
Axway Powerpoint Template · in this document as a result of a number of risks and uncertainties...
43
Investor Presentation March 2018
Transcript of Axway Powerpoint Template · in this document as a result of a number of risks and uncertainties...

Investor PresentationMarch 2018

© 2018 Axway 2
• This presentation contains forecasts in respect of which there are risks and uncertaintiesconcerning the company’s future growth and profitability. The group highlights the fact that thesignature of license contracts, which often represent investments for clients, are more significantin the second half of the year and may therefore induce to a more or less favorable full-yearperformance.
• Furthermore the current outcome of the events or actual results may differ from those describedin this document as a result of a number of risks and uncertainties set out in the RegistrationDocument 2016 submitted to the Autorité des Marchés Financiers (AMF) on 24 April 2017 n° D.17-0420.
• The distribution of this document in certain countries may be subject to the laws and regulationsin force. Natural persons present in these countries and in which this document is disseminated,published or distributed, should obtain information about such restrictions and comply with them.
Forward Looking Statements
© 2018 Axway 3
• Software Digital Transformation• Offer• Business Model• Accounting and Financial Results• Corporate Profile• Perspectives
INDEX
© 2018 Axway 4
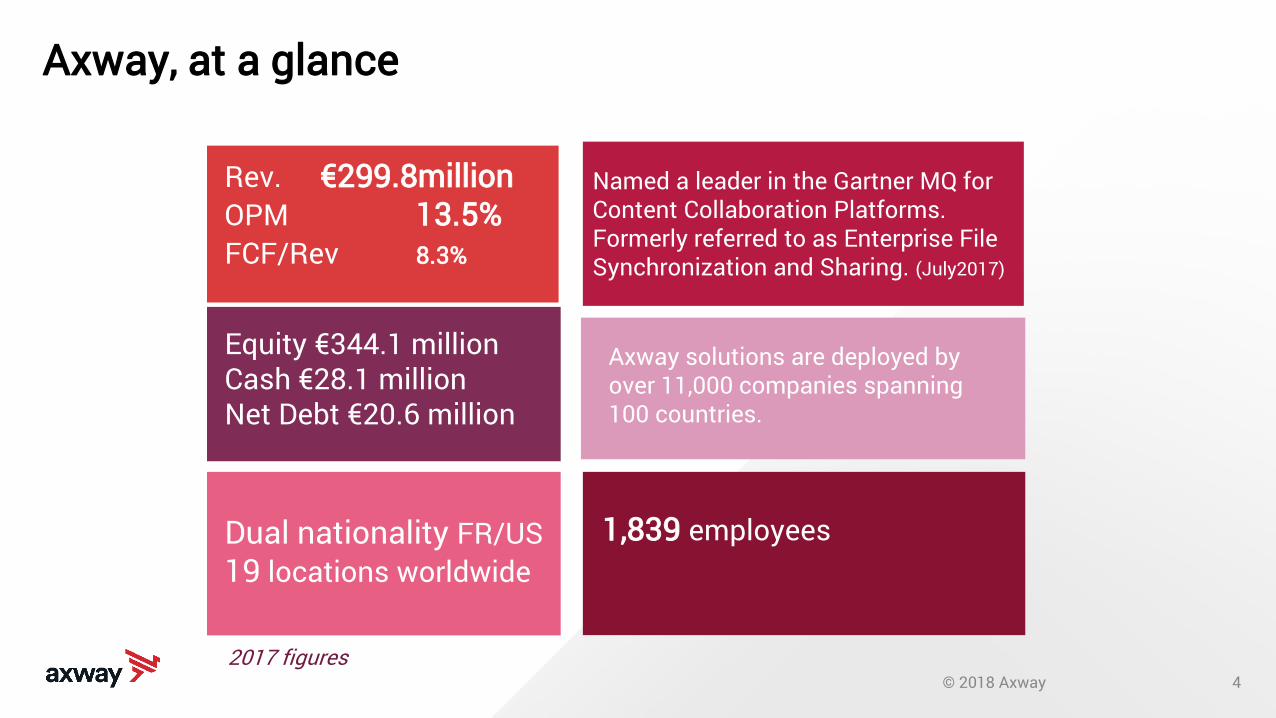
Axway, at a glance
Equity €344.1 millionCash €28.1 millionNet Debt €20.6 million
Rev. €299.8millionOPM 13.5%FCF/Rev 8.3%
Dual nationality FR/US19 locations worldwide
1,839 employees
2017 figures
Named a leader in the Gartner MQ for Content Collaboration Platforms. Formerly referred to as Enterprise File Synchronization and Sharing. (July2017)
Axway solutions are deployed by over 11,000 companies spanning 100 countries.

© 2018 Axway 5
Software Digital Transformation
MARKET DRIVERS
© 2018 Axway 6
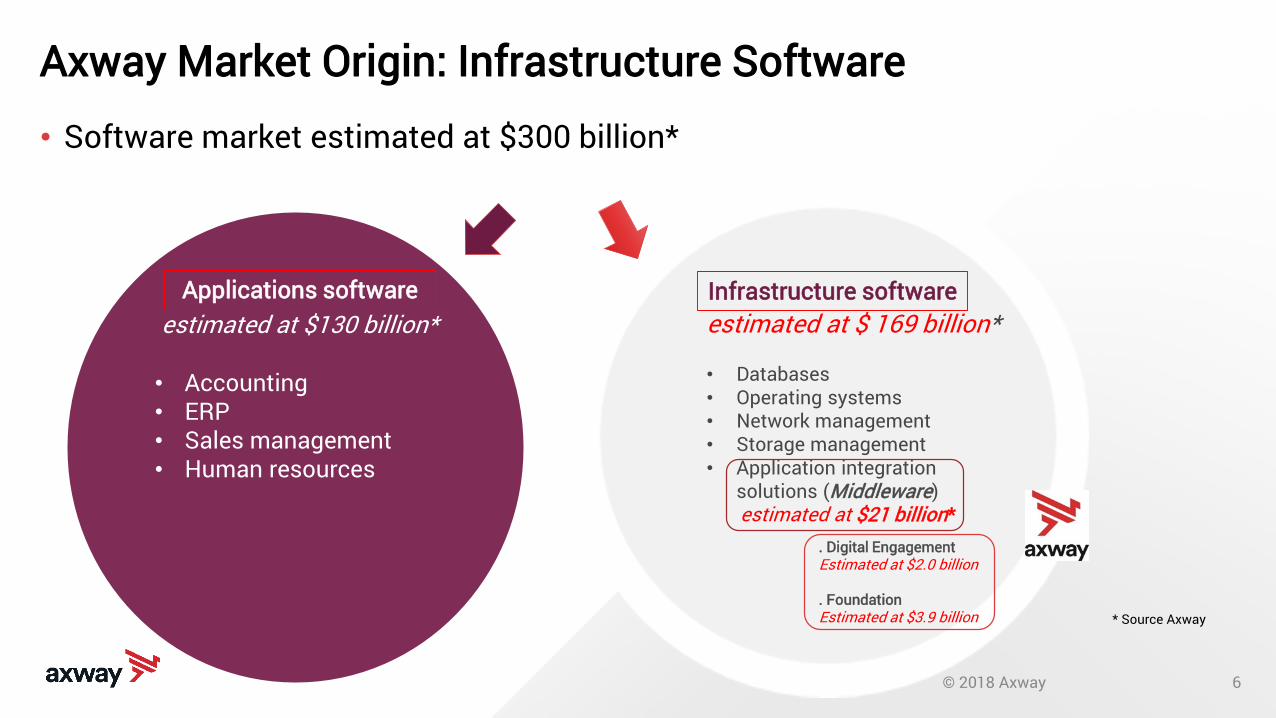
estimated at $130 billion*
• Accounting• ERP• Sales management• Human resources
estimated at $ 169 billion*
• Databases• Operating systems• Network management• Storage management• Application integration
solutions (Middleware) estimated at $21 billion*
Axway Market Origin: Infrastructure Software
• Software market estimated at $300 billion*
* Source Axway
. Digital EngagementEstimated at $2.0 billion
. FoundationEstimated at $3.9 billion
Applications software Infrastructure software

© 2018 Axway 7
A
A A A
A A
IntegrationMiddleware
DataIntegration
(ETL, MDM, …)
ApplicationIntegration
(ESB, MOM, …)
MFTB2B
EFSS
BPM / BAM
SOA Governance / API Management
IntegrationBrokerage
(VAN ), iPaaS
Market origin: technology viewpoint Axway addressable Market ($4 billion )

© 2018 Axway 8
A
A A A
A A
DigitalMiddleware
Market evolution: technology viewpoint Axway addressable Market ($2 billion )
A

© 2018 Axway 9
Digital technology impact: new domains
MOBILE
CLOUD
INTERNET OF THINGS
DIGITAL DISTRUPTION 2020
Cloud Creates$240 Billion
Market Opportunity
Mobile Spans80% of
Developed World
Internet of Things Drivers 25 Billion
Connected Machines
© 2018 Axway 10
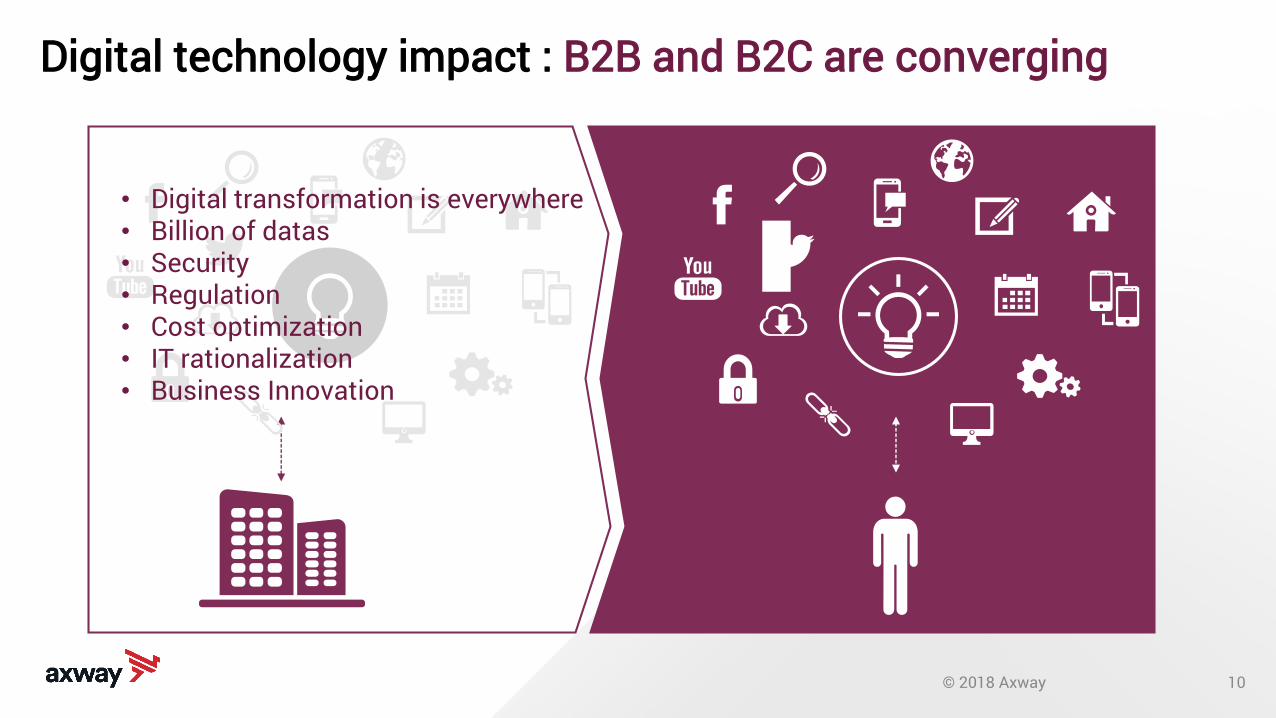
Digital technology impact : B2B and B2C are converging
• Digital transformation is everywhere• Billion of datas• Security• Regulation• Cost optimization• IT rationalization• Business Innovation
© 2018 Axway 11
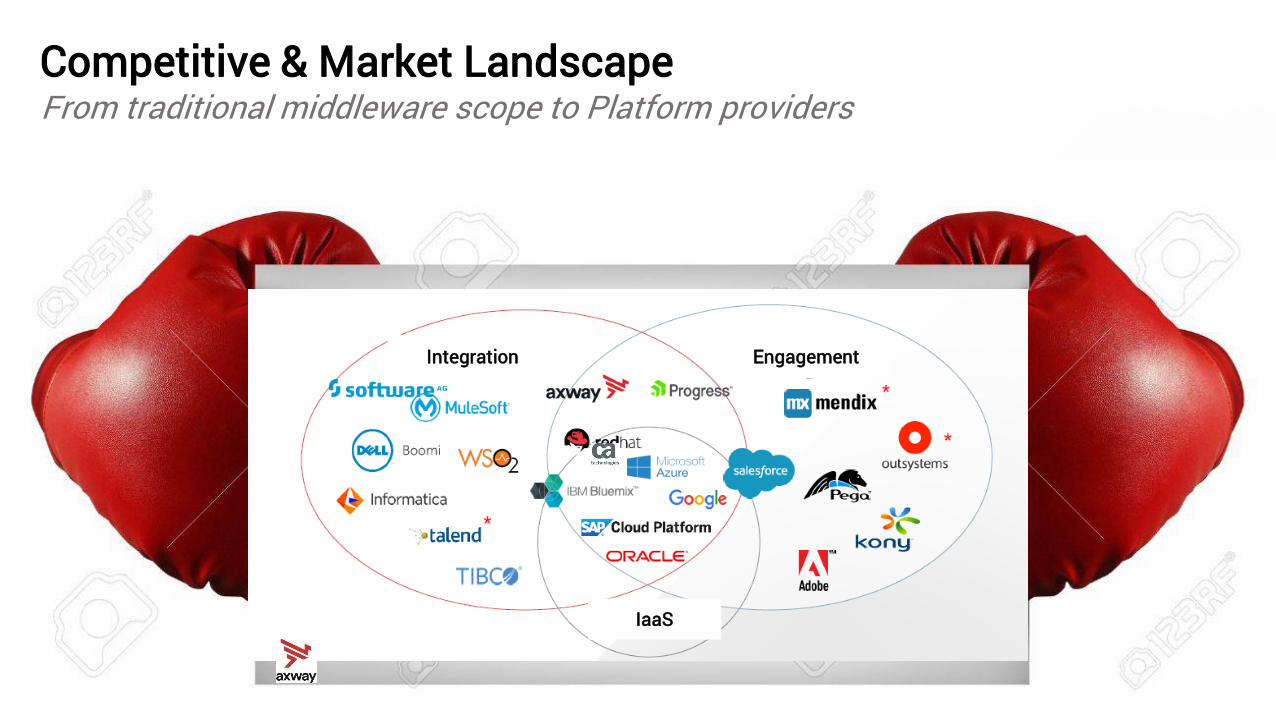
Competitive & Market LandscapeFrom traditional middleware scope to Platform providers
EngagementIntegration
IaaS
© 2018 Axway 12
Software Digital Transformation
AXWAY OFFER
© 2018 Axway 13
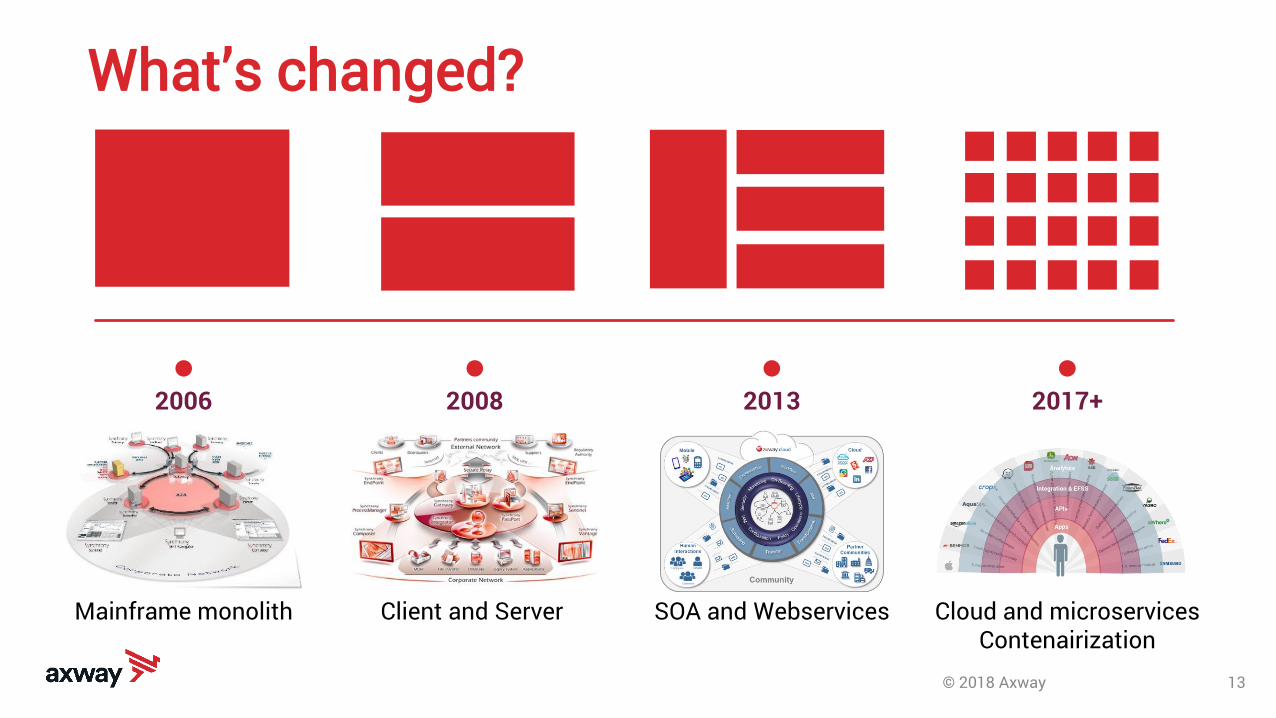
What’s changed?
2006 2008 2013 2017+
Mainframe monolith Client and Server Cloud and microservicesContenairization
SOA and Webservices

© 2018 Axway 14
Achieve higher levels of efficiency and growth by transforming rigid and manual connections between people, businesses and machines into customer experience networks.
DATA INTEGRATION &ENGAGEMENT PLATFORM
Axway AMPLIFY™
© 2018 Axway 15
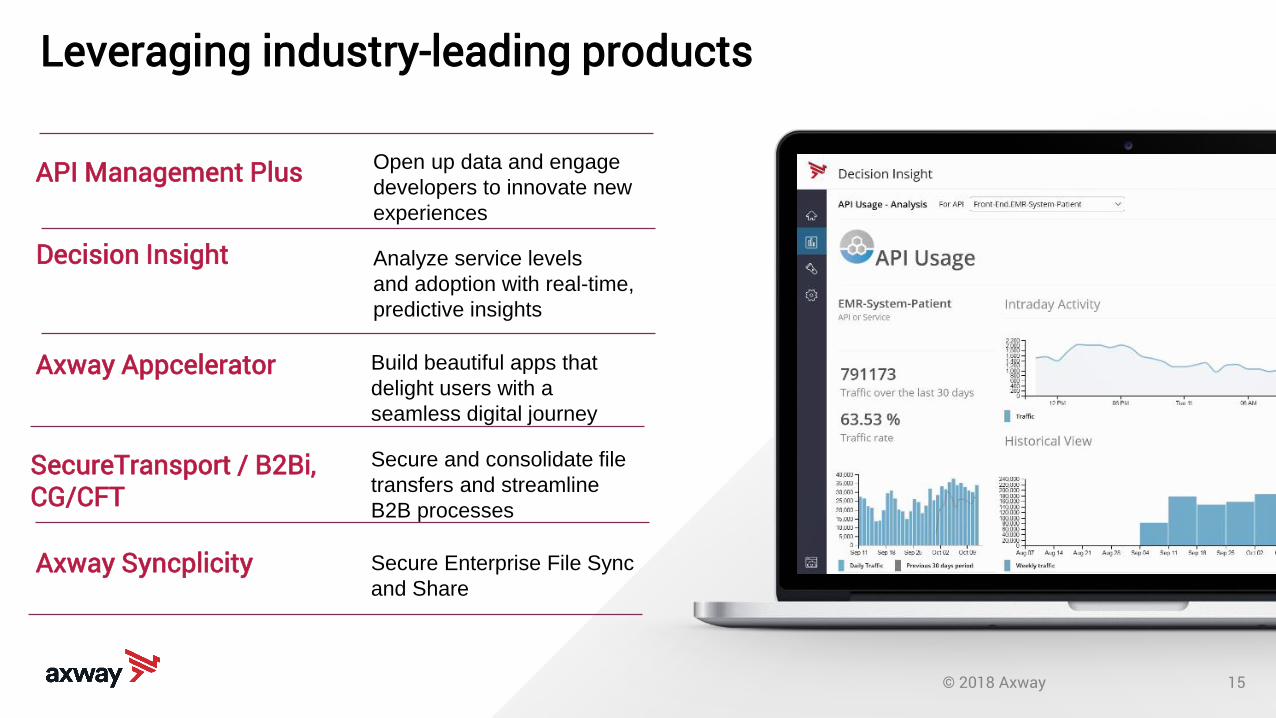
API Management Plus Open up data and engage
developers to innovate new
experiences
Decision Insight Analyze service levels
and adoption with real-time,
predictive insights
Axway Appcelerator Build beautiful apps that
delight users with a
seamless digital journey
SecureTransport / B2Bi, CG/CFT
Secure and consolidate file
transfers and streamline
B2B processes
Leveraging industry-leading products
Axway Syncplicity Secure Enterprise File Sync
and Share
© 2018 Axway 16
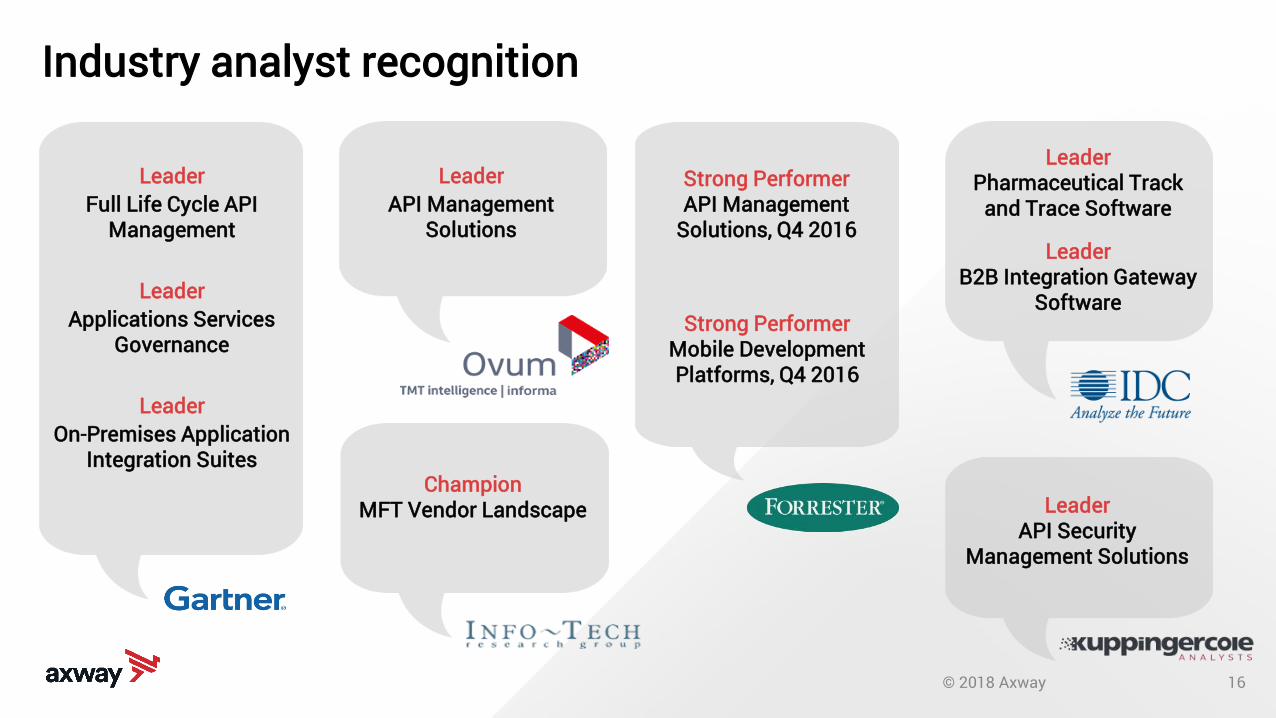
Leader API Management
Solutions
ChampionMFT Vendor Landscape
LeaderPharmaceutical Track
and Trace Software
LeaderB2B Integration Gateway
Software
LeaderAPI Security
Management Solutions
Industry analyst recognition
LeaderFull Life Cycle API
Management
LeaderApplications Services
Governance
LeaderOn-Premises Application
Integration Suites
Strong PerformerMobile Development Platforms, Q4 2016
Strong PerformerAPI Management
Solutions, Q4 2016

© 2018 Axway 17
INTEGRATION FOUNDATION ECOSYSTEM ENGAGEMENT
Managed File Transfer
B2B/EDI Integration
Cloud Service Integration
XML & SOA Services
API Gateway
Analytics
API Management
Identity Federation & Validation
EFSS
Mobile App Development
Axway portfolio segmentation

© 2018 Axway 18
Axway Business Model

© 2018 Axway 19
Services(Classic Editor)
Associated with the initial installation Independent of licence
Service agreement
46%
30%
24%
Axway Business Model: 4 sources of revenue in 2017
Licenses• Perpetual usage rights• Tiered pricing• Standard licensing
agreement
Maintenance• Associated
with licence sales• Three levels of support• For five years,
but termination possible every year
CloudSubscription usage
ACV or TCV

© 2018 Axway 20
2017 Balanced and resilient business model
By Region
Rest of Europe24%
Americas43% (2016 41%)
France28% (2016 31%)
Asia Pacific5%
Services18%
Maintenance49%
Licenses22%
By Activity
Cloud13%
61%Vs 54%
Recurring/R
© 2018 Axway 21
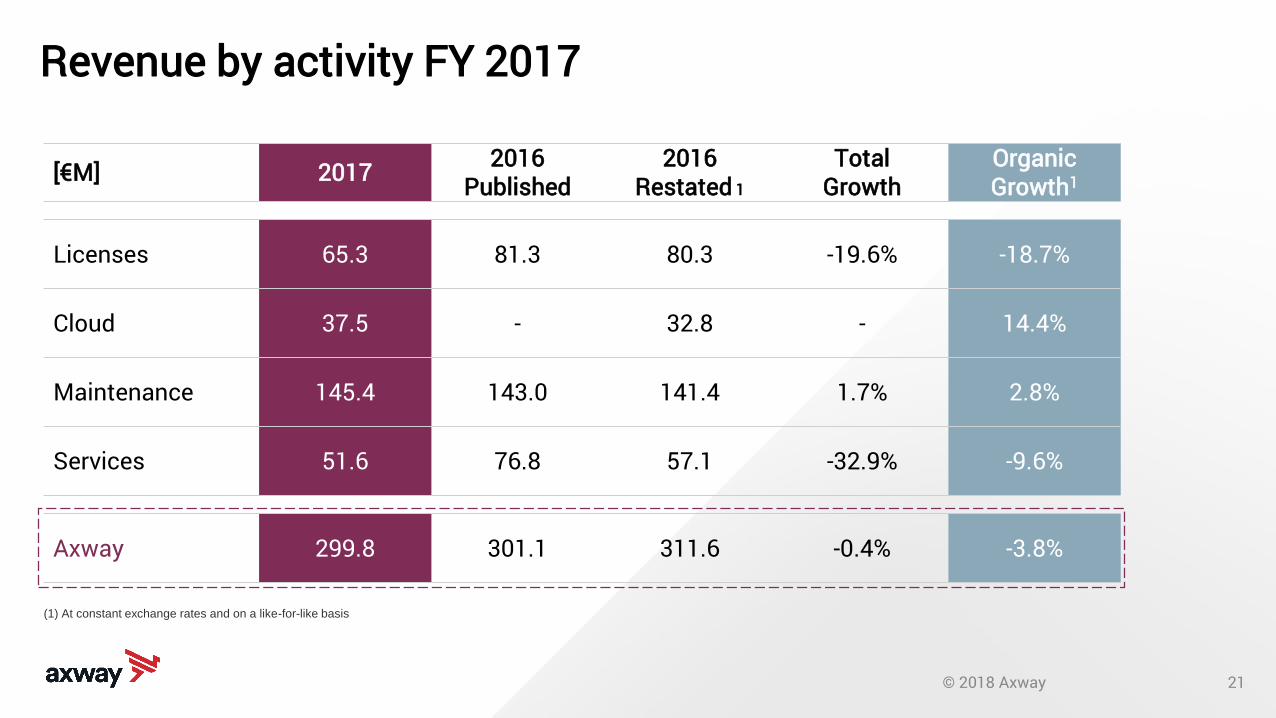
Revenue by activity FY 2017
(1) At constant exchange rates and on a like-for-like basis
[€M] 2017 2016Published
2016Restated 1
TotalGrowth
OrganicGrowth1
Licenses 65.3 81.3 80.3 -19.6% -18.7%
Cloud 37.5 - 32.8 - 14.4%
Maintenance 145.4 143.0 141.4 1.7% 2.8%
Services 51.6 76.8 57.1 -32.9% -9.6%
Axway 299.8 301.1 311.6 -0.4% -3.8%

© 2018 Axway 22
Revenue by region FY 2017
[€M] 2017 2016Published
2016Restated 1
TotalGrowth
OrganicGrowth1
France 83.8 94.2 94.2 -11.0% -11.0%
Rest of Europe 71.7 68.8 67.4 4.3% 6.5%
Americas 128.8 122.9 134.9 4.8% -4.5%
Asia Pacific 15.6 15.3 15.2 1.8% 2.7%301
Axway 299.8 301.1 311.6 -0.4% -3.8%
(1) At constant exchange rates and on a like-for-like basis
© 2018 Axway 23
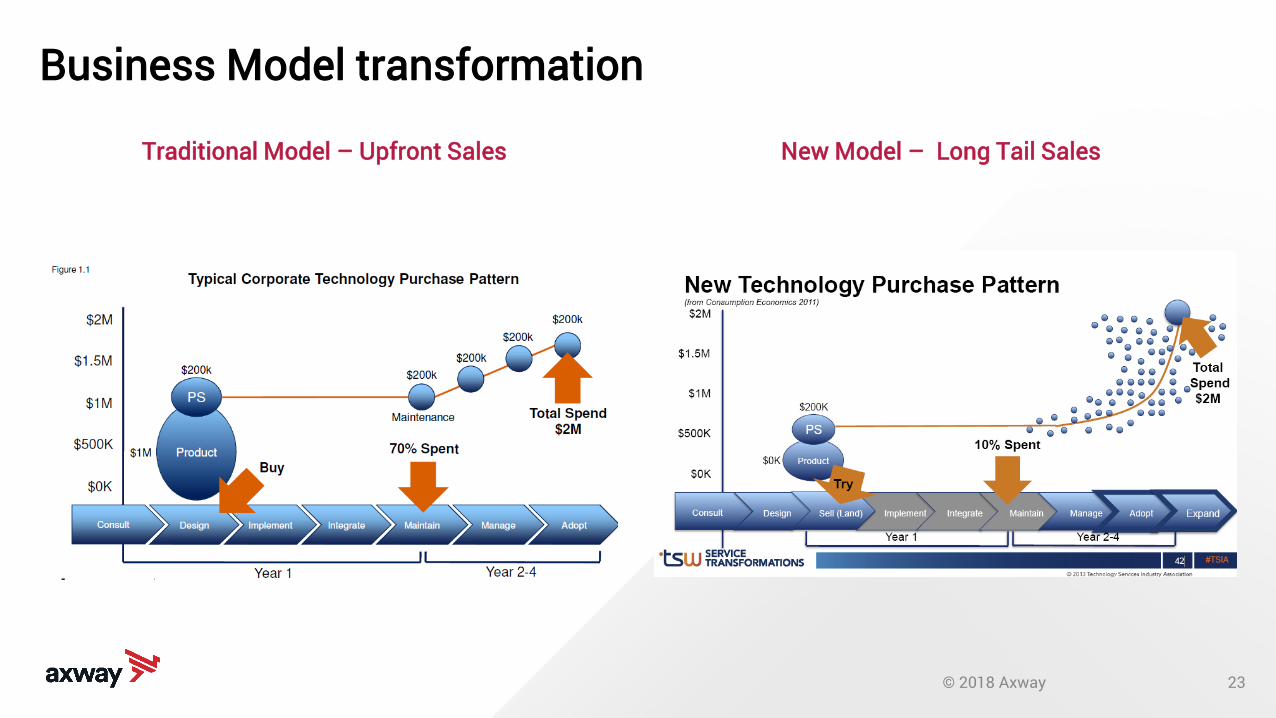
Traditional Model – Upfront Sales New Model – Long Tail Sales
Business Model transformation
© 2018 Axway 24
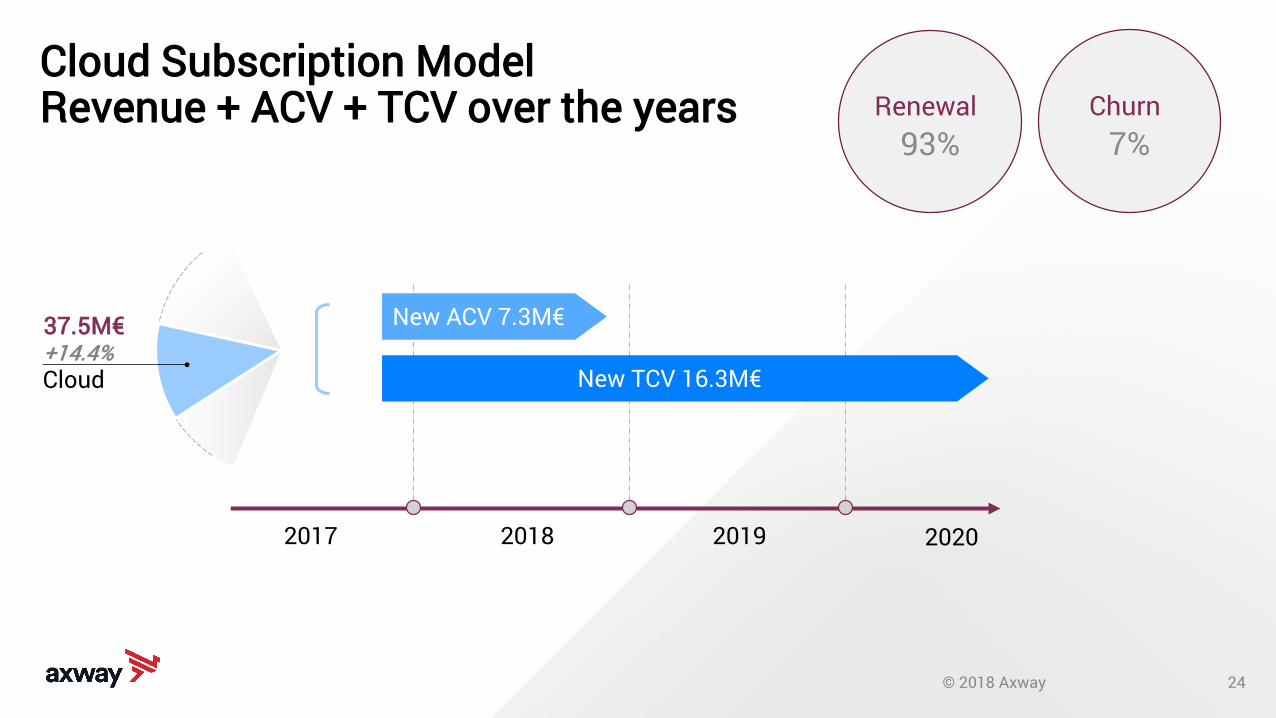
Cloud Subscription ModelRevenue + ACV + TCV over the years
Cloud
37.5M€+14.4%
New ACV 7.3M€
New TCV 16.3M€
2017 2018 2019 2020
Churn7%
Renewal93%
© 2018 Axway 25
0
50
100
150
200
250
300
2006
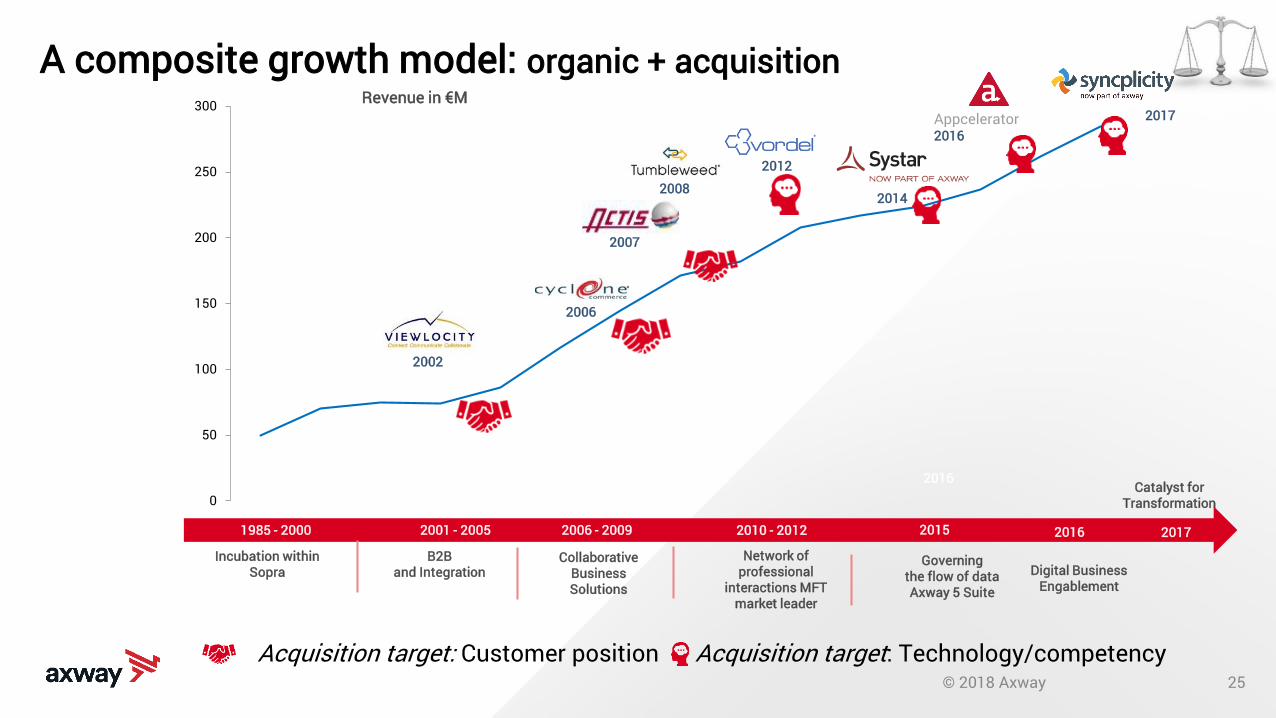
A composite growth model: organic + acquisition
2002
2007
20082014
2012
1985 - 2000 2001 - 2005 2006 - 2009 2010 - 2012 2015
Incubation within Sopra
B2B and Integration
Collaborative Business Solutions
Network of professional
interactions MFT market leader
Governing the flow of dataAxway 5 Suite
Revenue in €M
Acquisition target: Customer position Acquisition target: Technology/competency
2016
Digital Business Engablement
Appcelerator2016
2017
Catalyst forTransformation
2016 2017

Accounting & Financial Results
26
© 2018 Axway 27
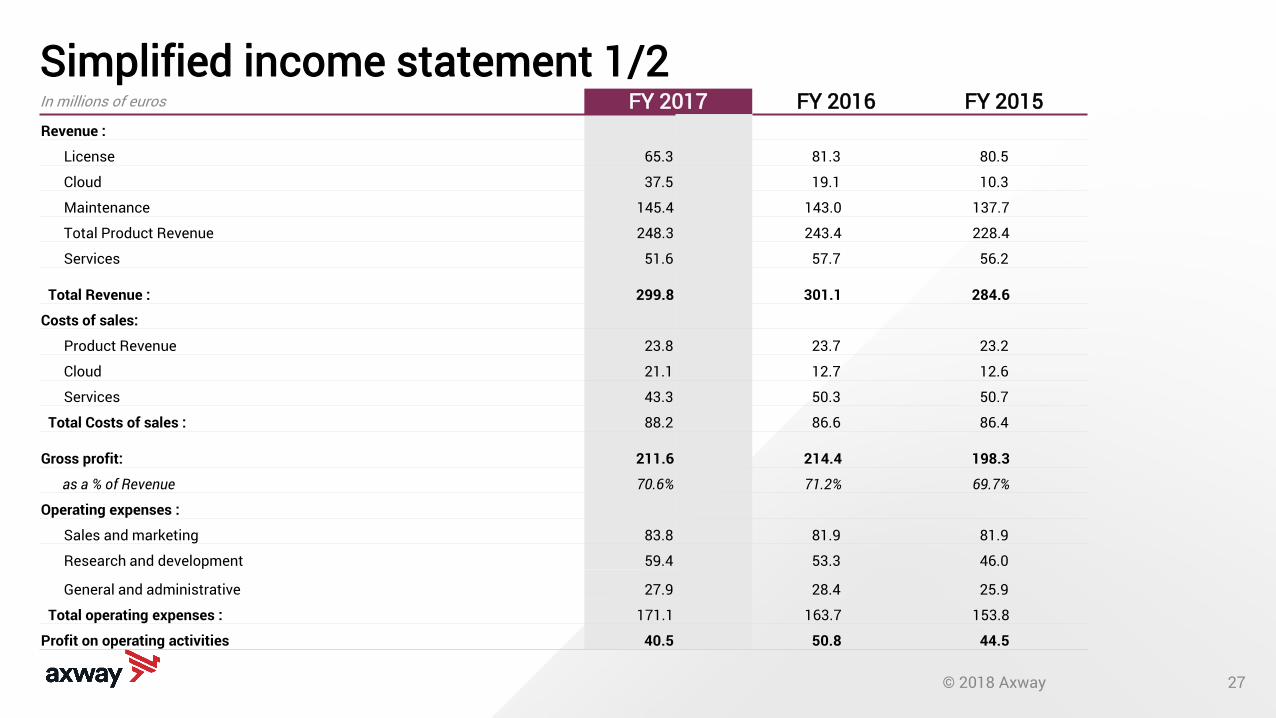
Simplified income statement 1/2In millions of euros FY 2017 FY 2016 FY 2015Revenue :
License 65.3 81.3 80.5
Cloud 37.5 19.1 10.3
Maintenance 145.4 143.0 137.7
Total Product Revenue 248.3 243.4 228.4
Services 51.6 57.7 56.2
Total Revenue : 299.8 301.1 284.6
Costs of sales:
Product Revenue 23.8 23.7 23.2
Cloud 21.1 12.7 12.6
Services 43.3 50.3 50.7
Total Costs of sales : 88.2 86.6 86.4
Gross profit: 211.6 214.4 198.3
as a % of Revenue 70.6% 71.2% 69.7%
Operating expenses :
Sales and marketing 83.8 81.9 81.9
Research and development 59.4 53.3 46.0
General and administrative 27.9 28.4 25.9
Total operating expenses : 171.1 163.7 153.8
Profit on operating activities 40.5 50.8 44.5

© 2018 Axway 28
Simplified income statement 2/2
In millions of euros FY 2017 FY 2016 FY 2015
Profit on operating activities 40.5 50.8 44.5
as a % of Revenue 13.5% 16.9% 15.6%
Stock option releated expenses (1.3) (1.1) (0.6)
Amortization of intangible assets (8.5) (7.9) (6.0)
Profit from recurring operations 30.7 41.8 37.9
as a % of Revenue 10.2% 13.9% 13.3%
Other income and expenses (2.9) (6.7) (10.5)
Operating profit 27.7 35.1 27.4
Cost of net financial debt (1.1) (0.4) (0.4)
Other financial revenues and expenses 1.8 0.5 (1.3)
Income taxes (24.0) (3.7) 2.1
Net Profit 4.4 31.5 27.9
as a % of Revenue 1.5% 10.5% 9.8%
Basic net earnings per share (in Euro) 0.21 1.51 1.35
• We continue to see impact ofshifting business model withlicense revenue decreasingand cloud increasing
• Gross Profit of 70.6% ofrevenue dropped with fallinglicense revenue, Cloudmargin up to 44% and servicemargin increased to 16% aswell
• R&D continued to grow insupport of our growingportfolio and new Platformlaunch and Syncplicityproducts

© 2018 Axway 29
Simplified balance sheetIn millions of euros 31/12/17 31/12/16 31/12/15ASSETSGoodwill 333.6 288.8 251.8 Non-current assets 420.7 402.7 347.5 Trade receivables 71.1 78.2 73.9 Other current assets 31.2 25.3 22.5 Cash and cash equivalents 28.1 51.7 44.7 TOTAL ASSETS 551.1 557.8 488.6 SHAREHOLDERS' EQUITY AND LIABILITIESTotal shareholders' equity 344.1 374.8 340.6Financial debt - long-term portion 47.8 35.5 7.5Other non-current liabilities 22.5 10.3 15.7Non-current liabilities 70.3 45.7 23.2Financial debt - short-term portion 4.5 3.7 1.5Deferred Revenue 67.3 74.5 66.7Other current liabilities 64.9 59.1 56.6Current liabilities 136.7 137.3 124.8TOTAL LIABILITIES 207.0 183.0 148.0TOTAL SHAREHOLDERS' EQUITY AND LIABILITIES 551.1 557.8 488.6
• Goodwill and intangiblesincreased from theacquisition of Syncplicity
• Cash balance of 28.1M€ andBank Debt of 48.8 M€ as of31 Dec 2017
• With our drop in TradeReceivables and stablerevenues, our DSO finished at77 days, down from 85 daysat 31 Dec 2016

© 2018 Axway 30
Change in Equity
In millions of euros 31/12/17 31/12/16 31/12/15Equity at Opening of Period 374.8 340.6 298.5
Profit for the period 4.4 31.5 27.9
Dividends -8.5 -8.3 -8.2
Capital increase 3.2 3.4 3.1
Other 0.7 0.9 0.8
Translation Differental -30.5 6.7 18.5
Equity at End of Period 344.1 374.8 340.6
• Due to the USD/Euro conver-sion rate movement atbalance sheet ending date asignificant translation adj-ustment was recorded inDec. 2017 on the conversionof the foreign balance sheetsto Euros

© 2018 Axway 31
Free Cash Flow statement
In millions of euros 31/12/17 31/12/16 31/12/15
Net profit for the period 4.4 31.5 27.9
Net cash from operating activities 29.6 38.4 49.6
Net cash used in investing activities (57.5) (57.3) (5.2)
Net cash from (used in) financing activites 6.8 26.0 (46.1)
NET CHANGE IN CASH AND CASH EQUIVALENTS (23.6) 7.8 (0.7)
CLOSING CASH POSITION 28.1 51.7 43.9
• Change in Working CapitalRequirements (BFR) for 2017of -11.7 M€ versus -5.9 M€ in2016
• Free cash for 2017 is 24.8M€ versus 27.9 M€ for 2016
© 2018 Axway 32
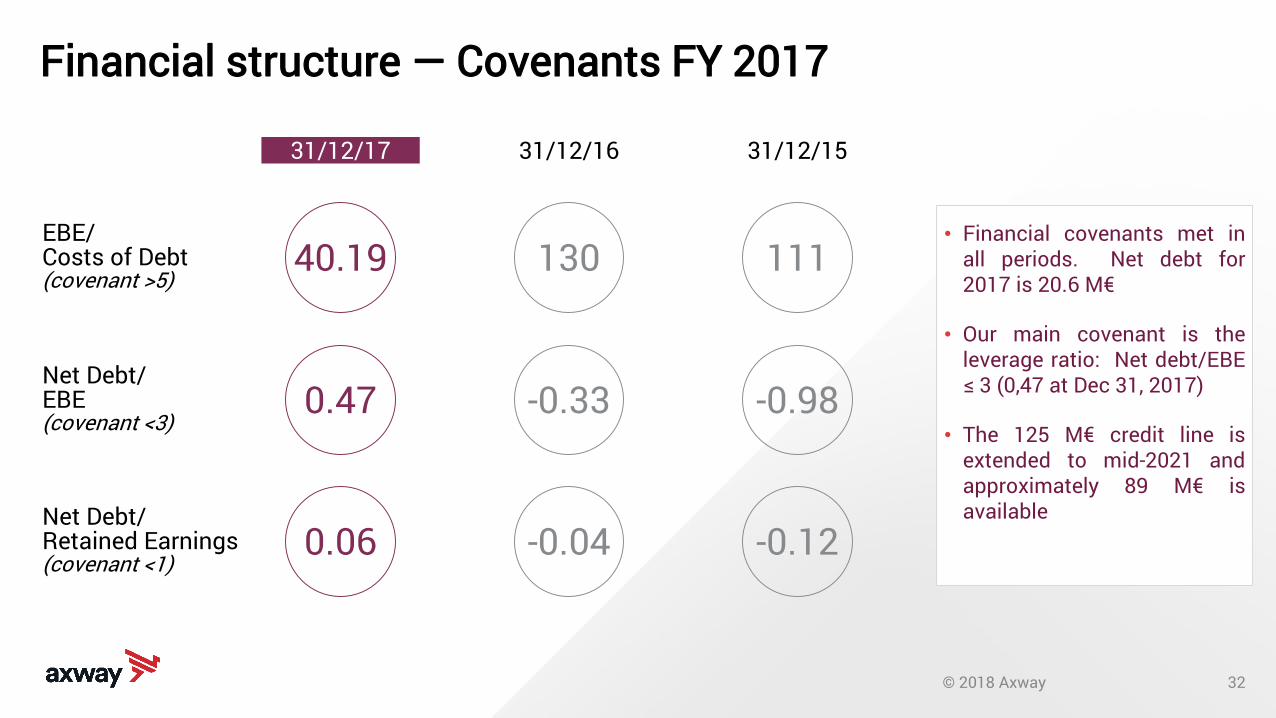
Financial structure — Covenants FY 2017
EBE/Costs of Debt(covenant >5)
111
Net Debt/EBE(covenant <3)
-0.98
Net Debt/Retained Earnings(covenant <1)
-0.12
130
-0.33
-0.04
40.19
0.47
0.06
31/12/16 31/12/1531/12/17
• Financial covenants met inall periods. Net debt for2017 is 20.6 M€
• Our main covenant is theleverage ratio: Net debt/EBE≤ 3 (0,47 at Dec 31, 2017)
• The 125 M€ credit line isextended to mid-2021 andapproximately 89 M€ isavailable

© 2018 Axway 33
Corporate Profile

© 2018 Axway 34
Governance
• Strengthened Governance
• Board of Directorscomprising 13 members, of which 7 are independent members
• Pierre Pasquier Chairman
• Kathleen Clark-Bracco Vice Chairman
• Compliance with the Middlenext Code of Corporate Governance
Jean-Marc LazzariChief Executive Officer
French-American management: 8 top managers coming from the software industry and historicalcorporate management

© 2018 Axway 35
Axway shareholder structure
Shares Outstanding
Voting Rights
31/12/201721,210,546 SHARES OUTSTANDING34,301,758 VOTING RIGHTS
Sopra SteriaGroup
PasquierFamily
OdinFamily Managers Sopra
GMT Caravelle Public TreasuryShares
32.59% 0.13% 1.37% 1.64% 21.23% 12.13% 30.77% 0.13%
35.08% 0.14% 1.52% 1.62% 26.26% 15.00% 20.38%
Concerted action• 56.97% of the shares• 64.62% of the voting rights
© 2018 Axway 36
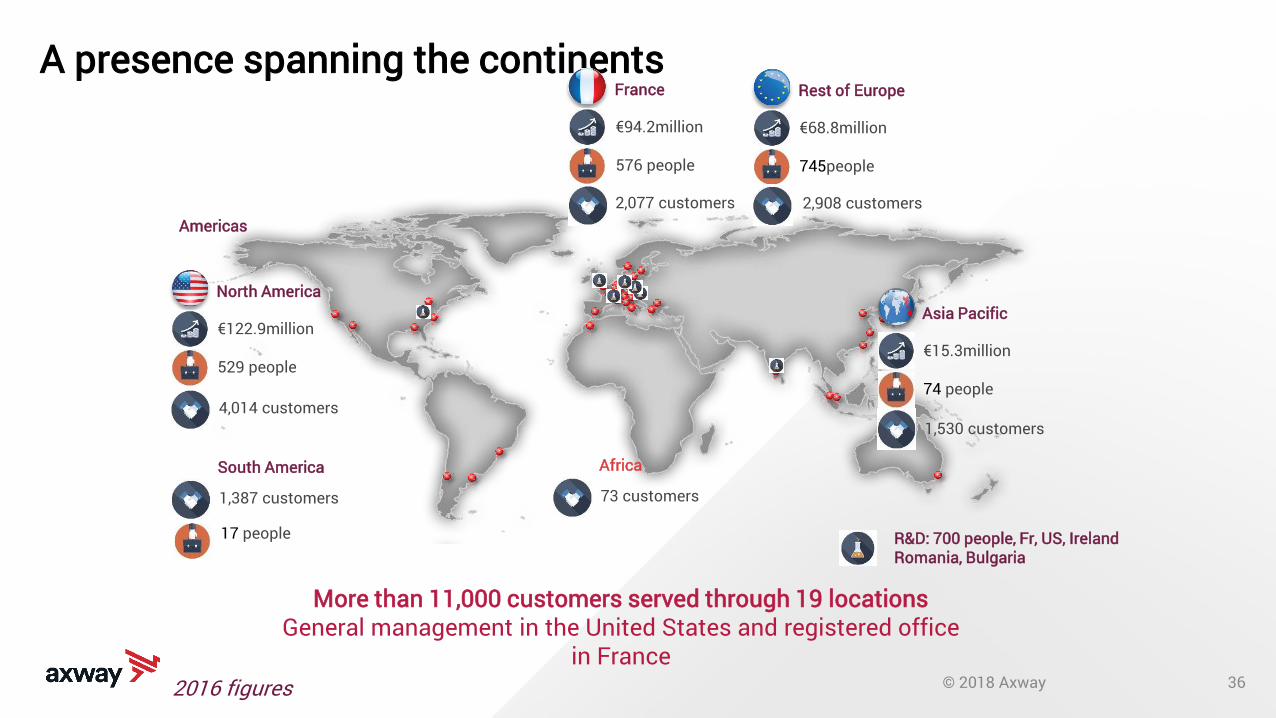
A presence spanning the continents
More than 11,000 customers served through 19 locations General management in the United States and registered office
in France
North America
€122.9million
529 people
4,014 customers
France
€94.2million
576 people
2,077 customers
Rest of Europe
€68.8million
745people
2,908 customers
Asia Pacific
€15.3million
74 people
1,530 customers
1,387 customers
South America
73 customers
Africa
17 people
Americas
R&D: 700 people, Fr, US, IrelandRomania, Bulgaria
2016 figures

© 2018 Axway 37
Governance
HR Responsibility
• 1,286 Axwagianstrained
• 23,714 hours• 7,367 training sessions
Corporate Social Responsibility
Organizations & Labels
• Global Compact
• EcoVadis label for the customers
• Gaïa Investment Index
• Ethic Chart
Downloadhttp://www.investors.axway.com/sites/default/files/csr_report_extract_registration_document_axway_2016_0.pdf
• Board members:• 63% independant• 36% women 42%• 95% attendance rate
meeting Environmental Responsibility
• Customer Satisfaction• Full digital internal
exchanges/paperless• 90% virtual servers
CSR Report

Concerted action
- 58.57% of the shares
- 67.44% of the voting rights
20,773,916 SHARES OUTSTANDING
35,538,163 VOTING RIGHTS
Axway Shareholder Structure
31/12/2015
Sopra
Steria
Pasquier
Family
Odin
FamilyManagers Sopra GMT
Geninfo(SG Group)
Caravelle PublicTreasury
Shares
24.9% 0.1% 1.4% 1.7% 21.6% 8.6% 12.3% 28.9% 0.2%
29.0% 0.1% 1.5% 1.6% 25.0% 10.0% 14.4% 18.0%
Shares outstanding
Voting Rights Perspective
38

© 2018 Axway | CONFIDENTIAL
Become a leader in Hybrid Integration Platform
39
© 2018 Axway 40
0,0
5 000,0
10 000,0
15 000,0
20 000,0
25 000,0
2015 2016 2017 2018 2019 2020 2021
EDI MFT API Mob App Dev EFSS iPaaS aPaaS
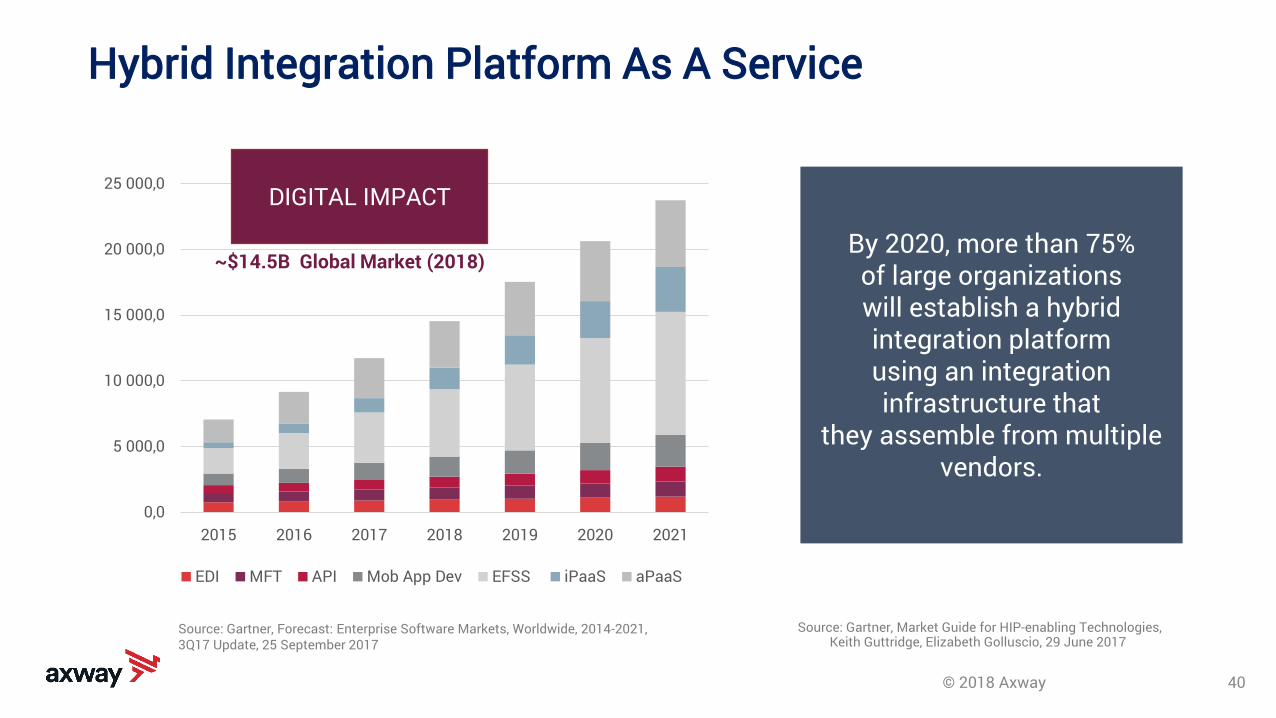
Hybrid Integration Platform As A Service
~$14.5B Global Market (2018)By 2020, more than 75%of large organizations will establish a hybrid integration platform using an integration infrastructure that
they assemble from multiple vendors.
Source: Gartner, Market Guide for HIP-enabling Technologies,Keith Guttridge, Elizabeth Golluscio, 29 June 2017
DIGITAL IMPACT
Source: Gartner, Forecast: Enterprise Software Markets, Worldwide, 2014-2021, 3Q17 Update, 25 September 2017

© 2018 Axway | CONFIDENTIAL
2020 TRENDS
• Stable Top Line Organic Revenue• Grow Subscription Revenue
to 65-75 M€• 65% of Recurring Revenue• Strategic M&A
2018 INVESTMENTSAdditional 15 M€
• R&D to deliver Cloud Offers• Sales & Digital Marketing• Customer Satisfaction
Become a leader in Hybrid Integration Platform
41

THANK YOU
www.investors.axway.com/en
Mobile App: Axway IR available on Apple store & Android
42

© 2018 Axway 43
• Restated: Revenue for the prior year, expressed on the basis of the scope and exchange rates for the current year.
• Organic growth of revenue: Growth of operations between revenue for the period and the reprocessed revenue data forthe same period of the preceding fiscal year.
• Profit (loss) from operations This indicator, such as defined in the Registration Document, corresponds to profit fromthe reprocessed counting operations data of the charge pertaining to the cost of services rendered by the beneficiariesof stock options and of restricted shares and of the provisions to amortisation of the affected intangible assets.
• Profit from counting operations: This indicator corresponds to the operating profit prior to taking into account otheroperating income and expenses which correspond to unusual, abnormal, infrequent, non-predictive operating incomeand expenses, and of a particularly significant amount, presented in a distinct manner in order to facilitateunderstanding of the performance connected to current operations.
• ACV: Annual Contract Value is the signed revenue still to come during the year.
• TCV: Total contract value, represents the full value of a customer contract. It includes both recurring for the duration ofthe contracted period and one-time payments.
APM Definition


![[ PowerPoint Template ]](https://static.fdocuments.us/doc/165x107/56814853550346895db565d2/-powerpoint-template--5697ba40150e6.jpg)

