AXIS/CO/CS/121/2021-22 9 The Deputy General Manager ...
72
AXIS BANK Legal &CS: Axis House, Wadia International Centre, Pandurang Budhkar marg, Worli, Mumbai 400 025 Registered Address: "Trishul" - 3rd Floor, Opp. Samartheswar Temple, Near Law Garden, Ellisbridge, Ahmedabad - 380006. Telephone No.: 079-26409322 Fax No.: 079-26409322 CIN : L65110GJ1993PLC020769 Website: www.axisbank.com AXIS/CO/CS/121/2021-22 9 th June, 2021 Chief Manager, Listing & Compliance Department National Stock Exchange of India Limited Exchange Plaza, 5th Floor Plot No. C/1, “G” Block Bandra-Kurla Complex Bandra (E), Mumbai – 400 051 NSE Symbol: AXISBANK The Deputy General Manager, Listing Department BSE Limited 1 st Floor, New Trading Ring, Rotunda Building P. J. Towers, ‘Dalal Street Fort, Mumbai – 400 001 BSE Scrip Code : 532215 Dear Sir(s), SUB.: DISCLOSURE UNDER REGULATION 30 READ WITH PARA A OF SCHEDULE III OF THE SECURITIES AND EXCHANGE BOARD OF INDIA (LISTING OBLIGATIONS AND DISCLOSURE REQUIREMENTS) REGULATIONS, 2015. Enclosed, please find the schedule of Analyst / Investor meeting / interactions held at Mumbai on 9 th June, 2021, in terms of the captioned subject. Further, we also enclose herewith the presentation made at the said meeting. The same is being uploaded on the website of the Bank www.axisbank.com You are requested to take note of above and arrange to bring it to the notice of all concerned. Thanking You. Yours Sincerely, For Axis Bank Limited Girish V. Koliyote Company Secretary Encl: as above
Transcript of AXIS/CO/CS/121/2021-22 9 The Deputy General Manager ...

AXIS BANK Legal &CS: Axis House, Wadia International Centre, Pandurang Budhkar marg, Worli, Mumbai 400 025 Registered Address: "Trishul" - 3rd Floor, Opp. Samartheswar Temple, Near Law Garden, Ellisbridge, Ahmedabad - 380006. Telephone No.: 079-26409322 Fax No.: 079-26409322 CIN : L65110GJ1993PLC020769 Website: www.axisbank.com
AXIS/CO/CS/121/2021-22
9th June, 2021
Chief Manager,
Listing & Compliance Department
National Stock Exchange of India Limited
Exchange Plaza, 5th Floor
Plot No. C/1, “G” Block
Bandra-Kurla Complex
Bandra (E), Mumbai – 400 051
NSE Symbol: AXISBANK
The Deputy General Manager,
Listing Department
BSE Limited
1st Floor, New Trading Ring,
Rotunda Building
P. J. Towers, ‘Dalal Street Fort,
Mumbai – 400 001
BSE Scrip Code : 532215
Dear Sir(s),
SUB.: DISCLOSURE UNDER REGULATION 30 READ WITH PARA A OF SCHEDULE III OF THE SECURITIES AND
EXCHANGE BOARD OF INDIA (LISTING OBLIGATIONS AND DISCLOSURE REQUIREMENTS)
REGULATIONS, 2015.
Enclosed, please find the schedule of Analyst / Investor meeting / interactions held at Mumbai on
9th June, 2021, in terms of the captioned subject. Further, we also enclose herewith the presentation
made at the said meeting.
The same is being uploaded on the website of the Bank www.axisbank.com
You are requested to take note of above and arrange to bring it to the notice of all concerned.
Thanking You.
Yours Sincerely,
For Axis Bank Limited
Girish V. Koliyote
Company Secretary
Encl: as above

AXIS BANK Legal &CS: Axis House, Wadia International Centre, Pandurang Budhkar marg, Worli, Mumbai 400 025 Registered Address: "Trishul" - 3rd Floor, Opp. Samartheswar Temple, Near Law Garden, Ellisbridge, Ahmedabad - 380006. Telephone No.: 079-26409322 Fax No.: 079-26409322 CIN : L65110GJ1993PLC020769 Website: www.axisbank.com
Place: Mumbai
Interactions held on 9th June, 2021
Sr.
No. Institution Name
1 AVENDUS
2 AMANSA CAPITAL
3 ASHMORE
4 BROAD PEAK INVESTMENT ADVISORS
5 CHANAKYA CAPITAL PARTNERS
6 CHARLES-LIM CAPITAL
7 DALTON INVESTMENT GROUP
8 DURO CAPITAL SINGAPORE ADVISORS
9 EASTSPRING INVESTMENTS
10 FACT CAPITAL
11 HDFC STANDARD LIFE INSURANCE
12 INVESCO ASSET MANAGEMENT ASIA
13 ISHANA CAPITAL
14 KHAZANAH NASIONAL
15 KONTIKI CAPITAL MANAGEMENT
16 LEGATUM GROUP
17 MAKRANA CAPITAL MANAGEMENT
18 MAPLE-BROWN ABBOTT
19 MILLENNIUM PARTNERS
20 MOON CAPITAL
21 MORGAN STANLEY INVESTMENT MANAGEMENT
22 NATIXIS
23 NIPPON LIFE GLOBAL INVESTORS
24 OPTIMAS CAPITAL
25 PLATINUM ASSET MANAGEMENT
26 POINT72 ASSET MANAGEMENT
27 POLYMER CAPITAL MANAGEMENT
28 PREMJI INVESTMENTS
29 QUANTUM ADVISORS
30 ROUTE ONE INVESTMENT COMPANY
31 SEPHIRA EMERGING MARKETS
32 SKALE INVESTMENTS
33 SUMITOMO MITSUI DS AM
34 T ROWE PRICE
35 TORQ CAPITAL MANAGEMENT
36 TRIKON ASSET MANAGEMENT
37 YORK CAPITAL MANAGEMENT
38 ZAABA CAPITAL

Investor Presentation
Annual Results FY20-21
NSE: AXISBANK BSE: 532215 LSE (GDR): AXB
Annual Results FY 20-21
Cumulative provisions
(standard + additional non-NPA)
2
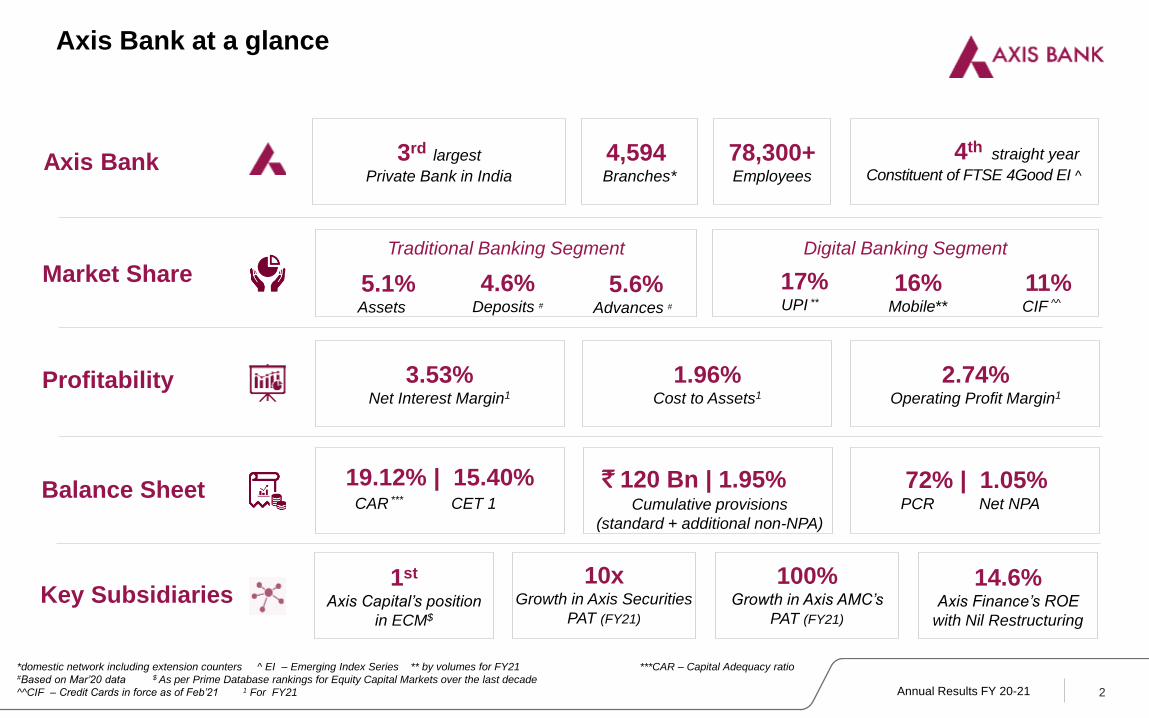
Axis Bank at a glance
Axis Bank
Market Share
3rd largest
Private Bank in India
78,300+ Employees
4,594Branches*
Traditional Banking Segment
3.53%Net Interest Margin1
1.96%Cost to Assets1
2.74% Operating Profit Margin1
Digital Banking Segment
5.1%Assets
5.6%Advances #
4.6%Deposits #
17%UPI
16%Mobile**
11%CIF
Balance Sheet19.12% | 15.40%
Profitability
Key Subsidiaries14.6%
Axis Finance’s ROE
with Nil Restructuring
1st
Axis Capital’s position
in ECM$
*domestic network including extension counters ^ EI – Emerging Index Series ** by volumes for FY21 ***CAR – Capital Adequacy ratio #Based on Mar’20 data $ As per Prime Database rankings for Equity Capital Markets over the last decade
^^CIF – Credit Cards in force as of Feb’21 1 For FY21
PCR Net NPA
4th straight year
Constituent of FTSE 4Good EI ^
** ^^
CAR CET 1***
` 120 Bn | 1.95% 72% | 1.05%
10x Growth in Axis Securities
PAT (FY21)
100% Growth in Axis AMC’s
PAT (FY21)
Annual Results FY 20-21
Financial Highlights
Business Segment performance
Asset Quality
Capital and Liquidity Position
Future of Work and Sustainability
Subsidiaries’ Performance
3
Other important information
Executive Summary

Annual Results FY 20-21 4
Strengthen the organizational core and quality of our balance sheet significantly1
2 Invest in technology capabilities to deliver on our Transformation plans
Deliver strong operating performance with improvement in return metrics 5
4 Build granularity across all our business segments to drive sustainable growth
Act with relentless focus on making Axis digital 3
Building a more sustainable organization
Create significant value among our key subsidiaries 6
Annual Results FY 20-21
6.8%
5.3% 4.9%3.7%
0.0 0%
1.0 0%
2.0 0%
3.0 0%
4.0 0%
5.0 0%
6.0 0%
7.0 0%
8.0 0%
52%
62%
69%72%
Mar-18 Mar-19 Mar-20 Mar-21
Credit Costs
3.57% 1.87%2.15%1.91%(1)
1.8%
1.3%
1.0% 1.1%
0.0 %
0.2 %
0.4 %
0.6 %
0.8 %
1.0 %
1.2 %
1.4 %
1.6 %
1.8 %
2.0 %
Mar-18 Mar-19 Mar-20 Mar-21
5
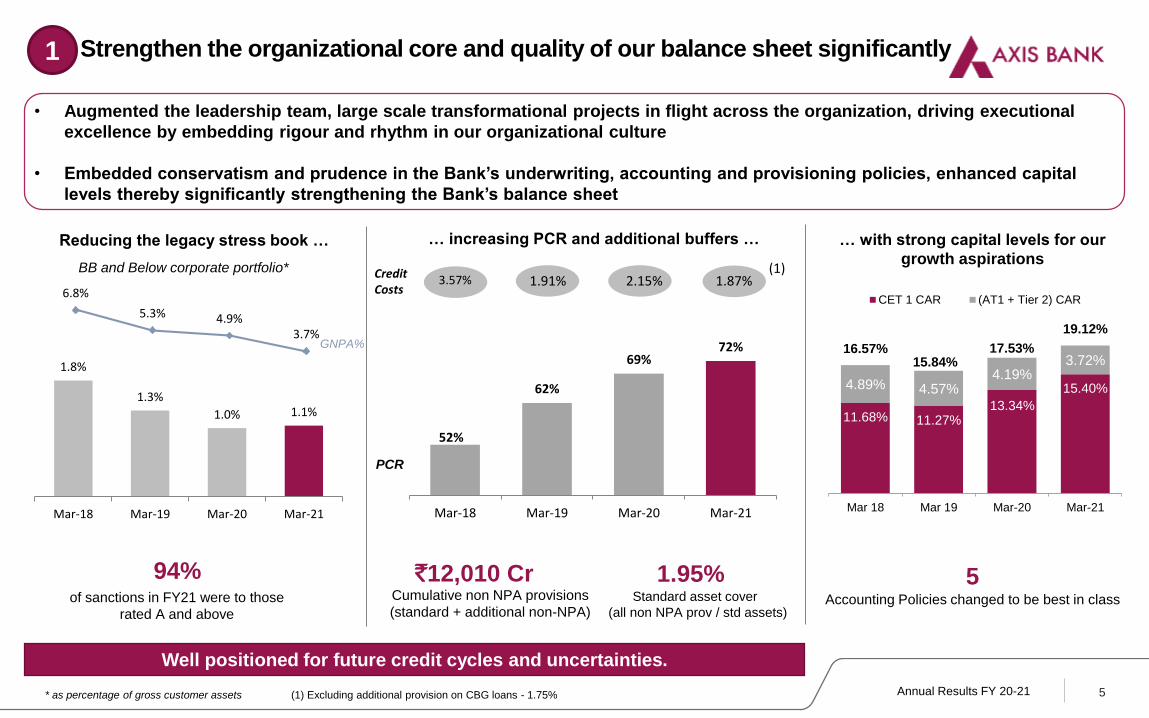
Strengthen the organizational core and quality of our balance sheet significantly 1
• Augmented the leadership team, large scale transformational projects in flight across the organization, driving executional
excellence by embedding rigour and rhythm in our organizational culture
• Embedded conservatism and prudence in the Bank’s underwriting, accounting and provisioning policies, enhanced capital
levels thereby significantly strengthening the Bank’s balance sheet
… increasing PCR and additional buffers …
Cumulative non NPA provisions
(standard + additional non-NPA)
`12,010 Cr 1.95%Standard asset cover
(all non NPA prov / std assets)
11.68% 11.27%13.34%
15.40%4.89% 4.57%4.19%
3.72%16.57%
15.84%17.53%
19.12%
Mar 18 Mar 19 Mar-20 Mar-21
CET 1 CAR (AT1 + Tier 2) CAR
Accounting Policies changed to be best in class
… with strong capital levels for our
growth aspirations
PCR
Reducing the legacy stress book …
BB and Below corporate portfolio*
94%of sanctions in FY21 were to those
rated A and above
Well positioned for future credit cycles and uncertainties.
GNPA%
* as percentage of gross customer assets
5
(1) Excluding additional provision on CBG loans - 1.75%

Annual Results FY 20-21 6
2
• Opex and capex spends ramped up to modernize the core systems, scale up Cloud portfolio, deliver engineering excellence
and digital risk-proofing
• Transformation delivered by a resilient, predictable and continuously improving operations culture in the Bank, reflecting in
external recognition
The Bank is investing in technological capabilities..
Invest in technology capabilities to deliver on our Transformation plans
Technology spends
• 79% increase in opex and capex spends in last 2 yrs
Modernizing the Core: Cloud first approach• Increased standardization and virtualization of infra, moving to Cloud
• ~50 apps on Cloud environment
Talent, training & capability building• Employees trained in Agile and next gen tech skills
• Business Solutions Group set up to act as an effective interface between
business & IT, with rigorous governance on quality and schedule of
delivery
Risk and Governance • Mitigation of risks through continuous detection and prediction
• Focus on cyber security
Resilient
• One of the largest WFH enablement in BFSI with 75K staff on productivity and
collaboration apps
• Continuous monitoring of resilience metrics (e.g. Process Health, Effectiveness of
critical controls)
Predictable• Intelligent automation interventions to build predictability
• Leveraging data analytics to improve operational efficiency.
• Ensuring data quality with a framework on data architecture and governance
Continuously Improving • Providing uniform & seamless journeys to customers, leveraging Big Data insights
• Building a quality culture and competency through assurance & control, and capability
building
• Internal Cx scores have improved in line with our goals set at the beginning of the year
..and is focused on building a culture in the Bank which is
# 1 bank and the only
domestic bank in the
“Large Corporate
(Institutional and
Coverage Quality)
Best digital bank awards
by Asia money and FE in
India
External recognition on the Bank’s initiatives

Annual Results FY 20-21
3 Act with relentless focus on making Axis digital
Transformation CapabilitiesD2C products
71%Fixed deposits
opened**
74%Digitally active
customers^^
57%PL
disbursed**
74%Credit cards
issued (Q4FY21)
250Services on
digital channels
16%Market share in
mobile (FY21^)
17%Market share in
UPI (FY21)
110In-house
development
team
800People dedicated
to digital agenda
150+AI use cases
deployed at scale
4.6Mobile App
ratings
AgileEnabled teams with
CI/CD, micro-services
architecture
^^Based on all financial transactions by individual customers in Q4FY21
*Digital tablet based account opening process for FY21 ^RBI data for eight months of FY21
** digitally in FY21
Significant progress under our silent revolution ... … reimagined customer journeys and
delivered market leading products …
Buy now Pay Later
(Freecharge)
# In CUG
Digital Forex
card
Digital Gold# NTB FD with
partners #
… rich pipeline for continued new product
introduction and scale up…
Personal finance management
2
APIs: Ecosystem solutions
3
Merchant lifecycle solutions
4
Hyper-personalized channels
5
Digital corporate banking
solutions
6
Small ticket lending and credit card
lifecycle digital experience
1
7
Annual Results FY 20-21
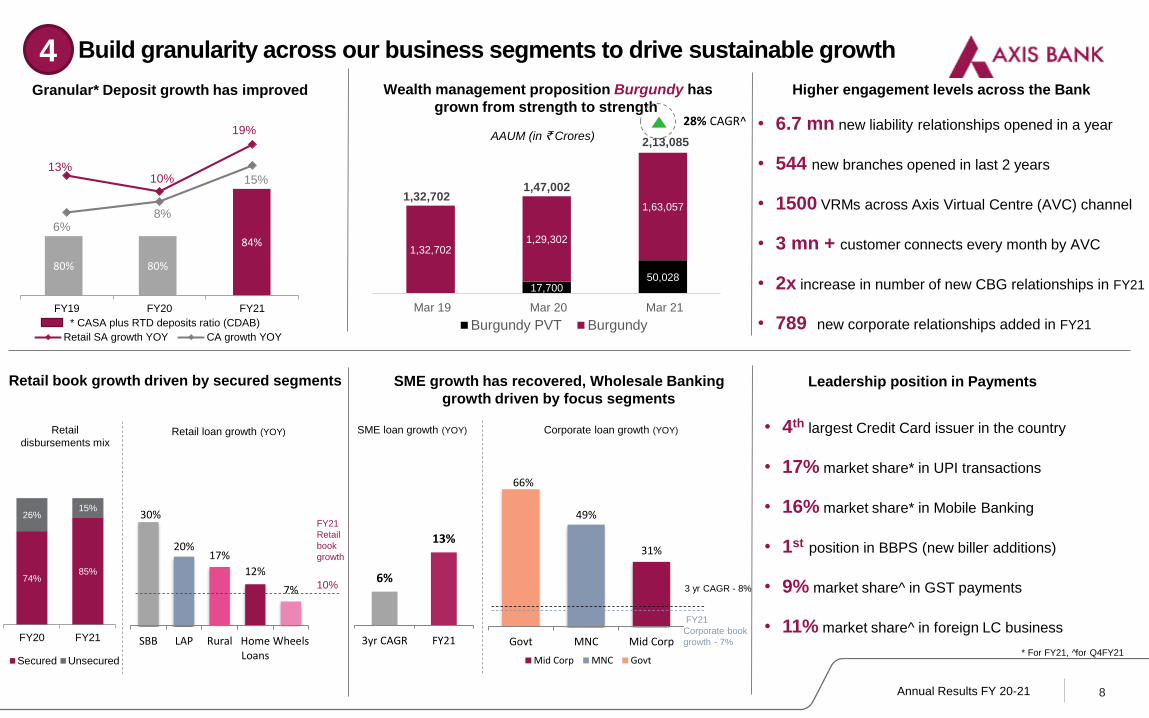
80% 80%
84%
13%10%
19%
6%8%
15%
FY19 FY20 FY21
Retail SA growth YOY CA growth YOY
6%
13%
3yr CAGR FY21
8
7%
12%
17%20%
30%
WheelsHomeLoans
RuralLAPSBB
Retail book growth driven by secured segments SME growth has recovered, Wholesale Banking
growth driven by focus segments
Granular* Deposit growth has improved Wealth management proposition Burgundy has
grown from strength to strength
Higher engagement levels across the Bank
4 Build granularity across our business segments to drive sustainable growth
31%
49%
66%
Mid CorpMNCGovt
Mid Corp MNC Govt
* CASA plus RTD deposits ratio (CDAB)
• 6.7 mn new liability relationships opened in a year
• 544 new branches opened in last 2 years
• 1500 VRMs across Axis Virtual Centre (AVC) channel
• 3 mn + customer connects every month by AVC
• 2x increase in number of new CBG relationships in FY21
• 789 new corporate relationships added in FY21
Leadership position in Payments
• 4th largest Credit Card issuer in the country
• 17% market share* in UPI transactions
• 16% market share* in Mobile Banking
• 1st position in BBPS (new biller additions)
• 9% market share^ in GST payments
• 11% market share^ in foreign LC business
3 yr CAGR - 8%
FY21
Corporate book
growth - 7%
SME loan growth (YOY) Corporate loan growth (YOY) Retail loan growth (YOY)
FY21
Retail
book
growth
10%74%
85%
26%15%
FY20 FY21
Secured Unsecured
Retail
disbursements mix
17,70050,028
1,32,7021,29,302
1,63,0571,32,702
1,47,002
2,13,085
Mar 19 Mar 20 Mar 21
Burgundy PVT Burgundy
AAUM (in ` Crores)
* For FY21, f̂or Q4FY21
28% CAGR^
Annual Results FY 20-21
79%
82%83%
FY19 FY20 FY21
9
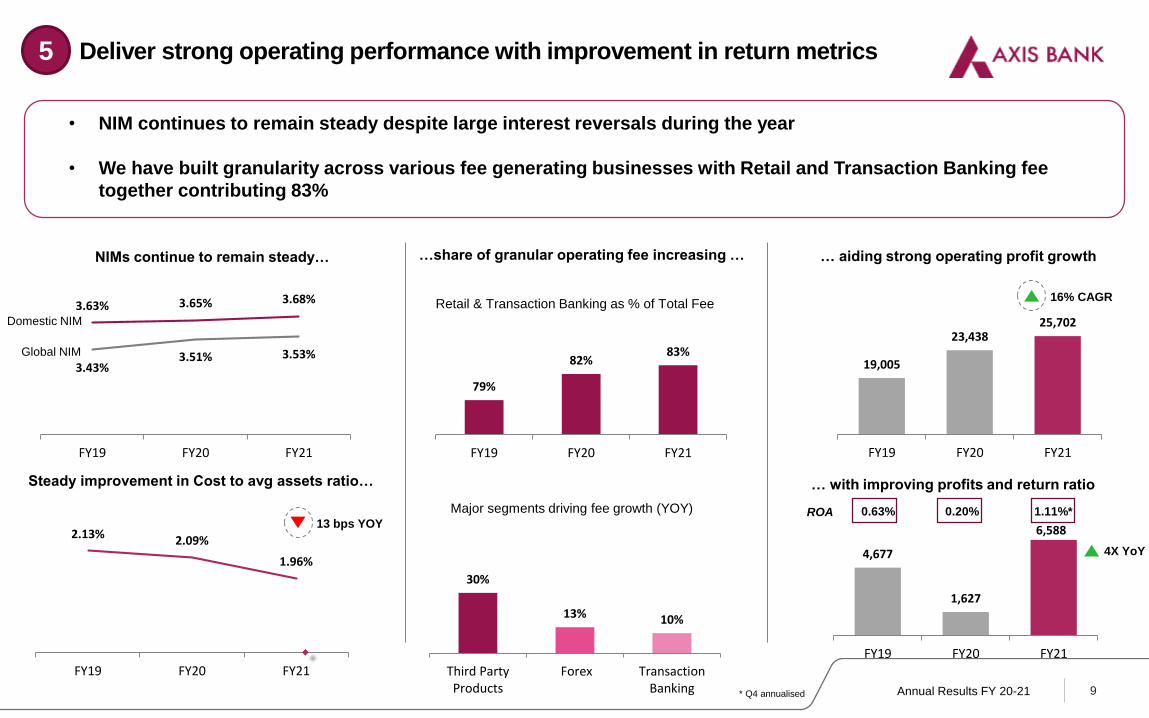
Deliver strong operating performance with improvement in return metrics 5
• NIM continues to remain steady despite large interest reversals during the year
• We have built granularity across various fee generating businesses with Retail and Transaction Banking fee
together contributing 83%
Steady improvement in Cost to avg assets ratio…
… aiding strong operating profit growth …share of granular operating fee increasing …
19,005
23,43825,702
FY19 FY20 FY21
16% CAGR
2.13% 2.09%
1.96%
FY19 FY20 FY21
13 bps YOY
Retail & Transaction Banking as % of Total Fee
3.43%3.51% 3.53%
3.63% 3.65% 3.68%
FY19 FY20 FY21
NIMs continue to remain steady…
Major segments driving fee growth (YOY)
30%
13% 10%
Third PartyProducts
Forex TransactionBanking
Global NIM
Domestic NIM
4,677
1,627
6,588
FY19 FY20 FY21
0.63% 0.20% 1.11%*
… with improving profits and return ratio
* Q4 annualised
ROA
4X YoY
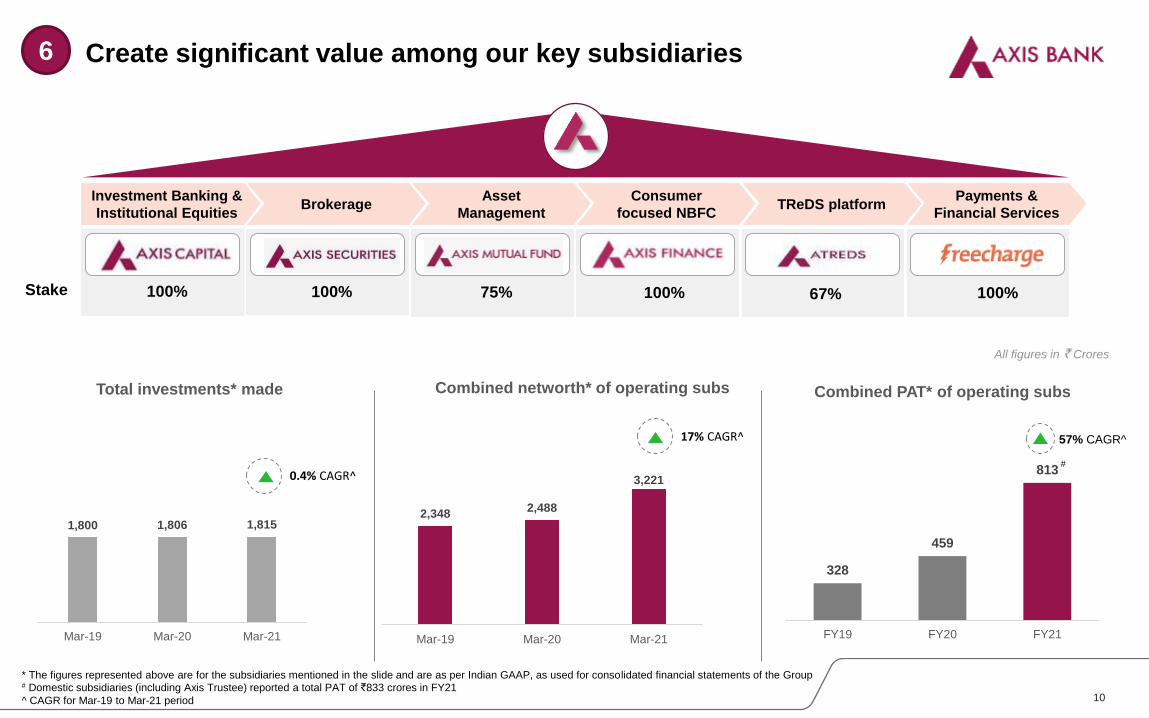
328
459
813
FY19 FY20 FY21
Combined PAT* of operating subs
Investment Banking &
Institutional Equities
Payments &
Financial ServicesTReDS platform
Consumer
focused NBFC
Asset
ManagementBrokerage
10
1,800 1,806 1,815
Mar-19 Mar-20 Mar-21
Total investments* made
2,3482,488
3,221
Mar-19 Mar-20 Mar-21
Combined networth* of operating subs
0.4% CAGR^
17% CAGR^
100%
* The figures represented above are for the subsidiaries mentioned in the slide and are as per Indian GAAP, as used for consolidated financial statements of the Group# Domestic subsidiaries (including Axis Trustee) reported a total PAT of `833 crores in FY21
^ CAGR for Mar-19 to Mar-21 period
Stake 100% 75% 67%100% 100%
All figures in ` Crores
Create significant value among our key subsidiaries
57% CAGR^
#
6
Annual Results FY 20-21
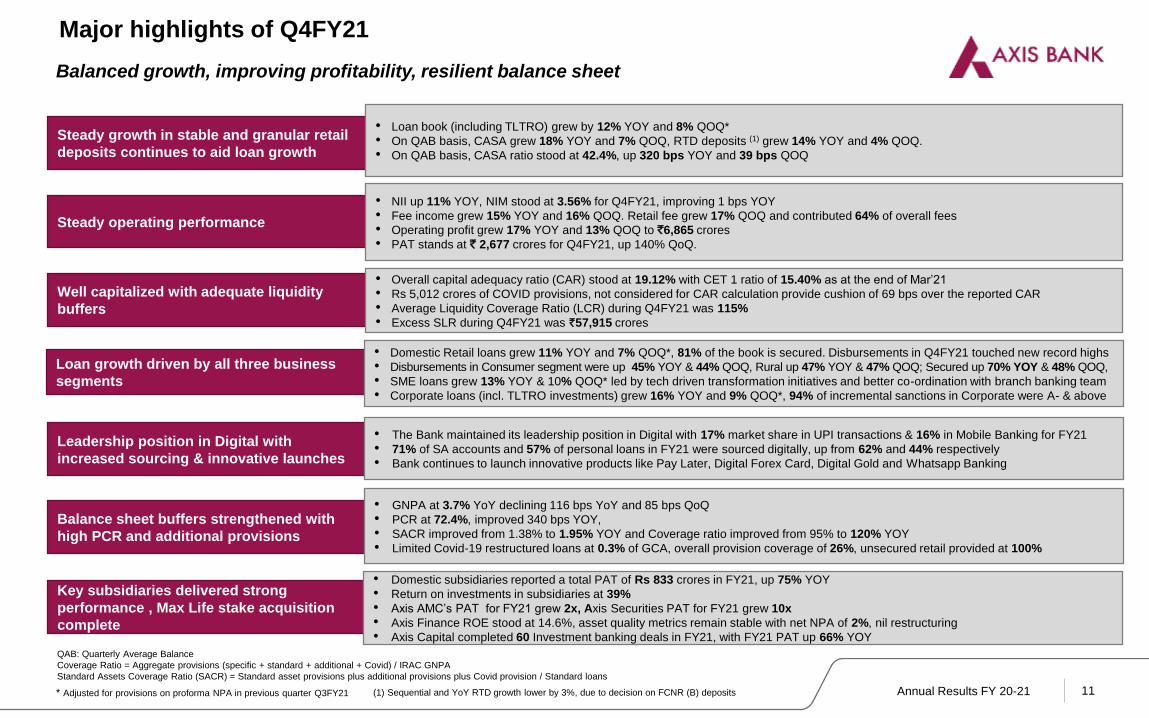
Major highlights of Q4FY21
11
Well capitalized with adequate liquidity
buffers
Loan growth driven by all three business
segments
Steady growth in stable and granular retail
deposits continues to aid loan growth
Steady operating performance
• Overall capital adequacy ratio (CAR) stood at 19.12% with CET 1 ratio of 15.40% as at the end of Mar’21
• Rs 5,012 crores of COVID provisions, not considered for CAR calculation provide cushion of 69 bps over the reported CAR
• Average Liquidity Coverage Ratio (LCR) during Q4FY21 was 115%
• Excess SLR during Q4FY21 was `57,915 crores
• Loan book (including TLTRO) grew by 12% YOY and 8% QOQ*
• On QAB basis, CASA grew 18% YOY and 7% QOQ, RTD deposits (1) grew 14% YOY and 4% QOQ.
• On QAB basis, CASA ratio stood at 42.4%, up 320 bps YOY and 39 bps QOQ
• Domestic Retail loans grew 11% YOY and 7% QOQ*, 81% of the book is secured. Disbursements in Q4FY21 touched new record highs
• Disbursements in Consumer segment were up 45% YOY & 44% QOQ, Rural up 47% YOY & 47% QOQ; Secured up 70% YOY & 48% QOQ,
• SME loans grew 13% YOY & 10% QOQ* led by tech driven transformation initiatives and better co-ordination with branch banking team
• Corporate loans (incl. TLTRO investments) grew 16% YOY and 9% QOQ*, 94% of incremental sanctions in Corporate were A- & above
• NII up 11% YOY, NIM stood at 3.56% for Q4FY21, improving 1 bps YOY
• Fee income grew 15% YOY and 16% QOQ. Retail fee grew 17% QOQ and contributed 64% of overall fees
• Operating profit grew 17% YOY and 13% QOQ to `6,865 crores
• PAT stands at ` 2,677 crores for Q4FY21, up 140% QoQ.
Balance sheet buffers strengthened with
high PCR and additional provisions
• GNPA at 3.7% YoY declining 116 bps YoY and 85 bps QoQ
• PCR at 72.4%, improved 340 bps YOY,
• SACR improved from 1.38% to 1.95% YOY and Coverage ratio improved from 95% to 120% YOY
• Limited Covid-19 restructured loans at 0.3% of GCA, overall provision coverage of 26%, unsecured retail provided at 100%
Key subsidiaries delivered strong
performance , Max Life stake acquisition
complete
• Domestic subsidiaries reported a total PAT of Rs 833 crores in FY21, up 75% YOY
• Return on investments in subsidiaries at 39%
• Axis AMC’s PAT for FY21 grew 2x, Axis Securities PAT for FY21 grew 10x
• Axis Finance ROE stood at 14.6%, asset quality metrics remain stable with net NPA of 2%, nil restructuring
• Axis Capital completed 60 Investment banking deals in FY21, with FY21 PAT up 66% YOY
Leadership position in Digital with
increased sourcing & innovative launches
• The Bank maintained its leadership position in Digital with 17% market share in UPI transactions & 16% in Mobile Banking for FY21
• 71% of SA accounts and 57% of personal loans in FY21 were sourced digitally, up from 62% and 44% respectively
• Bank continues to launch innovative products like Pay Later, Digital Forex Card, Digital Gold and Whatsapp Banking
QAB: Quarterly Average Balance
Coverage Ratio = Aggregate provisions (specific + standard + additional + Covid) / IRAC GNPA
Standard Assets Coverage Ratio (SACR) = Standard asset provisions plus additional provisions plus Covid provision / Standard loans
Balanced growth, improving profitability, resilient balance sheet
* Adjusted for provisions on proforma NPA in previous quarter Q3FY21 (1) Sequential and YoY RTD growth lower by 3%, due to decision on FCNR (B) deposits

Annual Results FY 20-21
Absolute (Rs. Cr) YOY Growth
Q4FY21 FY21 Q4FY21 FY21
Net Interest Income 7,555 29,239 11% 16%
Fee Income 3,376 10,686 15% (3%)
Operating Expenses 5,359 18,375 8% 6%
Operating Profit 6,865 25,702 17% 10%
Net Profit 2,677 6,588 - 305%
FY21 YOY Growth
Total Assets 9,96,118 9%
Net Advances 6,23,720 9%
Total Deposits ^ 7,07,306 10%
Shareholders’ Funds 101,603 20%
FY21 FY20
Diluted EPS (Annualised in `)
(Q4/FY)35.37 / 22.09 (19.79) / 5.97
Book Value per share (in `) 332 301
ROA (Annualised) (Q4/12M) 1.11 / 0.70 (0.62) / 0.20
ROE (Annualised) (Q4/12M) 11.72 / 7.55 (7.08) / 2.34
Gross NPA Ratio 3.70% 4.86%
Net NPA Ratio 1.05% 1.56%
Basel III Tier I CAR 16.47% 14.49%
Basel III Total CAR 19.12% 17.53%
1,627
FY20 FY21
23,438 25,702
FY20 FY21
Key metrics for Q4FY21Snapshot (As on 31st March 2021)
12
86%
CASA + RTD #
Deposits # 9% YOY
54%
11%
35%
Retail SME Corporate
10% YOY
Advances 12% YOY *
Profit After Tax (in ₹ Crores)
#QAB – Quarterly Average Balance
16% YOY (QAB#)
17% YOY (End Balance)
Operating Profit (in ₹ Crores)
12
10% YOY
Ba
lance
Sh
ee
t
Pro
fit &
Loss
Key R
atios
^ period end balances
* Including TLTRO
305% YOY
13% YOY 16% YOY *
6,588
Annual Results FY 20-21
Financial Highlights
Business Segment performance
Asset Quality
Capital and Liquidity Position
Future of Work and Sustainability
Subsidiaries’ Performance
13
Other important information
Executive Summary
Annual Results FY 20-21
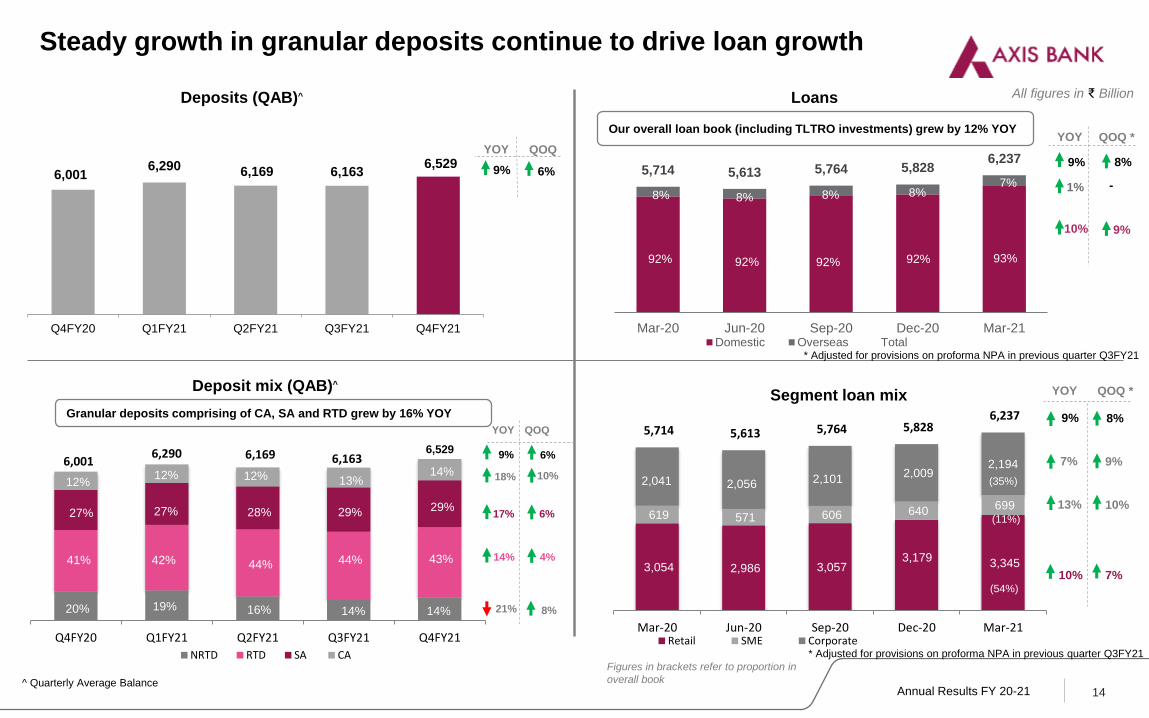
3,054 2,986 3,057 3,179
3,345
619 571 606 640 699
2,041 2,056 2,1012,009
2,194
5,714 5,613 5,764 5,828 6,237
Mar-20 Jun-20 Sep-20 Dec-20 Mar-21Retail SME Corporate
5,714 5,613 5,764 5,8286,237
Mar-20 Jun-20 Sep-20 Dec-20 Mar-21Domestic Overseas Total
6,001 6,290 6,169 6,163
Q4FY20 Q1FY21 Q2FY21 Q3FY21 Q4FY21
NRTD RTD SA CA
29%27%
41%
27%
20% 19% 16%
44%42%
13%12%12%12%
Steady growth in granular deposits continue to drive loan growth
^ Quarterly Average Balance14
All figures in ₹ Billion
6,0016,290 6,169 6,163
6,529
Q4FY20 Q1FY21 Q2FY21 Q3FY21 Q4FY21
Deposits (QAB)^
Deposit mix (QAB)^
Loans
Segment loan mix
92%92% 92%
8%8% 8%
28%
44%
14%
92%
Figures in brackets refer to proportion in
overall book
8%
Our overall loan book (including TLTRO investments) grew by 12% YOY
7%
93%
43%
14%
14%
29%
Granular deposits comprising of CA, SA and RTD grew by 16% YOY
6,5297%
13%
10%
YOY QOQ *
9%
10%
7%
YOY QOQ *
9% 8%YOY QOQ
9% 6%
8%
17%
14%
21%
YOY QOQ
6%
4%
18% 10%
9% 6%
9% 8%
1% -
10% 9%
(54%)
(35%)
(11%)
* Adjusted for provisions on proforma NPA in previous quarter Q3FY21
* Adjusted for provisions on proforma NPA in previous quarter Q3FY21

Annual Results FY 20-21
5.01% 4.73%4.37% 4.09% 3.90%
Cost of Deposits
39% 39% 40% 42% 42%
41% 42% 44% 44% 44%
80% 81% 84% 86% 86%
Q4FY20 Q1FY21 Q2FY21 Q3FY21 Q4FY21
(CASA + RTD*) ratio$ & cost of deposits
CASA% RTD% .
7%0% 3% 4%
10%
11%8%
18%15%
18%
QoQ YoY
3%5%
2%4%
6%
13%15% 15% 14%
17%
QoQ YoY
743 745 767 800 878
Q4FY20 Q1FY21 Q2FY21 Q3FY21 Q4FY21
1,609 1,692 1,726 1,7881,889
Q4FY20 Q1FY21 Q2FY21 Q3FY21 Q4FY21
7% 7%2%
0% 4%
33%27% 25%
17% 14%
QoQ YoY
15
Savings account balances^
2,4762,639 2,704 2,712 2,834
Q4FY20 Q1FY21 Q2FY21 Q3FY21 Q4FY21
Retail term deposits^
Current account balances^
Progress on building a granular, stable low cost deposit franchise remains on track
All figures in ₹ Billion
* Retail Term Deposits ^ Quarterly Average Balance$ Computed on QAB
(68%)(68%) (74%) (76%) (75%)
Figures in brackets refer to proportion of overall Term Deposits
(1)
(1)
(1) Adversely impacted by 3% YoY and QoQ on ren renewal of FCNR (B) deposits

Annual Results FY 20-21
5,851 5,844
6,898
6,096
6,865
Q4FY20 Q1FY21 Q2FY21 Q3FY21 Q4FY21
Operating profit
2.08%
2.15%2.17%
2.13%
2.09%
1.96%
FY16 FY17 FY18 FY19 FY20 FY21
Opex to average assets
Operating performance has been robust
16
All figures in ₹ Crores
6,808 6,985 7,326 7,373 7,555
3,985 2,587
3,807 3,776 4,668
10,793 9,572
11,133 11,149 12,223
Q4FY20 Q1FY21 Q2FY21 Q3FY21 Q4FY21
Operating revenue
Net Interest Income Non-Interest Income
* annualized
-1,388
1,112
1,683
1,117
2,677
Q4FY20 Q1FY21 Q2FY21 Q3FY21 Q4FY21
Profit after tax
Net of impact of prudent
COVID risk provisioning
of ₹2,306 crs
Net of impact of
prudent choices
~ ₹1,050 crs
13%
17%
11%
YOY QOQ
10%
24%
2%
YOY QOQ
17% 13%
Net of impact of CBG
provision and SR
provision of ₹1,409 crs
Annual Results FY 20-21
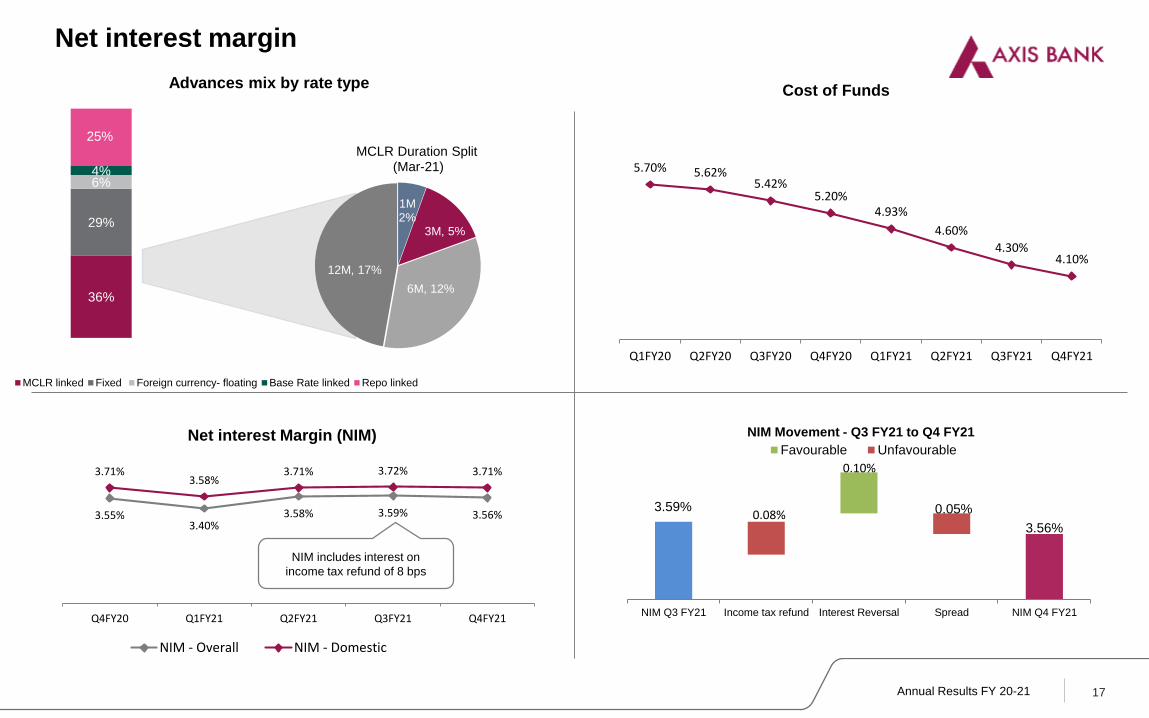
Net interest margin
5.70% 5.62%5.42%
5.20%4.93%
4.60%
4.30%4.10%
Q1FY20 Q2FY20 Q3FY20 Q4FY20 Q1FY21 Q2FY21 Q3FY21 Q4FY21
3.55%3.40%
3.58% 3.59% 3.56%
3.71%3.58%
3.71% 3.72% 3.71%
Q4FY20 Q1FY21 Q2FY21 Q3FY21 Q4FY21
NIM - Overall NIM - Domestic
17
Cost of Funds
36%
29%
6%4%
25%
MCLR linked Fixed Foreign currency- floating Base Rate linked Repo linked
1M2%
3M, 5%
6M, 12%
12M, 17%
MCLR Duration Split(Mar-21)
Net interest Margin (NIM)
Advances mix by rate type
NIM includes interest on
income tax refund of 8 bps
*
3.59%
3.56%
0.05%
NIM Q3 FY21 Income tax refund Interest Reversal Spread NIM Q4 FY21
NIM Movement - Q3 FY21 to Q4 FY21
Favourable Unfavourable
0.08%
0.10%
Annual Results FY 20-21
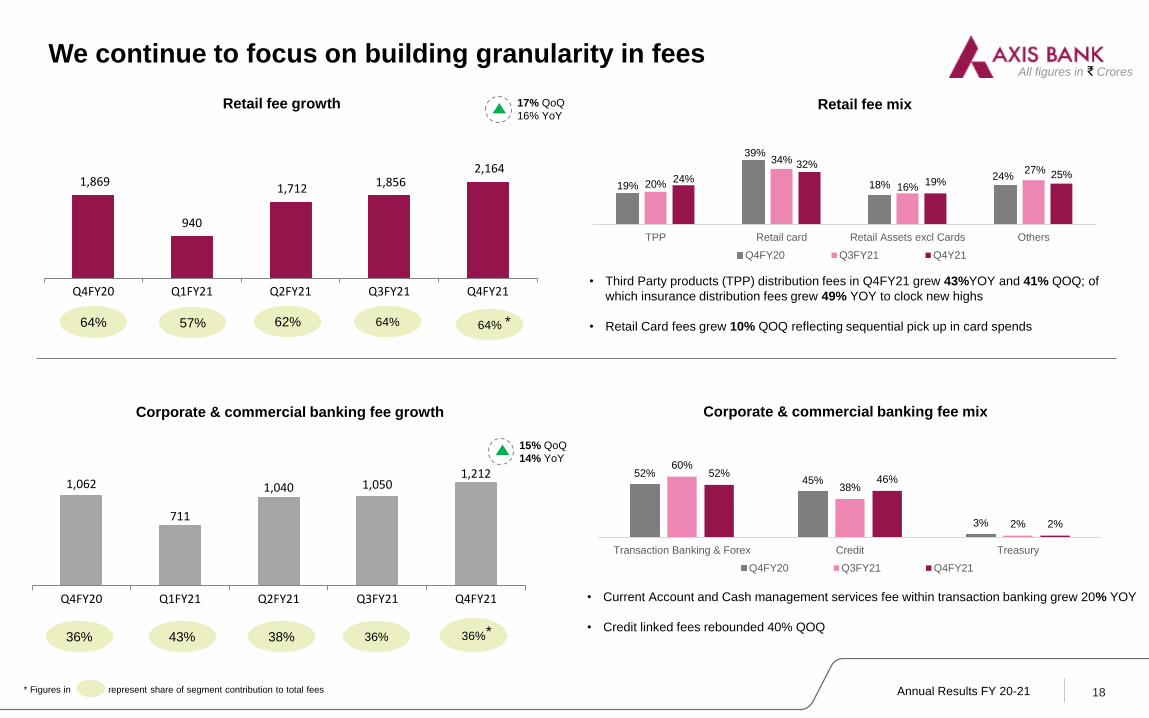
1,869
940
1,712 1,856 2,164
Q4FY20 Q1FY21 Q2FY21 Q3FY21 Q4FY21
1,062
711
1,040 1,0501,212
Q4FY20 Q1FY21 Q2FY21 Q3FY21 Q4FY21
18
Retail fee growth 17% QoQ
16% YoY
All figures in ₹ Crores
• Third Party products (TPP) distribution fees in Q4FY21 grew 43%YOY and 41% QOQ; of
which insurance distribution fees grew 49% YOY to clock new highs
• Retail Card fees grew 10% QOQ reflecting sequential pick up in card spends
• Current Account and Cash management services fee within transaction banking grew 20% YOY
• Credit linked fees rebounded 40% QOQ
Corporate & commercial banking fee growth
15% QoQ
14% YoY
We continue to focus on building granularity in fees
62%64% 57%
36%36% 43% 38%
64%
* Figures in % represent share of segment contribution to total fees
^
19%
39%
18%24%
20%
34%
16%
27%24%
32%
19%25%
TPP Retail card Retail Assets excl Cards Others
Q4FY20 Q3FY21 Q4Y21
52%45%
3%
60%
38%
2%
52%46%
2%
Transaction Banking & Forex Credit Treasury
Q4FY20 Q3FY21 Q4FY21
64%
36%
*
*
Retail fee mix
Corporate & commercial banking fee mix

Annual Results FY 20-21
Financial Highlights
Business Segment performance
Asset Quality
Capital and Liquidity Position
Future of Work and Sustainability
Subsidiaries’ Performance
19
Other important information
Executive Summary

Annual Results FY 20-21
11.68% 11.27%13.34%
15.40%4.89% 4.57%
4.19%
3.72%16.57% 15.84%17.53%
19.12%
Mar 18 Mar 19 Mar-20 Mar-21
CET 1 CAR (AT1 + Tier 2) CAR
Bank’s Capital Adequacy Ratio
* Includes effect of one-off item impacting around 1%
75%
69%67%
64%
Mar-18 Mar-19 Mar-20 Mar-21
RWA to Total Assets
*
113% 112%
120%117%
106%
115%
60%
70%
80%
90%
100%
110%
120%
130%
140%
Q3FY20 Q4FY20 Q1FY21 Q2FY21 Q3FY21 Q4FY21
Liquidity Coverage Ratio (consolidated)
Bank's LCR (consolidated)
Regulatory minimum LCR
The Bank holds excess SLR of `57,915 crores
Strong capital position with adequate liquidity
Bank raised ₹10,000 crores
of equity capital in Aug’20
20

Annual Results FY 20-21
Financial Highlights
Business Segment performance
Asset Quality
Capital and Liquidity Position
Future of Work and Sustainability
Subsidiaries’ Performance
21
Other important information
Executive Summary

86%CASA + RTD ratio
(QAB)
~25 MnSA customers
73%Sourcing* from ETB
customers
`2.13 TnAUM in wealth
management
Retail Banking
54%Share of
Advances~
64%Share in total fee^
10%Growth in
advances
17%Growth in SA
QAB deposits
4th
Largest issuer of
Credit Cards
*for Retail Assets in Q4FY21 from Existing to Bank (ETB) customers
~ share in Bank’s total advances, ^ share in Bank’s total fee for Q4FY21
Annual Results FY 20-21
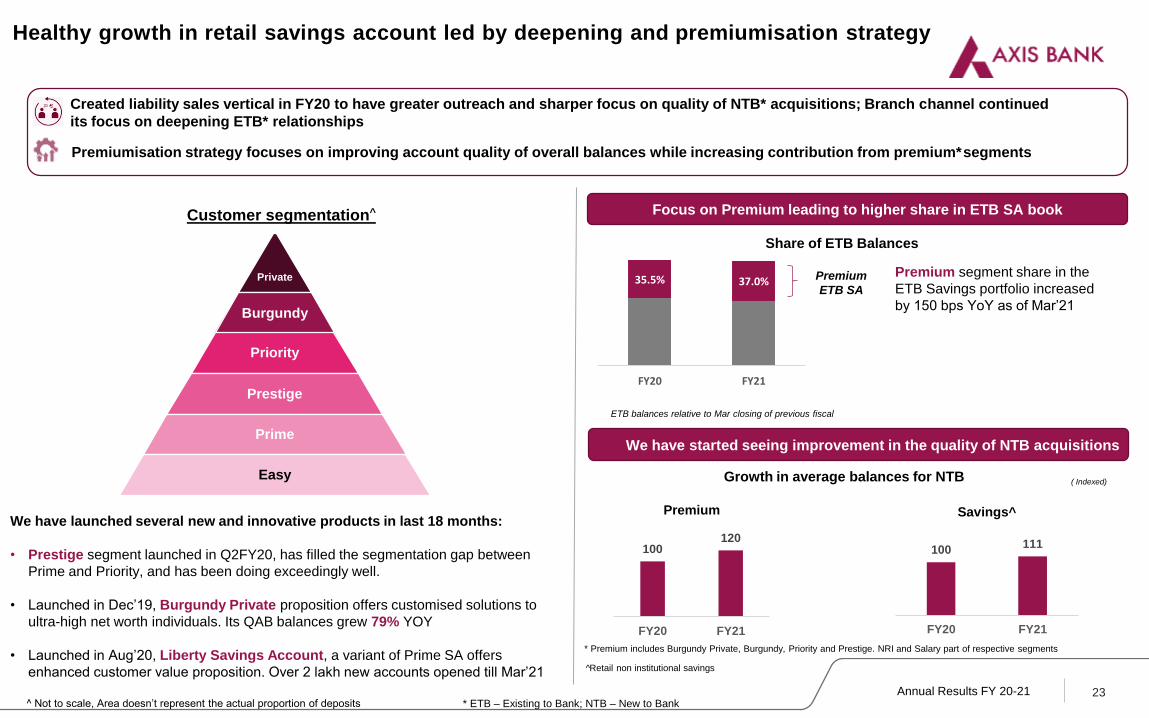
Higher customer engagement led to broad base growth from ETB relationships Focus on Premium leading to higher share in ETB SA book
23
Burgundy
Priority
Prestige
Prime
Easy
Private
* Premium includes Burgundy Private, Burgundy, Priority and Prestige. NRI and Salary part of respective segments
Healthy growth in retail savings account led by deepening and premiumisation strategy
^ Not to scale, Area doesn’t represent the actual proportion of deposits
Customer segmentation^
• Created liability sales vertical in FY20 to have greater outreach and sharper focus on quality of NTB* acquisitions; Branch channel continued
• its focus on deepening ETB* relationships
• Premiumisation strategy focuses on improving account quality of overall balances while increasing contribution from premium* segments
We have started seeing improvement in the quality of NTB acquisitions
* ETB – Existing to Bank; NTB – New to Bank
ETB balances relative to Mar closing of previous fiscal
Growth in average balances for NTB
Share of ETB Balances
( Indexed)
Premium
ETB SA
Premium segment share in the
ETB Savings portfolio increased
by 150 bps YoY as of Mar’21
We have launched several new and innovative products in last 18 months:
• Prestige segment launched in Q2FY20, has filled the segmentation gap between
Prime and Priority, and has been doing exceedingly well.
• Launched in Dec’19, Burgundy Private proposition offers customised solutions to
ultra-high net worth individuals. Its QAB balances grew 79% YOY
• Launched in Aug’20, Liberty Savings Account, a variant of Prime SA offers
enhanced customer value proposition. Over 2 lakh new accounts opened till Mar’21
35.5% 37.0%
FY20 FY21
^Retail non institutional savings
100120
FY20 FY21
Premium
100111
FY20 FY21
Savings^
Annual Results FY 20-21
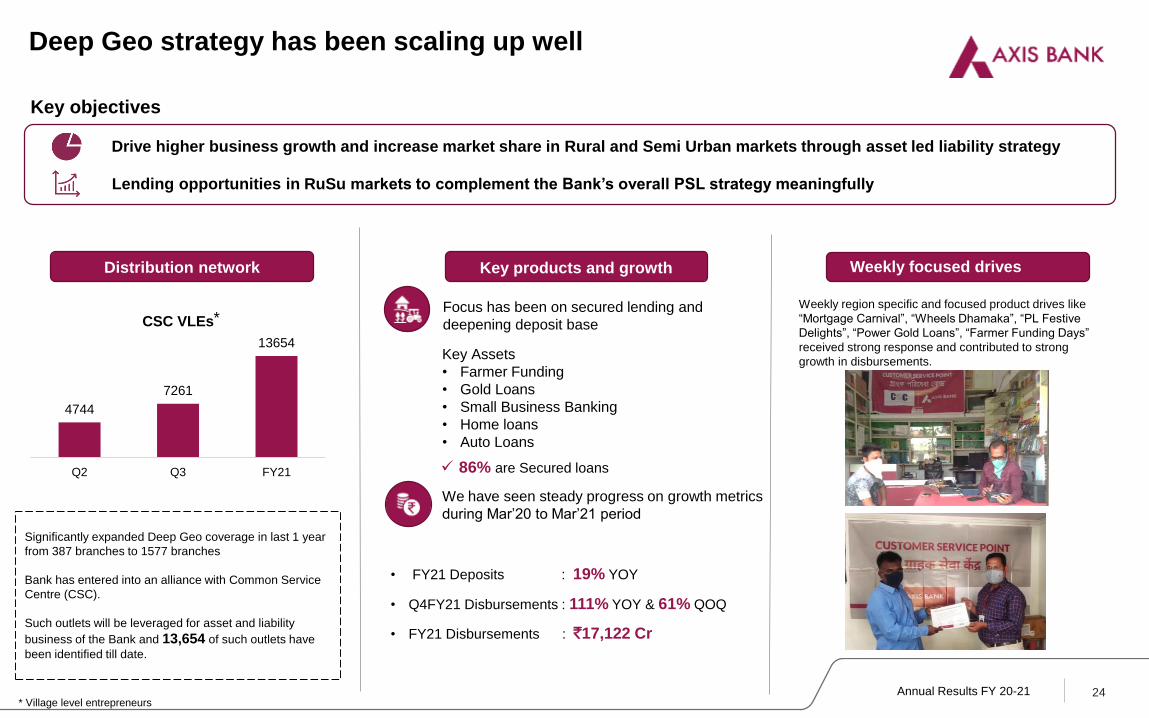
Focus has been on secured lending and
deepening deposit base
Drive higher business growth and increase market share in Rural and Semi Urban markets through asset led liability strategy
Distribution network
• Lending opportunities in RuSu markets to complement the Bank’s overall PSL strategy meaningfully
Deep Geo strategy has been scaling up well
Key objectives
Key products and growth Weekly focused drives
Weekly region specific and focused product drives like
“Mortgage Carnival”, “Wheels Dhamaka”, “PL Festive
Delights”, “Power Gold Loans”, “Farmer Funding Days”
received strong response and contributed to strong
growth in disbursements. Key Assets
• Farmer Funding
• Gold Loans
• Small Business Banking
• Home loans
• Auto Loans
We have seen steady progress on growth metrics
during Mar’20 to Mar’21 period
24
Significantly expanded Deep Geo coverage in last 1 year
from 387 branches to 1577 branches
Bank has entered into an alliance with Common Service
Centre (CSC).
Such outlets will be leveraged for asset and liability
business of the Bank and 13,654 of such outlets have
been identified till date.
4744
7261
13654
Q2 Q3 FY21
CSC VLEs
• FY21 Deposits : 19% YOY
• Q4FY21 Disbursements : 111% YOY & 61% QOQ
• FY21 Disbursements : `17,122 Cr
✓ 86% are Secured loans
*
* Village level entrepreneurs

Annual Results FY 20-21
36%
13%12%
12%
9%
4%
5%
8%
Home loans Rural lending Auto loans PL
LAP CC SBB Others
Secured loans disbursements growth
73%
88% 85% 83% 85%
as % of overall disbursements
170
115
86
29
100
Q4FY21Q3FY21Q2FY21Q1FY21Q4FY20
55%58%62%
79%81%92%
SBBHLAutoLAPPersonalLoan
CreditCard
HL – Home loans, PL – Personal Loan, SBB – Small Business Banking, LAP – Loan against Property, CC – Credit Cards25
~ 81% of our retail book is secured
ETB mix in retail portfolio
Rs 3 trillion Retail loan book is well diversified and 81% secured with significantly
high proportion of ETB and salaried customers
100% of PL and 63% of Credit Cards
portfolio is to salaried segment
Average LTVs:
52% in overall home loan portfolio
35% in LAP portfolio
Sourcing:
Branches contributed 59% to overall Retail
book sourcing in Q4FY21
Indexed to 100
Disbursement trends in secured loans
YOY QOQ
Home loans 73% 45%
LAP 53% 51%
SBB 71% 42%
Wheels 20% 7%
Rural 47% 47%
95% 95% 96% 96% 96%
5% 5% 4% 4% 4%
Mar-20 Jun-20 Sep-20 Dec-20 Mar-21
Domestic Overseas
Retail book mix by geography
3,054 2,986 3,057 3,179 3,345 10%
11%
YOY QOQ*
7%
7%
9%18%
* Provisions on proforma NPA in Q3FY21, netted from advances for comparability

Annual Results FY 20-21Source: RBI Data Reports
We are the 4th largest issuer of Credit Cards in the country
Premium Cards
Co-branded Cards
Featured Cards
26
7.0 6.8 6.9 6.9 7.1
Q4FY20 Q1FY21 Q2FY21 Q3FY21 Q4FY21
Credit Cards in force (mn)
11.7%12.1% 11.9% 11.5% 11.4%*
• Note: Figures in boxes represent market share for the period, For Q4FY21, market share is for month of Jan’21 & Feb’21
Flipkart Axis Bank
Credit Card
• Co-branded card partnership in collaboration with Flipkart
and Mastercard; it has best in class spends and engagement
metrics
• One of the fastest growing co-brand portfolio with 1
million cards in force within 20 months of launch
Continued focus to increase sourcing and deepen spends from the
affluent segment. The affluent portfolio penetration has improved from
11.51% in FY’20 to 11.85% in FY’21
Migration to digital based sourcing through straight through
applications – 74% in Q4FY21 as compared to 78% in Q3FY21 and
50% in Q4FY20
During the year, the Bank’s Partnership with Flipkart, Google Pay and
Freecharge resulted in sourcing of over 2 lakh credit cards that
contributed to 21% of overall credit card sourcing in FY21
Key insights
Axis Bank Aura
Credit Card
• Launched ‘AURA’ credit card with focus on Health & Wellness
need of the customers;
• Industry first affordable offering of various benefits which give
cardholders access to 48 free video doctor consultations across
21 medical specialties powered by Practo, free access to 48
interactive video sessions and 192 recorded sessions across
multiple fitness categories every year
Annual Results FY 20-21
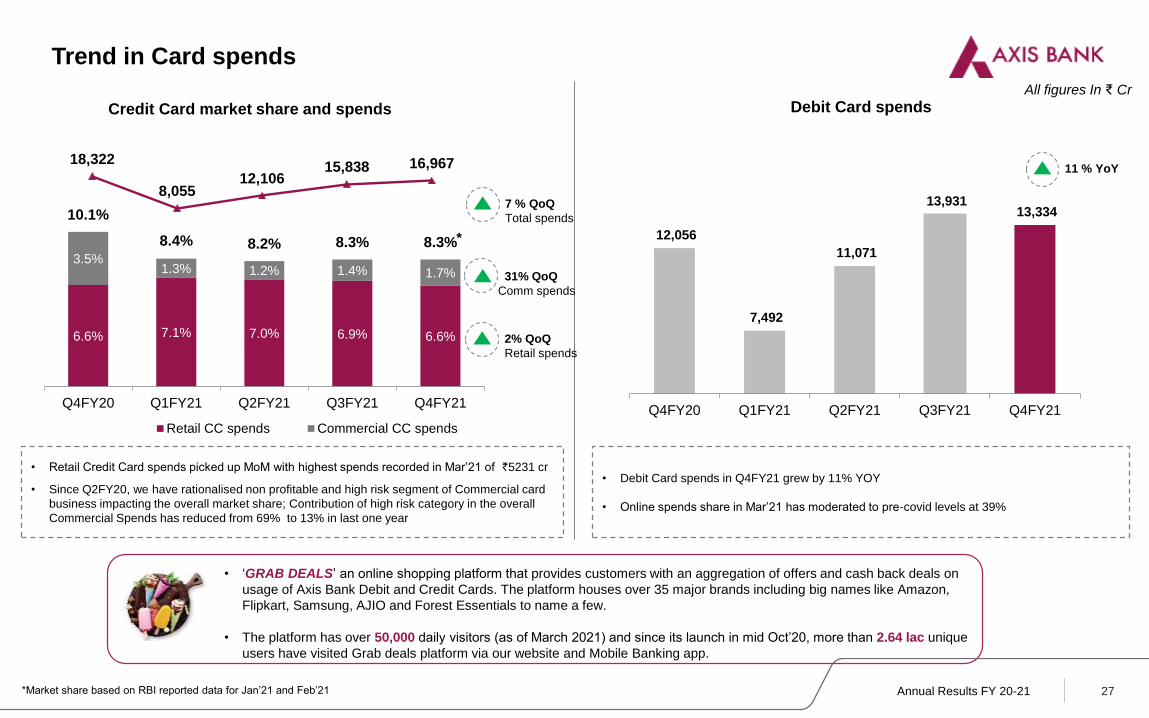
18,322
8,05512,106
15,838 16,967
6.6% 7.1% 7.0% 6.9% 6.6%
3.5%1.3% 1.2% 1.4% 1.7%
10.1%
8.4% 8.2% 8.3% 8.3%
Q4FY20 Q1FY21 Q2FY21 Q3FY21 Q4FY21
Retail CC spends Commercial CC spends
12,056
7,492
11,071
13,931 13,334
Q4FY20 Q1FY21 Q2FY21 Q3FY21 Q4FY21
All figures In ₹ Cr
Trend in Card spends
27
Credit Card market share and spends Debit Card spends
*
*Market share based on RBI reported data for Jan’21 and Feb’21
*
*
7 % QoQ
Total spends
2% QoQ
Retail spends
31% QoQ
Comm spends
• ‘GRAB DEALS’ an online shopping platform that provides customers with an aggregation of offers and cash back deals on
usage of Axis Bank Debit and Credit Cards. The platform houses over 35 major brands including big names like Amazon,
Flipkart, Samsung, AJIO and Forest Essentials to name a few.
• The platform has over 50,000 daily visitors (as of March 2021) and since its launch in mid Oct’20, more than 2.64 lac unique
users have visited Grab deals platform via our website and Mobile Banking app.
• Debit Card spends in Q4FY21 grew by 11% YOY
• Online spends share in Mar’21 has moderated to pre-covid levels at 39%
• Retail Credit Card spends picked up MoM with highest spends recorded in Mar’21 of `5231 cr
• Since Q2FY20, we have rationalised non profitable and high risk segment of Commercial card
business impacting the overall market share; Contribution of high risk category in the overall
Commercial Spends has reduced from 69% to 13% in last one year
11 % YoY

Annual Results FY 20-21 28
We continue to grow Acquiring through innovations and integrated approach
Expansion strategy
Innovations in AcquiringThroughput trend & market share
Feb’21
13.4%
Mar’20
11.9%
Jun’20
10.8%
Sep’20
12.0%
Dec’20
13.5%
(In ₹ ` thousand crores)
41.1
22.4
34.9
51.8 51.9
Q4FY20 Q1FY21 Q2FY21 Q3FY21 Q4FY21
Market share source for the month in %: RBI data
Available till Feb’21
Key insights
• Both Throughput and installations continue to grow QoQ.
• Focused approach on providing newer services to the merchants,
understanding their experiences & improving on them, rebuilding on
merchant relationships
• Acquiring strategy is aligned to CA growth with very good success
observed in our CA balance growth
• Android PoS: State-of-the-Art terminal loaded
with VAS such as Khaata & BQR contributing to
40% of the Sourcing. The early indicators are
encouraging with 30% higher activity and Ticket
Size of transactions than other terminals
• Buy Now Pay Later: Valued added service that
offers cardless EMI facitlity allowing faster
processing of high value transactions
• CX Index: Captures merchants’ experience
around On-boarding, Usage & Service. Helps
provide direction for future course of actions to
bring further stability to the business
• Accelerated Sourcing: Strategized focus on installations to gain market
share. Sourced 1Lakh+ terminals in Q4FY21
• Leveraging “Partnership Ecosystems” to get more merchants into the
Digital Payments foray
• Investment in Digital Infrastructure to “take the Bank to the Merchant”.
Offering a bouquet of Banking products along with a payment solution.
Annual Results FY 20-21
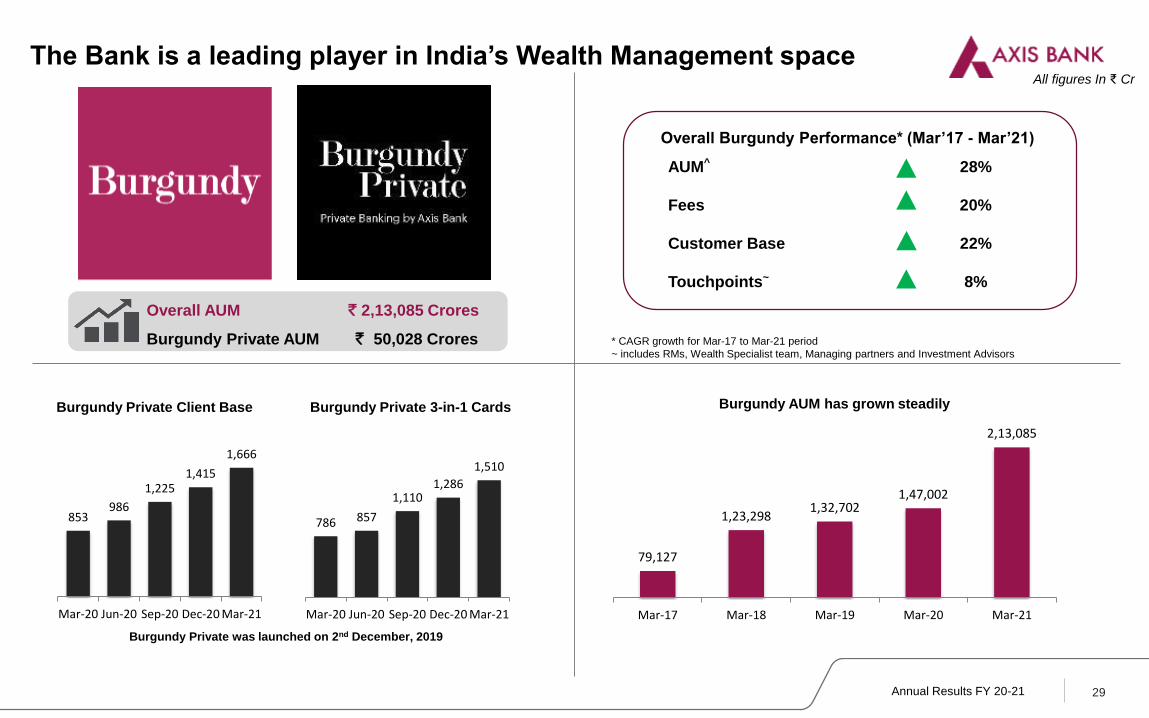
The Bank is a leading player in India’s Wealth Management space
29
Burgundy Private was launched on 2nd December, 2019
853986
1,2251,415
1,666
Mar-20 Jun-20 Sep-20 Dec-20 Mar-21
Burgundy Private Client Base
786 857
1,1101,286
1,510
Mar-20 Jun-20 Sep-20 Dec-20 Mar-21
Burgundy Private 3-in-1 Cards
AUM^ 28%
Fees 20%
Customer Base 22%
Touchpoints~ 8%
Overall Burgundy Performance* (Mar’17 - Mar’21)
79,127
1,23,2981,32,702
1,47,002
2,13,085
Mar-17 Mar-18 Mar-19 Mar-20 Mar-21
Burgundy AUM has grown steadily
All figures In ₹ Cr
* CAGR growth for Mar-17 to Mar-21 period
~ includes RMs, Wealth Specialist team, Managing partners and Investment Advisors
• Overall AUM ` 2,13,085 Crores
• Burgundy Private AUM ` 50,028 Crores

Annual Results FY 20-21
30%
23%
31%
16%
Metro Urban Semi-Urban Rural
3,703
4,050
4,528 4,594
Mar-18 Mar-19 Mar-20 Mar-21
Domestic branch network*
* Includes extension counters
30
We have grown our Virtual Center capacities faster than branches this year
Branch presence across categories
• Calibrated approach towards new branch additions across focused segments and regions
• Aligned to our Deep Geo strategy, specific RuSu branches follow an asset-led liability model
• Dedicated Asset Desk Managers for fulfilment of all loan leads at select branches
• Select Platinum branches to cater to SBB customer base
• Manages relationship with our existing customers
under affluent and other programs
• AVC expanded to three new centres across
Mumbai, Ahmedabad and Kolkata during this year
and is now present across West, South, North and
East with six centres
• We are connecting with more than 3 million
customers every month through this channel.
3 mnCustomer
connect ^
6Centers
1500 Virtual RMs
Axis Virtual Centre
^ Customers contacted every month
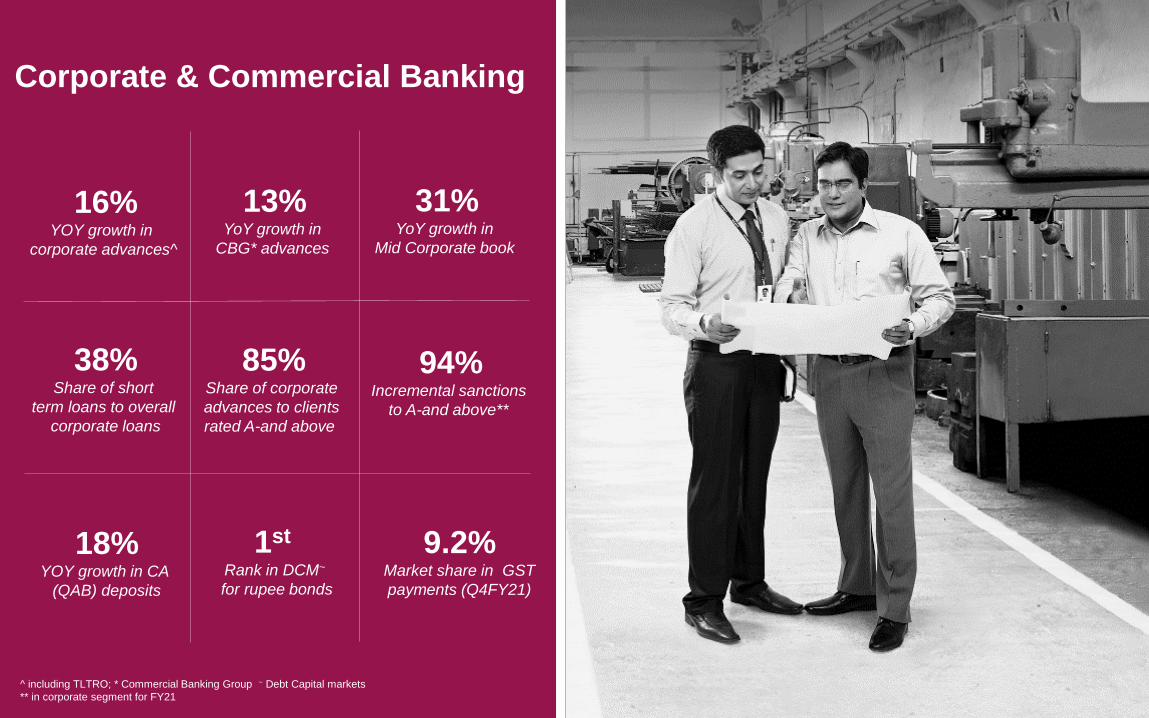
Corporate & Commercial Banking
1st
Rank in DCM~
for rupee bonds
13%YoY growth in
CBG* advances
9.2%Market share in GST
payments (Q4FY21)
94%Incremental sanctions
to A-and above**
38%Share of short
term loans to overall
corporate loans
18%YOY growth in CA
(QAB) deposits
^ including TLTRO; * Commercial Banking Group ~ Debt Capital markets
** in corporate segment for FY21
16%YOY growth in
corporate advances^
85%Share of corporate
advances to clients
rated A-and above
31%YoY growth in
Mid Corporate book

Annual Results FY 20-21 32
Strong relationship led franchise driving synergies across One Axis entities
‘One stop shop’ for Banking needs of Indian Corporates
3
4
Full Service
Corporate &
Commercial
Bank
• Wealth Management – Burgundy / Burgundy Private
• Salary Accounts of employees
Linkage to Retail Bank
• Debt Capital Markets (DCM)
• Equity Capital Markets (ECM)
• M&A & Advisory
• Forex & Derivative Solutions
Treasury, Capital Markets & Investment Banking
• Cash Management
• Trade & Supply Chain
• Letter of Credit/ Bank Guarantee
• Bill/ Invoice Discounting
• Current Accounts
• Correspondent Banking
• Custodial Services
Transaction Banking
• Working Capital / Term Loans
• Wholesale Deposits
Loan & Deposits
1
2
Axis Capital
A.Treds
Axis Trustee
Axis Finance
Axis MF
Reliable Partner Throughout the Business Life Cycle
Strategic Client Group
Mid Corporate
Government Coverage
Multi-national
Large Corporate
Financial Institution
Group
Structured Assets
Commercial Banking
We have re-oriented the organisation structure in Corporate & Commercial Banking for delivering execution excellence
• Segregated the responsibilities of coverage and product groups to ensure sharper focus
• Corporate & Commercial Bank coverage reorganized into 8 coverage groups, each with a stated objective
• Strengthened the leadership team across Mid Corporate, MNC, Government Coverage, Transaction Banking and Forex Sales
We continue to have penetration of 9 or more products and services across our top corporate relationships including at least two services offered by our subsidiaries

Annual Results FY 20-21
37% 38% 38%
63% 62% 62%
Mar-19 Mar-20 Mar-21
Corporate loan book mix (tenure based)
Short term loan Long term loan
* Provisions on proforma NPA in Q3FY21, netted from advances for comparability
Short term refers to loans of less than 1 yr tenure; Long term refers to loans of greater than 1 yr tenure
95% 95% 94%
FY19 FY20 FY21
Incremental sanctions to corporates rated A- & above
82% 83% 85%
18% 17% 15%
Mar-19 Mar-20 Mar-21A- or better BBB and below
…with better rated originations and focussed on short term loans
85% of the book is rated A- or better
33
66% of sanctions
were to those rated
AA- & above
1,55,4211,75,087 1,87,148
27,980
29,01532,2081,83,402
2,04,103 2,19,356
Mar-19 Mar-20 Mar-21
Corporate Loans
Overseas Domestic
All figures in ₹ Crores
7%
11%
7%
YOY QOQ*
9%
5%
10%
Annual Results FY 20-21
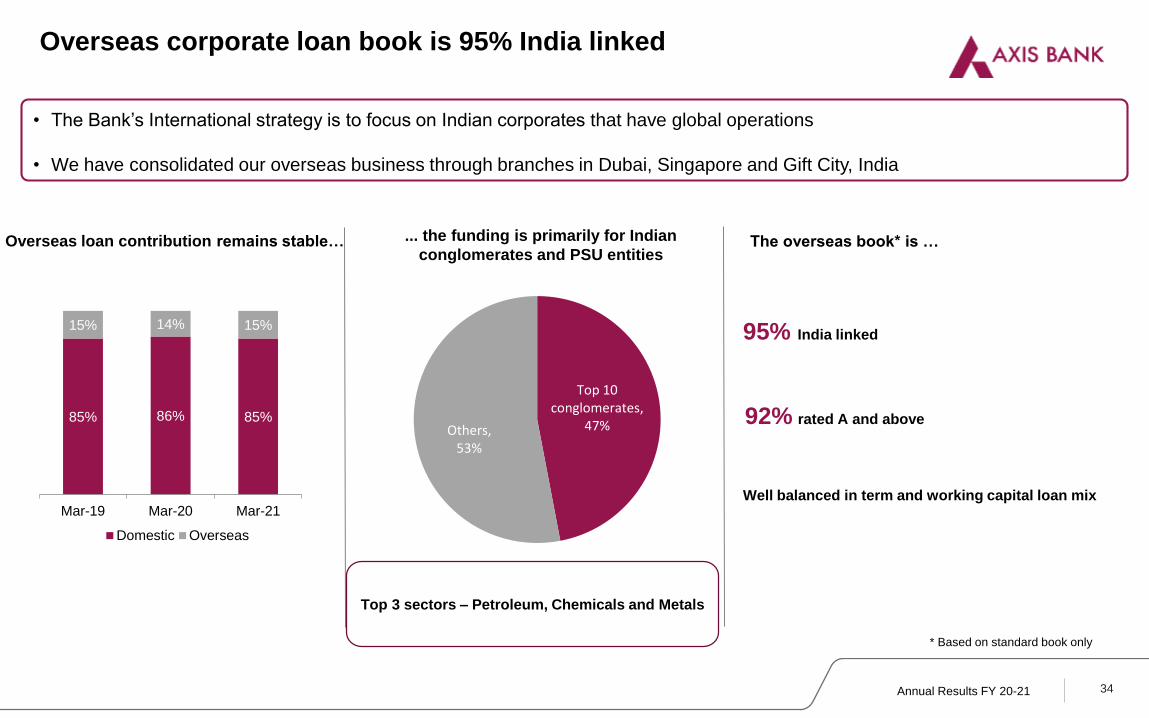
• The Bank’s International strategy is to focus on Indian corporates that have global operations
• We have consolidated our overseas business through branches in Dubai, Singapore and Gift City, India
Overseas corporate loan book is 95% India linked
34
95% India linked
92% rated A and above
Top 10 conglomerates,
47%Others, 53%
85% 86% 85%
15% 14% 15%
Mar-19 Mar-20 Mar-21
Domestic Overseas
Overseas loan contribution remains stable…
Well balanced in term and working capital loan mix
... the funding is primarily for Indian
conglomerates and PSU entities
Top 3 sectors – Petroleum, Chemicals and Metals
The overseas book* is …
* Based on standard book only

Annual Results FY 20-21
...and strengthened proposition as a Transaction Bank
Bharat Bill Payment SystemRanked 1st in Addition of number of Billers to
BBPS Ecosystem.
Forex Turnover Market ShareMarket Share moved from
2.7% (Mar’20) to 3.4% (Feb’21)
Digital Adoption67% Current Account customers
registered for internet banking
Foreign LC Market ShareMarket share moved from
6.0% (Q4FY20) to 11.3% (Q4FY21)
Rights IssueRanked 1st in “Rights Issue” business by
capturing 55% of market deals
Finnoviti Awards 2021“Prayagraj Smart City App” awarded the “Best
Innovative App” in BFSI
Source:
GST Payment – Ministry of Finance
Foreign LC – SWIFT Watch
Forex Turnover – RBI Report (Not updated post Feb’21)
BBPS – NPCI Report Mar’21
Rights Issue - SEBI Report Mar’2135
Current Account18% YoY growth in Current Account quarterly
average Balances (Q4FY21)
GST Payment Market ShareMarket Share moved from
8.8% (Q4FY20) to 9.2% (Q4FY21)
Annual Results FY 20-21
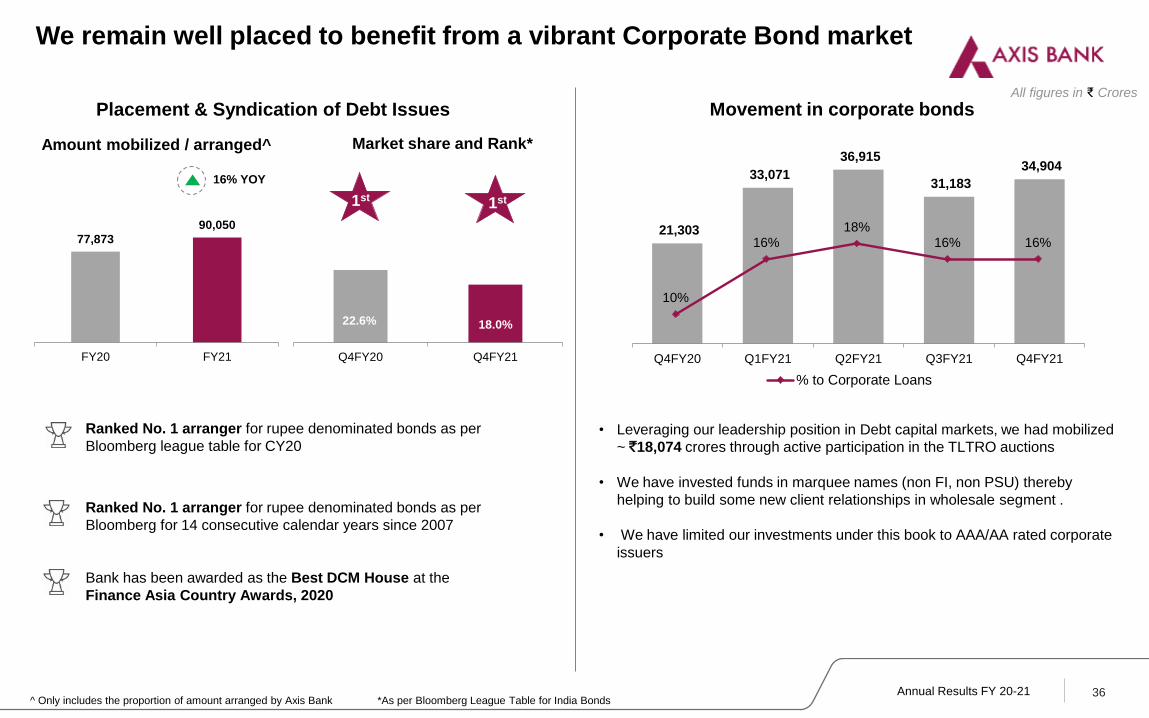
21,303
33,071
36,915
31,183
34,904
Q4FY20 Q1FY21 Q2FY21 Q3FY21 Q4FY21
10%
16%18%
16% 16%
% to Corporate Loans
22.6% 18.0%
Q4FY20 Q4FY21
We remain well placed to benefit from a vibrant Corporate Bond market
Placement & Syndication of Debt Issues
77,873
90,050
FY20 FY21
Market share and Rank*
^ Only includes the proportion of amount arranged by Axis Bank *As per Bloomberg League Table for India Bonds
1st
16% YOY
1st
36
All figures in ₹ Crores
Ranked No. 1 arranger for rupee denominated bonds as per
Bloomberg league table for CY20
Ranked No. 1 arranger for rupee denominated bonds as per
Bloomberg for 14 consecutive calendar years since 2007
Bank has been awarded as the Best DCM House at the
Finance Asia Country Awards, 2020
Movement in corporate bonds
• Leveraging our leadership position in Debt capital markets, we had mobilized
~ `18,074 crores through active participation in the TLTRO auctions
• We have invested funds in marquee names (non FI, non PSU) thereby
helping to build some new client relationships in wholesale segment .
• We have limited our investments under this book to AAA/AA rated corporate
issuers
Amount mobilized / arranged^

Annual Results FY 20-21
1 Figures stated represent only standard outstanding (advances, investments and non fund based) across all segments 2 Includes Banks (25%), Non Banking Financial Companies (36%), Housing Finance Companies (20%), MFIs (5%) and others (14%)3 Financing of projects (roads, ports, airports, etc.)4 Lease Rental Discounting (LRD) outstanding stood at `10,187 crores
Industry-wise Distribution (Top 10)
All figures in ` Crores
37
Rank
Outstanding1 as on 31st Mar’21
Sectors
Advances InvestmentsNon-fund
based
Total
Value (in % terms)
1. Financial Companies2 54,677 20,490 18,116 93,283 11.92%
2. Engineering & Electronics 12,166 1,980 27,775 41,920 5.36%
3. Petroleum & Petroleum Products 14,757 4,265 18,156 37,178 4.75%
4. Infrastructure Construction3 18,104 2,187 10,286 30,577 3.91%
5. Power Generation & Distribution 22,076 2,098 3,200 27,374 3.50%
6. Trade 18,208 - 2,596 20,804 2.66%
7. Telecommunication Services 12,530 1,104 6,078 19,711 2.52%
8. Iron & Steel 12,520 1,001 4,869 18,390 2.35%
9. Real Estate4 16,739 163 750 17,652 2.26%
10. Food Processing 13,695 359 2,751 16,805 2.15%
Commercial Banking
Business Performance

Annual Results FY 20-21
Higher customer engagement led to broad base growth from ETB relationships
39
Private
Commercial Banking business benefitting from technology led transformation
• Created integrated Commercial Banking Group (CBG) in FY20 to have greater focus on needs of the SME customers, one of the most profitable
segments of the Bank with high PSL coverage
• Integrated strategy focuses on Tech-driven transformation (project Sankalp) delivering - data driven credit decisions, minimal documentation,
simplified products, digitized operations and unlocking value using data for effective customer interactions
100
127
Q4FY20 Q4FY21
CBG Current Account
Balances (QAB)
100
136
Q4FY20 Q4FY21
Number of new CA
accounts opened
Indexed to 100
Indexed to 100
• Customer 360 view coupled with customer tiers and
effective meeting rhythm based on analytics to fulfil
needs vs. selling products
• Enhanced synergy with Branch Banking equipped with
automated dashboards for better lead management
60%+
30 mins
3x
Reduction in docs required
for pre-screening vs 1 day
Increase in number of client
interactions by RMs
Project Sankalp - Delivering Customer First & One Axis
82% 85% 86%
18% 15% 14%
Mar-19 Mar-20 Mar-21
SME-3 or better Others
61,92163,766
69,850
Q4FY20 Q3FY21 Q4FY21
CBG Advances
86% of book is rated SME3 or better
13% YOY
10% QOQ*
* Provisions on proforma NPA in Q3FY21, netted from advances for
comparability

Annual Results FY 20-21
SME lending book is well diversified, 89% of SME book is secured and predominantly
working capital financing
Well diversified Geographical mix Well diversified Sectoral mixBook by Loan size
40
79% 78% 71%
21% 22% 29%
Mar-19 Mar-20 Mar-21
Short term loan Long term loan
81% 85% 89%
19% 15% 11%
Mar-19 Mar-20 Mar-21
SME book mix (by type)
Secured Unsecured
SME book mix (by tenure)
94%84% 84%
FY19 FY20 FY21
Incremental sanctions to SME rated SME3 & above
32%
20%26%
22%
Less than 5 Cr 5 cr 10 cr10 cr to 25 cr More than 25 cr
16%
16%
16%15%
10%
10%
17%
West 1 West 2 South 1 South 2North 1 North 2 East
15%
10%
9%
8%
8%7%
7%
5%
4%
4%
4%3%2%1%
12%
Trade Retail & Wholesale Trade OthersServices & Others Food & BeveragesEngineering TextilesBasic Materials Others CREIndustrials Other Metal & Metal ProductsChemicals & Fertilisers Drugs & PharmaceuticalsIron & Steel Mfg Infra Cons OthersOthers
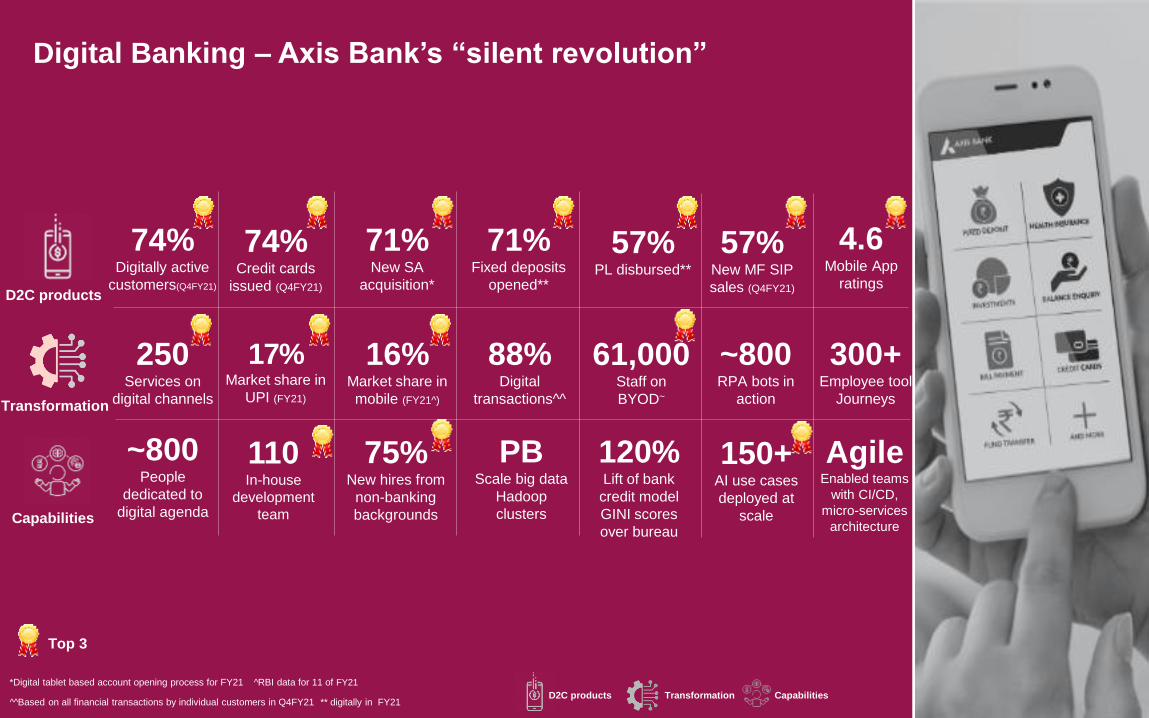
Transformation
Capabilities
D2C products
71%Fixed deposits
opened**
74%Digitally active
customers(Q4FY21)
71%New SA
acquisition*
57%PL disbursed**
74%Credit cards
issued (Q4FY21)
57%New MF SIP
sales (Q4FY21)
250Services on
digital channels
88%Digital
transactions^^
16% Market share in
mobile (FY21^)
61,000Staff on
BYOD~
~800RPA bots in
action
17% Market share in
UPI (FY21)
110In-house
development
team
~800People
dedicated to
digital agenda
75%New hires from
non-banking
backgrounds
PBScale big data
Hadoop
clusters
120%Lift of bank
credit model
GINI scores
over bureau
150+AI use cases
deployed at
scale
4.6Mobile App
ratings
AgileEnabled teams
with CI/CD,
micro-services
architecture
300+Employee tool
Journeys
Transformation CapabilitiesD2C products^^Based on all financial transactions by individual customers in Q4FY21
*Digital tablet based account opening process for FY21 ^RBI data for 11 of FY21
** digitally in FY21
Digital Banking – Axis Bank’s “silent revolution”
Top 3
Annual Results FY 20-21
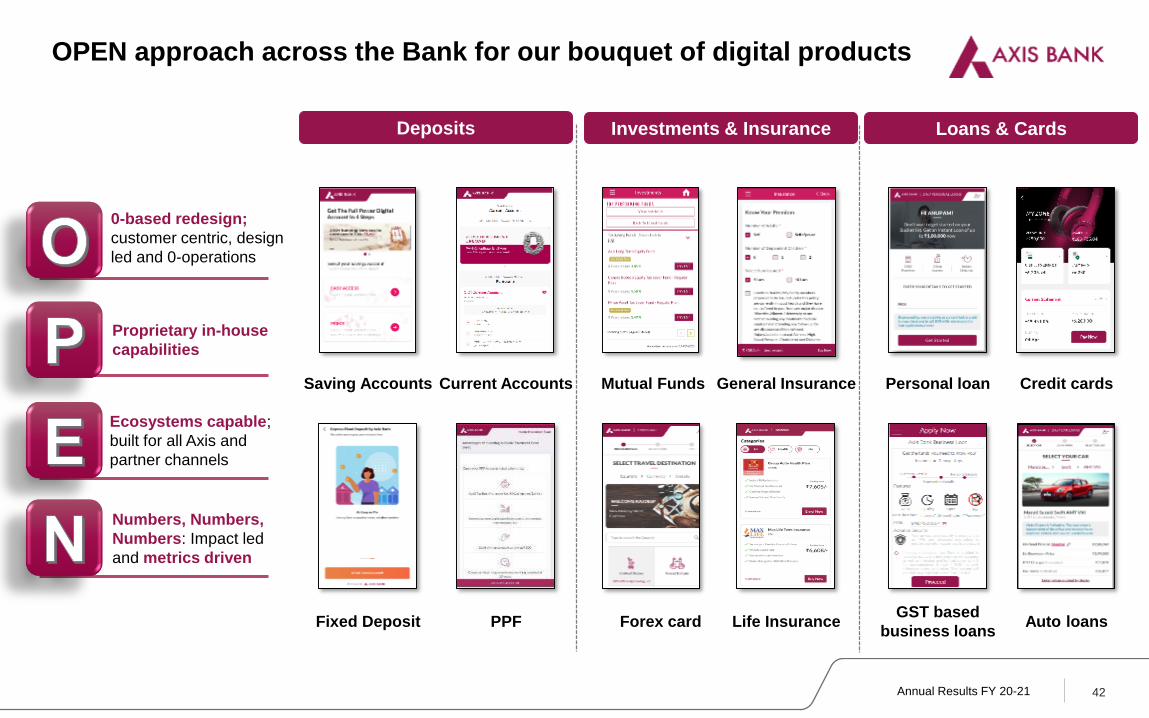
OPEN approach across the Bank for our bouquet of digital products
42
Saving Accounts Current Accounts
Fixed Deposit PPF
Mutual Funds General Insurance
Forex card Life Insurance
Personal loan Credit cards
GST based
business loansAuto loans
Deposits Investments & Insurance Loans & Cards
0-based redesign;
customer centric, design
led and 0-operations
Proprietary in-house
capabilities
Ecosystems capable;
built for all Axis and
partner channels
Numbers, Numbers,
Numbers: Impact led
and metrics driven

43Annual Results FY 20-21
Building a Strong Digital Suite for Retail Forex Business
1 Launched Outward Remittance on Mobile App
• A simple 2 step intuitive customer journey
• 24/7 enablement for anytime anywhere payment processing
• An omni-channel experience with syncing of beneficiaries and transaction history seamlessly
between Internet Banking & Mobile Banking
• Preferential pricing for customers on Digital
Servicing the Forex needs of our retail customers, through ‘frictionless-digitized’ transactions
2 Launched Forex Card Digital Issuance Platform
• Omni-channel platform available across Web, Mobile & Branch
• Simple 3 step process to avail Forex Card
• Pre-filled information and minimized data ask, making it a quick and easy process
• Preferential pricing for customers on Digital
Annual Results FY 20-21
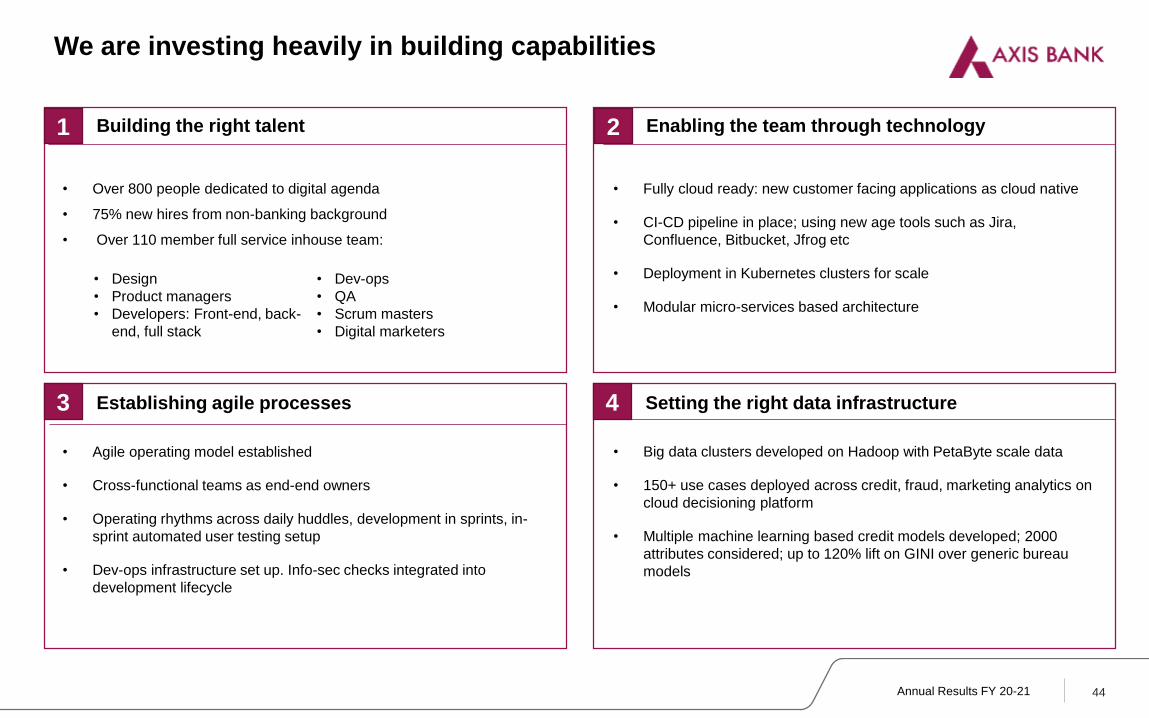
We are investing heavily in building capabilities
44
Building the right talent
• Over 800 people dedicated to digital agenda
• 75% new hires from non-banking background
• Over 110 member full service inhouse team:
• Fully cloud ready: new customer facing applications as cloud native
• CI-CD pipeline in place; using new age tools such as Jira,
Confluence, Bitbucket, Jfrog etc
• Deployment in Kubernetes clusters for scale
• Modular micro-services based architecture
Enabling the team through technology1 2
3 Establishing agile processes
• Agile operating model established
• Cross-functional teams as end-end owners
• Operating rhythms across daily huddles, development in sprints, in-
sprint automated user testing setup
• Dev-ops infrastructure set up. Info-sec checks integrated into
development lifecycle
4 Setting the right data infrastructure
• Design
• Product managers
• Developers: Front-end, back-
end, full stack
• Dev-ops
• QA
• Scrum masters
• Digital marketers
• Big data clusters developed on Hadoop with PetaByte scale data
• 150+ use cases deployed across credit, fraud, marketing analytics on
cloud decisioning platform
• Multiple machine learning based credit models developed; 2000
attributes considered; up to 120% lift on GINI over generic bureau
models

Annual Results FY 20-21
433654
9671,171 1,166
Q4FY20 Q1FY21 Q2FY21 Q3FY21 Q4FY21
1,70,370 1,43,583
2,33,888
3,05,808
4,76,612
10%
16%
17% 17%
15%
Q4FY20 Q1FY21 Q2FY21 Q3FY21 Q4FY21*
We continue to have strong market share in Mobile Banking
Axis Bank Mobile Banking Spends (in Cr) and Volumes (in Mn)Mobile Transactions Market Share by Volumes
Source: RBI data (for the period), * Q4FY21 period includes Jan-21 and Feb-21 data only45
Mobile banking spends (in ` Cr)
169% YOY
180% YOY
51% of Mobile Banking customers bank only on Mobile App with
Mobile Banking logins at 15x of Internet banking loginsAxis Aha! answered 4.3 million messages in Q4FY21
Axis Mobile is amongst the highest ranked Banking app on Apple Store & Google Play Store with rating of 4.6 and offers 250+ DIY services

Annual Results FY 20-21 46
Powering all major UPI TPAPs – Google Pay, PhonePe, Amazon, Whatsapp
Processing nearly 400 million monthly transactions as Payer PSP
Acquiring more than 5 million daily transactions for our merchants
More than 8.5 lakh merchants transacting per day on our stack
Among the lowest Technical Declines among peer banks
Easy to plug SDK, Intent, Collect & Pay API’s offered to partners
Pioneer in launching new initiatives like AutoPay & ODR
Robust bandwidth & connectivity with NPCI
Dedicated 24 x 7 tech support team
Money Transfers to Friends & Family
Shopping & Merchant Payments Online
Instant Cashbacks & Refunds Online
IPO Investments/PAN Validation (via UPI)
Recurring/AutoPay Payments
QR Based Payments
A world of features offered on Axis UPI
Axis Bank – Pioneer in the UPI Ecosystem
Annual Results FY 20-21
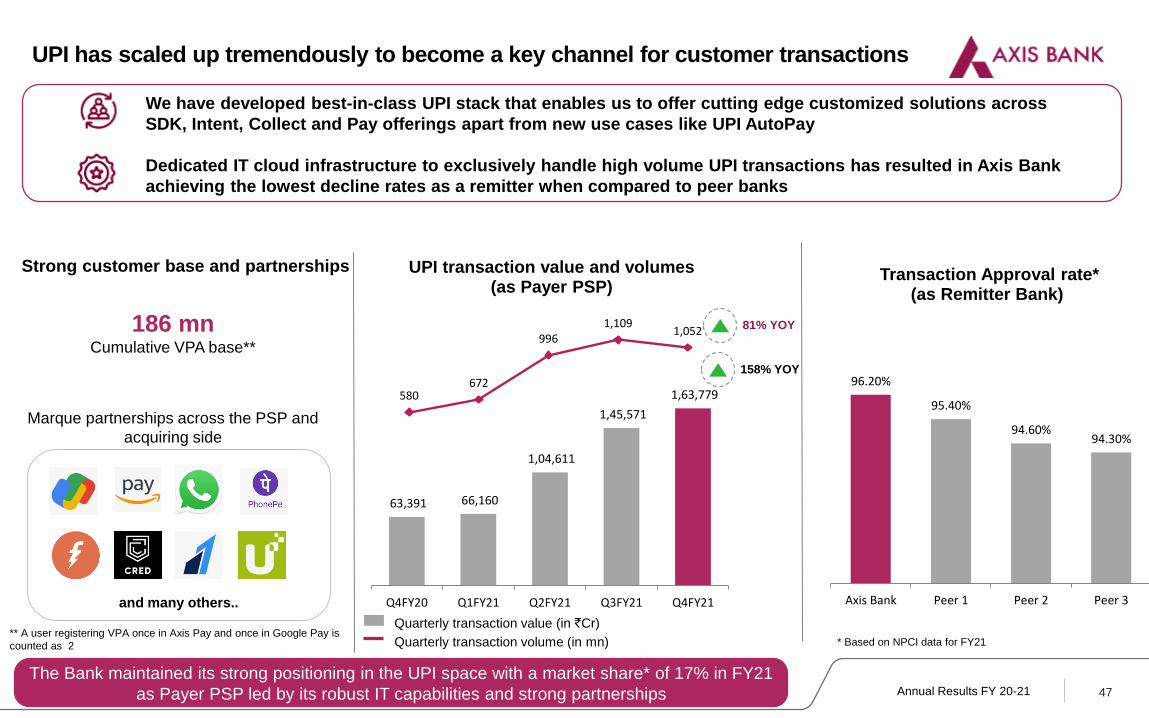
63,391 66,160
1,04,611
1,45,571
1,63,779
Q4FY20 Q1FY21 Q2FY21 Q3FY21 Q4FY21
UPI transaction value and volumes (as Payer PSP)
580672
9961,109
1,052
96.20%
95.40%
94.60%94.30%
Axis Bank Peer 1 Peer 2 Peer 3
Transaction Approval rate* (as Remitter Bank)
Quarterly transaction value (in `Cr)
Quarterly transaction volume (in mn) * Based on NPCI data for FY21
47
UPI has scaled up tremendously to become a key channel for customer transactions
158% YOY
81% YOY
We have developed best-in-class UPI stack that enables us to offer cutting edge customized solutions across
SDK, Intent, Collect and Pay offerings apart from new use cases like UPI AutoPay
Dedicated IT cloud infrastructure to exclusively handle high volume UPI transactions has resulted in Axis Bank
achieving the lowest decline rates as a remitter when compared to peer banks
186 mnCumulative VPA base**
Strong customer base and partnerships
The Bank maintained its strong positioning in the UPI space with a market share* of 17% in FY21
as Payer PSP led by its robust IT capabilities and strong partnerships
Marque partnerships across the PSP and
acquiring side
and many others..
** A user registering VPA once in Axis Pay and once in Google Pay is
counted as 2

Annual Results FY 20-21
Financial Highlights
Business Segment performance
Asset Quality
Capital and Liquidity Position
Future of Work and Sustainability
Subsidiaries’ Performance
48
Other important information
Executive Summary
Annual Results FY 20-21
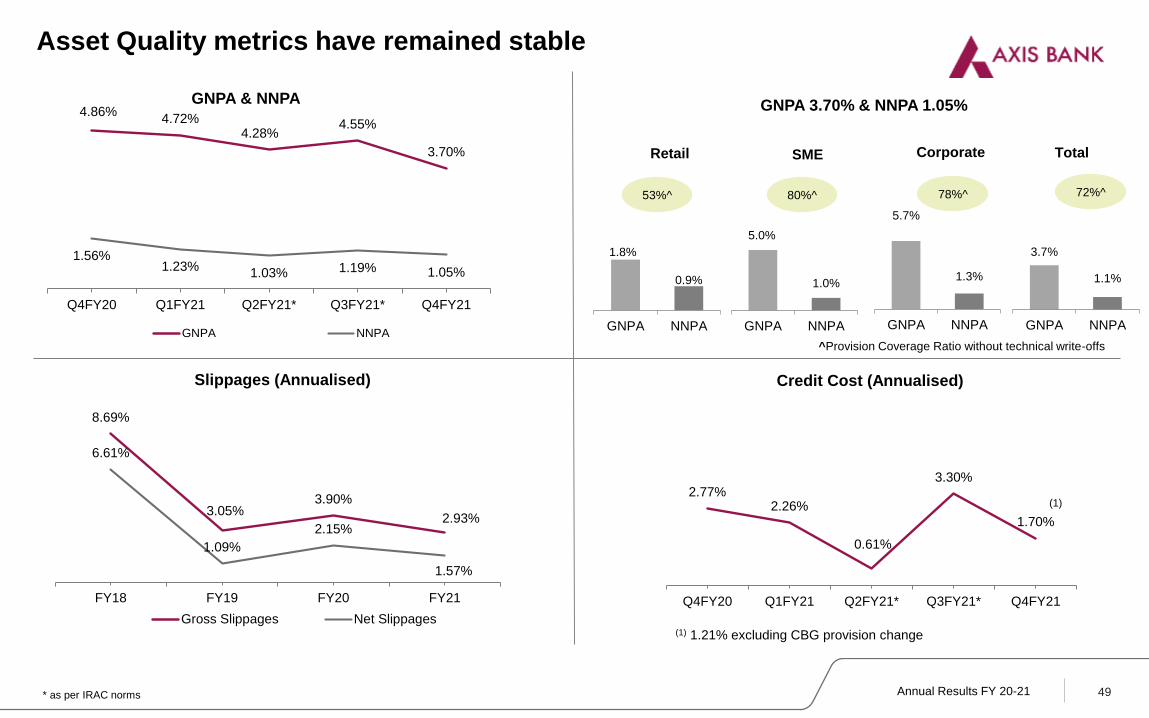
Asset Quality metrics have remained stable
49
2.77%2.26%
0.61%
3.30%
1.70%
Q4FY20 Q1FY21 Q2FY21* Q3FY21* Q4FY21
1.8%
0.9%
GNPA NNPA
Retail
5.0%
1.0%
GNPA NNPA
SME
5.7%
1.3%
GNPA NNPA
Corporate
53%^ 80%^ 78%^
^Provision Coverage Ratio without technical write-offs
GNPA 3.70% & NNPA 1.05%
Credit Cost (Annualised)Slippages (Annualised)
3.7%
1.1%
GNPA NNPA
Total
72%^
4.86%4.72%
4.28%4.55%
3.70%
1.56%1.23%
1.03% 1.19% 1.05%
Q4FY20 Q1FY21 Q2FY21* Q3FY21* Q4FY21
GNPA NNPA
8.69%
3.05%3.90%
2.93%
6.61%
1.09%
2.15%
1.57%
FY18 FY19 FY20 FY21
Gross Slippages Net Slippages
GNPA & NNPA
* as per IRAC norms
(1)
(1) 1.21% excluding CBG provision change

Annual Results FY 20-21
69%75% 77% 75% 72%
PCR without technical write-offs
1.56%1.23% 1.03% 1.19% 1.05%
1.05%
1.02% 1.42%1.37%
1.09%
2.61%
2.25%2.45% 2.56%
2.14%
0.0 0%
0.5 0%
1.0 0%
1.5 0%
2.0 0%
2.5 0%
3.0 0%
Q4FY20 Q1FY21 Q2FY21 Q3FY21^ Q4FY21
Net NPA BB & Below (Fund based)
BB & Below Corporate Book, Restructuring and NPAs
Bank’s Net NPA* and Fund based BB and Below* portfolio
50
All figures in ₹ Crores
*As % of customer assets, as applicable
PCR (excluding technical write offs) has improved from 69% to 72% YoY;
net NPA improved 51 bps YoY
BB & Below Outstanding Q3FY21 Q4FY21
Fund based 8,722 7,443
Non fund based 4,796 4,574
Investments 620 666
Key comments on BB and Below book
▪ Not upgraded Rs. 419 crs (fund based) of accounts downgraded in Q2 based
on probable restructuring, but not restructured
▪ 100% of restructured corporate book classified as BB & below
▪ Net NPA + BB & below (fund based), net of provisions held is 2.07% of net
customer assets
▪ Top 4 sectors comprising Power Generation & Distribution, Infra Construction,
Hotels & Trade account for 70% of fund based BB and Below book
Judicious approach to restructuring under Covid-19 framework
• 74% of 0.3% invoked restructured book as a % of GCA overlaps with BB and
below, Linked but not restructured non fund based facilities Rs 923 crs
• Restructuring as a % to respective loan books - Corporate 0.6%, Retail 0.1%,
SME 0.02%
• Provision coverage on overall restructured book 26%, 100% provision made
on unsecured retail restructured book, though classified as standard
The outstanding amount in ‘BB and Below’ portfolio incorporates cumulative impact of rating
Upgrades / Downgrades and Slippages from the pool
Restructured Book Estimated
in
Q2FY21
Invoked at
end of
Q4FY21$
Implemented
at end of
Q4FY21$
% of GCA 1.7% 0.3% 0.1%
Rs Cr 11,000 1,848 623Decline in BB & below pool across all three categories
i.e. fund based, non fund based and investments
^ as per IRAC norms $ accounts that are standard as at 31.3.2021
Annual Results FY 20-21
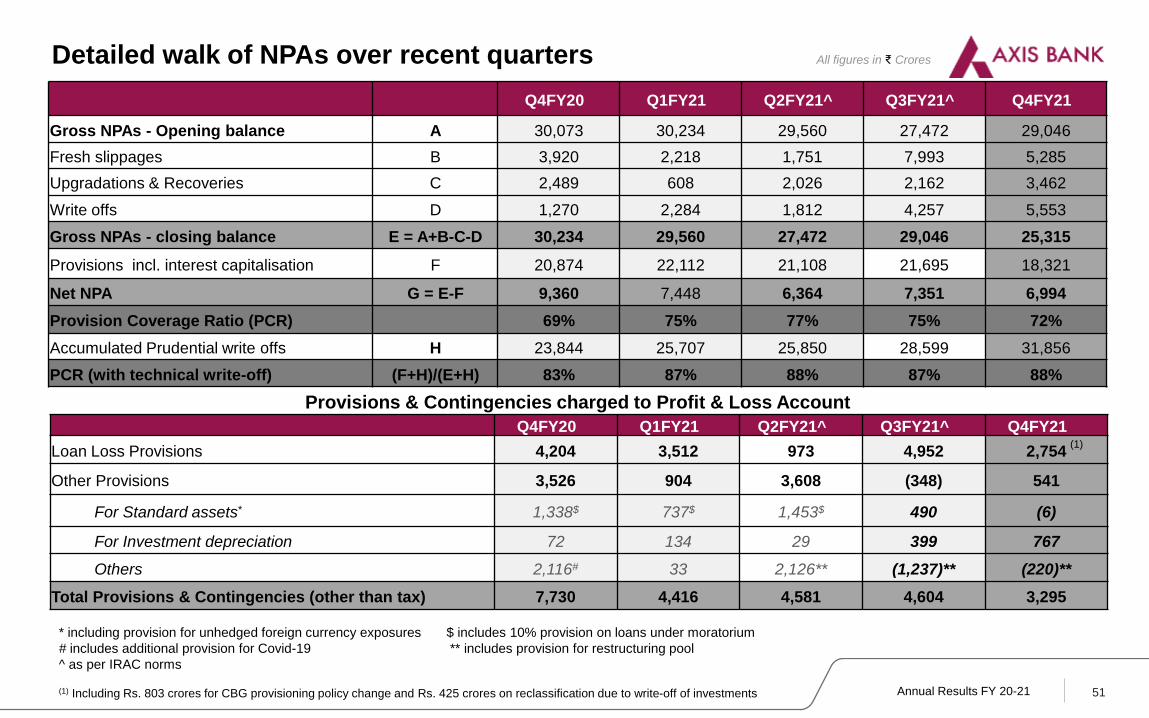
Q4FY20 Q1FY21 Q2FY21^ Q3FY21^ Q4FY21
Gross NPAs - Opening balance A 30,073 30,234 29,560 27,472 29,046
Fresh slippages B 3,920 2,218 1,751 7,993 5,285
Upgradations & Recoveries C 2,489 608 2,026 2,162 3,462
Write offs D 1,270 2,284 1,812 4,257 5,553
Gross NPAs - closing balance E = A+B-C-D 30,234 29,560 27,472 29,046 25,315
Provisions incl. interest capitalisation F 20,874 22,112 21,108 21,695 18,321
Net NPA G = E-F 9,360 7,448 6,364 7,351 6,994
Provision Coverage Ratio (PCR) 69% 75% 77% 75% 72%
Accumulated Prudential write offs H 23,844 25,707 25,850 28,599 31,856
PCR (with technical write-off) (F+H)/(E+H) 83% 87% 88% 87% 88%
Detailed walk of NPAs over recent quarters
Q4FY20 Q1FY21 Q2FY21^ Q3FY21^ Q4FY21
Loan Loss Provisions 4,204 3,512 973 4,952 2,754
Other Provisions 3,526 904 3,608 (348) 541
For Standard assets* 1,338$ 737$ 1,453$ 490 (6)
For Investment depreciation 72 134 29 399 767
Others 2,116# 33 2,126** (1,237)** (220)**
Total Provisions & Contingencies (other than tax) 7,730 4,416 4,581 4,604 3,295
Provisions & Contingencies charged to Profit & Loss Account
* including provision for unhedged foreign currency exposures $ includes 10% provision on loans under moratorium
# includes additional provision for Covid-19 ** includes provision for restructuring pool
^ as per IRAC norms
51
All figures in ₹ Crores
(1)
(1) Including Rs. 803 crores for CBG provisioning policy change and Rs. 425 crores on reclassification due to write-off of investments
Annual Results FY 20-21
Financial Highlights
Business Segment performance
Asset Quality
Capital and Liquidity Position
Future of Work and Sustainability
Subsidiaries’ Performance
52
Other important information
Executive Summary

Annual Results FY 20-21 53
The Future of Work initiative has evolved into multiple flexible work formats
Flexibility and Agility
• Allowed for a rapid scale up / scale down of in-office presence in Q4 in response to changing environment
• Coverage of ~15,000 employees across the Bank
Hybrid Model
Established for all roles that are not
customer-facing / regulatory
mandated to work from premises
Access to new Talent Pools
• 83 candidates hired in the pilot against a target of 50
• 40% Women, 73% Outside Mumbai, 44% Non-Metro
• Quicker on-boarding, Day 1 productive talent contributing to significant projects across the Bank
GIG-A-Opportunities
Hiring program in alternate formats:
skilled freelancers and virtual full time
employment
Transforming Operating Models
• ~1200 employees across 18 central departments moved to a 100% virtual format in the first phase
• Talent value segmentation used to identify roles where virtual working would continue to be productive
• Employees now have ability to move across formats through internal career mobility
GIG-A-Anywhere
Program for existing employees to
move to a 100% virtual formats
Annual Results FY 20-21
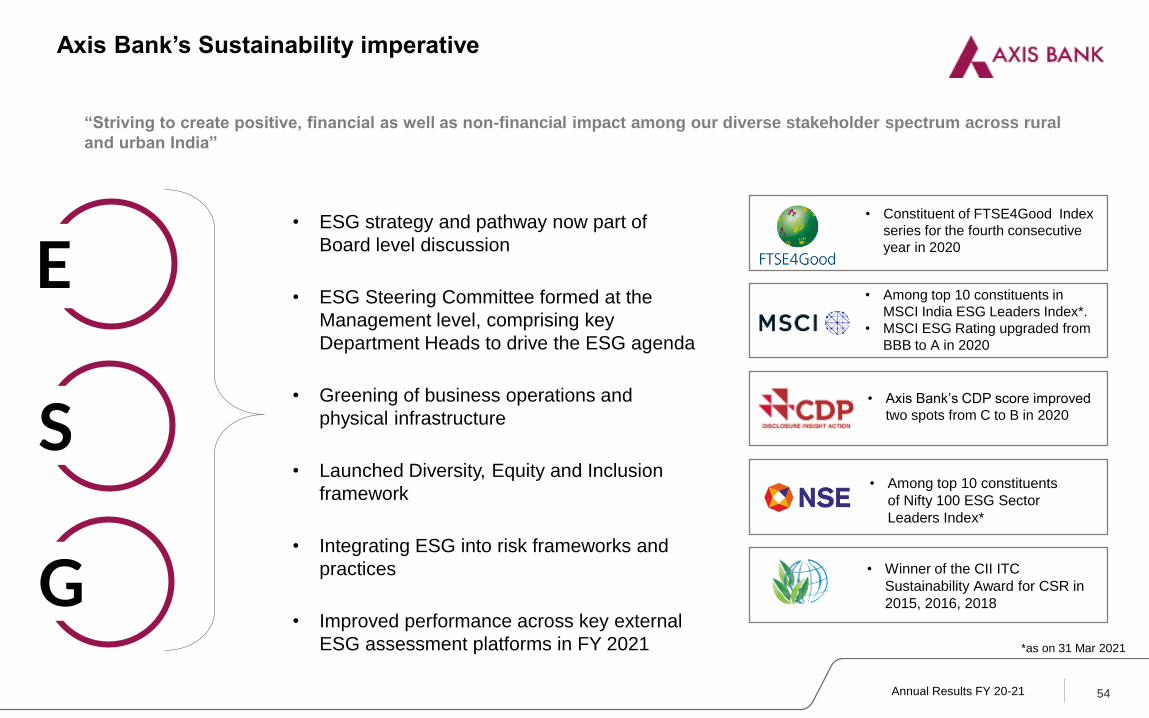
Axis Bank’s Sustainability imperative
“Striving to create positive, financial as well as non-financial impact among our diverse stakeholder spectrum across rural
and urban India”
• Constituent of FTSE4Good Index
series for the fourth consecutive
year in 2020
• Winner of the CII ITC
Sustainability Award for CSR in
2015, 2016, 2018
• Among top 10 constituents in
MSCI India ESG Leaders Index*.
• MSCI ESG Rating upgraded from
BBB to A in 2020
54
• Among top 10 constituents
of Nifty 100 ESG Sector
Leaders Index*
• Axis Bank’s CDP score improved
two spots from C to B in 2020
E
S
G
• ESG strategy and pathway now part of
Board level discussion
• ESG Steering Committee formed at the
Management level, comprising key
Department Heads to drive the ESG agenda
• Greening of business operations and
physical infrastructure
• Launched Diversity, Equity and Inclusion
framework
• Integrating ESG into risk frameworks and
practices
• Improved performance across key external
ESG assessment platforms in FY 2021 *as on 31 Mar 2021

Annual Results FY 20-21
Positive outcomes across stakeholders and sectors
• 1.5 mn women borrowers 24 states & UTs under Axis
Microfinance as on Mar’21
• Over 0.8 mn accounts under India’s MUDRA Scheme as on
Mar’21
• 0.3 mn dairy farmers associated with Bank’s integrated digital
dairy platform as of Mar’21
• 88% of all financial transactions in FY21 were digital
• 186 million VPAs registered with the Bank on UPI as of Mar’21
• 57% of personal loans sourced digitally in FY21
Banking for Emerging India
Digital Leadership
• 1st certified Green Bond by an Asian Bank, launched in 2016 for
US$ 500 mn
• Close to 5 mn sheets of paper saved under Project Saksham for
Branch Banking in FY21
• Integrating environmental and social risk assessment into lending
decisions through Sustainable Lending Policy & Procedures (SLPP)
Green Banking
55
• 0.92 mn households supported till Mar-’21 under Axis Bank
Foundation’s (ABF), Mission to reach 2 million by 2025
• Active COVID-19 CSR support to frontline responders and
communities pan-India
• 0.7 mn rural women participants in financial literacy and health
awareness programs in 14 states, as on Mar’21
CSR Impact
• 78,000+ full time employees as of Mar’21, with nearly one fourth
of them being women
• 31.4 years - Average age of the workforce
Human Capital
• 7.05 MW of solar installations across 248 locations, over 1 MW in
green power purchase agreements, as of Mar’21
• ~1,500 branches with Centralized Energy Management System,
delivering annualized electricity savings of over 6.5 million units .
• ~1,100 branches covered under EESL LED program with nearly
~55,000 light fittings
Operational Excellence

Annual Results FY 20-21
Financial Highlights
Business Segment performance
Asset Quality
Capital and Liquidity Position
Future of Work and Sustainability
Subsidiaries’ Performance
56
Other important information
Executive Summary

Annual Results FY 20-21 57
Axis Capital : Go to Banker for India Inc
309 319
402
214241
381
128 113139
64100
166
FY16 FY17 FY18 FY19 FY20 FY21
Revenue from Operations PAT
Trend in Income & PAT
Major Highlights
All figures in ₹ Crores
Rank Banker No of Deals*
1 Axis Capital 41
2 Peer 2 39
3 Peer 2 28
4 Peer 3 24
5 Peer 4 21
FY21 Ranking* (includes IPO, FPO, QIP, REIT, OFS & Rights)
• Axis Capital completed 60 IB transactions in FY21 that include 14 IPOs, 15 QIPs, 8 Rights
issue, 5 OFS, 6 Buybacks, among others
• Re-emphasized its ECM leadership as it participated as lead banker in 18 of 24 largest ECM
deals in India that collectively over US$ 20 Bn
• Established its leadership in REITs as it led 4th consecutive REITs transaction in India
• Axis Capital’s Institutional Equity business trading volumes in cash segment grew 20% and
that for F&O grew 5x in Q4FY21
• FY21 PAT grew 66% YOY, RoE improved from 16.4% to 36.3% in last 2 years
*Source: Primedatabase; Updated till 31St Marchr, 2021;
Includes all Equity IPOs, REIT, FPO, QIPs, OFS, Rights Transactions;
58% YoY
66% YoY
Annual Results FY 20-21
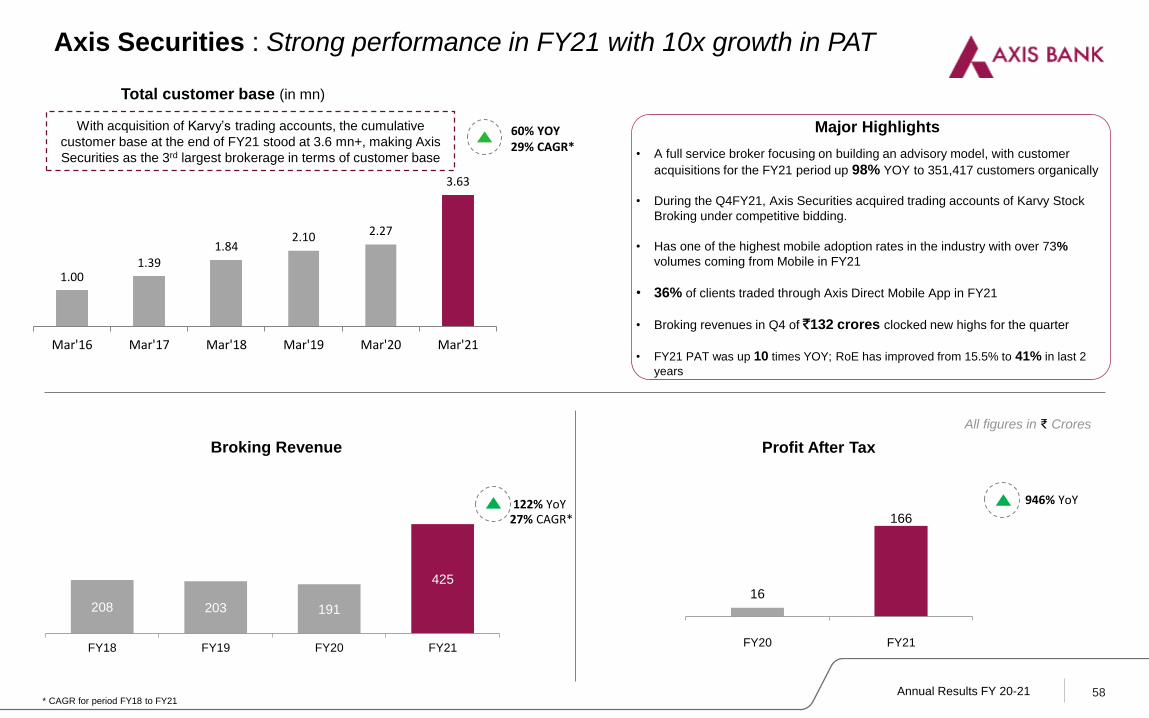
208 203 191
425
FY18 FY19 FY20 FY21
• A full service broker focusing on building an advisory model, with customer
acquisitions for the FY21 period up 98% YOY to 351,417 customers organically
• During the Q4FY21, Axis Securities acquired trading accounts of Karvy Stock
Broking under competitive bidding.
• Has one of the highest mobile adoption rates in the industry with over 73%
volumes coming from Mobile in FY21
• 36% of clients traded through Axis Direct Mobile App in FY21
• Broking revenues in Q4 of `132 crores clocked new highs for the quarter
• FY21 PAT was up 10 times YOY; RoE has improved from 15.5% to 41% in last 2
years
Axis Securities : Strong performance in FY21 with 10x growth in PAT
16
166
FY20 FY21
Broking Revenue
122% YoY
1.001.39
1.842.10 2.27
3.63
Mar'16 Mar'17 Mar'18 Mar'19 Mar'20 Mar'21
60% YOY
Total customer base (in mn)
Major Highlights
58
All figures in ₹ Crores
Profit After Tax
29% CAGR*
* CAGR for period FY18 to FY21
27% CAGR*
946% YoY
With acquisition of Karvy’s trading accounts, the cumulative
customer base at the end of FY21 stood at 3.6 mn+, making Axis
Securities as the 3rd largest brokerage in terms of customer base
Annual Results FY 20-21
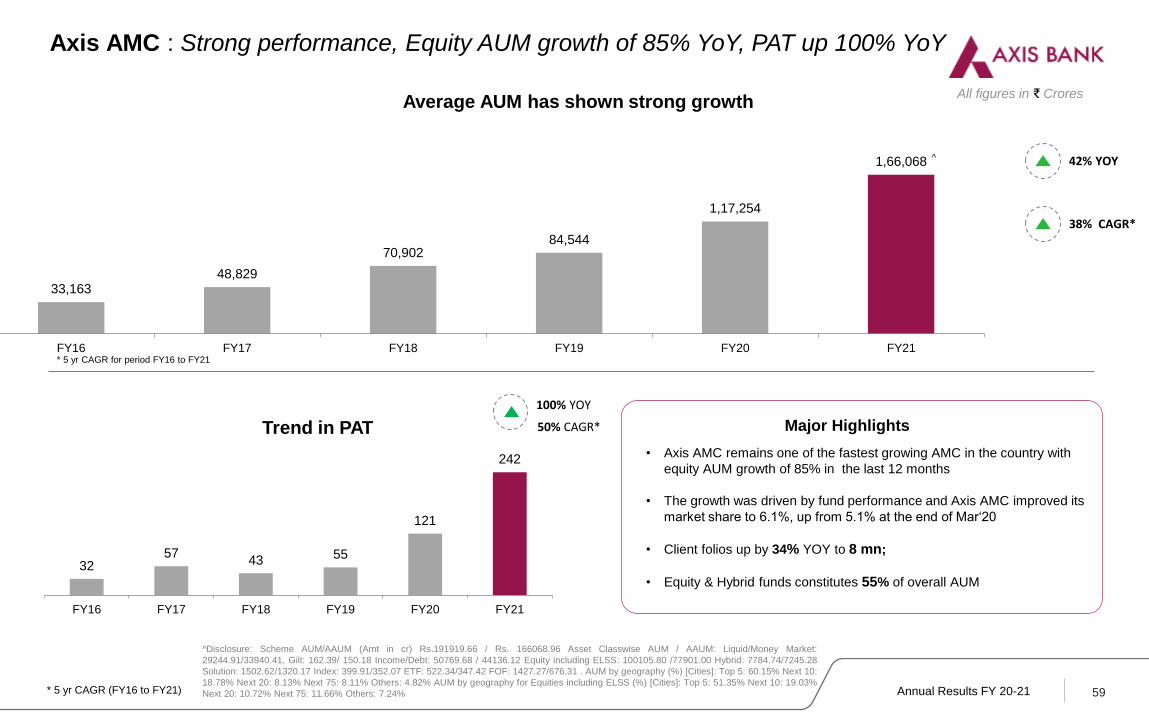
3257
43 55
121
242
FY16 FY17 FY18 FY19 FY20 FY21
33,16348,829
70,90284,544
1,17,254
1,66,068
FY16 FY17 FY18 FY19 FY20 FY21
Average AUM has shown strong growth
42% YOY
Trend in PAT Major Highlights
• Axis AMC remains one of the fastest growing AMC in the country with
equity AUM growth of 85% in the last 12 months
• The growth was driven by fund performance and Axis AMC improved its
market share to 6.1%, up from 5.1% at the end of Mar‘20
• Client folios up by 34% YOY to 8 mn;
• Equity & Hybrid funds constitutes 55% of overall AUM
100% YOY
All figures in ₹ Crores
Axis AMC : Strong performance, Equity AUM growth of 85% YoY, PAT up 100% YoY
50% CAGR*
* 5 yr CAGR for period FY16 to FY21
38% CAGR*
59* 5 yr CAGR (FY16 to FY21)
^Disclosure: Scheme AUM/AAUM (Amt in cr) Rs.191919.66 / Rs. 166068.96 Asset Classwise AUM / AAUM: Liquid/Money Market:
29244.91/33940.41, Gilt: 162.39/ 150.18 Income/Debt: 50769.68 / 44136.12 Equity including ELSS: 100105.80 /77901.00 Hybrid: 7784.74/7245.28
Solution: 1502.62/1320.17 Index: 399.91/352.07 ETF: 522.34/347.42 FOF: 1427.27/676.31 . AUM by geography (%) [Cities]: Top 5: 60.15% Next 10:
18.78% Next 20: 8.13% Next 75: 8.11% Others: 4.82% AUM by geography for Equities including ELSS (%) [Cities]: Top 5: 51.35% Next 10: 19.03%
Next 20: 10.72% Next 75: 11.66% Others: 7.24%
^

Annual Results FY 20-21
3,104
4,292
6,624
8,040 7,704
10,259
Mar'16 Mar'17 Mar'18 Mar'19 Mar'20 Mar'21
575722
911984 1023
258330 358 363 385
165 209 227 193 211
FY17 FY18 FY19 FY20 FY21
Income Pre-provisioning profit PAT
60
Axis Finance : Poised for growth, investing for growing the retail book
** CAGR for period Mar’16 to Mar’21
Growth in loan book
27% CAGR**33% YOY
All figures in `₹ Crores
Major Highlights
• Capital adequacy ratio comfortable at 20.4%
• Net NPA% at 2%. No accounts were restructured
• Our investments in retail business has started to yield results, Retail
disbursements now account for 25%+ of incremental disbursements
• In the Wholesale business, loan mix has undergone a major shift in the last 2 year
with cash flow backed and higher rated companies contributing 85%+ of incremental
disbursements
• Cost to Income at 28% for FY21 – one of the lowest in the industry
• Overall ROE for FY21 stood at 14.6% with wholesale ROE at ~19%
Started investment in retail franchise FY 19 onwards
Trend in total income, pre-provision profit and PAT16% CAGR*
6% CAGR*
11% CAGR*
* 4 yr CAGR (FY17 to FY21)
Annual Results FY 20-21 61
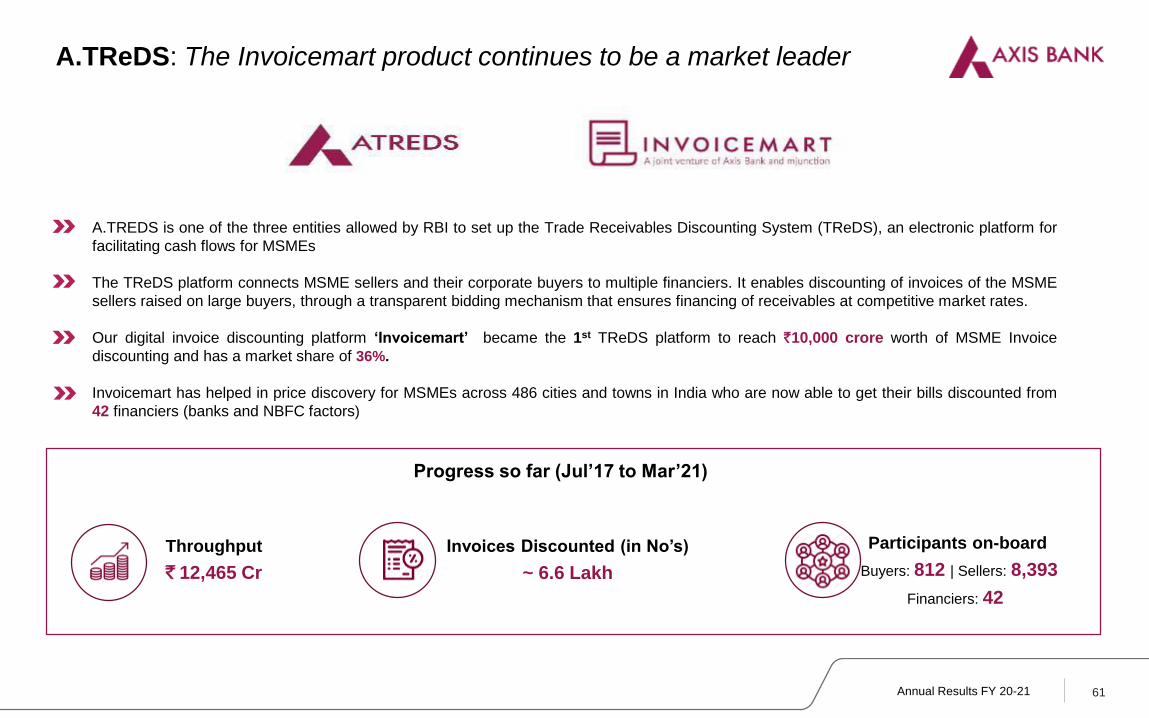
A.TReDS: The Invoicemart product continues to be a market leader
Throughput
` 12,465 Cr
Invoices Discounted (in No’s)
~ 6.6 Lakh
Participants on-board
Buyers: 812 | Sellers: 8,393
Financiers: 42
Progress so far (Jul’17 to Mar’21)
A.TREDS is one of the three entities allowed by RBI to set up the Trade Receivables Discounting System (TReDS), an electronic platform for
facilitating cash flows for MSMEs
The TReDS platform connects MSME sellers and their corporate buyers to multiple financiers. It enables discounting of invoices of the MSME
sellers raised on large buyers, through a transparent bidding mechanism that ensures financing of receivables at competitive market rates.
Our digital invoice discounting platform ‘Invoicemart’ became the 1st TReDS platform to reach `10,000 crore worth of MSME Invoice
discounting and has a market share of 36%.
Invoicemart has helped in price discovery for MSMEs across 486 cities and towns in India who are now able to get their bills discounted from
42 financiers (banks and NBFC factors)
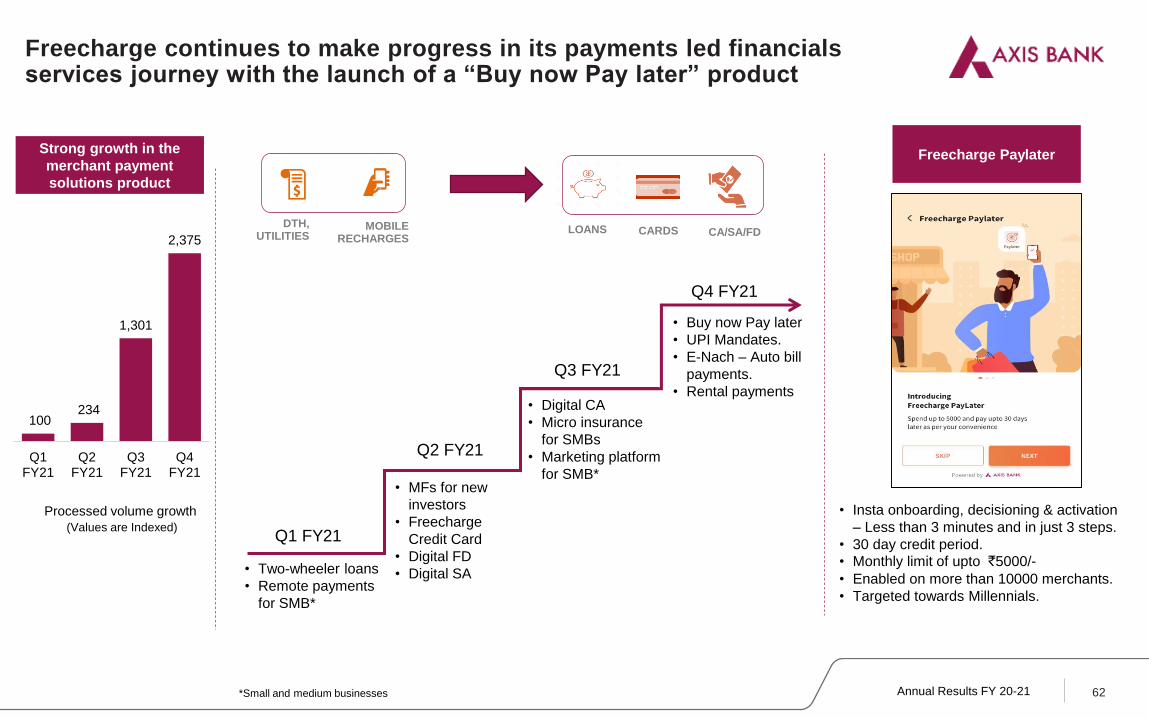
Annual Results FY 20-21 62
Q1 FY21
Q2 FY21
Q3 FY21
Q4 FY21
• MFs for new
investors
• Freecharge
Credit Card
• Digital FD
• Digital SA
• Digital CA
• Micro insurance
for SMBs
• Marketing platform
for SMB*
• Buy now Pay later
• UPI Mandates.
• E-Nach – Auto bill
payments.
• Rental payments
• Two-wheeler loans
• Remote payments
for SMB*
Strong growth in the
merchant payment
solutions product
Processed volume growth
(Values are Indexed)
MOBILE RECHARGES
DTH, UTILITIES
LOANS CARDS CA/SA/FD
100 234
1,301
2,375
Q1FY21
Q2FY21
Q3FY21
Q4FY21
Freecharge continues to make progress in its payments led financials services journey with the launch of a “Buy now Pay later” product
Freecharge Paylater
• Insta onboarding, decisioning & activation
– Less than 3 minutes and in just 3 steps.
• 30 day credit period.
• Monthly limit of upto `5000/-
• Enabled on more than 10000 merchants.
• Targeted towards Millennials.
*Small and medium businesses

Annual Results FY 20-21
Financial Highlights
Business Segment performance
Asset Quality
Capital and Liquidity Position
Future of Work and Sustainability
Subsidiaries’ Performance
63
Other important information
Executive Summary
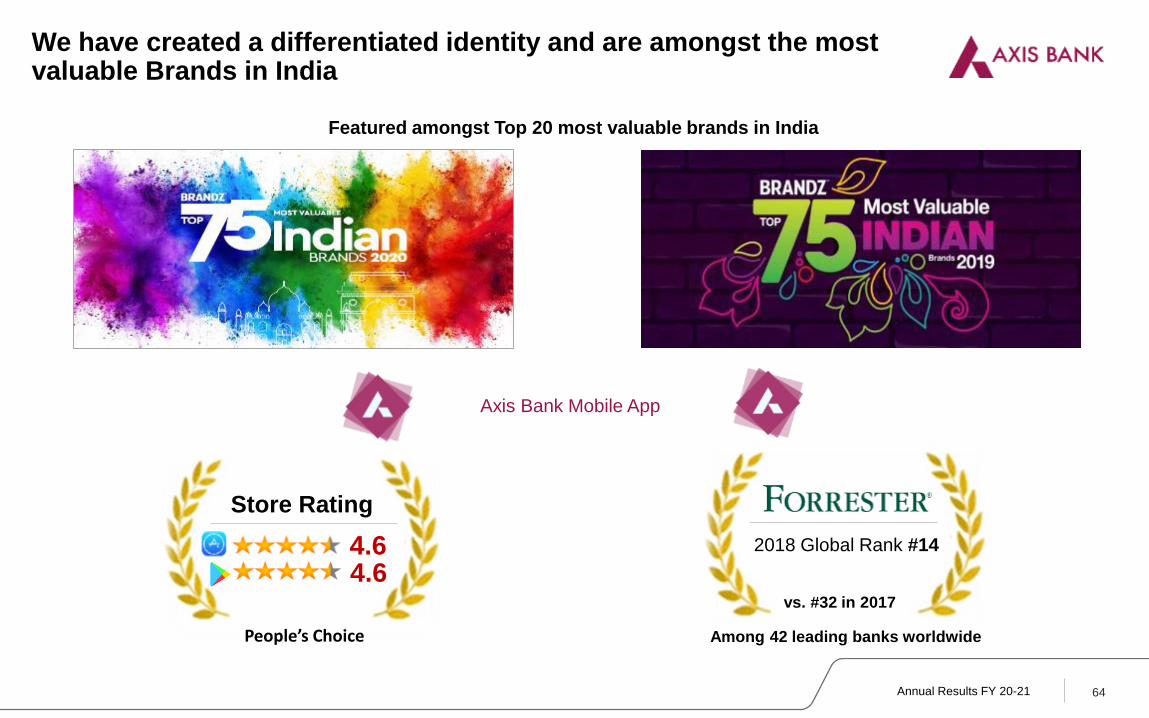
Annual Results FY 20-21
We have created a differentiated identity and are amongst the most valuable Brands in India
Featured amongst Top 20 most valuable brands in India
2018 Global Rank #14
vs. #32 in 2017
Among 42 leading banks worldwidePeople’s Choice
Store Rating
4.6
Axis Bank Mobile App
4.6
64

Annual Results FY 20-21
Major awards won by the Bank and its subsidiaries
Best Cyber Security Project,
Best Financial AI Project &
Best Risk Management Project
Ranked no 1 in Corporate
Banking Quality in IndiaBest Engagement and Loyalty
Scheme of the Year
Best Use of IT in Risk
Management / Fraud
Prevention
Anti-Money Laundering
Technology Implementation
Best Digital Bank India 2021
65

Annual Results FY 20-21
Financial Performance
66
Financial Performance (₹ crores) Q4FY21 Q4FY20 % Growth FY21 FY20 % Growth
Interest Income A 15,545 16,234 (4%) 63,645 62,635 2%
Other Income B = C+D+E 4,668 3,985 17% 14,838 15,537 (4%)
- Fee Income C 3,376 2,931 15% 10,686 11,019 (3%)
- Trading Income D 789 264 198% 2,547 2,420 5%
- Miscellaneous Income E 503 790 (36%) 1,605 2,098 (23%)
- Recoveries in written-off a/c’s 360 654 (45%) 1,246 1,553 (20%)
Total Income F = A+B 20,213 20,219 - 78,483 78,172 -
Interest Expended G 7,990 9,426 (15%) 34,406 37,429 (8%)
Net Interest Income H = A-G 7,555 6,808 11% 29,239 25,206 16%
Operating Revenue I = B+H 12,223 10,793 13% 44,077 40,743 8%
Core Operating Revenue* J 11,439 10,529 9% 41,524 38,323 8%
Operating Expenses K 5,359 4,942 8% 18,375 17,305 6%
-Staff Expense L 1,668 1,374 21% 6,164 5,321 16%
-Non Staff Expense M 3,691 3,568 3% 12,211 11,984 2%
Operating Profit N = I-K 6,865 5,851 17% 25,702 23,438 10%
Core Operating Profit* O 6,080 5,587 9% 23,149 21,018 10%
Provisions other than taxes P 3,295 7,730 (57%) 16,896 18,534 (9%)
Profit Before Tax Q = N-P 3,570 (1,879) - 8,806 4,904 80%
Tax Expenses R 893 (491) - 2,217 3,277 (32%)
Net Profit S = Q-R 2,677 (1,388) - 6,588 1,627 305%
EPS Diluted (in `) (annualized) 35.37 (19.79) 22.09 5.97
Return on Average Assets (annualized) 1.11% (0.62%) 0.70% 0.20%
Return on Equity (annualized) 11.72% (7.08%) 7.55% 2.34%
Capital Adequacy Ratio (Basel III) 19.12% 17.53% 19.12% 17.53%
* excluding trading profit and exchange gain/loss on capital repatriated from overseas branch
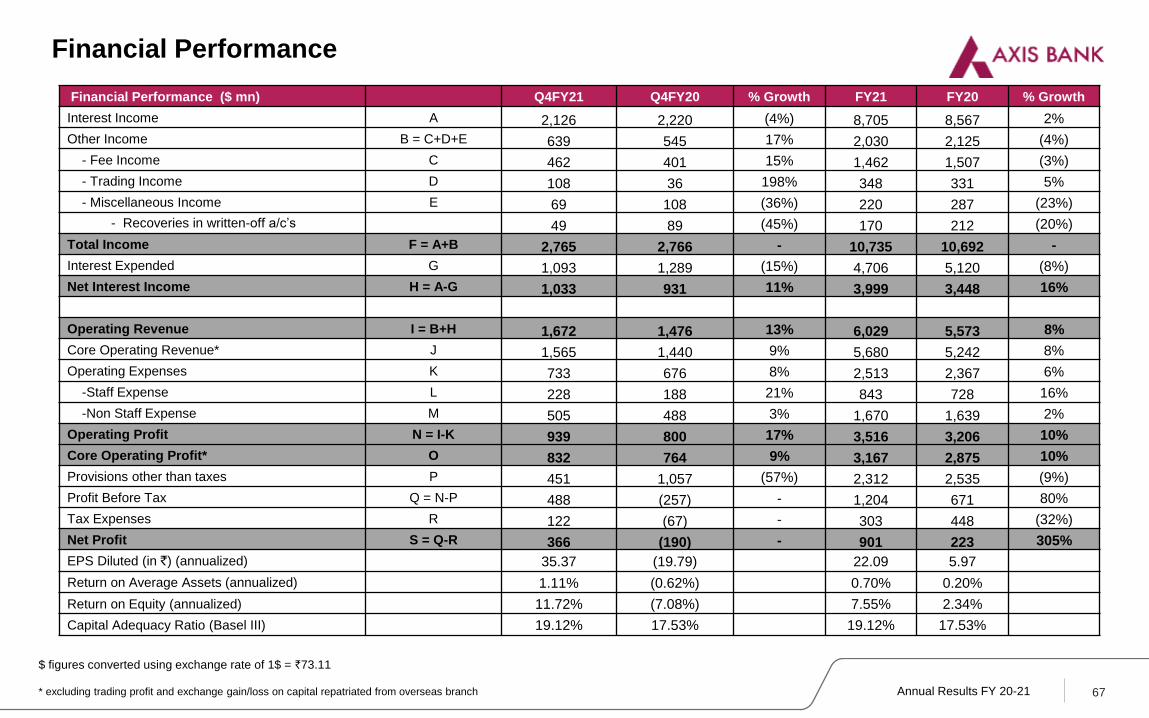
Annual Results FY 20-21
Financial Performance
67* excluding trading profit and exchange gain/loss on capital repatriated from overseas branch
$ figures converted using exchange rate of 1$ = `73.11
Financial Performance ($ mn) Q4FY21 Q4FY20 % Growth FY21 FY20 % Growth
Interest Income A 2,126 2,220 (4%) 8,705 8,567 2%
Other Income B = C+D+E 639 545 17% 2,030 2,125 (4%)
- Fee Income C 462 401 15% 1,462 1,507 (3%)
- Trading Income D 108 36 198% 348 331 5%
- Miscellaneous Income E 69 108 (36%) 220 287 (23%)
- Recoveries in written-off a/c’s 49 89 (45%) 170 212 (20%)
Total Income F = A+B 2,765 2,766 - 10,735 10,692 -
Interest Expended G 1,093 1,289 (15%) 4,706 5,120 (8%)
Net Interest Income H = A-G 1,033 931 11% 3,999 3,448 16%
Operating Revenue I = B+H 1,672 1,476 13% 6,029 5,573 8%
Core Operating Revenue* J 1,565 1,440 9% 5,680 5,242 8%
Operating Expenses K 733 676 8% 2,513 2,367 6%
-Staff Expense L 228 188 21% 843 728 16%
-Non Staff Expense M 505 488 3% 1,670 1,639 2%
Operating Profit N = I-K 939 800 17% 3,516 3,206 10%
Core Operating Profit* O 832 764 9% 3,167 2,875 10%
Provisions other than taxes P 451 1,057 (57%) 2,312 2,535 (9%)
Profit Before Tax Q = N-P 488 (257) - 1,204 671 80%
Tax Expenses R 122 (67) - 303 448 (32%)
Net Profit S = Q-R 366 (190) - 901 223 305%
EPS Diluted (in `) (annualized) 35.37 (19.79) 22.09 5.97
Return on Average Assets (annualized) 1.11% (0.62%) 0.70% 0.20%
Return on Equity (annualized) 11.72% (7.08%) 7.55% 2.34%
Capital Adequacy Ratio (Basel III) 19.12% 17.53% 19.12% 17.53%
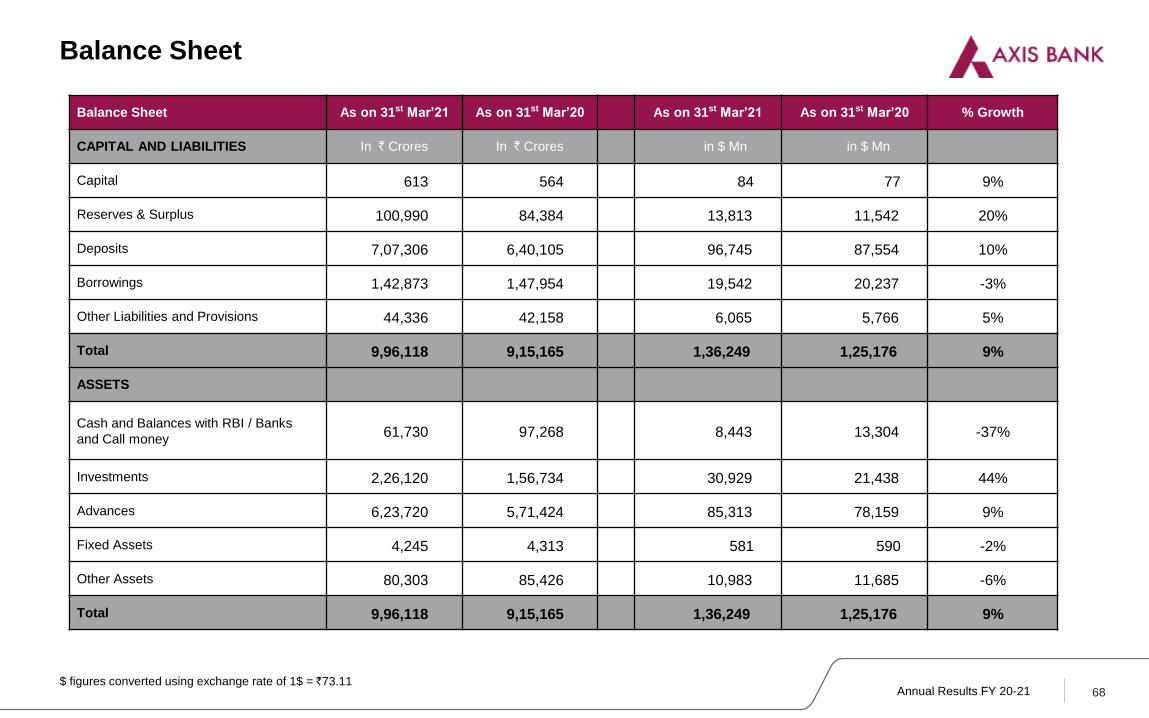
Annual Results FY 20-21
Balance Sheet
68
Balance Sheet As on 31st Mar’21 As on 31st Mar’20 As on 31st Mar’21 As on 31st Mar’20 % Growth
CAPITAL AND LIABILITIES In ` Crores In ` Crores in $ Mn in $ Mn
Capital 613 564 84 77 9%
Reserves & Surplus 100,990 84,384 13,813 11,542 20%
Deposits 7,07,306 6,40,105 96,745 87,554 10%
Borrowings 1,42,873 1,47,954 19,542 20,237 -3%
Other Liabilities and Provisions 44,336 42,158 6,065 5,766 5%
Total 9,96,118 9,15,165 1,36,249 1,25,176 9%
ASSETS
Cash and Balances with RBI / Banks
and Call money 61,730 97,268 8,443 13,304 -37%
Investments 2,26,120 1,56,734 30,929 21,438 44%
Advances 6,23,720 5,71,424 85,313 78,159 9%
Fixed Assets 4,245 4,313 581 590 -2%
Other Assets 80,303 85,426 10,983 11,685 -6%
Total 9,96,118 9,15,165 1,36,249 1,25,176 9%
$ figures converted using exchange rate of 1$ = ̀ 73.11
Annual Results FY 20-21
Except for the historical information contained herein, statements in this release which contain
words or phrases such as “will”, “aim”, “will likely result”, “would”, “believe”, “may”, “expect”, “will
continue”, “anticipate”, “estimate”, “intend”, “plan”, “contemplate”, “seek to”, “future”, “objective”,
“goal”, “strategy”, “philosophy”, “project”, “should”, “will pursue” and similar expressions or variations
of such expressions may constitute "forward-looking statements". These forward-looking statements
involve a number of risks, uncertainties and other factors that could cause actual results to differ
materially from those suggested by the forward-looking statements. These risks and uncertainties
include, but are not limited to our ability to successfully implement our strategy, future levels of non-
performing loans, our growth and expansion, the adequacy of our allowance for credit losses, our
provisioning policies, technological changes, investment income, cash flow projections, our
exposure to market risks as well as other risks. Axis Bank Limited undertakes no obligation to
update forward-looking statements to reflect events or circumstances after the date thereof.
Safe Harbor
69
Annual Results FY 20-21
Thank You
70