
awrrpt_26Nov2013
230
WORKLOAD REPOSITORY report for DB Name DB Id FLCP 2210110125 Host Name Platform CLKLXFLCDBP01 Linux x86 64-bit Snap Id Begin Snap: 21772 End Snap: 21795 Elapsed: DB Time: Report Summary Cache Sizes Begin Buffer Cache: 544M Shared Pool Size: 800M Load Profile Per Second DB Time(s): 0.6 DB CPU(s): 0.4 Redo size: 14,278.70 Logical reads: 12,907.10 Block changes: 98.3 Physical reads: 1,177.70 Physical writes: 2.4 User calls: 69.6 Parses: 12.6 Hard parses: 0.1 W/A MB processed: 12.9 Logons: 0 Executes: 73.1 Rollbacks: 0 Transactions: 1.7 Instance Efficiency Percentages (Target 100%) Buffer Nowait %: 100 Buffer Hit %: 97.03 Library Hit %: 99.87 Execute to Parse %: 82.71 Parse CPU to Parse Elapsd %: 83.74 Shared Pool Statistics
-
Upload
malathi-sv -
Category
Documents
-
view
35 -
download
2
description
awr
Transcript of awrrpt_26Nov2013
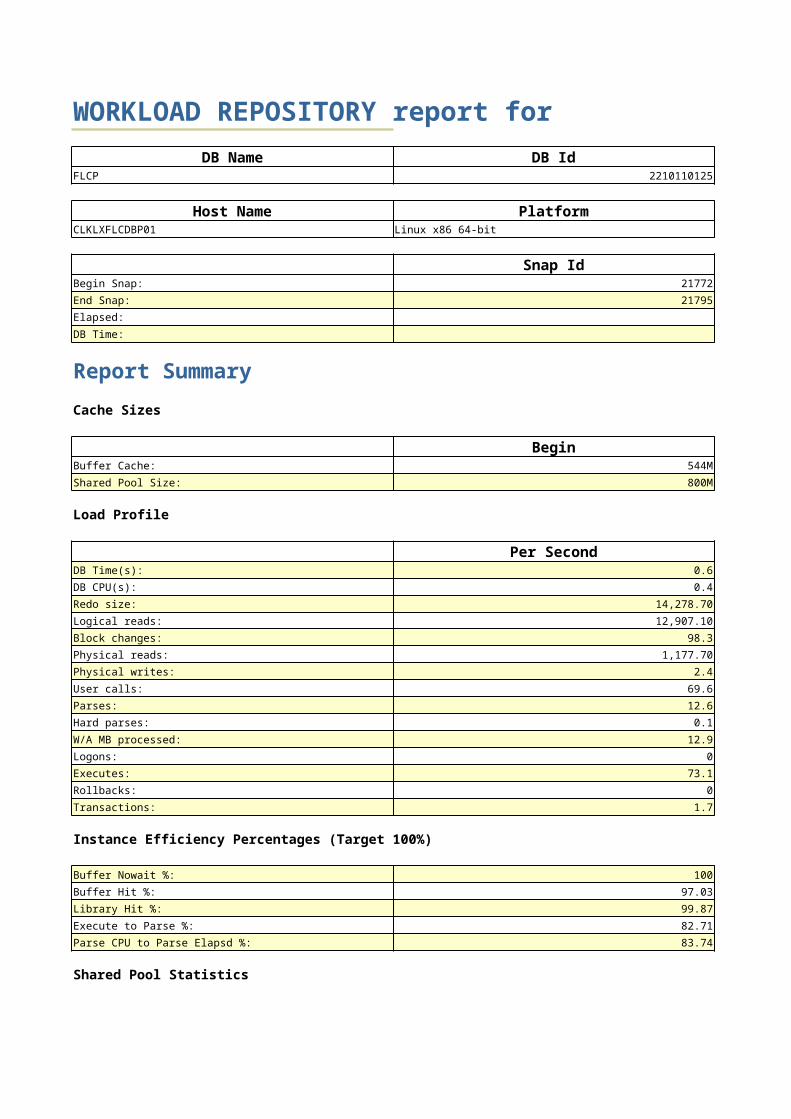
WORKLOAD REPOSITORY report for
DB Name DB IdFLCP 2210110125
Host Name PlatformCLKLXFLCDBP01 Linux x86 64-bit
Snap IdBegin Snap: 21772
End Snap: 21795
Elapsed:
DB Time:
Report Summary
Cache Sizes
BeginBuffer Cache: 544M
Shared Pool Size: 800M
Load Profile
Per SecondDB Time(s): 0.6
DB CPU(s): 0.4
Redo size: 14,278.70
Logical reads: 12,907.10
Block changes: 98.3
Physical reads: 1,177.70
Physical writes: 2.4
User calls: 69.6
Parses: 12.6
Hard parses: 0.1
W/A MB processed: 12.9
Logons: 0
Executes: 73.1
Rollbacks: 0
Transactions: 1.7
Instance Efficiency Percentages (Target 100%)
Buffer Nowait %: 100
Buffer Hit %: 97.03
Library Hit %: 99.87
Execute to Parse %: 82.71
Parse CPU to Parse Elapsd %: 83.74
Shared Pool Statistics

BeginMemory Usage %: 84.82
% SQL with executions>1: 95.32
% Memory for SQL w/exec>1: 92.46
Top 5 Timed Foreground Events
Event WaitsDB CPU
db file scattered read 1,260,831
db file sequential read 909,318
direct path read 496,726
resmgr:cpu quantum 11,708
Host CPU (CPUs: 2 Cores: Sockets: )
Load Average Begin Load Average End0.01 1.94
Instance CPU
%Total CPU %Busy CPU
21.7 95.1
Memory Statistics
BeginHost Mem (MB): 7,855.70
SGA use (MB): 1,536.00
PGA use (MB): 428.9
% Host Mem used for SGA+PGA: 25.01
Main Report
Report SummaryWait Events StatisticsSQL StatisticsInstance Activity StatisticsIO StatsBuffer Pool StatisticsAdvisory StatisticsWait StatisticsUndo StatisticsLatch StatisticsSegment StatisticsDictionary Cache StatisticsLibrary Cache StatisticsMemory StatisticsStreams StatisticsResource Limit StatisticsShared Server Statistics

Wait Events Statistics
Time Model Statistics
Total time in database user-calls (DB Time): 45999.1s
Statistics including the word "background" measure background process time, and so do not contribute to the DB time statistic
Ordered by % or DB time desc, Statistic name
Statistic Name Time (s)sql execute elapsed time 43,106.96
DB CPU 34,690.68
parse time elapsed 1,089.84
hard parse elapsed time 1,057.27
failed parse elapsed time 876.66
PL/SQL execution elapsed time 465.07
RMAN cpu time (backup/restore) 33.43
hard parse (sharing criteria) elapsed time 25.09
sequence load elapsed time 16.84
connection management call elapsed time 10.31
inbound PL/SQL rpc elapsed time 4.32
repeated bind elapsed time 3.3
PL/SQL compilation elapsed time 1.44
hard parse (bind mismatch) elapsed time 0.47
Java execution elapsed time 0.08
DB time 45,999.05
background elapsed time 5,932.91
background cpu time 457.35
init.ora Parameters
Back to Top
Time Model StatisticsOperating System StatisticsOperating System Statistics - DetailForeground Wait ClassForeground Wait EventsBackground Wait EventsWait Event HistogramWait Event Histogram Detail (64 msec to 2 sec)Wait Event Histogram Detail (4 sec to 2 min)Wait Event Histogram Detail (4 min to 1 hr)Service StatisticsService Wait Class Stats
Back to Top
Back to Wait Events StatisticsBack to Top
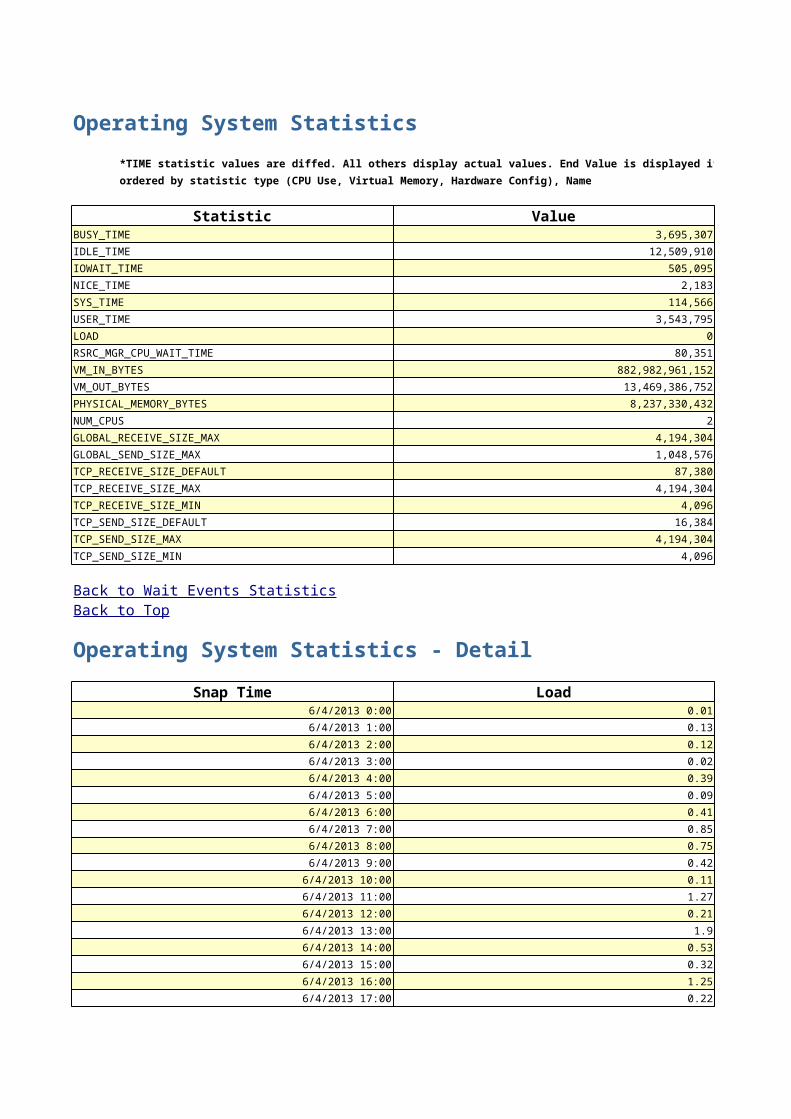
Operating System Statistics
*TIME statistic values are diffed. All others display actual values. End Value is displayed if different
ordered by statistic type (CPU Use, Virtual Memory, Hardware Config), Name
Statistic ValueBUSY_TIME 3,695,307
IDLE_TIME 12,509,910
IOWAIT_TIME 505,095
NICE_TIME 2,183
SYS_TIME 114,566
USER_TIME 3,543,795
LOAD 0
RSRC_MGR_CPU_WAIT_TIME 80,351
VM_IN_BYTES 882,982,961,152
VM_OUT_BYTES 13,469,386,752
PHYSICAL_MEMORY_BYTES 8,237,330,432
NUM_CPUS 2
GLOBAL_RECEIVE_SIZE_MAX 4,194,304
GLOBAL_SEND_SIZE_MAX 1,048,576
TCP_RECEIVE_SIZE_DEFAULT 87,380
TCP_RECEIVE_SIZE_MAX 4,194,304
TCP_RECEIVE_SIZE_MIN 4,096
TCP_SEND_SIZE_DEFAULT 16,384
TCP_SEND_SIZE_MAX 4,194,304
TCP_SEND_SIZE_MIN 4,096
Operating System Statistics - Detail
Snap Time Load6/4/2013 0:00 0.01
6/4/2013 1:00 0.13
6/4/2013 2:00 0.12
6/4/2013 3:00 0.02
6/4/2013 4:00 0.39
6/4/2013 5:00 0.09
6/4/2013 6:00 0.41
6/4/2013 7:00 0.85
6/4/2013 8:00 0.75
6/4/2013 9:00 0.42
6/4/2013 10:00 0.11
6/4/2013 11:00 1.27
6/4/2013 12:00 0.21
6/4/2013 13:00 1.9
6/4/2013 14:00 0.53
6/4/2013 15:00 0.32
6/4/2013 16:00 1.25
6/4/2013 17:00 0.22
Back to Wait Events StatisticsBack to Top

6/4/2013 18:00 0.8
6/4/2013 19:00 0.45
6/4/2013 20:00 0.1
6/4/2013 21:00 0.75
6/4/2013 22:00 2.65
6/4/2013 23:01 1.94
Foreground Wait Class
s - second, ms - millisecond - 1000th of a second
ordered by wait time desc, waits desc
%Timeouts: value of 0 indicates value was < .5%. Value of null is truly 0
Captured Time accounts for 91.1% of Total DB time 45,999.05 (s)
Total FG Wait Time: 7,221.25 (s) DB CPU time: 34,690.68 (s)
Wait Class WaitsDB CPU
User I/O 2,701,519
Scheduler 11,708
Commit 122,366
System I/O 86,916
Network 5,386,159
Concurrency 2,337
Application 1,494
Other 362,024
Administrative 2
Configuration 40
Foreground Wait Events
s - second, ms - millisecond - 1000th of a second
Only events with Total Wait Time (s) >= .001 are shown
ordered by wait time desc, waits desc (idle events last)
%Timeouts: value of 0 indicates value was < .5%. Value of null is truly 0
Event Waitsdb file scattered read 1,260,831
db file sequential read 909,318
direct path read 496,726
resmgr:cpu quantum 11,708
log file sync 122,366
control file sequential read 86,660
read by other session 28,648
library cache lock 29
TCP Socket (KGAS) 1,864
SQL*Net message to client 5,245,991
Back to Wait Events StatisticsBack to Top
Back to Wait Events StatisticsBack to Top
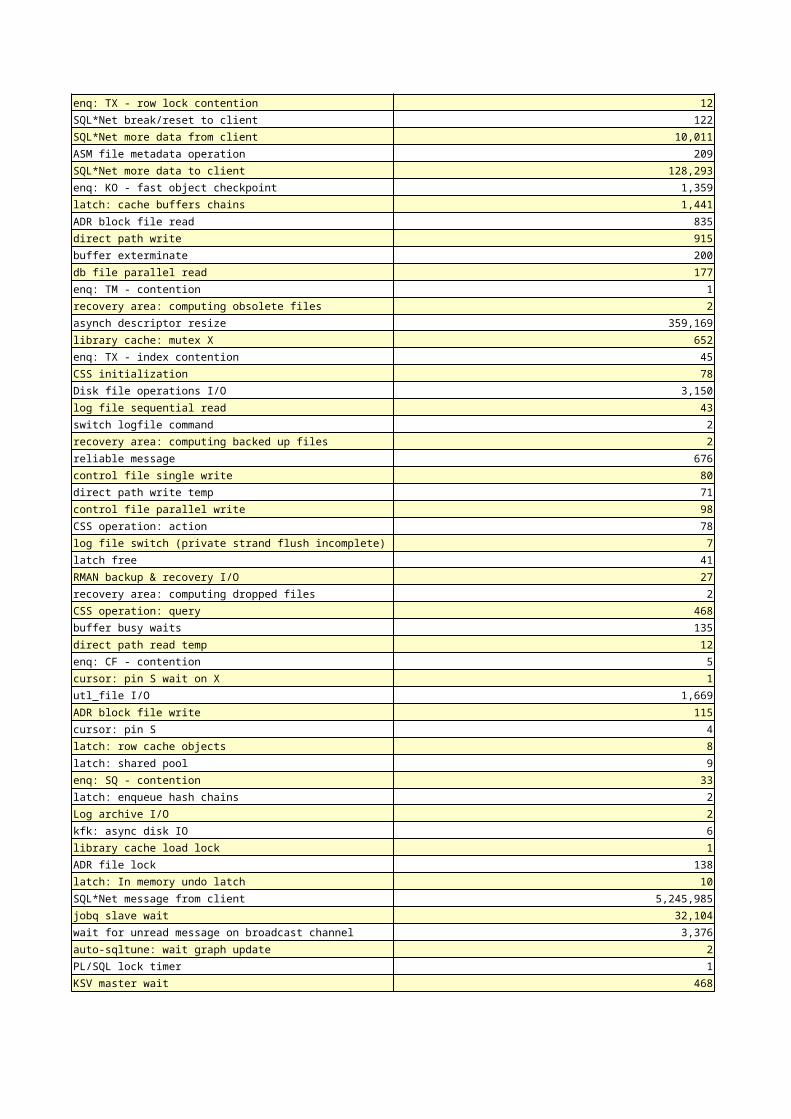
enq: TX - row lock contention 12
SQL*Net break/reset to client 122
SQL*Net more data from client 10,011
ASM file metadata operation 209
SQL*Net more data to client 128,293
enq: KO - fast object checkpoint 1,359
latch: cache buffers chains 1,441
ADR block file read 835
direct path write 915
buffer exterminate 200
db file parallel read 177
enq: TM - contention 1
recovery area: computing obsolete files 2
asynch descriptor resize 359,169
library cache: mutex X 652
enq: TX - index contention 45
CSS initialization 78
Disk file operations I/O 3,150
log file sequential read 43
switch logfile command 2
recovery area: computing backed up files 2
reliable message 676
control file single write 80
direct path write temp 71
control file parallel write 98
CSS operation: action 78
log file switch (private strand flush incomplete) 7
latch free 41
RMAN backup & recovery I/O 27
recovery area: computing dropped files 2
CSS operation: query 468
buffer busy waits 135
direct path read temp 12
enq: CF - contention 5
cursor: pin S wait on X 1
utl_file I/O 1,669
ADR block file write 115
cursor: pin S 4
latch: row cache objects 8
latch: shared pool 9
enq: SQ - contention 33
latch: enqueue hash chains 2
Log archive I/O 2
kfk: async disk IO 6
library cache load lock 1
ADR file lock 138
latch: In memory undo latch 10
SQL*Net message from client 5,245,985
jobq slave wait 32,104
wait for unread message on broadcast channel 3,376
auto-sqltune: wait graph update 2
PL/SQL lock timer 1
KSV master wait 468

Background Wait Events
ordered by wait time desc, waits desc (idle events last)
Only events with Total Wait Time (s) >= .001 are shown
%Timeouts: value of 0 indicates value was < .5%. Value of null is truly 0
Event WaitsBackup: MML create a backup piece 4
RMAN backup & recovery I/O 137,615
log file parallel write 195,339
control file sequential read 297,454
control file parallel write 89,075
ASM file metadata operation 141,608
db file parallel write 97,946
db file sequential read 17,274
Parameter File I/O 22,100
os thread startup 978
LNS wait on SENDREQ 194,672
Backup: MML write backup piece 5,828
Backup: MML commit backup piece 4
log file sequential read 1,745
db file scattered read 1,171
Backup: MML query backup piece 4
Disk file operations I/O 24,709
enq: CF - contention 62
ADR block file read 371
resmgr:cpu quantum 58
db file parallel read 63
control file single write 84
LGWR wait for redo copy 767
direct path read 101
SQL*Net more data from client 100
direct path write 96
CSS initialization 26
log file sync 49
latch free 35
latch: shared pool 5
rdbms ipc reply 100
resmgr:internal state change 1
log file single write 132
Log archive I/O 31
reliable message 178
kfk: async disk IO 93
enq: JS - queue lock 11
CSS operation: action 26
ADR block file write 118
enq: CR - block range reuse ckpt 41
read by other session 1
latch: redo allocation 20
asynch descriptor resize 3,788
Back to Wait Events StatisticsBack to Top

log file switch completion 1
CSS operation: query 156
undo segment extension 3
latch: call allocation 1
Backup: MML shutdown 1
latch: cache buffers chains 1
enq: RO - fast object reuse 35
buffer busy waits 8
SQL*Net message to client 3,192
latch: cache buffers lru chain 11
direct path write temp 1
SQL*Net more data to client 100
ADR file lock 144
enq: RF - synch: DG Broker metadata 5
rdbms ipc message 754,177
EMON slave idle wait 82,771
class slave wait 35,482
DIAG idle wait 164,733
6
Space Manager: slave idle wait 21,338
smon timer 423
Streams AQ: qmn coordinator idle wait 5,930
Streams AQ: qmn slave idle wait 3,032
ASM background timer 62,091
wait for unread message on broadcast channel 83,152
shared server idle wait 2,760
Streams AQ: emn coordinator idle wait 8,278
dispatcher timer 1,380
pmon timer 27,664
LNS ASYNC end of log 248,091
VKRM Idle 2
KSV master wait 49,702
JOX Jit Process Sleep 16
SQL*Net message from client 4,138
SGA: MMAN sleep for component shrink 107
Wait Event Histogram
Units for Total Waits column: K is 1000, M is 1000000, G is 1000000000
% of Waits: value of .0 indicates value was <.05%; value of null is truly 0
% of Waits: column heading of <=1s is truly <1024ms, >1s is truly >=1024ms
Ordered by Event (idle events last)
Event Total WaitsADR block file read 1206
ADR block file write 233
ADR file lock 282
ARCH wait for archivelog lock 39
Streams AQ: waiting for time management or cleanup tasks
Back to Wait Events StatisticsBack to Top

ASM file metadata operation 141.8K
Backup: MML commit backup piece 4
Backup: MML create a backup piece 4
Backup: MML query backup piece 4
Backup: MML shutdown 1
Backup: MML write backup piece 5828
CSS initialization 104
CSS operation: action 104
CSS operation: query 624
Disk file operations I/O 27.9K
LGWR wait for redo copy 766
LNS wait on SENDREQ 194.7K
Log archive I/O 33
Parameter File I/O 22.1K
RMAN backup & recovery I/O 137.6K
SQL*Net break/reset to client 124
SQL*Net message to client 5249.3K
SQL*Net more data from client 10.1K
SQL*Net more data to client 128.4K
TCP Socket (KGAS) 1864
asynch descriptor resize 363K
buffer busy waits 143
buffer exterminate 200
control file parallel write 89.2K
control file sequential read 384.1K
control file single write 164
cursor: pin S 4
cursor: pin S wait on X 1
db file parallel read 240
db file parallel write 97.9K
db file scattered read 1262K
db file sequential read 926.7K
direct path read 496.8K
direct path read temp 12
direct path write 1011
direct path write temp 72
enq: CF - contention 67
enq: CR - block range reuse ckpt 41
enq: JS - queue lock 11
enq: KO - fast object checkpoint 1359
enq: RF - synch: DG Broker metadata 5
enq: RO - fast object reuse 35
enq: SQ - contention 33
enq: TM - contention 1
enq: TX - index contention 45
enq: TX - row lock contention 12
kfk: async disk IO 99
latch free 76
latch: In memory undo latch 10
latch: cache buffers chains 1442
latch: cache buffers lru chain 12
latch: call allocation 1
latch: enqueue hash chains 5
latch: messages 2

latch: object queue header operation 3
latch: redo allocation 20
latch: row cache objects 8
latch: shared pool 14
library cache load lock 1
library cache lock 29
library cache: mutex X 652
log file parallel write 195.3K
log file sequential read 1788
log file single write 132
log file switch (private strand flush incomplete) 7
log file switch completion 1
log file sync 122.4K
os thread startup 978
rdbms ipc reply 100
read by other session 28.6K
recovery area: computing backed up files 2
recovery area: computing dropped files 2
recovery area: computing obsolete files 2
reliable message 854
resmgr:cpu quantum 11.8K
resmgr:internal state change 1
row cache lock 2
switch logfile command 2
undo segment extension 3
utl_file I/O 1669
ASM background timer 62.1K
DIAG idle wait 164.7K
EMON slave idle wait 82.8K
JOX Jit Process Sleep 16
KSV master wait 50.2K
LNS ASYNC end of log 248.1K
PL/SQL lock timer 1
SGA: MMAN sleep for component shrink 107
SQL*Net message from client 5250.2K
Space Manager: slave idle wait 21.3K
Streams AQ: emn coordinator idle wait 8278
Streams AQ: qmn coordinator idle wait 5930
Streams AQ: qmn slave idle wait 3032
6
VKRM Idle 1
auto-sqltune: wait graph update 2
class slave wait 35.5K
dispatcher timer 1380
jobq slave wait 32.1K
pmon timer 27.7K
rdbms ipc message 754.2K
shared server idle wait 2760
smon timer 422
wait for unread message on broadcast channel 86.5K
Streams AQ: waiting for time management or cleanup tasks
Back to Wait Events StatisticsBack to Top
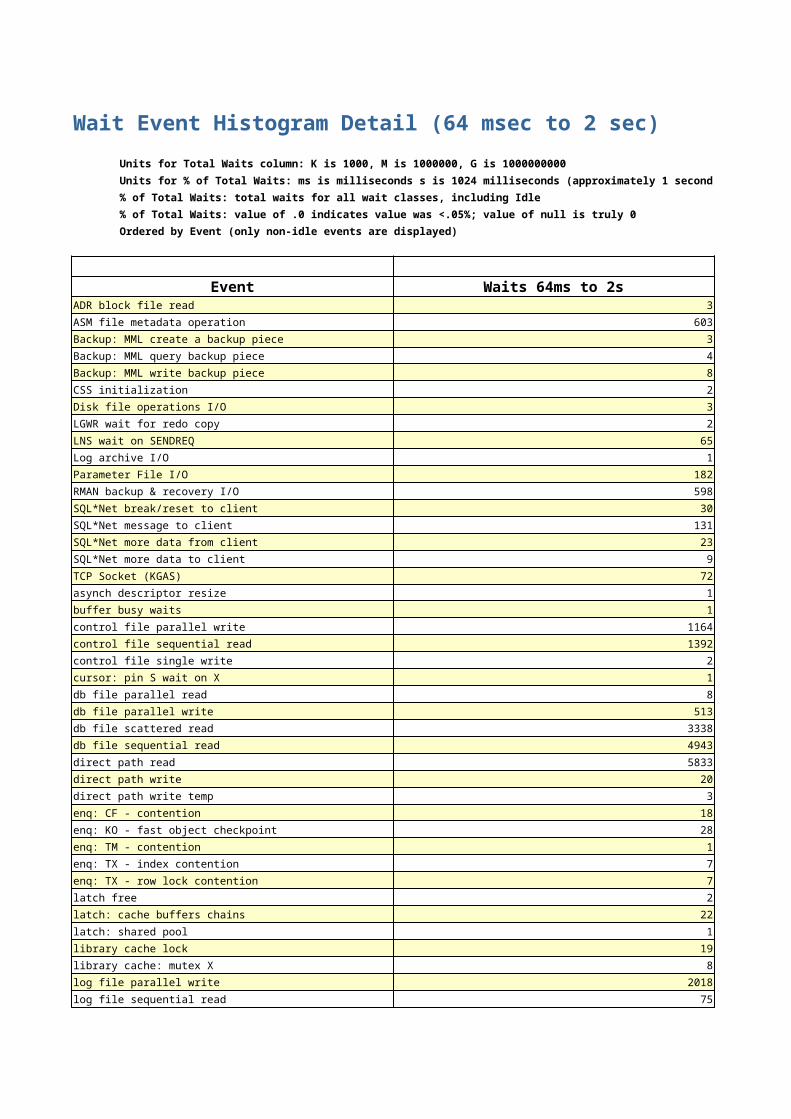
Wait Event Histogram Detail (64 msec to 2 sec)
Units for Total Waits column: K is 1000, M is 1000000, G is 1000000000
Units for % of Total Waits: ms is milliseconds s is 1024 milliseconds (approximately 1 second)
% of Total Waits: total waits for all wait classes, including Idle
% of Total Waits: value of .0 indicates value was <.05%; value of null is truly 0
Ordered by Event (only non-idle events are displayed)
Event Waits 64ms to 2sADR block file read 3
ASM file metadata operation 603
Backup: MML create a backup piece 3
Backup: MML query backup piece 4
Backup: MML write backup piece 8
CSS initialization 2
Disk file operations I/O 3
LGWR wait for redo copy 2
LNS wait on SENDREQ 65
Log archive I/O 1
Parameter File I/O 182
RMAN backup & recovery I/O 598
SQL*Net break/reset to client 30
SQL*Net message to client 131
SQL*Net more data from client 23
SQL*Net more data to client 9
TCP Socket (KGAS) 72
asynch descriptor resize 1
buffer busy waits 1
control file parallel write 1164
control file sequential read 1392
control file single write 2
cursor: pin S wait on X 1
db file parallel read 8
db file parallel write 513
db file scattered read 3338
db file sequential read 4943
direct path read 5833
direct path write 20
direct path write temp 3
enq: CF - contention 18
enq: KO - fast object checkpoint 28
enq: TM - contention 1
enq: TX - index contention 7
enq: TX - row lock contention 7
latch free 2
latch: cache buffers chains 22
latch: shared pool 1
library cache lock 19
library cache: mutex X 8
log file parallel write 2018
log file sequential read 75

log file sync 1815
os thread startup 110
rdbms ipc reply 2
read by other session 126
recovery area: computing backed up files 2
recovery area: computing dropped files 2
recovery area: computing obsolete files 2
reliable message 3
resmgr:cpu quantum 7591
resmgr:internal state change 1
switch logfile command 1
Wait Event Histogram Detail (4 sec to 2 min)
Units for Total Waits column: K is 1000, M is 1000000, G is 1000000000
Units for % of Total Waits: s is 1024 milliseconds (approximately 1 second) m is 64*1024 milliseconds (approximately 67 seconds or 1.1 minutes)
% of Total Waits: total waits for all wait classes, including Idle
% of Total Waits: value of .0 indicates value was <.05%; value of null is truly 0
Ordered by Event (only non-idle events are displayed)
Event Waits 4s to 2mASM file metadata operation 11
Backup: MML commit backup piece 4
TCP Socket (KGAS) 2
control file parallel write 1
enq: TX - row lock contention 4
library cache lock 2
os thread startup 1
Wait Event Histogram Detail (4 min to 1 hr)
Units for Total Waits column: K is 1000, M is 1000000, G is 1000000000
Units for % of Total Waits: m is 64*1024 milliseconds (approximately 67 seconds or 1.1 minutes) h is 4096*1024 milliseconds (approximately 70 minutes or 1.17 hours)
% of Total Waits: total waits for all wait classes, including Idle
% of Total Waits: value of .0 indicates value was <.05%; value of null is truly 0
Ordered by Event (only non-idle events are displayed)
Event Waits 4m to 1hBackup: MML create a backup piece 1
Back to Wait Events StatisticsBack to Top
Back to Wait Events StatisticsBack to Top
Back to Wait Events StatisticsBack to Top

Service Statistics
ordered by DB Time
Service Name DB Time (s)SYS$USERS 45,843
FLCP.WORLD 154
FLCPXDB 0
SYS$BACKGROUND 0
Service Wait Class Stats
Wait Class info for services in the Service Statistics section.
Total Waits and Time Waited displayed for the following wait classes: User I/O, Concurrency, Administrative, Network
Time Waited (Wt Time) in seconds
Service Name User I/O Total WtsSYS$USERS 2693659
FLCP.WORLD 8222
SYS$BACKGROUND 65136
SQL Statistics
SQL ordered by Elapsed Time
Resources reported for PL/SQL code includes the resources used by all SQL statements called by the code.
% Total DB Time is the Elapsed Time of the SQL statement divided into the Total Database Time multiplied by 100
%Total - Elapsed Time as a percentage of Total DB time
Back to Wait Events StatisticsBack to Top
Back to Wait Events StatisticsBack to Top
SQL ordered by Elapsed TimeSQL ordered by CPU TimeSQL ordered by User I/O Wait TimeSQL ordered by GetsSQL ordered by ReadsSQL ordered by Physical Reads (UnOptimized)SQL ordered by ExecutionsSQL ordered by Parse CallsSQL ordered by Sharable MemorySQL ordered by Version CountComplete List of SQL Text
Back to Top

%CPU - CPU Time as a percentage of Elapsed Time
%IO - User I/O Time as a percentage of Elapsed Time
Captured SQL account for 104.2% of Total DB Time (s): 45,999
Captured PL/SQL account for 12.2% of Total DB Time (s): 45,999
Elapsed Time (s) Executions15,610.14 202,190
7,304.95 107,828
5,466.25 3,402
4,444.66 2,605
3,052.65 5,826
2,675.94 107,811
2,667.04 3,677
2,264.21 107,794
2,250.37 107,800
1,048.54 4,948
1,027.96 636
963.63 1
785.65 2,941
600.45 1
502.33 1
SQL ordered by CPU Time
Resources reported for PL/SQL code includes the resources used by all SQL statements called by the code.
%Total - CPU Time as a percentage of Total DB CPU
%CPU - CPU Time as a percentage of Elapsed Time
%IO - User I/O Time as a percentage of Elapsed Time
Captured SQL account for 105.9% of Total CPU Time (s): 34,691
Captured PL/SQL account for 7.4% of Total CPU Time (s): 34,691
CPU Time (s) Executions13,831.41 202,190
6,858.20 107,828
2,896.49 3,402
2,505.48 107,811
2,433.02 2,605
2,112.96 107,794
2,109.60 107,800
1,538.37 3,677
1,463.62 5,826
758.84 2,941
595.87 4,948
530.56 636
Back to SQL StatisticsBack to Top

SQL ordered by User I/O Wait Time
Resources reported for PL/SQL code includes the resources used by all SQL statements called by the code.
%Total - User I/O Time as a percentage of Total User I/O Wait time
%CPU - CPU Time as a percentage of Elapsed Time
%IO - User I/O Time as a percentage of Elapsed Time
Captured SQL account for 137.0% of Total User I/O Wait Time (s): 5,956
Captured PL/SQL account for 46.5% of Total User I/O Wait Time (s): 5,956
User I/O Time (s) Executions2,504.66 3,402
1,959.49 2,605
1,570.68 5,826
1,103.04 3,677
686.04 1
577.85 1
482.79 636
427.45 4,948
359.35 1
164.24 130
132.99 1
126.75 116
117.71 1
97.57 14
72.22 66
SQL ordered by Gets
Resources reported for PL/SQL code includes the resources used by all SQL statements called by the code.
%Total - Buffer Gets as a percentage of Total Buffer Gets
%CPU - CPU Time as a percentage of Elapsed Time
%IO - User I/O Time as a percentage of Elapsed Time
Total Buffer Gets: 1,068,858,264
Captured SQL account for 106.3% of Total
Buffer Gets Executions190,929,941 107,811
190,911,099 107,828
190,900,724 107,794
190,883,029 107,800
75,980,331 202,190
69,331,789 3,402
Back to SQL StatisticsBack to Top
Back to SQL StatisticsBack to Top

68,187,749 5,826
57,898,052 2,605
36,391,443 3,677
19,713,555 4,948
18,339,075 2,941
17,698,186 77,801
16,303,638 3,958
12,996,125 636
SQL ordered by Reads
%Total - Physical Reads as a percentage of Total Disk Reads
%CPU - CPU Time as a percentage of Elapsed Time
%IO - User I/O Time as a percentage of Elapsed Time
Total Disk Reads: 97,527,850
Captured SQL account for 130.8% of Total
Physical Reads Executions64,448,202 5,826
28,778,664 3,402
23,412,955 2,605
13,693,584 3,677
5,798,609 636
5,382,144 4,948
1,585,228 116
1,074,155 130
701,365 85
488,786 1
SQL ordered by Physical Reads (UnOptimized)
UnOptimized Read Reqs = Physical Read Reqts - Optimized Read Reqs
%Opt - Optimized Reads as percentage of SQL Read Requests
%Total - UnOptimized Read Reqs as a percentage of Total UnOptimized Read Reqs
Total Physical Read Requests: 2,738,934
Captured SQL account for 154.7% of Total
Total UnOptimized Read Requests: 2,738,934
Captured SQL account for 154.7% of Total
Total Optimized Read Requests: 1
Captured SQL account for 0.0% of Total
UnOptimized Read Reqs Physical Read Reqs1,554,482 1,554,482
Back to SQL StatisticsBack to Top
Back to SQL StatisticsBack to Top
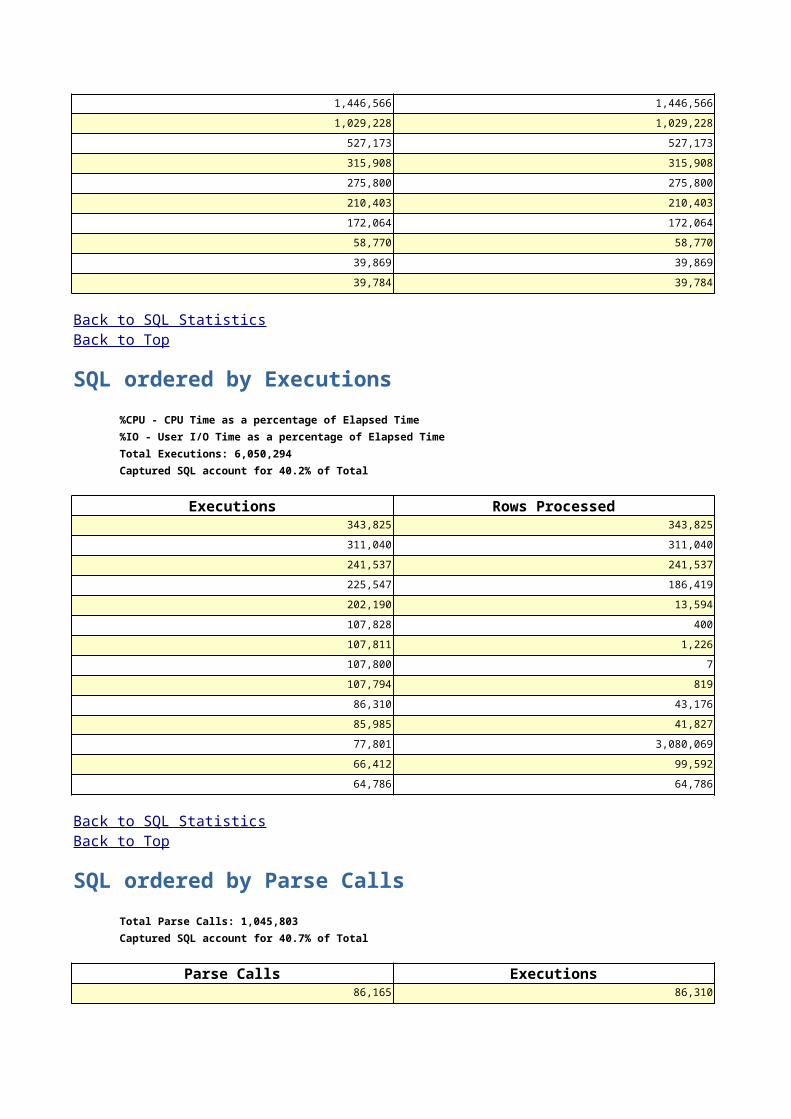
1,446,566 1,446,566
1,029,228 1,029,228
527,173 527,173
315,908 315,908
275,800 275,800
210,403 210,403
172,064 172,064
58,770 58,770
39,869 39,869
39,784 39,784
SQL ordered by Executions
%CPU - CPU Time as a percentage of Elapsed Time
%IO - User I/O Time as a percentage of Elapsed Time
Total Executions: 6,050,294
Captured SQL account for 40.2% of Total
Executions Rows Processed343,825 343,825
311,040 311,040
241,537 241,537
225,547 186,419
202,190 13,594
107,828 400
107,811 1,226
107,800 7
107,794 819
86,310 43,176
85,985 41,827
77,801 3,080,069
66,412 99,592
64,786 64,786
SQL ordered by Parse Calls
Total Parse Calls: 1,045,803
Captured SQL account for 40.7% of Total
Parse Calls Executions86,165 86,310
Back to SQL StatisticsBack to Top
Back to SQL StatisticsBack to Top

59,317 64,786
17,838 241,537
17,410 57,691
17,037 17,037
15,180 15,180
12,420 12,420
12,412 12,412
8,611 9,022
8,595 8,595
SQL ordered by Sharable Memory
Only Statements with Sharable Memory greater than 1048576 are displayed
Sharable Mem (b) Executions5,497,296 88
4,922,803 77
3,813,216 43
3,085,869 72
3,027,010 8
2,978,118 7
2,929,666 8
2,905,142 7
2,897,030 7
2,844,378 60
2,603,337 1,902
2,446,467 77
2,411,468 46
2,247,997 1
2,026,128 6
1,853,506 23
1,731,949 142
1,699,206 9
1,661,097 52
1,623,998 46
1,533,864 129
1,477,058 8
1,473,002 8
1,293,722 449
1,257,560 15
1,203,993 1,100
1,200,360 911
1,184,616 15
Back to SQL StatisticsBack to Top
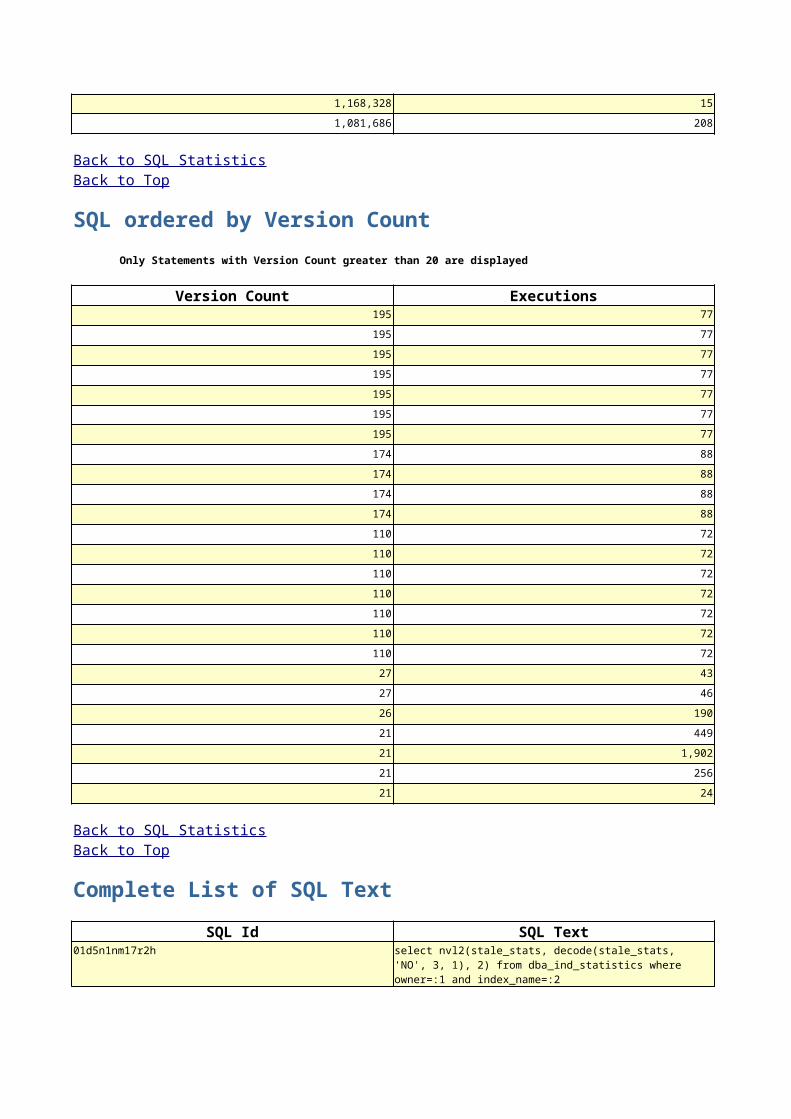
1,168,328 15
1,081,686 208
SQL ordered by Version Count
Only Statements with Version Count greater than 20 are displayed
Version Count Executions195 77
195 77
195 77
195 77
195 77
195 77
195 77
174 88
174 88
174 88
174 88
110 72
110 72
110 72
110 72
110 72
110 72
110 72
27 43
27 46
26 190
21 449
21 1,902
21 256
21 24
Complete List of SQL Text
SQL Id SQL Text01d5n1nm17r2h
Back to SQL StatisticsBack to Top
Back to SQL StatisticsBack to Top
select nvl2(stale_stats, decode(stale_stats, 'NO', 3, 1), 2) from dba_ind_statistics where owner=:1 and index_name=:2

0a2w8uvpc44aj
0bkjwu3swz0wy
0gchq3hv9w547
15aftu6tf4xd0
17jn6anhgwns5
1q3jj96ycbjtb delete from FLIGHT_ULD where FLU_ID = :1
select table_owner, table_name from all_synonyms where owner in (user, 'PUBLIC') and synonym_name=:1 and not exists ( select user, object_name from user_objects where object_name=:2 and object_type in ('TABLE', 'VIEW'))
SELECT value, type FROM v$parameter WHERE name = :1
BEGIN :1 := pack_reload.check_consistency(:2, 1, :3, :4); END;
SELECT /*+ ordered use_nl(o c cu h) index(u i_user1) index(o i_obj2) index(ci_obj#) index(cu i_col_usage$) index(h i_hh_obj#_intcol#) */ C.NAME COL_NAME, C.TYPE# COL_TYPE, C.CHARSETFORM COL_CSF, C.DEFAULT$ COL_DEF, C.NULL$ COL_NULL, C.PROPERTY COL_PROP, C.COL# COL_UNUM, C.INTCOL# COL_INUM, C.OBJ# COL_OBJ, C.SCALE COL_SCALE, H.BUCKET_CNT H_BCNT, (T.ROWCNT-H.NULL_CNT)/GREATEST(H.DISTCNT, 1) H_PFREQ, C.LENGTH COL_LEN, CU.TIMESTAMP CU_TIME, CU.EQUALITY_PREDS CU_EP, CU.EQUIJOIN_PREDS CU_EJP, CU.RANGE_PREDS CU_RP, CU.LIKE_PREDS CU_LP, CU.NONEQUIJOIN_PREDS CU_NEJP, CU.NULL_PREDS NP FROM SYS.USER$ U, SYS.OBJ$ O, SYS.TAB$ T, SYS.COL$ C, SYS.COL_USAGE$ CU, SYS.HIST_HEAD$ H WHERE :B3 = '0' AND U.NAME = :B2 AND O.OWNER# = U.USER# AND O.TYPE# = 2 AND O.NAME = :B1 AND O.OBJ# = T.OBJ# AND O.OBJ# = C.OBJ# AND C.OBJ# = CU.OBJ#(+) AND C.INTCOL# = CU.INTCOL#(+) AND C.OBJ# = H.OBJ#(+) AND C.INTCOL# = H.INTCOL#(+) UNION ALL SELECT /*+ ordered use_nl(c) */ C.KQFCONAM COL_NAME, C.KQFCODTY COL_TYPE, DECODE(C.KQFCODTY, 1, 1, 0) COL_CSF, NULL COL_DEF, 0 COL_NULL, 0 COL_PROP, C.KQFCOCNO COL_UNUM, C.KQFCOCNO COL_INUM, O.KQFTAOBJ COL_OBJ, DECODE(C.KQFCODTY, 2, -127, 0) COL_SCALE, H.BUCKET_CNT H_BCNT, (ST.ROWCNT-NULL_CNT)/GREATEST(H.DISTCNT, 1) H_PFREQ, DECODE(C.KQFCODTY, 2, 22, C.KQFCOSIZ) COL_LEN, CU.TIMESTAMP CU_TIME, CU.EQUALITY_PREDS CU_EP, CU.EQUIJOIN_PREDS CU_EJP, CU.RANGE_PREDS CU_RP, CU.LIKE_PREDS CU_LP, CU.NONEQUIJO IN_PREDS CU_NEJP, CU.NULL_PREDS NP FROM SYS.X$KQFTA O, SYS.TAB_STATS$ ST, INSERT INTO FLIGHT_ULD (FLU_ULD_OWN, FLU_HUID, FLU_GWT, FLU_TWT, FLU_NWT, FLU_VOL_PCT, FLU_AP_FR, FLU_AP_TO, FLU_GRP, FLU_REMARK, FLU_LP_REMARK, FLU_ULDT_ID, FLU_FL_ID, FLU_NAME, FLU_ULD_SERIAL_NR, FLU_SHADOW, FLU_LAST_CHANGE_BY, FLU_UHC_ID, FLU_STATUS, FLU_FRT_TD_ID, FLU_CTR_TD_ID, FLU_ACTUAL, FLU_TYPE, FLU_BT_TD_ID, FLU_TRF_TD_ID, FLU_FFL_TD_ID, FLU_TRF_FLNR, FLU_BAGS, FLU_VOL, FLU_TRAVEL, FLU_PRIORITY, FLU_NUM_OF_PIECES, FLU_SBC_TD_ID, FLU_POU, FLU_OFF_LOAD_LOCK, FLU_ON_LOAD_LOCK, FLU_ID) VALUES (:1, :2, :3, :4, :5, :6, :7, :8, :9, :10, :11, :12, :13, :14, :15, NULL, :16, :17, :18, :19, :20, :21, :22, :23, :24, :25, :26, :27, :28, :29, :30, :31, :32, :33, :34, :35, :36)
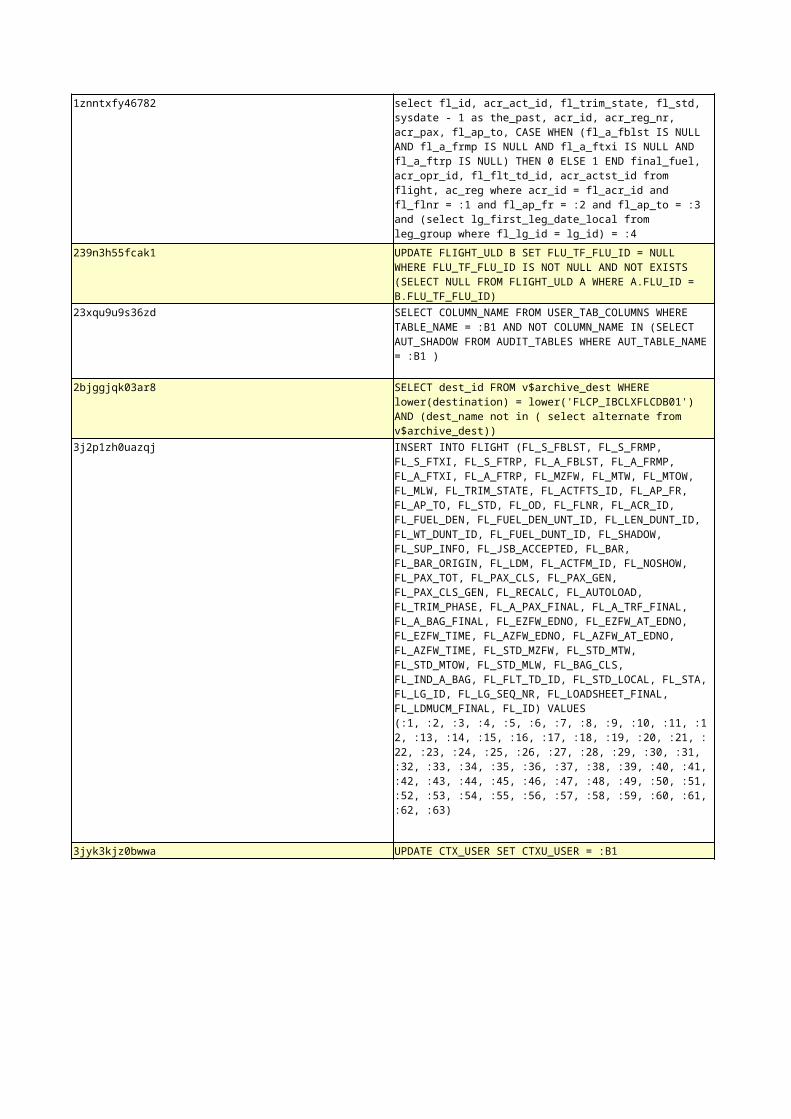
1znntxfy46782
239n3h55fcak1
23xqu9u9s36zd
2bjggjqk03ar8
3j2p1zh0uazqj
3jyk3kjz0bwwa UPDATE CTX_USER SET CTXU_USER = :B1
select fl_id, acr_act_id, fl_trim_state, fl_std, sysdate - 1 as the_past, acr_id, acr_reg_nr, acr_pax, fl_ap_to, CASE WHEN (fl_a_fblst IS NULL AND fl_a_frmp IS NULL AND fl_a_ftxi IS NULL AND fl_a_ftrp IS NULL) THEN 0 ELSE 1 END final_fuel, acr_opr_id, fl_flt_td_id, acr_actst_id from flight, ac_reg where acr_id = fl_acr_id and fl_flnr = :1 and fl_ap_fr = :2 and fl_ap_to = :3 and (select lg_first_leg_date_local from leg_group where fl_lg_id = lg_id) = :4
UPDATE FLIGHT_ULD B SET FLU_TF_FLU_ID = NULL WHERE FLU_TF_FLU_ID IS NOT NULL AND NOT EXISTS (SELECT NULL FROM FLIGHT_ULD A WHERE A.FLU_ID = B.FLU_TF_FLU_ID)
SELECT COLUMN_NAME FROM USER_TAB_COLUMNS WHERE TABLE_NAME = :B1 AND NOT COLUMN_NAME IN (SELECT AUT_SHADOW FROM AUDIT_TABLES WHERE AUT_TABLE_NAME = :B1 )
SELECT dest_id FROM v$archive_dest WHERE lower(destination) = lower('FLCP_IBCLXFLCDB01') AND (dest_name not in ( select alternate from v$archive_dest))
INSERT INTO FLIGHT (FL_S_FBLST, FL_S_FRMP, FL_S_FTXI, FL_S_FTRP, FL_A_FBLST, FL_A_FRMP, FL_A_FTXI, FL_A_FTRP, FL_MZFW, FL_MTW, FL_MTOW, FL_MLW, FL_TRIM_STATE, FL_ACTFTS_ID, FL_AP_FR, FL_AP_TO, FL_STD, FL_OD, FL_FLNR, FL_ACR_ID, FL_FUEL_DEN, FL_FUEL_DEN_UNT_ID, FL_LEN_DUNT_ID, FL_WT_DUNT_ID, FL_FUEL_DUNT_ID, FL_SHADOW, FL_SUP_INFO, FL_JSB_ACCEPTED, FL_BAR, FL_BAR_ORIGIN, FL_LDM, FL_ACTFM_ID, FL_NOSHOW, FL_PAX_TOT, FL_PAX_CLS, FL_PAX_GEN, FL_PAX_CLS_GEN, FL_RECALC, FL_AUTOLOAD, FL_TRIM_PHASE, FL_A_PAX_FINAL, FL_A_TRF_FINAL, FL_A_BAG_FINAL, FL_EZFW_EDNO, FL_EZFW_AT_EDNO, FL_EZFW_TIME, FL_AZFW_EDNO, FL_AZFW_AT_EDNO, FL_AZFW_TIME, FL_STD_MZFW, FL_STD_MTW, FL_STD_MTOW, FL_STD_MLW, FL_BAG_CLS, FL_IND_A_BAG, FL_FLT_TD_ID, FL_STD_LOCAL, FL_STA, FL_LG_ID, FL_LG_SEQ_NR, FL_LOADSHEET_FINAL, FL_LDMUCM_FINAL, FL_ID) VALUES (:1, :2, :3, :4, :5, :6, :7, :8, :9, :10, :11, :12, :13, :14, :15, :16, :17, :18, :19, :20, :21, :22, :23, :24, :25, :26, :27, :28, :29, :30, :31, :32, :33, :34, :35, :36, :37, :38, :39, :40, :41, :42, :43, :44, :45, :46, :47, :48, :49, :50, :51, :52, :53, :54, :55, :56, :57, :58, :59, :60, :61, :62, :63)
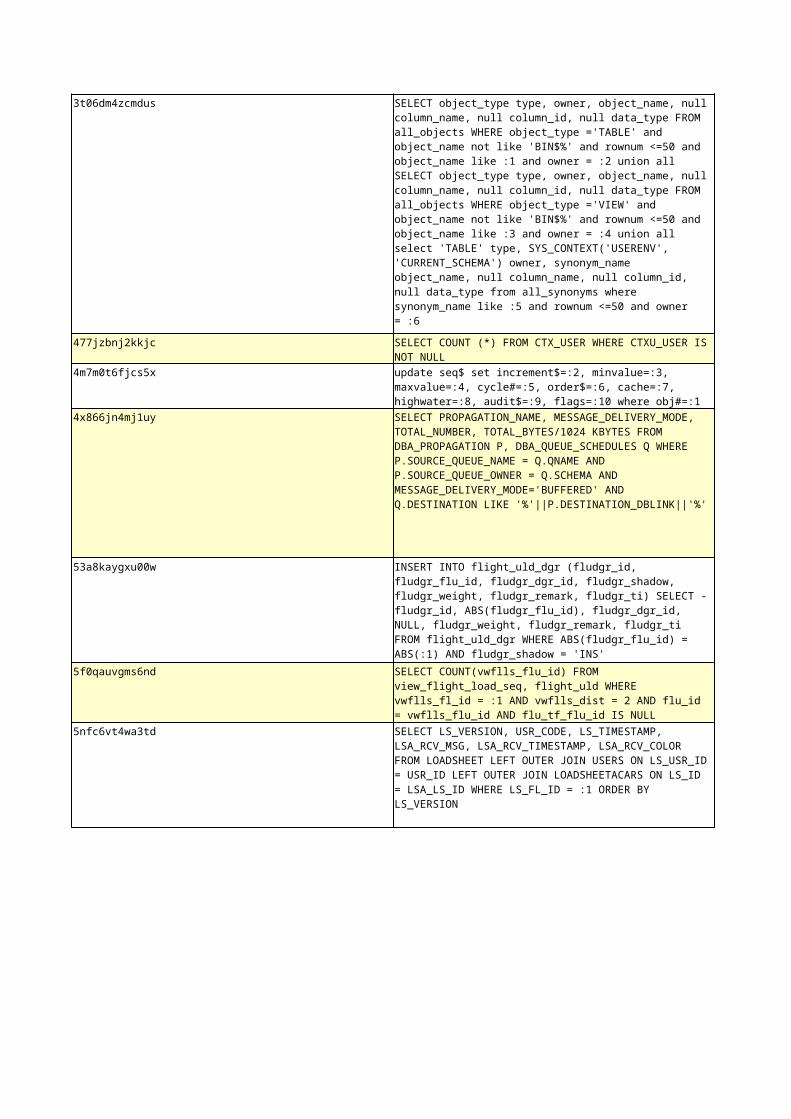
3t06dm4zcmdus
477jzbnj2kkjc
4m7m0t6fjcs5x
4x866jn4mj1uy
53a8kaygxu00w
5f0qauvgms6nd
5nfc6vt4wa3td
SELECT object_type type, owner, object_name, null column_name, null column_id, null data_type FROM all_objects WHERE object_type ='TABLE' and object_name not like 'BIN$%' and rownum <=50 and object_name like :1 and owner = :2 union all SELECT object_type type, owner, object_name, null column_name, null column_id, null data_type FROM all_objects WHERE object_type ='VIEW' and object_name not like 'BIN$%' and rownum <=50 and object_name like :3 and owner = :4 union all select 'TABLE' type, SYS_CONTEXT('USERENV', 'CURRENT_SCHEMA') owner, synonym_name object_name, null column_name, null column_id, null data_type from all_synonyms where synonym_name like :5 and rownum <=50 and owner = :6
SELECT COUNT (*) FROM CTX_USER WHERE CTXU_USER IS NOT NULL
update seq$ set increment$=:2, minvalue=:3, maxvalue=:4, cycle#=:5, order$=:6, cache=:7, highwater=:8, audit$=:9, flags=:10 where obj#=:1
SELECT PROPAGATION_NAME, MESSAGE_DELIVERY_MODE, TOTAL_NUMBER, TOTAL_BYTES/1024 KBYTES FROM DBA_PROPAGATION P, DBA_QUEUE_SCHEDULES Q WHERE P.SOURCE_QUEUE_NAME = Q.QNAME AND P.SOURCE_QUEUE_OWNER = Q.SCHEMA AND MESSAGE_DELIVERY_MODE='BUFFERED' AND Q.DESTINATION LIKE '%'||P.DESTINATION_DBLINK||'%'
INSERT INTO flight_uld_dgr (fludgr_id, fludgr_flu_id, fludgr_dgr_id, fludgr_shadow, fludgr_weight, fludgr_remark, fludgr_ti) SELECT -fludgr_id, ABS(fludgr_flu_id), fludgr_dgr_id, NULL, fludgr_weight, fludgr_remark, fludgr_ti FROM flight_uld_dgr WHERE ABS(fludgr_flu_id) = ABS(:1) AND fludgr_shadow = 'INS'
SELECT COUNT(vwflls_flu_id) FROM view_flight_load_seq, flight_uld WHERE vwflls_fl_id = :1 AND vwflls_dist = 2 AND flu_id = vwflls_flu_id AND flu_tf_flu_id IS NULL
SELECT LS_VERSION, USR_CODE, LS_TIMESTAMP, LSA_RCV_MSG, LSA_RCV_TIMESTAMP, LSA_RCV_COLOR FROM LOADSHEET LEFT OUTER JOIN USERS ON LS_USR_ID = USR_ID LEFT OUTER JOIN LOADSHEETACARS ON LS_ID = LSA_LS_ID WHERE LS_FL_ID = :1 ORDER BY LS_VERSION

5zruc4v6y32f9
69k5bhm12sz98
69x26sjrctxv8
DECLARE job BINARY_INTEGER := :job; next_date TIMESTAMP WITH TIME ZONE := :mydate; broken BOOLEAN := FALSE; job_name VARCHAR2(30) := :job_name; job_subname VARCHAR2(30) := :job_subname; job_owner VARCHAR2(30) := :job_owner; job_start TIMESTAMP WITH TIME ZONE := :job_start; job_scheduled_start TIMESTAMP WITH TIME ZONE := :job_scheduled_start; window_start TIMESTAMP WITH TIME ZONE := :window_start; window_end TIMESTAMP WITH TIME ZONE := :window_end; chain_id VARCHAR2(14) := :chainid; credential_owner varchar2(30) := :credown; credential_name varchar2(30) := :crednam; destination_owner varchar2(30) := :destown; destination_name varchar2(30) := :destnam; job_dest_id varchar2(14) := :jdestid; log_id number := :log_id; BEGIN DECLARE ename VARCHAR2(30); BEGIN ename := dbms_sqltune.execute_tuning_task( 'SYS_AUTO_SQL_TUNING_TASK'); END; :mydate := next_date; IF broken THEN :b := 1; ELSE :b := 0; END IF; END;
SELECT dbin.instance_number, dbin.db_name, dbin.instance_name, dbin.host_name, dbin.version, CASE WHEN s1.startup_time = s2.startup_time THEN 0 ELSE 1 END as bounce, CAST(s1.end_interval_time AS DATE) as begin_time, CAST(s2.end_interval_time AS DATE) as end_time, ROUND((cast( (case when s2.end_interval_time > s1.end_interval_time then s2.end_interval_time else s1.end_interval_time end) as date) - cast(s1.end_interval_time as date)) * 86400) as int_secs, CASE WHEN (s1.status <> 0 OR s2.status <> 0) THEN 1 ELSE 0 END as err_detect, round( greatest( (extract(day from s2.flush_elapsed) * 86400) + (extract(hour from s2.flush_elapsed) * 3600) + (extract(minute from s2.flush_elapsed) * 60) + extract(second from s2.flush_elapsed), (extract(day from s1.flush_elapsed) * 86400) + (extract(hour from s1.flush_elapsed) * 3600) + (extract(minute from s1.flush_elapsed) * 60) + extract(second from s1.flush_elapsed), 0 )) as max_flush_secs FROM WRM$_SNAPSHOT s1 , WRM$_DATABASE_INSTANCE dbin , WRM$_SNAPSHOT s2 WHERE s1.dbid = :dbid AND s2.dbid = :dbid AND s1.instance_number = s2.instance_number AND dbin.instance_number = s1.instance_number AND s1.snap_id = :bid AND s2.snap_id = :eid AND dbin.dbid = s1.dbid AND dbin.startup_time = s1.startup_time and dbin.instance_number = :inst
select segment_name, segment_type, extents, max_extents from sys.dba_segments where max_extents-extents<100

6by6u9hdyk1ab
6mcpb06rctk0x call dbms_space.auto_space_advisor_job_proc ( )
SELECT STEP, ORDERED_DATA_WITH_STEP.FLU_ID, ORDERED_DATA_WITH_STEP.ACTDDO_ID, ORDERED_DATA_WITH_STEP.ACTDLP_ID, ORDERED_DATA_WITH_STEP.FLC_FP_ALIGN, ORDERED_DATA_WITH_STEP.FLC_FP_ORIENTATION, ORDERED_DATA_WITH_STEP.FLC_FP_WEIGHT_DISTR, ORDERED_DATA_WITH_STEP.ACTDDO_SIDE, ORDERED_DATA_WITH_STEP.LSM_TYPE, ORDERED_DATA_WITH_STEP.LSMS_PRIORITY, ORDERED_DATA_WITH_STEP.LSMF_SEQUENCE, ORDERED_DATA_WITH_STEP.LSMF_LONG_DIRECTION, ORDERED_DATA_WITH_STEP.LSMF_LAT_DIRECTION, ORDERED_DATA_WITH_STEP.DOOR_X_FROM, ORDERED_DATA_WITH_STEP.DOOR_X_TO, ORDERED_DATA_WITH_STEP.DOOR_Y_FROM, ORDERED_DATA_WITH_STEP.DOOR_Y_TO, ORDERED_DATA_WITH_STEP.DIM_X_MIN, ORDERED_DATA_WITH_STEP.DIM_X_MAX, ORDERED_DATA_WITH_STEP.DIM_Y_MAX, ORDERED_DATA_WITH_STEP.DIM_Y_MIN, ORDERED_DATA_WITH_STEP.HOLD_MIN_X, ORDERED_DATA_WITH_STEP.HOLD_MAX_X, ORDERED_DATA_WITH_STEP.HOLD_MIN_Y, ORDERED_DATA_WITH_STEP.HOLD_MAX_Y, ORDERED_DATA_WITH_STEP.DECK_ID, ORDERED_DATA_WITH_STEP.ACTDLP_LATERAL_LOAD_INSTR FROM ( SELECT ORDERED_DATA.STEP, ORDERED_DATA.ULD_RANK, ORDERED_DATA.FLU_ID, ORDERED_DATA.ACTDDO_ID, ORDERED_DATA.ACTDDO_SIDE, ORDERED_DATA.ACTDLP_ID, ORDERED_DATA.FLC_FP_ALIGN, ORDERED_DATA.FLC_FP_ORIENTATION, ORDERED_DATA.FLC_FP_WEIGHT_DISTR, ORDERED_DATA.LSM_TYPE, ORDERED_DATA.LSMS_PRIORITY, ORDERED_DATA.LSMF_SEQUENCE, ORDERED_DATA.LSMF_LONG_DIRECTION, ORDERED_DATA.LSMF_LAT_DIRECTION, ORDERED_DATA.DOOR_X_FROM, ORDERED_DATA.DOOR_X_TO,

6wm3n4d7bnddg
72ukkfmh7y7dz
7417dx8xc2n5u
7gzxf61vj6wq4
SELECT source, (case when time_secs < 1 then 1 else time_secs end) as time_secs, operation FROM ( SELECT 1 as source, trunc((sysdate - cast(ll.log_date as date)) * 86400) as time_secs, decode(ll.operation, 'OPEN', 0 , 1 ) as operation, ll.log_id as log_id FROM DBA_SCHEDULER_WINDOW_LOG ll , ( SELECT max(l.log_id) as max_log_id FROM DBA_SCHEDULER_WINDOW_LOG l , DBA_SCHEDULER_WINGROUP_MEMBERS m WHERE l.window_name = m.window_name AND m.window_group_name = 'MAINTENANCE_WINDOW_GROUP' AND l.operation in ('OPEN', 'CLOSE') AND CAST(l.log_date AS DATE) < ( SELECT cast(min(end_interval_time) as date) as btime FROM WRM$_SNAPSHOT bsi WHERE bsi.dbid = :dbid AND bsi.instance_number = :inst AND bsi.snap_id = :bid ) ) max_log WHERE ll.log_id = max_log.max_log_id UNION ALL SELECT 2 as source, trunc((sysdate - cast(l.log_date as date)) * 86400) as time_secs, decode(l.operation, 'OPEN', 0 , 1 ) as operation, l.log_id as log_id FROM DBA_SCHEDULER_WINDOW_LOG l , DBA_SCHEDULER_WINGROUP_MEMBERS m WHERE l.window_name = m.window_name AND m.window_group_name = 'MAINTENANCE_WINDOW_GROUP' AND l.operation in ('OPEN', 'CLOSE') AND CAST(l.log_date AS DATE) <= ( SELECT cast(max(end_interval_time) as date) as etime FROM WRM$_SNAPSHOT esi WHERE esi.dbid = :dbid AND esi.instance_number = :inst AND esi.snap_id = :eid ) AND CAST(l.log_date AS DATE) >= ( SELECT cast(min(end_interval_time) as date) as btime FROM WRM$_SNAPSHOT bsi WHERE bsi.dbid = :dbid AND bsi.instance_number = :inst AND bsi.snap_id = :bid ) UNION ALL SELECT 0 as source, trunc((sysdate - UPDATE FLIGHT SET FL_S_FBLST = :1, FL_S_FRMP = :2, FL_S_FTXI = :3, FL_S_FTRP = :4, FL_A_FBLST = :5, FL_A_FRMP = :6, FL_A_FTXI = :7, FL_A_FTRP = :8, FL_MZFW = :9, FL_MTW = :10, FL_MTOW = :11, FL_MLW = :12, FL_TRIM_STATE = :13, FL_ACTFTS_ID = :14, FL_AP_FR = :15, FL_AP_TO = :16, FL_STD = :17, FL_OD = :18, FL_FLNR = :19, FL_ACR_ID = :20, FL_FUEL_DEN = :21, FL_FUEL_DEN_UNT_ID = :22, FL_LEN_DUNT_ID = :23, FL_WT_DUNT_ID = :24, FL_FUEL_DUNT_ID = :25, FL_SHADOW = :26, FL_SUP_INFO = :27, FL_JSB_ACCEPTED = :28, FL_BAR = :29, FL_BAR_ORIGIN = :30, FL_LDM = :31, FL_ACTFM_ID = :32, FL_NOSHOW = :33, FL_PAX_TOT = :34, FL_PAX_CLS = :35, FL_PAX_GEN = :36, FL_PAX_CLS_GEN = :37, FL_RECALC = :38, FL_AUTOLOAD = :39, FL_TRIM_PHASE = :40, FL_A_PAX_FINAL = :41, FL_A_TRF_FINAL = :42, FL_A_BAG_FINAL = :43, FL_EZFW_EDNO = :44, FL_EZFW_AT_EDNO = :45, FL_EZFW_TIME = :46, FL_AZFW_EDNO = :47, FL_AZFW_AT_EDNO = :48, FL_AZFW_TIME = :49, FL_STD_MZFW = :50, FL_STD_MTW = :51, FL_STD_MTOW = :52, FL_STD_MLW = :53, FL_BAG_CLS = :54, FL_IND_A_BAG = :55, FL_FLT_TD_ID = :56, FL_STD_LOCAL = :57, FL_STA = :58, FL_LG_ID = :59, FL_LG_SEQ_NR = :60, FL_LOADSHEET_FINAL = :61, FL_LDMUCM_FINAL = :62 WHERE FL_ID = :63
SELECT fludgr_id FROM flight_uld_dgr WHERE fludgr_shadow = 'UPD' AND ABS(fludgr_flu_id) = ABS(:1) AND fludgr_id < 0
SELECT ID FROM SYS.WRI$_ADV_TASKS A WHERE A.NAME = :B3 AND BITAND(A.PROPERTY, :B2 ) = :B2 AND A.OWNER# = :B1

7wt7phk4xns75
8szmwam7fysa3
8ums58rsq08u1 DELETE FROM ctx_user
9vbrvs0r5fud3
a3rjpuv67uaqp
a7a6ygz8y7762 DELETE FROM FLIGHT_ULD WHERE FLU_ID = :B1
ab3swhv5g138y
ah7s7nxmj2n5w
select a.capture_name streams_process_name, a.status streams_process_status, 'CAPTURE' streams_process_type, COUNT(a.error_message) from dba_capture a group by a.capture_name, a.status union all select a.propagation_name streams_process_name, a.status streams_process_status, 'PROPAGATION' streams_process_type, COUNT(a.error_message) from dba_propagation a group by a.propagation_name, a.status union all select a.apply_name streams_process_name, a.status streams_process_status, 'APPLY' streams_process_type, COUNT(a.error_message) from dba_apply a group by a.apply_name, a.status
insert into wri$_adv_objspace_trend_data select timepoint, space_usage, space_alloc, quality from table(dbms_space.object_growth_trend(:1, :2, :3, :4, NULL, NULL, NULL, 'FALSE', :5, 'FALSE'))
SELECT flls_flu_id, flls_pct_mac, flls_direction, flls_actdlp_id, flls_actddo_id, flls_fp_align, flls_fp_orientation, flls_fp_weight_distr, flls_id, flls_seq FROM flight_load_seq WHERE flls_fl_id = :1 AND flls_dist = :2 AND flls_seq = :3
select aul_date, b.aul_action, aul_usr_code, a.* from flight_load_seq a , audit_log b where flls_id=aul_row_pk and aul_aut_id in ( select aut_id from audit_tables where aut_table_name='FLIGHT_LOAD_SEQ' ) and flls_fl_id=3078567 order by aul_date
select OBJOID, CLSOID, RUNTIME, PRI, JOBTYPE, SCHLIM, WT, INST, RUNNOW, ENQ_SCHLIM from ( select a.obj# OBJOID, a.class_oid CLSOID, decode(bitand(a.flags, 16384), 0, a.next_run_date, a.last_enabled_time) RUNTIME, (2*a.priority + decode(bitand(a.job_status, 4), 0, 0, decode(a.running_instance, :1, -1, 1))) PRI, 1 JOBTYPE, decode(a.schedule_limit, NULL, decode(bitand(a.flags, 4194304), 4194304, p.schedule_limit, NULL), a.schedule_limit) SCHLIM, a.job_weight WT, decode(a.running_instance, NULL, 0, a.running_instance) INST, decode(bitand(a.flags, 16384), 0, 0, 1) RUNNOW, decode(bitand(a.job_status, 8388608), 0, 0, 1) ENQ_SCHLIM from sys.scheduler$_job a, sys.scheduler$_program p, v$database v, v$instance i where a.program_oid = p.obj#(+) and bitand(a.job_status, 515) = 1 and bitand(a.flags, 1048576) = 0 and ((bitand(a.flags, 134217728 + 268435456) = 0) or (bitand(a.job_status, 1024) <> 0)) and bitand(a.flags, 4096) = 0 and (a.next_run_date <= :2 or bitand(a.flags, 16384) <> 0) and a.instance_id is null and (a.class_oid is null or (a.class_oid is not null and a.class_oid in (select b.obj# from sys.scheduler$_class b where b.affinity is null))) and (a.database_role = v.database_role or (a.database_role is null and v.database_role = 'PRIMARY' )) and ( i.logins = 'ALLOWED' or bitand(a.flags, 17179869184) <> 0 ) union all select l.obj#, l.class_oid, decode(bitand(l.flags, 16384), 0, l.next_run_date, l.last_enabled_time), (2*decode(bitand(l.flags, 8589934592), 0, q.priority, SELECT COUNT(vwflls_flu_id) FROM view_flight_load_seq, flight_uld, flight_config WHERE vwflls_fl_id = :1 AND vwflls_dist = 1 AND flu_id = vwflls_flu_id AND vwflls_actdlp_id = flc_actdlp_id AND flc_flu_id = flu_id

ajud2fbak4n5q BEGIN pack_reload.deassign_position(:1, :2, :3); END;
arvad97suq7p1 BEGIN pack_audit.set_context_user(:1); END;
b6usrg82hwsa3 call dbms_stats.gather_database_stats_job_proc ( )
bghk5x23n0682
bgyq4u09zq1an
bmquxnvdftw7t
bqqwtnz5f54q4
INSERT INTO FLIGHT_ULD (FLU_ULD_OWN, FLU_HUID, FLU_GWT, FLU_TWT, FLU_NWT, FLU_VOL_PCT, FLU_AP_FR, FLU_AP_TO, FLU_GRP, FLU_REMARK, FLU_LP_REMARK, FLU_ULDT_ID, FLU_FL_ID, FLU_NAME, FLU_ULD_SERIAL_NR, FLU_SHADOW, FLU_LAST_CHANGE_BY, FLU_UHC_ID, FLU_STATUS, FLU_FRT_TD_ID, FLU_CTR_TD_ID, FLU_ACTUAL, FLU_TYPE, FLU_BT_TD_ID, FLU_TRF_TD_ID, FLU_FFL_TD_ID, FLU_TRF_FLNR, FLU_BAGS, FLU_VOL, FLU_TRAVEL, FLU_PRIORITY, FLU_NUM_OF_PIECES, FLU_SBC_TD_ID, FLU_POU, FLU_OFF_LOAD_LOCK, FLU_ON_LOAD_LOCK, FLU_ID) VALUES (:1, :2, :3, :4, :5, :6, :7, :8, :9, :10, :11, :12, :13, :14, :15, :16, 'U', :17, :18, :19, :20, :21, :22, :23, :24, :25, :26, :27, :28, :29, :30, :31, :32, :33, :34, :35, :36)
SELECT object_type type, owner, object_name, null column_name, null column_id, null data_type FROM all_objects WHERE object_type ='TABLE' and object_name not like 'BIN$%' and rownum <=50 and owner = :1 union all SELECT object_type type, owner, object_name, null column_name, null column_id, null data_type FROM all_objects WHERE object_type ='VIEW' and object_name not like 'BIN$%' and rownum <=50 and owner = :2 union all SELECT 'FUNCTION' type, owner, object_name||'.'||procedure_name object_name, null column_name, null column_id, null data_type FROM all_procedures WHERE rownum <=50 and object_type = 'PACKAGE' and procedure_name is not null and owner in('SYS', :3) and object_name = :4 union all SELECT 'COLUMN' type, owner, table_name object_name, column_name, column_id, data_type FROM sys.all_tab_cols WHERE hidden_column = 'NO' and rownum <=50 and owner = :5 and table_name = :6 union all SELECT object_type type, SYS_CONTEXT('USERENV', 'CURRENT_SCHEMA') owner, object_name, null column_name, null column_id, null data_type FROM all_objects WHERE rownum <=50 and object_name not like 'BIN$%' and object_type IN ('PROCEDURE', 'FUNCTION', 'PACKAGE') and owner = :7
SELECT value FROM v$parameter WHERE name = 'spfile'
select fl_id, acr_act_id, fl_trim_state, fl_std, sysdate - 1 as the_past, acr_id, acr_reg_nr, acr_pax, fl_ap_to, CASE WHEN (fl_a_fblst IS NULL AND fl_a_frmp IS NULL AND fl_a_ftxi IS NULL AND fl_a_ftrp IS NULL) THEN 0 ELSE 1 END final_fuel, acr_opr_id, fl_flt_td_id, acr_actst_id from flight, ac_reg where acr_id = fl_acr_id and fl_flnr = :1 and fl_ap_fr = :2 and fl_ap_to = :3 and trunc(fl_std_local) = :4

cm5vu20fhtnq1
ct2udavsj1fun
d0ckx4p2hrg91
d89c1mh5pvbkz
select /*+ connect_by_filtering */ privilege#, level from sysauth$ connect by grantee#=prior privilege# and privilege#>0 start with grantee#=:1 and privilege#>0
SELECT 'SCHEMA' type, username owner, username object_name, null column_name, null column_id, null data_type FROM all_users WHERE rownum <=50 and username like :1 union all SELECT 'COLUMN' type, owner, table_name object_name, column_name, column_id, data_type FROM sys.all_tab_cols WHERE hidden_column = 'NO' and rownum <=50 and owner = :2 and table_name = :3 union all SELECT 'COLUMN' type, owner, table_name object_name, column_name, column_id, data_type FROM sys.all_tab_cols WHERE hidden_column = 'NO' and rownum <=50 and owner = :4 and table_name = :5 union all SELECT 'COLUMN' type, owner, table_name object_name, column_name, column_id, data_type FROM sys.all_tab_cols WHERE hidden_column = 'NO' and rownum <=50 and owner = :6 and table_name = :7 and column_name like :8 union all SELECT object_type type, SYS_CONTEXT('USERENV', 'CURRENT_SCHEMA') owner, object_name, null column_name, null column_id, null data_type FROM all_objects WHERE rownum <=50 and object_name not like 'BIN$%' and object_type IN ('PROCEDURE', 'FUNCTION', 'PACKAGE') and object_name like :9
DELETE FROM flight_uld_dgr WHERE fludgr_id < 0 AND ABS(fludgr_flu_id) = ABS(:1)
SELECT /*+ rule */ U.NAME, OT.NAME, NULL, NULL, C.NAME, BITAND(H.SPARE2, 2), BITAND(H.SPARE2, 1), H.DISTCNT, H.DENSITY, H.SPARE1, H.SAMPLE_SIZE, H.NULL_CNT, H.TIMESTAMP#, H.AVGCLN, H.LOWVAL, H.HIVAL, H.MINIMUM, H.MAXIMUM, NULL, NULL, H.CACHE_CNT, HG.BUCKET, HG.ENDPOINT, HG.EPVALUE, BITAND(H.SPARE2, 4), NULL FROM SYS.USER$ U, SYS.OBJ$ OT, SYS.COL$ C, SYS.HIST_HEAD$ H, HISTGRM$ HG WHERE :B4 IS NULL AND U.NAME = :B3 AND OT.OWNER# = U.USER# AND OT.NAME = :B2 AND OT.TYPE# = 2 AND C.OBJ# = OT.OBJ# AND (:B1 IS NULL OR C.NAME = :B1 ) AND H.OBJ# = OT.OBJ# AND H.INTCOL# = C.INTCOL# AND HG.OBJ#(+) = H.OBJ# AND HG.INTCOL#(+) = H.INTCOL# UNION ALL SELECT U.NAME, OT.NAME, OP.SUBNAME, NULL, C.NAME, BITAND(H.SPARE2, 2), BITAND(H.SPARE2, 1), H.DISTCNT, H.DENSITY, H.SPARE1, H.SAMPLE_SIZE, H.NULL_CNT, H.TIMESTAMP#, H.AVGCLN, H.LOWVAL, H.HIVAL, H.MINIMUM, H.MAXIMUM, NULL, NULL, H.CACHE_CNT, HG.BUCKET, HG.ENDPOINT, HG.EPVALUE, BITAND(H.SPARE2, 4), NULL FROM SYS.USER$ U, SYS.OBJ$ OT, SYS.COL$ C, SYS.TABPART$ TP, SYS.OBJ$ OP, SYS.HIST_HEAD$ H, HISTGRM$ HG WHERE U.NAME = :B3 AND OT.OWNER# = U.USER# AND OT.NAME = :B2 AND OT.TYPE# = 2 AND C.OBJ# = OT.OBJ# AND (:B1 IS NULL OR C.NAME = :B1 ) AND TP.BO# = OT.OBJ# AND TP.OBJ# = OP.OBJ# AND ((:B4 IS NULL AND :B5 IS NOT NULL) OR OP.SUBNAME = :B4 ) AND H.OBJ# = OP.OBJ# AND H.INTCOL# = C.INTCOL# AND HG.OBJ#(+) = H.OBJ# AND HG.INTCOL#(+) = H.INTCOL# UNION ALL SELECT U.NAME, OP.NAME, OP.SUBNAME , NULL, C.NAME, BITAND(H.SPARE2, 2), BITAND(H.SPARE2, 1), H.DISTCNT, H.DENSITY,
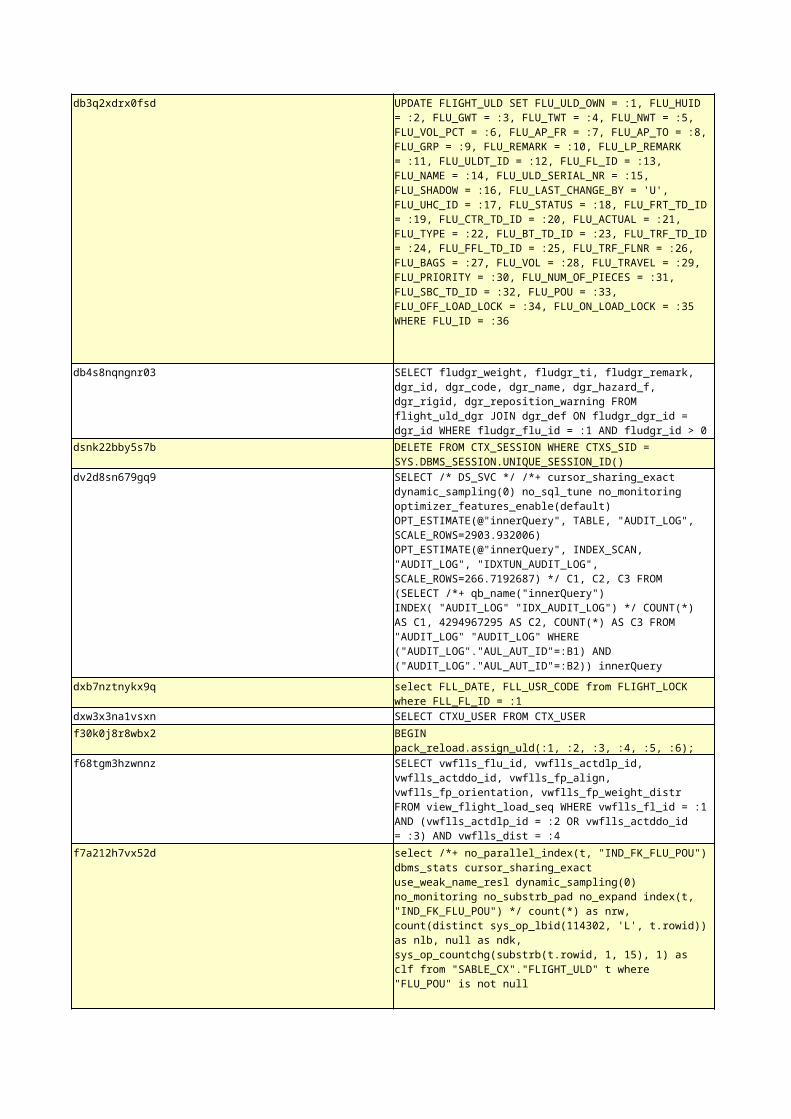
db3q2xdrx0fsd
db4s8nqngnr03
dsnk22bby5s7b
dv2d8sn679gq9
dxb7nztnykx9q
dxw3x3na1vsxn SELECT CTXU_USER FROM CTX_USER
f30k0j8r8wbx2
f68tgm3hzwnnz
f7a212h7vx52d
UPDATE FLIGHT_ULD SET FLU_ULD_OWN = :1, FLU_HUID = :2, FLU_GWT = :3, FLU_TWT = :4, FLU_NWT = :5, FLU_VOL_PCT = :6, FLU_AP_FR = :7, FLU_AP_TO = :8, FLU_GRP = :9, FLU_REMARK = :10, FLU_LP_REMARK = :11, FLU_ULDT_ID = :12, FLU_FL_ID = :13, FLU_NAME = :14, FLU_ULD_SERIAL_NR = :15, FLU_SHADOW = :16, FLU_LAST_CHANGE_BY = 'U', FLU_UHC_ID = :17, FLU_STATUS = :18, FLU_FRT_TD_ID = :19, FLU_CTR_TD_ID = :20, FLU_ACTUAL = :21, FLU_TYPE = :22, FLU_BT_TD_ID = :23, FLU_TRF_TD_ID = :24, FLU_FFL_TD_ID = :25, FLU_TRF_FLNR = :26, FLU_BAGS = :27, FLU_VOL = :28, FLU_TRAVEL = :29, FLU_PRIORITY = :30, FLU_NUM_OF_PIECES = :31, FLU_SBC_TD_ID = :32, FLU_POU = :33, FLU_OFF_LOAD_LOCK = :34, FLU_ON_LOAD_LOCK = :35 WHERE FLU_ID = :36
SELECT fludgr_weight, fludgr_ti, fludgr_remark, dgr_id, dgr_code, dgr_name, dgr_hazard_f, dgr_rigid, dgr_reposition_warning FROM flight_uld_dgr JOIN dgr_def ON fludgr_dgr_id = dgr_id WHERE fludgr_flu_id = :1 AND fludgr_id > 0
DELETE FROM CTX_SESSION WHERE CTXS_SID = SYS.DBMS_SESSION.UNIQUE_SESSION_ID()
SELECT /* DS_SVC */ /*+ cursor_sharing_exact dynamic_sampling(0) no_sql_tune no_monitoring optimizer_features_enable(default) OPT_ESTIMATE(@"innerQuery", TABLE, "AUDIT_LOG", SCALE_ROWS=2903.932006) OPT_ESTIMATE(@"innerQuery", INDEX_SCAN, "AUDIT_LOG", "IDXTUN_AUDIT_LOG", SCALE_ROWS=266.7192687) */ C1, C2, C3 FROM (SELECT /*+ qb_name("innerQuery") INDEX( "AUDIT_LOG" "IDX_AUDIT_LOG") */ COUNT(*) AS C1, 4294967295 AS C2, COUNT(*) AS C3 FROM "AUDIT_LOG" "AUDIT_LOG" WHERE ("AUDIT_LOG"."AUL_AUT_ID"=:B1) AND ("AUDIT_LOG"."AUL_AUT_ID"=:B2)) innerQuery
select FLL_DATE, FLL_USR_CODE from FLIGHT_LOCK where FLL_FL_ID = :1
BEGIN pack_reload.assign_uld(:1, :2, :3, :4, :5, :6); END;
SELECT vwflls_flu_id, vwflls_actdlp_id, vwflls_actddo_id, vwflls_fp_align, vwflls_fp_orientation, vwflls_fp_weight_distr FROM view_flight_load_seq WHERE vwflls_fl_id = :1 AND (vwflls_actdlp_id = :2 OR vwflls_actddo_id = :3) AND vwflls_dist = :4
select /*+ no_parallel_index(t, "IND_FK_FLU_POU") dbms_stats cursor_sharing_exact use_weak_name_resl dynamic_sampling(0) no_monitoring no_substrb_pad no_expand index(t, "IND_FK_FLU_POU") */ count(*) as nrw, count(distinct sys_op_lbid(114302, 'L', t.rowid)) as nlb, null as ndk, sys_op_countchg(substrb(t.rowid, 1, 15), 1) as clf from "SABLE_CX"."FLIGHT_ULD" t where "FLU_POU" is not null
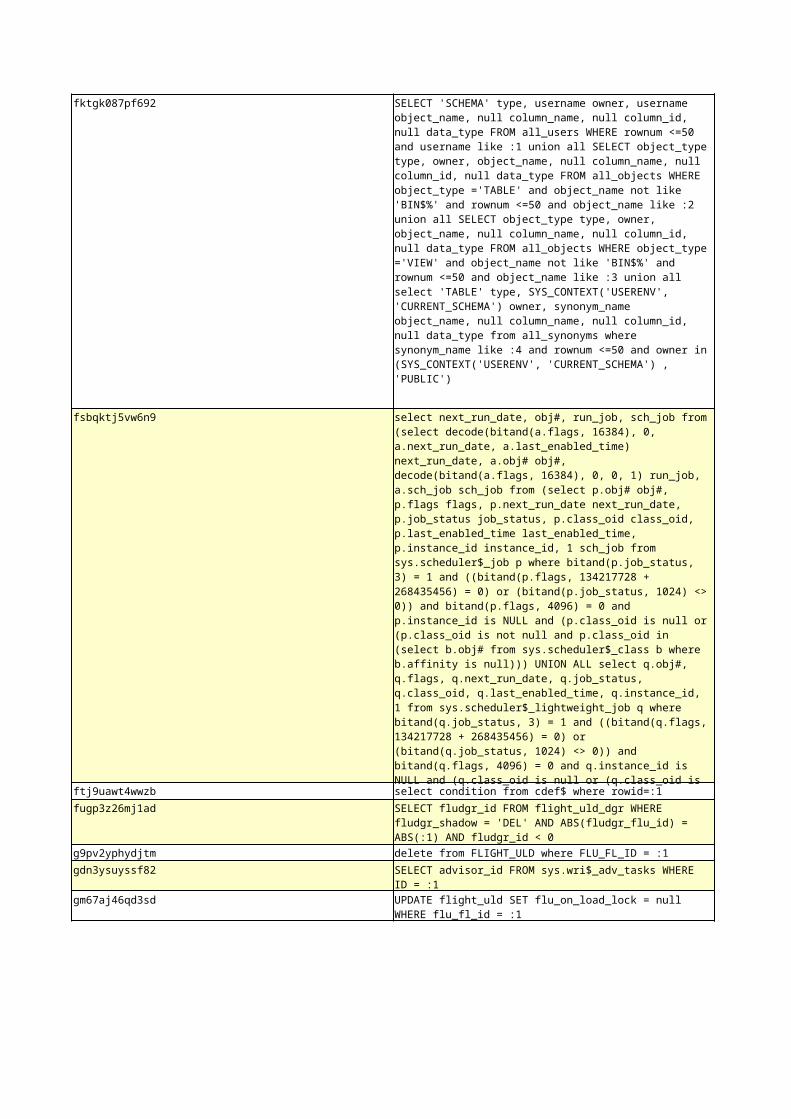
fktgk087pf692
fsbqktj5vw6n9
ftj9uawt4wwzb select condition from cdef$ where rowid=:1
fugp3z26mj1ad
g9pv2yphydjtm delete from FLIGHT_ULD where FLU_FL_ID = :1
gdn3ysuyssf82
gm67aj46qd3sd
SELECT 'SCHEMA' type, username owner, username object_name, null column_name, null column_id, null data_type FROM all_users WHERE rownum <=50 and username like :1 union all SELECT object_type type, owner, object_name, null column_name, null column_id, null data_type FROM all_objects WHERE object_type ='TABLE' and object_name not like 'BIN$%' and rownum <=50 and object_name like :2 union all SELECT object_type type, owner, object_name, null column_name, null column_id, null data_type FROM all_objects WHERE object_type ='VIEW' and object_name not like 'BIN$%' and rownum <=50 and object_name like :3 union all select 'TABLE' type, SYS_CONTEXT('USERENV', 'CURRENT_SCHEMA') owner, synonym_name object_name, null column_name, null column_id, null data_type from all_synonyms where synonym_name like :4 and rownum <=50 and owner in (SYS_CONTEXT('USERENV', 'CURRENT_SCHEMA') , 'PUBLIC')
select next_run_date, obj#, run_job, sch_job from (select decode(bitand(a.flags, 16384), 0, a.next_run_date, a.last_enabled_time) next_run_date, a.obj# obj#, decode(bitand(a.flags, 16384), 0, 0, 1) run_job, a.sch_job sch_job from (select p.obj# obj#, p.flags flags, p.next_run_date next_run_date, p.job_status job_status, p.class_oid class_oid, p.last_enabled_time last_enabled_time, p.instance_id instance_id, 1 sch_job from sys.scheduler$_job p where bitand(p.job_status, 3) = 1 and ((bitand(p.flags, 134217728 + 268435456) = 0) or (bitand(p.job_status, 1024) <> 0)) and bitand(p.flags, 4096) = 0 and p.instance_id is NULL and (p.class_oid is null or (p.class_oid is not null and p.class_oid in (select b.obj# from sys.scheduler$_class b where b.affinity is null))) UNION ALL select q.obj#, q.flags, q.next_run_date, q.job_status, q.class_oid, q.last_enabled_time, q.instance_id, 1 from sys.scheduler$_lightweight_job q where bitand(q.job_status, 3) = 1 and ((bitand(q.flags, 134217728 + 268435456) = 0) or (bitand(q.job_status, 1024) <> 0)) and bitand(q.flags, 4096) = 0 and q.instance_id is NULL and (q.class_oid is null or (q.class_oid is not null and q.class_oid in (select c.obj# from sys.scheduler$_class c where c.affinity is null))) UNION ALL select j.job, 0, from_tz(ca st(j.next_date as timestamp), to_char(systimestamp, 'TZH:TZM')), 1, NULL, from_tz(cast(j.next_date as timestamp), to_char(systimestamp, 'TZH:TZM')), NULL, 0 from sys.job$ j where (j.field1 is null or j.field1 = 0) and j.this_date is null) a order by 1) where rownum = 1
SELECT fludgr_id FROM flight_uld_dgr WHERE fludgr_shadow = 'DEL' AND ABS(fludgr_flu_id) = ABS(:1) AND fludgr_id < 0
SELECT advisor_id FROM sys.wri$_adv_tasks WHERE ID = :1
UPDATE flight_uld SET flu_on_load_lock = null WHERE flu_fl_id = :1
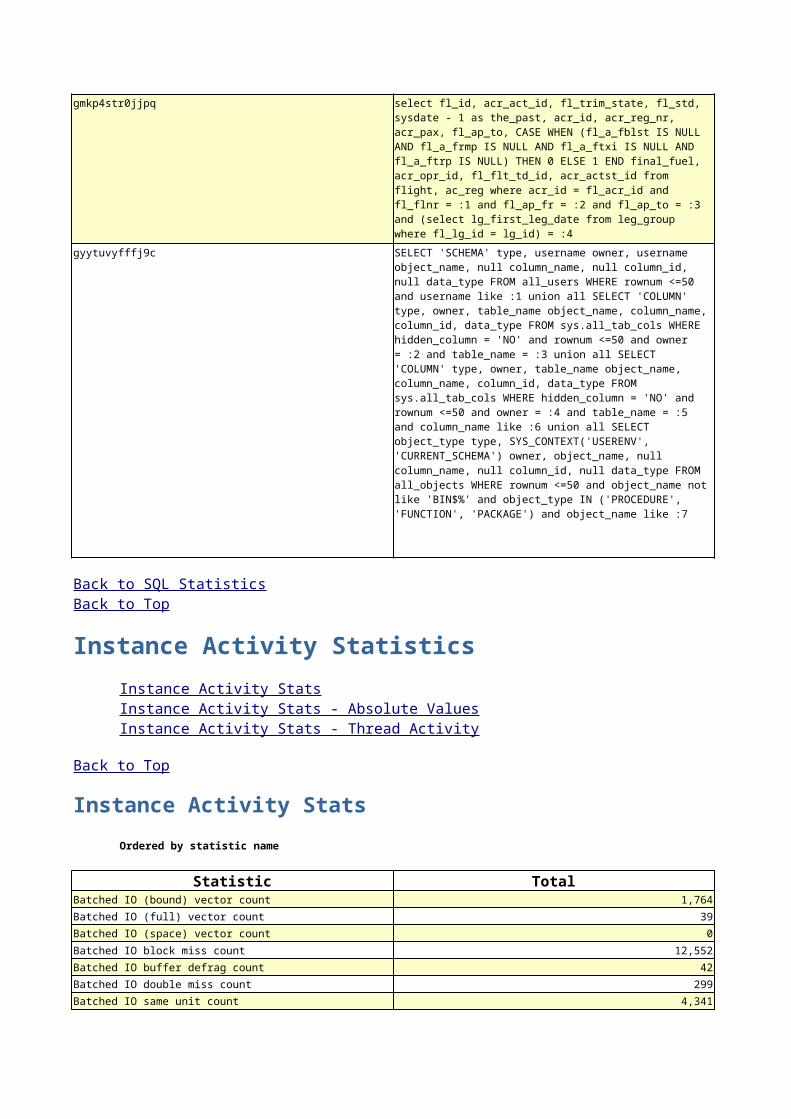
gmkp4str0jjpq
gyytuvyfffj9c
Instance Activity Statistics
Instance Activity Stats
Ordered by statistic name
Statistic TotalBatched IO (bound) vector count 1,764
Batched IO (full) vector count 39
Batched IO (space) vector count 0
Batched IO block miss count 12,552
Batched IO buffer defrag count 42
Batched IO double miss count 299
Batched IO same unit count 4,341
select fl_id, acr_act_id, fl_trim_state, fl_std, sysdate - 1 as the_past, acr_id, acr_reg_nr, acr_pax, fl_ap_to, CASE WHEN (fl_a_fblst IS NULL AND fl_a_frmp IS NULL AND fl_a_ftxi IS NULL AND fl_a_ftrp IS NULL) THEN 0 ELSE 1 END final_fuel, acr_opr_id, fl_flt_td_id, acr_actst_id from flight, ac_reg where acr_id = fl_acr_id and fl_flnr = :1 and fl_ap_fr = :2 and fl_ap_to = :3 and (select lg_first_leg_date from leg_group where fl_lg_id = lg_id) = :4
SELECT 'SCHEMA' type, username owner, username object_name, null column_name, null column_id, null data_type FROM all_users WHERE rownum <=50 and username like :1 union all SELECT 'COLUMN' type, owner, table_name object_name, column_name, column_id, data_type FROM sys.all_tab_cols WHERE hidden_column = 'NO' and rownum <=50 and owner = :2 and table_name = :3 union all SELECT 'COLUMN' type, owner, table_name object_name, column_name, column_id, data_type FROM sys.all_tab_cols WHERE hidden_column = 'NO' and rownum <=50 and owner = :4 and table_name = :5 and column_name like :6 union all SELECT object_type type, SYS_CONTEXT('USERENV', 'CURRENT_SCHEMA') owner, object_name, null column_name, null column_id, null data_type FROM all_objects WHERE rownum <=50 and object_name not like 'BIN$%' and object_type IN ('PROCEDURE', 'FUNCTION', 'PACKAGE') and object_name like :7
Back to SQL StatisticsBack to Top
Instance Activity StatsInstance Activity Stats - Absolute ValuesInstance Activity Stats - Thread Activity
Back to Top

Batched IO single block count 1,597
Batched IO slow jump count 106
Batched IO vector block count 6,654
Batched IO vector read count 251
Block Cleanout Optim referenced 4,849
CCursor + sql area evicted 154
CPU used by this session 3,472,975
CPU used when call started 3,418,700
CR blocks created 96,898
Cached Commit SCN referenced 13,999
Commit SCN cached 11,639
DB time 5,991,271
DBWR checkpoint buffers written 177,275
DBWR checkpoints 1,440
DBWR object drop buffers written 0
DBWR revisited being-written buffer 6,014
DBWR tablespace checkpoint buffers written 5,108
DBWR thread checkpoint buffers written 821
DBWR transaction table writes 5,905
DBWR undo block writes 63,339
Effective IO time 1,757,185,111
HSC Heap Segment Block Changes 1,444,451
HSC IDL Compressed Blocks 0
Heap Segment Array Inserts 3,621
Heap Segment Array Updates 852
IMU CR rollbacks 5,683
IMU Flushes 24,957
IMU Redo allocation size 155,569,156
IMU commits 111,521
IMU contention 6,030
IMU ktichg flush 1,976
IMU pool not allocated 244
IMU recursive-transaction flush 955
IMU undo allocation size 372,717,400
IMU- failed to get a private strand 244
LOB table id lookup cache misses 1
Misses for writing mapping 0
Number of read IOs issued 544,232
RowCR - row contention 328
RowCR attempts 1,419,473
RowCR hits 1,424,394
SMON posted for undo segment shrink 35
SQL*Net roundtrips to/from client 5,246,220
TBS Extension: bytes extended 0
TBS Extension: files extended 0
TBS Extension: tasks created 0
TBS Extension: tasks executed 0
active txn count during cleanout 170,430
application wait time 3,744
background checkpoints completed 33
background checkpoints started 33
background timeouts 527,021
branch node splits 33
buffer is not pinned count 34,170,156
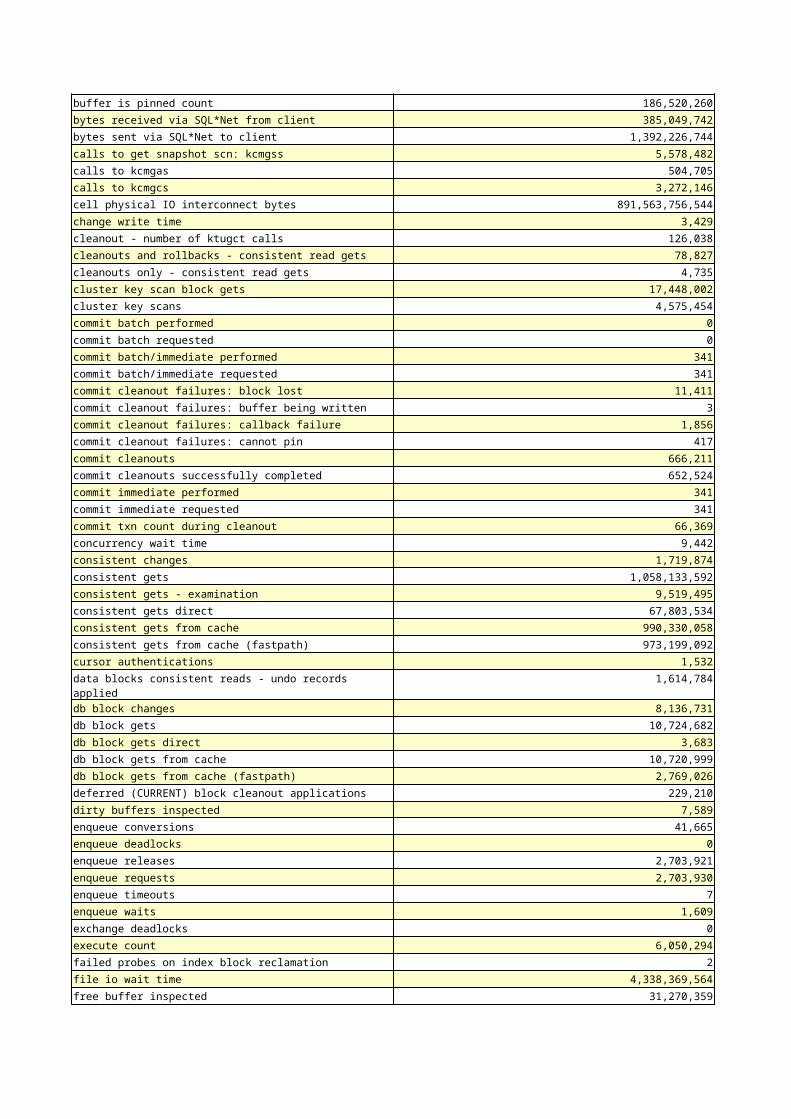
buffer is pinned count 186,520,260
bytes received via SQL*Net from client 385,049,742
bytes sent via SQL*Net to client 1,392,226,744
calls to get snapshot scn: kcmgss 5,578,482
calls to kcmgas 504,705
calls to kcmgcs 3,272,146
cell physical IO interconnect bytes 891,563,756,544
change write time 3,429
cleanout - number of ktugct calls 126,038
cleanouts and rollbacks - consistent read gets 78,827
cleanouts only - consistent read gets 4,735
cluster key scan block gets 17,448,002
cluster key scans 4,575,454
commit batch performed 0
commit batch requested 0
commit batch/immediate performed 341
commit batch/immediate requested 341
commit cleanout failures: block lost 11,411
commit cleanout failures: buffer being written 3
commit cleanout failures: callback failure 1,856
commit cleanout failures: cannot pin 417
commit cleanouts 666,211
commit cleanouts successfully completed 652,524
commit immediate performed 341
commit immediate requested 341
commit txn count during cleanout 66,369
concurrency wait time 9,442
consistent changes 1,719,874
consistent gets 1,058,133,592
consistent gets - examination 9,519,495
consistent gets direct 67,803,534
consistent gets from cache 990,330,058
consistent gets from cache (fastpath) 973,199,092
cursor authentications 1,532
data blocks consistent reads - undo records applied 1,614,784
db block changes 8,136,731
db block gets 10,724,682
db block gets direct 3,683
db block gets from cache 10,720,999
db block gets from cache (fastpath) 2,769,026
deferred (CURRENT) block cleanout applications 229,210
dirty buffers inspected 7,589
enqueue conversions 41,665
enqueue deadlocks 0
enqueue releases 2,703,921
enqueue requests 2,703,930
enqueue timeouts 7
enqueue waits 1,609
exchange deadlocks 0
execute count 6,050,294
failed probes on index block reclamation 2
file io wait time 4,338,369,564
free buffer inspected 31,270,359

free buffer requested 29,964,597
heap block compress 19,662
hot buffers moved to head of LRU 468,638
immediate (CR) block cleanout applications 83,562
immediate (CURRENT) block cleanout applications 120,850
index crx upgrade (positioned) 165
index crx upgrade (prefetch) 10
index fast full scans (full) 40,307
index fetch by key 5,775,197
index scans kdiixs1 11,525,238
java call heap collected bytes 160,328
java call heap collected count 963
java call heap gc count 3
java call heap live object count 606
java call heap live object count max 606
java call heap live size 53,696
java call heap live size max 53,696
java call heap object count 1,348
java call heap object count max 1,348
java call heap total size 2,621,440
java call heap total size max 2,621,440
java call heap used size 166,568
java call heap used size max 166,568
java session heap live size 602,112
java session heap live size max 602,112
java session heap used size 602,112
java session heap used size max 602,112
leaf node 90-10 splits 3,596
leaf node splits 8,189
lob reads 9,628
lob writes 6,910
lob writes unaligned 6,471
logons cumulative 2,203
max cf enq hold time 1,130
messages received 374,236
messages sent 374,236
min active SCN optimization applied on CR 398
no buffer to keep pinned count 93
no work - consistent read gets 1,043,166,476
non-idle wait count 10,168,574
non-idle wait time 1,218,356
opened cursors cumulative 4,344,973
parse count (describe) 51
parse count (failures) 510
parse count (hard) 4,326
parse count (total) 1,045,803
parse time cpu 31,350
parse time elapsed 37,439
physical read IO requests 2,738,934
physical read bytes 798,948,147,200
physical read total IO requests 3,291,933
physical read total bytes 883,083,706,368
physical read total multi block requests 1,360,221
physical reads 97,527,850
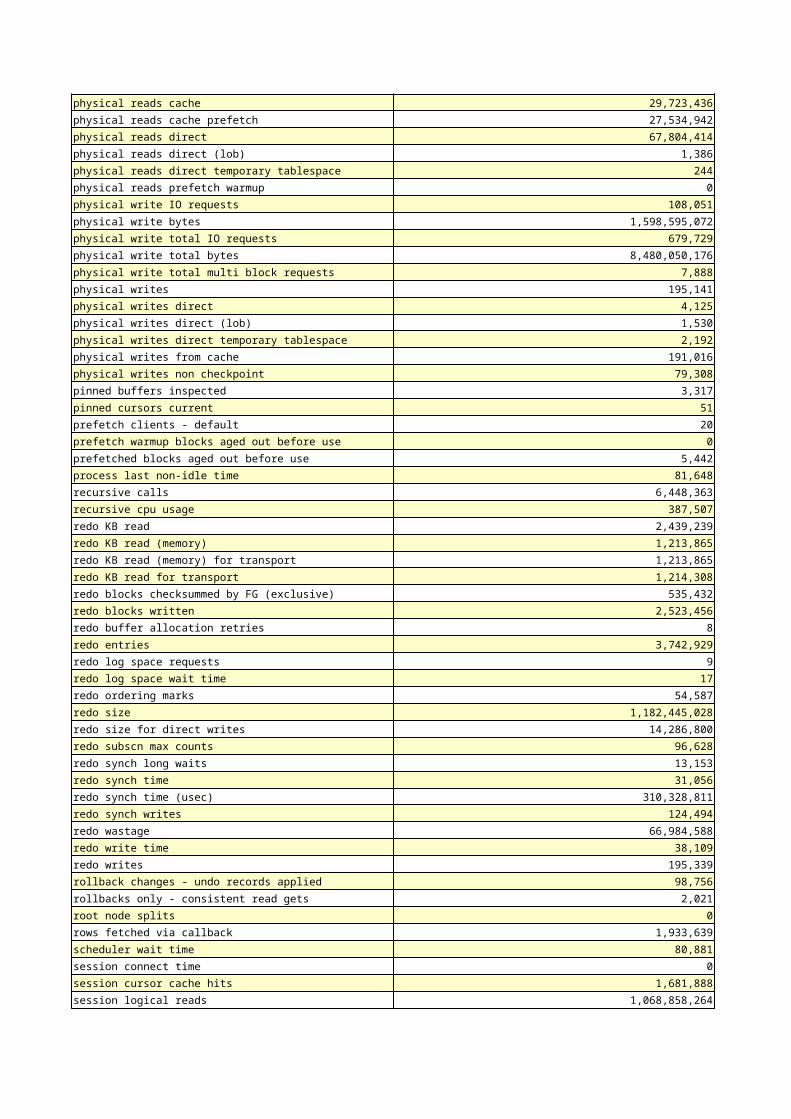
physical reads cache 29,723,436
physical reads cache prefetch 27,534,942
physical reads direct 67,804,414
physical reads direct (lob) 1,386
physical reads direct temporary tablespace 244
physical reads prefetch warmup 0
physical write IO requests 108,051
physical write bytes 1,598,595,072
physical write total IO requests 679,729
physical write total bytes 8,480,050,176
physical write total multi block requests 7,888
physical writes 195,141
physical writes direct 4,125
physical writes direct (lob) 1,530
physical writes direct temporary tablespace 2,192
physical writes from cache 191,016
physical writes non checkpoint 79,308
pinned buffers inspected 3,317
pinned cursors current 51
prefetch clients - default 20
prefetch warmup blocks aged out before use 0
prefetched blocks aged out before use 5,442
process last non-idle time 81,648
recursive calls 6,448,363
recursive cpu usage 387,507
redo KB read 2,439,239
redo KB read (memory) 1,213,865
redo KB read (memory) for transport 1,213,865
redo KB read for transport 1,214,308
redo blocks checksummed by FG (exclusive) 535,432
redo blocks written 2,523,456
redo buffer allocation retries 8
redo entries 3,742,929
redo log space requests 9
redo log space wait time 17
redo ordering marks 54,587
redo size 1,182,445,028
redo size for direct writes 14,286,800
redo subscn max counts 96,628
redo synch long waits 13,153
redo synch time 31,056
redo synch time (usec) 310,328,811
redo synch writes 124,494
redo wastage 66,984,588
redo write time 38,109
redo writes 195,339
rollback changes - undo records applied 98,756
rollbacks only - consistent read gets 2,021
root node splits 0
rows fetched via callback 1,933,639
scheduler wait time 80,881
session connect time 0
session cursor cache hits 1,681,888
session logical reads 1,068,858,264

shared hash latch upgrades - no wait 2,132,746
shared hash latch upgrades - wait 33
sorts (memory) 605,436
sorts (rows) 5,539,606,867
sql area evicted 3,142
sql area purged 607
summed dirty queue length 33,936
switch current to new buffer 68,510
table fetch by rowid 98,894,085
table fetch continued row 889,388
table scan blocks gotten 993,155,315
table scan rows gotten 294,922,711,621
table scans (direct read) 3,833
table scans (long tables) 7,625
table scans (rowid ranges) 0
table scans (short tables) 856,363
temp space allocated (bytes) 8,388,608
total cf enq hold time 34,200
total number of cf enq holders 5,203
total number of times SMON posted 178
transaction rollbacks 322
transaction tables consistent read rollbacks 0
0
undo change vector size 420,939,496
user I/O wait time 595,648
user calls 5,761,168
user commits 136,517
user rollbacks 354
workarea executions - onepass 4
workarea executions - optimal 902,254
write clones created in foreground 10
Instance Activity Stats - Absolute Values
Statistics with absolute values (should not be diffed)
Statistic Begin Valuesession pga memory max 5,318,715,768
session cursor cache count 171,156
session uga memory 7,907,825,732,904
opened cursors current 220
workarea memory allocated 1,243
logons current 66
session uga memory max 38,836,132,128
session pga memory 3,803,113,176
transaction tables consistent reads - undo records applied
Back to Instance Activity StatisticsBack to Top
Back to Instance Activity StatisticsBack to Top

Instance Activity Stats - Thread Activity
Statistics identified by '(derived)' come from sources other than SYSSTAT
Statistic Totallog switches (derived) 33
IO Stats
IOStat by Function summary
'Data' columns suffixed with M,G,T,P are in multiples of 1024 other columns suffixed with K,M,G,T,P are in multiples of 1000
ordered by (Data Read + Write) desc
Function Name Reads: DataDirect Reads 517.3G
Buffer Cache Reads 226.8G
RMAN 70.7G
Others 7.6G
LGWR 9M
DBWR 0M
Direct Writes 0M
Streams AQ 0M
TOTAL: 822.4G
IOStat by Filetype summary
'Data' columns suffixed with M,G,T,P are in multiples of 1024 other columns suffixed with K,M,G,T,P are in multiples of 1000
Small Read and Large Read are average service times, in milliseconds
Ordered by (Data Read + Write) desc
Filetype Name Reads: DataData File 813.6G
Control File 6.6G
Log File 1.2G
Back to Instance Activity StatisticsBack to Top
IOStat by Function summaryIOStat by Filetype summaryIOStat by Function/Filetype summaryTablespace IO StatsFile IO Stats
Back to Top
Back to IO StatsBack to Top

Archive Log 998M
Temp File 18M
Other 27M
TOTAL: 822.4G
IOStat by Function/Filetype summary
'Data' columns suffixed with M,G,T,P are in multiples of 1024 other columns suffixed with K,M,G,T,P are in multiples of 1000
Ordered by (Data Read + Write) desc for each function
Function/File Name Reads: DataDirect Reads 517.3G
Direct Reads (Data File) 517.3G
Buffer Cache Reads 226.8G
Buffer Cache Reads (Data File) 226.8G
RMAN 70.7G
RMAN (Data File) 69.6G
RMAN (Archive Log) 998M
RMAN (Control File) 166M
Others 7.6G
Others (Control File) 6.4G
Others (Log File) 1.2G
Others (Archive Log) 0M
Others (Data File) 5M
LGWR 9M
LGWR (Log File) 0M
LGWR (Control File) 9M
DBWR 0M
DBWR (Data File) 0M
Direct Writes 0M
Direct Writes (Data File) 0M
Streams AQ 0M
Streams AQ (Data File) 0M
TOTAL: 822.4G
Tablespace IO Stats
ordered by IOs (Reads + Writes) desc
Tablespace ReadsWB_DATA 2,736,650
UNDOTBS1 65,636
SYSAUX 44,915
SYSTEM 34,019
TEMP 81
USERS 44
Back to IO StatsBack to Top
Back to IO StatsBack to Top

File IO Stats
ordered by Tablespace, File
Tablespace FilenameSYSAUX +FLC_DATA/flcp/datafile/sysaux.257.736791025
SYSTEM +FLC_DATA/flcp/datafile/system.256.736791025
TEMP +FLC_DATA/flcp/tempfile/temp.268.736791089
UNDOTBS1 +FLC_DATA/flcp/datafile/undotbs1.258.736791025
USERS +FLC_DATA/flcp/datafile/users.259.736791025
WB_DATA +FLC_DATA/flcp/datafile/wb_data.270.736797079
WB_DATA +FLC_DATA/flcp/datafile/wb_data_01.dbf
Buffer Pool Statistics
Buffer Pool Statistics
Standard block size Pools D: default, K: keep, R: recycle
Default Pools for other block sizes: 2k, 4k, 8k, 16k, 32k
P Number of BuffersD 63,072
Checkpoint Activity
Total Physical Writes: 195,141
MTTR Writes Log Size Writes0 821
Back to IO StatsBack to Top
Back to IO StatsBack to Top
Buffer Pool StatisticsCheckpoint Activity
Back to Top
Back to Buffer Pool StatisticsBack to Top
Back to Buffer Pool StatisticsBack to Top

Advisory Statistics
Instance Recovery Stats
B: Begin Snapshot, E: End Snapshot
Targt MTTR (s)B 0
E 0
MTTR Advisory
No data exists for this section of the report.
Buffer Pool Advisory
Only rows with estimated physical reads >0 are displayed
ordered by Block Size, Buffers For Estimate
P Size for Est (M)
D 48
D 96
D 144
D 192
D 240
D 288
D 336
Instance Recovery StatsMTTR AdvisoryBuffer Pool AdvisoryPGA Aggr SummaryPGA Aggr Target StatsPGA Aggr Target HistogramPGA Memory AdvisoryShared Pool AdvisorySGA Target AdvisoryStreams Pool AdvisoryJava Pool Advisory
Back to Top
Back to Advisory StatisticsBack to Top
Back to Advisory StatisticsBack to Top

D 384
D 432
D 480
D 512
D 528
D 576
D 624
D 672
D 720
D 768
D 816
D 864
D 912
D 960
PGA Aggr Summary
PGA cache hit % - percentage of W/A (WorkArea) data processed only in-memory
PGA Cache Hit % W/A MB Processed100 1,069,637
PGA Aggr Target Stats
B: Begin Snap E: End Snap (rows dentified with B or E contain data which is absolute i.e. not diffed over the interval)
Auto PGA Target - actual workarea memory target
W/A PGA Used - amount of memory used for all Workareas (manual + auto)
%PGA W/A Mem - percentage of PGA memory allocated to workareas
%Auto W/A Mem - percentage of workarea memory controlled by Auto Mem Mgmt
%Man W/A Mem - percentage of workarea memory under manual control
PGA Aggr Target(M)B 2,656
E 2,656
PGA Aggr Target Histogram
Optimal Executions are purely in-memory operations
Low Optimal High Optimal2K 4K
64K 128K
Back to Advisory StatisticsBack to Top
Back to Advisory StatisticsBack to Top
Back to Advisory StatisticsBack to Top
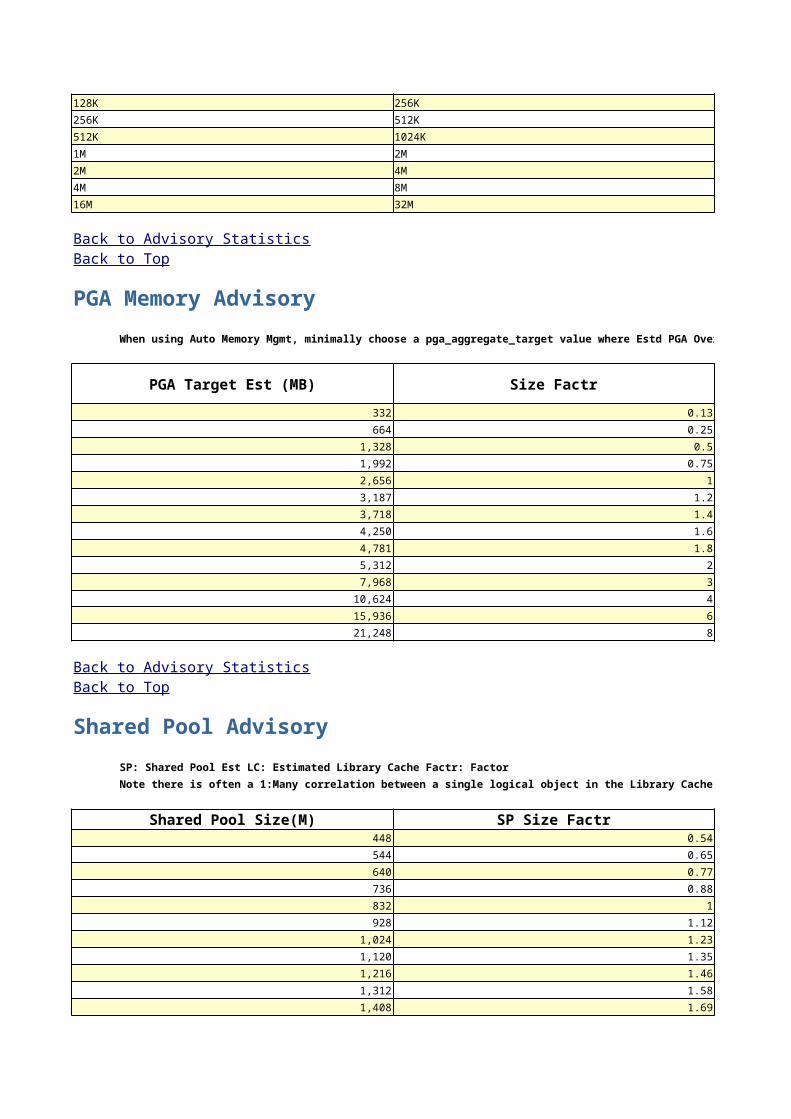
128K 256K
256K 512K
512K 1024K
1M 2M
2M 4M
4M 8M
16M 32M
PGA Memory Advisory
When using Auto Memory Mgmt, minimally choose a pga_aggregate_target value where Estd PGA Overalloc Count is 0
PGA Target Est (MB) Size Factr
332 0.13
664 0.25
1,328 0.5
1,992 0.75
2,656 1
3,187 1.2
3,718 1.4
4,250 1.6
4,781 1.8
5,312 2
7,968 3
10,624 4
15,936 6
21,248 8
Shared Pool Advisory
SP: Shared Pool Est LC: Estimated Library Cache Factr: Factor
Note there is often a 1:Many correlation between a single logical object in the Library Cache, and the physical number of memory objects associated with it. Therefore comparing the number of Lib Cache objects (e.g. in v$librarycache), with the number of Lib Cache Memory Objects is invalid.
Shared Pool Size(M) SP Size Factr448 0.54
544 0.65
640 0.77
736 0.88
832 1
928 1.12
1,024 1.23
1,120 1.35
1,216 1.46
1,312 1.58
1,408 1.69
Back to Advisory StatisticsBack to Top
Back to Advisory StatisticsBack to Top

1,504 1.81
1,600 1.92
1,696 2.04
SGA Target Advisory
SGA Target Size (M) SGA Size Factor768 0.5
1,152 0.75
1,536 1
1,920 1.25
2,304 1.5
2,688 1.75
3,072 2
Streams Pool Advisory
Size for Est (MB) Size Factor16 1
32 2
48 3
64 4
80 5
96 6
112 7
128 8
144 9
160 10
176 11
192 12
208 13
224 14
240 15
256 16
272 17
288 18
304 19
320 20
Java Pool Advisory
Java Pool Size(M) JP Size Factr
Back to Advisory StatisticsBack to Top
Back to Advisory StatisticsBack to Top
Back to Advisory StatisticsBack to Top
32 1
48 1.5
64 2
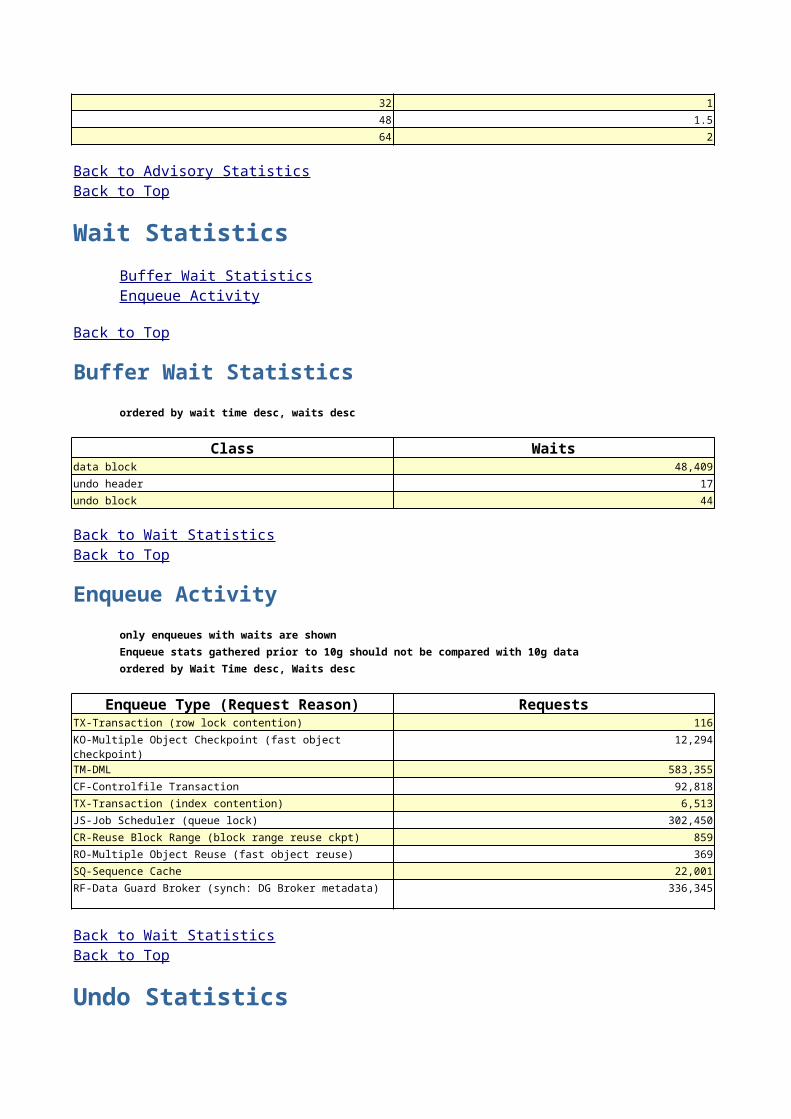
Wait Statistics
Buffer Wait Statistics
ordered by wait time desc, waits desc
Class Waitsdata block 48,409
undo header 17
undo block 44
Enqueue Activity
only enqueues with waits are shown
Enqueue stats gathered prior to 10g should not be compared with 10g data
ordered by Wait Time desc, Waits desc
Enqueue Type (Request Reason) RequestsTX-Transaction (row lock contention) 116
KO-Multiple Object Checkpoint (fast object checkpoint) 12,294
TM-DML 583,355
CF-Controlfile Transaction 92,818
TX-Transaction (index contention) 6,513
JS-Job Scheduler (queue lock) 302,450
CR-Reuse Block Range (block range reuse ckpt) 859
RO-Multiple Object Reuse (fast object reuse) 369
SQ-Sequence Cache 22,001
RF-Data Guard Broker (synch: DG Broker metadata) 336,345
Undo Statistics
Back to Advisory StatisticsBack to Top
Buffer Wait StatisticsEnqueue Activity
Back to Top
Back to Wait StatisticsBack to Top
Back to Wait StatisticsBack to Top
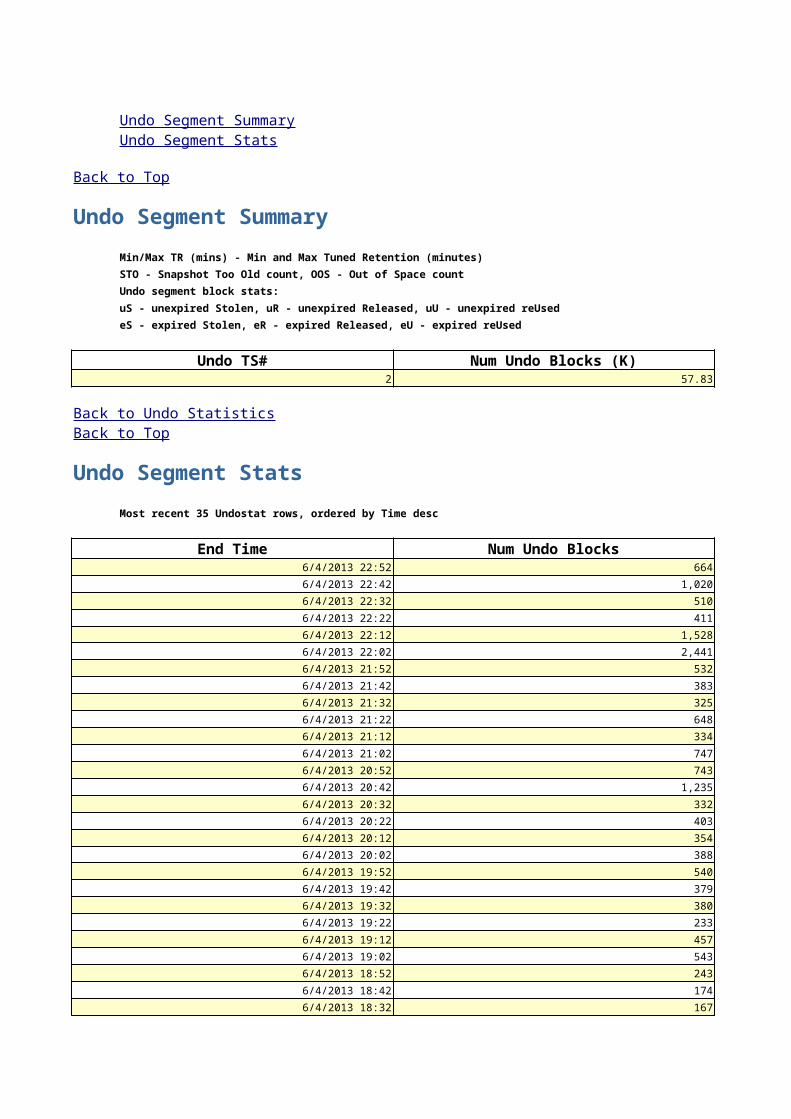
Undo Segment Summary
Min/Max TR (mins) - Min and Max Tuned Retention (minutes)
STO - Snapshot Too Old count, OOS - Out of Space count
Undo segment block stats:
uS - unexpired Stolen, uR - unexpired Released, uU - unexpired reUsed
eS - expired Stolen, eR - expired Released, eU - expired reUsed
Undo TS# Num Undo Blocks (K)2 57.83
Undo Segment Stats
Most recent 35 Undostat rows, ordered by Time desc
End Time Num Undo Blocks6/4/2013 22:52 664
6/4/2013 22:42 1,020
6/4/2013 22:32 510
6/4/2013 22:22 411
6/4/2013 22:12 1,528
6/4/2013 22:02 2,441
6/4/2013 21:52 532
6/4/2013 21:42 383
6/4/2013 21:32 325
6/4/2013 21:22 648
6/4/2013 21:12 334
6/4/2013 21:02 747
6/4/2013 20:52 743
6/4/2013 20:42 1,235
6/4/2013 20:32 332
6/4/2013 20:22 403
6/4/2013 20:12 354
6/4/2013 20:02 388
6/4/2013 19:52 540
6/4/2013 19:42 379
6/4/2013 19:32 380
6/4/2013 19:22 233
6/4/2013 19:12 457
6/4/2013 19:02 543
6/4/2013 18:52 243
6/4/2013 18:42 174
6/4/2013 18:32 167
Undo Segment SummaryUndo Segment Stats
Back to Top
Back to Undo StatisticsBack to Top

6/4/2013 18:22 419
6/4/2013 18:12 548
6/4/2013 18:02 931
6/4/2013 17:52 439
6/4/2013 17:42 120
6/4/2013 17:32 578
6/4/2013 17:22 715
Latch Statistics
Latch Activity
"Get Requests", "Pct Get Miss" and "Avg Slps/Miss" are statistics for willing-to-wait latch get requests
"NoWait Requests", "Pct NoWait Miss" are for no-wait latch get requests
"Pct Misses" for both should be very close to 0.0
Latch Name Get RequestsAQ deq hash table latch 92
ASM Keyed state latch 3,843
ASM allocation 109,646
ASM db client latch 167,676
ASM map headers 69,571
ASM map load waiting list 11,606
ASM map operation freelist 5,073
ASM map operation hash table 31,954,618
ASM network background latch 140,663
ASM network state latch 33,189
AWR Alerted Metric Element list 651,024
Change Notification Hash table latch 27,659
Consistent RBA 195,379
DML lock allocation 4,811,719
DMON Work Queues Latch 17,142
Event Group Locks 2,016
FAL Queue 3,654
FIB s.o chain latch 23,242
FOB s.o list latch 32,324
File State Object Pool Parent Latch 92
I/O Staticstics latch 92
IPC stats buffer allocation latch 92
Back to Undo StatisticsBack to Top
Latch ActivityLatch Sleep BreakdownLatch Miss SourcesMutex Sleep SummaryParent Latch StatisticsChild Latch Statistics
Back to Top

In memory undo latch 1,251,842
JOX JIT latch 1
JOX SGA heap latch 913
JS Sh mem access 214
JS broadcast autostart latch 1
JS mem alloc latch 388
JS queue access latch 480
JS queue state obj latch 604,900
JS slv state obj latch 2,124
KFC FX Hash Latch 92
KFC Hash Latch 92
KFCL LE Freelist 92
KFK SGA Libload latch 2,998
KFMD SGA 104
KGNFS-NFS:SHM structure 92
KGNFS-NFS:SVR LIST 92
KJC message pool free list 92
KJCT flow control latch 92
KMG MMAN ready and startup request latch 27,698
KMG resize request state object freelist 2
KTF sga latch 443
KWQMN job cache list latch 34
KWQP Prop Status 46
KWQS pqsubs latch 138
KWQS pqueue ctx latch 414
LGWR NS Write 391,653
Locator state objects pool parent latch 92
Lsod array latch 25,966
MQL Tracking Latch 0
Memory Management Latch 240
Memory Queue 92
Memory Queue Message Subscriber #1 92
Memory Queue Message Subscriber #2 92
Memory Queue Message Subscriber #3 92
Memory Queue Message Subscriber #4 92
Memory Queue Subscriber 92
MinActiveScn Latch 920
Mutex 92
Mutex Stats 92
NLS data objects 3
NSV command ID generation latch 1,657
NSV creation/termination latch 1,657
OS process 11,717
OS process allocation 172,415
OS process: request allocation 3,843
PL/SQL warning settings 58,248
PX hash array latch 92
QMT 92
RSM process latch 8,282
Real-time plan statistics latch 49,311
Request id generation latch 5,254
Reserved Space Latch 132
SGA IO buffer pool latch 74
SGA blob parent 92
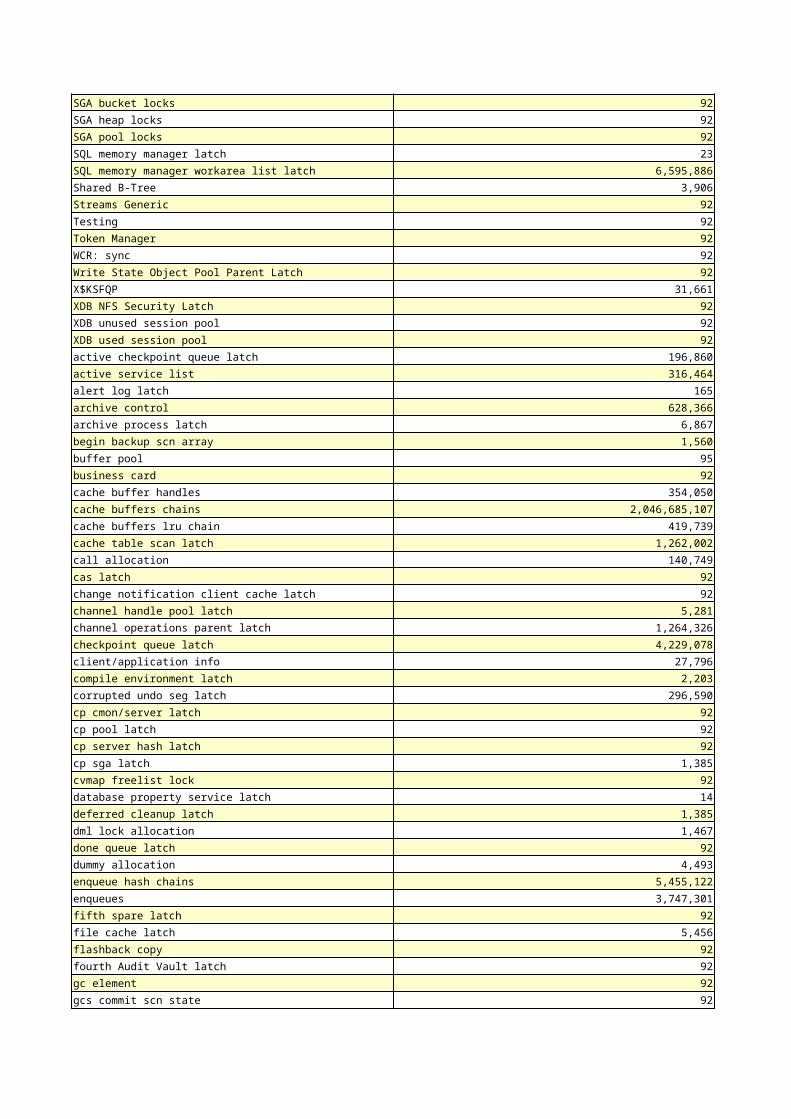
SGA bucket locks 92
SGA heap locks 92
SGA pool locks 92
SQL memory manager latch 23
SQL memory manager workarea list latch 6,595,886
Shared B-Tree 3,906
Streams Generic 92
Testing 92
Token Manager 92
WCR: sync 92
Write State Object Pool Parent Latch 92
X$KSFQP 31,661
XDB NFS Security Latch 92
XDB unused session pool 92
XDB used session pool 92
active checkpoint queue latch 196,860
active service list 316,464
alert log latch 165
archive control 628,366
archive process latch 6,867
begin backup scn array 1,560
buffer pool 95
business card 92
cache buffer handles 354,050
cache buffers chains 2,046,685,107
cache buffers lru chain 419,739
cache table scan latch 1,262,002
call allocation 140,749
cas latch 92
change notification client cache latch 92
channel handle pool latch 5,281
channel operations parent latch 1,264,326
checkpoint queue latch 4,229,078
client/application info 27,796
compile environment latch 2,203
corrupted undo seg latch 296,590
cp cmon/server latch 92
cp pool latch 92
cp server hash latch 92
cp sga latch 1,385
cvmap freelist lock 92
database property service latch 14
deferred cleanup latch 1,385
dml lock allocation 1,467
done queue latch 92
dummy allocation 4,493
enqueue hash chains 5,455,122
enqueues 3,747,301
fifth spare latch 92
file cache latch 5,456
flashback copy 92
fourth Audit Vault latch 92
gc element 92
gcs commit scn state 92

gcs partitioned table hash 92
gcs pcm hashed value bucket hash 92
gcs resource freelist 92
gcs resource hash 92
gcs resource scan list 92
gcs shadows freelist 92
ges domain table 92
ges enqueue table freelist 92
ges group table 92
ges process hash list 92
ges process parent latch 92
ges resource hash list 92
ges resource scan list 92
ges resource table freelist 92
ges value block free list 92
global KZLD latch for mem in SGA 829
global ctx hash table latch 1
global tx hash mapping 92
granule operation 92
hash table column usage latch 3,776
hash table modification latch 2,364
heartbeat check 92
internal temp table object number allocation latch 69
interrupt manipulation 8
intra txn parallel recovery 92
io pool granule metadata list 92
job workq parent latch 371
job_queue_processes free list latch 841
job_queue_processes parameter latch 18,264
k2q lock allocation 92
kcbtsemkid latch 33
kdlx hb parent latch 92
kgb parent 92
kgnfs mount latch 92
kmcptab latch 6
kmcpvec latch 0
kokc descriptor allocation latch 334
krbmrosl 201
ksfv messages 92
ksim group membership cache 92
kss move lock 1,038
ksuosstats global area 5,589
ksv allocation latch 3,277
ksv class latch 200,557
ksv instance latch 656
ksv msg queue latch 23,153
ksz_so allocation latch 3,843
ktm global data 1,615
kwqbsn:qsga 3,233
lgwr LWN SCN 196,920
list of block allocation 22,867
loader state object freelist 36,360
lob segment dispenser latch 92
lob segment hash table latch 368
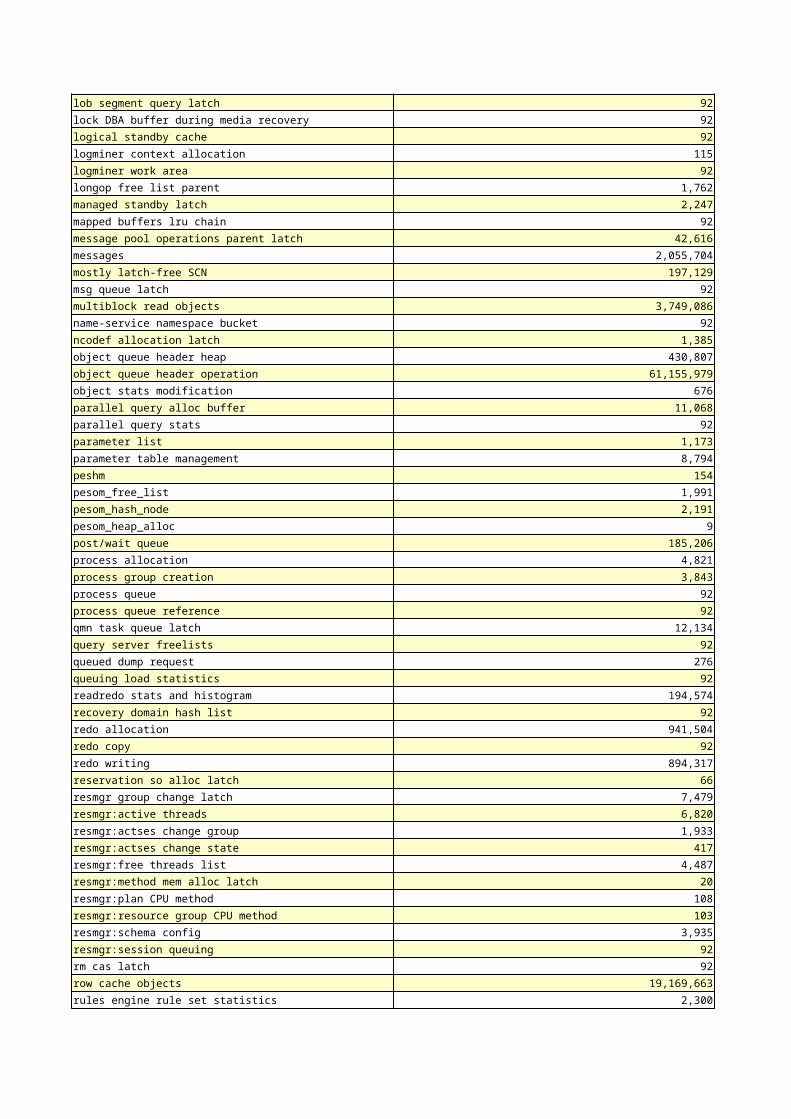
lob segment query latch 92
lock DBA buffer during media recovery 92
logical standby cache 92
logminer context allocation 115
logminer work area 92
longop free list parent 1,762
managed standby latch 2,247
mapped buffers lru chain 92
message pool operations parent latch 42,616
messages 2,055,704
mostly latch-free SCN 197,129
msg queue latch 92
multiblock read objects 3,749,086
name-service namespace bucket 92
ncodef allocation latch 1,385
object queue header heap 430,807
object queue header operation 61,155,979
object stats modification 676
parallel query alloc buffer 11,068
parallel query stats 92
parameter list 1,173
parameter table management 8,794
peshm 154
pesom_free_list 1,991
pesom_hash_node 2,191
pesom_heap_alloc 9
post/wait queue 185,206
process allocation 4,821
process group creation 3,843
process queue 92
process queue reference 92
qmn task queue latch 12,134
query server freelists 92
queued dump request 276
queuing load statistics 92
readredo stats and histogram 194,574
recovery domain hash list 92
redo allocation 941,504
redo copy 92
redo writing 894,317
reservation so alloc latch 66
resmgr group change latch 7,479
resmgr:active threads 6,820
resmgr:actses change group 1,933
resmgr:actses change state 417
resmgr:free threads list 4,487
resmgr:method mem alloc latch 20
resmgr:plan CPU method 108
resmgr:resource group CPU method 103
resmgr:schema config 3,935
resmgr:session queuing 92
rm cas latch 92
row cache objects 19,169,663
rules engine rule set statistics 2,300
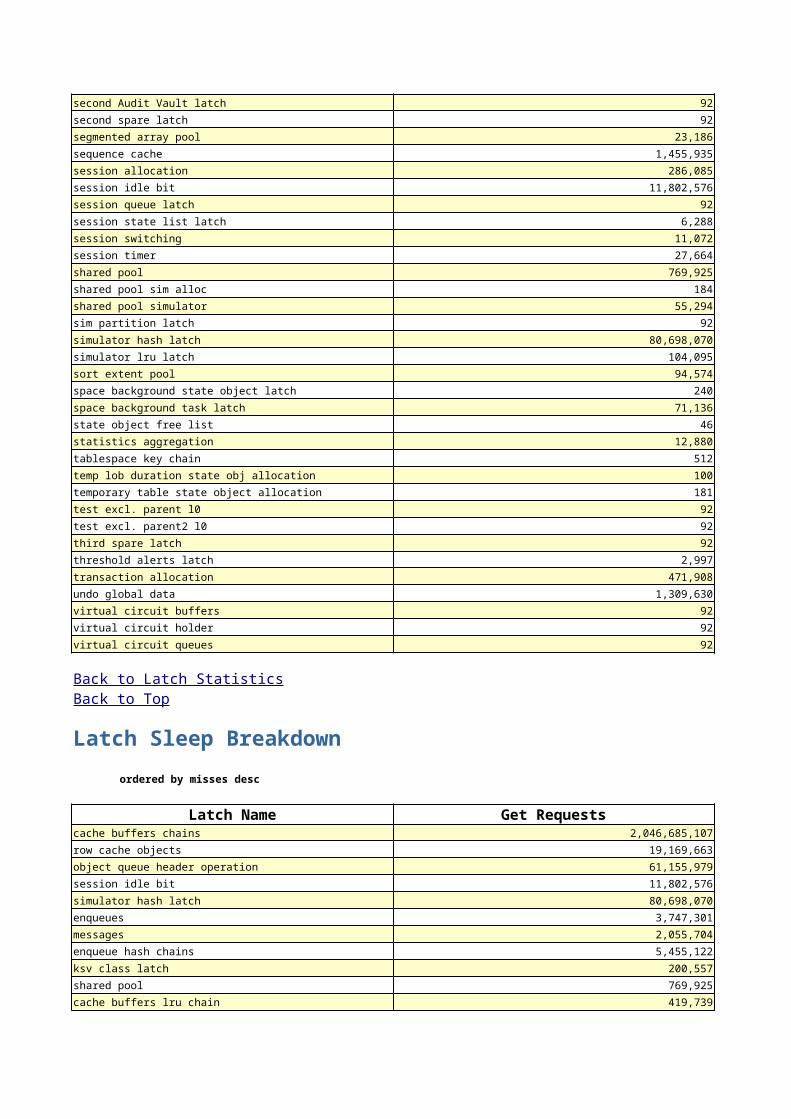
second Audit Vault latch 92
second spare latch 92
segmented array pool 23,186
sequence cache 1,455,935
session allocation 286,085
session idle bit 11,802,576
session queue latch 92
session state list latch 6,288
session switching 11,072
session timer 27,664
shared pool 769,925
shared pool sim alloc 184
shared pool simulator 55,294
sim partition latch 92
simulator hash latch 80,698,070
simulator lru latch 104,095
sort extent pool 94,574
space background state object latch 240
space background task latch 71,136
state object free list 46
statistics aggregation 12,880
tablespace key chain 512
temp lob duration state obj allocation 100
temporary table state object allocation 181
test excl. parent l0 92
test excl. parent2 l0 92
third spare latch 92
threshold alerts latch 2,997
transaction allocation 471,908
undo global data 1,309,630
virtual circuit buffers 92
virtual circuit holder 92
virtual circuit queues 92
Latch Sleep Breakdown
ordered by misses desc
Latch Name Get Requestscache buffers chains 2,046,685,107
row cache objects 19,169,663
object queue header operation 61,155,979
session idle bit 11,802,576
simulator hash latch 80,698,070
enqueues 3,747,301
messages 2,055,704
enqueue hash chains 5,455,122
ksv class latch 200,557
shared pool 769,925
cache buffers lru chain 419,739
Back to Latch StatisticsBack to Top
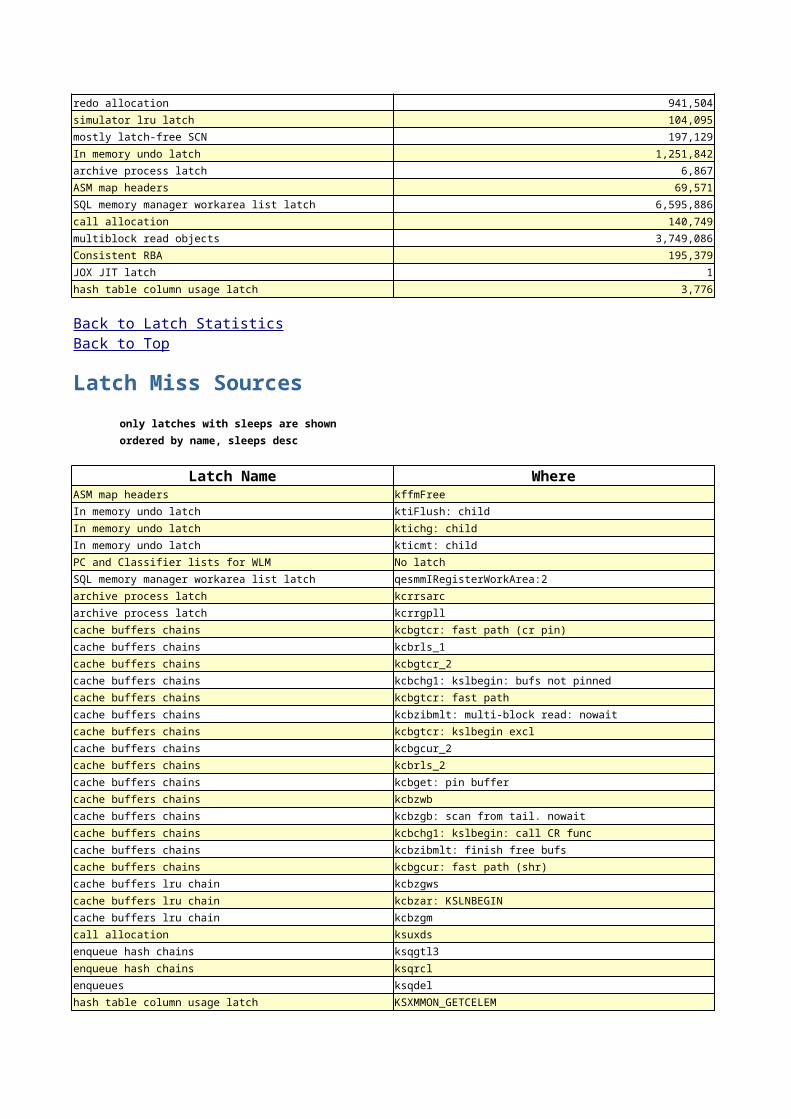
redo allocation 941,504
simulator lru latch 104,095
mostly latch-free SCN 197,129
In memory undo latch 1,251,842
archive process latch 6,867
ASM map headers 69,571
SQL memory manager workarea list latch 6,595,886
call allocation 140,749
multiblock read objects 3,749,086
Consistent RBA 195,379
JOX JIT latch 1
hash table column usage latch 3,776
Latch Miss Sources
only latches with sleeps are shown
ordered by name, sleeps desc
Latch Name WhereASM map headers kffmFree
In memory undo latch ktiFlush: child
In memory undo latch ktichg: child
In memory undo latch kticmt: child
PC and Classifier lists for WLM No latch
SQL memory manager workarea list latch qesmmIRegisterWorkArea:2
archive process latch kcrrsarc
archive process latch kcrrgpll
cache buffers chains kcbgtcr: fast path (cr pin)
cache buffers chains kcbrls_1
cache buffers chains kcbgtcr_2
cache buffers chains kcbchg1: kslbegin: bufs not pinned
cache buffers chains kcbgtcr: fast path
cache buffers chains kcbzibmlt: multi-block read: nowait
cache buffers chains kcbgtcr: kslbegin excl
cache buffers chains kcbgcur_2
cache buffers chains kcbrls_2
cache buffers chains kcbget: pin buffer
cache buffers chains kcbzwb
cache buffers chains kcbzgb: scan from tail. nowait
cache buffers chains kcbchg1: kslbegin: call CR func
cache buffers chains kcbzibmlt: finish free bufs
cache buffers chains kcbgcur: fast path (shr)
cache buffers lru chain kcbzgws
cache buffers lru chain kcbzar: KSLNBEGIN
cache buffers lru chain kcbzgm
call allocation ksuxds
enqueue hash chains ksqgtl3
enqueue hash chains ksqrcl
enqueues ksqdel
hash table column usage latch KSXMMON_GETCELEM
Back to Latch StatisticsBack to Top

ksv class latch ksvclsl: rdp - recycle
ksv class latch ksvclsl: checkpool
lgwr LWN SCN kcs023
messages ksaamb: after wakeup
mostly latch-free SCN kcsnew_scn_rba
multiblock read objects kcbzibmlt: normal mbr free
object queue header operation kcbo_link_q
object queue header operation kcbo_service_ockpt
object queue header operation kcbo_switch_cq
redo allocation kcrfw_redo_gen: redo allocation 1
redo allocation kcrfw_redo_gen: redo allocation 3
resmgr:resource group CPU method kgkprrpicknext
row cache objects kqreqd: reget
row cache objects kqrpre: find obj
session idle bit ksupuc: clear busy
session idle bit ksupuc: set busy
shared pool kghalo
shared pool kghupr1
shared pool kghfre
shared pool kghfrunp: clatch: nowait
simulator hash latch kcbsacc: lookup dba
simulator hash latch kcbs_lookup_setid: lookup dba
simulator hash latch kcbsacc: remove dba
simulator lru latch kcbs_simulate: simulate set
Mutex Sleep Summary
ordered by number of sleeps desc
Mutex Type LocationLibrary Cache kglpndl1 95
Library Cache kglhdgn2 106
Library Cache kglpnal1 90
Library Cache kglpin1 4
Cursor Pin kksfbc [KKSCHLFSP2]
Cursor Pin kksLockDelete [KKSCHLPIN6]
Cursor Pin kkslce [KKSCHLPIN2]
Library Cache kglReleaseHandleReference 125
Library Cache kglobpn1 71
Parent Latch Statistics
No data exists for this section of the report.
Back to Latch StatisticsBack to Top
Back to Latch StatisticsBack to Top
Back to Latch StatisticsBack to Top
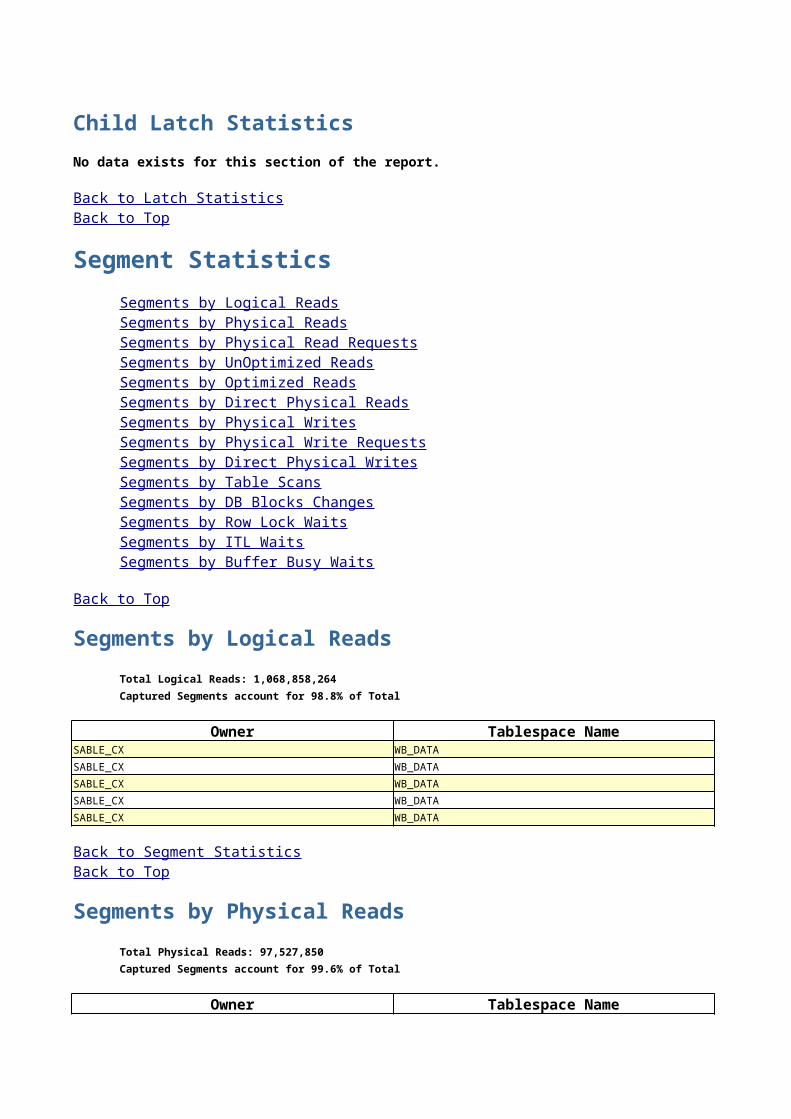
Child Latch Statistics
No data exists for this section of the report.
Segment Statistics
Segments by Logical Reads
Total Logical Reads: 1,068,858,264
Captured Segments account for 98.8% of Total
Owner Tablespace NameSABLE_CX WB_DATA
SABLE_CX WB_DATA
SABLE_CX WB_DATA
SABLE_CX WB_DATA
SABLE_CX WB_DATA
Segments by Physical Reads
Total Physical Reads: 97,527,850
Captured Segments account for 99.6% of Total
Owner Tablespace Name
Back to Latch StatisticsBack to Top
Segments by Logical ReadsSegments by Physical ReadsSegments by Physical Read RequestsSegments by UnOptimized ReadsSegments by Optimized ReadsSegments by Direct Physical ReadsSegments by Physical WritesSegments by Physical Write RequestsSegments by Direct Physical WritesSegments by Table ScansSegments by DB Blocks ChangesSegments by Row Lock WaitsSegments by ITL WaitsSegments by Buffer Busy Waits
Back to Top
Back to Segment StatisticsBack to Top

SABLE_CX WB_DATA
SABLE_CX WB_DATA
SABLE_CX WB_DATA
SYS SYSTEM
SABLE_CX WB_DATA
Segments by Physical Read Requests
Total Physical Read Requests: 2,738,934
Captured Segments account for 96.3% of Total
Owner Tablespace NameSABLE_CX WB_DATA
SABLE_CX WB_DATA
SABLE_CX WB_DATA
SABLE_CX WB_DATA
SABLE_CX WB_DATA
Segments by UnOptimized Reads
Total UnOptimized Read Requests: 2,738,934
Captured Segments account for 96.3% of Total
Owner Tablespace NameSABLE_CX WB_DATA
SABLE_CX WB_DATA
SABLE_CX WB_DATA
SABLE_CX WB_DATA
SABLE_CX WB_DATA
Segments by Optimized Reads
No data exists for this section of the report.
Segments by Direct Physical Reads
Total Direct Physical Reads: 67,804,414
Captured Segments account for 99.7% of Total
Back to Segment StatisticsBack to Top
Back to Segment StatisticsBack to Top
Back to Segment StatisticsBack to Top
Back to Segment StatisticsBack to Top

Owner Tablespace NameSABLE_CX WB_DATA
SABLE_CX WB_DATA
SABLE_CX WB_DATA
SYS SYSTEM
SYS SYSTEM
Segments by Physical Writes
Total Physical Writes: 195,141
Captured Segments account for 43.0% of Total
Owner Tablespace NameSABLE_CX WB_DATA
SABLE_CX WB_DATA
SABLE_CX WB_DATA
SABLE_CX WB_DATA
SABLE_CX WB_DATA
Segments by Physical Write Requests
Total Physical Write Requestss: 108,051
Captured Segments account for 54.1% of Total
Owner Tablespace NameSABLE_CX WB_DATA
SABLE_CX WB_DATA
SABLE_CX WB_DATA
SABLE_CX WB_DATA
SABLE_CX WB_DATA
Segments by Direct Physical Writes
Total Direct Physical Writes: 4,125
Captured Segments account for 88.7% of Total
Owner Tablespace NameSABLE_CX WB_DATA
SABLE_CX WB_DATA
SABLE_CX TEMP
MDSYS TEMP
Back to Segment StatisticsBack to Top
Back to Segment StatisticsBack to Top
Back to Segment StatisticsBack to Top
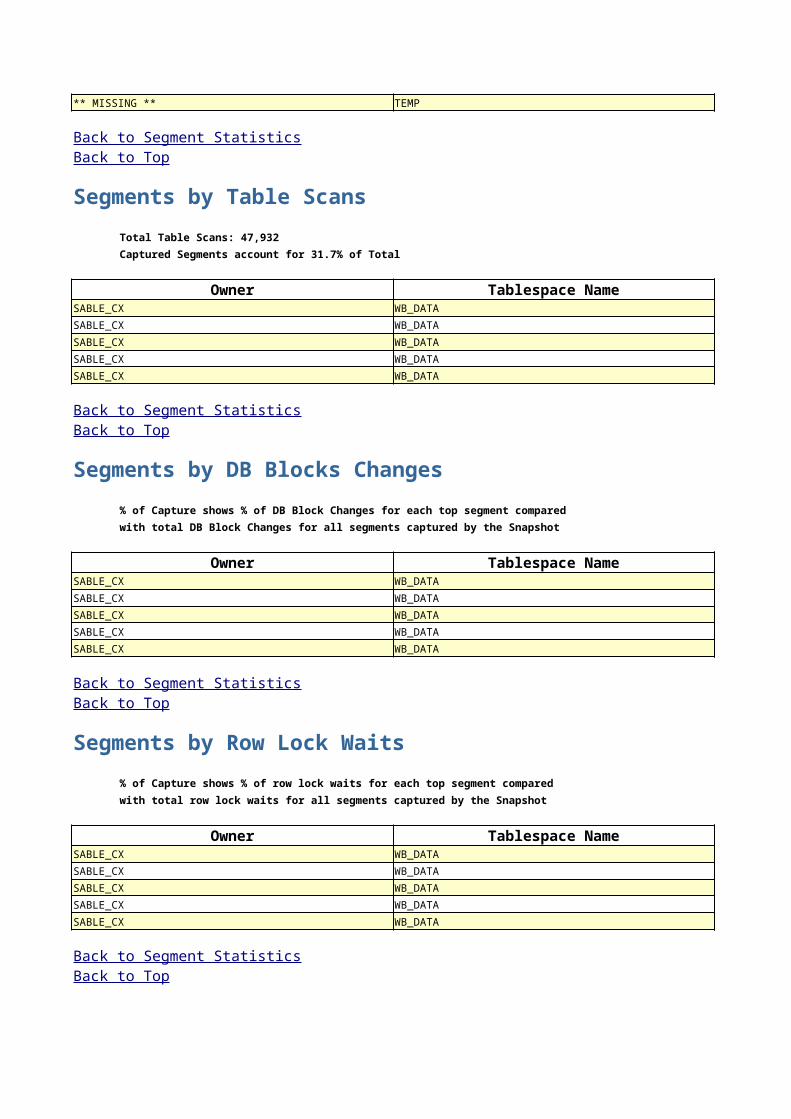
** MISSING ** TEMP
Segments by Table Scans
Total Table Scans: 47,932
Captured Segments account for 31.7% of Total
Owner Tablespace NameSABLE_CX WB_DATA
SABLE_CX WB_DATA
SABLE_CX WB_DATA
SABLE_CX WB_DATA
SABLE_CX WB_DATA
Segments by DB Blocks Changes
% of Capture shows % of DB Block Changes for each top segment compared
with total DB Block Changes for all segments captured by the Snapshot
Owner Tablespace NameSABLE_CX WB_DATA
SABLE_CX WB_DATA
SABLE_CX WB_DATA
SABLE_CX WB_DATA
SABLE_CX WB_DATA
Segments by Row Lock Waits
% of Capture shows % of row lock waits for each top segment compared
with total row lock waits for all segments captured by the Snapshot
Owner Tablespace NameSABLE_CX WB_DATA
SABLE_CX WB_DATA
SABLE_CX WB_DATA
SABLE_CX WB_DATA
SABLE_CX WB_DATA
Back to Segment StatisticsBack to Top
Back to Segment StatisticsBack to Top
Back to Segment StatisticsBack to Top
Back to Segment StatisticsBack to Top

Segments by ITL Waits
% of Capture shows % of ITL waits for each top segment compared
with total ITL waits for all segments captured by the Snapshot
Owner Tablespace NameSABLE_CX WB_DATA
SABLE_CX WB_DATA
SABLE_CX WB_DATA
SABLE_CX WB_DATA
SYS SYSAUX
Segments by Buffer Busy Waits
% of Capture shows % of Buffer Busy Waits for each top segment compared
with total Buffer Busy Waits for all segments captured by the Snapshot
Owner Tablespace NameSABLE_CX WB_DATA
SABLE_CX WB_DATA
SABLE_CX WB_DATA
SABLE_CX WB_DATA
SABLE_CX WB_DATA
Dictionary Cache Stats
"Pct Misses" should be very low (< 2% in most cases)
"Final Usage" is the number of cache entries being used
Cache Get Requestsdc_awr_control 2,007
dc_constraints 252
dc_files 732
dc_global_oids 1,317
dc_histogram_data 333,967
dc_histogram_defs 365,862
dc_object_grants 956
dc_objects 1,096,388
dc_profiles 1,951
dc_rollback_segments 45,232
dc_segments 100,402
dc_sequences 64,774
dc_table_scns 20
dc_tablespaces 2,259,413
dc_users 2,194,354
Back to Segment StatisticsBack to Top
Back to Segment StatisticsBack to Top

global database name 56,816
outstanding_alerts 548
qmtmrciq_cache_entries 81
qmtmrctn_cache_entries 81
qmtmrctq_cache_entries 82
sch_lj_objs 18
sch_lj_oids 310
Library Cache Activity
"Pct Misses" should be very low
Namespace Get RequestsACCOUNT_STATUS 1,661
APP CONTEXT 1
BODY 7,118
CLUSTER 498
DBLINK 1,821
DIRECTORY 7
EDITION 1,595
INDEX 2,426
JAVA DATA 3
JAVA SOURCE 1
OBJECT ID 93
QUEUE 81
SCHEMA 1,915
SECURITY CLASS 259
SQL AREA 379,127
SQL AREA BUILD 4,130
SQL AREA STATS 3,433
TABLE/PROCEDURE 37,766
TEMPORARY INDEX 176
TEMPORARY TABLE 490
TRIGGER 6,883
XDB ACL 82
XDB CONFIG 82
XML SCHEMA 410
Memory Statistics
Back to Top
Back to Top
Memory Dynamic ComponentsMemory Resize Operations SummaryMemory Resize OpsProcess Memory SummarySGA Memory Summary
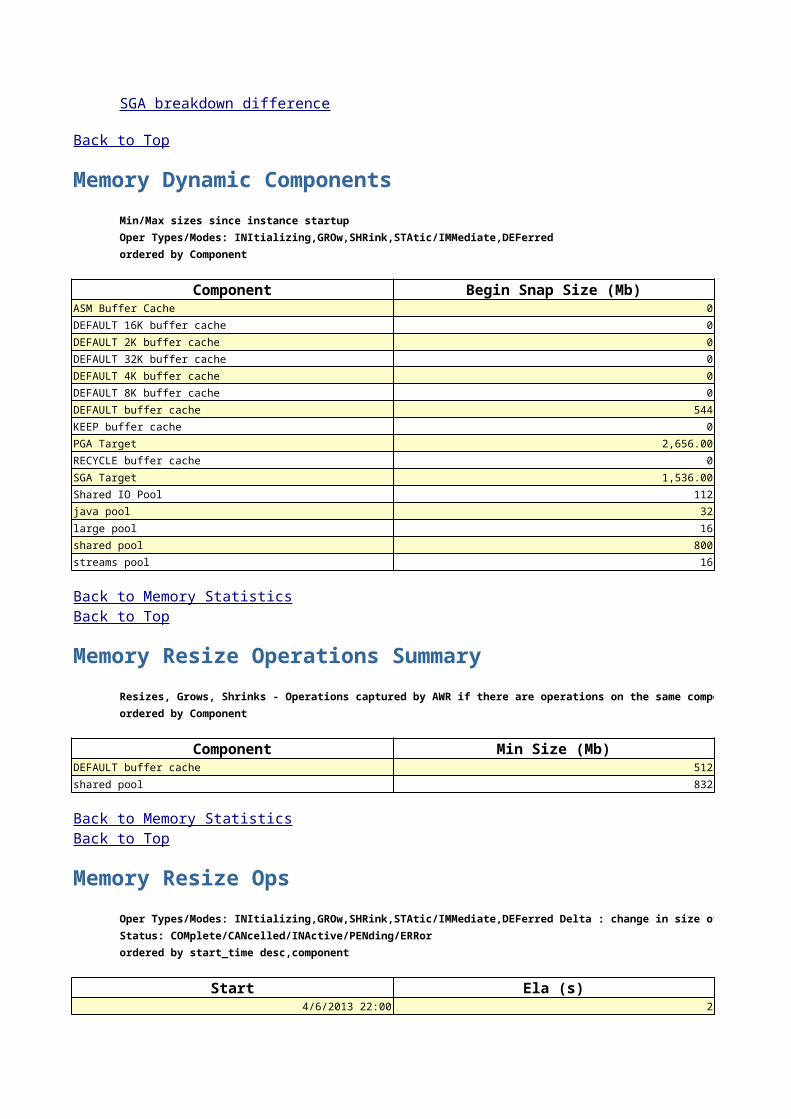
Memory Dynamic Components
Min/Max sizes since instance startup
Oper Types/Modes: INItializing,GROw,SHRink,STAtic/IMMediate,DEFerred
ordered by Component
Component Begin Snap Size (Mb)ASM Buffer Cache 0
DEFAULT 16K buffer cache 0
DEFAULT 2K buffer cache 0
DEFAULT 32K buffer cache 0
DEFAULT 4K buffer cache 0
DEFAULT 8K buffer cache 0
DEFAULT buffer cache 544
KEEP buffer cache 0
PGA Target 2,656.00
RECYCLE buffer cache 0
SGA Target 1,536.00
Shared IO Pool 112
java pool 32
large pool 16
shared pool 800
streams pool 16
Memory Resize Operations Summary
Resizes, Grows, Shrinks - Operations captured by AWR if there are operations on the same component for the same operation_type, target_size, and with the same start_time only one operation is captured
ordered by Component
Component Min Size (Mb)DEFAULT buffer cache 512
shared pool 832
Memory Resize Ops
Oper Types/Modes: INItializing,GROw,SHRink,STAtic/IMMediate,DEFerred Delta : change in size of the component Target Delta: displayed only if final size <> target_size
Status: COMplete/CANcelled/INActive/PENding/ERRor
ordered by start_time desc,component
Start Ela (s)4/6/2013 22:00 2
SGA breakdown difference
Back to Top
Back to Memory StatisticsBack to Top
Back to Memory StatisticsBack to Top

4/6/2013 22:00 2
Process Memory Summary
B: Begin Snap E: End Snap
All rows below contain absolute values (i.e. not diffed over the interval)
Max Alloc is Maximum PGA Allocation size at snapshot time
Hist Max Alloc is the Historical Max Allocation for still-connected processes
ordered by Begin/End snapshot, Alloc (MB) desc
CategoryB Other
Freeable
PL/SQL
SQL
E Other
Freeable
PL/SQL
SQL
SGA Memory Summary
SGA regions Begin Size (Bytes)Database Buffers 687,865,856
Fixed Size 2,226,912
Redo Buffers 7,348,224
Variable Size 905,970,976
SGA breakdown difference
ordered by Pool, Name
N/A value for Begin MB or End MB indicates the size of that Pool/Name was insignificant, or zero in that snapshot
Pool Namejava JOXLE
java free memory
java joxs heap
large ASM map operations hashta
large PX msg pool
large free memory
shared FileOpenBlock
shared KGLH0
Back to Memory StatisticsBack to Top
Back to Memory StatisticsBack to Top
Back to Memory StatisticsBack to Top

shared KGLHD
shared KGLS
shared SQLA
shared XDBSC
shared free memory
streams KTG hash buckets
streams free memory
buffer_cache
fixed_sga
log_buffer
shared_io_pool
Streams Statistics
Streams CPU/IO Usage
Streams processes ordered by CPU Time, descending
Session Type First LogonQMON Slaves 0528 17:42:55
QMON Coordinator 0528 17:42:50
Streams Capture
No data exists for this section of the report.
Back to Memory StatisticsBack to Top
Streams CPU/IO UsageStreams CaptureStreams Capture RateStreams ApplyStreams Apply RateBuffered QueuesBuffered Queue SubscribersRule SetPersistent QueuesPersistent Queues RatePersistent Queue Subscribers
Back to Top
Back to Streams StatisticsBack to Top
Back to Streams StatisticsBack to Top
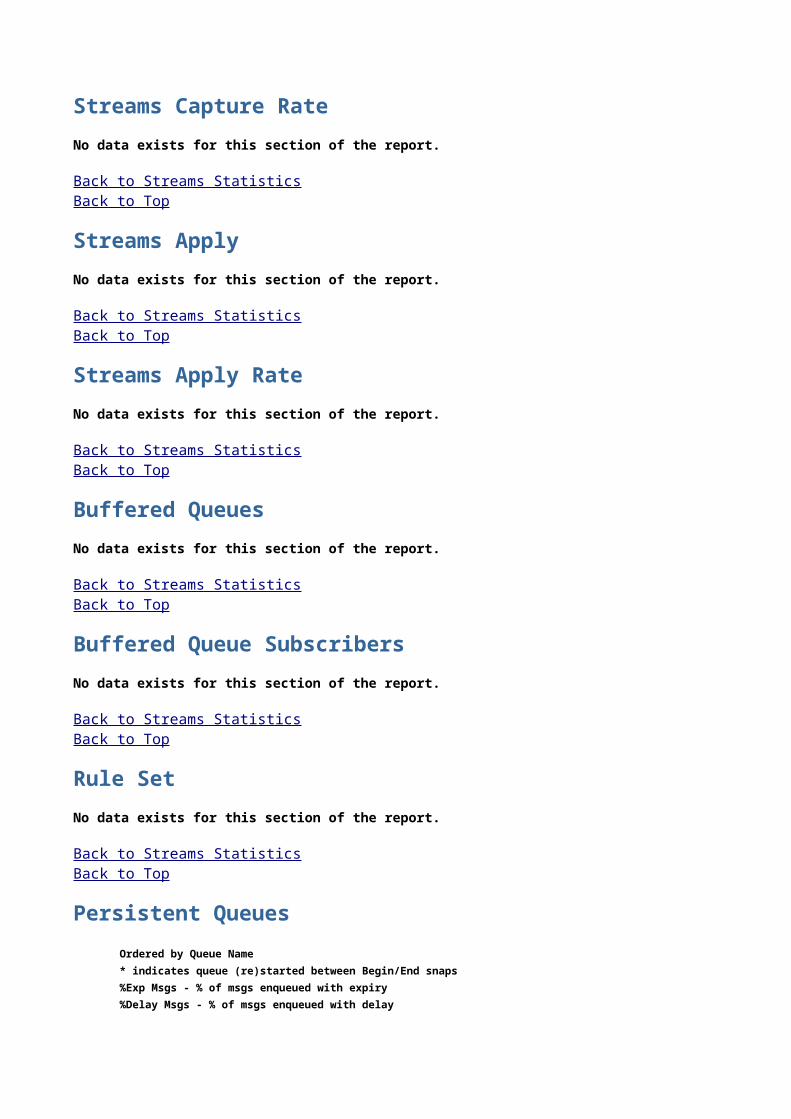
Streams Capture Rate
No data exists for this section of the report.
Streams Apply
No data exists for this section of the report.
Streams Apply Rate
No data exists for this section of the report.
Buffered Queues
No data exists for this section of the report.
Buffered Queue Subscribers
No data exists for this section of the report.
Rule Set
No data exists for this section of the report.
Persistent Queues
Ordered by Queue Name
* indicates queue (re)started between Begin/End snaps
%Exp Msgs - % of msgs enqueued with expiry
%Delay Msgs - % of msgs enqueued with delay
Back to Streams StatisticsBack to Top
Back to Streams StatisticsBack to Top
Back to Streams StatisticsBack to Top
Back to Streams StatisticsBack to Top
Back to Streams StatisticsBack to Top
Back to Streams StatisticsBack to Top

%Trasf Time - % of Enqueue time spent in transformation
%Eval Time - % of Enqueue time spent in rule evaluation
Queue Name Enq MsgsSYS.ALERT_QUE(12603) 0
Persistent Queues Rate
Ordered by Queue Name
* indicates queue (re)started between Begin/End snaps
Queue Name Enqueue Msgs/secSYS.ALERT_QUE(12603) 0
Persistent Queue Subscribers
Ordered by Queue Name, Subscriber Name
* indicates Subscriber activity (re)started between Begin/End snaps
Subscriber/Queue Enqueue MsgsHAE_SUB(1)/SYS.ALERT_QUE 0
NGCLKLXFLCDB_3872_FLCP(22)/SYS.ALERT_QUE 0
Resource Limit Stats
No data exists for this section of the report.
Shared Server Statistics
Back to Streams StatisticsBack to Top
Back to Streams StatisticsBack to Top
Back to Streams StatisticsBack to Top
Back to Top
Shared Servers ActivityShared Servers RatesShared Servers UtilizationShared Servers Common QueueShared Servers Dispatchers
Back to Top
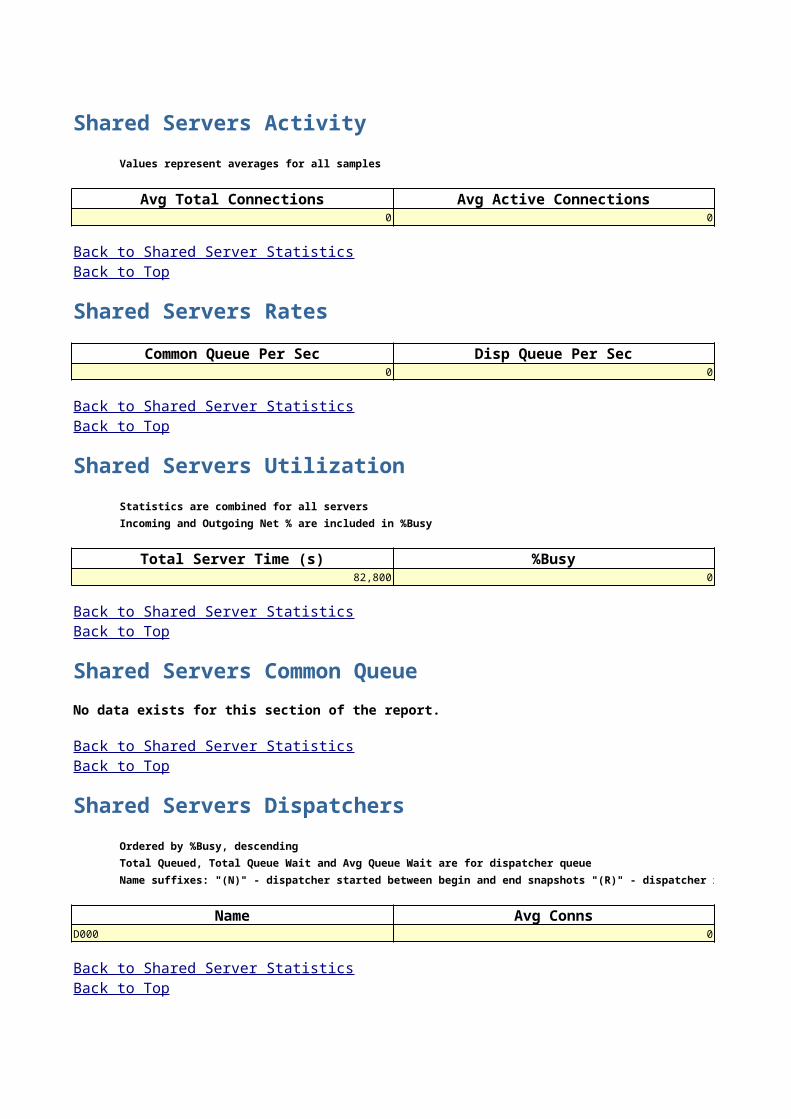
Shared Servers Activity
Values represent averages for all samples
Avg Total Connections Avg Active Connections0 0
Shared Servers Rates
Common Queue Per Sec Disp Queue Per Sec0 0
Shared Servers Utilization
Statistics are combined for all servers
Incoming and Outgoing Net % are included in %Busy
Total Server Time (s) %Busy82,800 0
Shared Servers Common Queue
No data exists for this section of the report.
Shared Servers Dispatchers
Ordered by %Busy, descending
Total Queued, Total Queue Wait and Avg Queue Wait are for dispatcher queue
Name suffixes: "(N)" - dispatcher started between begin and end snapshots "(R)" - dispatcher re-started between begin and end snapshots
Name Avg ConnsD000 0
Back to Shared Server StatisticsBack to Top
Back to Shared Server StatisticsBack to Top
Back to Shared Server StatisticsBack to Top
Back to Shared Server StatisticsBack to Top
Back to Shared Server StatisticsBack to Top

init.ora Parameters
init.ora Parameters
Parameter Name Begin valuearchive_lag_target 0
audit_file_dest /u01/app/oracle/admin/FLCP/adump
audit_trail DB
compatible 11.2.0.0.0
control_file_record_keep_time 43
control_files
db_block_size 8192
db_create_file_dest +FLC_DATA
db_domain WORLD
db_name FLCP
db_recovery_file_dest +FLC_DATA
db_recovery_file_dest_size 32212254720
dg_broker_start 1
diagnostic_dest /u01/app/oracle
dispatchers (PROTOCOL=TCP) (SERVICE=FLCPXDB)
fal_server flcp_ibclxflcdb01
local_listener
log_archive_config dg_config=(FLCP, FLCP_STBY)
log_archive_dest_1
log_archive_dest_2
log_archive_dest_state_2 ENABLE
log_archive_format %t_%s_%r.dbf
log_archive_max_processes 4
log_archive_min_succeed_dest 1
log_archive_trace 0
open_cursors 300
pga_aggregate_target 2785017856
processes 150
remote_login_passwordfile EXCLUSIVE
resource_manager_plan
sec_case_sensitive_logon 0
sga_target 1610612736
spfile +FLC_DATA/flcp/spfileflcp.ora
init.ora Parametersinit.ora Multi-Valued Parameters
Back to Top
+FLC_DATA/flcp/controlfile/current.261.736791085, +FLC_DATA/flcp/controlfile/current.260.736791085
(DESCRIPTION=(ADDRESS_LIST=(ADDRESS=(PROTOCOL=TCP)(HOST=57.28.246.84)(PORT=1521))))
location=USE_DB_RECOVERY_FILE_DEST, valid_for=(ALL_LOGFILES, ALL_ROLES)
service="FLCP_IBCLXFLCDB01", LGWR ASYNC NOAFFIRM delay=0 optional compression=disable max_failure=0 max_connections=1 reopen=300 db_unique_name="FLCP_STBY" net_timeout=30, valid_for=(all_logfiles, primary_role)
SCHEDULER[0x3107]:DEFAULT_MAINTENANCE_PLAN

standby_file_management Auto
undo_tablespace UNDOTBS1
init.ora Multi-Valued Parameters
This section only displays parameters that have more one value
'(NULL)' indicates a missing parameter value
A blank in the End Snapshot indicates the same value as the BeginSnapshot
Parameter Name Begin valuecontrol_files +FLC_DATA/flcp/controlfile/current.260.736791085
+FLC_DATA/flcp/controlfile/current.261.736791085
log_archive_dest_1 location=USE_DB_RECOVERY_FILE_DEST
valid_for=(ALL_LOGFILES, ALL_ROLES)
log_archive_dest_2
service="FLCP_IBCLXFLCDB01"
valid_for=(all_logfiles, primary_role)
Dynamic Remastering Stats
No data exists for this section of the report.
End of Report
Back to init.ora ParametersBack to Top
LGWR ASYNC NOAFFIRM delay=0 optional compression=disable max_failure=0 max_connections=1 reopen=300 db_unique_name="FLCP_STBY" net_timeout=30
Back to init.ora ParametersBack to Top
Back to Top

Instance Inst numFLCP 1
CPUs Cores2
Snap Time Sessions6/4/2013 0:00 66
6/4/2013 23:01 71
1,380.20 (mins)
766.65 (mins)
End512M Std Block Size:
832M Log Buffer:
Per Transaction Per Exec0.3 0.01
0.3 0.01
8,639.10
7,809.20
59.5
712.6
1.4
42.1
7.6
0
7.8
0
44.2
0
Redo NoWait %: 100
In-memory Sort %: 100
Soft Parse %: 99.59
Latch Hit %: 99.93
% Non-Parse CPU: 99.1

End84.86
78.88
83.48
Time(s) Avg wait (ms)34,691
2,238 2
1,785 2
1,757 4
807 69
%User %System21.9 0.7
1.7
End7,855.70
1,536.00
429.7
25.02
%DB time waiting for CPU (Resource Manager)

Statistics including the word "background" measure background process time, and so do not contribute to the DB time statistic
% of DB Time93.71
75.42
2.37
2.3
1.91
1.01
0.07
0.05
0.04
0.02
0.01
0.01
0
0
0

End Value
2
%busy %user
20.5 19.25
18.44 17.62
7.42 6.89
9.53 8.96
11.91 11.29
30.98 30.04
26.08 25.27
13.81 13.07
17.88 17.12
36.71 35.52
25.09 24.08
30.36 29.21
33.3 32.18
20.21 19.2
22.73 21.66
26.97 25.84
12.88 12.15

24.97 23.69
30.63 29.57
22 21.18
21.08 20.25
24.04 23.2
38.26 37.04
%Time -outs Total Wait Time (s)34,691
0 5,850
0 807
0 305
0 77
0 67
0 59
0 37
99 17
0 1
0 0
%Time -outs Total Wait Time (s)0 2,238
0 1,785
0 1,757
0 807
0 305
0 76
0 64
0 53
36 32
0 21
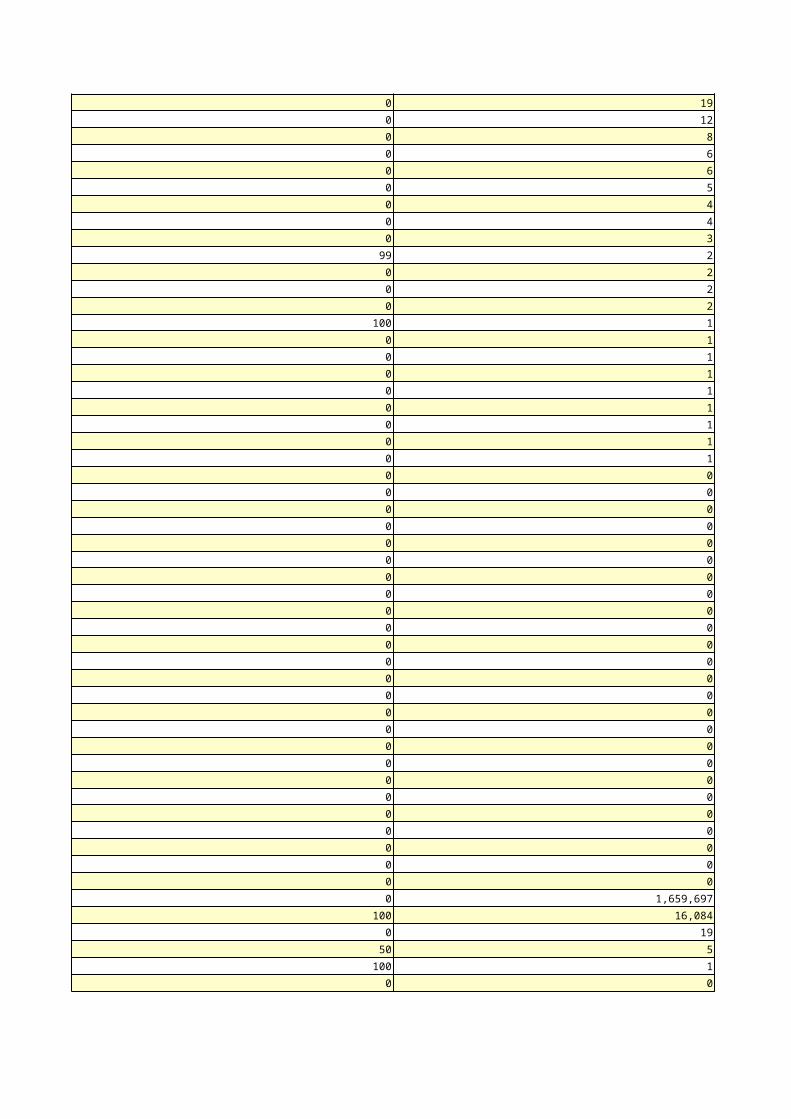
0 19
0 12
0 8
0 6
0 6
0 5
0 4
0 4
0 3
99 2
0 2
0 2
0 2
100 1
0 1
0 1
0 1
0 1
0 1
0 1
0 1
0 1
0 0
0 0
0 0
0 0
0 0
0 0
0 0
0 0
0 0
0 0
0 0
0 0
0 0
0 0
0 0
0 0
0 0
0 0
0 0
0 0
0 0
0 0
0 0
0 0
0 0
0 1,659,697
100 16,084
0 19
50 5
100 1
0 0

%Time -outs Total Wait Time (s)0 2,847
0 717
0 367
0 320
0 214
0 147
0 111
0 54
0 39
0 35
0 27
0 26
0 21
0 14
0 8
0 4
0 3
0 2
0 1
0 1
0 1
0 1
0 1
0 0
0 0
0 0
0 0
0 0
0 0
0 0
0 0
100 0
0 0
0 0
0 0
0 0
0 0
0 0
0 0
0 0
0 0
0 0
100 0
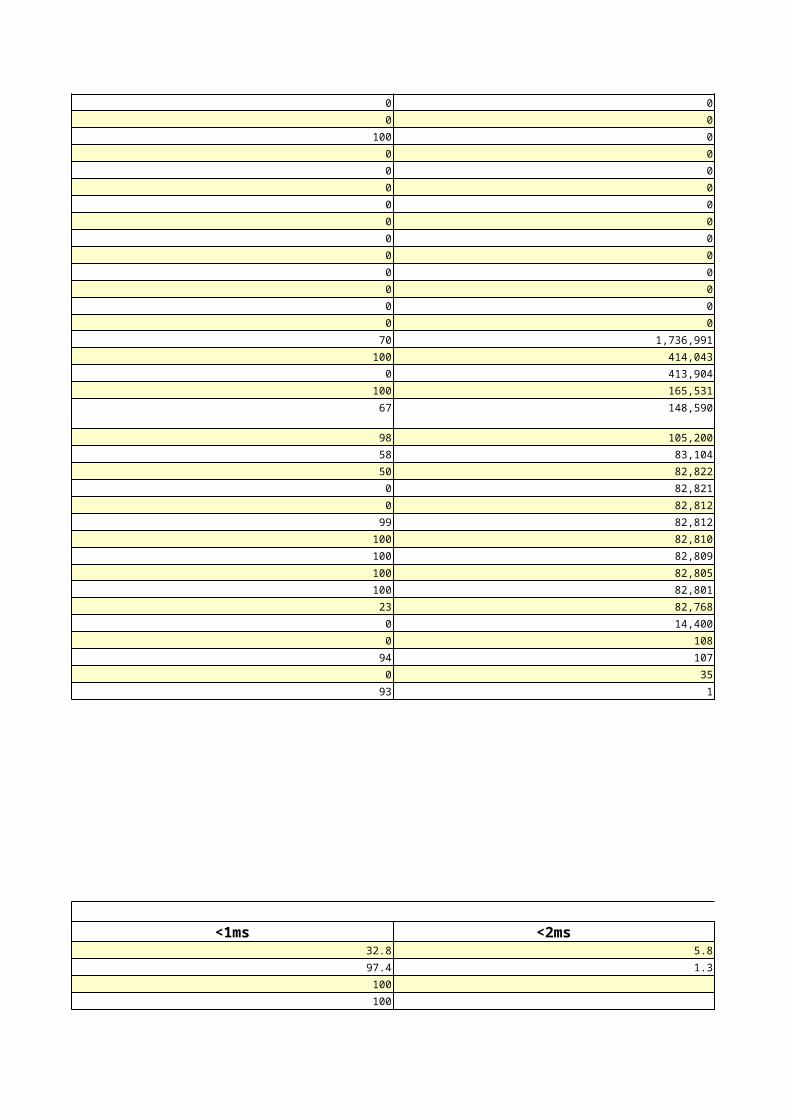
0 0
0 0
100 0
0 0
0 0
0 0
0 0
0 0
0 0
0 0
0 0
0 0
0 0
0 0
70 1,736,991
100 414,043
0 413,904
100 165,531
67 148,590
98 105,200
58 83,104
50 82,822
0 82,821
0 82,812
99 82,812
100 82,810
100 82,809
100 82,805
100 82,801
23 82,768
0 14,400
0 108
94 107
0 35
93 1
% of Waits<1ms <2ms
32.8 5.8
97.4 1.3
100
100

95.8 1.9
0.1
6.7 73.1
97.9 1.4
99.7 0.1
94.6 0.8
99.9 0
54.5 21.2
86 3
10.2 18.3
69.4 4.8
100 0
90.7 5.8
100 0
90.6 2.3
100 0
94.4 1.4
81.4 8.2
90.6 3
24.4 4.3
50
1.3
90.4 4.3
68.4 14.5
72.3 5.4
51.1 22.9
16.7 25
82.7 5.8
37.5 20.8
7.5 1.5
92.7 2.4
9.1 27.3
62.3 19.6
80 20
97.1 2.9
90.9 3
13.3 6.7
89.9 6.1
76.3 2.6
100
76.8 5
91.7
80
100

100
65 30
50 25
50
92.6 1.8
85.2 6
33.2 9.3
90.9 6.8
14.3
79.5 9.3
96 1
59.4 19.7
94 3.2
3.3 2
100
66.7
99.1 0.8
44.6 6.9
6.3
91.4 4.8
8.1 4.9
4.7 0.9
59.7 25.4
0.6 0
49.1 0.4
2.2
16.7
50
14.6 2.7
3.7 0.6
1.7 1.2
0.3 0.1

% of Total Waits<32ms <64ms
99.8 0.2
99.6 0.2
99.9 0.1
98.1 1.9
100
99.7 0.3
100 0
97 3
99.2 0.4
99.6 0.3
75.8
100 0
99.8 0
100 0
96 0.2
100 0
99.3 0.7
98.7 0.7
99.6 0.2
98.8 0.6
100
96.7 2.5
99.5 0.2
99.7 0.2
99.5 0.3
98.8 0.9
98 1
95.8 2.8
73.1 22.4
97.9 1.3
84.4 8.9
8.3 16.7
97.4 2.6
98.5 0.9
92.9
27.6
98.8 1.2
99 0.5
95.8 3.1
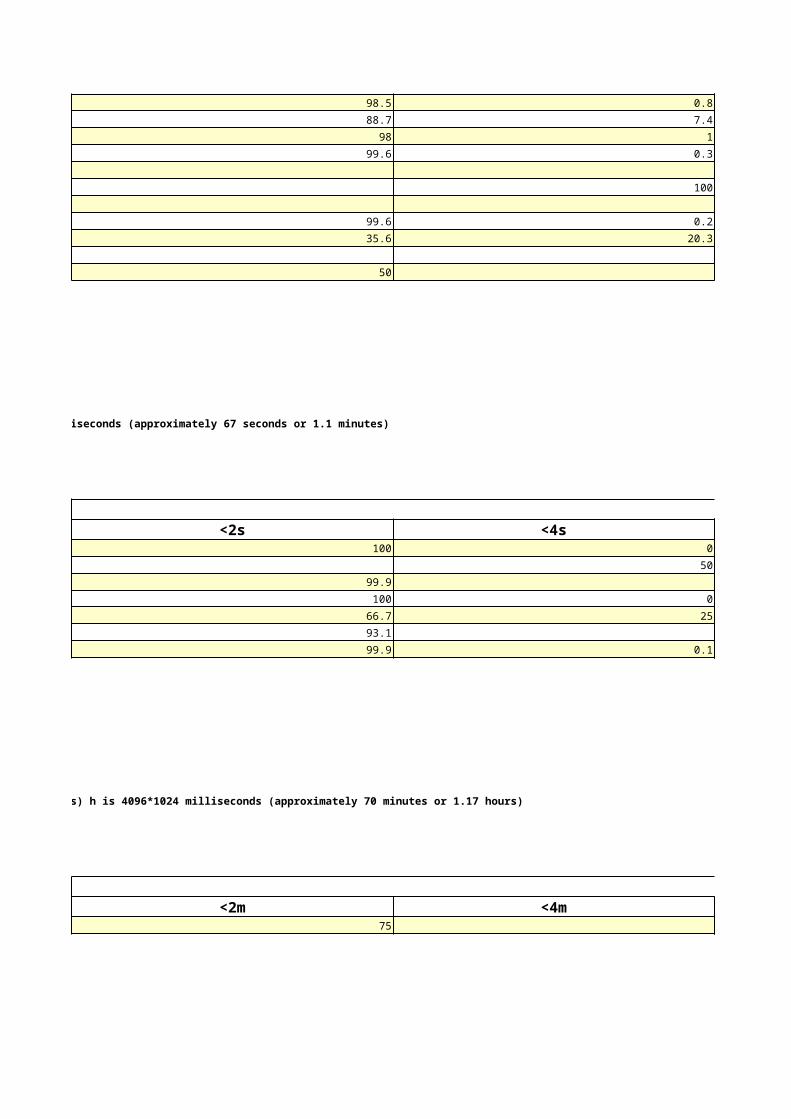
98.5 0.8
88.7 7.4
98 1
99.6 0.3
100
99.6 0.2
35.6 20.3
50
Units for % of Total Waits: s is 1024 milliseconds (approximately 1 second) m is 64*1024 milliseconds (approximately 67 seconds or 1.1 minutes)
% of Total Waits<2s <4s
100 0
50
99.9
100 0
66.7 25
93.1
99.9 0.1
Units for % of Total Waits: m is 64*1024 milliseconds (approximately 67 seconds or 1.1 minutes) h is 4096*1024 milliseconds (approximately 70 minutes or 1.17 hours)
% of Total Waits<2m <4m
75

DB CPU (s) Physical Reads (K)34,634 95,903
56 1,563
0 0
0 62
Total Waits and Time Waited displayed for the following wait classes: User I/O, Concurrency, Administrative, Network
User I/O Wt Time Concurcy Total Wts5779 2337
72 0
106 992
Resources reported for PL/SQL code includes the resources used by all SQL statements called by the code.
% Total DB Time is the Elapsed Time of the SQL statement divided into the Total Database Time multiplied by 100

Elapsed Time per Exec (s) %Total0.08 33.94
0.07 15.88
1.61 11.88
1.71 9.66
0.52 6.64
0.02 5.82
0.73 5.8
0.02 4.92
0.02 4.89
0.21 2.28
1.62 2.23
963.63 2.09
0.27 1.71
600.45 1.31
502.33 1.09
Resources reported for PL/SQL code includes the resources used by all SQL statements called by the code.
CPU per Exec (s) %Total0.07 39.87
0.06 19.77
0.85 8.35
0.02 7.22
0.93 7.01
0.02 6.09
0.02 6.08
0.42 4.43
0.25 4.22
0.26 2.19
0.12 1.72
0.83 1.53

Resources reported for PL/SQL code includes the resources used by all SQL statements called by the code.
UIO per Exec (s) %Total0.74 42.05
0.75 32.9
0.27 26.37
0.3 18.52
686.04 11.52
577.85 9.7
0.76 8.11
0.09 7.18
359.35 6.03
1.26 2.76
132.99 2.23
1.09 2.13
117.71 1.98
6.97 1.64
1.09 1.21
Resources reported for PL/SQL code includes the resources used by all SQL statements called by the code.
Gets per Exec %Total1,770.97 17.86
1,770.52 17.86
1,770.98 17.86
1,770.71 17.86
375.79 7.11
20,379.71 6.49

11,704.04 6.38
22,225.74 5.42
9,897.05 3.4
3,984.15 1.84
6,235.66 1.72
227.48 1.66
4,119.16 1.53
20,434.16 1.22
Reads per Exec %Total11,062.17 66.08
8,459.34 29.51
8,987.70 24.01
3,724.12 14.04
9,117.31 5.95
1,087.74 5.52
13,665.76 1.63
8,262.73 1.1
8,251.35 0.72
488,786.00 0.5
Executions UnOptimized Reqs per Exec3,402 456.93

2,605 555.3
3,677 279.91
5,826 90.49
636 496.71
4,948 55.74
1 210,403.00
1 172,064.00
130 452.08
85 469.05
1 39,784.00
Rows per Exec Elapsed Time (s)1 27.19
1 21.59
1 95.43
0.83 37.6
0.07 15,610.14
0 7,304.95
0.01 2,675.94
0 2,250.37
0.01 2,264.21
0.5 11.93
0.49 4.73
39.59 71.37
1.5 6.02
1 10.22
% Total Parses SQL Id8.24 dsnk22bby5s7b

5.67
1.71
1.66
1.63
1.45
1.19
1.19
0.82
0.82
% Total SQL Id0.63
0.56
0.44
0.35
0.35
0.34
0.34
0.33
0.33
0.33
0.3
0.28
0.28
0.26
0.23
0.21
0.2
0.19
0.19
0.19
0.18
0.17
0.17
0.15
0.14
0.14
0.14
0.14
4m7m0t6fjcs5xarvad97suq7p18ums58rsq08u1ftj9uawt4wwzb0bkjwu3swz0wybmquxnvdftw7t2bjggjqk03ar8dxb7nztnykx9qcm5vu20fhtnq1
bqqwtnz5f54q41znntxfy467823j2p1zh0uazqjgmkp4str0jjpqfktgk087pf6923t06dm4zcmdusfktgk087pf6923t06dm4zcmdus3t06dm4zcmdusab3swhv5g138y72ukkfmh7y7dz1znntxfy467824x866jn4mj1uybgyq4u09zq1anct2udavsj1fun6wm3n4d7bnddg6by6u9hdyk1abgyytuvyfffj9c01d5n1nm17r2h7wt7phk4xns75d89c1mh5pvbkzfktgk087pf692fktgk087pf69217jn6anhgwns50a2w8uvpc44ajbghk5x23n0682db3q2xdrx0fsd0a2w8uvpc44aj

0.13
0.12
SQL Id SQL ModuleJDBC Thin Client
JDBC Thin Client
JDBC Thin Client
JDBC Thin Client
JDBC Thin Client
JDBC Thin Client
JDBC Thin Client
JDBC Thin Client
JDBC Thin Client
JDBC Thin Client
JDBC Thin Client
JDBC Thin Client
JDBC Thin Client
JDBC Thin Client
JDBC Thin Client
JDBC Thin Client
JDBC Thin Client
JDBC Thin Client
JDBC Thin Client
emagent_SQL_oracle_database
JDBC Thin Client
JDBC Thin Client
0a2w8uvpc44aj15aftu6tf4xd0
1znntxfy467821znntxfy467821znntxfy467821znntxfy467821znntxfy467821znntxfy467821znntxfy46782bqqwtnz5f54q4bqqwtnz5f54q4bqqwtnz5f54q4bqqwtnz5f54q4gmkp4str0jjpqgmkp4str0jjpqgmkp4str0jjpqgmkp4str0jjpqgmkp4str0jjpqgmkp4str0jjpqgmkp4str0jjpq3j2p1zh0uazqj69k5bhm12sz987gzxf61vj6wq417jn6anhgwns572ukkfmh7y7dzfsbqktj5vw6n9gdn3ysuyssf82
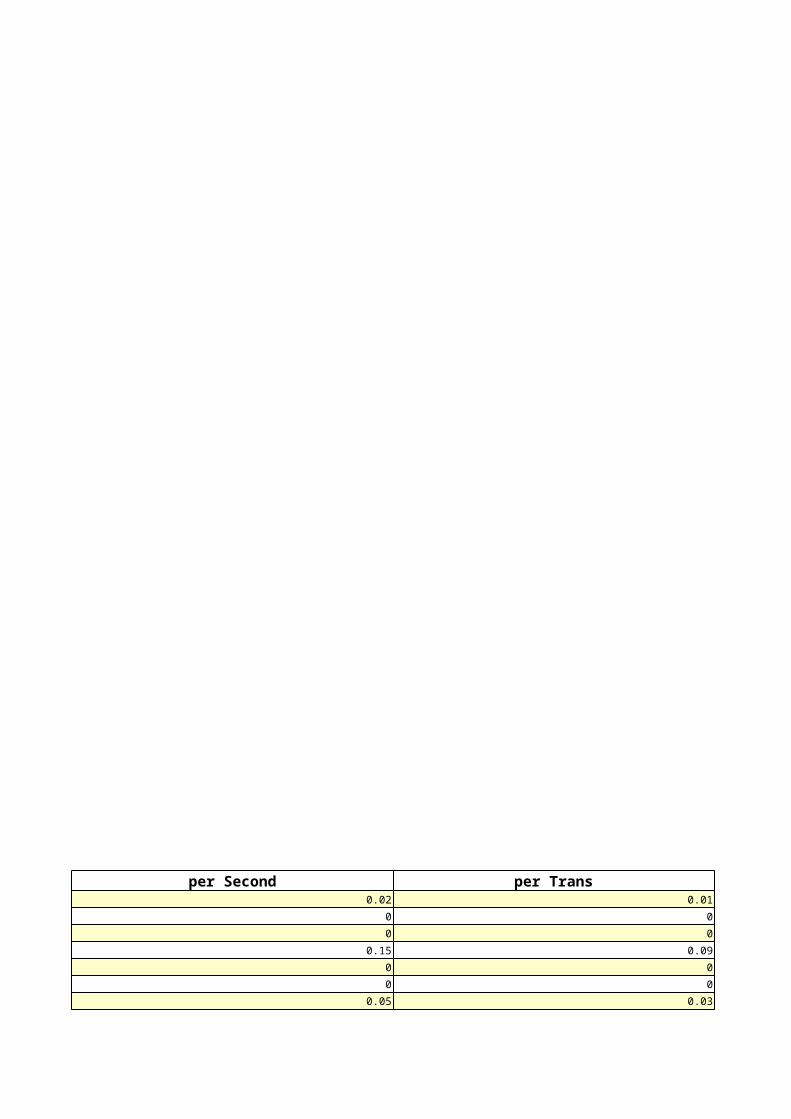
per Second per Trans0.02 0.01
0 0
0 0
0.15 0.09
0 0
0 0
0.05 0.03

0.02 0.01
0 0
0.08 0.05
0 0
0.06 0.04
0 0
41.94 25.37
41.28 24.98
1.17 0.71
0.17 0.1
0.14 0.09
72.35 43.77
2.14 1.3
0.02 0.01
0 0
0.07 0.04
0.06 0.04
0.01 0.01
0.07 0.04
0.76 0.46
21,219.00 12,838.26
17.44 10.55
0 0
0.04 0.03
0.01 0.01
0.07 0.04
0.3 0.18
1,878.59 1,136.61
1.35 0.81
0.07 0.04
0.02 0.01
0 0
0.01 0.01
4,500.77 2,723.13
0 0
0 0
0 0
6.57 3.98
0 0
17.14 10.37
17.2 10.41
0 0
63.35 38.33
0 0
0 0
0 0
0 0
2.06 1.25
0.05 0.03
0 0
0 0
6.36 3.85
0 0
412.62 249.65

2,252.34 1,362.74
4,649.69 2,813.23
16,811.92 10,171.82
67.36 40.76
6.09 3.69
39.51 23.91
10,766,134.55 6,513,898.17
0.04 0.03
1.52 0.92
0.95 0.58
0.06 0.03
210.69 127.48
55.25 33.43
0 0
0 0
0 0
0 0
0.14 0.08
0 0
0.02 0.01
0.01 0
8.04 4.87
7.88 4.77
0 0
0 0
0.8 0.48
0.11 0.07
20.77 12.57
12,777.56 7,730.88
114.95 69.55
818.77 495.38
11,958.79 7,235.50
11,751.93 7,110.34
0.02 0.01
19.5 11.8
98.26 59.45
129.51 78.36
0.04 0.03
129.46 78.33
33.44 20.23
2.77 1.67
0.09 0.06
0.5 0.3
0 0
32.65 19.76
32.65 19.76
0 0
0.02 0.01
0 0
73.06 44.2
0 0
52,388.26 31,696.78
377.61 228.47

361.84 218.93
0.24 0.14
5.66 3.42
1.01 0.61
1.46 0.88
0 0
0 0
0.49 0.29
69.74 42.19
139.17 84.21
1.94 1.17
0.01 0.01
0 0
0.01 0
0.01 0
0.65 0.39
0.65 0.39
0.02 0.01
0.02 0.01
31.66 19.15
31.66 19.15
2.01 1.22
2.01 1.22
7.27 4.4
7.27 4.4
7.27 4.4
7.27 4.4
0.04 0.03
0.1 0.06
0.12 0.07
0.08 0.05
0.08 0.05
0.03 0.02
0.01 0.01
4.52 2.73
4.52 2.73
0 0
0 0
12,596.82 7,621.53
122.79 74.29
14.71 8.9
52.47 31.75
0 0
0.01 0
0.05 0.03
12.63 7.64
0.38 0.23
0.45 0.27
33.07 20.01
9,647,748.90 5,837,234.67
39.75 24.05
10,663,733.17 6,451,941.66
16.43 9.94
1,177.70 712.55
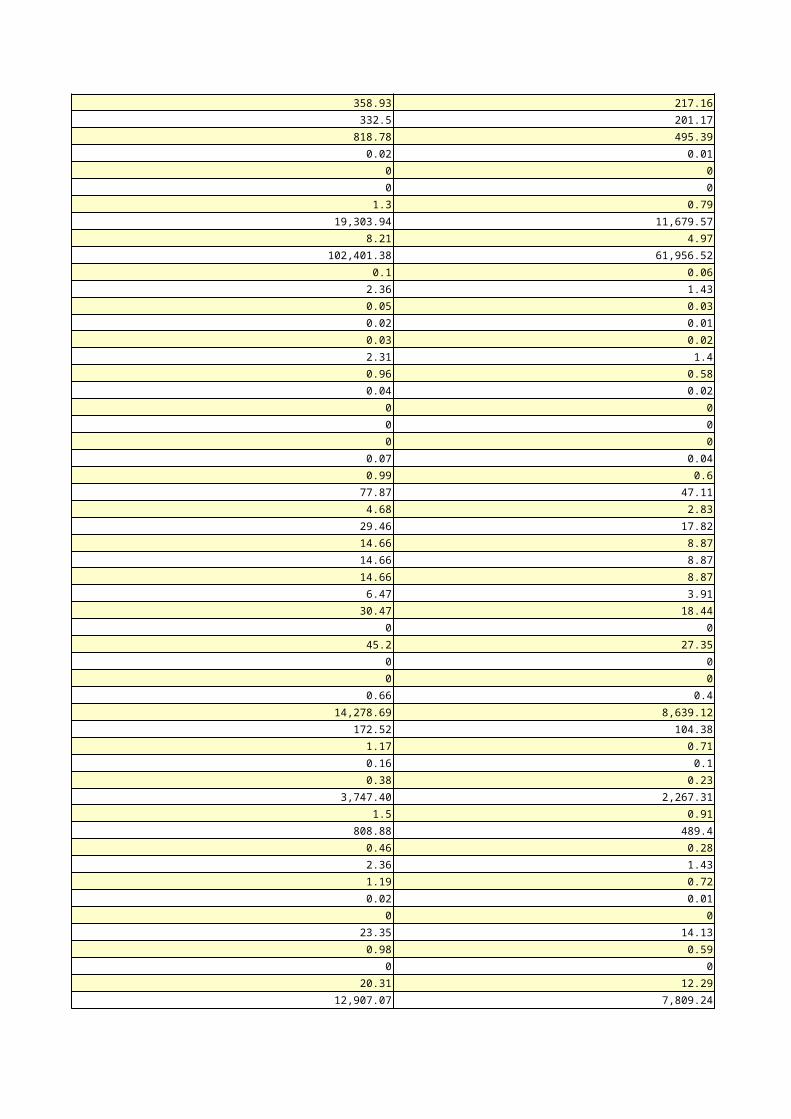
358.93 217.16
332.5 201.17
818.78 495.39
0.02 0.01
0 0
0 0
1.3 0.79
19,303.94 11,679.57
8.21 4.97
102,401.38 61,956.52
0.1 0.06
2.36 1.43
0.05 0.03
0.02 0.01
0.03 0.02
2.31 1.4
0.96 0.58
0.04 0.02
0 0
0 0
0 0
0.07 0.04
0.99 0.6
77.87 47.11
4.68 2.83
29.46 17.82
14.66 8.87
14.66 8.87
14.66 8.87
6.47 3.91
30.47 18.44
0 0
45.2 27.35
0 0
0 0
0.66 0.4
14,278.69 8,639.12
172.52 104.38
1.17 0.71
0.16 0.1
0.38 0.23
3,747.40 2,267.31
1.5 0.91
808.88 489.4
0.46 0.28
2.36 1.43
1.19 0.72
0.02 0.01
0 0
23.35 14.13
0.98 0.59
0 0
20.31 12.29
12,907.07 7,809.24
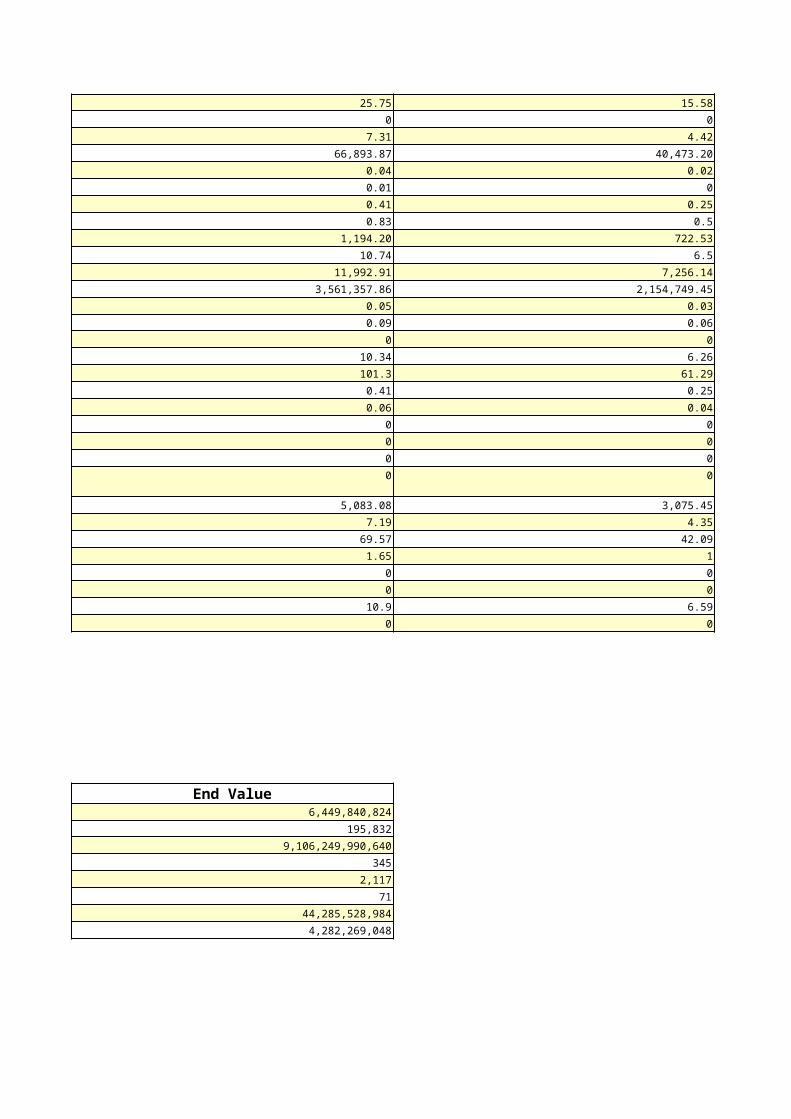
25.75 15.58
0 0
7.31 4.42
66,893.87 40,473.20
0.04 0.02
0.01 0
0.41 0.25
0.83 0.5
1,194.20 722.53
10.74 6.5
11,992.91 7,256.14
3,561,357.86 2,154,749.45
0.05 0.03
0.09 0.06
0 0
10.34 6.26
101.3 61.29
0.41 0.25
0.06 0.04
0 0
0 0
0 0
0 0
5,083.08 3,075.45
7.19 4.35
69.57 42.09
1.65 1
0 0
0 0
10.9 6.59
0 0
End Value6,449,840,824
195,832
9,106,249,990,640
345
2,117
71
44,285,528,984
4,282,269,048

per Hour1.43
'Data' columns suffixed with M,G,T,P are in multiples of 1024 other columns suffixed with K,M,G,T,P are in multiples of 1000
Reqs per sec Data per sec6.57 6.39665
26.5 2.80412
1.79 0.874427
4.88 0.094406
0.01 0.000108
0 0M
0 0M
0 0M
39.75 10.1697
'Data' columns suffixed with M,G,T,P are in multiples of 1024 other columns suffixed with K,M,G,T,P are in multiples of 1000
Reqs per sec Data per sec34.8 10.061
4.64 0.081691
0.02 0.014454

0.03 0.012051
0 0.000217
0.27 0.000326
39.75 10.1697
'Data' columns suffixed with M,G,T,P are in multiples of 1024 other columns suffixed with K,M,G,T,P are in multiples of 1000
Reqs per sec Data per sec6.57 6.39665
6.57 6.39665
26.5 2.80412
26.5 2.80412
1.79 0.874427
1.72 0.860371
0.03 0.012051
0.04 0.002004
4.62 0.094092
4.59 0.079577
0.02 0.014454
0 0M
0 0.00006
0.01 0.000108
0 0M
0.01 0.000108
0 0M
0 0M
0 0M
0 0M
0 0M
0 0M
39.49 10.1694
Av Reads/s Av Rd(ms)33 1.36
1 0.01
1 5.26
0 3.3
0 6.3
0 1.36

Reads Av Reads/s44,915 1
34,019 0
81 0
65,636 1
44 0
2,446,927 30
289,723 3
Pool Hit% Buffer Gets97 1,000,943,585
Log Ckpt Writes Other Settings Writes0 0

Estd MTTR (s) Recovery Estd IOs14 311
16 2046
Size Factor Buffers (thousands)
0.09 6
0.19 12
0.28 18
0.38 24
0.47 30
0.56 35
0.66 41
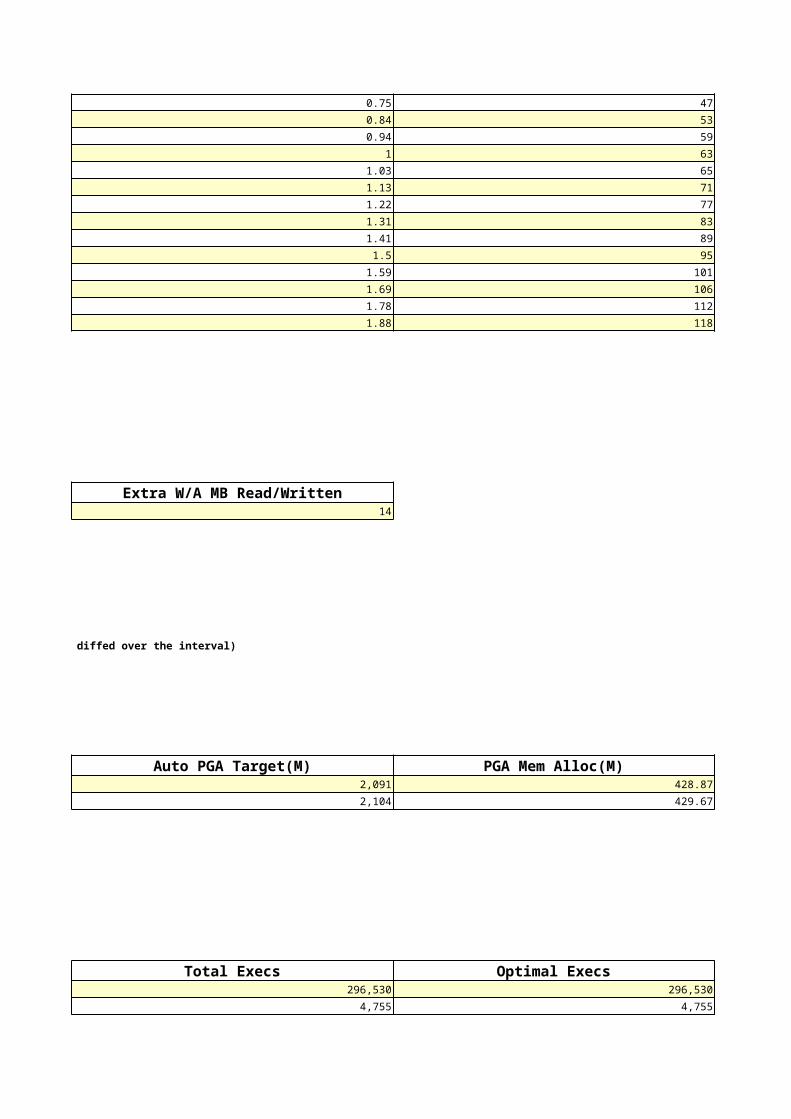
0.75 47
0.84 53
0.94 59
1 63
1.03 65
1.13 71
1.22 77
1.31 83
1.41 89
1.5 95
1.59 101
1.69 106
1.78 112
1.88 118
Extra W/A MB Read/Written14
B: Begin Snap E: End Snap (rows dentified with B or E contain data which is absolute i.e. not diffed over the interval)
Auto PGA Target(M) PGA Mem Alloc(M)2,091 428.87
2,104 429.67
Total Execs Optimal Execs296,530 296,530
4,755 4,755

8,028 8,028
1,662 1,662
134,781 134,781
339,381 339,381
110,276 110,272
48 48
6,806 6,806
When using Auto Memory Mgmt, minimally choose a pga_aggregate_target value where Estd PGA Overalloc Count is 0
W/A MB Processed
9,728,883.57 1,682,846.83
9,728,883.57 42.79
9,728,883.57 42.79
9,728,883.57 42.79
9,728,883.57 42.79
9,728,883.57 0
9,728,883.57 0
9,728,883.57 0
9,728,883.57 0
9,728,883.57 0
9,728,883.57 0
9,728,883.57 0
9,728,883.57 0
9,728,883.57 0
Note there is often a 1:Many correlation between a single logical object in the Library Cache, and the physical number of memory objects associated with it. Therefore comparing the number of Lib Cache objects (e.g. in v$librarycache), with the number of Lib Cache Memory Objects is invalid.
Est LC Size (M) Est LC Mem Obj53 2,169
148 5,987
244 9,097
340 11,906
435 15,182
531 17,814
627 19,920
722 22,646
818 25,775
914 28,754
1,010 31,866
Estd Extra W/A MB Read/ Written to Disk

1,086 34,092
1,113 34,673
1,166 37,459
Est DB Time (s) Est Physical Reads390,692 151,029,540
378,601 146,257,421
377,845 145,936,361
371,875 143,513,817
371,612 143,513,817
371,574 143,513,817
371,574 143,513,817
Est Spill Count Est Spill Time (s)0 0
0 0
0 0
0 0
0 0
0 0
0 0
0 0
0 0
0 0
0 0
0 0
0 0
0 0
0 0
0 0
0 0
0 0
0 0
0 0
Est LC Size (M) Est LC Mem Obj

11 181
17 301
18 318
Total Wait Time (s) Avg Time (ms)65 1
0 1
0 0
Succ Gets Failed Gets116 0
12,294 0
583,354 0
92,817 1
6,513 0
302,450 0
859 0
369 0
22,001 0
336,345 0

Number of Transactions Max Qry Len (s)220,773 1,600
Number of Transactions Max Qry Len (s)2,409 527
3,164 1,131
1,481 590
2,056 1,133
6,718 532
5,039 1,134
2,002 533
2,279 1,136
1,302 536
2,648 1,140
1,538 539
3,294 1,142
1,704 542
2,383 1,146
2,058 545
1,891 1,148
1,543 547
1,258 1,151
1,763 550
1,335 1,154
2,586 553
1,625 1,157
2,425 556
1,519 1,160
1,647 559
959 1,260
1,233 659

1,883 1,164
2,498 563
2,764 1,165
1,653 564
430 1,168
2,338 567
2,719 1,170
Pct Get Miss Avg Slps /Miss0
0
0
0
0 0.33
0
0
0 0
0
0.01 0
0
0
0 1
0 0
0
0
0
0
0
0
0
0

0 0.5
100 1
0
0
0
0
0
0
0
0
0
0
0
0
0
0
0
0
0
0
0
0
0
0
0
0
0
0
0
0
0
0
0
0
0
0
0
0
0
0
0
0
0
0
0
0
0
0
0
0
0
0
0

0
0
0
0
0 0.33
0
0
0
0
0
0
0
0
0
0
0
0
0
0
0.12 0.88
0
0
0
0
0.08 0
0.02 0.14
0
0 0.5
0
0
0
0 0
0 0
0
0
0
0
0
0
0
0
0
0
0
0
0
0 0.02
0.01 0.01
0
0
0
0
0
0
0
0
0
0
0
0
0
0
0
0
0
0
0
0
0
0
0
0
0
0.03 1
0
0
0
0
0
0
0
0
0
0
0
0
0
0
0
0
0
0
0
0
0
0
0.07 0.07
0
0.03 0
0
0
0
0
0
0
0
0

0
0
0
0
0
0
0
0
0.08 0
0.01 0.01
0.02 0.06
0
0 0.5
0
0
0
0 0
0
0
0
0
0
0
0
0
0
0
0
0
0
0
0
0
0
0
0
0
0.01 0.3
0
0 0
0
0
0
0
0
0
0
0
0
0
0
0
0.01 0.01
0

0
0
0
0 0
0
0 0.01
0
0
0
0
0.02 0.12
0
0
0
0 0.09
0.05 0.2
0
0
0.02 0
0
0
0
0
0
0
0
0
0
0
0 0
0
0
0
Misses Sleeps1,536,854 1,523
1,077 8
614 3
355 5
320 30
301 3
233 2
224 5
138 10
121 14
87 12
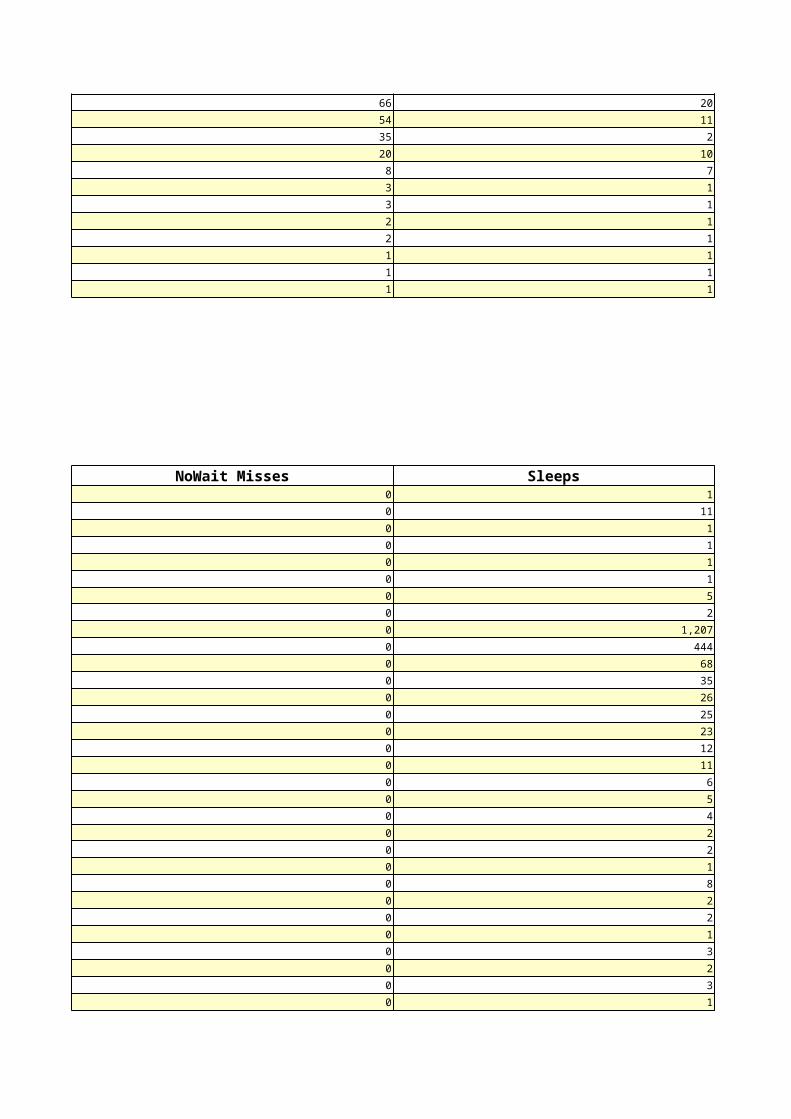
66 20
54 11
35 2
20 10
8 7
3 1
3 1
2 1
2 1
1 1
1 1
1 1
NoWait Misses Sleeps0 1
0 11
0 1
0 1
0 1
0 1
0 5
0 2
0 1,207
0 444
0 68
0 35
0 26
0 25
0 23
0 12
0 11
0 6
0 5
0 4
0 2
0 2
0 1
0 8
0 2
0 2
0 1
0 3
0 2
0 3
0 1

0 9
0 1
0 2
0 2
0 1
0 1
0 1
0 1
0 1
0 19
0 1
0 2
0 5
0 2
0 4
0 2
0 10
0 3
0 1
0 1
0 28
0 1
0 1
0 11
Sleeps Wait Time (ms)401 398
300 8
211 293
116 159
101 31
4 0
4 58
1 0
1 0
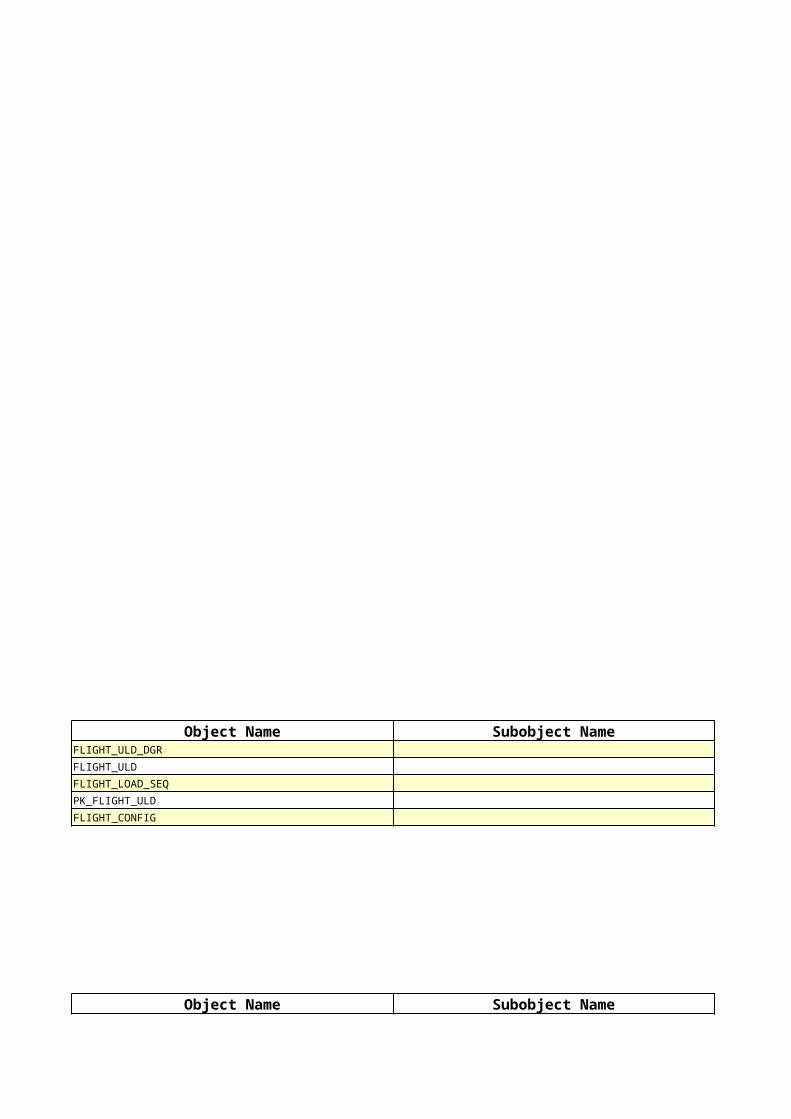
Object Name Subobject NameFLIGHT_ULD_DGR
FLIGHT_ULD
FLIGHT_LOAD_SEQ
PK_FLIGHT_ULD
FLIGHT_CONFIG
Object Name Subobject Name

FLIGHT_ULD
LOADSHEETACARS
AUDIT_LOG
AUD$
IDX_AUDIT_LOG
Object Name Subobject NameFLIGHT_ULD
IDX_AUDIT_LOG
PK_AUDIT_LOG
AUDIT_LOG
LOADSHEETACARS
Object Name Subobject NameFLIGHT_ULD
IDX_AUDIT_LOG
PK_AUDIT_LOG
AUDIT_LOG
LOADSHEETACARS

Object Name Subobject NameFLIGHT_ULD
LOADSHEETACARS
AUDIT_LOG
AUD$
COLTYPE$
Object Name Subobject NameIDXTUN_AUDIT_LOG
IDX_AUDIT_LOG
PK_AUDIT_LOG
AUDIT_LOG
FLIGHT_ULD
Object Name Subobject NameIDXTUN_AUDIT_LOG
IDX_AUDIT_LOG
FLIGHT_ULD
AUDIT_LOG
PK_AUDIT_LOG
Object Name Subobject NameSYS_LOB0000091730C00008$$
SYS_LOB0000091730C00004$$
TEMP_FLIGHT_ULD
SDO_GEOR_DDL__TABLE$$

** MISSING: 176188/5329536 ** MISSING **
Object Name Subobject NameFLIGHT_ULD
PK_FLIGHT_ULD
UK_ACT_DECK_LOAD_POS_NAU
UK_ACTDLPD_ACTDLP_ID_DGR_ID
LOADSHEETACARS
Object Name Subobject NameFLIGHT_LOAD_SEQ
FLIGHT_ULD
IDX_AUDIT_LOG
IDXTUN_AUDIT_LOG
PK_AUDIT_LOG
Object Name Subobject NameIDX_AUDIT_LOG
PK_AUDIT_LOG
IDXTUN_AUDIT_LOG
NDX_TT_TIMESTAMP
PK_AUDIT_FLIGHT
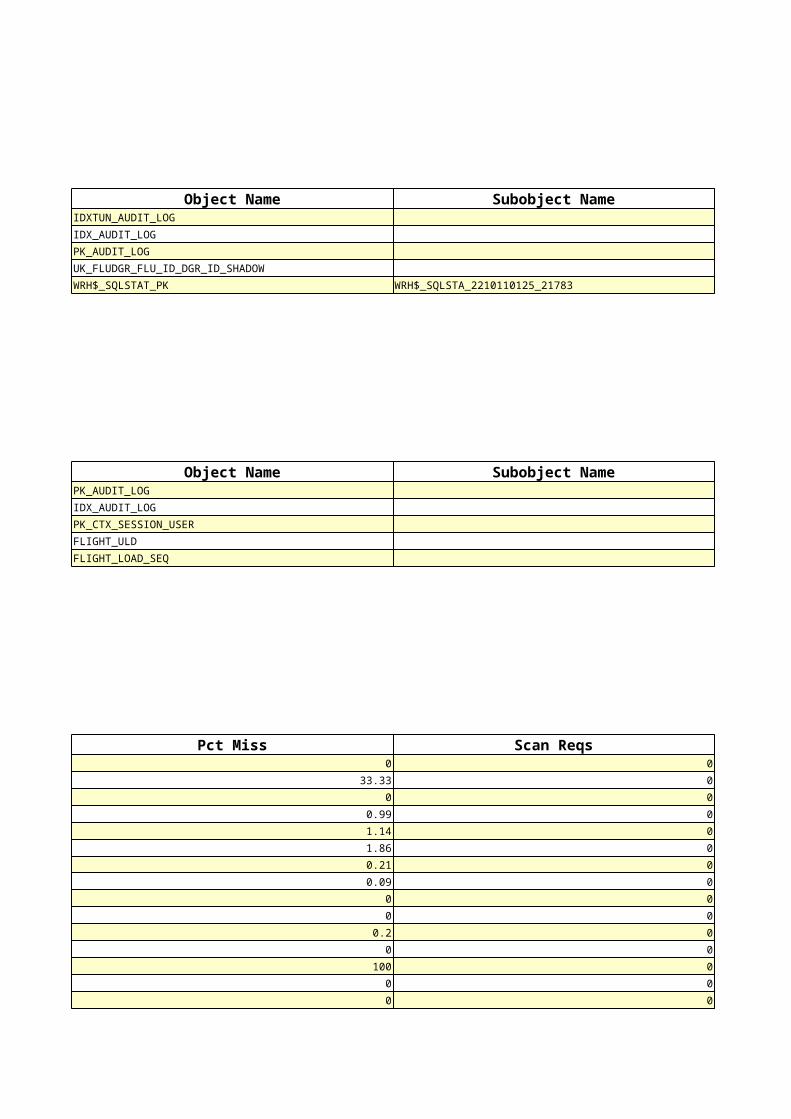
Object Name Subobject NameIDXTUN_AUDIT_LOG
IDX_AUDIT_LOG
PK_AUDIT_LOG
UK_FLUDGR_FLU_ID_DGR_ID_SHADOW
WRH$_SQLSTAT_PK WRH$_SQLSTA_2210110125_21783
Object Name Subobject NamePK_AUDIT_LOG
IDX_AUDIT_LOG
PK_CTX_SESSION_USER
FLIGHT_ULD
FLIGHT_LOAD_SEQ
Pct Miss Scan Reqs0 0
33.33 0
0 0
0.99 0
1.14 0
1.86 0
0.21 0
0.09 0
0 0
0 0
0.2 0
0 0
100 0
0 0
0 0

0 0
0 0
0 0
0 0
0 0
16.67 0
1.29 0
Pct Miss Pin Requests0.06 0
0 2
0.15 1,670,754
0.4 511
0 0
57.14 14
0 2,694
7.21 2,215
0 0
100 1
100 0
0 16,638
0.05 0
0 259
0.34 6,265,293
73.15 0
65.69 3,433
0.74 2,362,299
64.2 176
17.76 490
0.23 1,106,753
0 82
0 82
0 738
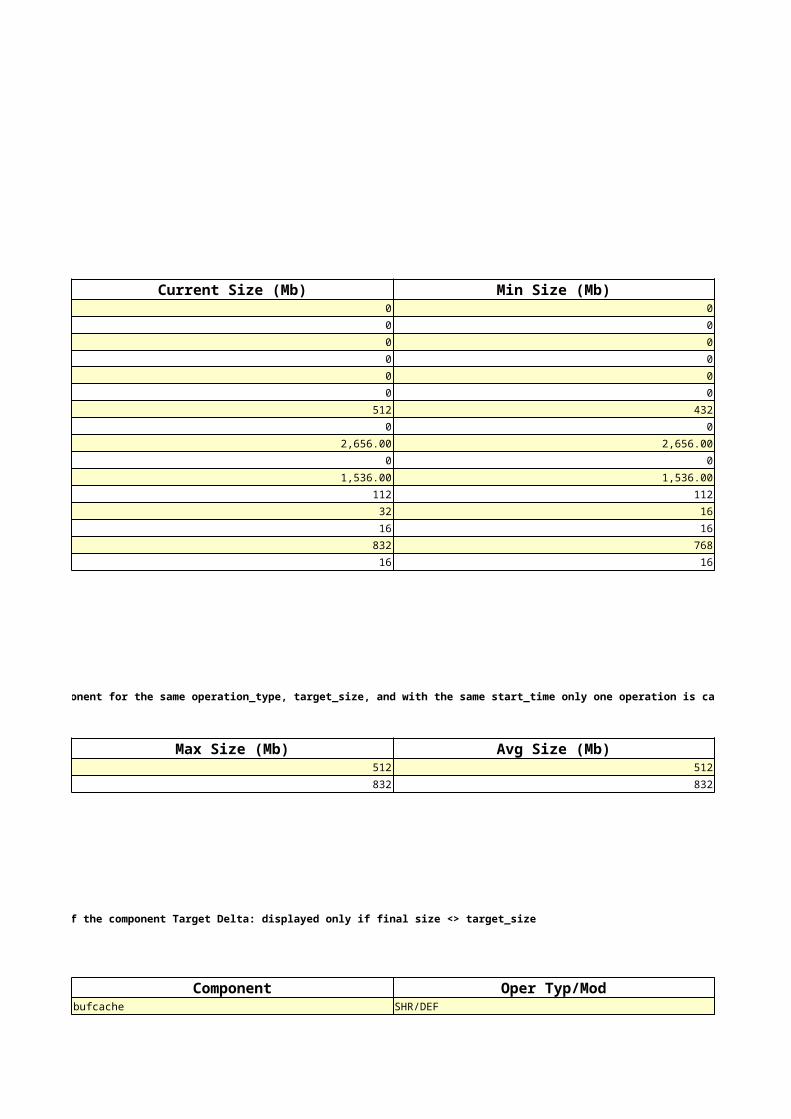
Current Size (Mb) Min Size (Mb)0 0
0 0
0 0
0 0
0 0
0 0
512 432
0 0
2,656.00 2,656.00
0 0
1,536.00 1,536.00
112 112
32 16
16 16
832 768
16 16
Resizes, Grows, Shrinks - Operations captured by AWR if there are operations on the same component for the same operation_type, target_size, and with the same start_time only one operation is captured
Max Size (Mb) Avg Size (Mb)512 512
832 832
Oper Types/Modes: INItializing,GROw,SHRink,STAtic/IMMediate,DEFerred Delta : change in size of the component Target Delta: displayed only if final size <> target_size
Component Oper Typ/Modbufcache SHR/DEF
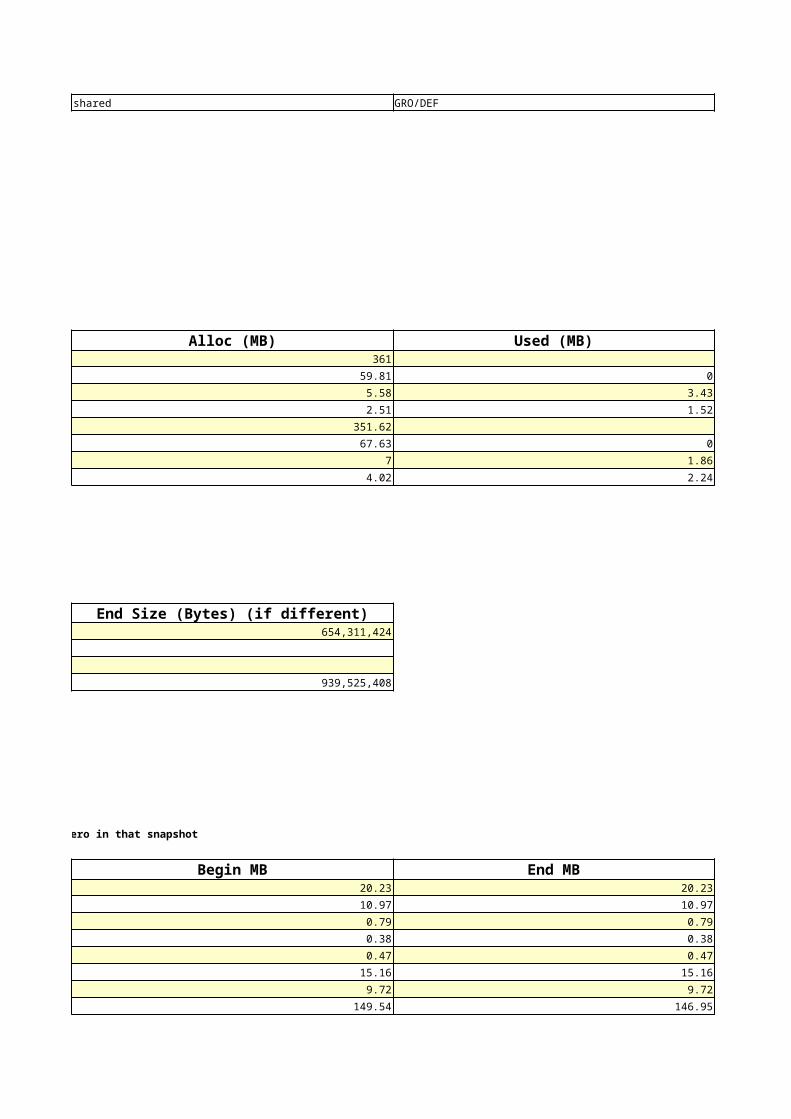
shared GRO/DEF
Alloc (MB) Used (MB)361
59.81 0
5.58 3.43
2.51 1.52
351.62
67.63 0
7 1.86
4.02 2.24
End Size (Bytes) (if different)654,311,424
939,525,408
N/A value for Begin MB or End MB indicates the size of that Pool/Name was insignificant, or zero in that snapshot
Begin MB End MB20.23 20.23
10.97 10.97
0.79 0.79
0.38 0.38
0.47 0.47
15.16 15.16
9.72 9.72
149.54 146.95
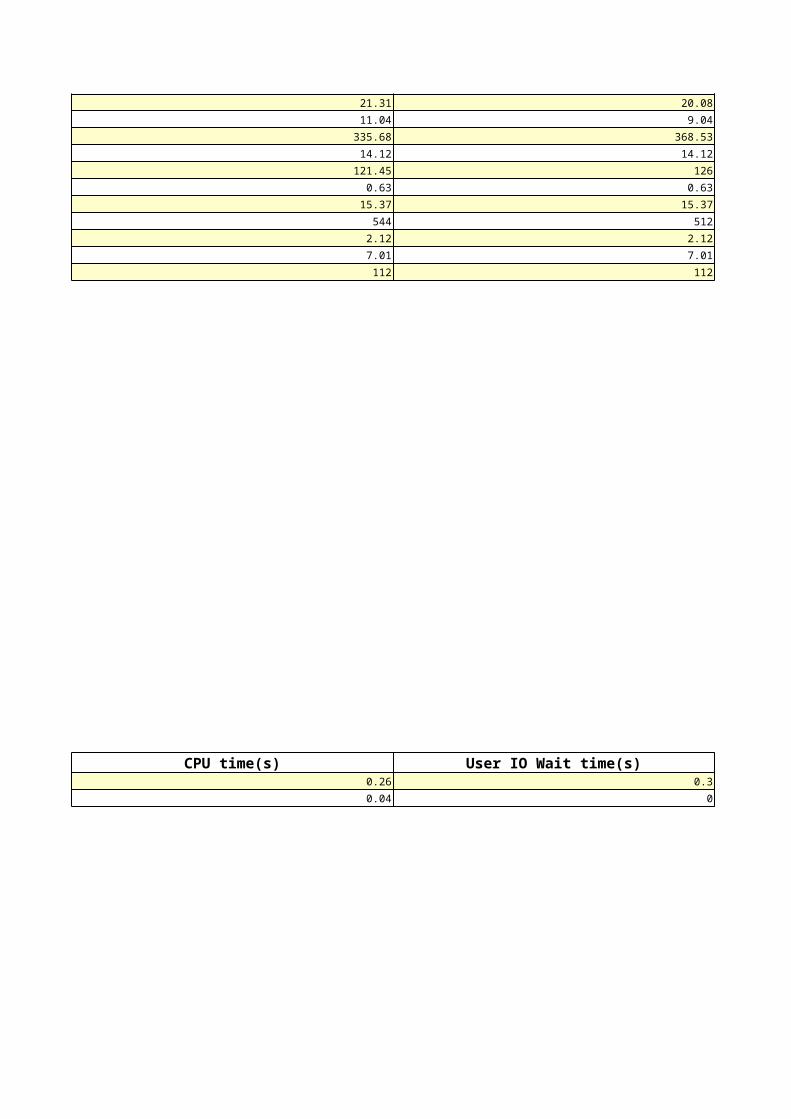
21.31 20.08
11.04 9.04
335.68 368.53
14.12 14.12
121.45 126
0.63 0.63
15.37 15.37
544 512
2.12 2.12
7.01 7.01
112 112
CPU time(s) User IO Wait time(s)0.26 0.3
0.04 0

Deq Msgs %Exp Msgs0
Dequeue Msgs/sec Avg Enqueue sec / msg0
Dequeue Msgs Expire Msgs0 0
0 0
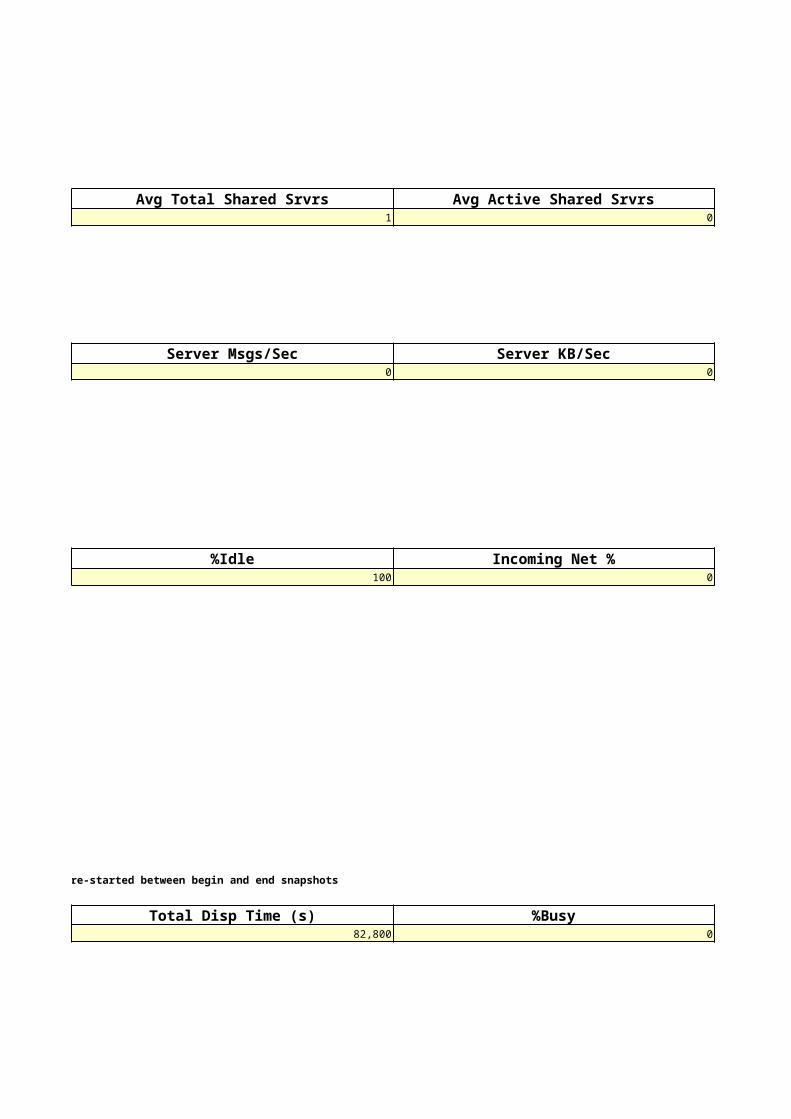
Avg Total Shared Srvrs Avg Active Shared Srvrs1 0
Server Msgs/Sec Server KB/Sec0 0
%Idle Incoming Net %100 0
Name suffixes: "(N)" - dispatcher started between begin and end snapshots "(R)" - dispatcher re-started between begin and end snapshots
Total Disp Time (s) %Busy82,800 0
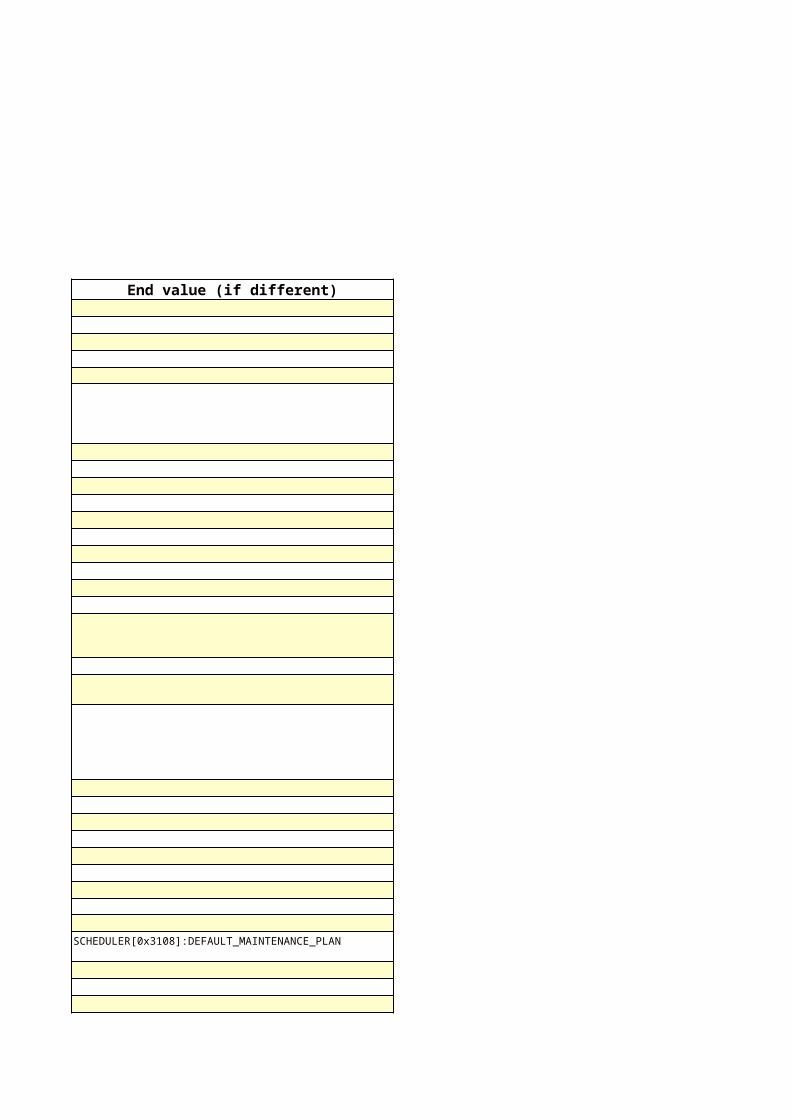
End value (if different)
SCHEDULER[0x3108]:DEFAULT_MAINTENANCE_PLAN

End value (if different)

Startup Time Release5/28/2013 17:05 11.2.0.2.0
Sockets Memory (GB)7.67
Cursors/Session3.3
4.9
8K
7,176K
Per Call0.01
0.01
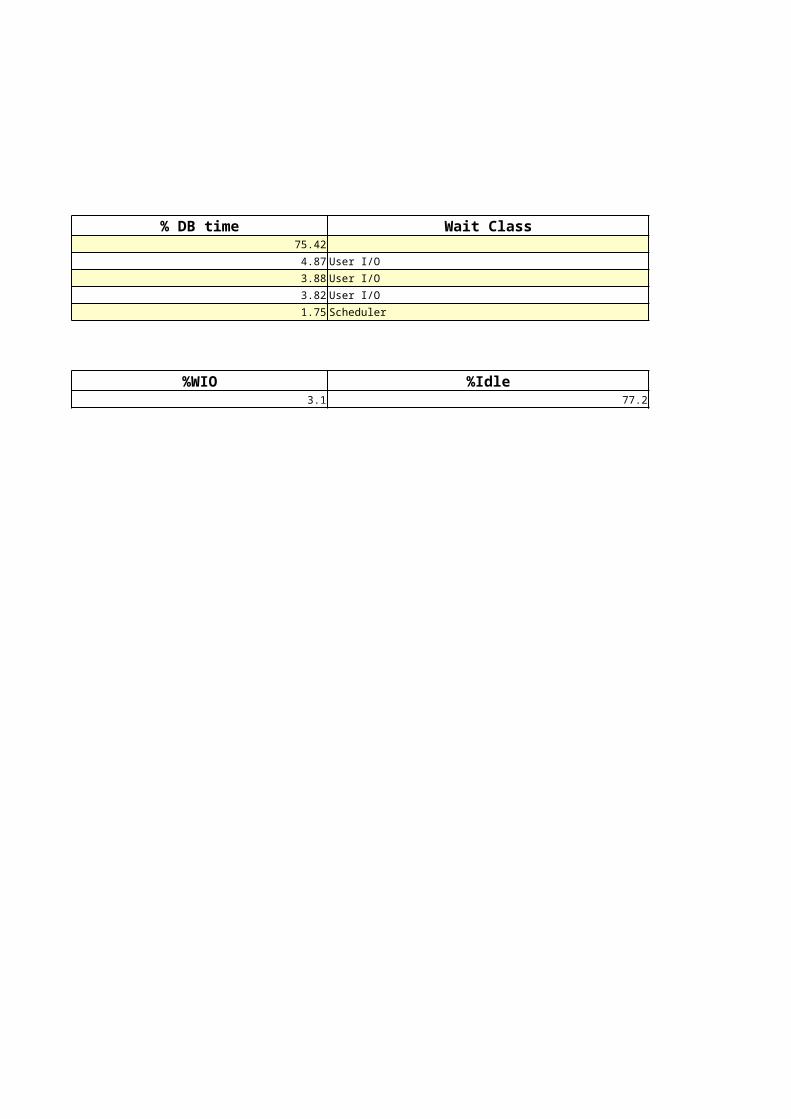
% DB time Wait Class75.42
4.87 User I/O
3.88 User I/O
3.82 User I/O
1.75 Scheduler
%WIO %Idle3.1 77.2
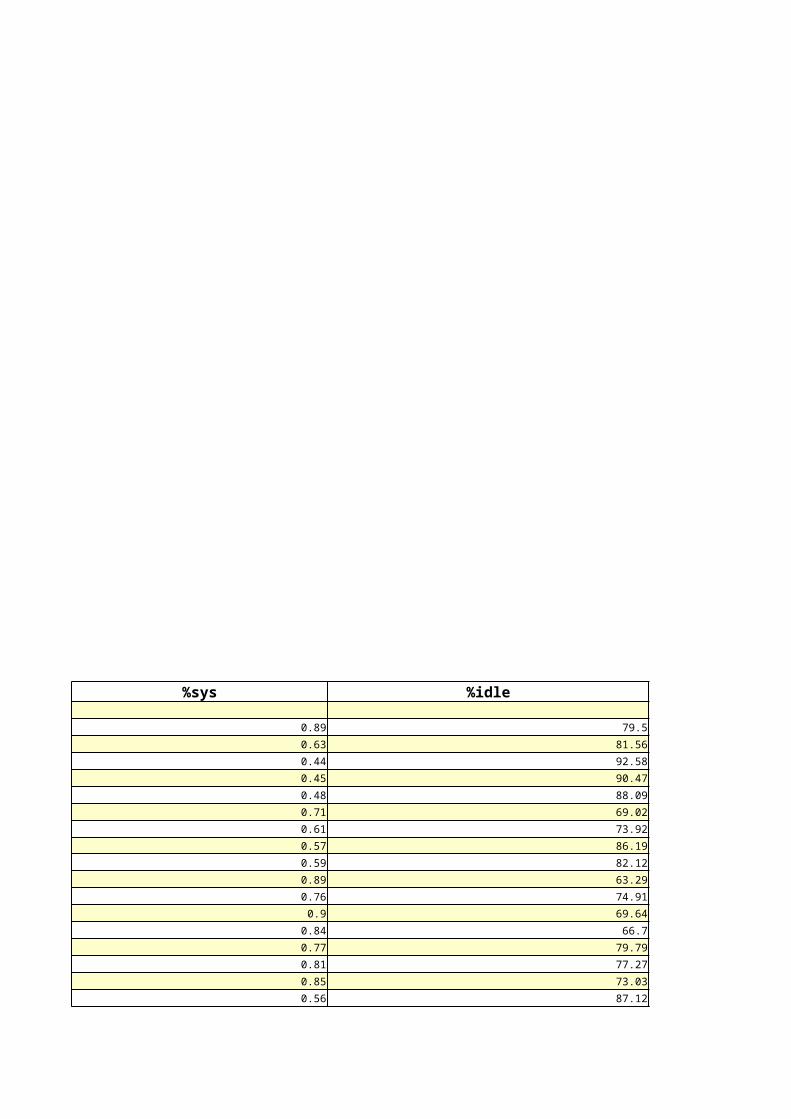
%sys %idle
0.89 79.5
0.63 81.56
0.44 92.58
0.45 90.47
0.48 88.09
0.71 69.02
0.61 73.92
0.57 86.19
0.59 82.12
0.89 63.29
0.76 74.91
0.9 69.64
0.84 66.7
0.77 79.79
0.81 77.27
0.85 73.03
0.56 87.12

1.02 75.03
0.8 69.37
0.61 78
0.62 78.92
0.62 75.96
0.89 61.74
Avg wait (ms) %DB time75.42
2 12.72
69 1.75
2 0.66
1 0.17
0 0.15
25 0.13
25 0.08
0 0.04
284 0
4 0
Avg wait (ms) Waits /txn2 9.21
2 6.64
4 3.63
69 0.09
2 0.89
1 0.63
2 0.21
1839 0
17 0.01
0 38.33
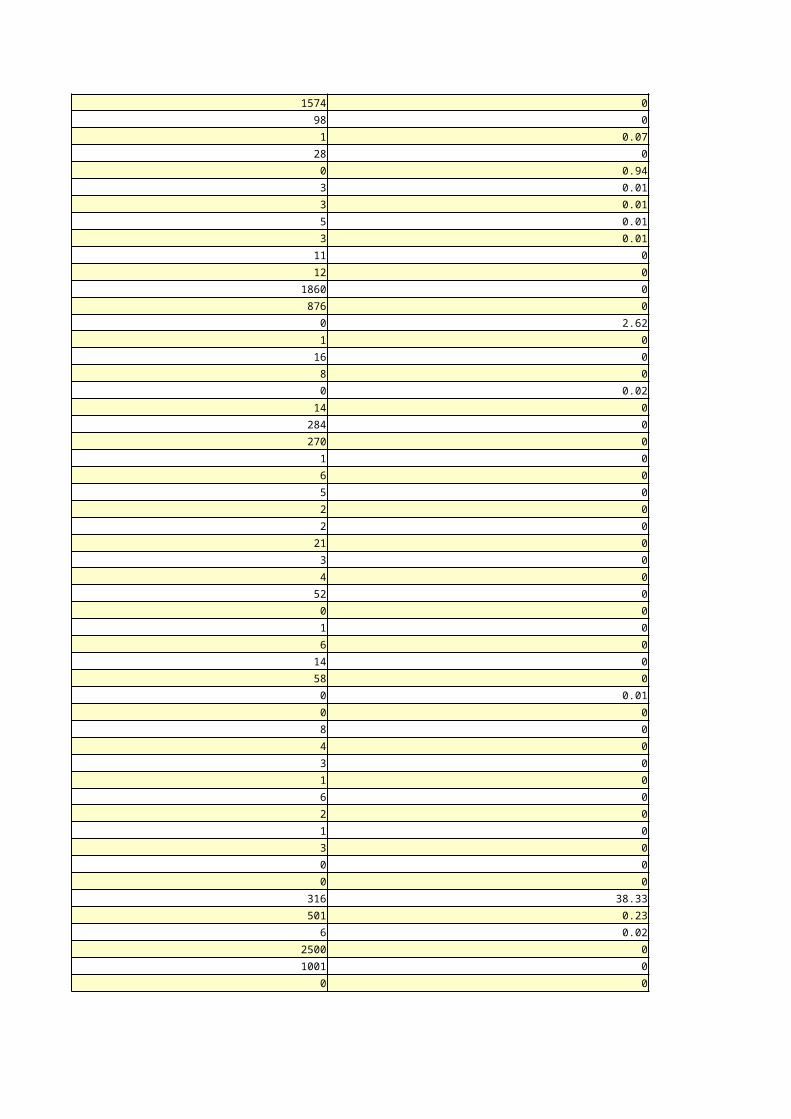
1574 0
98 0
1 0.07
28 0
0 0.94
3 0.01
3 0.01
5 0.01
3 0.01
11 0
12 0
1860 0
876 0
0 2.62
1 0
16 0
8 0
0 0.02
14 0
284 0
270 0
1 0
6 0
5 0
2 0
2 0
21 0
3 0
4 0
52 0
0 0
1 0
6 0
14 0
58 0
0 0.01
0 0
8 0
4 0
3 0
1 0
6 0
2 0
1 0
3 0
0 0
0 0
316 38.33
501 0.23
6 0.02
2500 0
1001 0
0 0
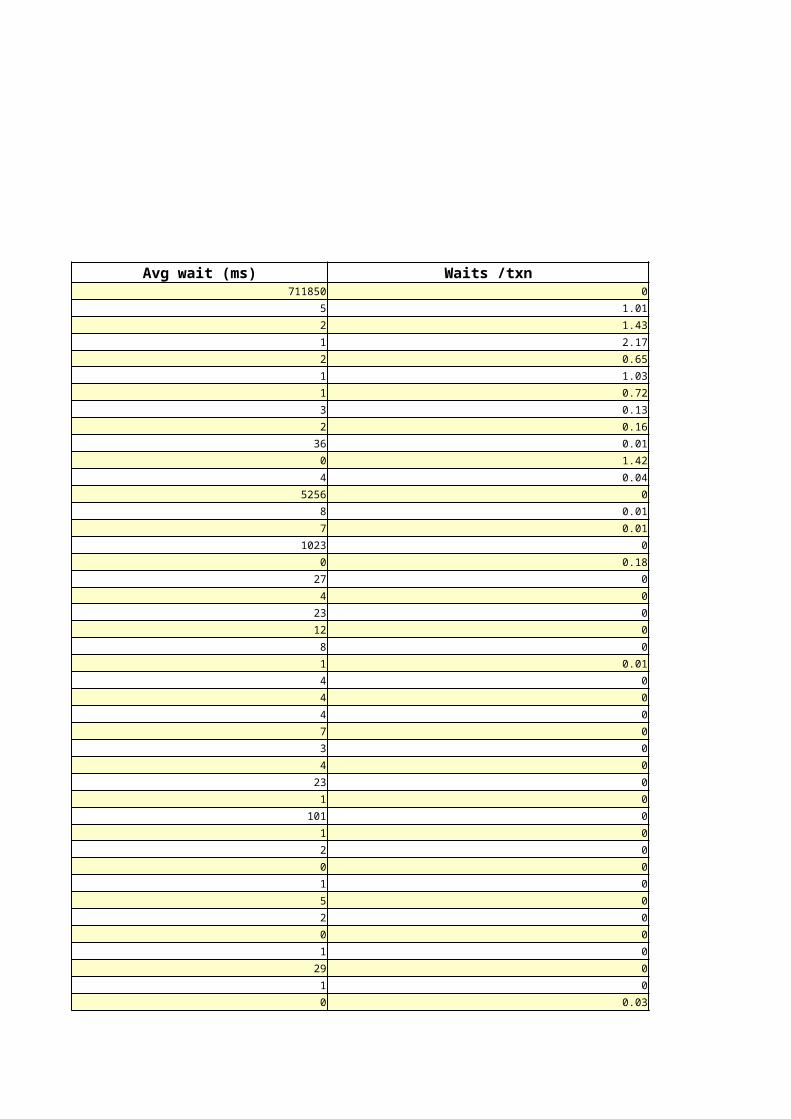
Avg wait (ms) Waits /txn711850 0
5 1.01
2 1.43
1 2.17
2 0.65
1 1.03
1 0.72
3 0.13
2 0.16
36 0.01
0 1.42
4 0.04
5256 0
8 0.01
7 0.01
1023 0
0 0.18
27 0
4 0
23 0
12 0
8 0
1 0.01
4 0
4 0
4 0
7 0
3 0
4 0
23 0
1 0
101 0
1 0
2 0
0 0
1 0
5 0
2 0
0 0
1 0
29 0
1 0
0 0.03
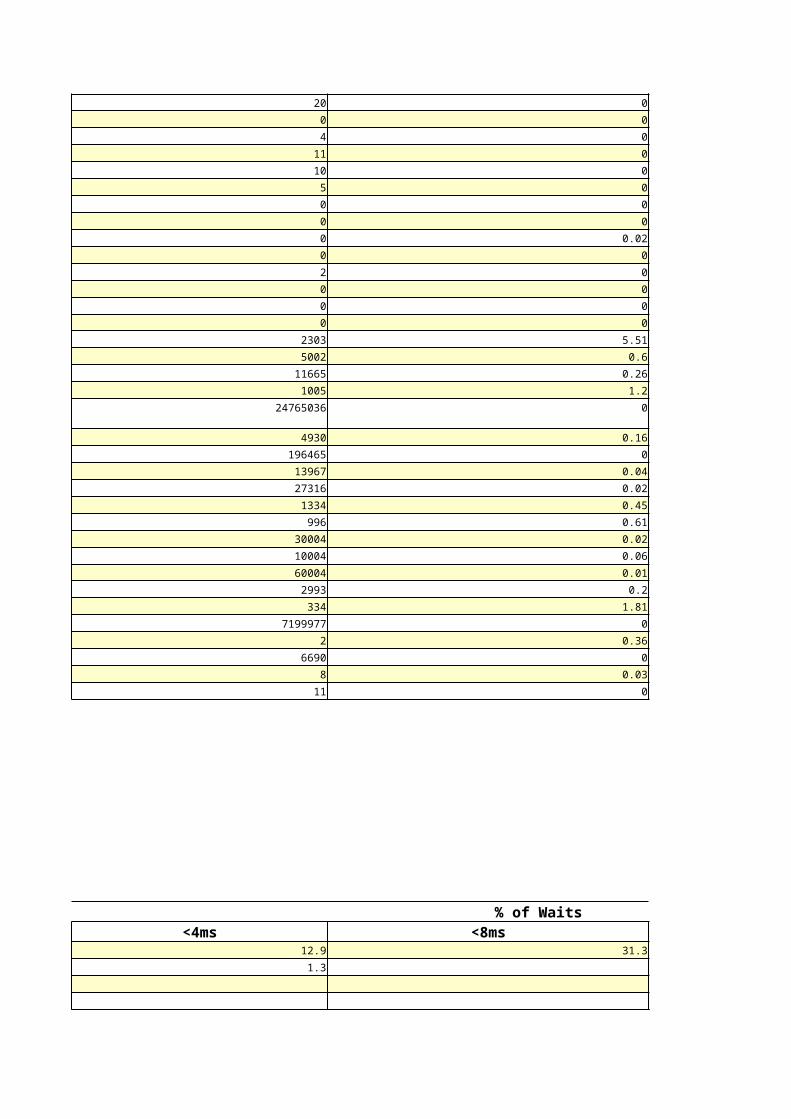
20 0
0 0
4 0
11 0
10 0
5 0
0 0
0 0
0 0.02
0 0
2 0
0 0
0 0
0 0
2303 5.51
5002 0.6
11665 0.26
1005 1.2
24765036 0
4930 0.16
196465 0
13967 0.04
27316 0.02
1334 0.45
996 0.61
30004 0.02
10004 0.06
60004 0.01
2993 0.2
334 1.81
7199977 0
2 0.36
6690 0
8 0.03
11 0
% of Waits<4ms <8ms
12.9 31.3
1.3
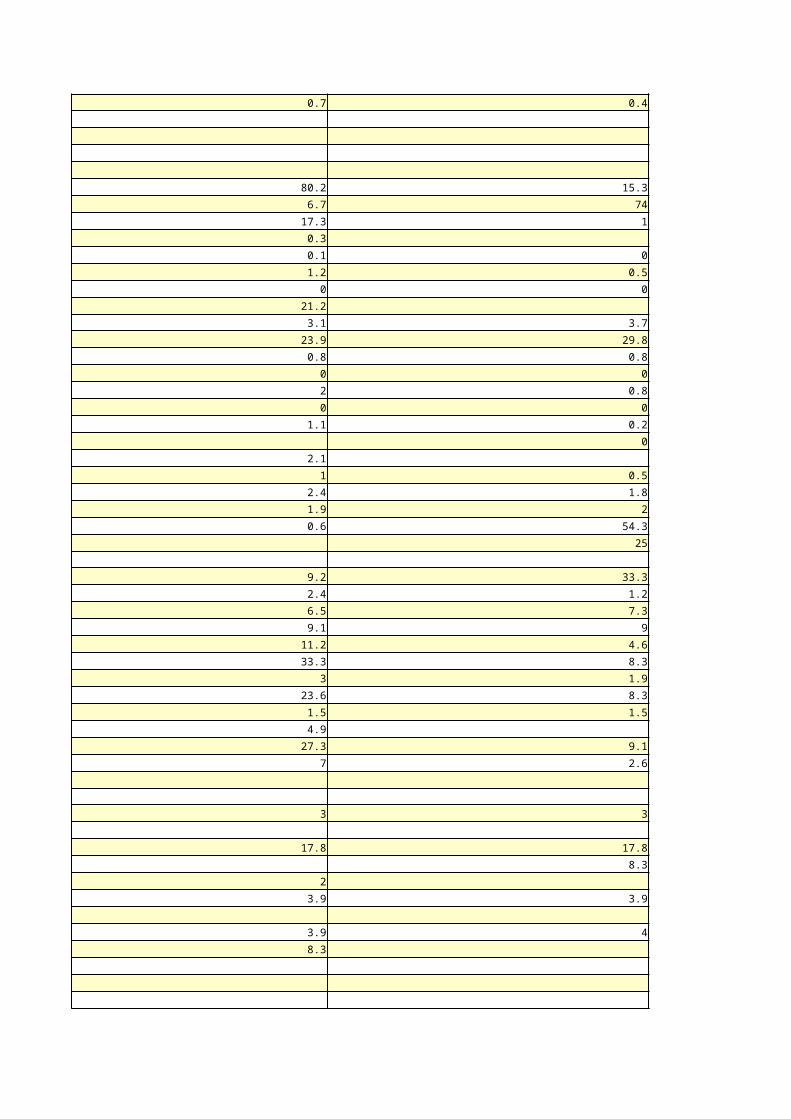
0.7 0.4
80.2 15.3
6.7 74
17.3 1
0.3
0.1 0
1.2 0.5
0 0
21.2
3.1 3.7
23.9 29.8
0.8 0.8
0 0
2 0.8
0 0
1.1 0.2
0
2.1
1 0.5
2.4 1.8
1.9 2
0.6 54.3
25
9.2 33.3
2.4 1.2
6.5 7.3
9.1 9
11.2 4.6
33.3 8.3
3 1.9
23.6 8.3
1.5 1.5
4.9
27.3 9.1
7 2.6
3 3
17.8 17.8
8.3
2
3.9 3.9
3.9 4
8.3

14.3 7.1
100
3.4 6.9
0.5 0.8
2.5 1.7
10.9 15.5
1.5
3.6 2.3
1
8.3 7.3
1.1 0.6
2.8 5.2
1.7 1
1.4 0.7
6.9 7.5
5.1 4.3
0 0
0.2 0.1
2 1.7
0
1.7 2.3
0.7 1.2
2.6 0.8

% of Total Waits<1/8s <1/4s
0.1
0.1 0
0
0 0
0.2 0.3
0.1 0
0 0
0 0
0
0.8 0.3
0.4 0.2
0.1 0
0.6
0.4 0.4
0.2 0.1
0.1 0
0.2 0.1
0.2 0.1
0.6 0.4
1.4
4.5
0.6 0.1
4.4 2.2
0.6
7.1
6.9
0.4 0.1
1 0.1
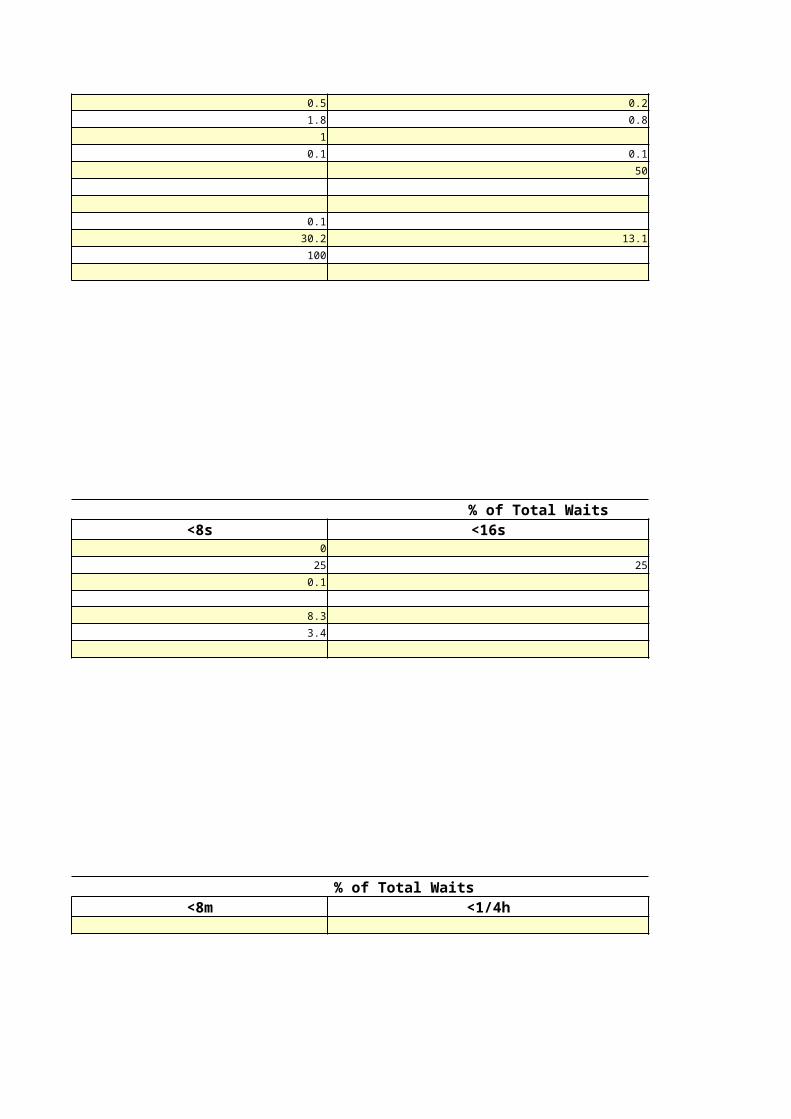
0.5 0.2
1.8 0.8
1
0.1 0.1
50
0.1
30.2 13.1
100
% of Total Waits<8s <16s
0
25 25
0.1
8.3
3.4
% of Total Waits<8m <1/4h

Logical Reads (K)1,065,600
1,702
0
1,518
Concurcy Wt Time Admin Total Wts59 0
0 5843
35 0
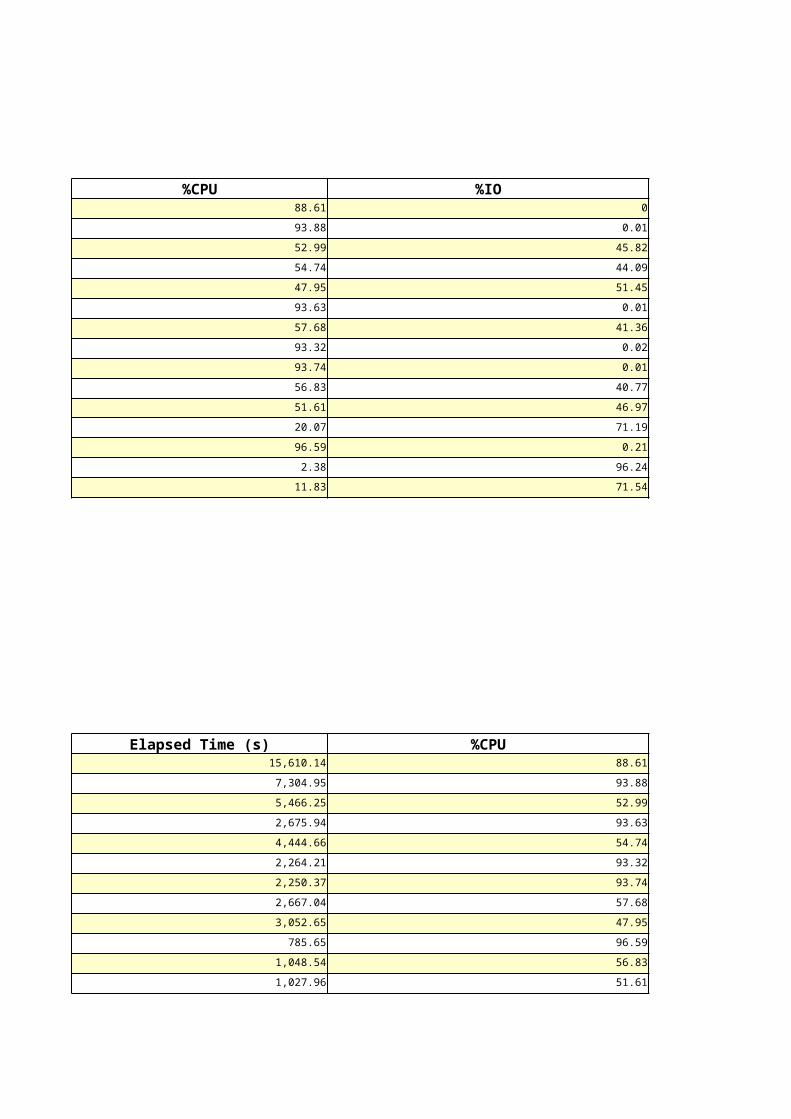
%CPU %IO88.61 0
93.88 0.01
52.99 45.82
54.74 44.09
47.95 51.45
93.63 0.01
57.68 41.36
93.32 0.02
93.74 0.01
56.83 40.77
51.61 46.97
20.07 71.19
96.59 0.21
2.38 96.24
11.83 71.54
Elapsed Time (s) %CPU15,610.14 88.61
7,304.95 93.88
5,466.25 52.99
2,675.94 93.63
4,444.66 54.74
2,264.21 93.32
2,250.37 93.74
2,667.04 57.68
3,052.65 47.95
785.65 96.59
1,048.54 56.83
1,027.96 51.61

Elapsed Time (s) %CPU5,466.25 52.99
4,444.66 54.74
3,052.65 47.95
2,667.04 57.68
963.63 20.07
600.45 2.38
1,027.96 51.61
1,048.54 56.83
502.33 11.83
275.85 40.11
140.25 0.89
132.16 4.88
150.06 3.99
113.47 1.35
84.95 14.63
Elapsed Time (s) %CPU2,675.94 93.63
7,304.95 93.88
2,264.21 93.32
2,250.37 93.74
15,610.14 88.61
5,466.25 52.99

3,052.65 47.95
4,444.66 54.74
2,667.04 57.68
1,048.54 56.83
785.65 96.59
71.37 96.1
156.37 79.86
1,027.96 51.61
Elapsed Time (s) %CPU3,052.65 47.95
5,466.25 52.99
4,444.66 54.74
2,667.04 57.68
1,027.96 51.61
1,048.54 56.83
132.16 4.88
275.85 40.11
112.1 62.79
31.32 20.83
%Opt %Total0 56.76

0 52.81
0 37.58
0 19.25
0 11.53
0 10.07
0 7.68
0 6.28
0 2.15
0 1.46
0 1.45
%CPU %IO97.5 0
99.41 0
91.73 0.26
91.57 0
88.61 0
93.88 0.01
93.63 0.01
93.74 0.01
93.32 0.02
92.92 0.31
86.2 1.37
96.1 0.29
96.82 0
90.63 2.3
SQL Module SQL TextTOAD background query session DELETE FROM CTX_SESSION WHERE ...

update seq$ set increment$=:2,...
JDBC Thin Client BEGIN pack_audit.set_context_u...
JDBC Thin Client DELETE FROM ctx_user
select condition from cdef$ wh...
SELECT value, type FROM v$para...
SELECT value FROM v$parameter ...
SELECT dest_id FROM v$archive_...
JDBC Thin Client select FLL_DATE, FLL_USR_CODE ...
select /*+ connect_by_filterin...
SQL Module SQL TextJDBC Thin Client select fl_id, acr_act_id, fl_t...
JDBC Thin Client select fl_id, acr_act_id, fl_t...
JDBC Thin Client INSERT INTO FLIGHT (FL_S_FBLST...
JDBC Thin Client select fl_id, acr_act_id, fl_t...
SQL Developer SELECT 'SCHEMA' type, username...
SQL Developer SELECT object_type type, owner...
SQL Developer SELECT 'SCHEMA' type, username...
SQL Developer SELECT object_type type, owner...
SQL Developer SELECT object_type type, owner...
select OBJOID, CLSOID, RUNTIME...
JDBC Thin Client UPDATE FLIGHT SET FL_S_FBLST =...
JDBC Thin Client select fl_id, acr_act_id, fl_t...
emagent_SQL_oracle_database SELECT PROPAGATION_NAME, MESS...
SQL Developer SELECT object_type type, owner...
SQL Developer SELECT 'SCHEMA' type, username...
SELECT source, (case when tim...
JDBC Thin Client SELECT STEP, ORDERED_DATA_WITH...
SQL Developer SELECT 'SCHEMA' type, username...
select nvl2(stale_stats, decod...
emagent_SQL_oracle_database select a.capture_name streams_...
DBMS_SCHEDULER SELECT /*+ rule */ U.NAME, OT....
SQL Developer SELECT 'SCHEMA' type, username...
SQL Developer SELECT 'SCHEMA' type, username...
JDBC Thin Client INSERT INTO FLIGHT_ULD (FLU_UL...
SQL Developer select table_owner, table_name...
JDBC Thin Client INSERT INTO FLIGHT_ULD (FLU_UL...
JDBC Thin Client UPDATE FLIGHT_ULD SET FLU_ULD_...
SQL Developer select table_owner, table_name...
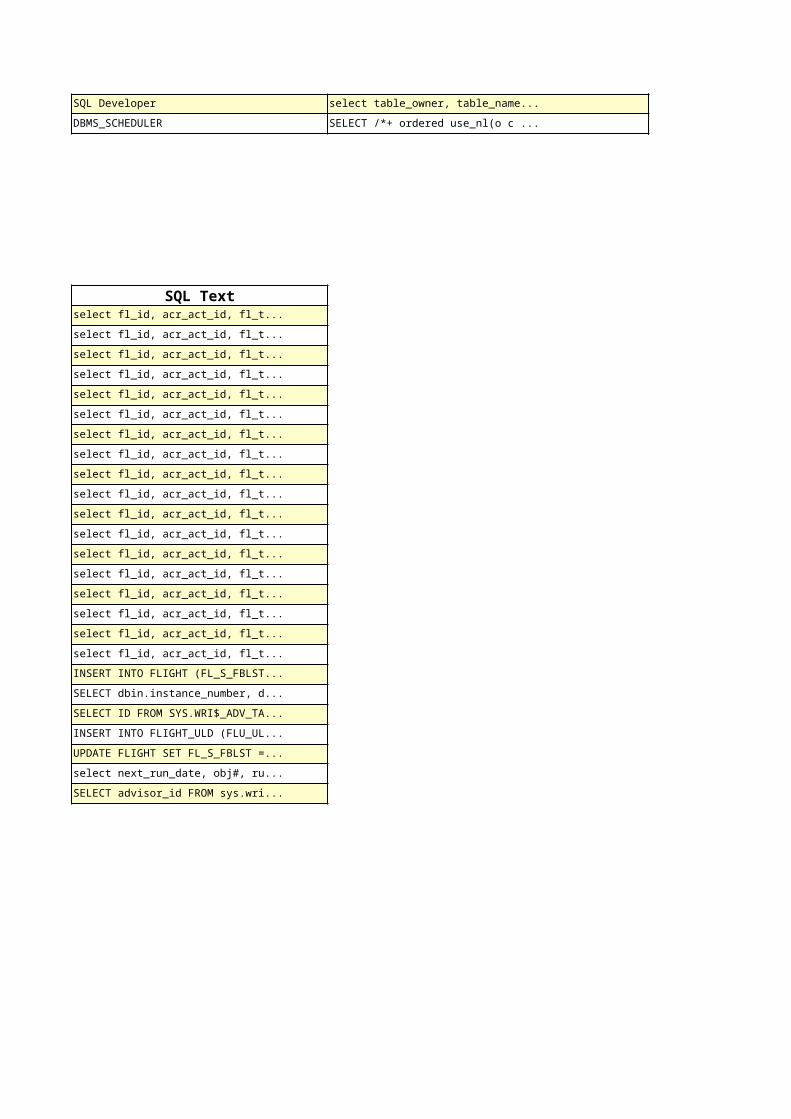
SQL Developer select table_owner, table_name...
DBMS_SCHEDULER SELECT /*+ ordered use_nl(o c ...
SQL Textselect fl_id, acr_act_id, fl_t...
select fl_id, acr_act_id, fl_t...
select fl_id, acr_act_id, fl_t...
select fl_id, acr_act_id, fl_t...
select fl_id, acr_act_id, fl_t...
select fl_id, acr_act_id, fl_t...
select fl_id, acr_act_id, fl_t...
select fl_id, acr_act_id, fl_t...
select fl_id, acr_act_id, fl_t...
select fl_id, acr_act_id, fl_t...
select fl_id, acr_act_id, fl_t...
select fl_id, acr_act_id, fl_t...
select fl_id, acr_act_id, fl_t...
select fl_id, acr_act_id, fl_t...
select fl_id, acr_act_id, fl_t...
select fl_id, acr_act_id, fl_t...
select fl_id, acr_act_id, fl_t...
select fl_id, acr_act_id, fl_t...
INSERT INTO FLIGHT (FL_S_FBLST...
SELECT dbin.instance_number, d...
SELECT ID FROM SYS.WRI$_ADV_TA...
INSERT INTO FLIGHT_ULD (FLU_UL...
UPDATE FLIGHT SET FL_S_FBLST =...
select next_run_date, obj#, ru...
SELECT advisor_id FROM sys.wri...
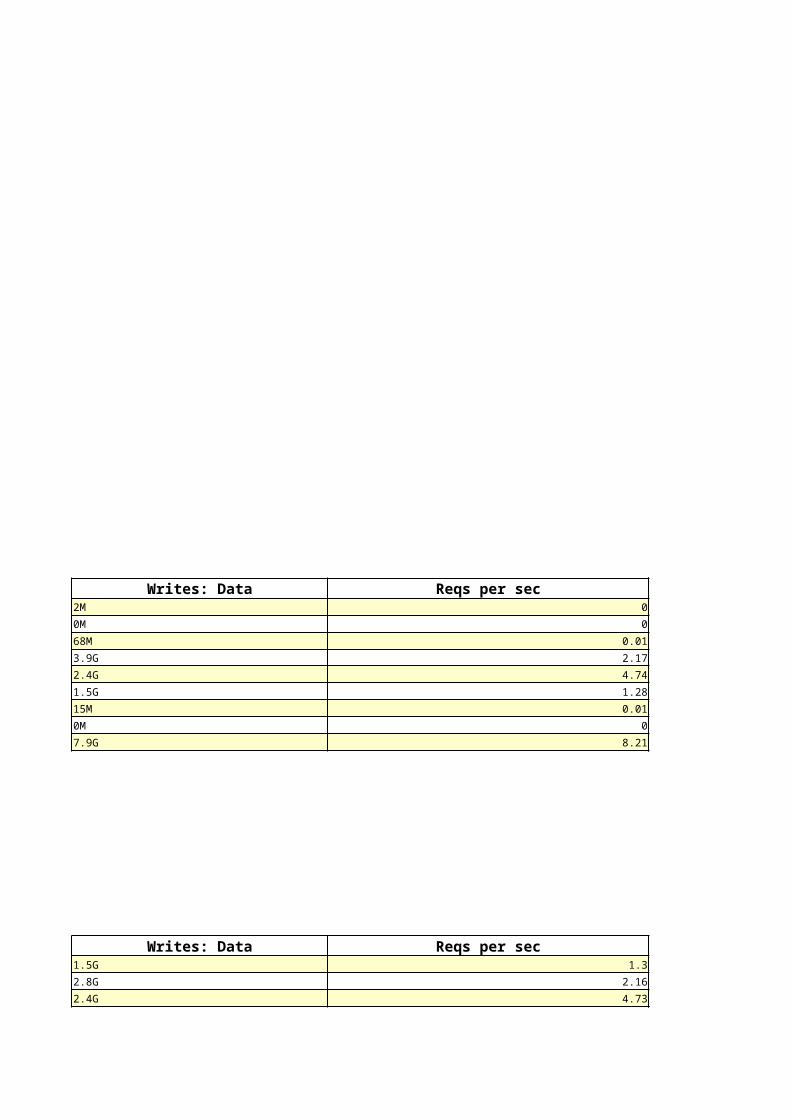
Writes: Data Reqs per sec2M 0
0M 0
68M 0.01
3.9G 2.17
2.4G 4.74
1.5G 1.28
15M 0.01
0M 0
7.9G 8.21
Writes: Data Reqs per sec1.5G 1.3
2.8G 2.16
2.4G 4.73

1.2G 0.01
18M 0
0M 0
7.9G 8.21
Writes: Data Reqs per sec2M 0
2M 0
0M 0
0M 0
68M 0.01
0M 0
0M 0
68M 0.01
3.9G 2.17
2.8G 2.14
0M 0
1.2G 0.01
16M 0.01
2.4G 4.74
2.4G 4.73
11M 0.01
1.5G 1.28
1.5G 1.28
15M 0.01
15M 0.01
0M 0
0M 0
7.9G 8.21
Av Blks/Rd Writes37.11 76,185
63.9 13,806
6.77 14,273
17.7 3,629
27.11 125
15.3 33

Av Rd(ms) Av Blks/Rd5.26 6.77
3.3 17.7
6.3 27.11
0.01 63.9
1.36 15.3
1.37 38.44
1.3 25.84
Physical Reads Physical Writes29,723,407 191,016
Autotune Ckpt Writes Thread Ckpt Writes171,346 0

Actual RedoBlks Target RedoBlks1764 13737
36297 112060
Est Phys Read Factor Estimated Phys Reads (thousands)
1.26 184,176
1.03 150,818
1.01 147,189
1 146,414
1 146,164
1 146,061
1 146,013
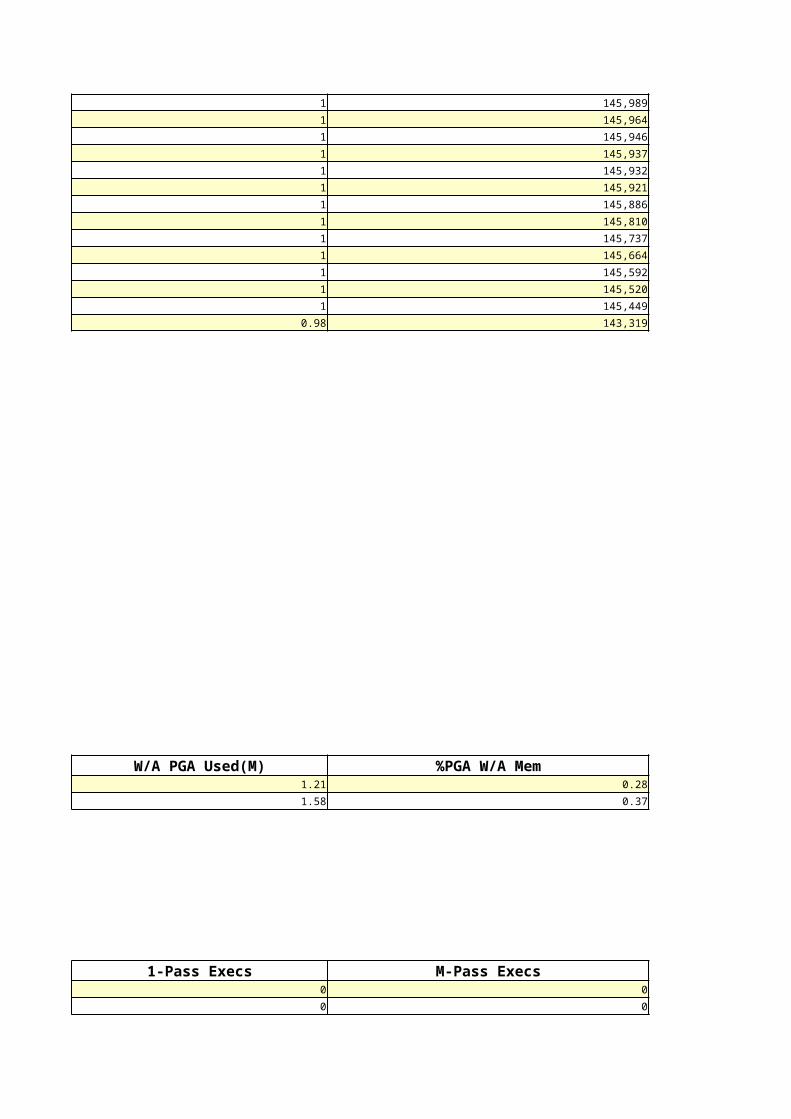
1 145,989
1 145,964
1 145,946
1 145,937
1 145,932
1 145,921
1 145,886
1 145,810
1 145,737
1 145,664
1 145,592
1 145,520
1 145,449
0.98 143,319
W/A PGA Used(M) %PGA W/A Mem1.21 0.28
1.58 0.37
1-Pass Execs M-Pass Execs0 0
0 0
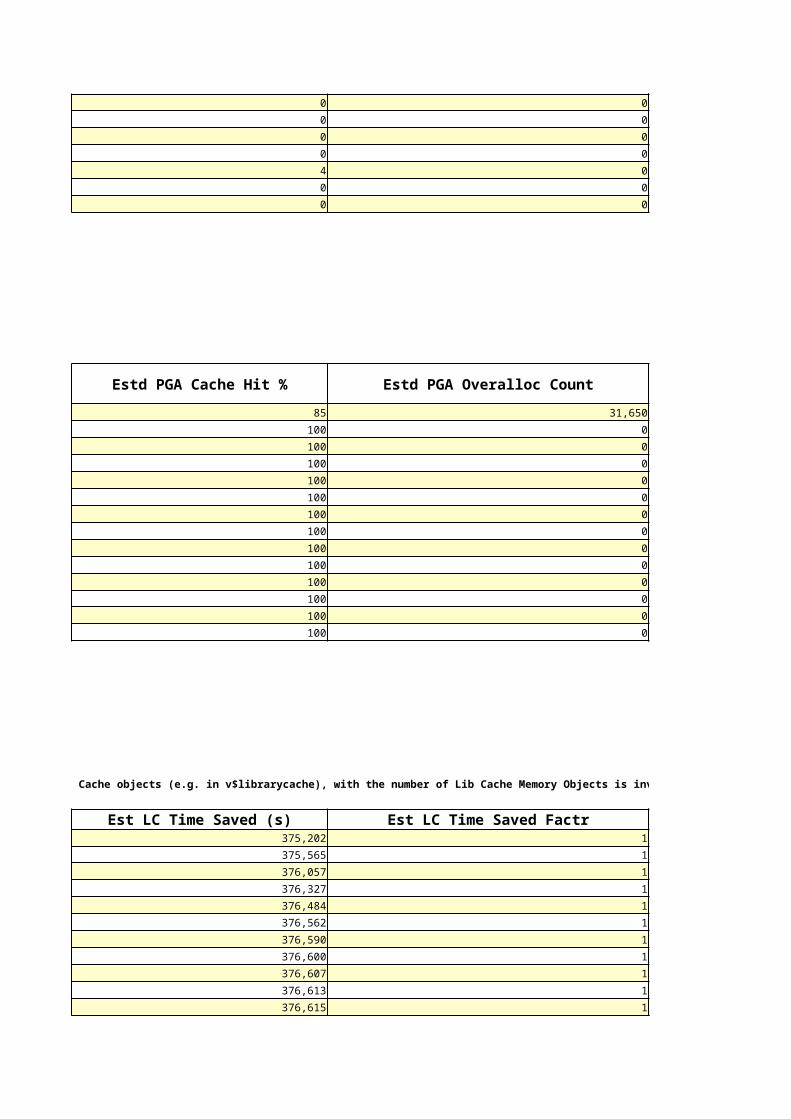
0 0
0 0
0 0
0 0
4 0
0 0
0 0
Estd PGA Cache Hit % Estd PGA Overalloc Count
85 31,650
100 0
100 0
100 0
100 0
100 0
100 0
100 0
100 0
100 0
100 0
100 0
100 0
100 0
Note there is often a 1:Many correlation between a single logical object in the Library Cache, and the physical number of memory objects associated with it. Therefore comparing the number of Lib Cache objects (e.g. in v$librarycache), with the number of Lib Cache Memory Objects is invalid.
Est LC Time Saved (s) Est LC Time Saved Factr375,202 1
375,565 1
376,057 1
376,327 1
376,484 1
376,562 1
376,590 1
376,600 1
376,607 1
376,613 1
376,615 1

376,618 1
376,621 1
376,623 1
Est Unspill Count Est Unspill Time (s)0 0
0 0
0 0
0 0
0 0
0 0
0 0
0 0
0 0
0 0
0 0
0 0
0 0
0 0
0 0
0 0
0 0
0 0
0 0
0 0
Est LC Time Saved (s) Est LC Time Saved Factr

13 1
13 1
13 1
Waits Wt Time (s)12 19
1,359 5
1 2
67 2
45 1
11 0
41 0
35 0
33 0
5 0

Max Tx Concurcy Min/Max TR (mins)22 15.5/40.7
Max Tx Concy Tun Ret (mins)5 23
6 33
4 24
5 33
7 23
9 33
5 23
4 33
4 23
4 33
4 23
5 33
3 23
5 33
5 23
5 33
5 23
5 33
3 23
3 33
4 23
4 33
5 23
5 33
4 23
3 35
3 25
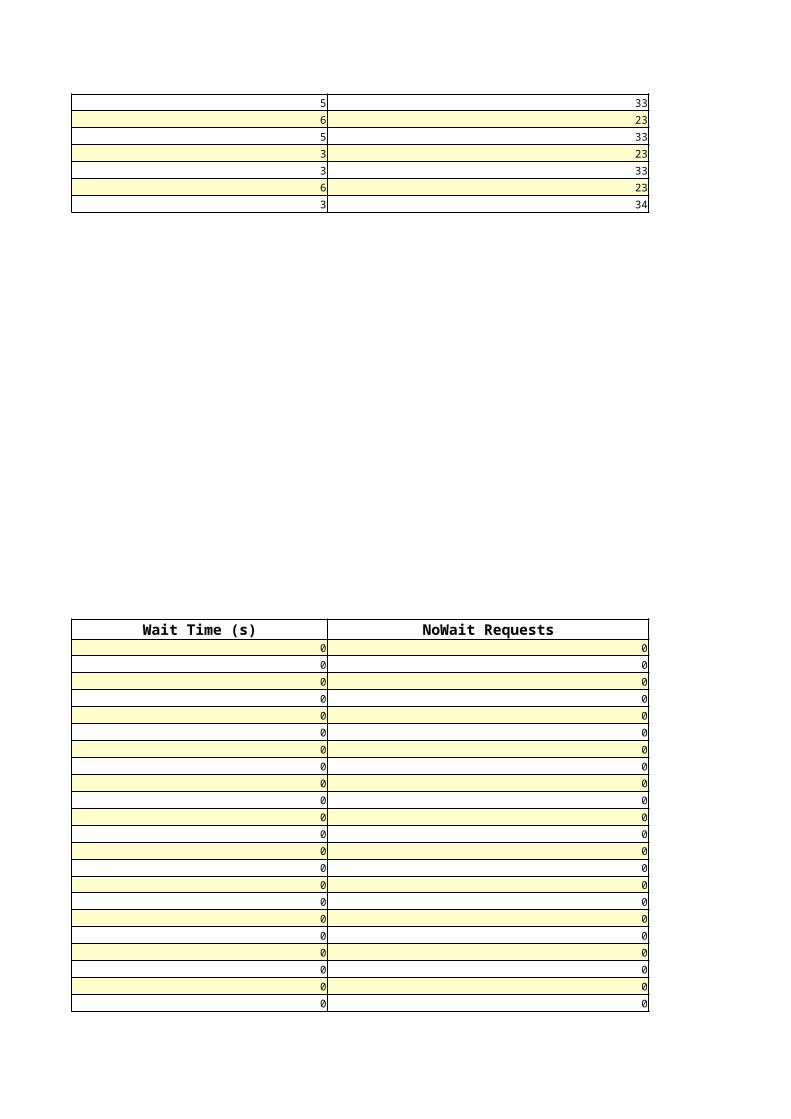
5 33
6 23
5 33
3 23
3 33
6 23
3 34
Wait Time (s) NoWait Requests0 0
0 0
0 0
0 0
0 0
0 0
0 0
0 0
0 0
0 0
0 0
0 0
0 0
0 0
0 0
0 0
0 0
0 0
0 0
0 0
0 0
0 0

0 175,658
0 1
0 0
0 0
0 0
0 0
0 0
0 0
0 0
0 0
0 0
0 0
0 0
0 0
0 0
0 0
0 0
0 0
0 0
0 0
0 26,797
0 0
0 0
0 0
0 0
0 0
0 0
0 0
0 1,654
0 27,698
0 0
0 0
0 0
0 0
0 0
0 0
0 0
0 0
0 0
0 0
0 0
0 0
0 0
0 0
0 0
0 0
0 0
0 0
0 0
0 0
0 0
0 0
0 74
0 0
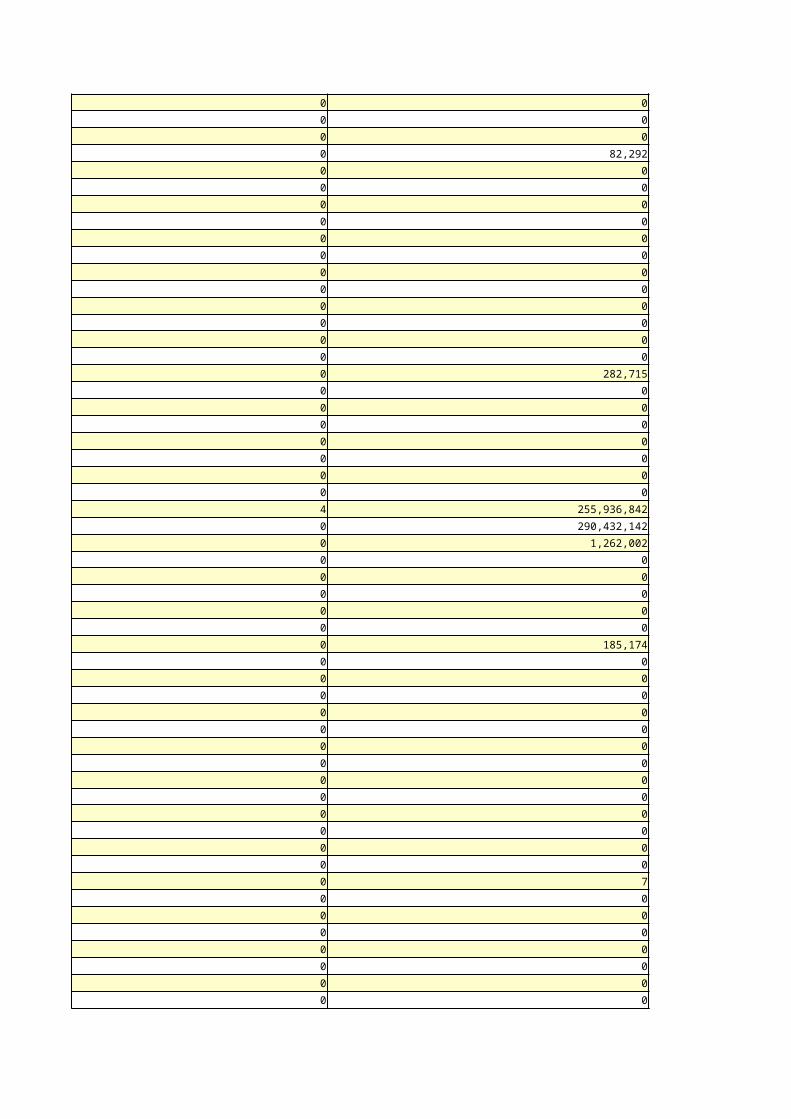
0 0
0 0
0 0
0 82,292
0 0
0 0
0 0
0 0
0 0
0 0
0 0
0 0
0 0
0 0
0 0
0 0
0 282,715
0 0
0 0
0 0
0 0
0 0
0 0
0 0
4 255,936,842
0 290,432,142
0 1,262,002
0 0
0 0
0 0
0 0
0 0
0 185,174
0 0
0 0
0 0
0 0
0 0
0 0
0 0
0 0
0 0
0 0
0 0
0 0
0 0
0 7
0 0
0 0
0 0
0 0
0 0
0 0
0 0
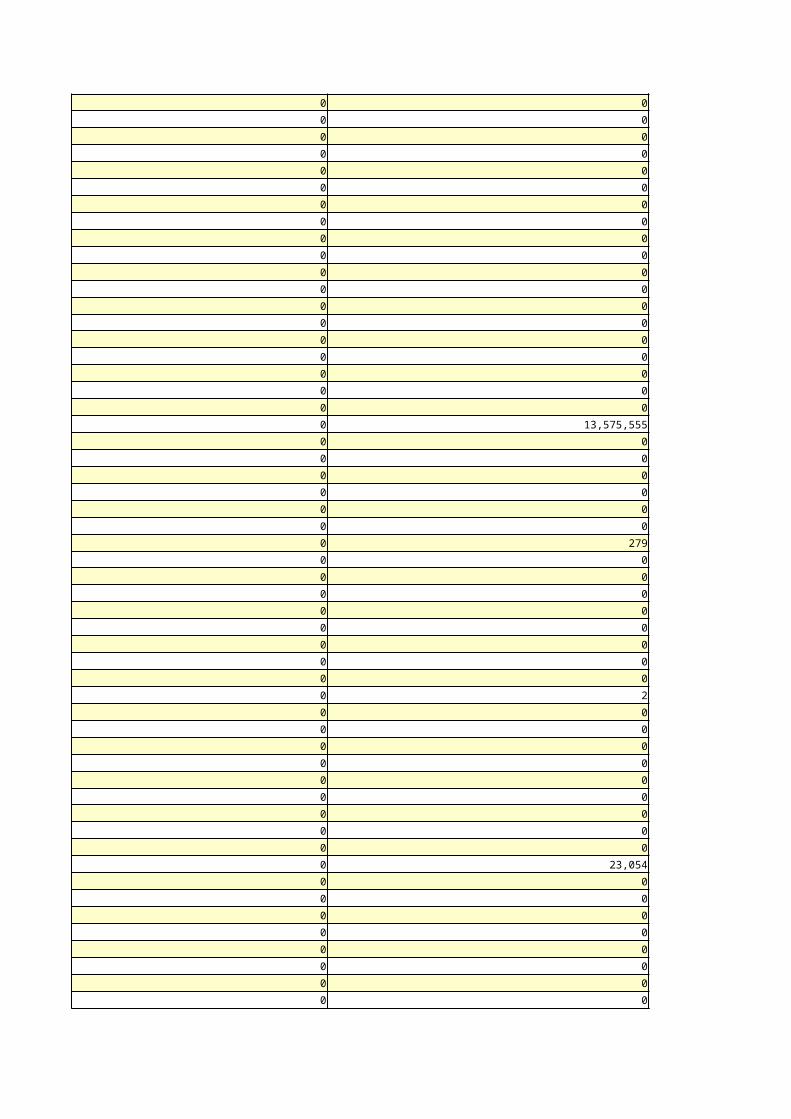
0 0
0 0
0 0
0 0
0 0
0 0
0 0
0 0
0 0
0 0
0 0
0 0
0 0
0 0
0 0
0 0
0 0
0 0
0 0
0 13,575,555
0 0
0 0
0 0
0 0
0 0
0 0
0 279
0 0
0 0
0 0
0 0
0 0
0 0
0 0
0 0
0 2
0 0
0 0
0 0
0 0
0 0
0 0
0 0
0 0
0 0
0 23,054
0 0
0 0
0 0
0 0
0 0
0 0
0 0
0 0
0 0
0 0
0 0
0 0
0 0
0 177
0 0
0 0
0 0
0 0
0 0
0 0
0 0
0 0
0 0
0 54,299
0 3,883
0 0
0 0
0 0
0 0
0 0
0 0
0 0
0 0
0 0
0 123,142
0 1,924
0 0
0 0
0 0
0 0
0 0
0 0
0 0
0 0
0 0
0 3,742,795
0 3,742,870
0 0
0 0
0 0
0 5,404
0 0
0 0
0 0
0 0
0 0
0 0
0 360
0 0
0 0
0 1,527
0 0

0 0
0 0
0 0
0 0
0 282,530
0 0
0 0
0 0
0 0
0 0
0 0
0 0
0 0
0 0
0 0
0 72,993,646
0 0
0 0
0 55,323
0 0
0 0
0 0
0 0
0 0
0 0
0 0
0 0
0 0
0 0
0 0
0 0
0 0
0 0
Spin Gets1,535,412
1,069
611
350
290
298
231
219
128
107
75
46
43
33
10
1
2
2
1
1
0
0
0
Waiter Sleeps0
1
10
1
1
0
0
5
589
1,103
70
9
5
0
34
5
16
1
6
0
11
8
1
0
0
0
0
5
0
2
0
1
0
0
0
0
1
0
0
1
0
0
2
0
7
4
2
3
7
4
0
27
1
2
0
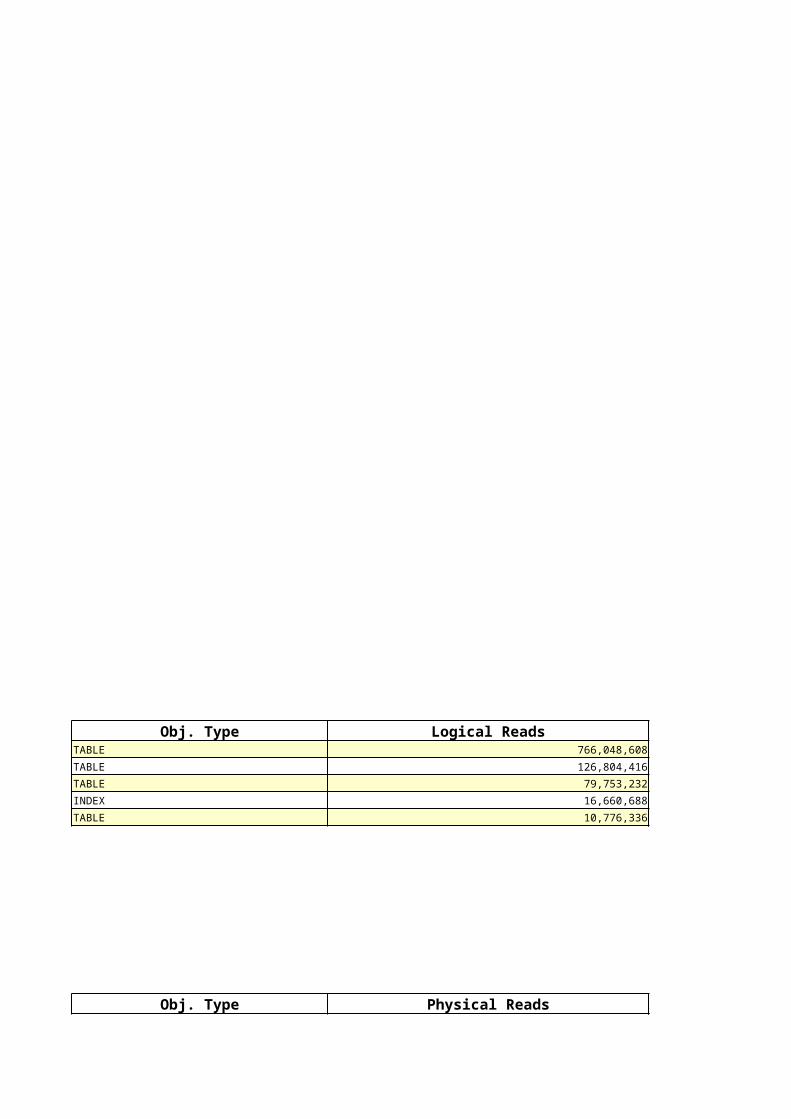
Obj. Type Logical ReadsTABLE 766,048,608
TABLE 126,804,416
TABLE 79,753,232
INDEX 16,660,688
TABLE 10,776,336
Obj. Type Physical Reads

TABLE 93,417,100
TABLE 1,636,981
TABLE 1,562,221
TABLE 202,312
INDEX 176,777
Obj. Type Phys Read RequestsTABLE 2,377,200
INDEX 176,076
INDEX 20,170
TABLE 17,049
TABLE 13,748
Obj. Type UnOptimized ReadsTABLE 2,377,200
INDEX 176,076
INDEX 20,170
TABLE 17,049
TABLE 13,748

Obj. Type Direct ReadsTABLE 64,146,735
TABLE 1,636,939
TABLE 1,556,604
TABLE 202,308
TABLE 14,370
Obj. Type Physical WritesINDEX 23,644
INDEX 12,369
INDEX 6,569
TABLE 6,062
TABLE 5,178
Obj. Type Phys Write RequestsINDEX 17,669
INDEX 6,225
TABLE 5,035
TABLE 3,595
INDEX 2,436
Obj. Type Direct WritesLOB 834
LOB 617
TABLE 490
TABLE 408

UNDEFINED 374
Obj. Type Table ScansTABLE 7,188
INDEX 5,885
INDEX 966
INDEX 776
TABLE 95
Obj. Type DB Block ChangesTABLE 904,320
TABLE 531,808
INDEX 441,712
INDEX 433,168
INDEX 423,936
Obj. Type Row Lock WaitsINDEX 2,633
INDEX 1,843
INDEX 1,613
INDEX 119
INDEX 38
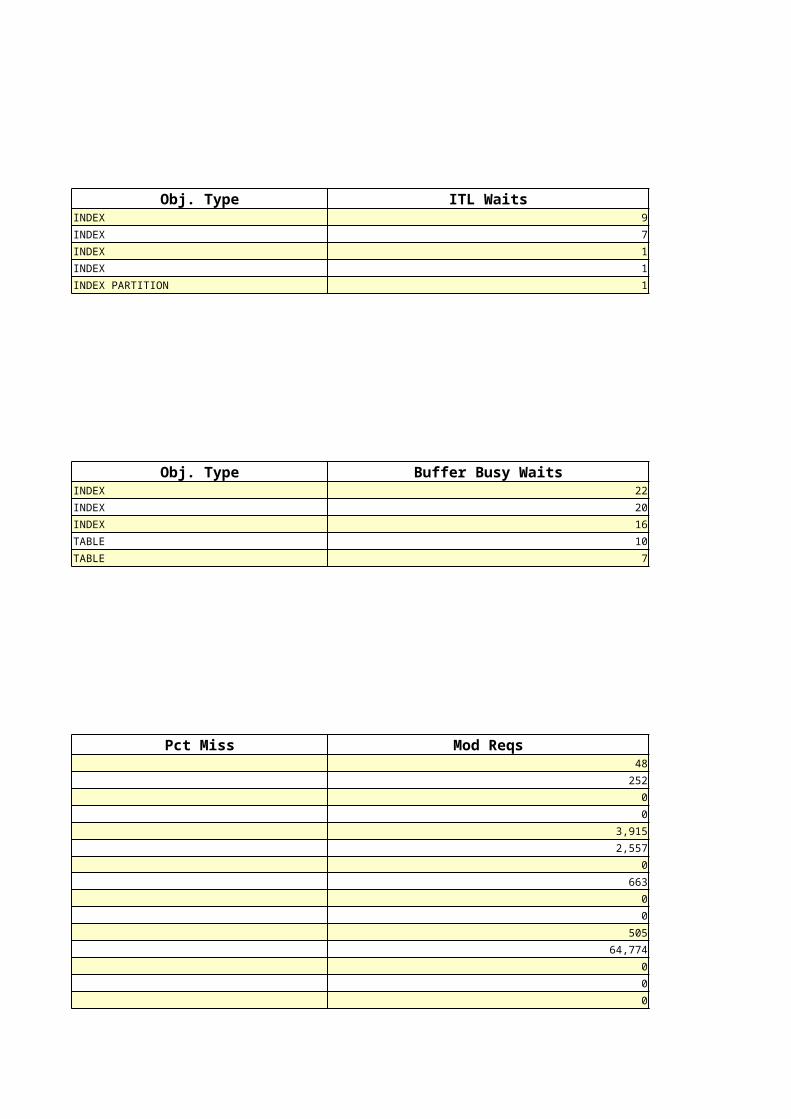
Obj. Type ITL WaitsINDEX 9
INDEX 7
INDEX 1
INDEX 1
INDEX PARTITION 1
Obj. Type Buffer Busy WaitsINDEX 22
INDEX 20
INDEX 16
TABLE 10
TABLE 7
Pct Miss Mod Reqs48
252
0
0
3,915
2,557
0
663
0
0
505
64,774
0
0
0

0
0
0
0
0
0
0
Pct Miss Reloads0
0 0
0 7
0.39 0
0
57.14 0
0 0
17.83 58
0
100 0
0
0.01 1
0
0 0
0.15 2,641
0
65.69 0
0.11 1,374
100 63
100 403
0.01 64
0 0
0 0
0 0

Max Size (Mb) Oper Count0 0
0 0
0 0
0 0
0 0
0 0
576 1
0 0
2,656.00 0
0 0
1,536.00 0
112 0
32 0
16 0
912 1
16 0
Re- Sizes Grows1 0
1 1
Init Size (M) Delta544 -32
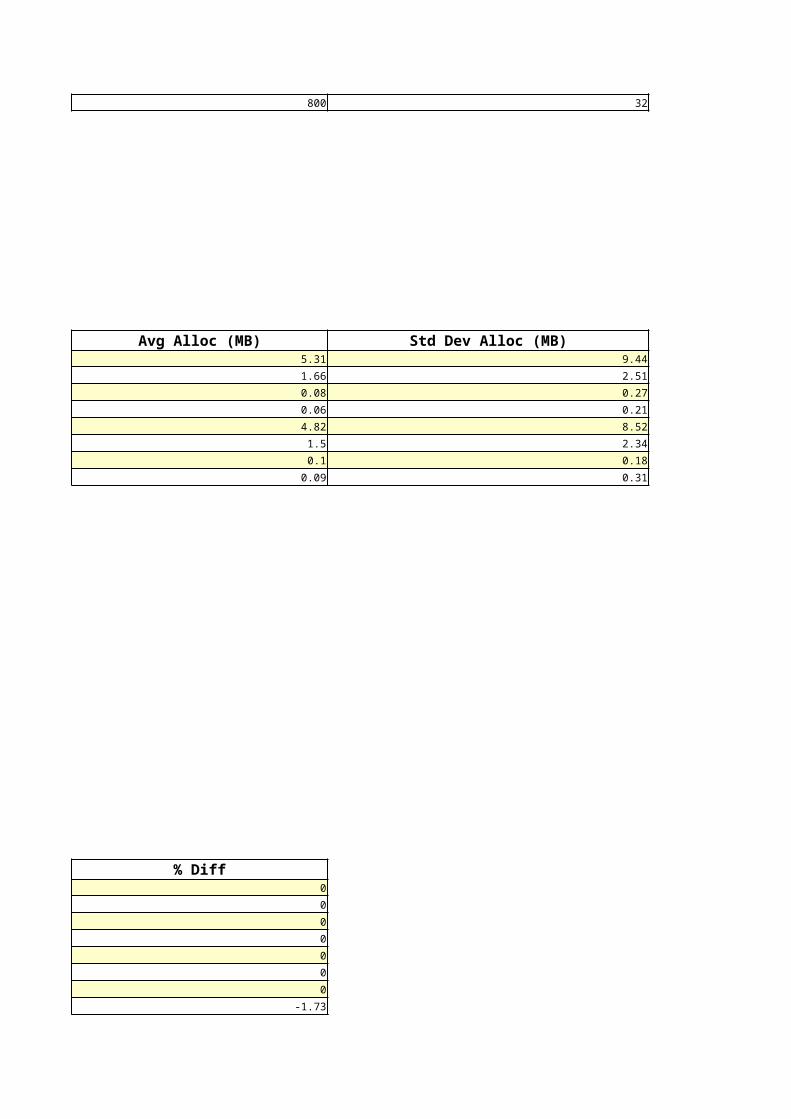
800 32
Avg Alloc (MB) Std Dev Alloc (MB)5.31 9.44
1.66 2.51
0.08 0.27
0.06 0.21
4.82 8.52
1.5 2.34
0.1 0.18
0.09 0.31
% Diff0
0
0
0
0
0
0
-1.73

-5.79
-18.15
9.79
0
3.75
0
0
-5.88
0
0
0
SYS IO Wait time(s)0
0

%Delay Msgs Enq Time(s)0
Avg Dequeue sec / msg
Enqueue Msgs/sec Dequeue Msgs/sec
0 0

Avg Total Dispatchers Avg Active Dispatchers1 0
Common Queue Total Disp Queue Total0 0
Outgoing Net %0
%Idle Total Queued100 0

RACNO

%iowait
9.41
3.06
1.63
1.32
1.51
2.68
1.68
1.98
2.15
2.02
2.14
1.45
2.08
3.14
4.91
2.65
1.8

3.38
2.33
1.74
4.12
3.52
10.96
% DB time4.87
3.88
3.82
1.75
0.66
0.17
0.14
0.12
0.07
0.05
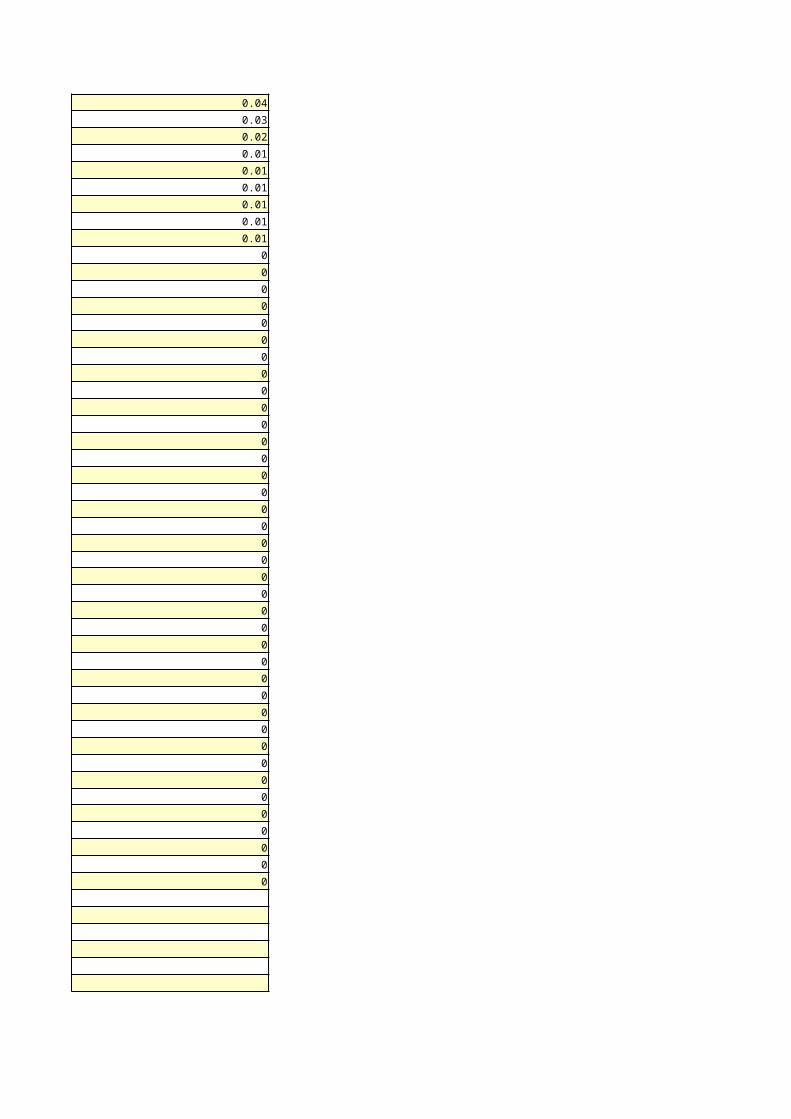
0.04
0.03
0.02
0.01
0.01
0.01
0.01
0.01
0.01
0
0
0
0
0
0
0
0
0
0
0
0
0
0
0
0
0
0
0
0
0
0
0
0
0
0
0
0
0
0
0
0
0
0
0
0
0
0
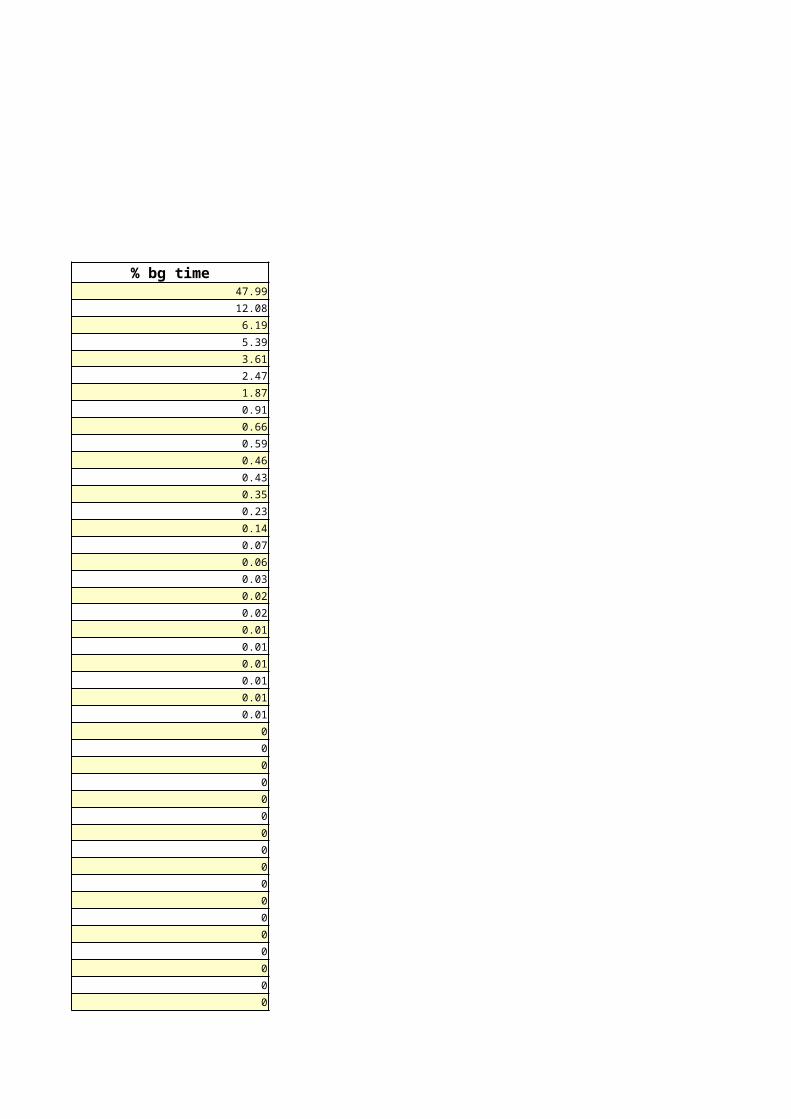
% bg time47.99
12.08
6.19
5.39
3.61
2.47
1.87
0.91
0.66
0.59
0.46
0.43
0.35
0.23
0.14
0.07
0.06
0.03
0.02
0.02
0.01
0.01
0.01
0.01
0.01
0.01
0
0
0
0
0
0
0
0
0
0
0
0
0
0
0
0
0

0
0
0
0
0
0
0
0
0
0
0
0
0
0
% of Waits<16ms <32ms <=1s
15.6 1.2 0.2

0.3 0.5 0.4
25
75
100
2.2 2.1 0.1
12.5 4.8 1.9
1 1
0.2 0.2
0 0 0
0.8 1.8 0.3
0 0 0
3
2.5 0.8 0.8
15.1 2.3 0.4
24.2
0 0 0
0.3 0.1 0.2
0 0
0.6 1.3 3.9
0 0 0
0.7 0.7 0.7
97.5 1
3.6 1.3 1.3
1.6 0.4 0.4
14.6 0.6 1.2
25
100
41.3 11.7 3.3
0.7 0.5 0.5
2.3 0.7 0.3
2.8 0.8 0.5
5.1 3.9 1.2
16.7
3 1.7 2
2.8 2.8 4.2
35.8 25.4 26.9
27.3
4 2.5 2.1
20 8.9 15.6
41.7
2
5.3 5.3 2.6
4.7 4 1.5
100
20
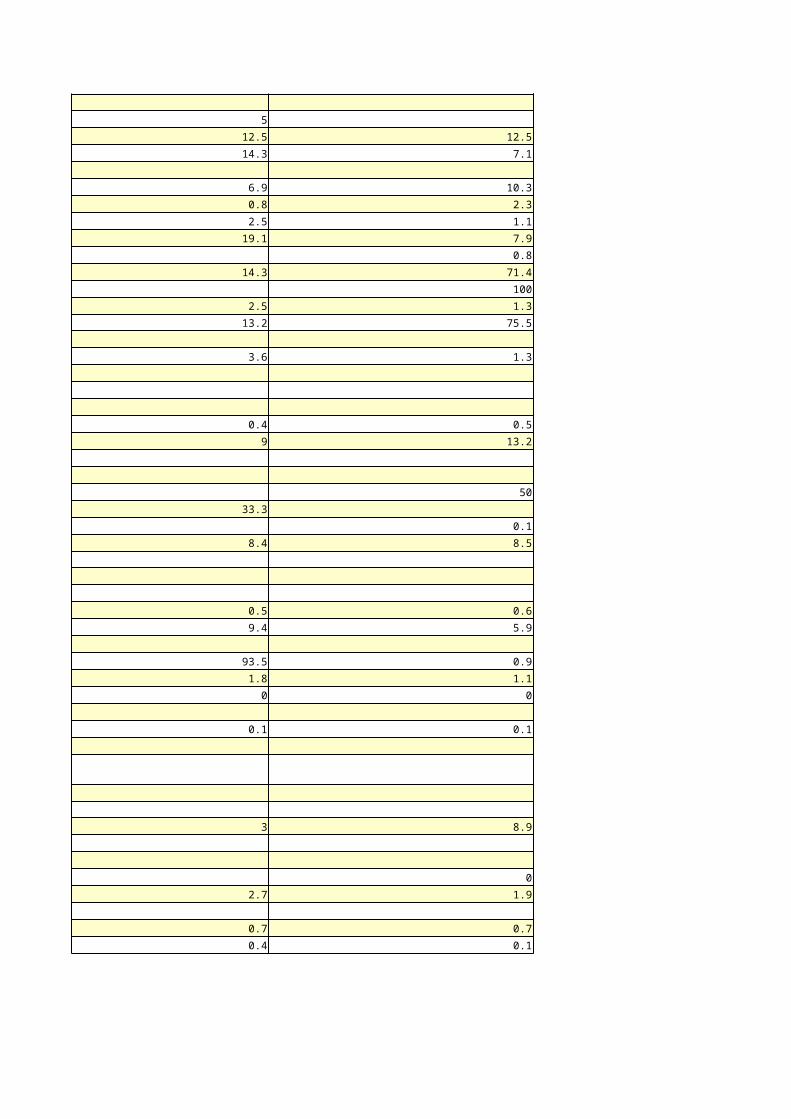
5
12.5 12.5
14.3 7.1 7.1
6.9 10.3 65.5
0.8 2.3 1.2
2.5 1.1 1
19.1 7.9 4.2
0.8
14.3 71.4
100
2.5 1.3 1.5
13.2 75.5 10.9
2
3.6 1.3 0.4
100
100
100
0.4 0.5 0.4
9 13.2 64.4
100
50 50
33.3
0.1
8.4 8.5 1.8
98.9
6.3
0.5 0.6 0.6
9.4 5.9 57.2
100
93.5 0.9
1.8 1.1 1.9
0 0 0.6
0.1 0.1 0.1
0
33.3
3 8.9 45.2
100
0 0.2
2.7 1.9 51.1
0.7 0.7 19.7
0.4 0.1 95.6
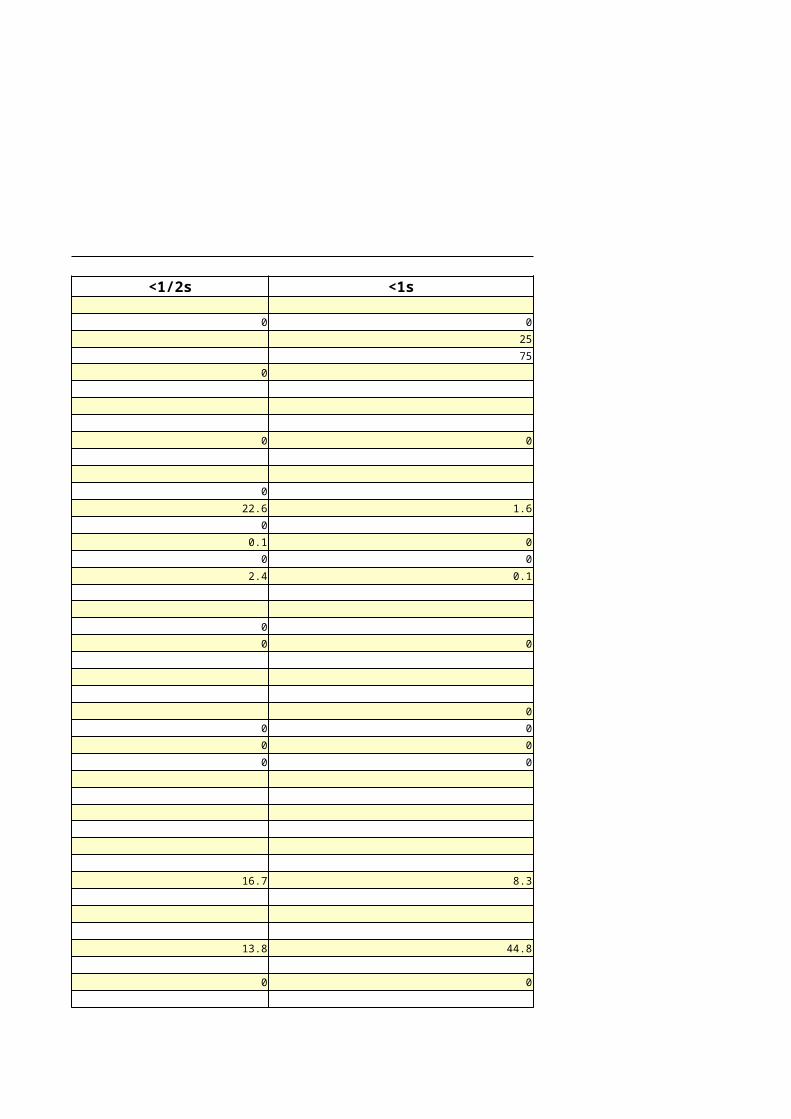
% of Total Waits<1/2s <1s <2s
0 0 0
25 50
75 25
0 0
0 0
0 0
22.6 1.6
0
0.1 0
0 0
2.4 0.1
0
0 0 0
0
0 0
0 0
0 0 0
100
16.7 8.3 16.7
13.8 44.8
0 0

0 0
0.3 0.6 0.3
0 0
50
100
0.7 0.1 0
50
% of Total Waits<32s < 1m < 2m
3.4
% of Total Waits<1/2h < 1h >=1h
25

Admin Wt Time Network Total Wts Network Wt Time0 5382302 64
2899 2340 3
0 194672 27
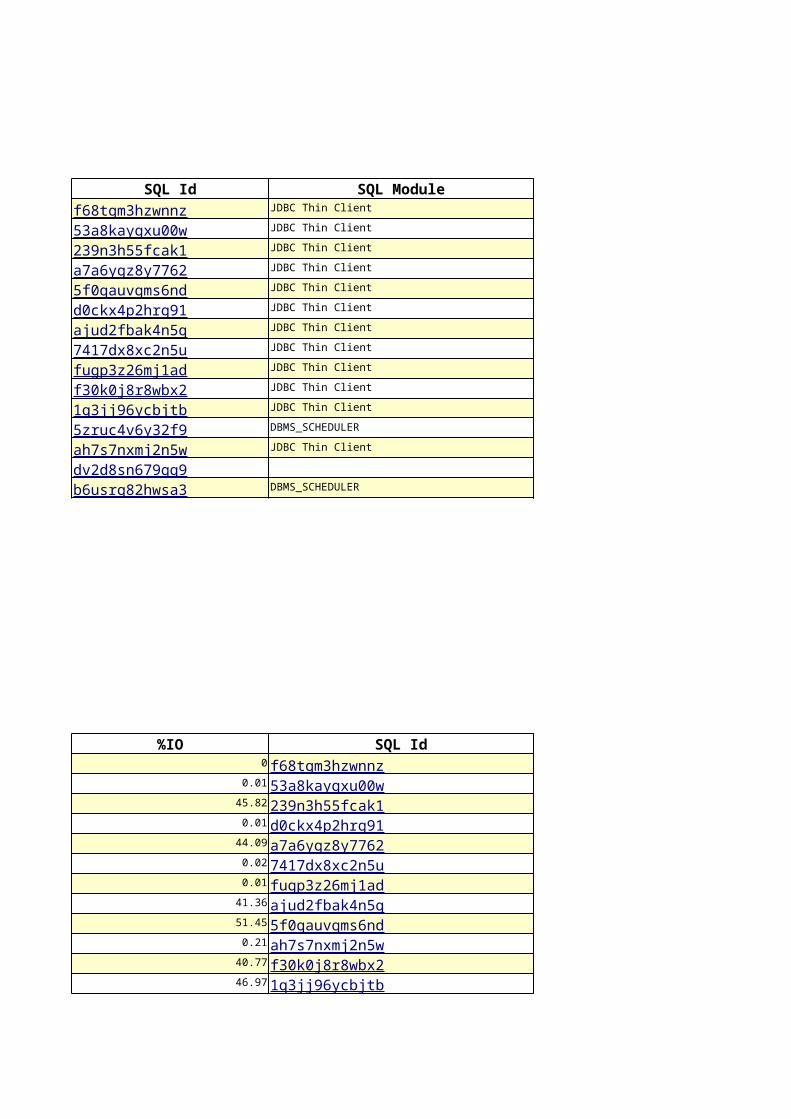
SQL Id SQL Module SQL TextJDBC Thin Client SELECT vwflls_flu_id, vwflls_a...
JDBC Thin Client INSERT INTO flight_uld_dgr (fl...
JDBC Thin Client UPDATE FLIGHT_ULD B SET FLU_TF...
JDBC Thin Client DELETE FROM FLIGHT_ULD WHERE F...
JDBC Thin Client SELECT COUNT(vwflls_flu_id) FR...
JDBC Thin Client DELETE FROM flight_uld_dgr WHE...
JDBC Thin Client BEGIN pack_reload.deassign_pos...
JDBC Thin Client SELECT fludgr_id FROM flight_u...
JDBC Thin Client SELECT fludgr_id FROM flight_u...
JDBC Thin Client BEGIN pack_reload.assign_uld(:...
JDBC Thin Client delete from FLIGHT_ULD where F...
DBMS_SCHEDULER DECLARE job BINARY_INTEGER := ...
JDBC Thin Client SELECT COUNT(vwflls_flu_id) FR...
SELECT /* DS_SVC */ /*+ cursor...
DBMS_SCHEDULER call dbms_stats.gather_databas...
%IO SQL Id SQL Module0 JDBC Thin Client
0.01 JDBC Thin Client
45.82 JDBC Thin Client
0.01 JDBC Thin Client
44.09 JDBC Thin Client
0.02 JDBC Thin Client
0.01 JDBC Thin Client
41.36 JDBC Thin Client
51.45 JDBC Thin Client
0.21 JDBC Thin Client
40.77 JDBC Thin Client
46.97 JDBC Thin Client
f68tgm3hzwnnz53a8kaygxu00w239n3h55fcak1a7a6ygz8y77625f0qauvgms6ndd0ckx4p2hrg91ajud2fbak4n5q7417dx8xc2n5ufugp3z26mj1adf30k0j8r8wbx21q3jj96ycbjtb5zruc4v6y32f9ah7s7nxmj2n5wdv2d8sn679gq9b6usrg82hwsa3
f68tgm3hzwnnz53a8kaygxu00w239n3h55fcak1d0ckx4p2hrg91a7a6ygz8y77627417dx8xc2n5ufugp3z26mj1adajud2fbak4n5q5f0qauvgms6ndah7s7nxmj2n5wf30k0j8r8wbx21q3jj96ycbjtb
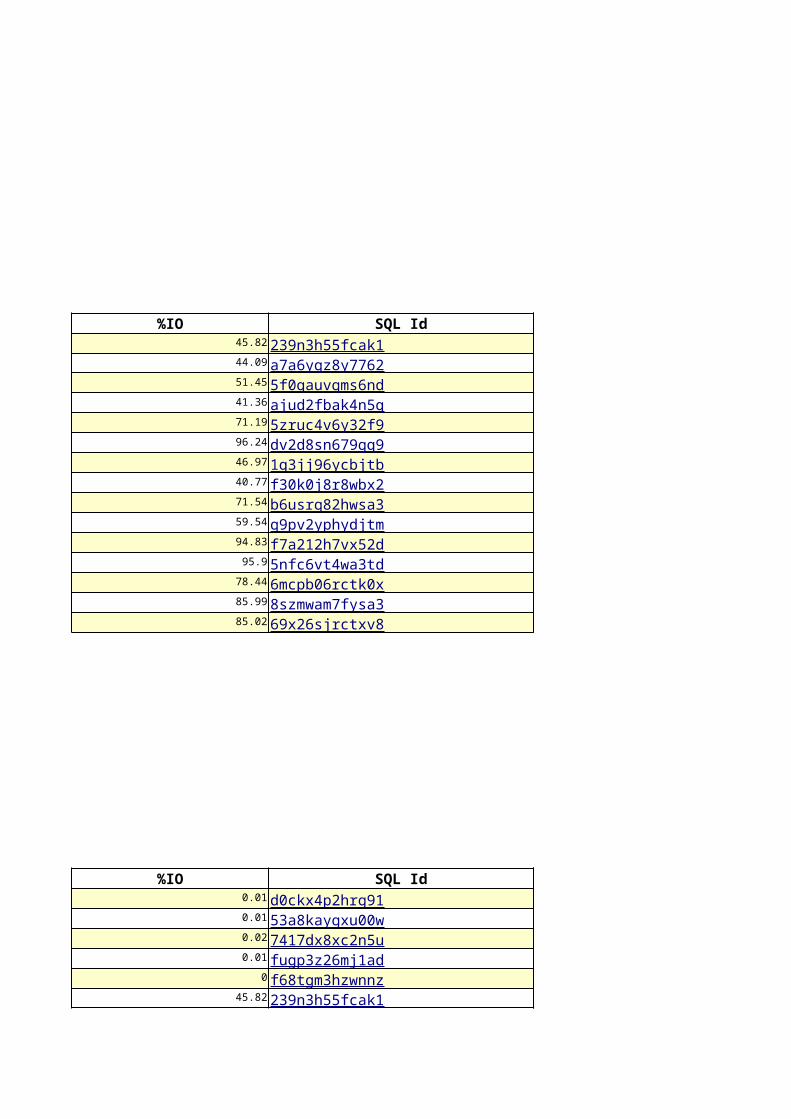
%IO SQL Id SQL Module45.82 JDBC Thin Client
44.09 JDBC Thin Client
51.45 JDBC Thin Client
41.36 JDBC Thin Client
71.19 DBMS_SCHEDULER
96.24
46.97 JDBC Thin Client
40.77 JDBC Thin Client
71.54 DBMS_SCHEDULER
59.54 JDBC Thin Client
94.83 DBMS_SCHEDULER
95.9 JDBC Thin Client
78.44 DBMS_SCHEDULER
85.99 DBMS_SCHEDULER
85.02 sqlplus@CLKLXFLCDBP01 (TNS V1-V3)
%IO SQL Id SQL Module0.01 JDBC Thin Client
0.01 JDBC Thin Client
0.02 JDBC Thin Client
0.01 JDBC Thin Client
0 JDBC Thin Client
45.82 JDBC Thin Client
239n3h55fcak1a7a6ygz8y77625f0qauvgms6ndajud2fbak4n5q5zruc4v6y32f9dv2d8sn679gq91q3jj96ycbjtbf30k0j8r8wbx2b6usrg82hwsa3g9pv2yphydjtmf7a212h7vx52d5nfc6vt4wa3td6mcpb06rctk0x8szmwam7fysa369x26sjrctxv8
d0ckx4p2hrg9153a8kaygxu00w7417dx8xc2n5ufugp3z26mj1adf68tgm3hzwnnz239n3h55fcak1
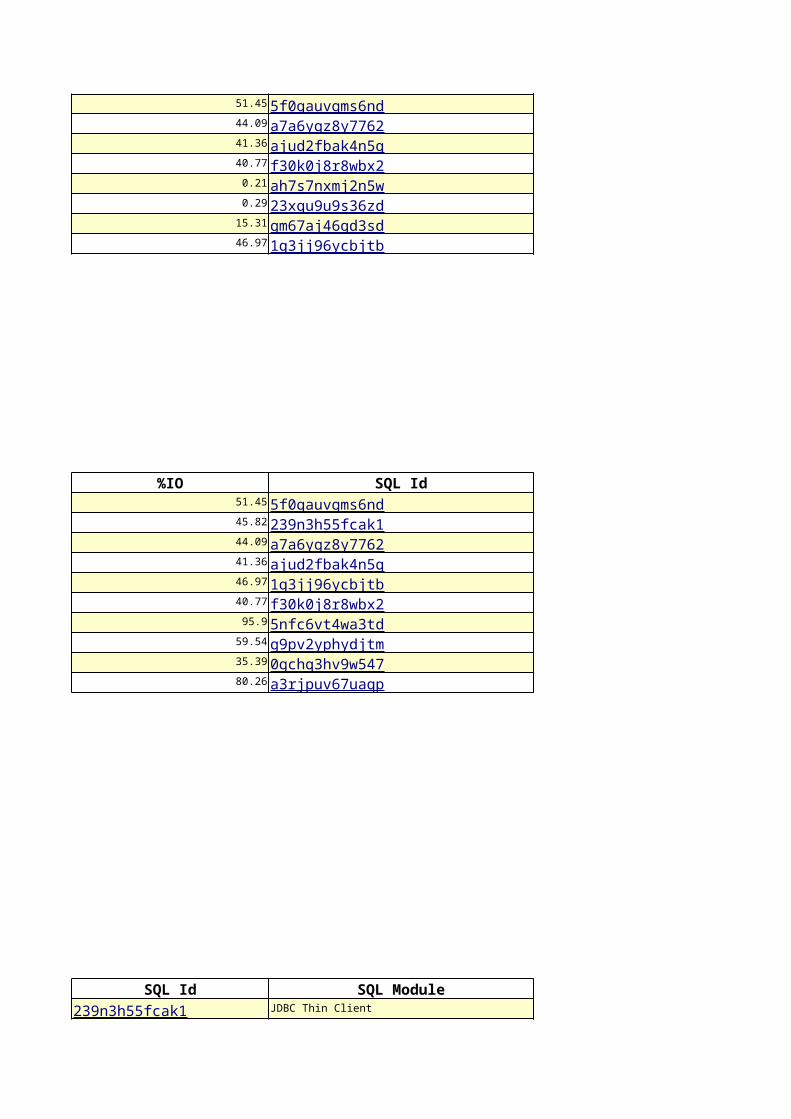
51.45 JDBC Thin Client
44.09 JDBC Thin Client
41.36 JDBC Thin Client
40.77 JDBC Thin Client
0.21 JDBC Thin Client
0.29 SQL*Plus
15.31 JDBC Thin Client
46.97 JDBC Thin Client
%IO SQL Id SQL Module51.45 JDBC Thin Client
45.82 JDBC Thin Client
44.09 JDBC Thin Client
41.36 JDBC Thin Client
46.97 JDBC Thin Client
40.77 JDBC Thin Client
95.9 JDBC Thin Client
59.54 JDBC Thin Client
35.39 JDBC Thin Client
80.26 SQL Developer
SQL Id SQL Module SQL TextJDBC Thin Client UPDATE FLIGHT_ULD B SET FLU_TF...
5f0qauvgms6nda7a6ygz8y7762ajud2fbak4n5qf30k0j8r8wbx2ah7s7nxmj2n5w23xqu9u9s36zdgm67aj46qd3sd1q3jj96ycbjtb
5f0qauvgms6nd239n3h55fcak1a7a6ygz8y7762ajud2fbak4n5q1q3jj96ycbjtbf30k0j8r8wbx25nfc6vt4wa3tdg9pv2yphydjtm0gchq3hv9w547a3rjpuv67uaqp
239n3h55fcak1

JDBC Thin Client DELETE FROM FLIGHT_ULD WHERE F...
JDBC Thin Client BEGIN pack_reload.deassign_pos...
JDBC Thin Client SELECT COUNT(vwflls_flu_id) FR...
JDBC Thin Client delete from FLIGHT_ULD where F...
JDBC Thin Client BEGIN pack_reload.assign_uld(:...
DBMS_SCHEDULER DECLARE job BINARY_INTEGER := ...
SELECT /* DS_SVC */ /*+ cursor...
JDBC Thin Client delete from FLIGHT_ULD where F...
JDBC Thin Client BEGIN :1 := pack_reload.check_...
DBMS_SCHEDULER call dbms_stats.gather_databas...
SQL Id SQL Module SQL TextSQL*Plus SELECT COUNT (*) FROM CTX_USER...
SQL*Plus SELECT CTXU_USER FROM CTX_USER
JDBC Thin Client BEGIN pack_audit.set_context_u...
JDBC Thin Client UPDATE CTX_USER SET CTXU_USER ...
JDBC Thin Client SELECT vwflls_flu_id, vwflls_a...
JDBC Thin Client INSERT INTO flight_uld_dgr (fl...
JDBC Thin Client DELETE FROM flight_uld_dgr WHE...
JDBC Thin Client SELECT fludgr_id FROM flight_u...
JDBC Thin Client SELECT fludgr_id FROM flight_u...
TOAD background query session DELETE FROM CTX_SESSION WHERE ...
JDBC Thin Client SELECT fludgr_weight, fludgr_t...
SQL*Plus SELECT COLUMN_NAME FROM USER_T...
JDBC Thin Client SELECT flls_flu_id, flls_pct_m...
update seq$ set increment$=:2,...
a7a6ygz8y7762ajud2fbak4n5q5f0qauvgms6nd1q3jj96ycbjtbf30k0j8r8wbx25zruc4v6y32f9dv2d8sn679gq9g9pv2yphydjtm0gchq3hv9w547b6usrg82hwsa3
477jzbnj2kkjcdxw3x3na1vsxnarvad97suq7p13jyk3kjz0bwwaf68tgm3hzwnnz53a8kaygxu00wd0ckx4p2hrg91fugp3z26mj1ad7417dx8xc2n5udsnk22bby5s7bdb4s8nqngnr0323xqu9u9s36zd9vbrvs0r5fud34m7m0t6fjcs5x

Data per sec Waits: Count Avg Tm(ms)0.000024 0
0M 2188.5K 1.5
0.000821 3868 0.84
0.048712 491.7K 1
0.029899 196.6K 1.52
0.018028 0
0.000181 0
0M 51 5.43
0.097667 2880.7K 1.42
Data per sec Small Read Large Read0.018209 1.34 0.94
0.035043 0.73 6.83
0.029766 2.41 0.03

0.014442 2.66 1.93
0.000217 5.8 8.34
0M 1.5
0.097679 1.22 0.95
Data per sec Waits: Count Avg Tm(ms)0.000024 0
0.000024 0
0M 2188.3K 1.5
0M 2188.3K 1.5
0.000821 3503 0.86
0M 0
0M 84 2.2
0.000821 3419 0.83
0.048712 381.1K 0.75
0.034077 380.2K 0.75
0M 441 1.32
0.014442 27 3.41
0.000193 397 7.5
0.029899 897 1.75
0.029766 264 2.8
0.000132 633 1.31
0.018028 0
0.018028 0
0.000181 0
0.000181 0
0M 51 5.43
0M 51 5.43
0.097667 2573.8K 1.39
Av Writes/s Buffer Waits Av Buf Wt(ms)1 48,403 1.33
0 61 0.16
0 0 0
0 6 5
0 0 0
0 0 0

Writes Av Writes/s Buffer Waits14,273 0 0
3,629 0 6
125 0 0
13,806 0 61
33 0 0
33,401 0 40,585
42,784 1 7,818
Free Buff Wait Writ Comp Wait Buffer Busy Waits0 0 48,470
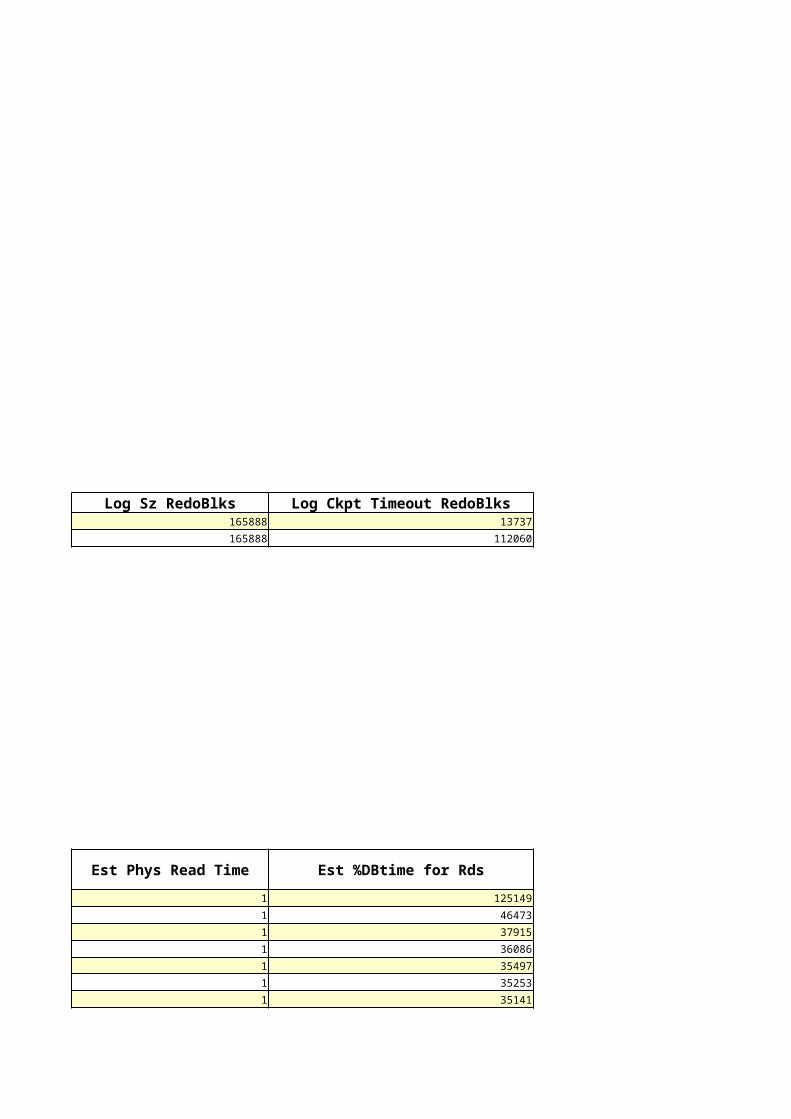
Log Sz RedoBlks Log Ckpt Timeout RedoBlks Log Ckpt Interval RedoBlks165888 13737
165888 112060
Est Phys Read Time Est %DBtime for Rds
1 125149
1 46473
1 37915
1 36086
1 35497
1 35253
1 35141

1 35084
1 35025
1 34983
1 34961
1 34950
1 34924
1 34841
1 34662
1 34491
1 34318
1 34148
1 33978
1 33810
1 28787
%Auto W/A Mem %Man W/A Mem Global Mem Bound(K)100 0 271,970
100 0 271,970
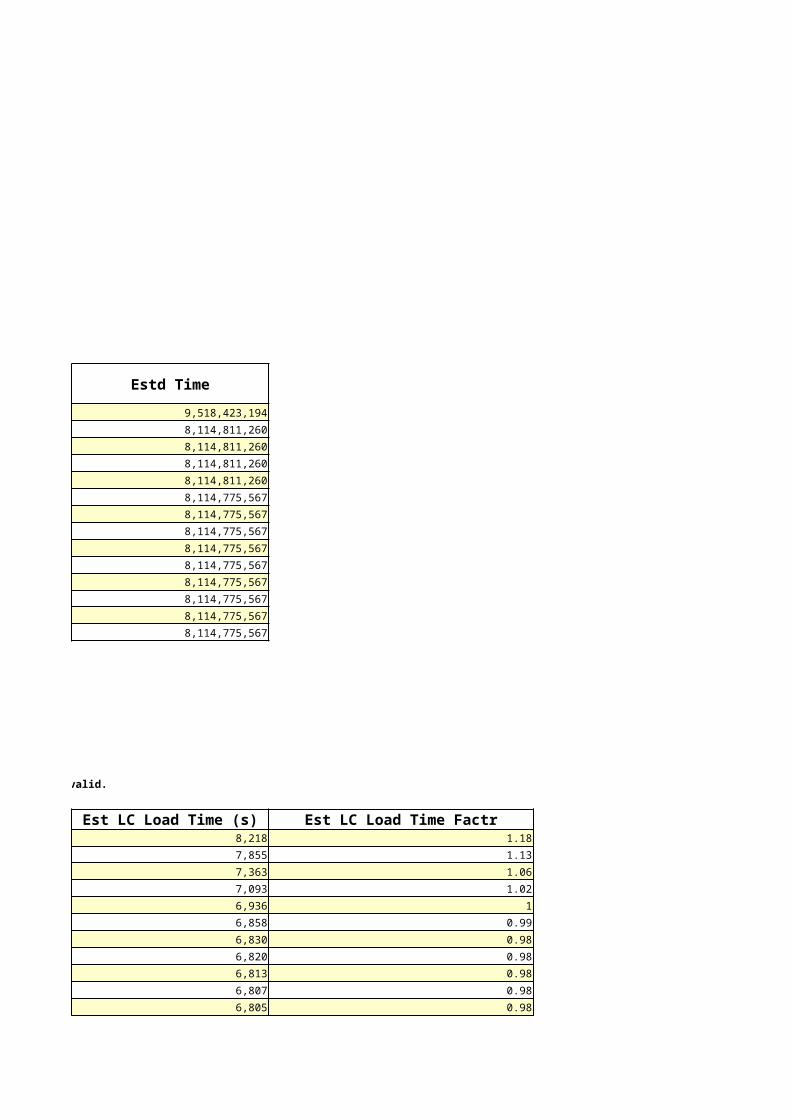
Estd Time
9,518,423,194
8,114,811,260
8,114,811,260
8,114,811,260
8,114,811,260
8,114,775,567
8,114,775,567
8,114,775,567
8,114,775,567
8,114,775,567
8,114,775,567
8,114,775,567
8,114,775,567
8,114,775,567
Est LC Load Time (s) Est LC Load Time Factr Est LC Mem Obj Hits (K)8,218 1.18 55,103
7,855 1.13 101,180
7,363 1.06 101,213
7,093 1.02 101,231
6,936 1 101,242
6,858 0.99 101,248
6,830 0.98 101,250
6,820 0.98 101,250
6,813 0.98 101,251
6,807 0.98 101,251
6,805 0.98 101,251
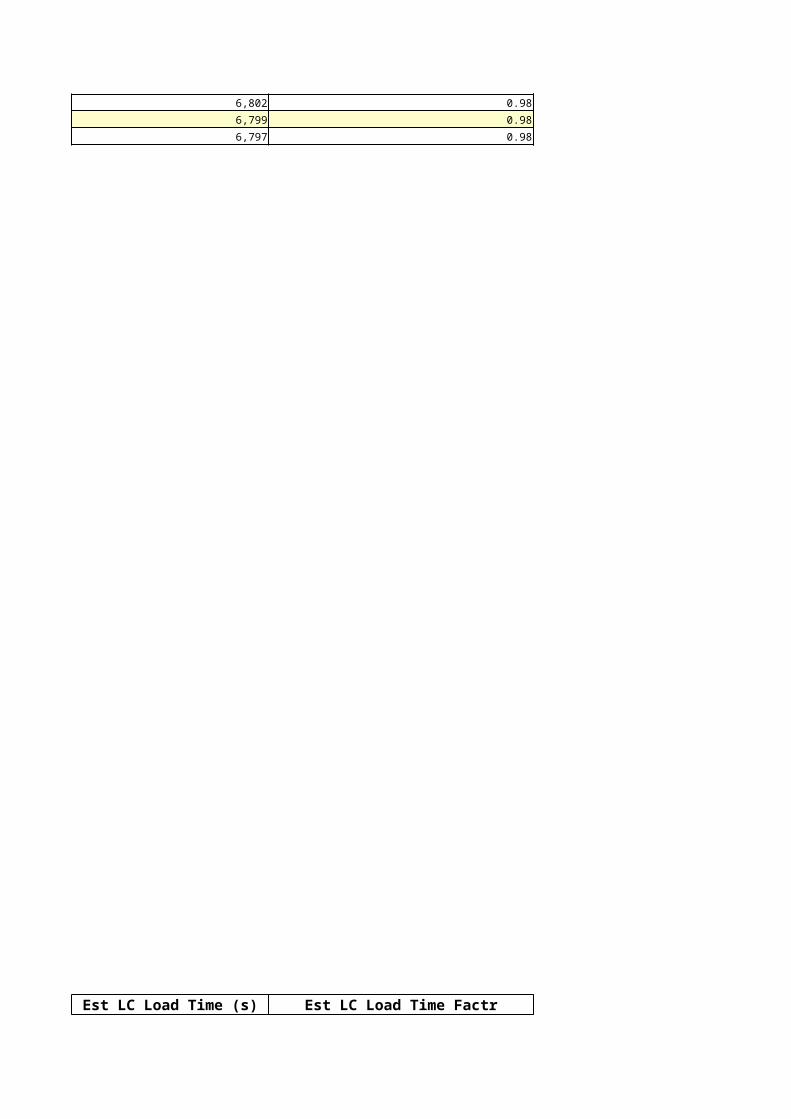
6,802 0.98 101,251
6,799 0.98 101,252
6,797 0.98 101,252
Est LC Load Time (s) Est LC Load Time Factr Est LC Mem Obj Hits
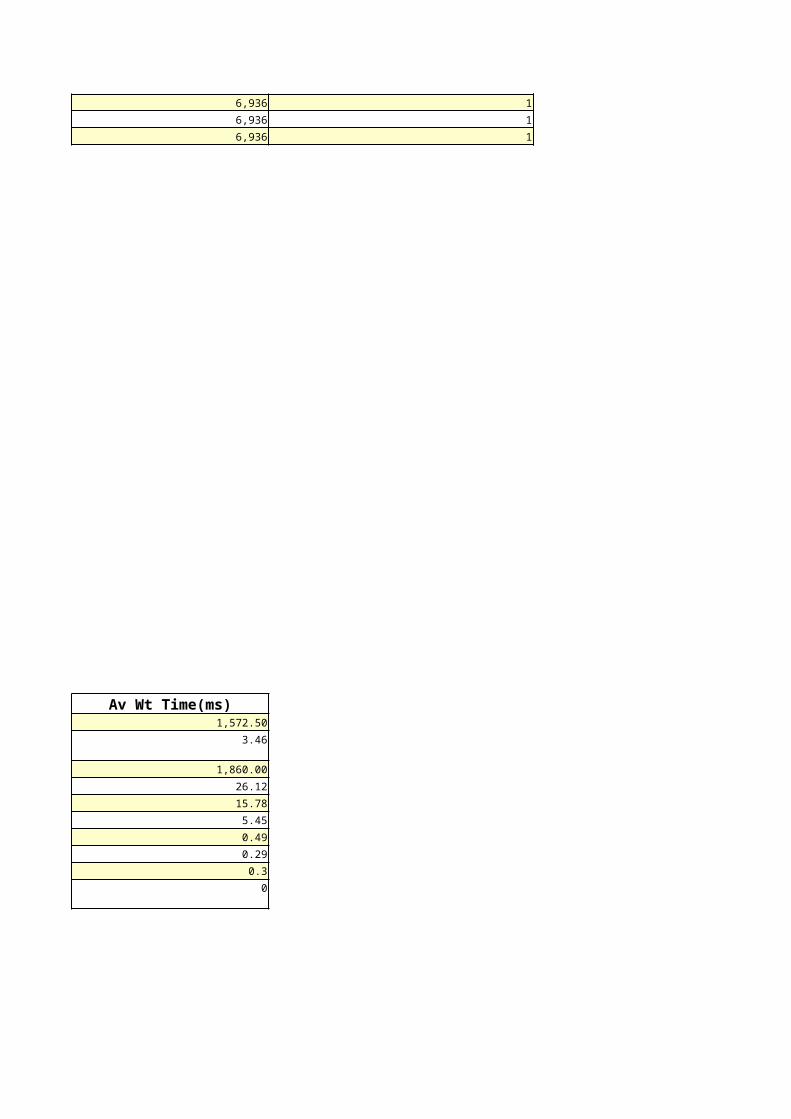
6,936 1 212
6,936 1 308
6,936 1 308
Av Wt Time(ms)1,572.50
3.46
1,860.00
26.12
15.78
5.45
0.49
0.29
0.3
0

STO/ OOS uS/uR/uU/ eS/eR/eU0/0 0/0/0/0/0/0
STO/ OOS uS/uR/uU/ eS/eR/eU0/0 0/0/0/0/0/0
0/0 0/0/0/0/0/0
0/0 0/0/0/0/0/0
0/0 0/0/0/0/0/0
0/0 0/0/0/0/0/0
0/0 0/0/0/0/0/0
0/0 0/0/0/0/0/0
0/0 0/0/0/0/0/0
0/0 0/0/0/0/0/0
0/0 0/0/0/0/0/0
0/0 0/0/0/0/0/0
0/0 0/0/0/0/0/0
0/0 0/0/0/0/0/0
0/0 0/0/0/0/0/0
0/0 0/0/0/0/0/0
0/0 0/0/0/0/0/0
0/0 0/0/0/0/0/0
0/0 0/0/0/0/0/0
0/0 0/0/0/0/0/0
0/0 0/0/0/0/0/0
0/0 0/0/0/0/0/0
0/0 0/0/0/0/0/0
0/0 0/0/0/0/0/0
0/0 0/0/0/0/0/0
0/0 0/0/0/0/0/0
0/0 0/0/0/0/0/0
0/0 0/0/0/0/0/0

0/0 0/0/0/0/0/0
0/0 0/0/0/0/0/0
0/0 0/0/0/0/0/0
0/0 0/0/0/0/0/0
0/0 0/0/0/0/0/0
0/0 0/0/0/0/0/0
0/0 0/0/0/0/0/0
Pct NoWait Miss
0
0
0
0
0
0

0
0
0
0.01
0
0
0
0.01
1.08
0
0

0
0
0
0
0
0.01
0.04
0
0
0

0
0.12
0
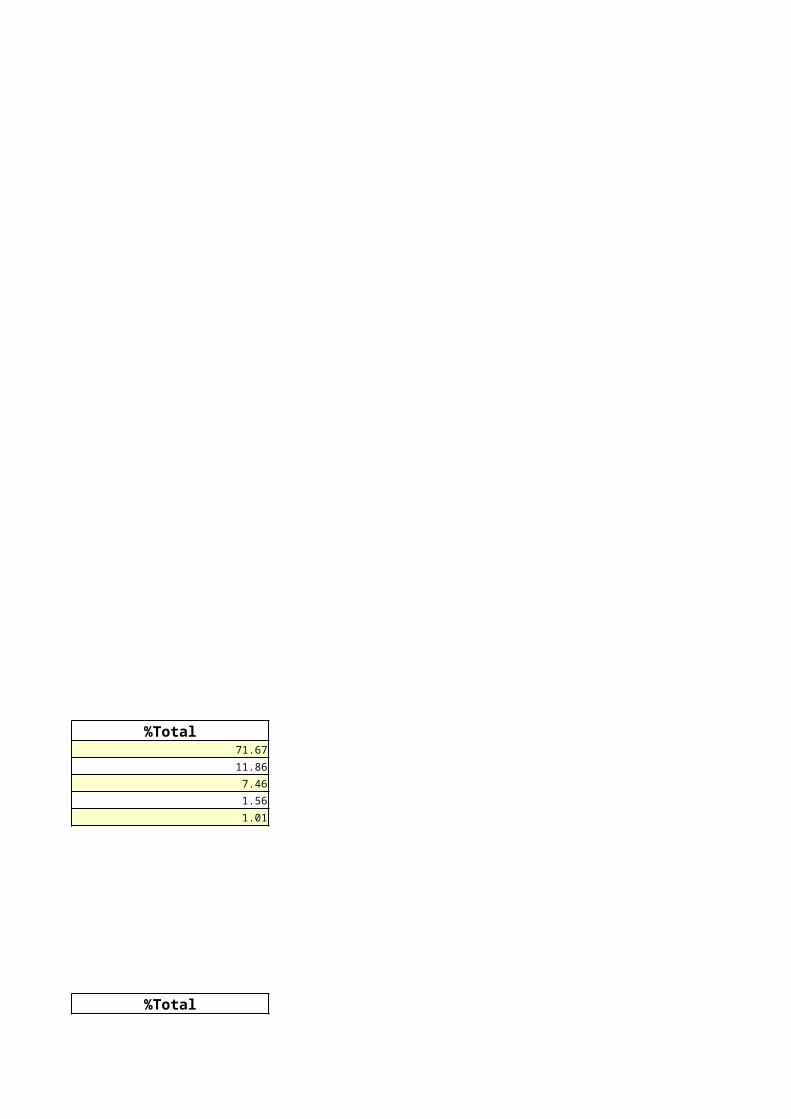
%Total71.67
11.86
7.46
1.56
1.01
%Total

95.79
1.68
1.6
0.21
0.18
%Total86.79
6.43
0.74
0.62
0.5
%Total86.79
6.43
0.74
0.62
0.5

%Total94.61
2.41
2.3
0.3
0.02
%Total12.12
6.34
3.37
3.11
2.65
%Total16.35
5.76
4.66
3.33
2.25
%Total20.22
14.96
11.88
9.89

9.07
%Total15
12.28
2.02
1.62
0.2
% of Capture20.17
11.86
9.85
9.66
9.46
% of Capture39.73
27.81
24.34
1.8
0.57
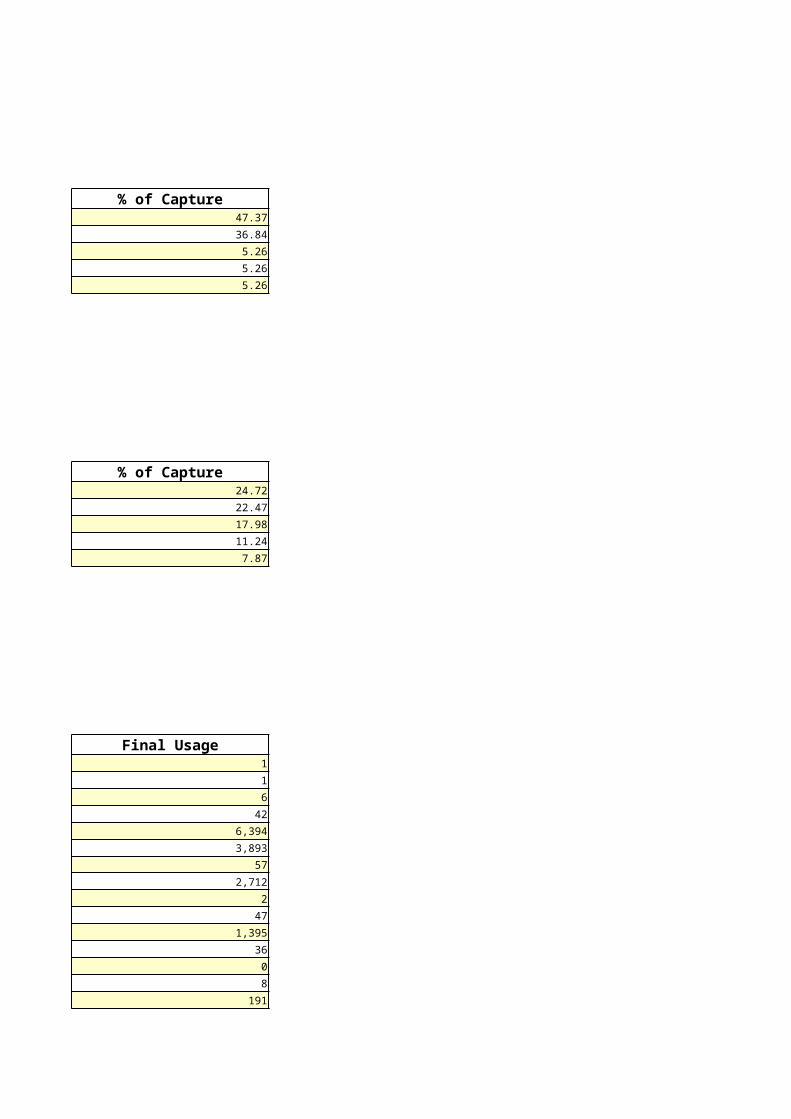
% of Capture47.37
36.84
5.26
5.26
5.26
% of Capture24.72
22.47
17.98
11.24
7.87
Final Usage1
1
6
42
6,394
3,893
57
2,712
2
47
1,395
36
0
8
191
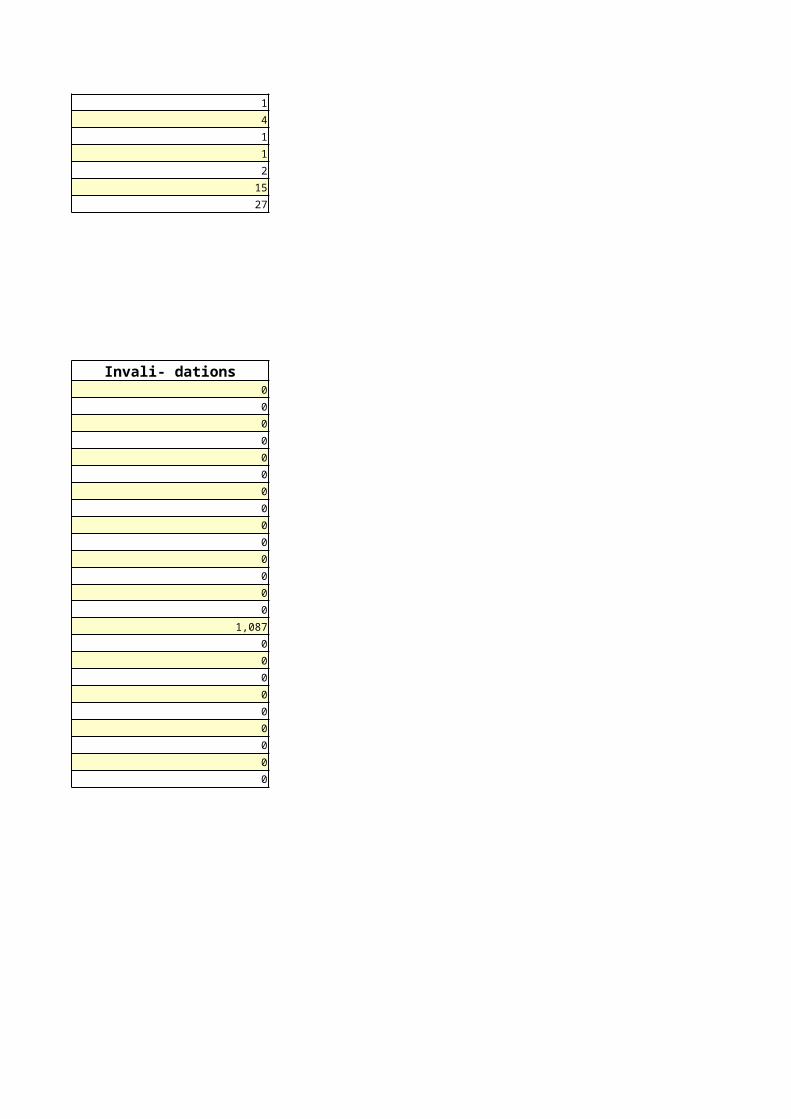
1
4
1
1
2
15
27
Invali- dations0
0
0
0
0
0
0
0
0
0
0
0
0
0
1,087
0
0
0
0
0
0
0
0
0
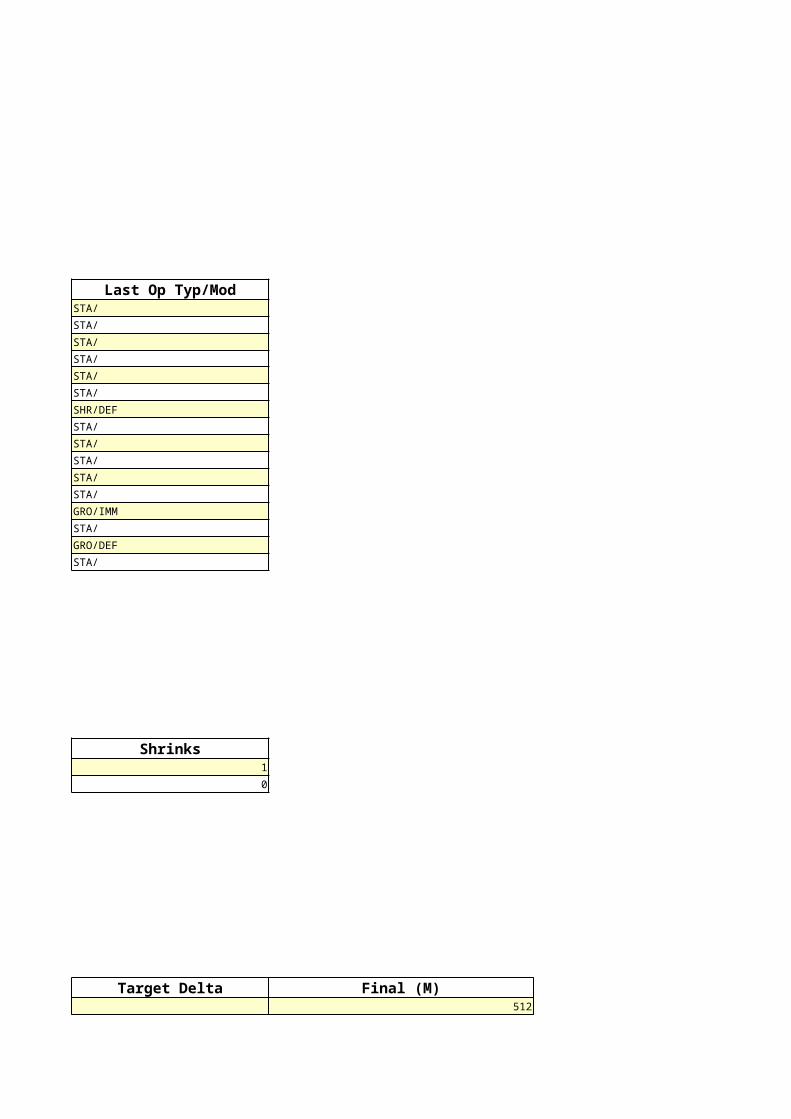
Last Op Typ/ModSTA/
STA/
STA/
STA/
STA/
STA/
SHR/DEF
STA/
STA/
STA/
STA/
STA/
GRO/IMM
STA/
GRO/DEF
STA/
Shrinks1
0
Target Delta Final (M) Sta512 COM
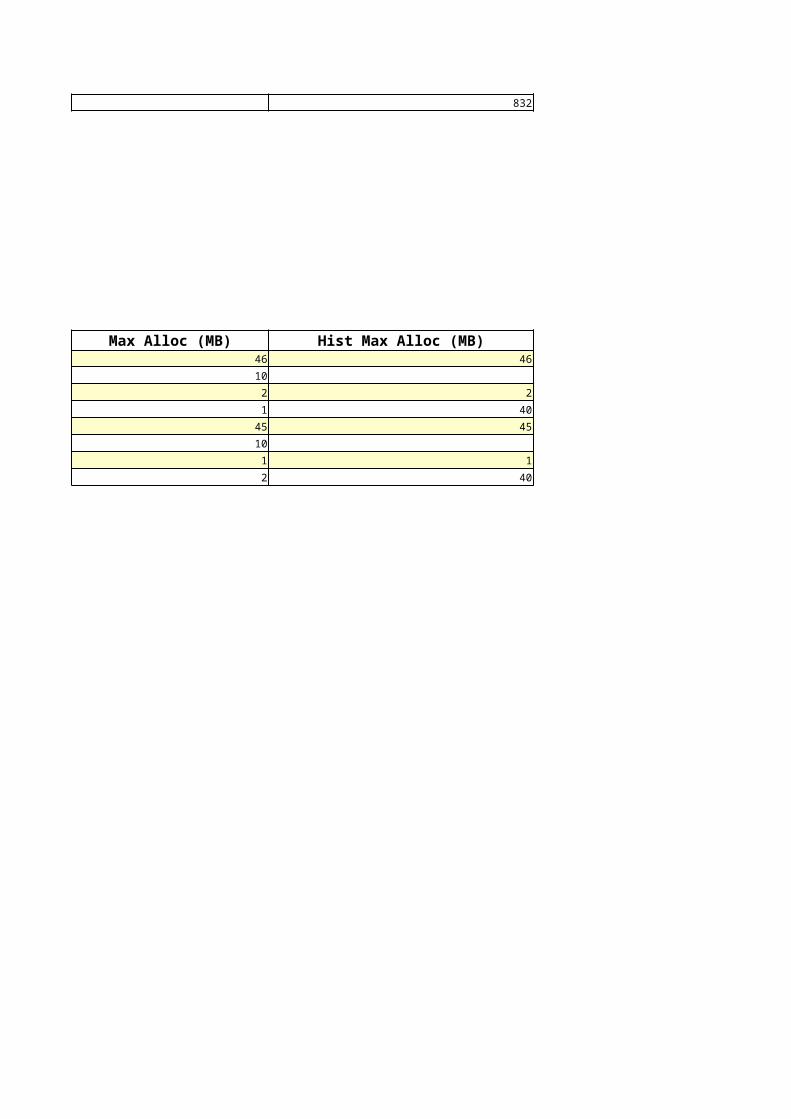
832 COM
Max Alloc (MB) Hist Max Alloc (MB) Num Proc46 46 68
10 36
2 2 66
1 40 39
45 45 73
10 45
1 1 71
2 40 44

Deq Time(s) %Transf Time %Eval Time0
Expire Msgs/sec
0
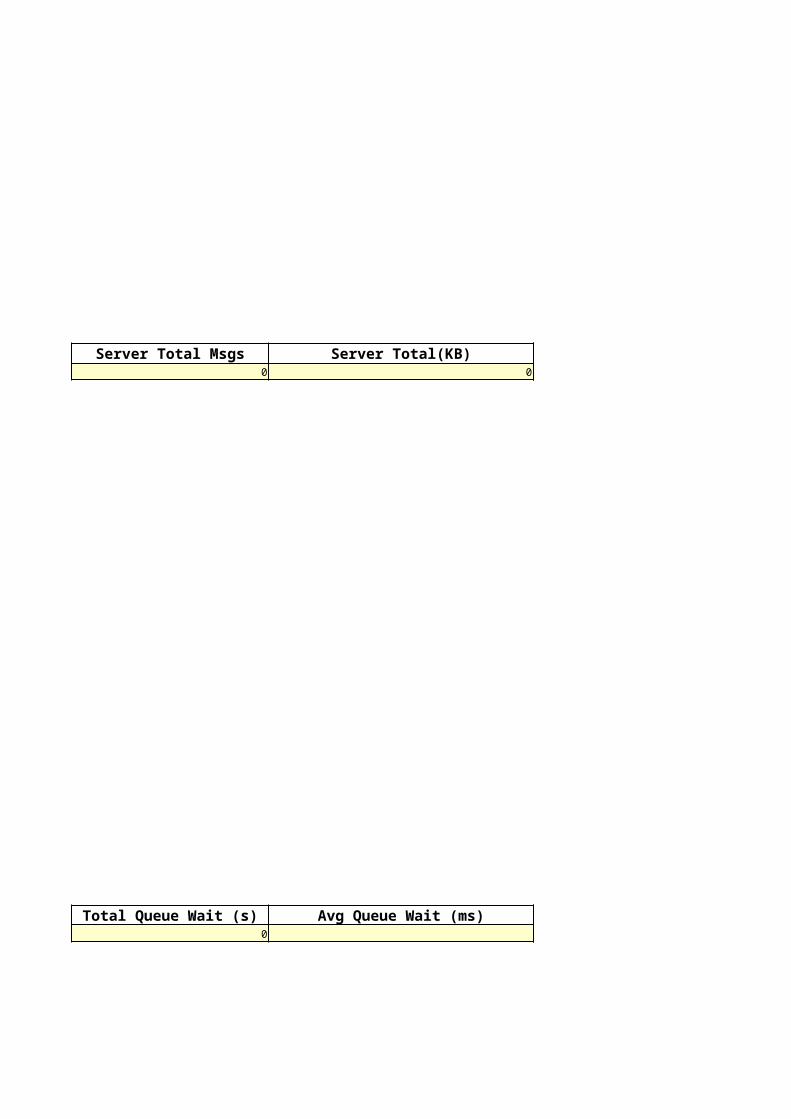
Server Total Msgs Server Total(KB)0 0
Total Queue Wait (s) Avg Queue Wait (ms)0

% of Waits>1s

0
100
75
25
0
0
0.1
0
0
0
100
50

6.9
0.4
0
27
1.1
100
87.5
0
0
0.7
98.7
100
50
97.8
50
100
50
21.9
100
99.8
36
100
74.2
0
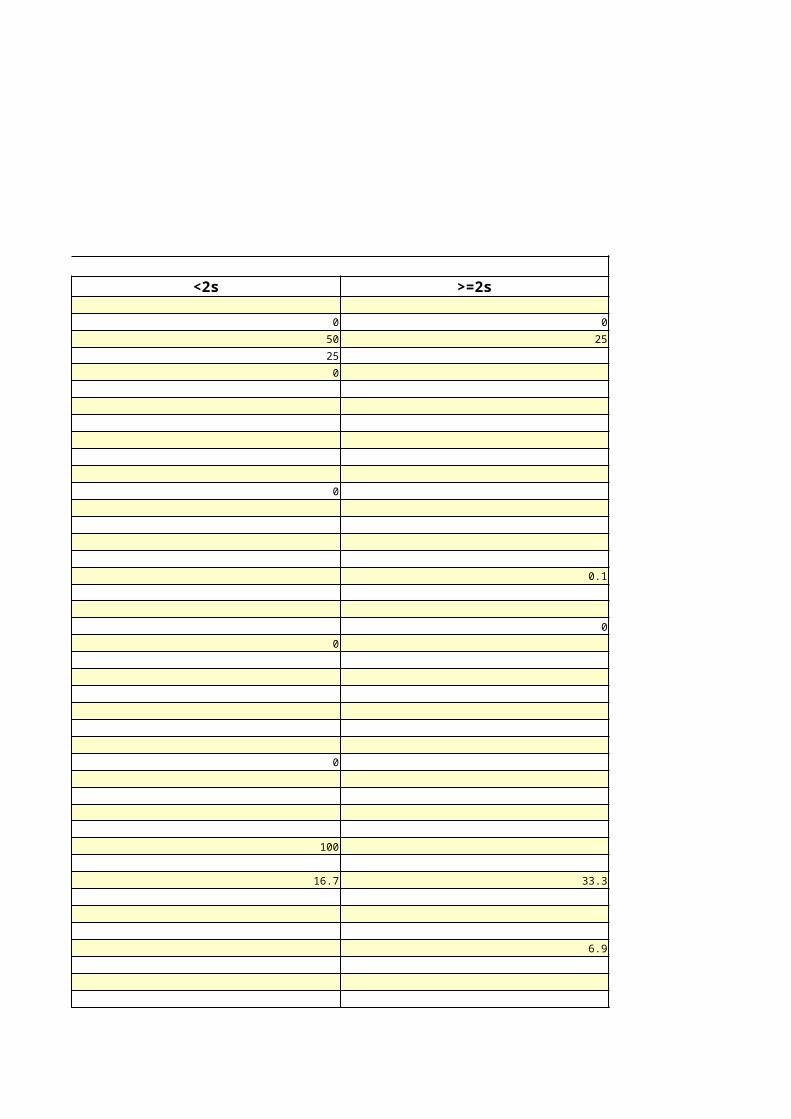
% of Total Waits>=2s
0
25
0.1
0
33.3
6.9

0.1
% of Total Waits>=2m
SQL TextSELECT vwflls_flu_id, vwflls_a...
INSERT INTO flight_uld_dgr (fl...
UPDATE FLIGHT_ULD B SET FLU_TF...
DELETE FROM flight_uld_dgr WHE...
DELETE FROM FLIGHT_ULD WHERE F...
SELECT fludgr_id FROM flight_u...
SELECT fludgr_id FROM flight_u...
BEGIN pack_reload.deassign_pos...
SELECT COUNT(vwflls_flu_id) FR...
SELECT COUNT(vwflls_flu_id) FR...
BEGIN pack_reload.assign_uld(:...
delete from FLIGHT_ULD where F...

SQL TextUPDATE FLIGHT_ULD B SET FLU_TF...
DELETE FROM FLIGHT_ULD WHERE F...
SELECT COUNT(vwflls_flu_id) FR...
BEGIN pack_reload.deassign_pos...
DECLARE job BINARY_INTEGER := ...
SELECT /* DS_SVC */ /*+ cursor...
delete from FLIGHT_ULD where F...
BEGIN pack_reload.assign_uld(:...
call dbms_stats.gather_databas...
delete from FLIGHT_ULD where F...
select /*+ no_parallel_index(t...
SELECT LS_VERSION, USR_CODE, L...
call dbms_space.auto_space_adv...
insert into wri$_adv_objspace_...
select segment_name, segment_t...
SQL TextDELETE FROM flight_uld_dgr WHE...
INSERT INTO flight_uld_dgr (fl...
SELECT fludgr_id FROM flight_u...
SELECT fludgr_id FROM flight_u...
SELECT vwflls_flu_id, vwflls_a...
UPDATE FLIGHT_ULD B SET FLU_TF...

SELECT COUNT(vwflls_flu_id) FR...
DELETE FROM FLIGHT_ULD WHERE F...
BEGIN pack_reload.deassign_pos...
BEGIN pack_reload.assign_uld(:...
SELECT COUNT(vwflls_flu_id) FR...
SELECT COLUMN_NAME FROM USER_T...
UPDATE flight_uld SET flu_on_l...
delete from FLIGHT_ULD where F...
SQL TextSELECT COUNT(vwflls_flu_id) FR...
UPDATE FLIGHT_ULD B SET FLU_TF...
DELETE FROM FLIGHT_ULD WHERE F...
BEGIN pack_reload.deassign_pos...
delete from FLIGHT_ULD where F...
BEGIN pack_reload.assign_uld(:...
SELECT LS_VERSION, USR_CODE, L...
delete from FLIGHT_ULD where F...
BEGIN :1 := pack_reload.check_...
select aul_date, b.aul_action,...
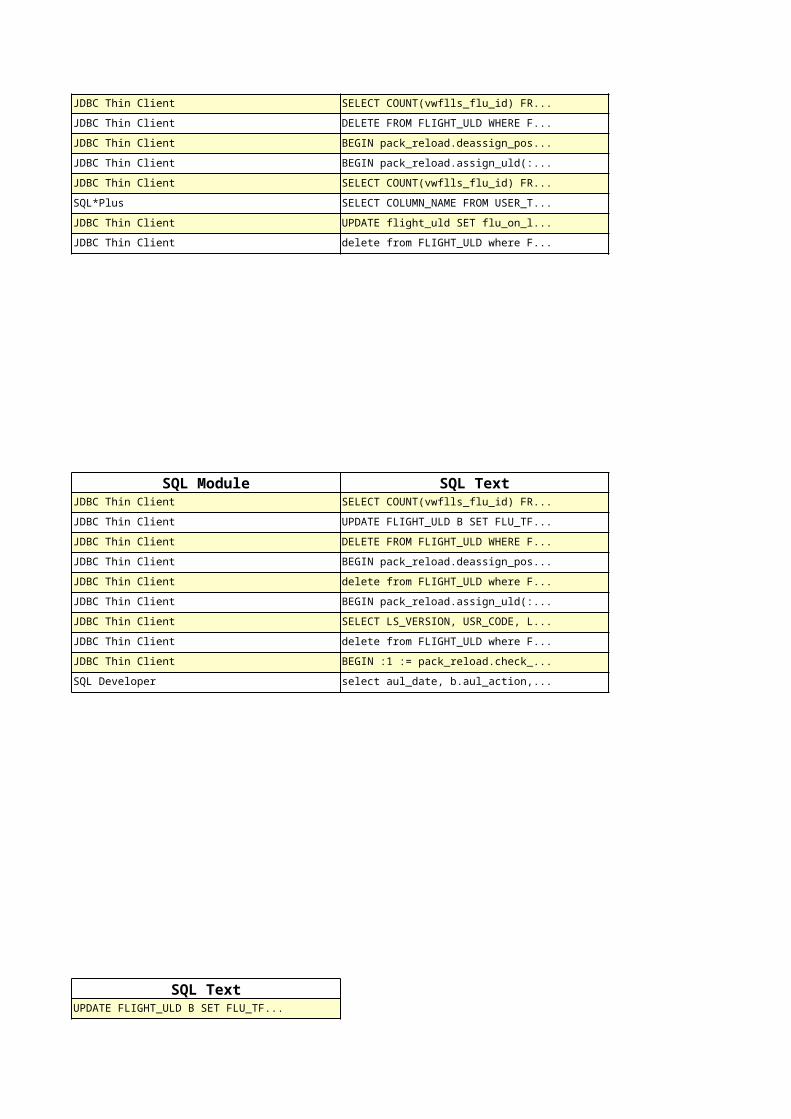
Av Buf Wt(ms)0
5
0.16
0
1.41
0.96
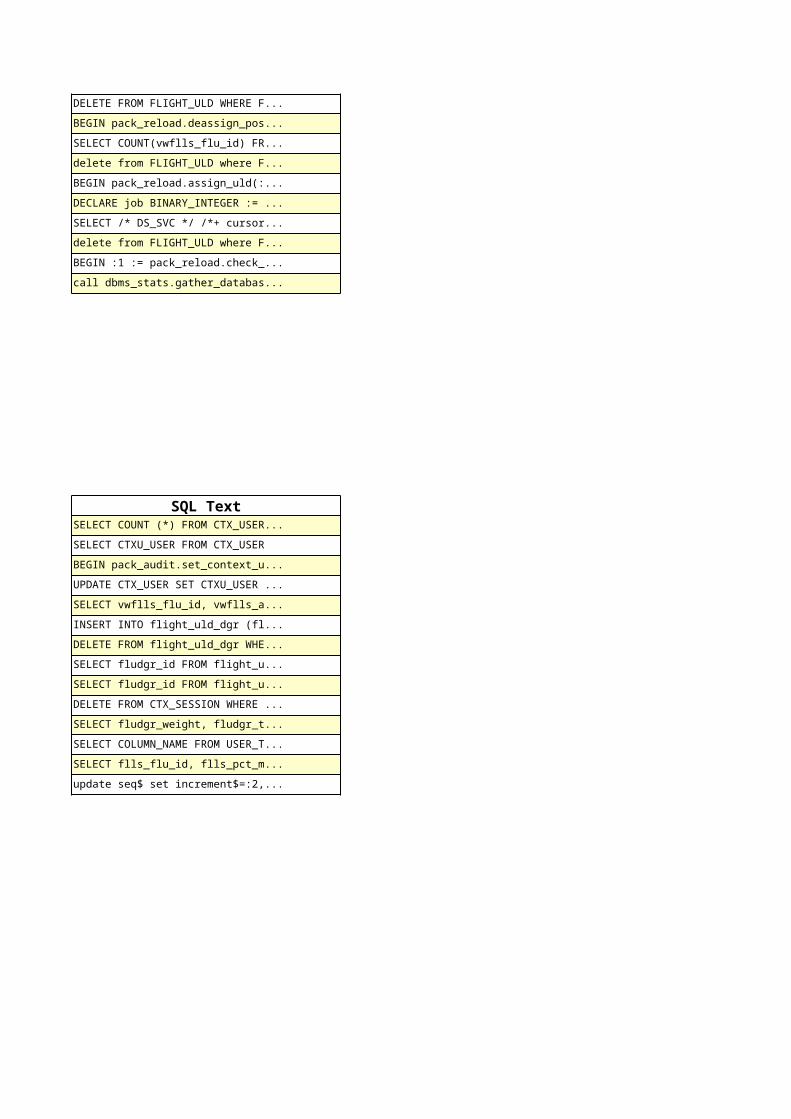
Opt Log Sz(M) Estd RAC Avail Time

Num Alloc68
36
66
30
73
45
71
35


