Awalin viz sec
38
1 Copyright © 2014, FireEye, Inc. All rights reserved. VIZSEC 2015 http://vizsec.org/vizsec2015/ Awalin Sopan
-
Upload
awalin-sopan -
Category
Science
-
view
314 -
download
0
Transcript of Awalin viz sec

1 Copyright © 2014, FireEye, Inc. All rights reserved.
VIZSEC 2015http://vizsec.org/vizsec2015/
Awalin Sopan

2 Copyright © 2014, FireEye, Inc. All rights reserved.
Co-located events with IEEE VIS
– InfoVis (information visualization)
– VAST (visual analytics in sci and tech)
– VizSec: 11 papers, 6 posters,…
– SciVis, .etc

3 Copyright © 2014, FireEye, Inc. All rights reserved.
Why visualize data?

4 Copyright © 2014, FireEye, Inc. All rights reserved.
Anscombe’s Quartet
1 2 3 4
x y x y x y x y
10.0 8.04 10.0 9.14 10.0 7.46 8.0 6.58
8.0 6.95 8.0 8.14 8.0 6.77 8.0 5.76
13.0 7.58 13.0 8.74 13.0 12.74 8.0 7.71
9.0 8.81 9.0 8.77 9.0 7.11 8.0 8.84
11.0 8.33 11.0 9.26 11.0 7.81 8.0 8.47
14.0 9.96 14.0 8.10 14.0 8.84 8.0 7.04
6.0 7.24 6.0 6.13 6.0 6.08 8.0 5.25
4.0 4.26 4.0 3.10 4.0 5.39 19.0 12.50
12.0 10.84 12.0 9.13 12.0 8.15 8.0 5.56
7.0 4.82 7.0 7.26 7.0 6.42 8.0 7.91
5.0 5.68 5.0 4.74 5.0 5.73 8.0 6.89

5 Copyright © 2014, FireEye, Inc. All rights reserved.
Anscombe’s Quartet
1 2 3 4
x y x y x y x y
10.0 8.04 10.0 9.14 10.0 7.46 8.0 6.58
8.0 6.95 8.0 8.14 8.0 6.77 8.0 5.76
13.0 7.58 13.0 8.74 13.0 12.74 8.0 7.71
9.0 8.81 9.0 8.77 9.0 7.11 8.0 8.84
11.0 8.33 11.0 9.26 11.0 7.81 8.0 8.47
14.0 9.96 14.0 8.10 14.0 8.84 8.0 7.04
6.0 7.24 6.0 6.13 6.0 6.08 8.0 5.25
4.0 4.26 4.0 3.10 4.0 5.39 19.0 12.50
12.0 10.84 12.0 9.13 12.0 8.15 8.0 5.56
7.0 4.82 7.0 7.26 7.0 6.42 8.0 7.91
5.0 5.68 5.0 4.74 5.0 5.73 8.0 6.89
Property Value
Mean of x 9.0
Variance of x 11.0
Mean of y 7.5
Linear regression y = 3 + 0.5x
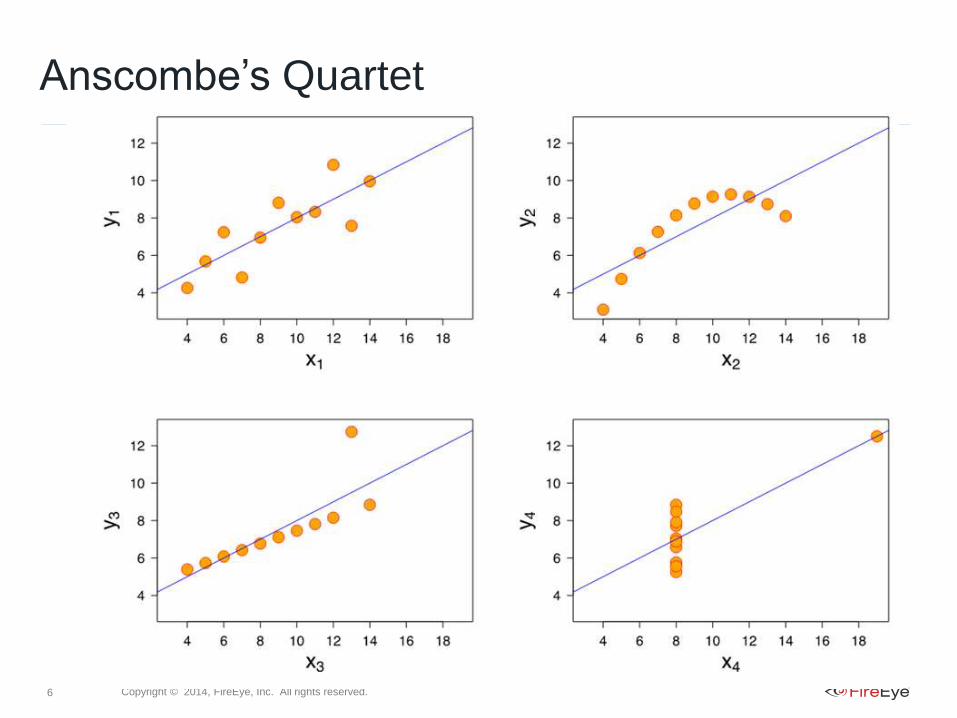
6 Copyright © 2014, FireEye, Inc. All rights reserved.
Anscombe’s Quartet
7 Copyright © 2014, FireEye, Inc. All rights reserved.
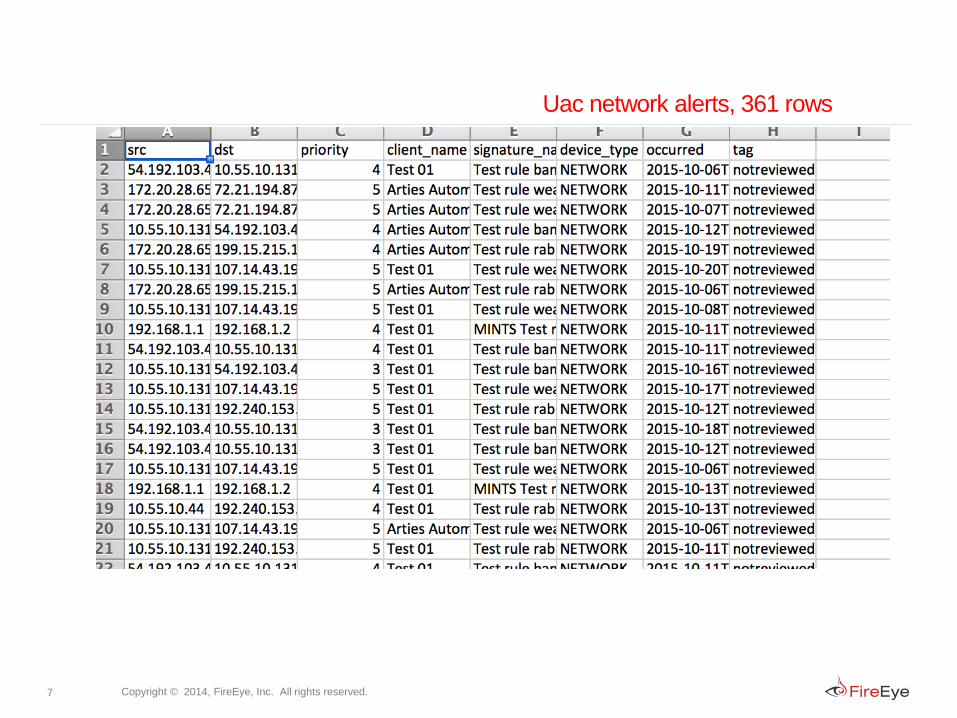
Uac network alerts, 361 rows
8 Copyright © 2014, FireEye, Inc. All rights reserved.
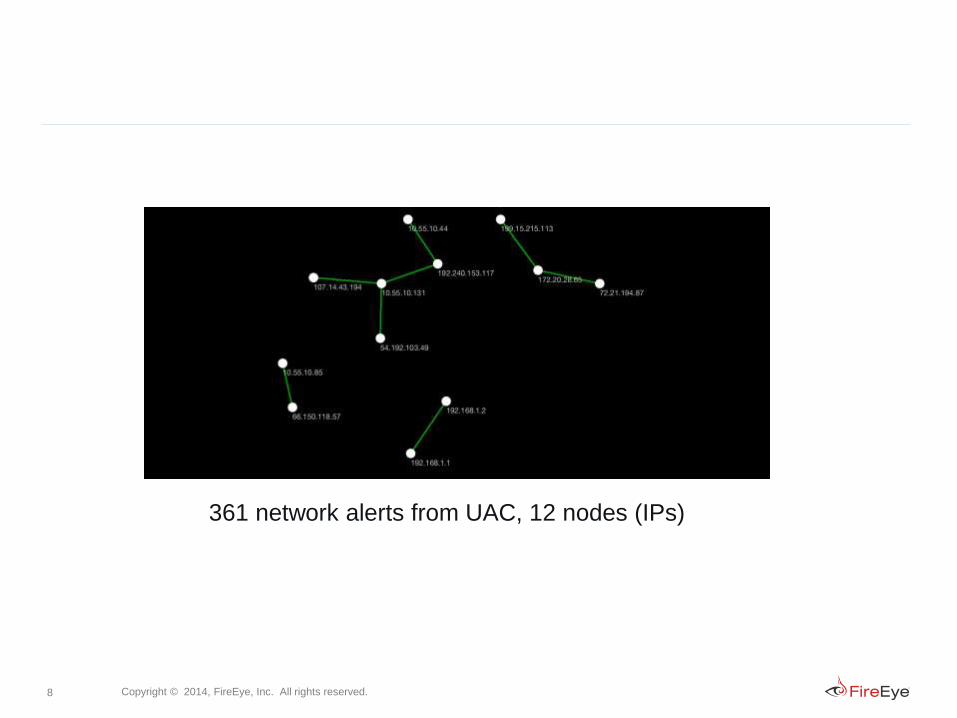
361 network alerts from UAC, 12 nodes (IPs)
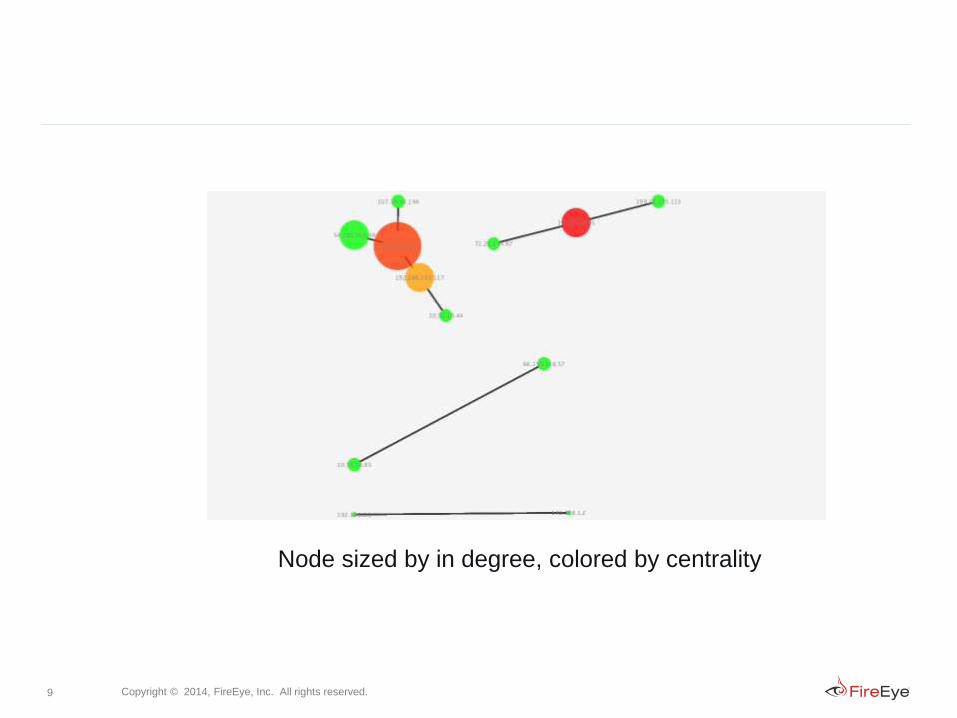
9 Copyright © 2014, FireEye, Inc. All rights reserved.
Node sized by in degree, colored by centrality

10 Copyright © 2014, FireEye, Inc. All rights reserved.
Multivariate: Packet/TCP dump, (ip, port, pkt size,
time, etc…multiple variables), Server Logs table, scatter plot, bubble chart, parallel coordinate
Relational: Netflow (nodes and edges): Src ip and dest ip >Node-link
diagram, Matrix diagram
Can identify active nodes
Temporal: Log Files/Activity/EventsHost/endpoint events over time>Line chart, histogram
Can identify anomalous pattern
Security Data

11 Copyright © 2014, FireEye, Inc. All rights reserved.
Charts and Dashboards: static representation

12 Copyright © 2014, FireEye, Inc. All rights reserved.
• Vulnerabilities
• IDS alarms (NIDS/HIDS) , correlating alerts
• worm/virus propagation
• routing anomalies
• large volume computer network logs
• visual correlations of security events
• network traffic for security
• attacks in near-real-time
• dynamic attack tree creation (graphic)
• signature detection
Visual Analytics for Cyber Security -Greg Conti, US Army

13 Copyright © 2014, FireEye, Inc. All rights reserved.
• noise in the data
• skewed data distribution
• efficient processing of large amounts of data
• anomaly detection
• feature selection/construction
• forensic visualization

14 Copyright © 2014, FireEye, Inc. All rights reserved.
Visual Analytics: Interactive Visual Interface for Decision Making
Overview data using charts, dashboard, tables: see all alerts
– Find pattern, trend, outlier, correlation
– Sort by rank
– Group similar things: group by signature
Zoom and filter: select only interesting ones
Details on Demand: details of the selected alert
Relate: show related alerts

15 Copyright © 2014, FireEye, Inc. All rights reserved.
Time-based Network Traffic Visualization
-John Goodall et al, 2005http://tnv.sourceforge.net/
src dest
Packets, background colored by host ip, links colored by protocol

16 Copyright © 2014, FireEye, Inc. All rights reserved.

17 Copyright © 2014, FireEye, Inc. All rights reserved.
VisAlert: Livnat et al., 2005http://link.springer.com/chapter/10.1007%2F978-3-540-78243-8_11#page-1
https://www.youtube.com/watch?v=tB_uAb1DN8g

18 Copyright © 2014, FireEye, Inc. All rights reserved.
Probe phase Attack phase
19 Copyright © 2014, FireEye, Inc. All rights reserved.
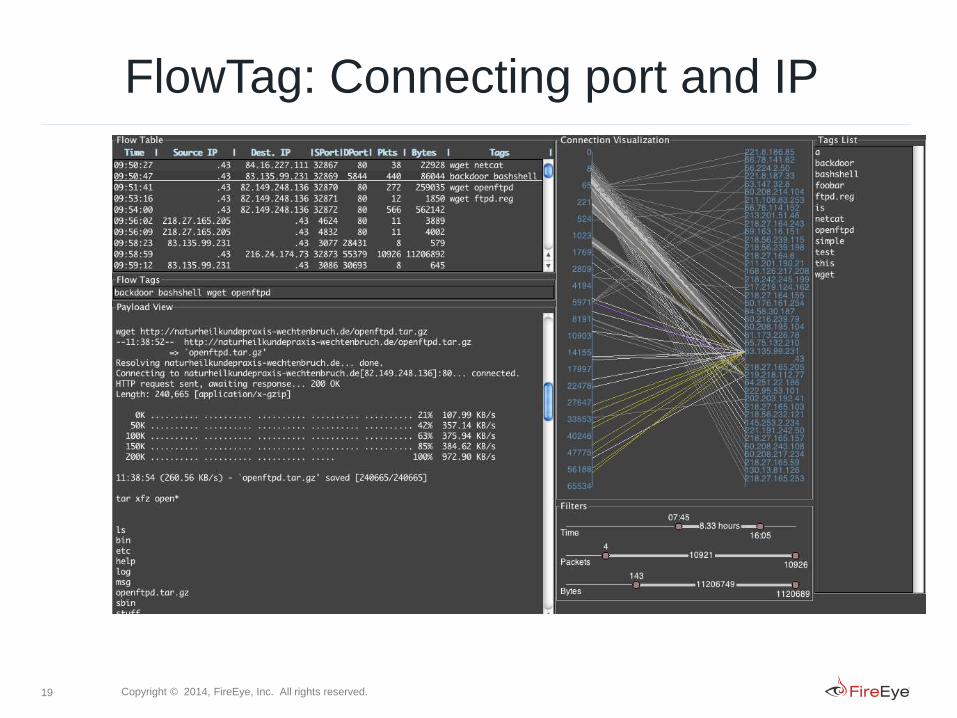
FlowTag: Connecting port and IP

20 Copyright © 2014, FireEye, Inc. All rights reserved.
Binary File Vis
http://binvis.io/#/view/examples/elf-Linux-ARMv7-ls.bin

21 Copyright © 2014, FireEye, Inc. All rights reserved.
Some Papers from VizSec 2015

22 Copyright © 2014, FireEye, Inc. All rights reserved.
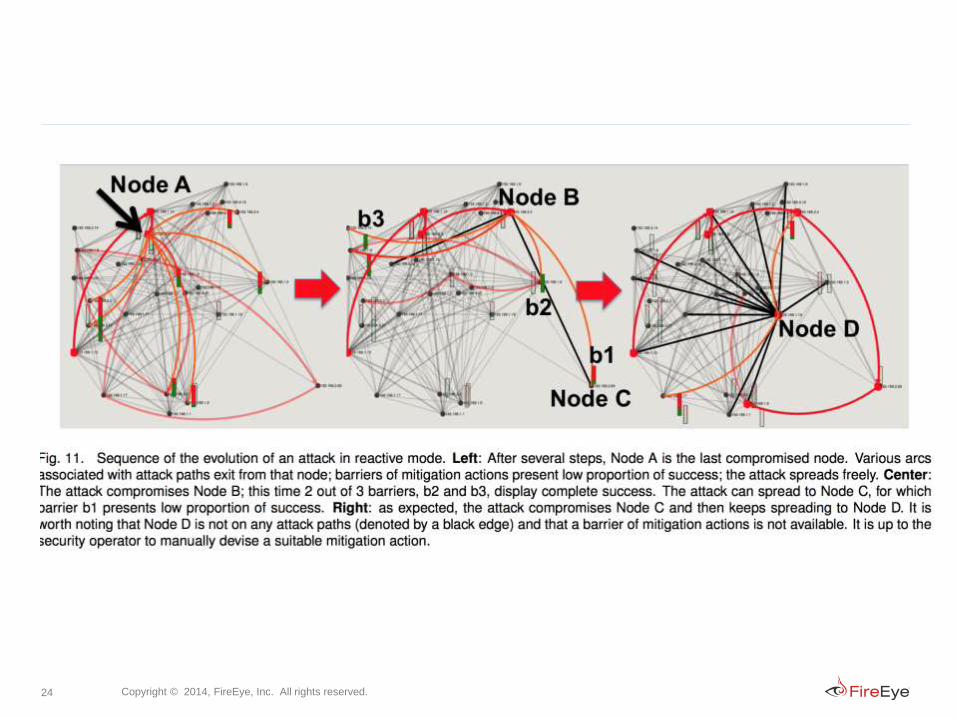
Percival: compute attack graph, assess response plan
Possible attack graphs

23 Copyright © 2014, FireEye, Inc. All rights reserved.
24 Copyright © 2014, FireEye, Inc. All rights reserved.
25 Copyright © 2014, FireEye, Inc. All rights reserved.
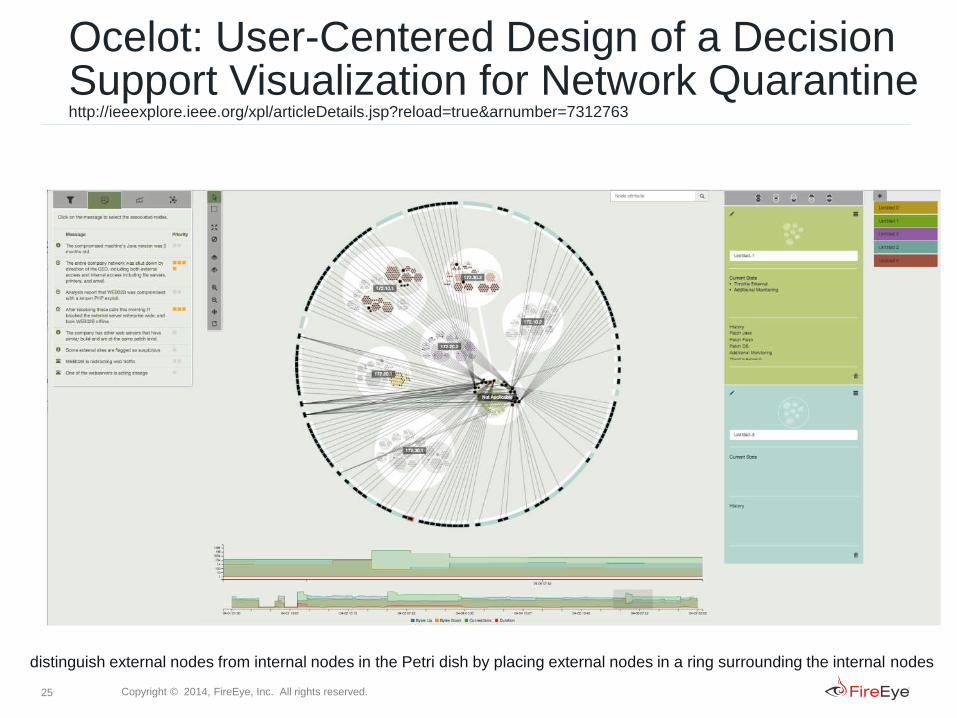
Ocelot: User-Centered Design of a Decision Support Visualization for Network Quarantine http://ieeexplore.ieee.org/xpl/articleDetails.jsp?reload=true&arnumber=7312763
distinguish external nodes from internal nodes in the Petri dish by placing external nodes in a ring surrounding the internal nodes
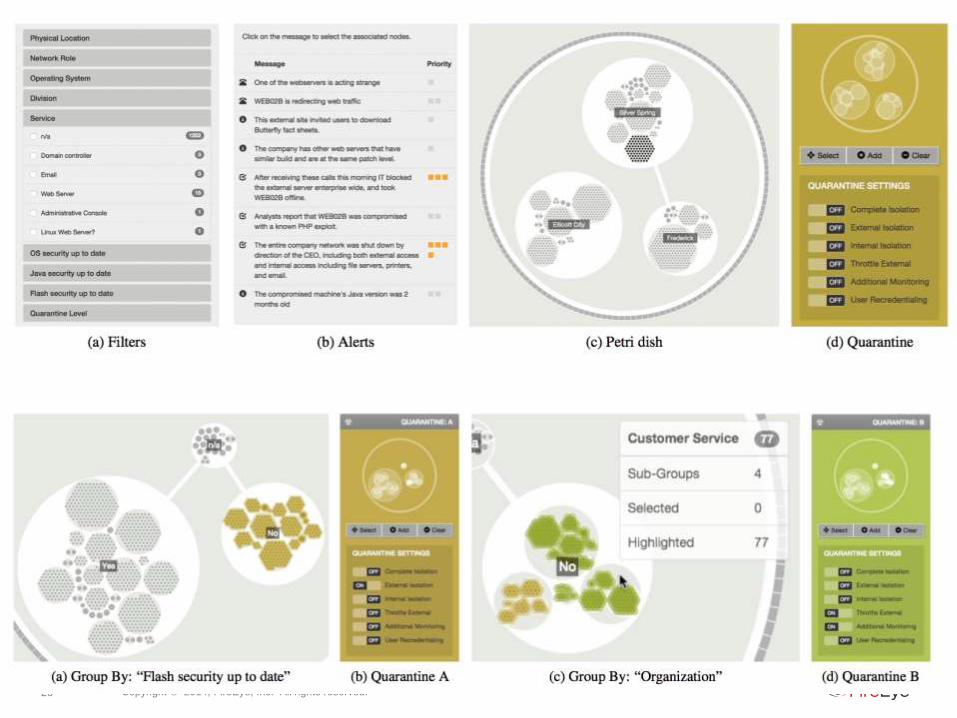
26 Copyright © 2014, FireEye, Inc. All rights reserved.

27 Copyright © 2014, FireEye, Inc. All rights reserved.
feedback from 4 security engineers ->
added time series filtering and brushing

28 Copyright © 2014, FireEye, Inc. All rights reserved.
Unlocking User-Centered Design Methods for Building Cyber Security Visualizations
• Worked with a cyber security company, to improve their dashboard
• Created 20 types of visualizations: categorized in Network, Map, Charts,
and Time series
• Showed them to analysts
• Finally developed prototype of the new interface
• URL: http://mckennapsean.com/projects/vizsec-design-methods/

29 Copyright © 2014, FireEye, Inc. All rights reserved.

30 Copyright © 2014, FireEye, Inc. All rights reserved.
The analyst was unconvinced that the graphs could show meaningful insights at
scale with each node representing a single IP address.
The layout algorithm confused the analyst since it positioned each IP address at a
location that was not meaningful to the analyst.

31 Copyright © 2014, FireEye, Inc. All rights reserved.
The map representations garnered positive feedback from the
analyst, in particular the cartograms due to their novelty.
32 Copyright © 2014, FireEye, Inc. All rights reserved.
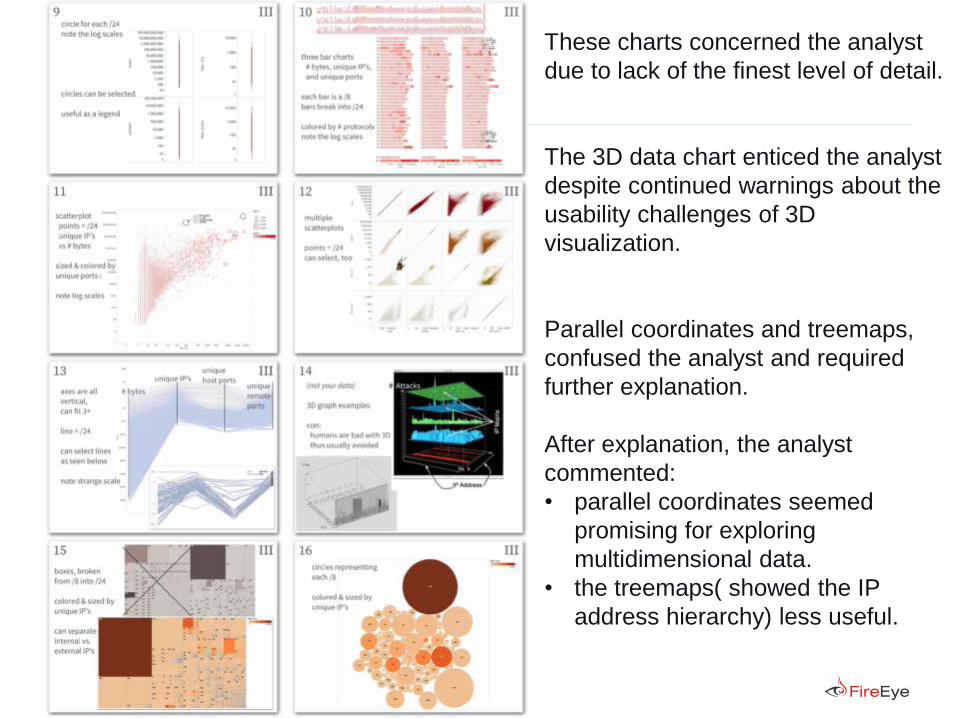
These charts concerned the analyst
due to lack of the finest level of detail.
The 3D data chart enticed the analyst
despite continued warnings about the
usability challenges of 3D
visualization.
Parallel coordinates and treemaps,
confused the analyst and required
further explanation.
After explanation, the analyst
commented:
• parallel coordinates seemed
promising for exploring
multidimensional data.
• the treemaps( showed the IP
address hierarchy) less useful.

33 Copyright © 2014, FireEye, Inc. All rights reserved.
Timestamp was one of the least important data fields for the analyst.

34 Copyright © 2014, FireEye, Inc. All rights reserved.
Avoid visual representations that require significant explanation, such as parallel coordinates or treemaps.
Precise details on the time scale may not be immediately vital.
Summary views for communication can use aggregation.
Aggregation of data should be immediately obvious.
A map-based view could aid the discovery of patterns.

35 Copyright © 2014, FireEye, Inc. All rights reserved.
Visualizing the Insider Threat: Challenges and tools for identifying malicious user activityhttp://ieeexplore.ieee.org/xpl/login.jsp?tp=&arnumber=7312772&url=http%3A%2F%2Fieeexplore.ieee.org%2Fiel7%2F7310645%2F7312757%2F07312772.pdf%3Farnumber%3D7312772
Interactive PCA of user activity
Anomalous cluster

36 Copyright © 2014, FireEye, Inc. All rights reserved.
Ensemble Visualization For Cyber Situation Awareness of Network Security Data
Goals:– Cluster traffic with similar behavior
– Identify traffic with unusual patterns
Ensembles:– Snort alerts ensemble: source and destination IP, port,
time, protocol, message, and classification.
– Flow ensemble: An alert belongs to a flow if it is detected within the time range of the flow, has the same source and dest IP.
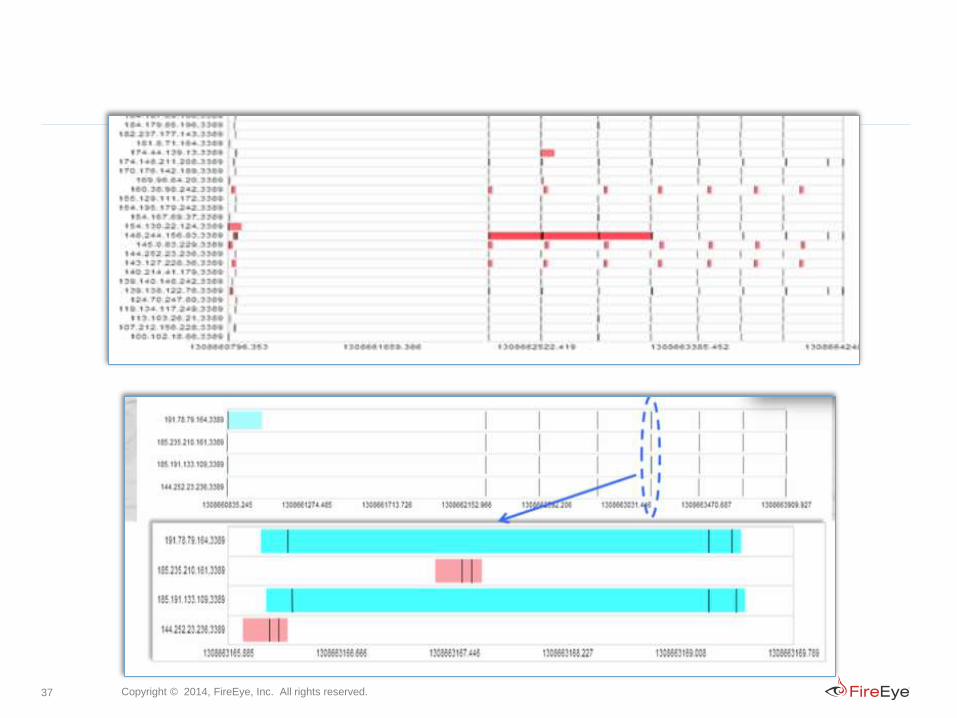
37 Copyright © 2014, FireEye, Inc. All rights reserved.

38 Copyright © 2014, FireEye, Inc. All rights reserved.
• (Human && Machine) >> (Human || Machine)
• Network visualization is complex due to huge data, need
contextual analysis, use of better layout, clustering.
• Although some groups directly worked with analysts
(APL, PNNL, DoD,…), not enough intersection of
knowledge from security and visual analytics.
• VizSec 2016, Baltimore, MD!
Takeaways…