Aviva plc P li i R lt 2010Preliminary Results 2010 · downturn of the insurance indus try; ......
45
Aviva plc P li i R lt 2010 Preliminary Results 2010
Transcript of Aviva plc P li i R lt 2010Preliminary Results 2010 · downturn of the insurance indus try; ......

Aviva plc P li i R lt 2010Preliminary Results 2010

DisclaimerDisclaimerCautionary statements:
This should be read in conjunction with the documents filed by Aviva plc (the “Company” or “Aviva”) with the United States Securities and Exchange Commission (“SEC”). This announcement contains, and we may make verbal statements containing, “forward-looking statements” with respect to certain of Aviva’s plans and current goals and expectations relating to future financial condition, performance, results, strategic initiatives and objectives. Statements containing the words “believes”, “intends”, “expects”, “plans”, “will,” “seeks”, “aims”, “may”, “could”, “outlook”, “estimates” and “anticipates”, and words of similar meaning, are forward-looking. By their nature, all forward-looking statements involve risk and uncertainty. Accordingly, there are or will be important factors that could cause actual results to differ materially from those indicated in y g y p ythese statements. Aviva believes factors that could cause actual results to differ materially from those indicated in forward-looking statements in the presentation include, but are not limited to: the impact of difficult conditions in the global capital markets and the economy generally; the impact of new government initiatives related to the financial crisis; defaults and impairments in our bond, mortgage and structured credit portfolios; changes in general economic conditions, including foreign currency exchange rates, interest rates and other factors that could affect our profitability; the impact of volatility in the equity capital and credit markets on our profitability and ability to access capital and credit; risksour profitability; the impact of volatility in the equity, capital and credit markets on our profitability and ability to access capital and credit; risks associated with arrangements with third parties, including joint ventures; inability of reinsurers to meet obligations or unavailability of reinsurance coverage; a decline in our ratings with Standard & Poor’s, Moody’s, Fitch and A.M. Best; increased competition in the U.K. and in other countries where we have significant operations; changes to our brands and reputation; changes in assumptions in pricing and reserving for insurance business (particularly with regard to mortality and morbidity trends, lapse rates and policy renewal rates), longevity and endowments; a cyclical downturn of the insurance industry; changes in local political, regulatory and economic conditions, business risks and challenges which may impact demand for our products, our investment portfolio and credit quality of counterparties; the impact of actual experience differing from estimates on amortisation of deferred acquisition costs and acquired value of in-force business; the impact of recognising an impairment of our goodwill or intangibles with indefinite lives; changes in valuation methodologies, estimates and assumptions used in the valuation of investment securities; the effect of various legal proceedings and regulatory investigations; the impact of operational risks; the loss of key personnel; the impact of catastrophic events on our results; changes in government regulations or tax laws in jurisdictions where we conduct business; funding risks associated with our pension schemes; the effect of undisclosed liabilities, integration issues and other risks associated with our acquisitions; and the timing impact and other uncertainties relating to acquisitions and disposals and relating to other future acquisitions, combinations or disposals within relevant industries. For a more detailed description of these risks, uncertainties and other factors, please see Item 3, “Risk Factors” and Item 5 “Operating and Financial Review and Prospects” in Aviva’s Annual Report Form 20-F filed with the SEC on 30 March 2010Factors , and Item 5, Operating and Financial Review and Prospects in Aviva s Annual Report Form 20-F filed with the SEC on 30 March 2010. Aviva undertakes no obligation to update the forward looking statements in this announcement or any other forward-looking statements we may make. Forward-looking statements in this presentation are current only as of the date on which such statements are made.
2

Agenda
1. Review of the business Andrew Moss
2 Financial res lts Patrick Regan2. Financial results Patrick Regan
3. Looking ahead Andrew Moss3. Looking ahead Andrew Moss
4. Q&A
3

Significant growth in all key performance metrics
IFRS operating profit
Net operating capital generated
£1.7bn£2,550m
IFRS Return on Equity
14.8%
£1.0bn
,
£2,022m10.9%
26%70%
FY10FY09FY10FY09
NAV 621pDividend
FY10FY09
Funds under management
EEV374p
454p25.5p
6%24p80p
£402bn
£23bn£379bn
IFRS
EEV374p
IFRS
24p
4FY10FY09 FY10FY10FY09FY10FY09

Strong growth in Life & GI
Life IRR
12.5%
Life sales (PVNBP)
£33.4bn
Life operating profit
£2,318m
10.0%2.5ppt£32.0bn 4%
£1,887m23%
FY10FY09FY10FY09FY10FY09
GI & Health sales (NWP) GI CORGI & Health operating profit
£9.2bn
£9.7bn 99%
97%6%£960m
£1,050m
9%
5FY10FY09 FY10FY09FY10FY09

Growing income whilst controlling expenses
£m
8,000 Income
7,000
6,000
5,000
Expenses
4,000FY09 FY10
6

Growth in sales and profits in UK – Life
L&P sales
£8.9bn£10.3bn 15%
New business IRRIncreased sales, returns and profits16%
£5.7bn
£5.8bn
Pensions, bonds
P b k
Improved7 year
14%• Record and sustainable profits
of £850 million
S b t ti d t
£4.6bn£3.1bn Protection
& annuities
Payback8 years
payback • Substantive and permanent operational change implemented
• Increased earnings from new b i d th i f b k
45%
FY09 FY10 FY09 FY10
IFRS operating profitNet operating
business and the in-force book
• Continued shift in mix towards more profitable credit and IFRS operating profit
£850mcapital generated
£0.4bn
insurance related earnings
• New distribution agreements with Santander and RBS
26%£672m
£0.1bn
x4
26%
7FY09 FY10FY09 FY10

Growth in sales and profits in UK – GI
GI & health NWP£4.5bn
£4 3bn
GI COR*
99%Improved sales, COR and profits
Fo r consec ti e q arters of GI6%£4.3bn
96%Four consecutive quarters of GIsales growth• Strong retention levels• Growth in Direct and the
6%
Growth in Direct and the RAC panel
Significant improvement in current year COR due to:
FY09 FY10 FY09 FY10
GI & healthoperating profits
year COR due to:• Strong underwriting• Further cost savings• Distribution management
Net operating capital generated
£535m
£579moperating profits
£0.6bn
£0 4bn
• Distribution management
Improvement in spite of £40 million exceptional weather-related claims
capital generated
8%50%
£0.4bn
8FY09 FY10FY09 FY10
* COR excludes Aviva Re and run-off business

Resilience and profit growth in Europe – Life
13%
L&P sales New business IRRResilience and growth in profits
R ili t b i i i d
£13.5bn £13.5bn
Payback Payback
13% 13% Resilient new business in a period of continued economic volatilitySecond half sales lower due to:• Legislative changes and
£10.1bn£10.9bn
Pensions,WP savings
Payback7 years
Payback7 years
Legislative changes and economic pressures
• Actions taken to redesign products and refocus sales
£3.5bn£2.6bn Unit linked, Protection
33%
FY09 FY10 FY09 FY10
IFRS operating profitsNet operating capital generated*
Resulting in improved second half margin and increased capital efficiency Continued bancassurance
£ 61
£893m£0.3bn £0.3bn
capital generated Continued bancassuranceleadershipHigher returns from AUM growth in France, Italy and Spain17%
£761m Introduction of realistic term assurance reserving in IrelandQuantum Leap programme continues to deliver
9FY09 FY10FY09 FY10
continues to deliver
* For both life and non-life business

Improved sales in Europe – GIbut COR remains high
£2.0bn103%
Improved sales, COR remains high
GI & health NWP GI COR
£1.9bn 103%103%4% • GI sales growth across the portfolio offset by a tougher environment in IrelandHealth franchise continues• Health franchise continues to grow
• Profit reflects a fall in investment returns
FY09 FY10 FY09 FY10
GI & healthoperating profits
COR reflects:• Second year of exceptional
£132m
£109m
operating profits
-17%
weather related claims • Lower reserve margin releases• Offset by cost savings
10FY09 FY10

Significant profit improvement in North America
£4.5bn £4.7bn4%
14%L&P sales New business IRR
Significant increase in Life profits
£3.7bn£3.6bn
Annuity
Improved4 year
7%
Profitable growth and capital self-sufficiency
• Diversification of business mix f f
£1.0bn£0.9bn Life
15% Payback14 years
payback with a focus on life sales• Strong improvement in IRR
reflects product, pricing & capital actions
FY09 FY10 FY09 FY10
Net operating capital generated
p• Re-pricing of the in-force book• Improved economic environmentIFRS
operating profit
£0.3bn
capital generatedCanadian COR of 97%Record profits achieved in 2010• Improved underwriting
operating profit
54% £222m
£174m
£0.1bn
x3 • Pricing action across the book• Favourable weather conditions
54%
£144m
£222m
GI
x2
£85m£174m
11FY09 FY10 FY09 FY10
Life

Value growth in Asia Pacific
£1.6bn 11%Increased sales, returns and profits
L&P sales New business IRR
£1.1bn48%
Improved13 year
6%• Scale and mix drives a
500 bps IRR improvement• Bancassurance contributes
51% of sales a 76% increasePayback25 years
13 year payback 51% of sales, a 76% increase
from 2009• Resilient and growing in-force
book with a 66% increase in FY09 FY10 FY09 FY10 IFRS in-force profits
Continuing progressUnderlying total IFRS operating profits*
Sales growth absorbs expenses
• Well positioned to benefit from the region’s long-term growth potential
• Pulling back from high capital
£4mFY09
operating profits
• Pulling back from high capital low return markets
• Sharpened focus on creating franchise value through
i th
FY1048%
5%
12
organic growth
All FY09 figures exclude Australia, which was sold in 2009* Underlying operating profit excludes Australia and Singapore reserve release in FY09; FY10 excludes China GAAP adjustment
£(31)mExpensesSales
Profit growth and further investment in fund management
Operating profits
£201mIncrease in profitsGrowth in profits driven by Delta
£133m
Delta Lloyd
DeltaLloyd
51%
p yLloyd emerging markets profits
Continuing investment in Aviva Investors
AvivaInvestors
AvivaInvestors
• Investment in capability and infrastructure development
• Continuing high performance i t b h kFY09 FY10
Aviva InvestorsFunds performing above
*Positive third party
against benchmarks• Growing pipeline of
external mandates• Increased focus on higherbenchmark* net flows**
78% 73%£2.4bn
Increased focus on higher margin assets
• Ongoing improvement in client service standards
£(0.2)bn
FY09
FY10
FY08
13FY09 FY10 £(3)bn
* On an equally weighted 1 and 3 year basis where benchmarks exist ** excluding liquidity funds

Delta Lloyd – strong profit growth
Life PVNBP*
£3.3bn£3 1bn
GI&H NWP
£1 2bn £1 2bn
Strong operating performance• Life new business IRR
IRR IRR*
£3.1bn
COR COR
£1.2bn £1.2bnimprovement due to mix and cost savings
• Three-fold asset management profit growth to £103 million
-6%
IRR6%
IRR7%
COR97%
COR95%
profit growth to £103 million• Continuing low investment
impairments• Dividend increased to €1.0
Total IFRS operating profit
FY10FY09 FY10FY09
IFRS net assets**£4 3bn
Continued structural improvements
(2009 €0.5) per share
£536m
£399m
£4.3bn
£3.8bn
p• German subsidiary closed to
new business• Programme on track to deliver
cost savings by 2012
13%34%
IFRSIFRS
cost savings by 2012
Longevity reserving increase in line with the Dutch Central Bureau of
14FY10FY09 FY10FY09
Statistics findings
* Excluding German life operation, now closed to new business** 100% of IFRS net assets

Patrick ReganPatrick Regan
Fi i l ltFinancial results
15

Key performance metrics
1. Capital generation and efficiency
2. IFRS operating profits
3 T t l fit3. Total profits
4 The balance sheet4. The balance sheet
5. Return on equity, NAV and IGD5. Return on equity, NAV and IGD
16

Capital generation and efficiencyCapital generation and efficiency
17
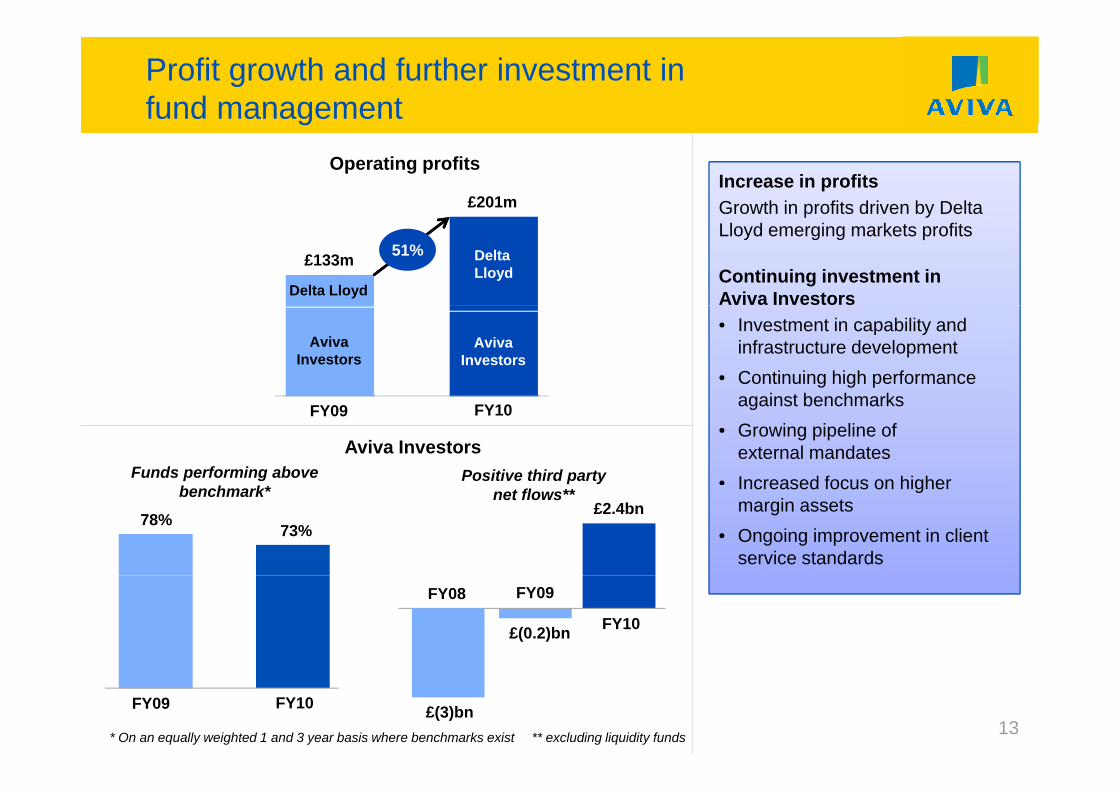
70% increase in net capital generation provides strong dividend cover
2010 vs 20092010 £bn
Operating capital
Generated Usage Net£bn
FY10£2.7bn
g
UK 0.9 0.1 1.0
Europe 0.8 (0.5) 0.3
2.0
FY10£1.0bn
FY10£1 7bn*
FY09£2.5bn
North America 0.6 (0.3) 0.3
Asia Pacific - (0.1) (0.1)£1.7bn
FY09£1.5bn
Delta Lloyd* 0.4 (0.2) 0.2
Total 2.7 (1.0) 1.770%
1.0
FY09
£0.7 billion uplift from 2009 driven by:• £0.2 billion higher gross capital generated
70%
Operating New Underlying
FY09£1.0bn
g g p g• £0.2 billion lower US new business strain• £0.2 billion lower GI capital requirements• £0.1 billion benefit of UK inherited estate
18
Operating capital generated
New business
investment
Underlying capital generated
Capital efficiency IFRS Total
profitsBalance
sheetROE & NAV* Excluding Delta Lloyd longevity reserving of £0.2 billion post tax & MI

Effective use of capital to grow shareholder value
2010 £bn Sales
Capital usage
IRR %
Payback periodyears
Improved life capital efficiency*
£bn Sales usage % years
UK Life 10.3 (0.1) 15 7
Europe Life 13 5 (0 5) 13 7
4.8%
3.8%
Europe Life 13.5 (0.5) 13 7
North America Life 4.7 (0.4) 14 4
Asia Pacific Life 1.6 (0.1) 11 13
Delta Lloyd Life 3.2 (0.1) 7* 16
FY10FY09
Increased future cash flows
Non-life** 13.7 0.2 n/a n/a
Total 47.1 (1.0) 12.5 8£33bn
£36bn
*Delta Lloyd IRR excludes German operations closed to new business**Non-life sales include investment sales and GI & health net written premiums
19* Life capital efficiency (life capital usage over life sales) excluding Delta Lloyd & Australia
Capital efficiency IFRS Total
profitsBalance
sheetROE & NAV
FY10FY09

IFRS operating profitsIFRS operating profits
20

Improved performance flowing through to profit
FY09 FY10
Life GI Life GIIFRS operating profits
3,000
UK 672 535 850 579
Aviva Europe 761 132 893 109
£m
+23% +9% +51%
2,600
Delta Lloyd 277 143 330 146
North America 85 144 174 222
Asia Pacific 92 6 71 (6)2,550
43190
68 (61)
2,200Total Life / GI 1,887 960 2,318 1,050
Fund Management 133 2012,022
1,800
Other, non-insurance (214) (220)
Corporate costs (108) (143)
Group debt costs (562) (569)
1,400FY09 Life GI Fund
MgtGroup &
OtherFY10
p ( ) ( )
Pension costs (74) (87)
Operating profit 2,022 2,550
21Capital
efficiency IFRS Total profits
Balance sheet
ROE & NAV
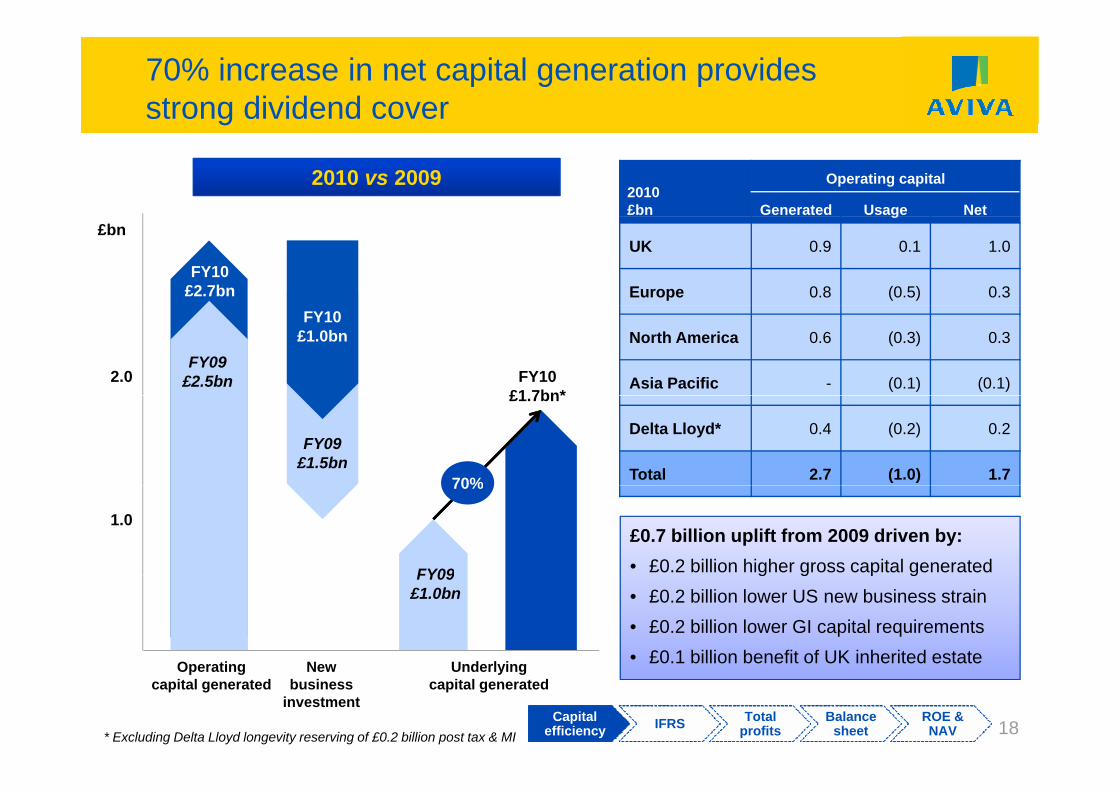
Summary IFRS life profit drivers
DriverKey:£m FY09 FY10
UK 672 850
A i E 761 893
Pre-tax operating profit
FY09 FY10 VarianceAviva Europe 761 893
Delta Lloyd 277 330
North America 85 174
Asia Pacific 92 711,887 2,318 23%
Asia Pacific 92 71
Operating profit 1,887 2,318
Income
4,461 5,128 15%
DAC/AVIF amortisation and other
(221) (366) (66)%
Expenses and commissions
(2,353) (2,444) (4)%
New business income Investment return Acquisition expenses and commissions
Admin expenses and renewal commissions
813 1,021 26%
Underwriting margin
2,865 3,226 13% (945) (1,084) (15)% (1,408) (1,360) 3%
783 881 13%
22Capital
efficiency IFRS Total profits
Balance sheet
ROE & NAV

Life new business income
TotalNew business income
Key: Driver
New business income
813 1,021 26%
• Growth in annuities
FY09 FY10 Variance
UKNew business income
402 499 24%
APE 1,143 1,310 15%
Margin 35% 38% 3ppt
• Growth in annuities, protection and group personal pension sales
• Benefit of business mix on margin
Aviva EuropeNew business income APE 1,554 1,544 (1)%
on margin
• Focus on profit over volume
310 382 23% Margin 20% 25% 5pptreflected by increase in margin
A i th ff t b lROW*New business income
101 140 39%
APE 1,049 1,089 4%
Margin 10% 13% 3ppt
• Asian growth offset by lower sales in Delta Lloyd
• Margin reflects pricing action in US and Asia
23Capital
efficiency IFRS Total profits
Balance sheet
ROE & NAV* 2009 excludes Australia which was sold in October 2009
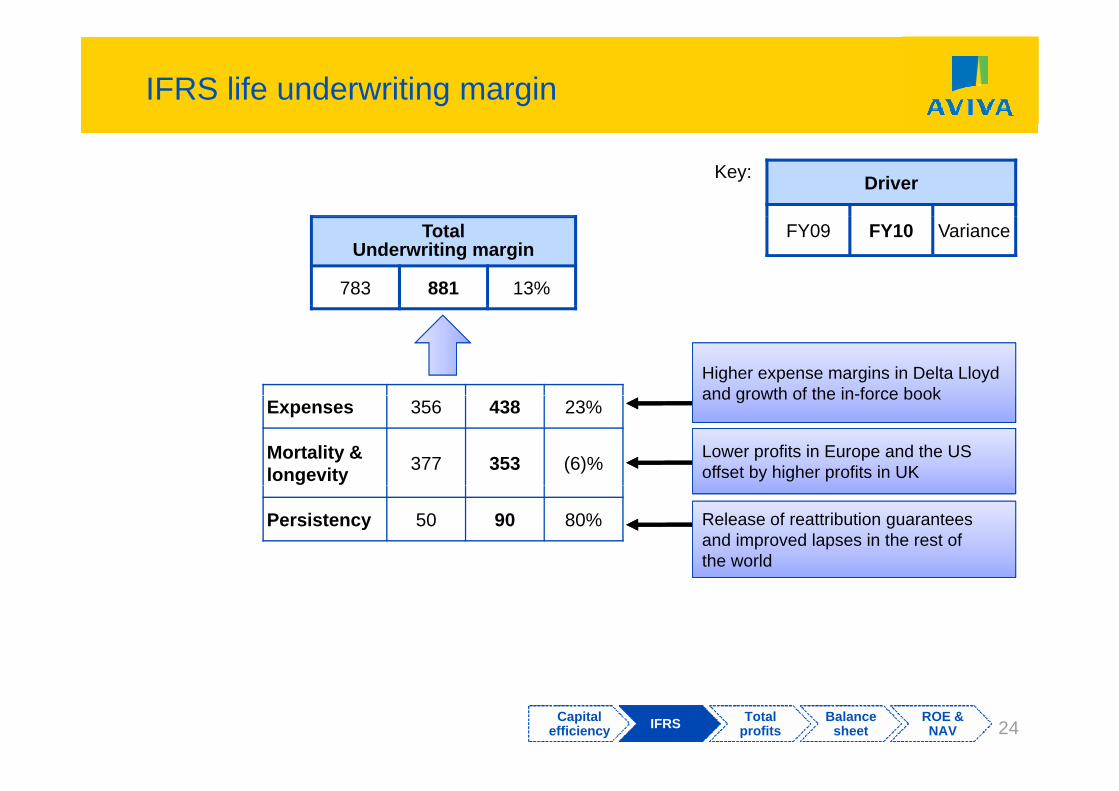
IFRS life underwriting margin
DriverKey:
TotalUnderwriting margin
783 881 13%
FY09 FY10 Variance
Higher expense margins in Delta Lloyd and growth of the in-force book
Expenses 356 438 23%
Mortality & longevity 377 353 (6)%
and growth of the in-force book
Lower profits in Europe and the US offset by higher profits in UK
Persistency 50 90 80% Release of reattribution guarantees and improved lapses in the rest of the world
24Capital
efficiency IFRS Total profits
Balance sheet
ROE & NAV

Total IFRS life investment return
Investment return
DriverKey:
Investment return
2,865 3,226 13%FY09 FY10 Variance
Unit linked margin Participating business Spread margin Expected return on shareholder assets
938 999 7% 660 682 3% 676 890 32% 591 655 11%
AMC (bps) 111 108 (3) Bonus
(bps) 59 60 1 Spread(bps) 94 114 20 Equity 7.3% 7.2% (0.1)
ppt(bps)
Average reserves (£bn)
84.5 92.7 10%
(bps)
Average reserves(£bn)
111.0 114.2 3%
(bps)
Average reserves(£bn)
72.2 77.7 8%
ppt
Property 5.8% 5.7% (0.1)ppt
Bonds 4 9% 4 7% (0.2)Bonds 4.9% 4.7% pptImproved market conditions across all businesses
Growth in French AFER bonuses offset by lower UK with profit bonuses
Pricing actions in the US business
25Capital
efficiency IFRS Total profits
Balance sheet
ROE & NAV

Life expenses
DriverKey:
Acquisition expenses and commissions
Admin expenses and renewal commissions
FY09 FY10 Variance
and commissions
(945) (1,084) (15)%
renewal commissions
(1,408) (1,360) 3%
Acquisitionexpense ratio
25% 27% (2)pptExisting expense ratio (bps) 53 48 5
ratio
APE (£m) 3,746 3,943 5%Average reserves (£bn) 267.7 284.6 6%
G th i l d hi h G i i f b k d tGrowth in sales and higher initial commissions in Italy
Growing in-force book and cost savings in UK and Delta Lloyd
26Capital
efficiency IFRS Total profits
Balance sheet
ROE & NAV

GI & Health profit drivers
Pre-tax operating profit DriverKey:
960 1,050 9% FY09 FY10 Variance
GI Underwriting result Expected investment return
Health underwriting result
74 232 214% 875 846 (3)%30 31 3%
Average rate 4.6% 4.6% -Net written premiums 8,492 8,920 5% e age ate 6% 6%
Average assets £bn 19.1 18.5 (3)%
premiums
Claimsratio 66.7% 64.5% 2.2ppt
Commission ti 19.8% 19.9% (0.1)pptratio 19.8% 19.9% (0.1)ppt
Expense ratio 12.6% 12.4% 0.2ppt
COR 99% 97% 2.3ppt
27Note: Operating profit includes £(59)m resulting from unwind of discount and pension scheme finance costs (FY09: £(19)m)
Capital efficiency IFRS Total
profitsBalance
sheetROE & NAV
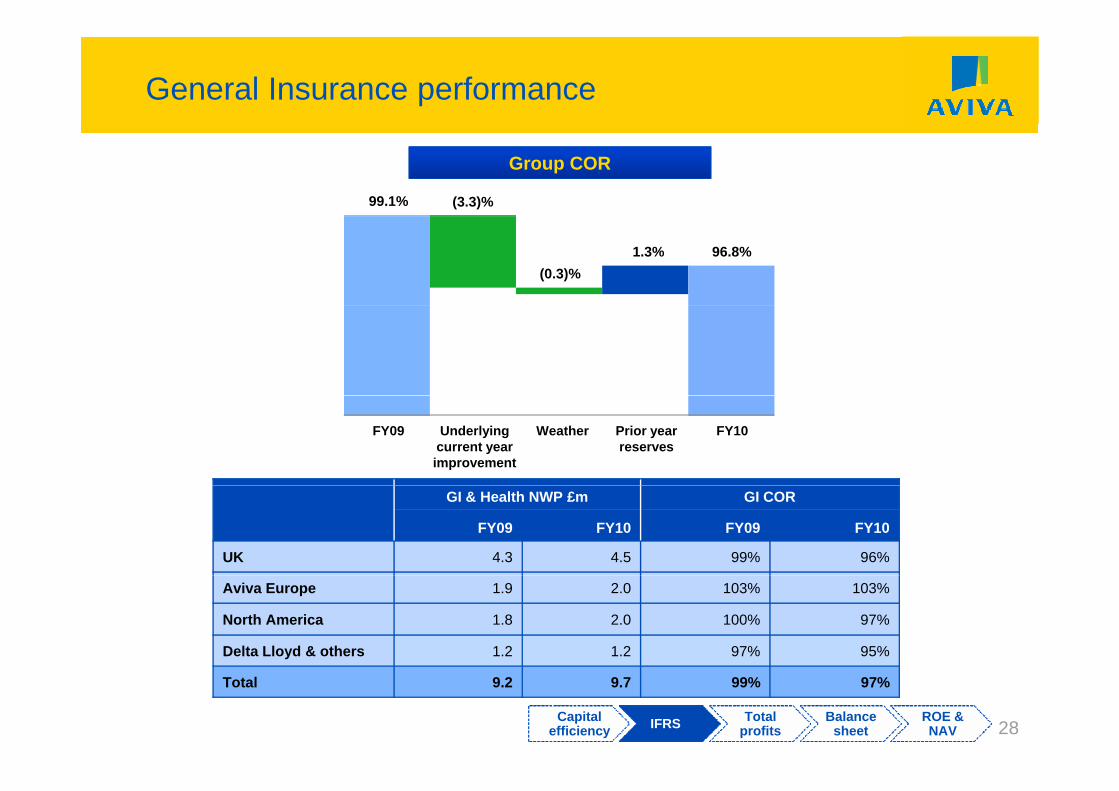
General Insurance performance
Group COR
99.1% (3.3)%
1.3% 96.8%(0.3)%
FY09 Underlying current year improvement
Prior year reserves
FY10Weather
GI & Health NWP £m GI COR
FY09 FY10 FY09 FY10
UK 4.3 4.5 99% 96%
Aviva Europe 1.9 2.0 103% 103%
North America 1.8 2.0 100% 97%
Delta Lloyd & others 1.2 1.2 97% 95%
28
Total 9.2 9.7 99% 97%
Capital efficiency IFRS Total
profitsBalance
sheetROE & NAV

Fund management
£m FY09 FY10
Aviva Investors 115 97
DriverKey:
Pre-tax operating profit
Aviva Investors 115 97
Delta Lloyd 28 103
Other (10) 1
FY09 FY10 Variance
133 201 51%Fund Management 133 201
Total income
731 803 10%
Operating expenses
(598) (602) (1)%
Averagefees (bps)
17.4 18.6 1.4
Average assets £bn
289 315 9%
29Capital
efficiency IFRS Total profits
Balance sheet
ROE & NAV

MCEV performance
PVNBP£33.4bn
£32.0bn
New business margin
4%2.4%
1.9%
4%
FY10FY09 FY10FY09
MCEV NAV
FY10FY09 FY10FY09
Total MCEVoperating profit
£3 760542p
£3,592m
£3,760m473p
5%
69p
3030
FY10FY09 FY10FY09Capital
efficiency MCEV Total profits
Balance sheet
ROE & NAV
Total profitsTotal profits
31

IFRS profit after tax
FY09£m
FY10£m
Integration and restructuring costs
Operating profit 2,022 2,550
Integration & restructuring costs (286) (243)
Other exceptional items 45 (273)
g• Regional restructuring and
Solvency II
P fit di lp ( )
Investment variances & assumption changes 77 487
Profit on disposals 153 159
Profit on disposals• RBS bancassurance joint venture
profit of £128 million • Non core disposals in France
Goodwill and intangibles amortisation (206) (240)
Profit before tax 1,805 2,440
Tax (490) (548)
• Non-core disposals in France and UK
Minority interest & DCI (291) (488)
Total return 1,024 1,404
Earnings per share 37.8p 50.4p
Total dividend per share increase by 6% to 25.5p (2009: 24p)
* Earnings per share - stated after tax, minority interest, preference dividend and DCI 32
Capital efficiency IFRS Total
profitsBalance
sheetROE & NAV
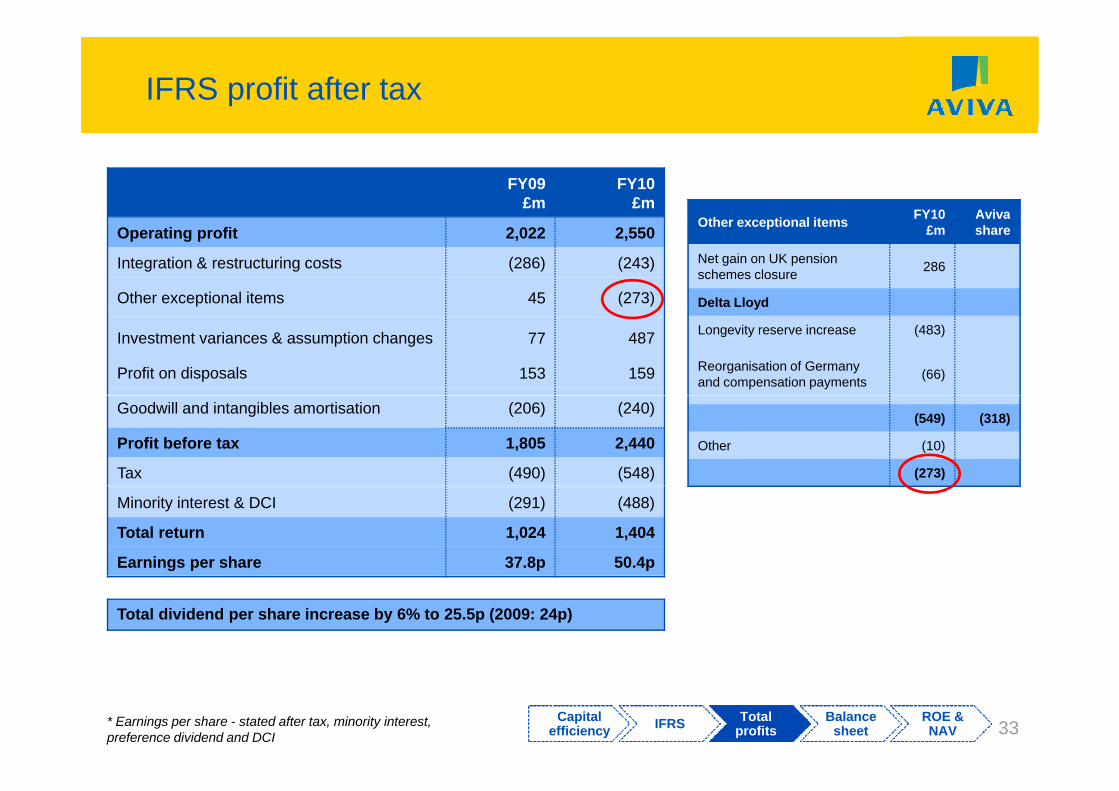
IFRS profit after tax
FY09£m
FY10£m
FY10 AvivaOperating profit 2,022 2,550
Integration & restructuring costs (286) (243)
Other exceptional items 45 (273)
Other exceptional items FY10£m
Avivashare
Net gain on UK pensionschemes closure 286
Delta Lloydp ( )
Investment variances & assumption changes 77 487
Profit on disposals 153 159
Delta Lloyd
Longevity reserve increase (483)
Reorganisation of Germany and compensation payments (66)
Goodwill and intangibles amortisation (206) (240)
Profit before tax 1,805 2,440
Tax (490) (548)
(549) (318)
Other (10)
(273)
Minority interest & DCI (291) (488)
Total return 1,024 1,404
Earnings per share 37.8p 50.4p
Total dividend per share increase by 6% to 25.5p (2009: 24p)
33Capital
efficiency IFRS Total profits
Balance sheet
ROE & NAV
* Earnings per share - stated after tax, minority interest, preference dividend and DCI

IFRS profit after tax
FY09£m
FY10£m
Investment variances and FY10 AvivaOperating profit 2,022 2,550
Integration & restructuring costs (286) (243)
Other exceptional items 45 (273)
Investment variances and assumption changes
FY10£m
Avivashare
Asset and liability curve movements 800
p ( )
Investment variances & assumption changes 77 487
Profit on disposals 153 159
Other investment variances 210
Delta Lloyd life investment variances 1,010 586
Other life investment variancesGoodwill and intangibles amortisation (206) (240)
Profit before tax 1,805 2,440
Tax (490) (548)
Other life investment variances and assumption changes (219)
GI short-term fluctuations and economic variances (304)
487Minority interest & DCI (291) (488)
Total return 1,024 1,404
Earnings per share 37.8p 50.4p
487
Total dividend per share increase by 6% to 25.5p (2009: 24p)
34Capital
efficiency IFRS Total profits
Balance sheet
ROE & NAV
* Earnings per share - stated after tax, minority interest, preference dividend and DCI

The balance sheetThe balance sheet
35
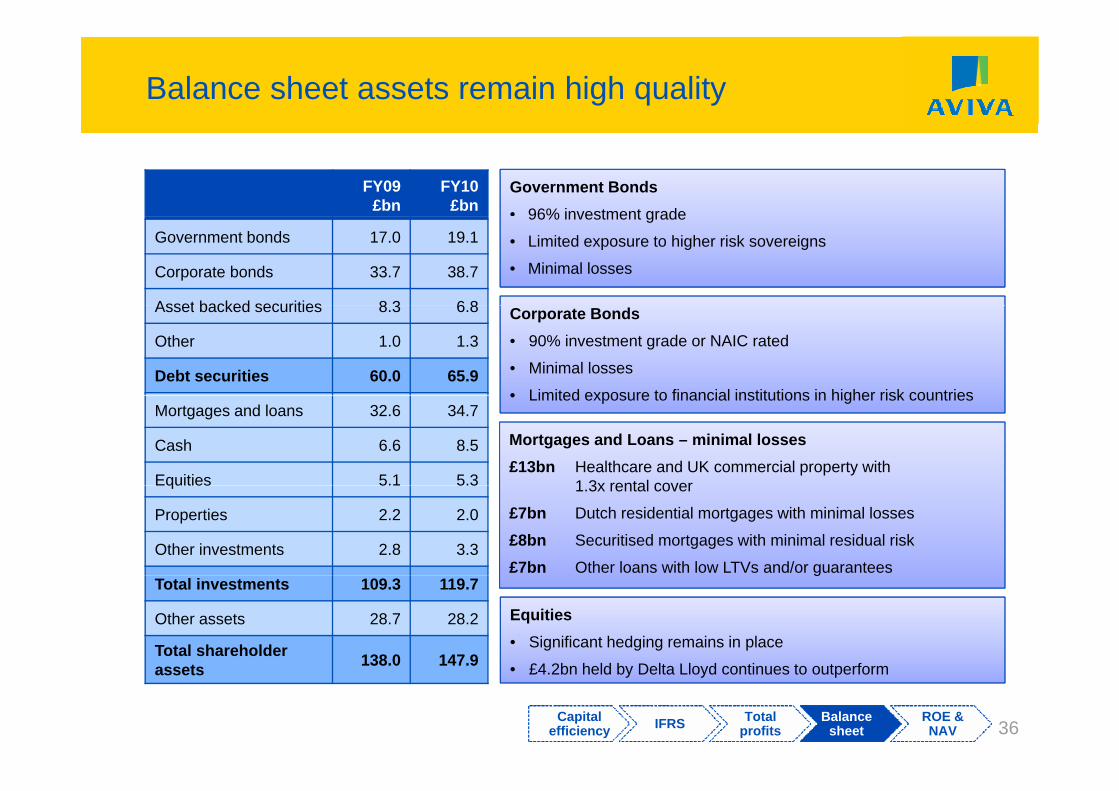
Balance sheet assets remain high quality
Government Bonds• 96% investment grade
FY09£bn
FY10£bn 96% investment grade
• Limited exposure to higher risk sovereigns
• Minimal losses
Government bonds 17.0 19.1
Corporate bonds 33.7 38.7
Asset backed securities 8 3 6 8 Corporate Bonds• 90% investment grade or NAIC rated
• Minimal losses
• Limited exposure to financial institutions in higher risk countries
Asset backed securities 8.3 6.8
Other 1.0 1.3
Debt securities 60.0 65.9• Limited exposure to financial institutions in higher risk countries
Mortgages and Loans – minimal losses£13bn Healthcare and UK commercial property with
1 3x rental cover
Mortgages and loans 32.6 34.7
Cash 6.6 8.5
Equities 5.1 5.3 1.3x rental cover
£7bn Dutch residential mortgages with minimal losses
£8bn Securitised mortgages with minimal residual risk
£7bn Other loans with low LTVs and/or guarantees
Equities 5.1 5.3
Properties 2.2 2.0
Other investments 2.8 3.3g
Equities• Significant hedging remains in place
£4 2b h ld b D lt Ll d ti t t f
Total investments 109.3 119.7
Other assets 28.7 28.2
Total shareholder t 138.0 147.9
36Capital
efficiency IFRS Total profits
Balance sheet
ROE & NAV
• £4.2bn held by Delta Lloyd continues to outperformassets 138.0 147.9

Continuing low levels of losses
UK Corporate bonds Aviva USA
60bps 40bps
116bps
31bps
2009 2010
10bps< 5bps
2008 2009 20102008
Delta Lloyd mortgage portfolioUK mortgage portfolio
36bps*38bps
1bp 1bp 1bp 2bps
2007 2008 2009 20102009 2010
Nil
36bps
2008
p
37Capital
efficiency IFRS Total profits
Balance sheet
ROE & NAV
* 36bps = £57 million loss

Aviva’s pension schemes
Actions Result (£bn)
2.5
Actions Result (£bn)
icit
(£bn
)
0 3 0 6
• Aviva and RAC schemes closed reducing liabilities
1.5
21.7
ntin
g ba
sis
defi 0.3 0.6
0.3
g• Aviva scheme:
– Long-term funding agreement in place– £378 million deficit funding payment
1
chem
e ac
coun 0.4
0.20.5
g p yin 2010
• Updated mortality assumptions favourable in the UK with offset in DLO i f th ALM i t d
0
0.5
ZeroP
ensi
on s
c 0 5• Ongoing further ALM improvements and volatility mitigation strategies underway-covering longevity, equity, interest rate, inflation and credit exposure
38Capital
efficiency IFRS Total profits
Balance sheet
ROE & NAV

IGD, ROE & NAVIGD, ROE & NAV
39

Significant improvement in NAV
374p
454p
80p
IFRS
IFRSPence per share IFRS MCEV
NAV at year end 2009 374p 473p
P fit d i t t i 68 62
621pFY09 FY10
Profit and investment variances 68p 62p
Dividends (net of scrip) and newshares issued (26)p (26)p
542p
69p
Pension scheme revaluation 37p 37p
Foreign exchange and other movements 1p (4)p
EEV
MCEV
473p
MCEV
69pNAV at year end 2010 454p 542p
IGD Solvency £3 8bn (HY10: £3 8bn) MCEV
FY09 FY10 FY10
IGD Solvency £3.8bn (HY10: £3.8bn)
40
FY09 FY10 FY10
Capital efficiency IFRS Total
profitsBalance
sheetROE & NAV

Growing return on equity
15.8%14.8%
16%
12.0%10 9%
14.8%
12%
8.5%
10.9%10.2%
8%
4%
0%0%
Life GI Group
FY09 FY10
41Group IFRS return on equity stated after tax, minority interest, preference dividend and DCI over opening shareholders’ funds
Capital efficiency IFRS Total
profitsBalance
sheetROE & NAV

Andrew MossAndrew Moss
L ki h dLooking ahead
42

Looking ahead: a clear direction
Strategic portfolio
Increasing focus and depth in 12 • Progress on portfolio changes in 2011p
changes countries
• UK: Continued market leadership with profitable
g g
Operational ll
Excelling in Life, General Insurance
& Asset Management
UK: Continued market leadership with profitable sales growth
• Europe: Rigorous focus on delivery & execution
N th A i P fit th & it l lf ffi iexcellenceDriving out
composite value from the business
• North America: Profit growth & capital self sufficiency
• Asia Pacific: Strong value growth
• Aviva Investors: Increasing external AUM
• At least £1.5 billion operational capital generation in 2011
g
Short term goals
Demonstrating financial discipline through a range of short term targets
• Life IRR of at least 12% with payback of 10 years or less
• 2011 general insurance COR to be 97% or better
43
• £400 million cost savings & efficiency gains by end 2012

Strong results pave the way for further growth
Strong performance• IFRS operating profit up 26% to £2,550 million
• Increased net operational capital generation by 70% to £1.7 billion
• IFRS NAV per share up by 21% to 454p
Profitable growth in both life and general insurance• 23% increase in life operating profit to £2,318 million with new business IRR of 12.5%
• 9% increase in GI operating profit to £1,050 million with a COR of 96.8%
P iti tl k ll t l tf f ti d thPositive outlook, an excellent platform for continued growth• Focussed on markets where we have strength and scale
• A stronger and larger balance sheet
• £23 billion increase in funds under management to £402 billion
• Pension deficit reduced to zero
Sh h ld it di i i l l• Shareholder equity exceeding pre crisis level
44

Q&AQ&A
45