Aviva: CMD presentation 2017 · Cash flow plus growth ... This should be read in conjunction with...
40
Cash flow plus growth…Upgraded Capital Markets Day 2017 Aviva plc
Transcript of Aviva: CMD presentation 2017 · Cash flow plus growth ... This should be read in conjunction with...

Cash flow plus growth…Upgraded Capital Markets Day 2017
Aviva plc

2
Disclaimer Cautionary statements: This should be read in conjunction with the documents distributed by Aviva plc (the “Company” or “Aviva”) through The Regulatory News Service (RNS). This presentation contains, and we may make other verbal or written “forward-looking statements” with respect to certain of Aviva’s plans and current goals and expectations relating to future financial condition, performance, results, strategic initiatives and objectives. Statements containing the words “believes”, “intends”, “expects”, “projects”, “plans”, “will,” “seeks”, “aims”, “may”, “could”, “outlook”, “likely”, “target”, “goal”, “guidance”, “trends”, “future”, “estimates”, “potential” and “anticipates”, and words of similar meaning, are forward-looking. By their nature, all forward-looking statements involve risk and uncertainty. Accordingly, there are or will be important factors that could cause actual results to differ materially from those indicated in these statements. Aviva believes factors that could cause actual results to differ materially from those indicated in forward-looking statements in the presentation include, but are not limited to: the impact of ongoing difficult conditions in the global financial markets and the economy generally; the impact of simplifying our operating structure and activities; the impact of various local and international political, regulatory and economic conditions; market developments and government actions (including those arising from the referendum on UK membership of the European Union); the effect of credit spread volatility on the net unrealised value of the investment portfolio; the effect of losses due to defaults by counterparties, including potential sovereign debt defaults or restructurings, on the value of our investments; changes in interest rates that may cause policyholders to surrender their contracts, reduce the value of our portfolio and impact our asset and liability matching; the impact of changes in short or long term inflation; the impact of changes in equity or property prices on our investment portfolio; fluctuations in currency exchange rates; the effect of market fluctuations on the value of options and guarantees embedded in some of our life insurance products and the value of the assets backing their reserves; the amount of allowances and impairments taken on our investments; the effect of adverse capital and credit market conditions on our ability to meet liquidity needs and our access to capital; changes in, or restrictions on, our ability to initiate capital management initiatives; changes in or inaccuracy of assumptions in pricing and reserving for insurance business (particularly with regard to mortality and morbidity trends, lapse rates and policy renewal rates), longevity and endowments; a cyclical downturn of the insurance industry; the impact of natural and man-made catastrophic events on our business activities and results of operations; our reliance on information and technology and third-party service providers for our operations and systems; the inability of reinsurers to meet obligations or unavailability of reinsurance coverage; increased competition in the UK and in other countries where we have significant operations; regulatory approval of extension of use of the Group’s internal model for calculation of regulatory capital under the European Union’s Solvency II rules; the impact of actual experience differing from estimates used in valuing and amortising deferred acquisition costs (“DAC”) and acquired value of in-force business (“AVIF”); the impact of recognising an impairment of our goodwill or intangibles with indefinite lives; changes in valuation methodologies, estimates and assumptions used in the valuation of investment securities; the effect of legal proceedings and regulatory investigations; the impact of operational risks, including inadequate or failed internal and external processes, systems and human error or from external events (including cyber attack); risks associated with arrangements with third parties, including joint ventures; our reliance on third-party distribution channels to deliver our products; funding risks associated with our participation in defined benefit staff pension schemes; the failure to attract or retain the necessary key personnel; the effect of systems errors or regulatory changes on the calculation of unit prices or deduction of charges for our unit-linked products that may require retrospective compensation to our customers; the effect of fluctuations in share price as a result of general market conditions or otherwise; the effect of simplifying our operating structure and activities; the effect of a decline in any of our ratings by rating agencies on our standing among customers, broker-dealers, agents, wholesalers and other distributors of our products and services; changes to our brand and reputation; changes in government regulations or tax laws in jurisdictions where we conduct business, including decreased demand for annuities in the UK due to proposed changes in UK law; the inability to protect our intellectual property; the effect of undisclosed liabilities, integration issues and other risks associated with our acquisitions; and the timing/regulatory approval impact, integration risk, and other uncertainties, such as non-realisation of expected benefits or diversion of management attention and other resources, relating to announced acquisitions and pending disposals and relating to future acquisitions, combinations or disposals within relevant industries; the policies, decisions and actions of government or regulatory authorities in the UK, the EU, the US or elsewhere, including the implementation of key legislation and regulation. For a more detailed description of these risks, uncertainties and other factors, please see ‘Other information – Shareholder Information – Risks relating to our business’ in Aviva’s most recent Annual Report. Aviva undertakes no obligation to update the forward looking statements in this presentation or any other forward-looking statements we may make. Forward-looking statements in this presentation are current only as of the date on which such statements are made.

3
Mark Wilson Aviva plc
Group Chief Executive Officer

4
Cash flow plus growth…Upgraded
Deploy surplus,
increase dividends
Leading franchises
Disposals complete
Quality and focus
Underlying growth
Growing share
Composite delivering
Better earnings quality
De-leveraging
Bolt-on M&A
Capital returns
Capital Growth
Leading IP
Partner of choice
Enhanced efficiency
Digital
5
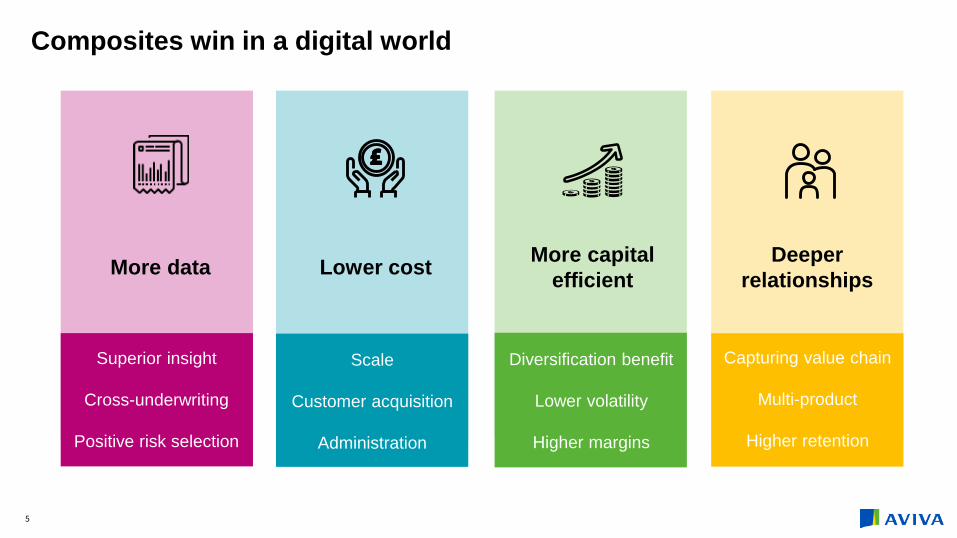
Composites win in a digital world
Deploy surplus,
increase dividends
More data Deeper relationships Lower cost
More capital efficient
Superior insight
Cross-underwriting
Positive risk selection
Scale
Customer acquisition
Administration
Diversification benefit
Lower volatility
Higher margins
Capturing value chain
Multi-product
Higher retention

6
Quality oaks
France Cash generator underpinned by
strong distribution
Canada Leading general insurance franchise
with high ROE
UK #1 composite providing a core
growth engine and high levels of sustainable cash flow
Ireland A leading brand in a growth economy with accelerated development of the
composite model
Poland High ROE business with strong
distribution and digital credentials
Singapore Accelerating development of the financial advisor channel in an
attractive growth market
Aviva Investors A strong growth engine underpinned by increasing third party assets and
positive cost-income jaws
“We are focused on 8 attractive, growing markets where we are, or have the potential to be best in class. It is these businesses that will underpin cash flow plus growth”
Italy
Rebounding economic opportunity providing strong net flows

7
High potential acorns
Digital Leading IP being rolled out across our markets, with scope for further
commercialisation
Hong Kong Joint venture with Tencent and
Hillhouse focused on digital disruption
Turkey Leading position in the life and
pension market and exposure to a large, young and growing population
India Reassessing options given changes
in market fundamentals
Indonesia Bancassurance venture in an underpenetrated, high growth
emerging market
Corporate & Specialty Selective expansion provides a natural
extension to our existing strength in retail and commercial lines
Vietnam Leading business in one of the
fastest growing Asian economies
China Delivering strong growth in sales and operating profit in one of the world’s
largest insurance markets
“We have made a number of strategic bets that will accelerate growth and provide increased value over the long term”

8
Building track record of outperformance in the UK
Long-term savings
Annuities and Equity Release
Protection
General insurance
Track record Growth drivers Performance*
• 39% year on year growth*: workplace pensions leader
• Advisor platform: 10% share of net flows
• 26% year on year growth*
• Mid-20% market share in individual annuities & equity release
• Only 5% share of BPA
• Strong double digit growth*
• c20% share in individual and group protection
• Leading distribution
• NWP: high single digit growth
• Digital direct NWP: double digit growth
• Reported COR: 93-95%***
• Auto-enrolment
• DB to DC
• Grow platform share
• Savings assets: 11% CAGR
• DB de-risking: £1.3tr market
• Increased BPA appetite
• Asset optimisation £14bn
• Modest growth segment
• TCC opportunity
• Expense and pricing discipline
• Digital direct
• Partnerships
*Operating profit before tax (£m) **restated for the internal loan ***excluding the impact of Ogden
102
142FY16
FY15
519
656
FY15
FY16
159
242FY16
FY15
322
392
FY15
FY16
246
309
HY16
HY17
114
133
HY16
HY17
190
213HY17
HY16
64
89
HY16
HY17
** **

Consistently delivering growth outside the UK
International Life
Track record Growth drivers Performance*
International GI
Asia
Aviva Investors
• France: 47% UL & Protection • Poland: #2 with attractive returns • Italy: €2bn+ net inflows p.a. • Ireland: #4 Life (pre Friends First) • Turkey: doubled operating profit (HY17)
NWP
VNB
*All numbers in £m **Restated for DBS ***FY15 & FY16 on MCEV basis with HY16 & HY17 on adjusted SII basis
• Canada: #2 with 11% market share
• France: Eurofil #2 direct GI player
• Ireland: market leader (15% share)
• Consistently attractive CORs
• Attractive mix: 51% protection
• Singapore: >500-strong FA network
• China: VNB x2 at HY17
• Operating profit: 45% growth at HY17
• AIMS: AUM x3 at HY17 (vs. FY15)
• HY17 operating margin: 26% (+6pp)
• HY17 external revenues: 35% total (+5pp)
• Diverse distribution • Product development (e.g. hybrids) • Pensions reforms • Attractive demographics • Friends First
• Partnerships
• Digital disruption
• Channel diversification
• Hardening market
• Disruptive strategies
• Partnerships (Tencent, Astra & VietinBank)
• Increased 3rd party AuM
• Product diversification
• Positive cost-income jaws
416
504FY16
FY15
FY16 4,269
FY15 3,474
148FY16
FY15 123**
105
139FY16
FY15
193
246HY17
HY16
HY17 2,577
HY16 1,985
43
71HY17
HY16
49
71HY17
HY16 Op profit
VNB***
9
10
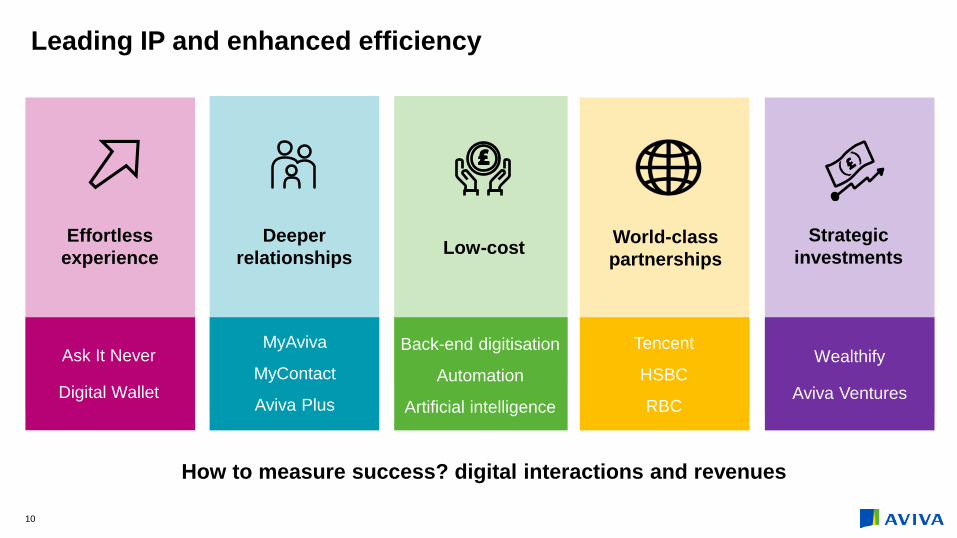
Effortless experience
World-class partnerships
Deeper relationships
Tencent
HSBC
RBC
Wealthify
Aviva Ventures
Low-cost
MyAviva
MyContact
Aviva Plus
Back-end digitisation
Automation
Artificial intelligence
How to measure success? digital interactions and revenues
Leading IP and enhanced efficiency
Ask It Never
Digital Wallet
Strategic investments
11
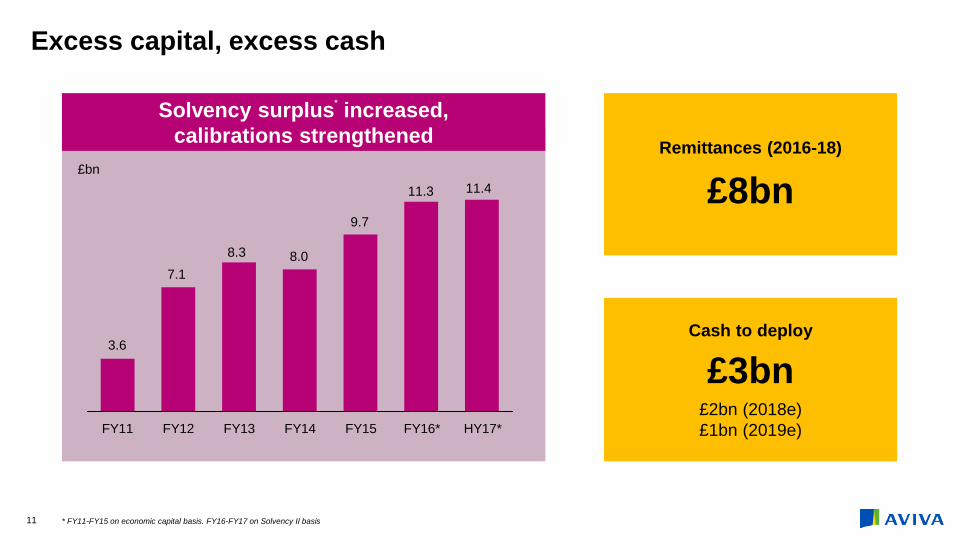
Excess capital, excess cash
Solvency surplus* increased, calibrations strengthened
FY11 FY12 FY13 FY14 FY15 FY16* HY17*
3.6
7.1
8.3 8.0
9.7
11.3 11.4 £bn
Remittances (2016-18)
£8bn
Cash to deploy
£3bn £2bn (2018e) £1bn (2019e)
* FY11-FY15 on economic capital basis. FY16-FY17 on Solvency II basis
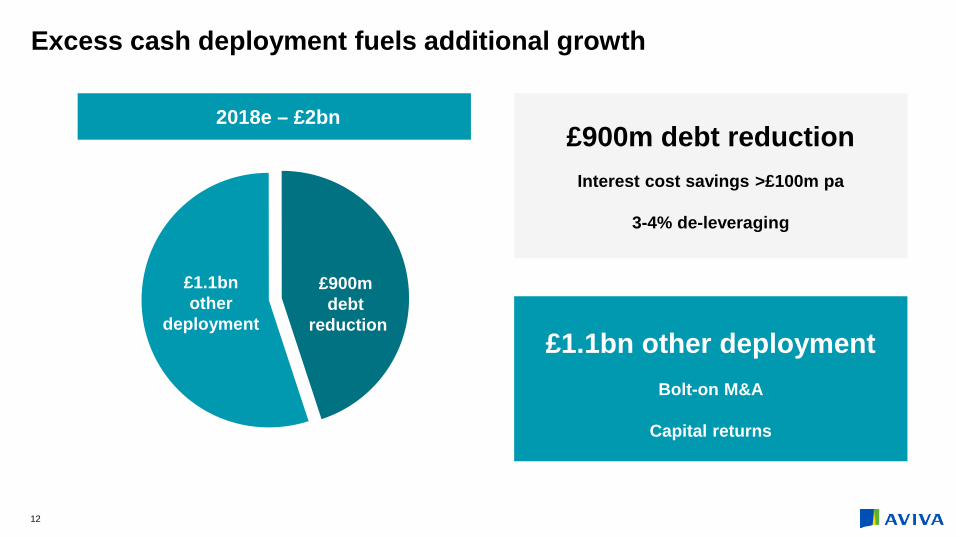
Excess cash deployment fuels additional growth
£900m debt reduction
Interest cost savings >£100m pa
3-4% de-leveraging
£900m debt
reduction
£1.1bn other
deployment
2018e – £2bn
£1.1bn other deployment
Bolt-on M&A
Capital returns
12
13
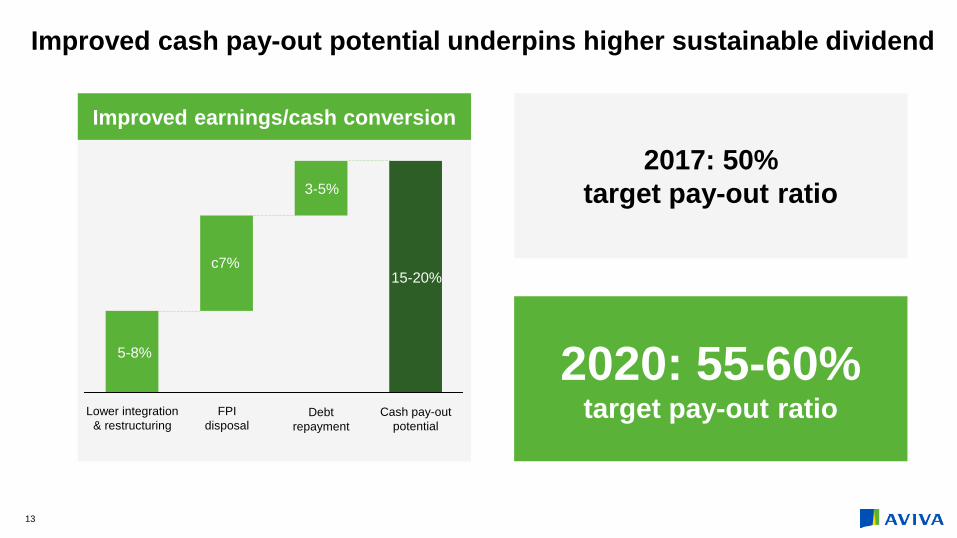
Improved cash pay-out potential underpins higher sustainable dividend
Improved earnings/cash conversion
FPI disposal
Cash pay-out potential
Debt repayment
Lower integration & restructuring
15-20%
3-5%
2017: 50% target pay-out ratio
2020: 55-60% target pay-out ratio
5-8%
c7%

14
Cash flow plus growth…Upgraded
Operating EPS Cash Dividend
Mid-single digit growth in the medium term
Aiming higher
£7bn cash remittances 2016-18 inclusive
£8bn
pay-out ratio target 50% (2017)
55-60% (2020)

15
Tom Stoddard Aviva plc
Chief Financial Officer

Sustainable
Consistent growth
Maintain strength
Accretive deployment
Earnings Capital & Liquidity Dividend
Our financial priorities
Improving quality
Increased ambition
16
Diversified portfolio
Cash flow plus growth…Upgraded
42%
By geography
58%
UK
Canada
Italy
Singapore
Digital
Hong Kong
Indonesia
Vietnam
France
Poland
Ireland
Aviva Investors
China
Turkey
India
Corporate & Specialty
Winning positions
Control over destiny
TCC / Digital First
Consistent cash plus growth
%FY16 market operating profit (adjusted for disposals*)
5%
70%
25%
By segment
UKI
Non UK
Life
FM
GI
Disruptive strategies
First-class JV partners
Digital / Distribution expertise
Accelerated growth options
*FPI, majority of Spain, Antarius & Banco BPM 17

Cash flow plus growth: UK Insurance
Leveraging growing UK pension pools
Longevity
Outperforming on Capital / Cash
• Asset optimisation towards illiquids
• Prudent risk management: hedging & reinsurance
• Part Vlls completed: capital & cash upsides expected
£4-4.5bn cash expected vs. £3.5-4bn target 2016-18
• BPA opportunities from DB de-risking - Market leader on small BPA deals (<£300m)
- Superior skill set to be major player across whole market (£600m Pearson win)
• Fast-growing long-term savings profit pool driven by workplace & platform
#1 Composite*
• Double digit growth** across all core segments
• Single operating model
• Building track record for exceeding targets
• Prudent reserving policy, reflecting customer base’s profile
• Material slowdown in mortality improvements experienced over last 4Y with CMI16 further reflecting this
Upside potential while maintaining prudence
#1 ind. Annuities #2 equity release
#1 GI #2 protection
#1 workplace #4 platform (net flows)
*Rankings at end 2016 based on Aviva’s analysis of data from company reporting, Fundscape, AON and GlobalData. **Operating profit 18

Cash flow plus growth: France
*Operating profit ** Fonds de Retraite Professionnelle Supplémentaire
Transformed strategy
Interest rates
Optimise capital & cash
• DVA application in progress in France
• French supplementary pension funds (FRPS**) in 2018 to enable better risk management
Potential benefits to local capital Supports dividend-paying capacity to Group
• Asset returns comfortably above average guarantees
• Downwards trends in both crediting & guarantee rates
• Further optimise product mix
• On-going management
• Single brand; 4 customer propositions
• Maintain focus on risk products
• Offer attractive & alternative savings products
• Disciplined digitalisation across all channels
#2 contributor to Group*
• Leadership in 5 distribution channels
• Composite: Life, GI & Aviva Investors
• New management making impact
• Sale of Antarius for 16.4x net earnings in 2017
19

Operating EPS
Growth ambition >5% p.a. 2019 onward
44.2p49.0p 49.7p 51.1p
25.8p
FY20 FY19 FY18 FY17 FY16 FY15 FY14 FY13
Perimeter changes: FPI, Spain, Antarius & Banco BPM
Canada in 2017
Change spend (IFRS17, IT etc.)
- -
Organic growth in major markets
Investment optimisation & backbook actions
Capital returns
FX in 2017
New partnerships & acquisitions: HSBC UK, Ireland, Tencent, Wealthify
+ +
+ +
+
-
Headwinds
Tailwinds
perimeter changes from 2016 onwards
2013-16 CAGR +5%
Not to scale
20
21
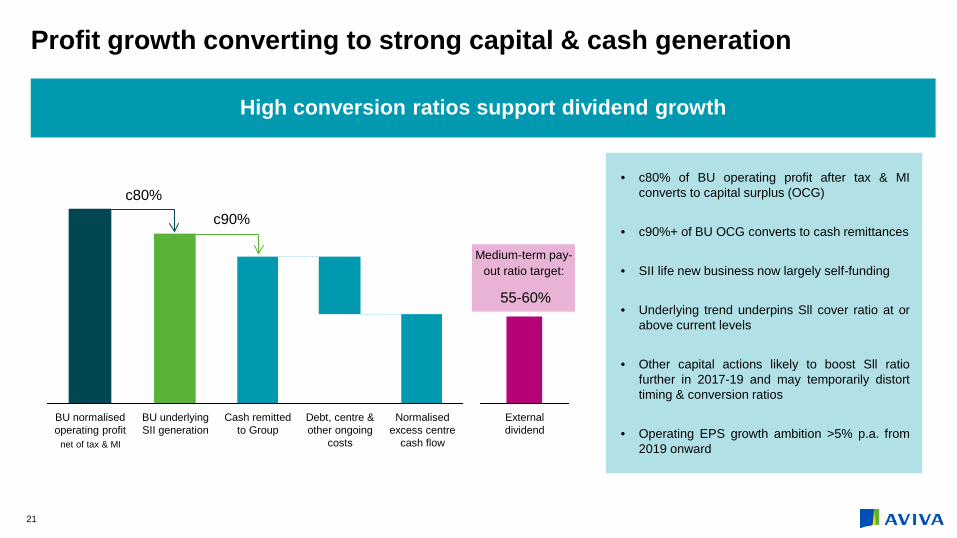
Profit growth converting to strong capital & cash generation
High conversion ratios support dividend growth
net of tax & MI
BU underlying SII generation
BU normalised operating profit
Debt, centre & other ongoing
costs
Cash remitted to Group
Normalised excess centre
cash flow
External dividend
c80% c90%
Medium-term pay-out ratio target:
• c80% of BU operating profit after tax & MI converts to capital surplus (OCG)
• c90%+ of BU OCG converts to cash remittances
• SII life new business now largely self-funding
• Underlying trend underpins Sll cover ratio at or above current levels
• Other capital actions likely to boost Sll ratio further in 2017-19 and may temporarily distort timing & conversion ratios
• Operating EPS growth ambition >5% p.a. from 2019 onward
55-60%
22
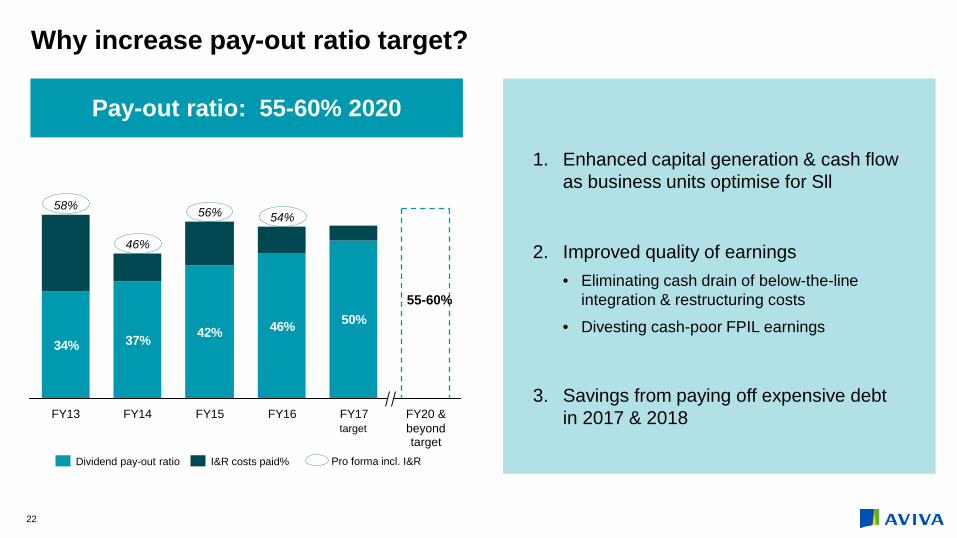
Why increase pay-out ratio target?
34% 37% 42% 46% 50%
FY16
54%
FY14
58% 56%
FY13 FY15
46%
FY17 FY20 & beyond
55-60%
Pay-out ratio: 55-60% 2020
Dividend pay-out ratio I&R costs paid% Pro forma incl. I&R
1. Enhanced capital generation & cash flow as business units optimise for Sll
2. Improved quality of earnings • Eliminating cash drain of below-the-line
integration & restructuring costs
• Divesting cash-poor FPIL earnings
3. Savings from paying off expensive debt in 2017 & 2018
target target

23
SII cover ratio
Strengthened capital position and upgraded ratings
FY16 FY15 HY17
180%
189% 193%
150%
180%
£300m $650m
2017 share buy-back complete
8.25% RT1 notes redeemed
Moody’s Aa3 Stable
Fitch AA- Stable
S&P A+ Stable
AM Best A Stable
Shareholder basis

24
Capital resilient to stress
193%
181%
192%
190%
181%
HY17 SII cover ratio
Interest rates -50bps
Corporate spreads +100bps
Equities -25%
Longevity shock: 5% fall in mortality rates (annuities)
Rating downgrade on annuity portfolio bonds 189%
179%
184%
152%
2011 financial crisis*
2008 financial crisis*
150% 180%
• Well capitalised
• Tightly matched
• High quality investment portfolio
• Well positioned to respond to market fluctuations
• Within working range across all sensitivities, incl. 2008 & 2011 financial crises
UK property c25% fall
*Estimates based on observed market movements during these crises and intended to provide a high level indication of the Group’s solvency position in these scenarios

25
Capital surplus
Industry-leading financial risk management
£3.6bn
HY17 (SII)
FY11 (EC)
£11.4bn 130%
193%
21% 18%
31%26%
36% 50%
HY17 FY11
Non rated
BBB
<BBB
A
AA & above
Debt securities Commercial mortgages
58%
FY11
102%
HY17
LTV
Reinsurance Hedging • Strategic hedges protect balance sheet
and support efficient capital allocation - Macro credit & equity hedges - Interest rates, inflation & FX risks
mitigated through matching, incl. derivative programmes
• Tactical hedging around specific events
• Group-wide catastrophe reinsurance programmes - Per event: £150m retention (UK) - Aggregate: £175m retention (Group)
• Specific reinsurance (e.g. latents)
High quality investment portfolio (shareholder assets)

26
Liquidity before capital redeployment
Building cash capacity for redeployment
Maintain both:
• Centre assets within £1.0-1.5bn range
• Liquidity coverage ratio (‘LCR’) >100% Forward look over 2 years under 1-in-15 stress
FY16 FY14 FY18e FY17e FY15 FY20e FY19e
£1.1bn £1.3bn
£1.8bn
£1.0bn
Liquidity management
£0.8bn
BU remittances & proceeds from disposals net of ordinary dividends, centre & debt costs
2017 2018e
£2.0bn
redeployed available for redeployment
2017 capital returns
Not to scale
27
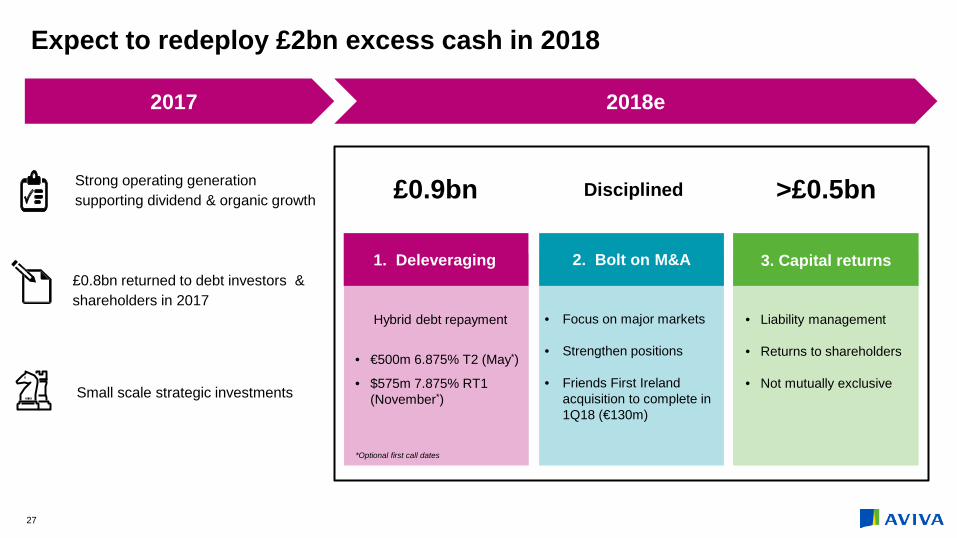
Expect to redeploy £2bn excess cash in 2018
2018e 2017
1. Deleveraging 2. Bolt on M&A 3. Capital returns
£0.9bn
Hybrid debt repayment
• €500m 6.875% T2 (May*)
• $575m 7.875% RT1 (November*)
*Optional first call dates
• Focus on major markets
• Strengthen positions
• Friends First Ireland acquisition to complete in 1Q18 (€130m)
• Liability management
• Returns to shareholders
• Not mutually exclusive
£0.8bn returned to debt investors & shareholders in 2017
Strong operating generation supporting dividend & organic growth
Small scale strategic investments
Disciplined >£0.5bn

28
And another £1bn in 2019
2019e
£1bn
• Dividend remains paramount
• Returns to shareholders
• Continued focus on optimising cost of debt
for discretionary deployment
Beyond
Capital returns
Sll ratio trending above working range
Bolt on M&A
• Focus on major markets
• Reinforce our winning positions
• Disciplined approach

29
Cash flow plus growth…Upgraded
Operating EPS Cash Dividend
Mid-single digit growth in the medium term
Aiming higher
£7bn cash remittances 2016-18 inclusive
£8bn
pay-out ratio target 50% (2017)
55-60% (2020)
Maurice Tulloch
Chief Executive Officer International

31
Growth ambition in International
Significant positions in some of the world’s largest insurance
markets
Focused footprint
Strong and diversified
distribution
Partnerships
Building a
track record
Growth
32
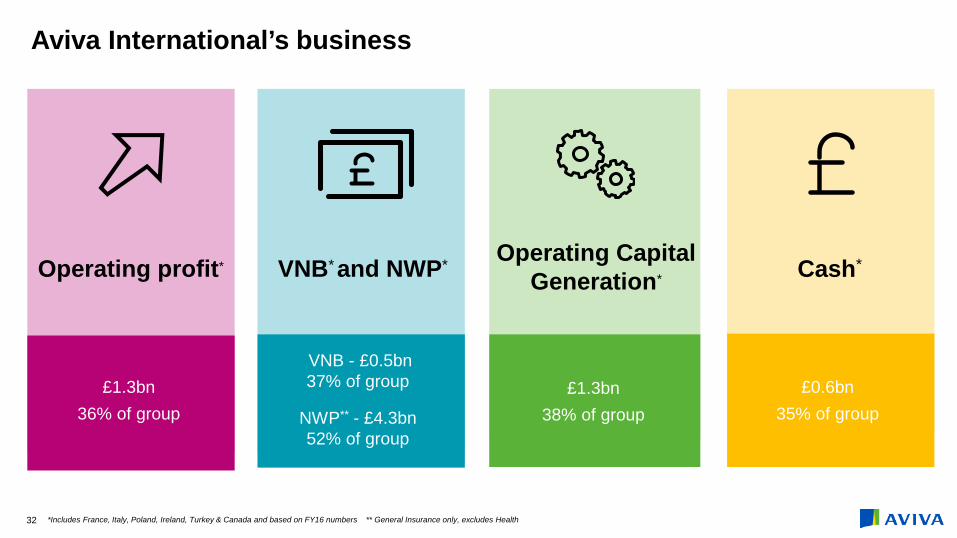
Operating profit* Cash*
Aviva International’s business
£1.3bn 36% of group
VNB* and NWP*
Operating Capital Generation*
£1.3bn 38% of group
£0.6bn 35% of group
VNB - £0.5bn
37% of group
NWP** - £4.3bn 52% of group
*Includes France, Italy, Poland, Ireland, Turkey & Canada and based on FY16 numbers ** General Insurance only, excludes Health

33
The International markets
• World’s 7th
largest insurance market
• Fast growth #12 to #7 in 2016
• World’s 5th largest insurance market
• Leadership in 5 distribution channels
• World’s 8th largest insurance market
• #2 in GI
Canada
• #2 in Life
• Great ROE
Italy France Poland
• #1 in GI, #4 in Life
• Highest GDP growth in Europe
Ireland
• Operating profit more than doubled (HY17)
• Auto-enrolment & TCC opportunity
Turkey Turkey

34
Accelerating our ambition in Ireland
• €130m consideration
• 250k customers
• Market leader Group Risk and Protection
• Superior brand
• 800k customers
• Proven growth and underwriting expertise
Market leading composite insurer #4 Life insurer
#1 GI insurer
1.1m customers Scale benefits
Attractive composite product offerings
Accelerated growth

Strong diversified distribution and partnerships
Poland
France
Italy
Ireland
Canada
Turkey
Key partners Owned channels
#1 direct sales force
Growing agency network
Small Direct GI
Select owned brokers
#2 Direct GI
#2 FA network
Direct
Developing strategy
Direct
Direct
#1 Life Direct Sales Force
#2 FA network
Direct GI
Brokers
Brokers
IFA Network
Agents
35
36
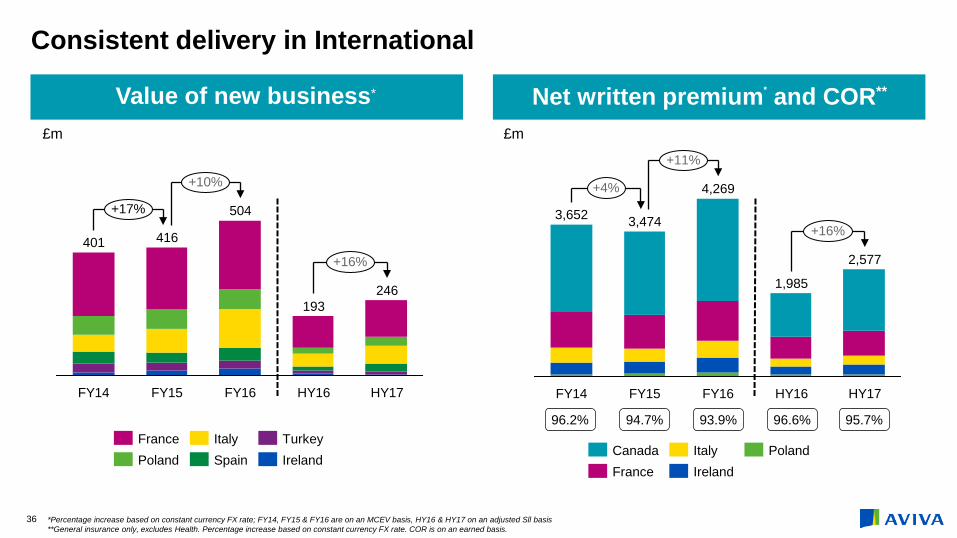
Value of new business*
Consistent delivery in International
Net written premium* and COR**
96.2% 94.7% 93.9% 96.6% 95.7%
FY16 FY15 FY14 HY16
246
401
HY17
193
504
416
+10%
+16%
+17%
France Turkey Italy Poland Ireland Spain
+16%
+11%
+4%
FY14
2,577
3,474
1,985
HY16
4,269
HY17 FY16
3,652
FY15
Poland Canada France
Italy Ireland
*Percentage increase based on constant currency FX rate; FY14, FY15 & FY16 are on an MCEV basis, HY16 & HY17 on an adjusted Sll basis **General insurance only, excludes Health. Percentage increase based on constant currency FX rate. COR is on an earned basis.
£m £m
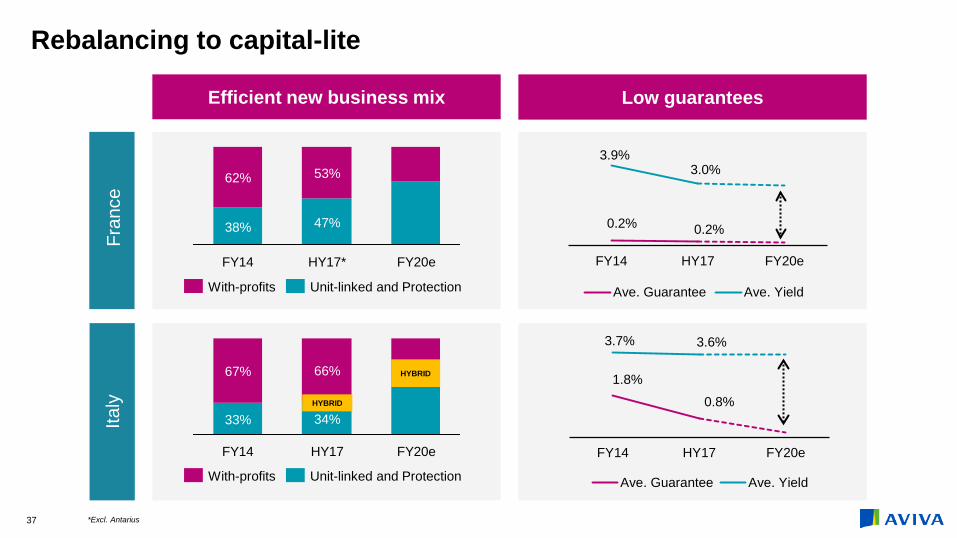
Rebalancing to capital-lite
Low guarantees Ita
ly
Fra
nce
Efficient new business mix
1.8%
0.8%
3.7% 3.6%
FY14 HY17 FY20e
Ave. Guarantee Ave. Yield
0.2% 0.2%
3.9% 3.0%
FY14 HY17 FY20e
Ave. Guarantee Ave. Yield
37
FY14
38%
62%
FY20e
47%
53%
HY17*
Unit-linked and Protection With-profits
67%
34%
HY17
33%
FY14
66%
FY20e
With-profits Unit-linked and Protection
HYBRID
HYBRID
*Excl. Antarius

38
Growth ambition in International
Significant positions in some of the world’s largest insurance
markets
Focused footprint
Strong and diversified
distribution
Partnerships
Higher than mid single-
digit growth
Growth

Appendix

70
Potential benefits from paying back expensive debt
Subordinated debt profile
£439m
£450m
£500m £571m £615m£790m £700m
£400m £400m£600m
£450m£267m
£162m
£800m
£500m
£210m
£443m
£500m
Perpetual 2038 2030 2026 2029 2024 2023 2025 2022 2021 2020 2019 2018 2017 (redeemed)
HY17 (baseline)
Tier 2
Restricted Tier 1
Tier 3
Preference shares (RT1)
All debt instruments have been presented at optional first call dates at nominal values converted to GBP using 30 June 2017 rates.
£882m £879m
£1,300m Implied SII gearing ratio (illustrative only)*
33% 32% 30% 29%
Implied cash savings (illustrative only)*
c£60m c£105m c£3m
c£105m c£105m c£105m c£105m c£105m c£105m c£105m c£105m c£105m c£105m c£105m
*Pro forma for 2017 debt redemption & illustrative only for potential redemption of 2018 notes - does not reflect additional upside potential from refinancing in the longer term