
AVIATION ADMINISTRATION WASHINGTON DC OFFICE -ETC … · AD-AMA8" 666 FEDERAL AVIATION...
151
? AD-AMA8" 666 FEDERAL AVIATION ADMINISTRATION WASHINGTON DC OFFICE -ETC F/6 1/2 GENERAL AVIATION: HOURS FLOWN AND AVIONICS PURCHASE DECISIONS. (U) MAY 78 S B VAI4OVICH UNCLASSIFIED FAA-AP--7B PA omEEEEEEEhhhhI IIIII EIIIIIEEEEIIIE IIIIIIIIIIIIII...lfl
Transcript of AVIATION ADMINISTRATION WASHINGTON DC OFFICE -ETC … · AD-AMA8" 666 FEDERAL AVIATION...

? AD-AMA8" 666 FEDERAL AVIATION ADMINISTRATION WASHINGTON DC OFFICE -ETC F/6 1/2GENERAL AVIATION: HOURS FLOWN AND AVIONICS PURCHASE DECISIONS. (U)MAY 78 S B VAI4OVICH
UNCLASSIFIED FAA-AP--7B PA
omEEEEEEEhhhhIIIIIIEIIIIIEEEEIIIEIIIIIIIIIIIIII...lfl

111 .111112 .2
'IIIIII111K
4 0
MICRO:OPY RESOLUTION TEST CHAqTNAT;ONAL BUR[AU Of STANDARDS 1463-,

PHOTOGRAPH THIS SHEET
00LE EL ex Aviafw g~jJI VENTORY
00 8DOCUMENT IDENTIFICATION
0 Moty (t?8
_:DISTa1 ON S TATM AApproved for public rel s
Distribution Unlimited
DISTRIBUTION STATEMENT
ACCESSION FORNTIS GRA&i DCurric TAB 0UNANNOUNC DTICJUSTFICATION / iCT
JUN 2 1980
DISTRIBUTION DAVAILABILITY CODESDIST AVAIL AND/OR SPECIAL DATE ACCESSIONED
DISTRIBUTION STAMP
80 5 30 053DATE RECEIVED IN DTIC
PHOTOGRAPH THIS SHEET AND RETURN TO DTIC-DDA-2
FORM DOCUMENT PROCESSING SHEETDTIC OCT 79 70A

General Aviation:Hours Flown 8' AvionicsPurchase Decisions
4-4
(tO-Ca May 1978
Document is available to the public throughthe National Technical Information Service.
Springfield, 22151
U.S. DEPARTMENT OF TRANSPORTATIONFEDERAL AVIATION ADMINISTRATION
Office of Aviation PolicyWashington, D.C. 20591
S7
__ _ _ _ _ _ _ _ _ _ _ _ _ _ _ __ _ _ _ _ _ _ _ _ _ _ _ _-C-
* p_ • .. . . .

F' *-- " .c... ...1. Report No. 2 Go ment Accession No. 3. Recapent's Caotalog No.
FAA-AVP-78-9
4. Title and Sbttle S. Rep,, Dote
General Aviation: Hours Flown and May 1978Avionics Purchase Decisions 6. Pefoming Ogn .... ,on Code
7. Authors). Performing Organization Report No.
Stephen G. Vahovich9. Performing Organization Name and Address 10. Work Unit No. (TRAIS)Department of TransportationFederal Aviation Administration 11. Contract or GrontNo.
Office of Aviation Policy, AVP-120Washington, D.C. 20591 13. Type of Report and Period Covered
12. Sponsoring Agency Name and Address
Department of Transportation Staff StudyFederal Aviation AdministrationOffice of Aviation Policy, AVP-120 14 Sponsoring Agency CodeWashington, D.C. 20591
15. Supplementary Notes
16. Abstract
Using data from the Federal Aviation Administration's (FAA) nationalsample of general aviation (GA) aircraft owners, this staff studyexplores separately the factors that influence aircraft owners' hoursflown decisions and factors influencing avionics equipage. Fivedifferent hours flown measures are utilized. Chapter 2 concentrateson the importance of aircraft owners' income and operating cost inthe hours flown decisions of noncompany owners. Chapter 3 broadensthe scope of the hours flown analysis by including company andnoncompany owners, and discusses the importance of factors other thainco'e and cost. Chapter 4 presents the factors that differentiateavionics equipped from nonequipped aircraft. Based on these factorsa "system" is developed to predict avionics equipage for each ofeight different types of avionics.
17. Key Words 18. Distrrbution Statement
General Aviation, Hours Flown, Document is available to the publicAvionics, Factors Affecting through the National Technical
Information Service, Springfield,Virginia 22151.
S19. Secrrty C issf. (of rhs ,e po, 1 20. Securty Clossuf. (of this pagel of Pages 22. Prce
Unclassified Unclassified
Form DOT F 1700.7 .-?-72 R .,Juction of completed poge authorized
.............

EXECUTIVE SUMMARY
This report marks the first time that reliable statisticalsample data are used to explore the preference structureor decisionmaking process of general aviation (GA) aircraftowners. By concentrating on the underlying relationshipsbetween owners' characteristics and their hours flown andto their avionics equipage, and by utilizing representativedata, the validity of the results presented in this reportshould be sustained for the foreseeable future in theabsenceof significant structural change in the GA community.
The need for such a structural assessment utilizing dataspecific to the GA community was identified in an earliercompanion volume--General Aviation: Aircraft Owner & Utiliza-tion Characteristics (FAA-AVP-76-9)--which demonstrated theuniqueness of the GA community as compared to the generalpopulation. The latter volume also summarizes numerous sta-tistical information collected by the Bureau of the Census froma nationally representative sample of GA aircraft owners. Thepresent report uses this representative sample data but eschewsrote, numerical emphasis. Rather, it seeks to explain thereasons why and the extent to which GA aircraft owners' charac-teristics determine hours flown and avionics purchases. Thepresentation of the results, following the intent of thePresident's Executive Order, is geared to common parlance,substituting easy to understand explanations and graphicpresentations for the technical terminology. Thus, the reportprovides the individual aircraft owner with understanding ofand insight into the "big picture," while simultaneouslyproviding valuable information on the hierarchical orderingof key indicators to both the Federal Aviation Administration(FAA) and industry. Since FAA manpower staffing and facilityplanning are related to GA hours flown and avionics utilization,and since GA manufacturing industries' (aircraft and avionics)sales and production schedules are closely tied to GA aircraftowners' preferences, the practical value of the results presentedin this report should not be underrated.
Chapter 1 is the introduction to the report, detailing thescope and the approach taken in the report.
Chapter 2 focuses almost exclusively on the impbrtance ofnoncompany aircraft owners' income and operating cost inhours flown decisions. The results show that while bothcost and income are important in explaining the number ofhour flown, noncompany owners give more weight to costs than
B~i

income in their hours flown decisions. towever, the extentto which cost exceeds income in importance varies with thetype of hours flown--from almost equal importance for instru-ment hours flown to eleven times more important for localhours. This result implies that to properly ascertain theimpact of cost and income on hour flown, each of the fivetypes of hours flown (total, itinerant, local, instrument,and visual) must be analyzed separately. Investigatingsensitivity of hours flown to income and cost changes, leadsto the conclusion that GA aircraft owners appear to act as ifthey were renting their airplanes to themselves, thus consider-ing both the annualized initial purchase price of the aircraftand its operating cost in deciding at what point price has becomehigh enough to curtail hours flown. Support for this type ofconsumption behavior has been found in areas other than generalaviation. Further, this study found strong evidence that GAaircraft owners are firmly committed to their flying activities.Contrarily, other studies, which did not use data specific tothe GA community, conclude that GA flying is a luxury good--nonessential and quickly sacrificed. Using GA specific data,this report finds strong evidence that GA aircraft ownersconsider their flying activities a necessity--hours flown aregiven up only grudgingly in response to changes in price andincome.
Chapter 3 of this report broadens the purview, of the hours flowninvestigation in two ways. First, it considers company as wellas noncompany owners of GA aircraft. Second, while including arevised income-cost measure (based on Chapter 2 results), itexamines in detail the importance of such other factors asaircraft productivity, age of aircraft, owners' type of use,and avionics equipage on GA hours flown. The results showthat no single characteristic can be considered dominant inimportance in explaining either company or noncompany ownerhours flown decisions across all categories of hours flown.Thus, the results provide the necessary information on therelative importance of the various owner characteristics ineach hours flown category. Further, the much broader scaleresults obtained in Chapter 3 concur with those obtained inChapter 2--separate analysis must be conducted for each hoursflown category. With respect to comparisons of the companyand noncompany owners' hierarchical ordering of their hoursflown decision criteria, discrepancies between the two ownergroup rankings are the rule, not the exception, across allcategories of hours flown. Apparently, company and noncompanyowners assess their hours flown decisions differently andconsequently the two owner groups should be analyzed separately.Further, the decision structure for each owner group wasreviewed for its level of decisiveness--i.e., the strengthwith which each owner group differentiated among the factors
.i.

in making their hours flown decisions. In two hours flowncategories, total and instrument hours, the company ownerordering was more clearly defined. However, noncompany ownerswere more decisive in their itinerant and visual hours decisions.
The purpose and methodological approach taken in Chapter 4 isquite different from that of the preceding chapters. The focalpoint of Chapter 4 is to determine which GA aircraft ownercharacteristics account for avionics purchases, and to developa system (based on those characteristics) that maximizes thenumber of correct predictions of avionics equipage and nonequip-age. Eight different types of avionics are considered. In gen-eral, the results show that type of aircraft and age of aircraftare the two most powerful factors determining GA aircraft avionicsequipage. Incidences of the system's "total" correct predic-tions--i.e., for both equipage and nonequipage--range from46.2 percent for area navigation equipment to 86.6 percent forOMNI-directional receivers. Measured against the stringentmaxim'm pure chance criterion, the system's correct predictionrate exceeds that which could be expected by this "educatedguess" criterion in all but two of the eight avionics categories.Even for the latter two avionics categories, the percentage ofthe system's correct predictions exceed the criterion percentagewhen the avionics equipped owners are considered alone. Thus,the system developed in Chapter 4 is judged to be an effectivediscriminator between avionics equipped and nonequipped GAaircraft owners.
i iii
. . .. . . . . . . .. . . . . . .

ACKNOWLEDGEMENT
Special note for cooperation and dedication is due to
Me Barbara Turner and Ms Geraldine Bolden whose patient
and conscientious efforts expedited the typing of this
report through its many stages of revisions.
iv

TABLE OF CONTENTS
Page
EXECUTIVE SUMMARY ....... .................. i
TABLE OF CONTENTS ....... .................. v
LIST OF FIGURES ....... ................... vii
LIST OF TABLES ........... ................... x
1. INTRODUCTION .......... .................. 1
2. IMPACT OF COST AND INCOME ON HOURS FLOWN BYNONCOMPANY OWNERS ..... ............... 6
2.1 NEED FOR STUDY ........ .............. 62.2 FACTORS INFLUENCING GA HOURS FLOWN . . .. 72.3 IMPORTANCE OF FACTORS IN THE HOURS FLOWN
DECISION ...... ................. 16
2.3.1 TOTAL HOURS FLOWN .. .......... 212.3.2 ITINERANT HOURS FLOWN ......... 242.3.3 LOCAL HOURS FLOWN .. .......... 262.3.4 INSTRUMENT HOURS FLOWN ....... 292.3.5 VISUAL HOURS FLOWN .. ......... 33
2.4 DEGREE OF SENSITIVITY ... ........... 352.5 CONCLUSIONS ...... ................ 41
3. HOURS FLOWN BY COMPANY AND NONCOMPANY OWNERS 45
3.1 PURPOSE OF STUDY .... ............. 453.2 FACTORS INFLUENCING HOURS FLOWN ...... ... 463.3 IMPORTANCE OF FACTORS IN THE HOURS FLOWN
DECISION ...... ................. 58
3.3.1 TOTAL HOURS FLOWN .......... 603.3.2 ITINERANT HOURS FLOWN.. ....... . 633.3.3 LOCAL HOURS FLOWN .. .......... 673.3.4 INSTRUMENT HOURS FLOWN ....... 703.3.5 VISUAL HOURS FLOWN .. ......... 74
3.4 CONCLUSIONS ..... ................ 76
v

TABLE OF CONTENTS (Cont'd)
Page
4. GENERAL AVIATION PURCHASERS OF AVIONICS. . .. 81
4.1 INTRODUCTION ..... .............. 814.2 APPROACH ...... ................ 844.3 RESULTS ....... ................. 91
4.3.1 INSTRUMENT LANDING SYSTEM ..... 954.3.2 VERY HIGH FREQUENCY OMNI-DIRECTIONAL
RECEIVER ..... ............. 1024.3.3 DISTANCE MEASURING EQUIPMENT . . 1064.3.4 AUTOMATIC DIRECTION FINDER . . . iii4.3.5 WEATHER RADAR ................. 1144.3.6 AREA NAVIGATION EQUIPMENT ..... 1204.3.7 TRANSPONDER .... ............ 1244.3.8 ALTITUDE ENCODING TRANSPONDER . . 127
4.4 CONCLUSIONS ...... ............... 130
iv
VI
vi

LIST OF FIGURES
2-1 e Proposed Hoqrs Flown Response to Increasesin Hourly Operating Cost .. ........... 9
2-2 Percent Distribution of Aircraft by Type ofAircraft .... ................ ....... 14
2-3 Percent Distribution of 4ircraft by UserGroup ...... ................... 15
2-4 FAA Regional Distribution of NoncompanyOwners of Aircraft .... ............. .. 17
2-5 Relative Importance of Key Factors in TotalHours Flown Decision ... ............ . 22
2-6 'elative Importance of Key Factors inItinerant Hours Flown Dpcision ........ .. 25
2-7 Relative Importance of Key Factors in LocalHours Flown Decision ... ............ . 28
2-8 Relative Importance of Key Factors inInstrument Hours Flown Decision ...... .. 31
2-9 Average Hourly Operating Cost by Type of PoursFlown ...... ................... 32
2-10 Average Annual Family Income by Type of FoursFlown ...... ................... 34
2-11 Relative Importance of Key Factors in VisualHours Flown Decision ... ............ . 36
2-12 Critical operating Cost (Average Use Charge in
Parenthesis) Above Which Hours FlownDecrease ....... .................. 39
3-1 Percent Distribution of Aircraft by Type ofAircraft ....... .................. 47
3-2 Percent Distribution of Aircraft by UserGroup ....... ................... 49
3-3 FAA Regional Distribution of Company Ownersof Aircraft ...... ................ 51
vii
Al .. . V*

TIST OF FIGURES (Cont'd)
Paq ,-
-4 Relative importance of Factors in TotalHours Flown Decision ...... ........... 6]
3-5 Relative Importance of Factors in ItinerantHours Flown Decision ... ........... 64
3-F, Relative Importance of Factors in LocalHours Flown Decision ... ........... 68
3-7 Relative Importance of Factors in InstrumentHours Flown Decision ...... ........... 7
3-8 Relative Importance of Factors in VisualHours Flown Decision ... ........... 75
4-1 Relative Importance of Factors in TSAvionics Equipage ... ............ 97
4-2 IIS: Percentage of Correct and IncorrectPredictioins ..... ............... 100
4-1 Relative Importance of Factors in VORAvionics Equipage ... ............ 103
4-4 VOR: Percentage of Correct and IncorrectPredictions . . . . . . . . . . . . . . . 104
4-5 Relative Importance of Factors in DMEAvionics Equipage ... ............ 108
4-6 DME: Percentage of Correct and IncorrectPredictions ........ ............... 110
4-'7 Relative Importance of Factors in ADFAvionics Equipage ... ............ 112
4-8 ADF: Percentage of Correct and IncorrectPredictions ..... ............... 113
4-9 Relative lmportance of Factors in RadarAvionics Fquipage ... ............ 115
4-10 Radar: Percentage of Correct and IncorrectPredictions ..... ............... 118
viii

LIST OF FIGURES (Cont'd)
4-11 Relative Importance of Factors in ANEAvionics Equipage .... ............. .. 121
4-12 ANE: Percentage of Correct and IncorrectPredictions ..... ................ . 123
4-13 Relative Importance of Factors in TransponderAvionics Equipage .... ............. .. 125
4-14 Transponder: Percentage of Correct andIncorrect Predictions ... ........... .. 126
4-15 Relative Importance of Factors in AltitudeEncoding Transponder Avionics Equipage . 128
4-16 Altitude Encoding Transponder: Percentage ofCorrect and Incorrect Predictions ..... .. 129
ix

LIST OF TABLES
Page
2-A Direction of impact of Factors on Hours Flown 2-20
3-A Direction of Tmpact of Factors on Hours Flown 3-59
4-A Typical Classification Matrix .. .......... 4-85
4-B Outline of Discriminant Analysis Approach .... 4-90
4-C Direction of Impact of Factors on AvionicsEquipage.................. 4-92
X

CHAPTER 1 INTRODUCTION
This staff report is divided into two major parts. The
purpose of Part I is to examine the factors that are signif-
icant in determining the number of hours flown by general
aviation (GA) aircraft owners. The first chapter in Part I
presents a fairly detailed analysis of the relative importance
of operating cost and owners' income in the number of hours
flown decision of GA aircraft owners. In addition, the
responsiveness (amount of increase or decrease) of hours
flown to changes in GA owners income and operating cost is
examined. This analysis is conducted using data for non-
company owners of GA aircraft. The next chapter in Part I
investigates both company and noncompany owners of GA aircraft.
This second study should be viewed as relatively independent
of the first. That is, although it deals with the same topic,
hours flown, its perspective is different. The change in per-
spective is based partly on the results obtained in the first
study, and partly on the need to thoroughly examine the influ-
ence of factors, other than cost and income, on hours flown
decisions. The details of each of these studies are discussed
more fully 41n the individual chapters in Part I.
The analytical technique and objectives of Part II are entirely
different than those of Part I. The objective of Part II is to
ir

identify aircraft owner characteristics that are important in
determining whether or not an aircraft is equipped with avionics.
Eight different types of communication and navigation instrumen-
tation are considered. Once the characteristics are selected,
they are combined to form a "system" which in turn is used to
predict avionics equipage and nonequipage. The predictions are
tested against a criterion value, formulated from known data,
to assess their accuracy. Thus, the effectiveness of the system
to differentiate between the avionics "haves" and "have-nots"
is ascertained.
The advantages to the Federal Aviation Administration (FAA) and
to industry of having information about which characteristics,
as well as the relative importance of each, influence hours
flown and avionics equipage are numerous. Given that GA air-
craft represent approximately 98 percent of all civil aircraft
and account for about 80 percent of all aircraft operations at
FAA towered airports, FAA manpower staffing at its facilities
is strongly influenced by GA. More particularly, certain types
of flying, especially instrument flight, requires specified
types of communications and navigation instrumentation and
draws heavily on FAA ground facility manpower and equipment
services. Currently GA accounts for almost one-third of all
instrument flights handled at FAA Control Centers and well
over one-half of all FAA tower instrument operations. Thus,
in order to facilitate its planning for future manpower needs
2
as well as for the ground aid systems per se, knowledge of
the factors that influence GA avionics equipage is critical
to the FAA.
As may be expected, factors influencinq the purchase of
communication and navigation instrumentation is also of
intense interest to the avionics producing industry. GA's
commanding share of the civil aircraft fleet together with
recent advances in microprocessors and consequent lower cost
production technology target GA as a prime market. Thus,
identifying the characteristics of GA aircraft and their
owners that purchase the various types of avionics as well
as the relative importance of those characteristics in the
avionics equipage decision forms a basis for defining market
demand, planning future sales/marketing strategies and
arranging production schedules.
The data utilized in the analysis are from the 1975 sample of
GA aircraft owners. This nationally representative sample of
9,860 GA aircraft owners was conducted by the Bureau of the
Census for the FAA. Complete details of the sampling procedure
and numerous statistics on GA ownership characteristics are
presented in General Aviation: Aircraft, Owner & Utilization
Characteristics (Report No. FAA-AVP-76-9). Whereas the latter
report simply presented the information on GA characteristics,
the present study examines the reasons why and to what extent
GA aircraft owners behave as they do. Since the results are
3

based on representative data, and since the structure of air-
craft owner preferences are not likely to change rapidly
(similar to other consumer units), the results presented in
this report may be considered relevant for some time to come.
In addition, although the present study utilizes the sophisticat-
ed techniques of multiple regression analysis (Part I) and
multiple discriminant analysis (Part II) to obtain the results,
the complex terminology and catch phrases of these techniques
have not been used. This report is written so that no prior
knowledge of these techniques is necessary to understand the
results presented herein. Graphic presentation and simplified
explanations have been heavily utilized so that the important
findings presented can be understood by both researchers and by
GA aircraft owners.* This does not mean that the report reduces
to light reading. The style retains the slightly more formal
third person, and the substance focuses on describing serious
research efforts and their results in a nontechnical manner.
It is especially important that research results be comprehensible
to the individual GA aircraft owner. Understanding what
characteristics, and the extent to which each of these
characteristics, motivate the GA community as a whole cannot
be obtained from individual experience. Thus, the information
Technical versio-ns-of the studies, presenting the equations,
estimated coefficients, and supporting statistical tests areavailable through the Office of Aviation Policy.
4
ii

presented in this report assists in making the individual
aircraft owner vastly more knowledgeable about the larger
community of which he is a member.
The analyses and conclusions presented in this study are those
of the author and do not necessarily reflect the views of the
FAA.
5
:j 5

PART I
ANALYSIS OF GENER~AL AVIATION
HOURS FLOWN

CHAPTER 2 IMPACT OF COST AND INCOME ON HOURS FLOWN BY
NONCOMPANY OWNERS
2.1 NEED FOR STUDY
Based on the author's earlier research [5], the GA community
may be characterized as a large and heterogeneous grouping,
encompassing diverse types of aircraft, user groups, and
utilization rates. Further, this earlier research also
supports the uniqueness of the GA community as compared to
the U.S. population. When the U.S. is divided into 11 distinct
geographical areas (FAA regions), both the median (50 percent
have incomes higher than this value and 50 percent are lower)
and average incomes for aircraft owners are substantially
higher than those of the U.S. population, and the distribution
of aircraft owners across the United States is less skewed toward
the East Coast than that for the general population.
Given their uniqueness and their importance in the National
Airspace System (GA represents about 98 percent of all civil
aircraft, and accounts for about 80 percent of all aircraft
operations at FAA towered airports; [2]), an urgent need
exists to conduct and present analysis on hours flown deci-
sions utilizing GA specific data. Although the question of
the impact of cost and income changes has been addressed in
other studies, none of these have used data collected from
the GA community. That is, for convenience, two implicit
assumptions are usually made. First, that changes in the
6

general price level in the economy (e.g., as measured by
gross national product deflator or some regional price index)
represent an adequate measure of the change in prices of GA
flying. Second, that GA aircraft owners react to changes in
aircraft hours flown in the same manner and degree that they
react to changes in the general price level. A similar set
of assumptions are made concerning income. However given
the uniqueness of the GA community, the validity of this
assumption is questioned, and is further scrutinized by the
results presented below.
2.2 FACTORS INFLUENCING GA HOURS FLOWN
Economists tell us that there are two main factors which
direct buying habits. The price of the goods to be purchased
and the income earned by the potential purchaser. GA aircraft
owners may be thought of as a consumer of a good called hours
flown. But hours flown, as with almost all goods, can only
be purchased at a certain price. Excluding the initial
purchase price of the aircraft, the important cost to the
consumer/GA aircraft owner is the price that must be paid
to operate his airplane say for one hour. The operating
costs consist of fuel and oil costs, airframe and avionics
costs, and engine overhaul and maintenance costs. (Hourly
operating cost data by type of aircraft [3) was added onto
the data obtain on the sample survey.) If hourly operating
7

cost increases, and excluding thc influence of any other
factor, the aircraft owner may be expected to fly fewer
hours. The basic and simple economic principle is that as
anything becomes more expensive, less of it is purchased.
In the early stages of the research the validity of this
principle was tested using sophisticated multiple regression
analysis techniques. Somewhat surprisingly, GA aircraft owners
did not appear to consistently respond in the way the theory
suggested. A second and more in-depth analysis was undertaken.
The question to be answered was: what could cause GA aircraft
owners to appear unresponsive to changes in operating cost?
One factor, heretofore largely ignored, was the initial pur-
chase price of the aircraft. This "initiation fee" into the
club of GA owners, generally nontrivial for most owners, may
exert a powerful influence on flying hours decisions. On
this reasoning the basic economic principle put forth above
was modified somewhat. That is, because of the high initial
investment cost of purchasing an aircraft, hours flown are
insensitive to increasing unit operating costs at low levels
of operating cost; only at some high level of operating cost,
will hours flown decrease. This theory is demonstrated in
Figure 2-1. This figure shows hourly operating costs in
dollars on one axis and hours flown on the other axis. The
solid line from A to B, drawn on the plane formed by the
8

D
C2
0
0
AI
0~ Hours Flown
Figure 2-1
PROPOSED HOURS FLOWN RESPONSE TO INCREASES IN HOURLY OPERATING COST
axes, shows that at low levels of operating cost, hours
Iown continue to increase from zero to Ill hours despite
the increase in operating costs from zero to C1 dollars.
The portion of the line from B to D shows that only at
operating costs higher than C1 do hours flown decline
(from Hl toward zero) as costs increase from Cl to C2.
Thus, the basic economic principle of decreases in quantity
purchased with increases in price is not contradicted, but
an emphasis is placed on the relevance of the magnitude of
the change in operating costs. Due to the sophisticated
techniques employed in this study (the mathematics and
proofs we shall accept on faith) the validity of this
theory can be tested for GA aircraft owners. But the
investigation will not stop at this point. That is, should
evidence be found to substantiate this interesting theory,
mathematical extension of the results (via some basic calculus)
will allow us to determine the point at which hours flown
decrease in response to increases in operating cost (i.e., find
point B as given in Figure 2-1).
Income is another factor often considered to be important in
the purchase decision. Its relation to the quantity purchased
is opposite to that of price. That is, as income increases,
all other things remaining the same, we may be expected to buy
more of a particular good. For aircraft owners, it may be
expected that as their income increases, other things the same,
10

they will fly more hours. This theory is also tested in the
.present study. Further, the degree or magnitude of the
responsiveness of hours flown to changes in owners' incomeIis assessed.
While there are other factors which help to explain the numberpof hours flown by GA aircraft owners, a theoretical justifica-
tion supporting the relevance of these factors and the results
obtained is postponed until later. The intent of this chapter
is to focus the reader's attention on the useful findings
related to the impact of cost and income, rather than to get
needlessly involved in the lengthy theoretical aspects. How-
ever, one digression is necessary before proceeding to the
results. The purpose is to acquaint the reader with some of
the particulars of the GA owners included in the study.
An important distinction to keep in mind for purpose of the
present and following chapters is that between company and
noncompany owners of GA aircraft. Company ownership means
that the registered owner (FAA Form 8050-1) is some business
entity such as a corporation, etc. Noncompany ownership
means that the registered owner of the aircraft is an
individual. However, this does not preclude the possibility
that an individual will use his aircraft for business purposes.
For example, an aircraft owned by an individual in a sole
proprietorship business may use that aircraft for business
purposes. (Figures 2-3 and 3-2 show the percent distribution

of use for noncompany and company owners, respectively.)
However, it must be recognized that business entities realize
special advantages such as tax write-offs for aircraft
purchases and operating costs, some of which are not available
to noncompany owners using their aircraft for business purposes.
Further, Figure 2-3 shows that the personal use category
accounts for 63.3 percent of total noncorpany owners; however,
Figure 3-2 (see Chapter 3) shows that the comparable percentage
for noncompany owners is only 18.4 percent. Thus, even under the
most liberal assumption--all use categories other than personal
use are for business purposes and available for tax advantages--
only 36.7 percent of the noncompany owners would realize some tax
advantages) whereas 81.6 percent of the company owners would real-
ize tax advantages. Because these advantages and other factors
may be expected to result in differences between noncompany
and company owners of aircraft in the magnitude of their hours
flown response to price and income changes, these two groups
of owners are considered separately. This chapter deals cnly
with noncompany owners (Chapter 3 presents a comparison
analysis for company and noncompany owners). Aircraft owned
by noncompany owners represent 65.1 percent of the GA fleet.
For the purpose of eliminating suspected deviant members
of the owners under study (i.e., individuals whose price
and income responses may be atypical. of the majority) only
fixed wing aircraft, flying some positive number of hours
are included. Twin/multiple-engine piston aircraft weighing
12

over 12,500 lbs. are excluded. That is, since the purpose
of the study presented in this chapter is to estimate
representative hours flown responses to changes in cost
and income for a segment (noncompany owners) of the GA
community, the latter were suspected of distorting this
objective. Specifically, piston aircraft weighing over
12,500 lbs. were excluded because this class of aircraft
has not been manufactured since 1960, and almost one-half
of them could not be classified by any of eight user
categories describing the other members of the GA community.
The following three figures are used to illustrate some of
the characteristics of the GA owners upon whose responses
the results are based. Remember that the "total" values (i.e.,
total aircraft in Figure 2-2 and total users in Figure 2-3)
represent the number of observations in the sample used for
analysis, not to the total number in the fleet. Figure 2-2
shows the composition of the GA noncompany owner fleet used
in the study by type of aircraft. This figure shows that the
noncompany owner is much more likely to own a single-engine
piston (4 or more seats) aircraft (55.1 percent) than any other
type of aircraft. The next most popular aircraft types are the
small single-engine pistons (38.3 percent), twin-engine pistons
(6.3 percent), turboprops (0.3 percent) and turbojets
(0.1 percent). Figure 2-3 shows the composition of the
noncompany owners according to primary use category. The
largest concentration of noncompany owners is in the personal
13

T P, 0. 3% - T, 0.16.3%SEP,
38.3%SEP 4+55.1%
Total Aircraft4,436
Legend:
SEP -Single-Engine Piston (1-3 seats) TP -TurbopropSEP 4+ - Single-Engine Piston (4 or more seats) TJ -TurbojetTEP - Twin-Engine Piston (under 12,500 lbs.)
Figure 2-2
PERCENT DISTRIBUTION OF AIRCRAFT BY TYPE OF AIRCRAFT
14
. ... .......

Indust, 0.5% Rent, 2.0%AT, 1.1% Oth, 1.4%
Instr, 3.7% Exec, 0.6%
Aerial, 3.2%
24.2%
Pers,63.3%
Total Users4,436
Legend:
Exec Executive AT - Air TaxiBus - Business Indust - IndustrialPers - Personal Rent - RentalAerial -Aerial Application Oth - OtherInstr - Instructional
Figure 2-3
PERCENT DISTRIBUTION OF AIRCRAFT BY USER GROUP
15.1

use category (63.3 percent). Business use is the next largest
category (24.2 percent), with the remainder of owners distri-
buted among the other use categories. As for regional distri-
bution, Figure 2-4 shows that the largest concentration of
noncompany owners occurs in the Great Lakes Region (20.4 per-
cent), followed closely by the Western Region (17.5 percent).
If these figures are compared against those presented in
General Aviation: Aircraft, Owner & Utilization Characteristics,
it can be seen that the impact of including the screening
criteria (i.e., fly some positive number of hours, etc.) does
not significantly affect the characteristics of the sample.
In the unscreened sample single-engine piston (4 or more seats)
represent the largest proportion of the fleet, personal users
are more prevalent than any other user category, and the Great
Lakes Region has the largest concentration of owners. That is,
the screening criteria have not changed the relative order of
the components of the type of aircraft distribution, use dis-
tribution, or the regional distribution. Thus, the results
obtained from the noncompany owners used in this study may be
considered representative of all noncompany owners.
2.3 IMPORTANCE OF FACTORS IN THE HOURS FLOWN DECISION
Using multiple regression analysis, estimates of the relative
impact of changes in cost, income and other factors were
16
....

z 0
0 W(nw
2! 0
ae 0
0
0 ~ se I .. I
c0r
7-U-
0i442
cu0(M.
co-
00ccJ
U
1.7

derived for each of five different measures of hours flown--
total hours flown, itinerant local, instrument, and visual
flight hours. As used in this study, local and itinerant
hours are the component parts of total hours. Instrument
and visual hours comprise itinerant hours. Each of these
hours flown measures will be considered separately.
It is critical at this time to alert the reader to the fact
that the results presented in this chapter, and throughout
much of this report, are presented in terms of the importance
of each factor (e.g., income, operating costs, etc.) relative
to the other factors. For the hours flown analysis, this means
that the particular numerical value assigned to a factor is not
important in and of itself, but rather that the relationship of
that value to the values obtained by the other factors is the
important point. For example, if there were only two factors,
and if Factor A has a value of 4 and Factor B has a value of 2,
then Factor A is two times more important or powerful than B in
determining the number of hours flown. However, an identical
statement is true if Factor A had a value of 8 and Factor B had
a value of 4. The key point to remember is that the numerical
value per se is not important for the purposes of this report,
but the relative "position" of a factor is of crucial importance--
i.e., the rank assigned to a factor when all the factors are
ordered from highest to lowest, based on their associated
numerical values. Thus, the basis for the discussion throughout
18
- M-4

much of this report is what econometricians call the "standard-
ized beta," beta weight, or standarized estimating coefficient.
Simply, it is a useful tool to assess the relative importance
of say apples and oranges by standardizing them to common basis.
Similarly, the reader must also be aware of the fact that certain
factors impact hours flown in a positive manner (e.g., income
and hours flown move in the same direction) while others have
a negative impact (e.g., as cost increase, hours flown decrease).
Economic theory explains the direction of impact. However,
factors having equivalent numerical values associated with them
are equally important in determining hours flown regardless of
the direction of their impact.
Since this study focuses on assessing the importance of the
factor's impact, the graphical presentation of the results
includes only this dimension. For the interest of the reader,
the direction (positive or negative) of the factor's impact, as
it is used in this chapter for a specific hours flown category,
is presented in the theoretical discussion in the text and is
sunm-arized in Table 2-A. This table may be used as a handy
reference guide to the discussion and in conjunction with the
results presented in the bar-charts (Figures 2-5 through 2-11).
The actual or absolute magnitude (i.e., impact relative to zero)
of cost and income on hours flown for the various hours flown
categories will be considered in Section 2-4 of this chapter.
19

For the benefit of the economists, it should be noted that all
monetary variables used in the study have been deflated by a
regional price index to control for distortions in the results
that may arise simply from geographical variations in cost and
income.
FACTOR DIRECTION OF IMPACT
Annual Family Income +
Hourly Operating Cost
Manufactured Pre-1960
Personal Use*
Instructional Use +
Avionics +
Air Carrier Service
Personal use has a positive impact in the local hoursdecision only (see Section 2.3.3).
TABLE 2-A
DIRECTION OF IMPACT OF FACTORSON HOURS FLOWN
20

Finally, it should be noted that since the purpose of this
chapter is to concentrate on the impact of cost and income on
hours flown, the impact of other factors receive considerably
less attention. Results for "key" factors are presented and
discussed in this chapter. That is, results for income and
cost are always presented, as are results for the most impor-
tant (highest numerical value) and least important (lowest
numerical value) factors. Further, if a factor achieves the
highest or lowest rank in any one hours flown category, it is
included in the presentation of the results for the other hours
flown categories as well. Exceptions occur when a factor is
irrelevant for a particular hours flown category--e.g., air
carrier service, as an alternative to GA flying, is important
to itinerant hours, but is irrelevant for consideration in
local hours. Using this rule the discussion is able to focus
attention on the income and cost impacts, simultaneously main-
taining continuity with respect to the factors considered, and
minimize unnecessary (for purposes of this chapter) distraction
from the stated objective. The objectives of Chapter 3 are much
broader and it presents results for each factor used in the
analysis.
2.3.1 TOTAL HOURS FLOWN
Figure 2-5 shows the importance of key factors, relative to the
others, in the owners' decisions about how many hours to fly.
21
; I

17
16
14
7
i_
Annual Hourly Manufactured Personal Air CarrierFamily Operating Pre-1960 Use ServiceIncome Cost
Figure 2-5
RELATIVE IMPORTANCE OF KEY FACTORS INTOTAL HOURS FLOWN DECISION
22
" _ _
The figure shows that hourly operating costs are twice as
important as annual family income in the total hours flown
decision. The least important factor is the availability of
air carrier service, while the most influential factor is age
of the aircraft. The type of use, specifically personal use,
is also very important in the hours flown decision. The
theoretical justification supporting the use of the latter
three factors in the hours flown equation and their expected
direction of impact may be briefly stated as follows. Due to
the deleterious effect of age/use on an aircraft's operating
condition and performance, older aircraft may be expected to
fly fewer hours. For the opposite reason, more recent vintage
aircraft may be expected to fly more hours. The greater the
availability of a substitute mode of transportation, specifically
the number and frequency of air carrier service, the fewer the
expected number of hours flown. Because of the way the study is
structured, theoretical arguments for the user group factors are
related to business users. An owner who flies his aircraft
primarily for pleasure may be expected to fly fewer hours than an
owner who flies for business reasons. That is, business users
suffer a greater financial loss if they do not reduce nonproductive
travel time. This rationale supports the use of these factors
for all categories of hours flown except local hours (see
Section 2.3.3).
23

As for the direction of the impact, the multiple regression
results support all the contentions advanced thus far. That
is, hours flown increase with income and decrease with
increases in cost. Older aircraft fly fewer hours and newer
aircraft fly more hours. Personal users fly fewer total
hours than business users and the availability of air carrier
service decreases total hours flown. While these findings may
seem almost trivial, this study represents the first time that
this reasoning has been scientifically tested and has been
found true at a statistically significant level using actual
sample data from aircraft owners. As is well known, many
supposedly common sense notions have, under the close scrunity
of scientific testing, been proven erroneous, or at least not
as simple as they first appeared.
2.3.2 ITINERANT HOURS FLOWN
Itinerant hours consist of the time elapsed during a flight
having an origin different than its destination. Figure 2-6
shows the relative importance of key factors in the itinerant
hours flown decision. The figure shows that hourly operating
costs are almost three times as important as annual family
income in the itinerant hours flown decision. Clearly, the
most important factor is equipage with an automatic direction
finder (ADF). The intent of introducing this variable in the
itinerant hours equation is to capture the impact of the level
of aeronautical sophistication on the.hours flown decision.
24
,-- Pa t-

23
1l9
17
12
3
Annual Hourly Manufactured Personal Avionics Air CarrierFamily Operating Pre-1960 Use ServiceIncome Cost
Figure 2-6
RELATIVE IMPORTANCE OF KEY FACTORS INITINERANT HOURS FLOWN DECISION
25
-. ,. . , \ . . . \ \ \ \,,

This particular type of avionics (ADF) was selected because
of its function--i.e., it is indicative of longer inter-city
flights--and it did not cause distortions of the results when
included with the other factors.
As for the other factors presented in Figure 2-6, the avail-
ability of air carrier transportation appears to have the
least impact on the itinerant hours decision. Personal use
appears to exert more influence than age of aircraft in the
itinerant hours flown decision, whereas their relative positions
were reversed in the results for total hours.
The direction of the impact of these factors is the same as
that found for total hours. That is, increases in income
and the level of aeronautical sophistication are associated
with increase in itinerant hours flown, while increases in
cost, age, personal use, and availability of air carrier
service are associated with decreases in itinerant hours
flown. Results for avionics shows that this factor has a
positive influence on the number of hours flown.
2.3.3 LOCAL HOURS FLOWN
Local hours are defined as the time elapsed between a takeoff
and landing, both of which occur at the same airport. Local
hours, having the same origin and destination point, are
generally associated with the pure pleasure of flight experi-
ence. Since, at best, local hours may be considered incidental
to the business use of aircraft, personal users may be expected
26

to fly more local hours than business users. s iij arlIy , si nee
flight training involves a great deal of local flying, instruc-
tional users may be expected to fly more local hours than
business users.
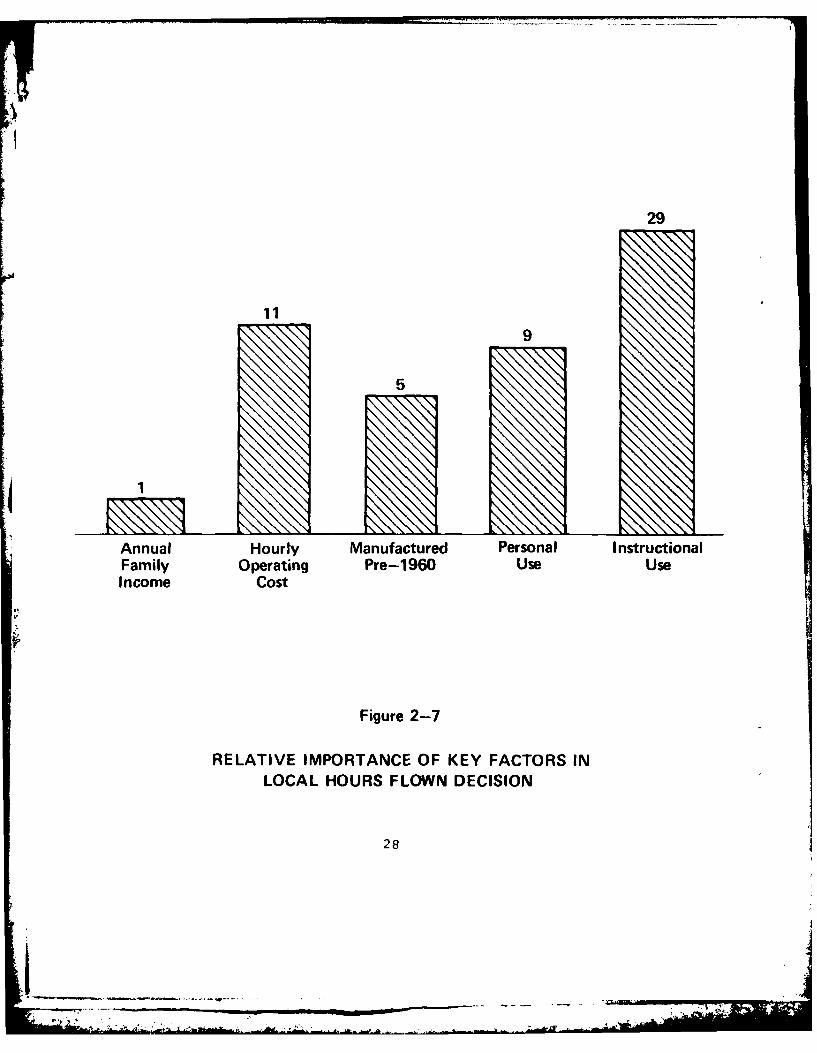
Figure 2-7 illustrates the relative importance of key factors
00 in determining the number of local hours flown. This figure
shows that owners' income is the least important factor in the
local hours flown decision. Instructional use is by far the
most important factor, followed by hourly operating costs.
Age of aircraft is only about one-half as important as cost
in its influence on the number of local hours flown decision.
Comparing Figures 2-7 and 2-6 quickly shows the variation in
the relative importance of the factors for each of the different
I types of hours flown. Hourly operating cost is significantly
more important relative to family income (11 to 1 ratio) in
the local hours decisions than it is in the itinerant hours
decision (17 to 6 ratio) . These differences in relative
importance appear to reflect the distinguishing characteristics
of each of the two types of hours flown. That is, the defini-
tion of local hours primarily suggests a pure pleasure flight
of relatively short duration with highly discretionary trip costs.
The definition of itinerant hours suggests a purposeful trans-
portation flight of longer duration entailing a certain minimum
trip cost. Since most local hours are primarly for pleasure
flight, costs should be more important than for purposeful
transportation. Alternatively, since the amount of time spent
27
29
K 119
5
Annual Hourly Manufactured Personal I nstructionalFamily Operating Pre-1960 Use UseIncome Cost
Figure 2-7
RELATIVE IMPORTANCE OF KEY FACTORS INLOCAL HOURS FLOWN DECISION
28
-. %Mk - adf.

in local flying is core discretionary than it is for itinerant
flying, the income ability to purchase larger discrete bundles
of hours (time from origin to destination) becomes more important
in the itinerant hours purchase decision.
2.3.4 INSTRUMENT HOURS FLOWN
As used in this study, instrument hours form one of the two
components (the other is visual hours, see following section)
of itinerant hours. In addition to satisfying the reqtuirement
for itinerant flight (origin different than its destination),
instrument hours require that the time spent in flight he
under the control (i.e., periodic reporting of altitude
and location) of an FAA. facility. This entails certain
on-board avionics (e.g., two-way radio conunications
system and certain navigation equipment). Since instrument
hours are the most sophisticated flight procedural level,
equipage with an ADF did not serve well to differentiate
among GA owners flying especially high or low numbers of
instrument hours. Thus for instrument hours only, equip-
age with an altitude encoding transponder is used to
differentiate among owners flying at the most sophisticated
flight procedural level. Equipage with this type of avionics,
required for high altitude flights (18,000 feet and above)
* and in airspace around most major cities, suggests a high
number of instrument hours flown.
29

Figure 2-8 illustrates the relative importance of key factors
in determining the number of instrument hours flown. This
figure shows that family income, hourly operating cost, and
avionics equipage are about equally important in the instru-
ment hours flown decision. Age of aircraft and personal use
are considerably less important .than any of the other factors.
Compared to the relative importance of cost to income for the
other hours flown categories, the results for instrument hours
are quite unique. That is, for itinerant hours operating cost
is about three times more important than family income, for
total hours it is twice as important, and for local hours it
is eleven times more important in the hours flown decision.
However, in the instrument hours flown decision cost and
income are approximately of equal importance. The large
weight obtained by income in the instrument hours decision
may be due to the fact that the cost of instrument hours,
given the minimum trip length cost requirement and the
additional and not insignificant cost required for sophisti-
cated avionics, are relatively more expensive than other types
of hours flown. The average hourly operating costs, across
all characteristics of the study subsample, for each type of
hours flown are presented in Figure 2-9. This figure adds
credence to the above contention, showing that, on average,
instrument hours are significantly more expensive than any
other type of hours flown. Further, the results presented
in Figure 2-8 suggest that as the cost of flying takes a
30
OIL.p. **. *NEW

1615 15
76
Annual Hourly Manufactured Personal AvionicsFamily Operating Pre-1960 UseIncome Cost
Figure 2-8
RELATIVE IMPORTANCE OF KEY FACTORS ININSTRUMENT HOURS FLOWN DECISION
31
I

Dollars
$25
$17 $17 no $17
Total Itinerant Local Instrument Visual
Type of Hour Flown
Figure 2-9
AVERAGE HOURLY OPERATING COST BYTYPE OF HOURS FLOWN
32
lop,.
* ~ *.-AWL---
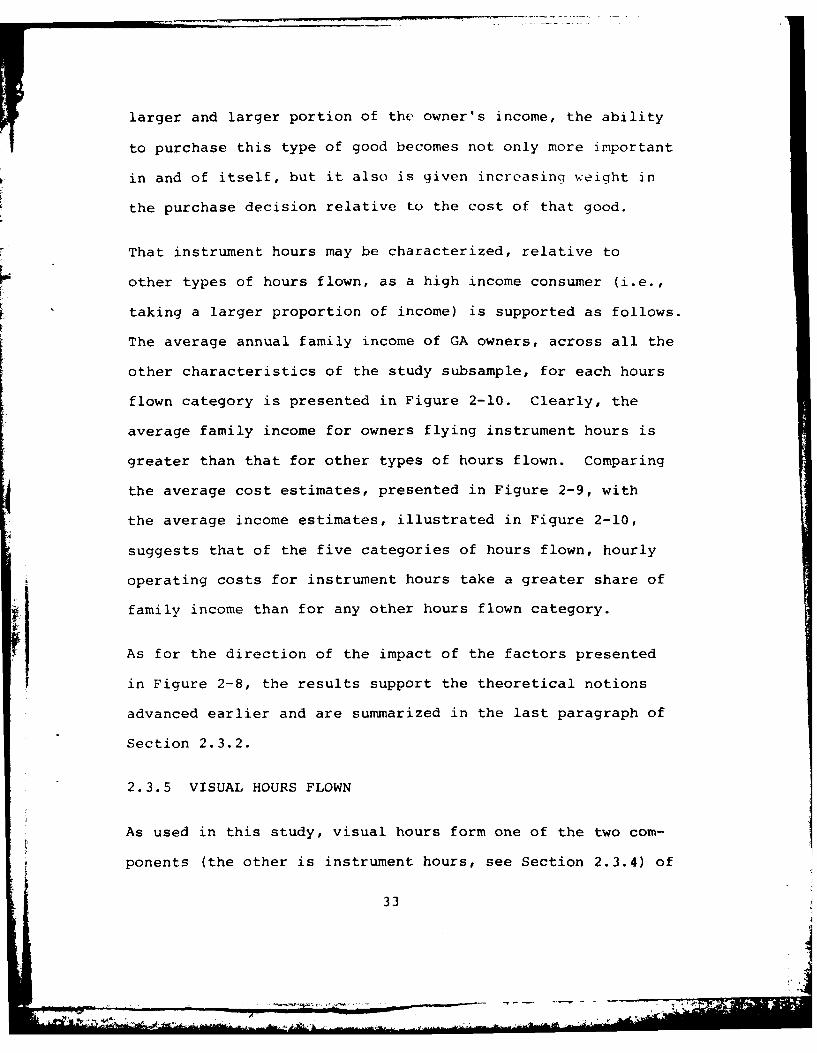
larger and larger portion of the owner's income, the ability
to purchase this type of good becomes not only more important
in and of itself, but it also is given increasing weight in
the purchase decision relative to the cost of that good.
That instrument hours may be characterized, relative to
other types of hours flown, as a high income consumer (i.e.,
taking a larger proportion of income) is supported as follows.
The average annual family income of GA owners, across all the
other characteristics of the study subsample, for each hours
flown category is presented in Figure 2-10. Clearly, the
average family income for owners flying instrument hours is
greater than that for other types of hours flown. Comparing
the average cost estimates, presented in Figure 2-9, with
the average income estimates, illustrated in Figure 2-10,
suggests that of the five categories of hours flown, hourly
operating costs for instrument hours take a greater share of
family income than for any other hours flown category.
As for the direction of the impact of the factors presented
in Figure 2-8, the results support the theoretical notions
advanced earlier and are summarized in the last paragraph of
Section 2.3.2.
2.3.5 VISUAL HOURS FLOWN
As used in this study, visual hours form one of the two com-
ponents (the other is instrument hours, see Section 2.3.4) of
33

Dollars
$34,541
$24,580$23,849 $2W0 -- $24,103
-~-p
Tota It ea _oa _ srmt VsaTyp ofouFow
Figur 2 1
BYTYPE OF HOURS FLOWN
34
k ~-AA

itinerant hours. In addition to satisfying the requirements
for itinerant flight (origin different from its destination),
visual hours do not require periodic reporting to an FAA
facility. Although visual hours require certain minimum
avionics equipage, the instrumentation requirements are less
stringent than for instrument hours.
Figure 2-11 il1~astrates the relative importance of key factors
in determining the number of visual hours flown. This figure
shows that personal use and avionics (ADF) equipage share
equally the most important place in the visual hours flown
decision. The next most important factor is hourly operating
cost, followed by age of the aircraft. Family income and
availability of air carrier service are relatively less impor-
tant than the other factors shown. The result that income is
considerably less important, relative to operating cost, in
the visual hours flown decision is similar to the results
obtained for all other categories of hours flown except
instrument hours. Results regardi.ng the direction of the
impact of the factors, presented in Figure 2-11, on visual
hours flown are identical to those presented for itinerant
hours and are adequately summarized in Section 2.3.2.
2.4 DEGREE OF SENSITIVITY
While the preceding sections have focused largely on pointing
out which factors are important, and why, in the hours flown
I3

19 19
13
..... ....... x , N x
4
3"" -...
.
Annual Hourly Manufactured Personal Avionics Air CarrierFamily Operating Pre-1960 Use ServiceIncome Cost
Figure 2-11
RELATIVE IMPORTANCE OF KEY FACTORS INVISUAL HOURS FLOWN DECISION
36
-i . i
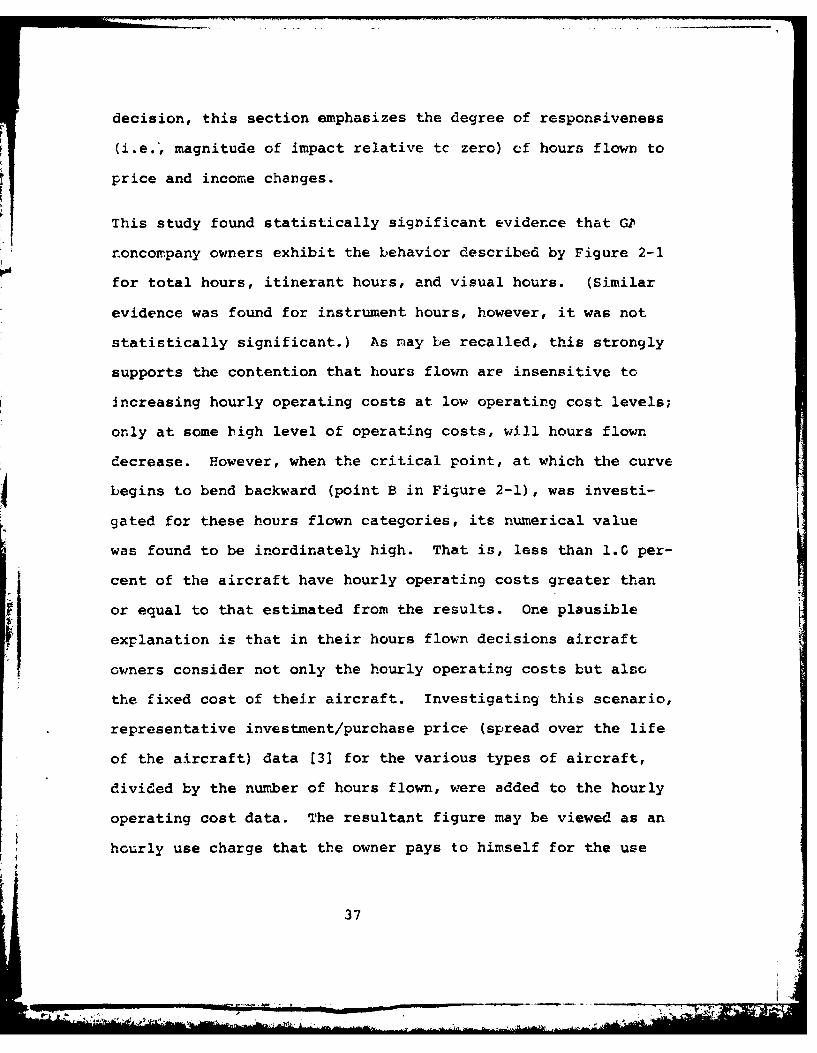
"decision, this section emphasizes the degree of responsiveness
(i.e.', magnitude of impact relative tc zero) cf hours flown to
price and income changes.
This study found statistically significant evidence that GP~
roncompany owners exhibit the behavior described by Figure 2-1
for total hours, itinerant hours, and visual hours. (Similar
evidence was found for instrument hours, however, it was not
statistically significant.) AS may be recalled, this strongly
supports the contention that hours flown are insensitive to
increasing hourly operating costs at low operating cost levels;
only at some high level of operating costs, will hours flown
decrease. However, when the critical point, at which the curve
begins to bend backward (point B in Figure 2-1), was investi-
gated for these hours flown categories, its numericalvau
was found to be inordinately high. That is, less than 1.C per-
cent of the aircraft have hourly operating costs greater than
or equal to that estimated from the results. one plausible
explanation is that in their hours flown decisions aircraftowners consider not only the hourly operating costs but also
the fixed cost of their aircraft. Investigating this scenario,
representative investment/purchase price (spread over the life
of the aircraft) data [3] for the various types of aircraft,
divided by the number of hours flown, were added to the hourly
operating cost data. The resultant figure may be viewed as an
hourly use charge that the owner pays to himself for the use
37

of his aircraft. It is conceptually equivalent to the gain
that he would realize if he had rented the plane rather than
using it himself. The results of comparing the computed hourly
use charge with the critical value showed a high degree of
similarity for the three categories of hours flown where
statistically significant evidence of backward bendingness
occurred. This suggests that owners decrease hours flown
approximately at the same point at which the price of an
additional hour equals the total hourly cost (operating plus
annualized fixed) of flying. This is illustrated in Figure 2-12.
This figure shows the critical costs, above which hours flown
begin to decrease (equivalent to point B in Figure 2-1), and
the corresponding mean hourly use charge (in parenthesis).
Support for this type of consumption behavior has been found
in areas other than general aviation.
The results for local hours were considerably different. That
is, local hours decreased as operating costs increased over all
relevant levels of operating cost. The lack of a critical or
threshold value for local hours, may reflect the pleasure
use and highly discretionary nature of local hours.
Further investigations were conducted to determine the extent
of the responsiveness of hours flown to cost and income changes.
The customary way of measuring this "sensitivity" is to compute
the percentage change in hours flown in response to a one per-
cent change in price. A similar computation is performed for a
38

Dollars
Itinerant ($333)
Visual ($164)Total ($229)
$275
$211
$144
Hours Flown
t
Figure 2-12
CRITICAL OPERATING COST (AVERAGE USE CHARGE IN PARENTHESIS)ABOVE WHICH HOURS FLOWN DECREASE
39

one percent change in income. Economists call these estimates
the "price elasticity" and "income elasticity" of demand,
respectively. The results of these computations for the pres-
ent study are very interesting, not only for the magnitude of
the estimated elasticities themselves but also because of the
relationship between the income and price elasticities. First,
it should be pointed out that the computation for each category
of hours flown showed that GA noncompany owners' hours flown
decisions are not very sensitive to family income changes. That
is, while hours flown increase as income increases, they do not
increase in the same proportion. The results show that if
income increases by 1.0 percent, hours flown increase by a
significantly lesser amount (on average by about 0.10 percent).
Second, similar results are obtained for the sensitivity of
hours flown to hourly operating costs (on average, hours flown
decrease by 0.29 percent in response to a 1.0 percent increase
in costs). In contrast, two fairly recent studies, one using
income of the population for a specific geographical area [1],
another using income for the U.S. population [4], found that
GA owners' acti'ity increases by a greater percentage than the
percentage change in income. The latter findings imply that GA
flying would be classified as a luxury good. That is, a good
consumed which is not considered essential and is therefore
rather quickly sacrificed if income decreases. The principal
difference between the two studies cited above and the research
results presented in this chapter is that the present study is
40

2. ;.w on data specific to the CA community. The lack of researcn
bastd on GA specific data has been a co nspicuous void until the
present study. Thus, contraiy to other studies, the results
presented in this chapter imply that GA owners consider their
flying hours a necessity good--a good which they are willing
to give up grudgingly and only after large changes in income.
Further evidence to support this result is obtained by comparing
the magnitudes of the changes in flying hours in response to
changes in income with the hours flown response to changes in
prices. That is, this study found that for each category of
hours flown, the hours flown response to changes in prices is
significantly greater (on average at least twice as great)
than the response to equivalent percentage changes in income.
T-is is considered strong evidence by many economist [6] that
the good in question (hours flown) is a necessity. If it were
a luxury good, the opposite relationship would hold. Thus, in
general, the results suggest that while the GA community acts
in accordance with conventional economic theory (i.e., increas-
ing hours flown in response to increases in income and decreasing
hours flown as costs increase), they are strongly committed to
their flying activities. Hours flown are curtailed only
grudgingly in response to changes in price and income.
2.5 CONCLUSIONS
This chapter has focused almost exclusively on the impact of
changes in noncompany owner's income and operating cost on
41
r b - .

hours flown. The results shows that the importance of these
factors in the hours flown decision varies with the type of
hours flown. While both factors are useful in explaining
hours flown decisions, operating cost appears to be more
powerful than owner's income in the decision hierarchy. For
total hours flown, operating cost is twice as important as
income; for itinerant hours it is three times more important;
and for local hours it is eleven times more important. However,
disaggregating itinerant hours into its components show that
income and operating cost are equally powerful in the instrument
hours flown decision. In the other component of itinerant hours,
visual hours, operating cost is over three times more important
than income. An interesting point to note is that the impact
of income and cost in the two aggregate hours flown categories
(i.e., total and itinerant hours) is not simply a straightfor-
ward summation or average of their respective impacts in the
components of these aggregate categories. This is because,
when, for example, itinerant and local hours are added to form
total hours, the two distributions are combined. To the extent
that either or both of these distributions are excessively
skewed and dissimilar, the results will correspondingly be
unpredictable. That is, to properly ascertain the impact of
cost and income on hours flown, the various hours flown categories
must be considered separately. The impact of cost or income
exhibited for total hours cannot be used as representative of
their respective impacts for either local or itinerant hours.
42

Nor can their itineranL hours results be used to reduce their
separate impacts in either instrument or visual hours.
Investigating the sensitivity of hours flown to income and
operating cost revealed strong evidence supporting the conten-
tion that hours flown are insensitive to increasing hourly
operating cost at low operating cost levels; only at some
high level of operating cost will hours flown decrease. GA
aircraft owners decrease hours flown approximately at the same
point at which the price of an additional hour flown equals
total hourly cost. That is, the GA aircraft owner appear to
act as if he were renting the plane to himself, thus he
considers both his initial purchase price of the aircraft
and operating costs in deciding at what point prices have
become high enough to curtail hours flown. Further, this
study found strong evidence that GA aircraft owners are
firmly committed to their flying activities. Contrarily,
other studies, which did not use data specific to the GA
community, conclude that GA flying is a luxury good--an extra
or a good which is not considered essential and quickly
sacrificed. This study, based on data specific to the GA
community, finds that GA aircraft owners consider their
flying activities a necessity--hours flown are given up
only grudgingly in response to changes in price and income.
43
.- 7

CHAPTER 2 REFERENCES
1. Baxter, N.D. and Ilowrety, E.P. "The Determinants ofGeneral Aviation Activity: A Cross-Sectional Analvsis,"Transportation Research, Ii (March 1968), 73-81.
2. Federal Aviation Administration, Office of Aviation PolicyAviation Forecasts Fiscal Years 1978-1989. Springfield,Virginia: National Technical Information Service, 1977.
3. Federal Aviation Administration, Office of AviationPolicy, Selected Statistics United States General Aviation1959-1975. Springfield, Virginia: National TechnicalInformation Service, 1976.
4. Urban Systems Research & Engineering, Inc. Models forAviation Activity Forecasting. Report prepared forDepartment of Transportation, Federal Aviation Adminis-tration, June 1975. Cambridge, Mass.: Urban Systems &Engineering, Inc., 1975.
5. Vahovich, S.G. General Aviation: Aircraft Owner & Utili-zation Characteristics. Springfield Virginia: NationalTechnical Information Service, 1977.
6. Wold, H. Demand Analysis. New York: John Wiley & Sons,Inc., 1953.
44

CHAPTER 3 HOURS FLOWN BY COMPANY AND NONCOMPANY OWIERS
3.1 PURPOSE OF STUDY
While Chapter 2 focused almost exclusively on an analysis of
the impact of cost and income changes on noncompany owners'
hours flown, Chapter 3 takes a much broader approach. The
broadened approach involves three areas--a detailed discussion
of the importance of those factors considered only in a per-
functory fashion in Chapter 2; an alternative formulation of
the hours flown problem based on Chapter 2 results; and expand-
ing the scope of the hours flown analysis to include company
as well as noncompany owners of GA aircraft. Thus while
building on Chapter 2 results, the present study represents a
major departure from the previous chapter in two important
respects. First, a qualitative departure is noted in the
formulation of the problem in that the cost and income factors
for noncompany owners are replaced by an aircraft productivity
factor and a relative income factor. Second, a quantitative
departure is noted in that the scope of the present study
includes both company and noncompany owners of GA aircraft.
Thus, the purpose of Chapter 3 is to present additional infor-
mation on hours flown decisions, via the alternative formulation
of the problem and the detailed evaluation of the importance
of each factor, and to assess and compare the structure of
company and noncompany owners' hours flown decisions.
45
-4

For the reasons stated in Chapter 2 (Section 2.2), the present
study includes only fixed wing aircraft, flying some positive
number of hours, and excludes twin/multiple-engine piston air-
craft weighing over 12,500 lbs. The factors examined in this
chapter may be grouped into four major categories: an income
measure, an aircraft productivity indicator, age of aircraft,
and owner's type of use of his aircraft. For noncompany owners,
the income measure consists of annual family income divided by
aircraft operating costs. The income measure for company owmers
is profits. As in Chapter 2, all monetary variables have been
deflated by a regional price index. For both company and
noncompany owners, aircraft productivity is measured in seat-
miles per hour. Two separate factors are used to measure the
importance of aircraft age in both the company and noncompany
owners' hours flown decisions, and four primary use categories
are employed to gauge the importance of owners' type of use
in explaining changes in hours flown. Similar, to the previous
chapter, an avionics factor is included to measure the impact
of the level cf aeronautical sophistication. Each of these
factors will be discussed in detail in the following sections.
3.2 FACTORS INFLUENCING HOURS FLOWN
The following discussion serves to acquaint the reader with
some of the characteristics of the noncompany owners included
in the study. Figures 3-1 through 3-3 present some of the
characteristics of the study sample utilized for the company
46
' s ."" ' .... . . , : :> -L .. ,X ,,: ... , . ._60=,,.LI: -

TJ, 2.7% OTH. 0.1%
TEP, SEP,
21.0% 25.1%
SEP 4+,47.7%
2,429TOTAL AIRCRAFT
LEGEND:SEP - Single-Engine Piston (1-3 seats) TP - TurbopropSEP 4+ - Single-Engine Piston (4 or more seats) TJ - TurbojetTEP - Twin-Engine Piston (under 12,500 lbs.) OTH - Other
Figure 3-1
PERCENT DISTRIBUTION OF AIRCRAFT BY TYPE OF AIRCRAFT
47

owner analysis. The percentages exhibited i~n these figures
mtay be compared with those given in the comparable figures
for noncompany owners presented in Chapter 2. Rememrber that
tI~e total values presented in the pie-charts (total aircraft
in Figure 3-1 and total users in Figure 3-2) represent the
number of observations in the sample used in the analysis,
not the number in the total fleet. Figure 3-1 shows the
distribution of company owned aircraft by type of aircraft.
This figure shows that the company owner is much more likely
to own a single-engine piston (4 or more seats) aircraft
(47.7 percent) than any other type of aircraft. The next most
popular aircraft types are the small single-engine pistons
(25.1 percent), twin-engine pistons (21.0 percent), turboprops
(3.4 percent), and turbojets (2.7 percent). The "other"
category, comprising a small percentage (0.1 percent) of
company owned aircraft, represent jets with other than two
engines. Compared with Figure 2-2 for noncompany owners,
the most striking difference evident in rigure 3-1 is the
much larger representation of turboprop and turbojet aircraft
in the company owner fleet. Compared to roncompany owners,
this difference probably reflects a multitude of influences.
Among these may be included, the greater financial resources
available to companies to purchase the more costly aircraft,
companies' greater emphasis on reducing nonproductive travel
timie, and their desire to reach out further in order to broaden
the potential market base. Figure 3-2 shows the composition of
the company owners according to primary use category.
48

INDUST, 1.3%
2XE29
TOTAL USERRENT, 5.6 LEGEND
EXEC 5. xcui4%T-i Tx
AEELRIeraAApLato,0H- teINSTRTR - nsrutina
249
TOTAL-------------------------------

Whereas noncompany owners (see Figure 2-3) have the largest
concentration of users in the personal use category (3.3 percent),
Figure 3-2 shows that business use is by far the most popular
company owner use category (33.9 percent), followed by personal
use (18.4 percent). While the personal users' share of the
total is lower for company owners, relative to noncompany
owners, the share of total use accounted for by the "for-hire"
user categories (instructional, rental, and air taxi) is
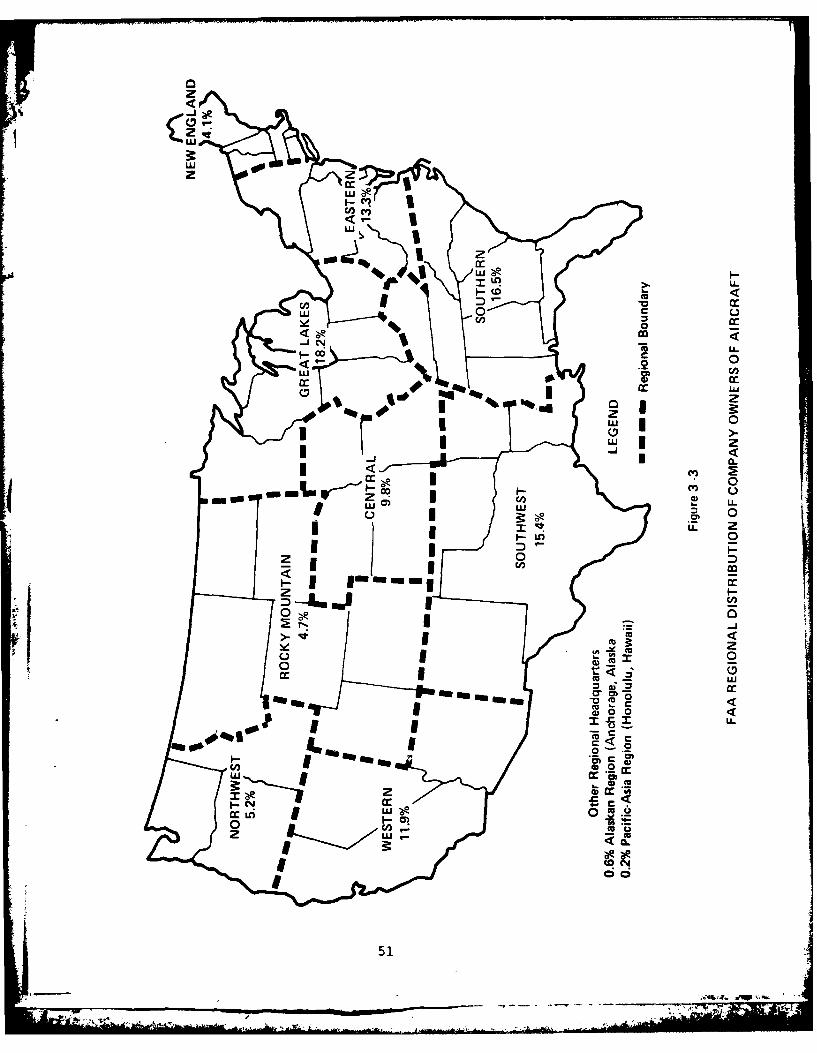
significantly higher for company owners. Finally, Figure 3-3
shows the regional distribution of company owners of GA air-
craft. This figure shows that the largest concentration of
company owners occurs in the Great Lakes Region (18.2 percent),
followed closely by the Southern Region (16.5 percent). Compared
to noncompany owners (Figure 2-4), the distribution for company
owners, presented in Figure 3-3, appears to have a slightly
larger representation of owners in the three East Coast
Regions. This probably reflects the large concentration of
manufacturing and financial institutions in this area.
Correspondingly, noncompany owners have a somewhat larger
representation of owners in the two West Coast Regions.
The bulk of the remainder of this section deals with the
reasoning that supports the inclusion of each of the factors
in the company and noncompany owners hours flown analysis.
Since this chapter undertakes a detailed examination of a
relatively large number of factors, such discussion will help
the reader to understand the results presented in Section 3.3.
50
z
CV)"
L0L
w~ 0
040co-
.2 0
I zI
uj 0
0
C/) LL
n 0).
-Amu0a
00
cc 51

First, it provides the reader with an explanation of the
researcher's logic; second, it gives the reader insights into
the researcher's expectations as to the direction (positive
or negative) of iripact of the factors used in the analysis.
In the actual research, this theoretical reasoning is carried
out prior to the inclusion of each factor in the computerized.
multiple regression "run." Such theoretical reasoning or logic
justification may be conducted for a larger group of factors
than those which are included in the final analysis. The
preliminary computer run of the regression model, and the
resulting statistics which are generated from this process,
represent a mathematical test of the theoretical reasoning set
down by the researcher. (A more extensive but also simplifiedf explanation of the modeling and testing process is presented
in [1].) In this preliminary stage of model testing, results
obtained for some factors, for one reason or another, may be
contrary to the theoretical expectations (implying that the
reasoning is oversimplified or otherwise faulty), or the
results may confirm the theoretica. expectations. From, among
the latter group, a set of factors is selected which cooperate
well together to accomplish the overall objective of solving
the problem at hand--i.e., explain GA owners' hours flown
decisions.
Caution should be exercised should the reader choose to ignore
the remainder of the discussion presented in this section
because the results presented in Figures 3-4 through 3-8
52

emphasize the relative importance of the factor in hours
flown decisions and not the direction (positive or negative)
of the impact. However, a brief summary of the direction of
impact is provided at the beginning of Section 3.3.
The income measure for company owners of GA aircraft is
profits. As profits increase it may be expected that
companies will attempt to expand the geographical scope
of their markets. To sell more, companies must reach out
further in order to broaden the potential market base.
Since privately owned GA aircraft allow maximum flexibility
in arranging travel schedules and provide access to relatively
large market areas, some of which may not be easily accessible
I by commercial air transportation, increasing profits are
expected to be associated with increasing hours flown. More
specifically, this study uses the change in before tax cor-
porate profits between 1974 and 1973 [31 to measure the impact
of increased profits on hours flown. The results from several
trial computer runs showed that the change in profits factor
explained more about the number of hours flown by aircraft
owners than profits per se, and further this factor explained
aspects of the hours flown decision not explained by any of
the other factors considered. Econometricians refer to the
latter characteristic as the degree of independence of the
predicting variable, and if not satisfied it leads to multi-
collinearity problems which cause spurious and misleading
results to be obtained in either or both the direction and
magnitude of impact of the variable.
53

The income measure used in the noncompany owner equation is
the ratio of annual income to operating costs. The use of
this relative income factor was suggested from the results
obtained in Chapter 2. Tt is expected that as this ratio
increases, hours flown will increase. That is, as costs
consume a smaller and smaller proportion of incom-e, the
owner will be better able to afford to fly his aircraft
and hence hours flown will increase.
Another factor considered in the hours flown analysis is
aircraft productivity. This factor is measured in seat miles
per hour, computed by type of aircraft as the product of average
cruising speed [21 and the typical number of seats [1]. Air-
craft owners are expected to get high utilization fromn those
aircraft with higher productivity because such aircraft can
carry a greater payload more rapidly than other aircraft, and
they are expensive to own and thus cannot be allowed to stand
idle.
While this argument is persuasive for itinerant hours flown,
its corollary is equally convincing for local hours flown.
That is, e:xpensive, high productivity aircraft are likely
to be inversely related to the number of local hours flown.
For example, results from an earlier study [5] show that
average turboprops fly eleven times more itinerant than
local hours, and turbojets fly thirty-eight times more
itinerant hours. Thus, as aircraft productivity increases,
local hours flown are expected to decrease.
54

As pointed out in Section 3.1, two factors are used coopera-
tively to measure the impact of aircraft age on hours flown.
The first factor accounts for the effect of ownership of
older aircraft, those manufactured between 1901 through 1959,
the other factor captures the impact of more recent vintage
aircraft, those manufactured between 1970 and 1975. Both
aircraft age groupings are compared against the category held
constant (aircraft manufactured between 1960 through 1969).
Ownership of the pre-1960 vintage aircraft, because of the
deleterious effect of age/use on performance and operating
condition, are expected to fly fewer hours. For the opposite
reason, aircraft of the post-1969 vintage are expected to
fly more hours.
In the study presented in Chapter 2, avionic equipage was
introduced as a factor which influenced hours flown decisions
in a positive direction. The present study also uses this
factor and the hypothesis supporting its expected impact is
the same as that proposed in Chapter 2--the GA owner has
achieved a level of proficiency over and above the minimum
level required or attained by other owners and has corres-
pondingly equipped his aircraft with the appropriate avionics.
Similar to Chapter 2, automatic direction finder equipage is
the preferred measure, because its function is indicative of
longer inter-city flights, for all but instrument hours flown.
55
__ L
- - - -- - - -- - -

For the latter hours flown category, equipage with altitude
encoding transponder is the measure of the level of aeronau-
tical sophistication (see Section 2.3.4).
The final group of factors relate to the manner in which the
owner uses his aircraft. Originally the sample data collected
information on owners classified by nine separate user groups.
However, because of the relatively few number of observations
in some user groups (see Figures 2-3 and 3-2) and based on
similarities among their activities, the nine user groups
were clustered into five categories.* Four different user
groups are compared against the business use category (i.e.,
the combined business and executive users). Fxcept for local
hours, business users may be expected to fly more hours than
personal and the combined aerial application and industrial/
special category (hereafter referre to simply as the industrial
category). This is because business users are likely to incur
greater costs than either of these two user categories if they do
not reduce their executives' travel time. The costs incurred are
Both aerial application and industrial/special uses involvespecialized application of aircraft. The former primarilyfor crop dusting, the latter for such uses as survey work,advertising, etc. Miscellaneous users were also includedin this category. Business and executive uses share thefunction of transporting employees and/or property of theorganization. The primary difference is that the latteremploys a professional pilot. In air taxi and rental usesthe owner places his aircraft up for hire, neither maintainsa regular schedule, and charges are made on an hourly basis.The primary difference is that a rental may be either "wet"(with pilot) or "dry" (no pilot), whereas air taxi alwaysincludes a pilot.
56

direct--i.e., the length of time in travel--and indirect--i.e.,
the money which the executives could earn if they performed an
alternative productive function rather than travel. The latter
is referred to by economists as the opportunity cost. On the
other hand, the instructional dnd combined air taxi and rental
categories (hereafter referred to simply as the rental category)
use their aircraft in direct revenue generating activities.
Thus, compared -to business users where reduced consumption of
hours flown is only partially reflected (via the executive's
contribution) in reduced revenues, the instructional and rental
categories realize the full monetary impact of reduced utiliza-
tion rates on their revenues. For this reason, and because the
incentive for the latter two user groups to maintain higher
utilization rates is not expected to change qualitatively (i.e.,
the direction of impact) with the type of hours flown, these
user groups are expected to have a positive impact for all
categories of hours flown.
Because of the nature of local hours, the rationale support-
ing the expected direction of impact for the personal and
industrial users is different than that for the other types
of hours flown. Local hours, having the same origin and
destination, are generally associated with the "pure" pleasure
of flight experience and with certain productive activities.
Since, at best, local hours may be considered incidental to
the business use of aircraft, personal users and industrial
users are expected to fly more local hours than business users.
57

That is, personal users may at least derive a certain level
of satisfaction from recreational flying, and most industrial
uses (e.g., crop dusting, survey work, pipeline patrol) are
compatible with local hours.
3.3 IMPORTANCE OF FACTORS IN THE HOURS FLOWN DECISION
The results obtained for the direction of impact of each factor
on the five different hours flown measures are summarized in
Table 3-A. In brief, the multiple regression results obtained
in the hours flown analysis support the expectations advanced
in the preceding section. That is, all categories of hours
flown increase with increases in the income measure and produc-
tivity. The exception, if local hours where, as hypothesized,
hours flown is inversely related to productivity. A~ll user
categories fly more local hours than business users. Thus, all
user group factors have a positive impact on local hours flown.
Personal use has a negative impact on total, itinerant, instru-
went, and visual hours--as hypothesized, this user group flies
fewer of these type of hours than business users. on the other
hand, the instructional and rental categories fly more of each
of the latter type of hours than business users (i.e., positive
impact). The industrial category has a negative impact on the
itinerant, instrument, and visual hours flown decision, but a
positive impact on total hours flown. The latter is attributed
to the large positive impact of the local hours component of
total hours flown--i.e., the activities of this user category
are highly compatible with local flying.
58

TABLE 3-A DIRECTION OF IMPACT OF FACTORS
ON HOURS FLOWN
Hours Flown Measures
Factors Total Itinerant Local Instrument Visual
Productivity + + - + +
Income + + + + +
Pre-1960 .....
Post-1960 + + + + +
Rental + + + + +
Industrial + - + -
Instructional + + + + +
Personal - - + -
Avionics + + N.A. + +
Key:-
+ indicates that the direction of impact is positive.
- indicates that the direction of impact is negative.
N.A. indicates that the factor has been omitted because of
irrelevance.
59
- 7it
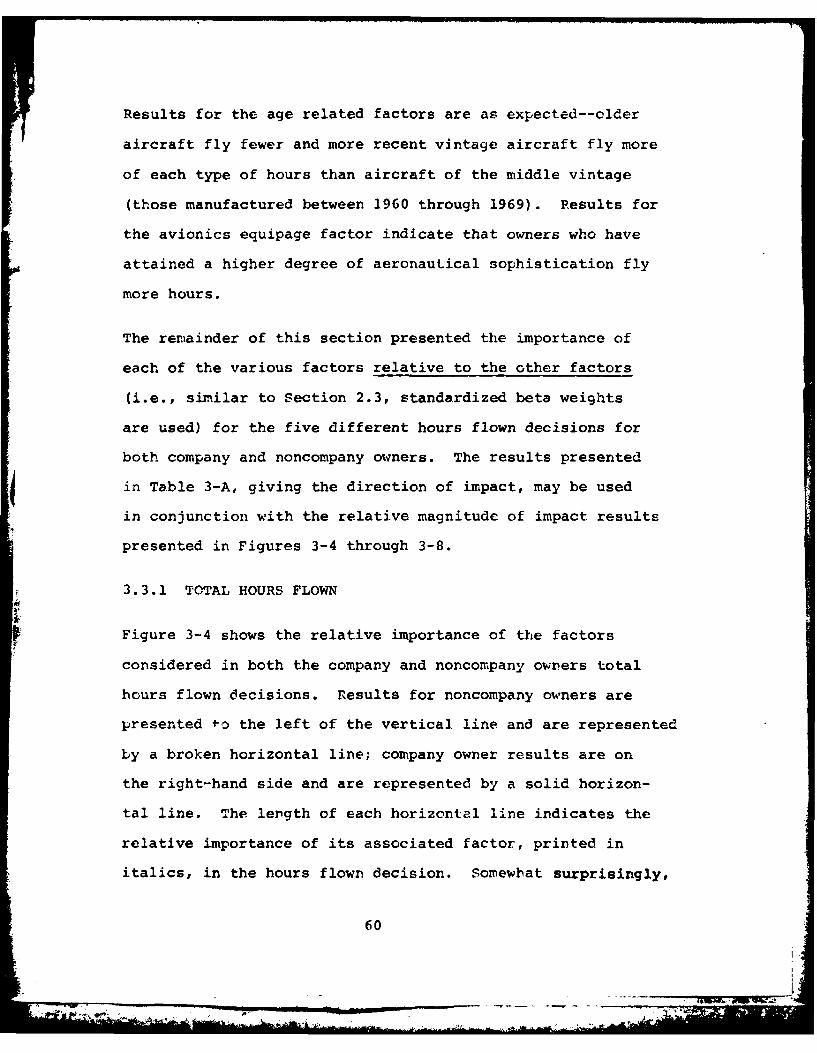
Results for the age related factors are as expected--cider
aircraft fly fewer and more recent vintage aircraft fly more
of each type of hours than aircraft of the middle vintage
(those manufactured between 1960 through 1969). Results for
the avionics equipage factor indicate that owners who have
attained a higher degree of aeronautical sophistication fly
more hours.
The remainder of this section presented the importance of
each of the various factors relative to the other factors
(i.e., similar to Section 2.3, standardized beta weights
are used) for the five different hours flown decisions for
both company and noncompany owners. The results presented
in Table 3-A, giving the direction of impact, may be used
in conjunction with the relative magnitude of impact results
presented in Figures 3-4 through 3-8.
3.3.1 TOTAL HOURS FLOWN
Figure 3-4 shows the relative importance of the factors
considered in both the company and noncompany owners total
hours flown decisions. Results for noncompany owners are
presented fo* the left of the vertical line and are represented
by a broken horizontal line; company owner results are on
the right-hand side and are represented by a solid horizon-
tal line. The length of each horizontal line indicates the
relative importance of its associated factor, printed in
italics, in the hours flown decision. Somiewhat surprisingly,
60

Noncompany Owners Comnpany Owners
Productivity11EEEI 16
Incoie *
Pre- 196014EEEUENE 17
Post- 1969
Rental
Industrial
Instructional15 30
Personal12EEOEE2
Avionics
EKEE
Figure 3 - 4
RELATIVE IMPORTANCE OF FACTORS IN TOTAL HOURS FLOWN DECISION
Two different income measures are used. Change in profits is used for company owners; income relative to
operating cost is used for noncompany owners.
61

Figure 3-4 shows that aircraft productivity is only the
fourth most important factor for each group of owners. ror
company owners, it is superseded in importance by instructional
use, by far the most important factor, rental use, and age of
aircraft (pre-1960 vintage). For noncompany owners, it is
preceded in importance by instructional use, age of aircraft
(pre-1960 vintage), and personal use. Femeirbering that com-
parisons of the numerical values are valid only within each
owner group (however, rank order comparisons are valid between
owner groups), the results presented in Figure 3-4 suggests
that company and noncompany owners evaluate the importance of
productivity equally in their respective total hours flown
decisions.
The importance of the income measure is alko evaluated quite
similarly in the company and noncompany owners"' -hours flown
decisions. The change in corporate profits is onef the
least important factors in the company owner total ho flown
decision. Apparently, company owner decisions are guided to
a much larger extent by factors such as owners' type of use,
age of aircraft (pre-1960 vintages), and productivity. A
similar statement applies to noncompany owners, where income
relative to cost is ranked next to last in importance.
Despite these similarities at the extremes of the company and
noncompany orderings, several differences between the respective
priority ordering may be noted. Company owners rank rental use
62
I .. .. . . . . ; U I .. . 1 I - ,-- -,W-

as the second most important factor while noncompany owners
relegate this factor to the fourth most important position.
Another significant discrepancy between the orderings is the
importance of the personal use factor. Noncompany owners
consider this factor as third most important while it is next.
to last in importance in company owner hours flown decisions.
Thus, in general, it may be stated that while certain similari-
ties exist for the company and noncompany owner decision struc-
ture, several significant differences exist in the hierarchical
ordering of the factors. rigure 3-4 also shows that the company
owner ranking is more definitive than that for noncompany owners.
For example, the most important factor in the company owner
decision ordering is one and one-half times more important than
the second, whereas only minor difference is noted for the
corresponding ordering for noncompany owners. That is, non-
company owners tend not to differentiate as acutely among the
factors.
Since total hours is comprised of two very different compon-
ents--itinerant and local hours, the following sections examine
each of these components separately. This analysis will focus
on the origin of the differences in the orderings exhibited in
and noncompany owners which may have been lost in the total hours
aggregation will be clarified.
3.2.2 ITINERANT HOURS FLOWN
Figure 3-5 presents the results for itinerant hours.
63

Noncompany Owners Company Owners
Productivity2010 S E E 1 25
In1comne5EU 2
Pre-196011 1E. ~3
Post- 19696 lME 2
Rental
Instructional310 7
17EE7EE1Personal
A vionics160 0 S E 15
Figure 3 -5
RELATIVE IMPORTANCE OF FACTORS IN ITINERANTHOURS FLOWN DECISION
Two different income measures are used. Change in profits is used for company owners; income relative tooperating cost is used for noncompany owners.
64

Clearly, aircraft productivity is by far the most important
factor for both company and noncompany owners in theii respective
itinerant hours flown decisions. Thus, for GA flying of a more
purposeful nature, productivity is a very important factor in the
untilization decision. This result is considerably different than
that obtained for total hours. At this point, it can be speculated
that the mediocre level of importance achieved by productivity
in the total hours equation can be attributed to its low level
of importance in the local hours equation. (The following sec-
tion presents results supporting this contention.) For company
owners, avionics equipage and rental use are the next most impor-
tant factors explaining itinerant hours flown decisions. In
contrast, noncompany owners rank rental use considerably lower
in importance than company owners. Further, the second most
important factor in the noncompany owners' itinerant hours
flown decision--the personal use factor--receives a much lower
priority in the company owner ordering. Thus, some of the
discrepancies between the orderings for the two owner groups
noted in the total hours analysis is also clearly visiable in
the itinerant hours analysis.
Contrary to the results obtained for total hours, instructional
use is not very important in explaining the number of itinerant
hours flown by either owner category. This can probably be
attributed to the fact that instructional activities are associ-
ated with both itinerant and local hours, although largely the
latter, and hence do not serve well to explain differences in
65

itinerant hours flown. As in the results for total hours, the
income measure for each owner group is considered very low in
the hierarchy of factors explaining the number of itinerant
hours flown. Apparently, either further research is required
to determine a more appropriate factor to measure the income
effect, or this factor may not have a large weight in hours
flown decisions.
As in the case of total hours, company and noncompany owners
exhibit some similarities in their itinerant hours rankings,
primarily at the extreme ends of their respective orderings;
otherwise, considerable differences exist in the preference
orderings of company and noncompany owners. As noted above,
at least some of these discrepancies are common to total
and itinerant hours and hence appear to stem from itinerant
rather than local hours (see the following section for
additional supporting analysis). Alternatively, the itin-
erant hours ordering for company and noncompany owners does
-' not explain the low level of importance accorded to instruc-
tional use in the total hours analysis, nor does it explain
the mediocre level of importance achieved by aircraft produc-
tivity in the total hours equation. Thus, the following
section turns to an examination of local hours in an attempt
to account for these results.
Finally, it may be noted that the company owner ordering for
itinerant hours does not, in general, exhibit the same degree
of decisiveness as in apparent in the total hours decision.
66
- ' n n - I

That is, except f9r the two highest ranked factors, where
company owner preferences are clearly more definitive, non-
company owners differentiate more acutely between the factors.
3.3.3 LOCAL HOURS FLOWN
Figure 3-6 shows the relative importance of factors in the
local hours flown decision. since local hours are primarily
associated with a pleasure flight of relatively short duration
and highly discretionary trip costs, it may be expected that
aircraft productivity and income are not likely to he the most
important factors in this type of hours flown decision. Tha~t
is shown in Figure 3-6. Aircraft productivity is ranked the
third most important factor in noncompany owners' decisions
I and it is the fifth most important factor for company owners.
Remembering, from Table 3-A, that the direction of impact of
this factor is negative for local hours, the relatively greater
emphasis placed on productivity by noncompany owners suggests
that the latter group of owners are less likely than company
owners to fly the more expensive aircraft in local hcurs. The
fact that instructional use is by far the most important factor
for both owner groups is n~ot surprising, since much pilot
training takes place with takeoffs and landings at the same
airport. The great emphasis placed on instructional use and the
low-emphasis placed on productivity by both owner groups in
their local hours decisions helps to explain the degree of
importance achieved by these factors in the total hours analysis.
67

Noncompany Owners Company Owners
Productivity
In comne
Pre- 196061N rE
Post- 1969
Rental1410EEEEE EI 24
Industrial2700MOMMMENN 7- 31
280IEENENE5
PersonalHEKEEN 20
Figure 3 - 6
RELATIVE IMPORTANCE OF FACTORS IN LOCAL HOURS FLOWN DECISION
Two different income measures are used. Change in profits is used for company owners; income relative tooperating cost is used for noncompany owners.
68

Personal use is commonly taken as the basis for
the classic image of GA as the one airport pure pleasure
sport. However, the result, that personal use receives a
relatively low priority in local hours flown decisions of
both owner groups (lower or equal to its priority for
itinerant hours), contradicts this classic image. The
fact that personal users do not concentrate their hours
flown in local hours (about 43 percent of total personal
use hours are local hours [5]) helps to account for the
resulting low priority of personal use. This result
suggests a more mature image of GA, including at least
equal emphasis on purposeful transportation. As may be
expected, the pre-1960 vintage factor receives significantly
less emphasis in the local hours decision than in itinerant
hours. That is, since local flights are of relatively short
duration, the effects of age/use do not weigh heavily i~n this
decision (see Figure 3-6); however, for the relatively longer
t inter-city flights, the operating condition of the aircraft
is an important consideration (see Figure 3-5).
In general, an overall comparison of the company and noncompany
local hours factor orderings reveals fewer differences than
ncted in the itinerant hours analysis. The top three factors
in the company owner hierarchy are the same as those for non-
company owners, and an identical statement can be made for the
three least Important factors. Perhaps the greatest difference
between the local hour company and noncompany orderings occurs

for the priority assigned to productivity. This implies that
most of the differences exhibited in the company and ncncompany
comparison for total hours ranking steu. from the itinerant hours
decision structure. The following sections further analyze the
origin of these difference exhibited in the itinerant hours
analysis by disaggregating the latter hours category into its
component parts--instrument and visual hours.
Contrary to the preceding hours analyses, the results presented
in Figure 3-6 suggest no clear determination as to which owner
group is more decisive in its local hours flowr decisions. At
the highest priority level company owner preferences are rore
explicit (the highest ranked factor is over one and one-half
times more important than the second highest); at the next high-
est priority level noncompany owner preferences are more explicitly
(the second highest ranked factor is almost twice as important
as the third highest).
3.3.4 INSTRUMENT HOURS FLOWN
Instrument hours represent one of the two components (the
other is visual hours) forming itinerant hours. Figure 3-7
shows the relative importance of the factors in the instru-
ment hours flown decision. For both company and noncompany
owners, aircraft productivity is the most important factor.
This is especially true for company owners where productivity
is over three times more important than the second r1ost
important factor, rental use. Since this type of flight
70
______________

Noncompany Owners Company Owners
Produc tivity
18 lncomne* 411
Pre- 19608 IEEE 10
Post- 196910 8
Rental14 INEEE 13
Industrial500 10
Instructional510073
Personal
A vionics14 INNEEE2
Figure 3 - 7
RELATIVE IMPORTANCE OF FACTORS IN INSTRUMENTHOURS FLOWN DECISION
Two different income measures are used. Change in profits is used for company owners; income relative toI
operating cost is used f')r oncompany owners.
71

is generally at higher altitudes and of longer distances
per trip, the higher rank accorded productivity for both
owner groups is understandable. Jets and turboprops generally
pressurized and providing speedy transportation over long
distances are especially suited to this type of hours flown.
Further, the fact that instrument hours are likely tc entail
flying in and around major cities--the centers of commercial
and financial activities--helps to explain the dominant
position of productivity relative to the other factors in
the company owner results (business use is by far the largest
single use category among company owners, see Figure 3-2).
The great emphasis placed on productivity by both owner
groups in their instrument hours decisions concurs with the
results obtained for itinerant hours. As shown in the next
section, the owners' evaluation of productivity for visual
hours is somewhat more mixed. Thus, the high rank accorded
to productivity in the itinerant hours analysis may be attri-
buted primarily to its instrument hours component.
rigure 3-7 also shows that for noncompany owners, income
relative tc cost is the third most important factor in the
instrument hours decision. In Chapter 2 the contention
was advanced that as cost takes a larger and larger proportion
of income, hours flown would decrease--i.e., a positive
relationship between the income to cost ratio and hours
flown because they move in the same direction. while
the results presented in Table 3-A support this hypothesis
for all categoires of hours flown, the results presented
72
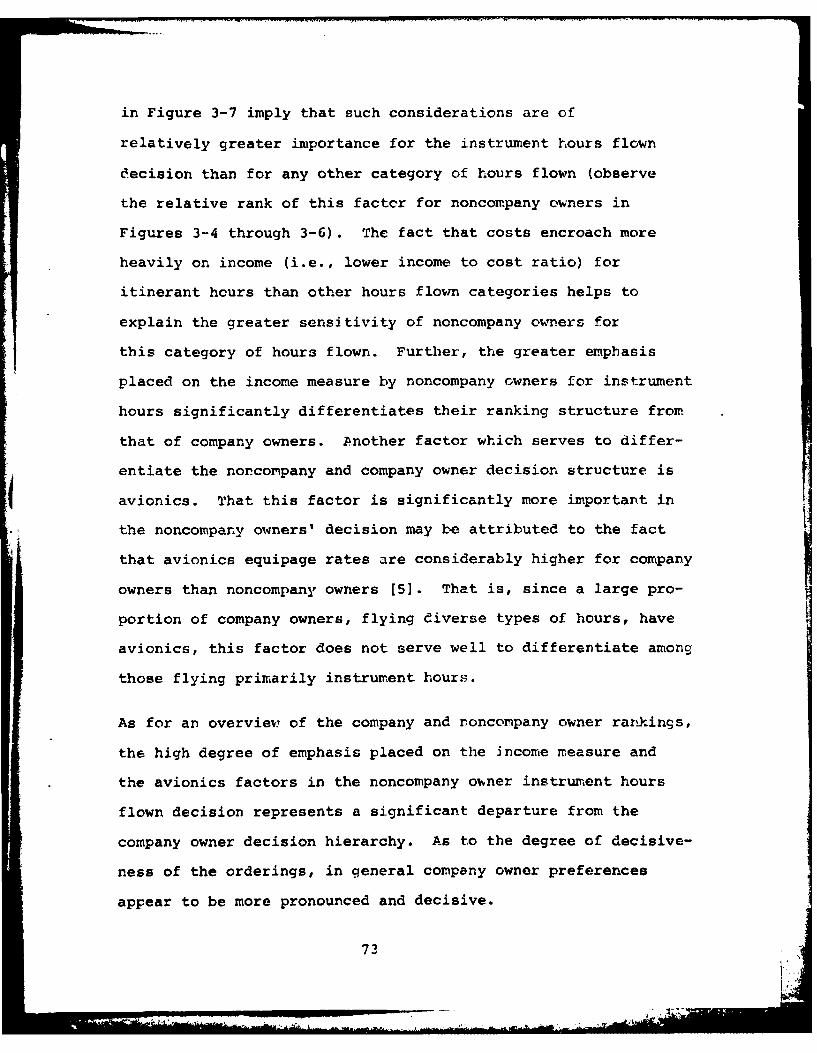
in Figure 3-7 imply that such considerations are of
relatively greater importance for the instrument hours flown
decision than for any other category of hours flown (observe
the relative rank of this factor for noncompany owners in
Figures 3-4 through 3-6). The fact that costs encroach more
heavily on income (i.e., lower income to cost ratio) for
itinerant hours than other hours flown categories helps to
explain the greater sensitivity of noncompany owners for
this category of hours flown. Further, the greater emphasis
placed on the income measure by noncompany owners for instrument
hours significantly differentiates their ranking structure from
that of company owners. Pnother factor which serves to differ-
entiate the noncompany and company owner decision structure is
avionics. That this factor is significantly more important in
the noncompany owners' decision may be attributed to the fact
that avionics equipage rates are considerably higher for company
owners than noncompany owners [5]. That is, since a large pro-
portion of company owners, flying Civerse types of hours, have
avionics, this factor does not serve well to differentiate among
those flying primarily instrument hours.
As for an overview of the company and roncompany owner rankings,
the high degree of emphasis placed on the income measure and
the avionics factors in the noncompany ouner instrument hours
flown decision represents a significant departure from the
company owner decision hierarchy. As to the degree of decisive-
ness of the orderings, in general company owner preferences
appear to be more pronounced and decisive.
73

3.3.5 VISUAL HOURS FLOWN
Visual hours represent one of the two components (the other is
instrument hours) of itinerant hours. Figure 3-8 shows the
relative importance of the factor for both company and noncompany
owners in visual hours flown decisions. Of all the types of
hours flown examined, Figure 3-8 exhibits the greatest disparity
between company and noncompany owners' rankings. The difference
in emphasis placed on the factors in visual hours flown decisions
by the two groups of owners is at least partly attributable to
vastly different levels of concentration of their itinerant hours
in visual hours. The typical noncompany owner flies over seven
times more visual hours than instrument hours, whereas the typical
company owner flies only about three times as many visual hcurs
[5]. Given this disparity in concentration levels between the
two owner groups, it may be expected that the factor orderings
will differ significantly for the two owner groups and that the
preference ordering for the owner group which is most concentrat-
ed in visual hours will be more clearly defined. This is
reflected in Figure 3-8. Noncompany owners consider personal
use the most important factor and aircraft productivity a close
second. Results for company owners show that rental use is the
most important factor in visual hours flown decisions and three
factors (avionics, personal use, and pre-1960 vintage) share
equally the second most important place. For noncompany owners,
avionics is the third most important factor. The income measure
is the least important factor for both company and noncompany
owners. As pointed out above, in general, the noncompany
ordering is more decisive than that for company owners.
74

Noncompany Owners Company Owners
Productivity170EEEEWE7
Income*31M 3
Pre- 796010 1
Post- 1969F004Rental
500E 15
Industrial61UE8
Instructionll
Personal1800MMN
A vionics131u.000.00
Figure 3 -8
RELATIVE IMPORTANCE OF FACTORS IN VISUAL HOURS FLOWN DECISION
Two different income measures are used. Change in profits is used for company owners; income relative tooperating cost is used for noncompany owners.
75
.- 6

3.4 CONCLUSIONS
This chapter examined in detail the relative importance of
various factors in company and noncompany owner decisions for
five different %ours flown categories. With respect of the
factors per se, no single factor can be considered as dominant
in explaining either the company or noncompany owner hours
flown decisions across all categories of hours flown. The
relative importance of the factors vary considerably with
the type of hours flown. This irplies that the results obtained
for one category of hours flown cannot be generalized to cther
hours flown categories. This result supports the approach taken in
this chapter--separate hours flown analysis must be conducted
for each category of hours flown. This approach, while originally
adopted largely on intuitive justification related to the diverse
nature of each of the hours flown categories, is now supported by
sophisiticated econometric results.
With respect to comparisons of the owners' decision structure,
for each category of hours flown, considerable discrepancies
were noted when the company and noncompany owner rank orderings
of the factors were compared. That is, although the two owner
groups exhibited similarities in the extremes (highest and lowest)
of their respective factor rankings both for total hcurs and
itinerant hours, discrepancies between company and noncompany
owner rankings were the rule, not the exception, across all
76
.y

categories of hours flown. This result confirms earlier expec-
tations that company and noncompany owners assess their hours
flown decisions differently (i.e., in degree, but not in the
direction of factor impact). Given these nontrivial differences,
the two owner groups should be analyzed separately for each
category of hours flown.
In order to determine the extent to which the differences between
the company and noncompany owner orderings noted for the two
aggregate hours flown categories could be attributable exclusively
to one or the other of their components, an attempt was made to
trace the origin of the differences. Since the greatest degree
of similarity between the company and noncompany owner decision
structure occurred in local hours (where the three highest and
the three lowest ranked factors were the same for both owner
groups), most of the discrepancies evident in total hours could
be attributed to itinerant hours. However, when itinerant hours
was disaggregated into its components--instrument and visual
hours, the degree of discrepancy between the owner group rank-
ings quickly intensified. Little similarity was found between
company and noncompany owner rankings for instrument hours
and even less was noted for their respective visual hours
rankings. Thu3, the differences between the respective owner
group itinerant hour factor orderings is attributable to both
of its components. As for the similarities between company
and noncompany orderings for total and itinerant hours, when
the rank of a factor was approximately the same for both owner
77

groups, some success was achieved in tracing the origin of the
difference to its component hours category. The more the owner
ranks diverged for a particular factor, the more difficult/
complex the tracing process becomes.
The decision structure for each owner group was reviewed for its
level of decisiveness--i.e., the strength with which each owner
group differentiated among the factors in making their hours
flown decisions. In two hours flown categories, total and instru-
ment hours, company owners were more decisive. However, non-
company owners were more decisive in their itinerant and visual
hours decisions. In the case of local hours, no determination
could be made as to which owner group preference structure was
stronger.
As a final note, it must be reemphasized that this chapter
represents one, among several possible ways, of viewing the
hours flown problem. Although the factors selected for inclu-
sion were pretested and were determined to be more effective
than any other group of factors in explaining hours flown (and
at least as effective as those used in Chapter 2), further
research may reveal an even more powerful combination of factors.
However, regardless of later findings, the results reported in
this chapter are significant in that they provide each GA air-
craft owner important insights into the hours flown decision as
made by the entire GA community, and as viewed over a standard-
ized (i.e., same group of factors over different categories of
hours and different owner groups) and scientifically selected
78

group of factors. Further, the results point out basic struc-
tural differences among the various categories of hours flown
and between the owner groups. These scientifically tested and
proven heterogeneous properties are not likely to change (even
if a different set of factors are used) unless the CA covmunity
undergoes substantial structural change.
79
AMA

CHAPTER 3 REFERENCES
1. Battelle-Columbus Laboratories. General Aviation CostImpact Study, Volume IV: Data Base, prepared for theFederal Aviation Administration, June 1973.
2. Federal Aviation Administration, Aeronautical Center,Oklahoma City, Oklahoma, "Engine Manufacture and ModelReference File."
3. U.S. Department of Labor, Bureau of Labor Statistics,Survey of Current Business (July 1976 and July 1977).
4. Vahovich, S.X., "How to Forecast Aviation Activity Level,"in Aviation Forecasts Fiscal Years 1978-1989. Springfield,Virginia: National Technical Information Service, 1977.
5. Vahovich, S.C., General Aviation: Aircraft, Owner &Utilization Characteristics: Springfield, Virginia:National Technical Information Service, 1977.
80
17-
. *i-

PART II
ANALYSIS OF PURCHASERS OF
GENERAL AVIATION AIRCRAFT
AVIONICS
ii

CHAPTER 4 GENERAL AVIATION PURCHASERS OF AVIONICS
4.1 I11TRODUCTION
This chapter explores the factors that account for GA
purchases of aircraft communication and navigation
instrumentation (avionics). While the results presen~ted
in this chapter are highly informative to the individual
GA aircraft owner, they are at least of equal importance
to the FAA and the avionics manufacturing industry. This
is because FAA manpower staffing at Control Centers and
Towers and facility planning are highly dependent on
instrument operations, and the latter, in-turn, is depend-
ent on aircraft avionics equipage. Similarly, the infor-
mation presented in this chapter can be utilized to
establish a market profile of the demand for avionics.
Obviously, such information is valuable to avionics
manufacturers in planning sales strategies and arranging
production schedules. Eight separate types of avionics
are considered in the present chapter.
Technically speaking, the analytical technique employed in
this study-discriminant analysis--is quite different from
that employed in the previous chapters. For informational
purposes, discriminant analysis is the same technique that
is freque~ntly used to forecast national election results and
assess your credit eligibility rating when you apply for
81

7 AD-AOO I 6 FEDERAL AVIATION ADMINISTRATION WASHINGTON DC OFFICE -ETC F/S 1/2GENERAL AVIATIONS HOURS FLOWN AND AVIONICS PURCHASE DECISIONS.(U)MAY 78 S 6 VAHOVICH
UNCLASSIFIE.D FAA-AVP-78-9 "LhuhuuuuhuIIIhuIIIIIIIIIIIIIIl~lfllfIIIIIIIIIIIIIIffllfllf

iiii 2_.o11 I iI 111120
MICROCOPY RESOLUTION TEST CHART
NATIONAL BUREAU Of STANDARDS-1963-Il

credit cards. Since one of the objectives of this report
is to present the results obtained from such sophisticated
techniques in a manner that is understandable to all, the
reader need not be concerned with the technical ramifications.
Good technical explanations of the theoretical underpinings
of discriminant analysis are available elsewhere 11,3).
Ho-wever, since this technique may be unfamiliar even to
most researchers, and since a basic understanding of the
way in which the results are derived will greatly enhance
the meaningfulness of those results to the general reader,
the following simplified explanation is provided.
In brief, developing a combination of factors (aircraft
and owner characteristics) that differentiate or discriminate
optimally between the "have" and the "have-nots" is the
primary objective, virtue, and usefuless of discriminant
analysis. Two components are involved here. First, in
developing the final set of factors the researcher utilizes
his knowledge to select candidate factors that are backed
by sound reasoning (the methodology cannot manufacture
gold from straw), and the methodology provides statistical
tests which the researcher uses to evaluate the trial
results. The unique aspect of the methodology, per se,
is that given the factors it is asked to consider, it will
develop the best possible "system" (i.e., an equation
utilizing those factors) for discriminating between the
have and have-not groups--the system's discriminating
82

power is optimized. Second, the methodology uses this
system to make predictions about an individual's likely
group membership based only on his values for these factors.
The magnitude of the problem solved by the methodology is
illustrated by the following hypothetical example.
Suppose a hat contains 100 balls, 90 of which are red balls
and the rest are green balls. If the balls were drawn one-
by-one (and not seen until all the balls were drawn) and
each correct guess as to color drawn was worth $100, the
best strategy to get the most money would be to simply
always guess red. That way one would get $9,000. This
is defined as the pure chance rule. But suppose each
correct guess of a red ball is worth $100, each correct
guess of a green ball is worth $500, and a certain number
of the green balls had to be correctly guessed in order to
collect any money. As applied to this problem, the
discriminant analysis methodology would develop a red-green
prediction system based on the characteristics of the
balls--e.g., if they varied by size, texture, and weight--
so that the maximum number of both green and red balls are
correctly identified. This maximum would be limited by the
extent to which color varied regularly with the above named
characteristics of the balls. This example demonstrates the
complex problem faced in the analysis undertaken in this
chapter. That is, by analogy, there are two types of owners--
avionics equipped and nonequipped--corresponding to the two
83

different colored balls. Based on owners' characteristics/
factors (e.g., type of aircraft owned, aircraft's age, etc.),
the system must correctly identify not only those aircraft
owners who are equipped with avionics, but also the system
must correctly identify their counterparts who are not so
equipped. Further, since for many type of avionics the
group equipped with avionics is considerably smaller than
the nonequipped group (corresponding to the disproportionately
low number of green balls), the magnitude of the problem of
correctly identifying members of the smaller group increases
exponentially. The system must defy the odds by identifying
owners in the smaller group. How well the system achieves the
objective of correctly identifying members of both groups
is the very practical and acid test of its usefulness. Each
of the eight systems, one for each type of avionics, developed
in this chapter is judged against a nonarbitrary criterion
in order to determine how well it meets this objective.
The next section explains this criterion as well as the type
of results obtained from the methodology.
4.2 APPROACH
The results in a study of this nature are usually reported
in the form exhibited in Table 4-A. For the present study,
"Group 0" means the nonequipped group and "Group 1" is the
group equipped with the particular type of avionics in
question. Nol the number of owners in Group 0, is known fron
the results obtained on the CA survey-sample questionnaire.
84

PREDICTED
Group 0 Group 1
Group 0 nil n12 No
ACTUAL
Group 1 n21 n22 N1
N
Co C1
Table 4 - A
TYPICAL CLASSIFICATION MATRIX
85

N, is the number of owners in Group 1, and this number is
known from the questionnaire results. The sum' of No and N
is N--the total number of owners considered. nil and 4'2 2 each
represent what can loosely be called the number of "correct
guesses." If the have-not group (NO) is larger than the have
group (N1), then by analogy from the preceding section, n11
represents correctly guessing a red ball and n22 represents
* correctly guessing a green ball. (nll + nl2)/K is the overall
* proportion of correct guesses. The latter is a crucial number
and will be utilized extensively as a key result in the
* following section.
As explained in the preceding section, the guesses are
actually based on a system. Thus, the guesses might more
appropriately be called predictions. Each system developed
in the present study is based on the way the aircraft owner
uses his aircraft, the age of the aircraft, the type of
aircraft, and the number of itinerant hours flown. ResultsI from extensive pre-testing suggest that the have and have-not groups differ substantially from one another Ly these
characteristics or factors. However, no system is prefect.
In Table 4-A, n12 and n2l represent the number of incorrect
predictions. n12 represents the number of aircraft owners
who actually do not have the avionics device but who are
predicted by the system as having that device. a,21 is the
number of owners who are actually haves but are predicted
as have-nots. Then the column sums, represented by C0 and
86

C1 , represent the total number in each group predicted as
have-nots and haves, respectively. The number of correct
predictions in each column (i.e, nl] and n22) divided by
its respective column sum is the proportion of correct
predictions for that group. This is the second key result
that is extensively utilized in the following section.
While Table 4-A is an extremely useful tool to explain the
background for the results presented in the following
section, it may be too cumbersome for many readers. Thus,
further graphical simplification is undertaken in the
presentation of the results. Given the background pro-
vided in this section, that graphical presentaticn will
be mea'ingful to the reader.
A very important point to note in the approach taken in
this study is that only noncompany owners were used to
develop the system which differentiates between and pre-
dicts the equipped and nonequipped group members. Company
owners were not considered in this development phase of
the system. Once the system was developed, it was applied
to the heretofore unconsidered company owner data. The
theoretical necessity for conducting the analysis in this
manner is discussed elsewhere [2]. Intuitively, the reason-
ing is that the data that has been used to develop the
discriminating system cannot also be used to test that
system as to how well it discriminates arnong member of
87

that same data. The predictions obtained by applying the
system to the "fresh" company owner data are then evaluated
in the manner described below.
As mentioned briefly in the previous section, how well the
system distinguishes among the equipped and nonequipped
groups is not evaluated in an arbitrary fashion. That is,
the prediction results for the total (equipped and nonequipped
groups) and the equipped group obtained for company owners
are not simply compared against the corresponding results
for noncompany owners to see if they are about the same or
higher. The nonarbitrary test applied to judge if the system
is an effective discriminator between the avionics equipped
and nonequipped groups is the "pure chance" criterion.
The pure chance criterion values are obtained as follows.
The number of individuals actually having the avionics device
is divided by the total number of individuals considered,
yielding the pure chance expectation of correctly guessing a
member of the avionics equipped group. This computation gives
the appropriate pure chance criterion value against wbich to
judge the company owner system generated prediction result for
the avionics equipped group. This, however, is only a partial
result, since it concerns only one component group of the total,
and its usefulness by itself is discussed later (subsection 4.3.5).
Dividing the number of nonequipped individuals by the total
number of individuals yields the pure chance expectation of
88

correctly guessing a member of the nonequipped group. The
appropriate pure chance criterion value against which to
judge the system's company owner prediction result for the total
is the maximum or highest of the above two pure chance
expectations. That is, this maximum pure chance criterion
value is compared against the percentage of the system's
correct predictions for the total. If the system's percentage
of correct predictions for the total exceeds the maximum
pure chance criterion value, the system is judged to be an
effective discriminator between the avionics equipped and
nonequipped groups.
* This is a very stringent test and many researchers argue
that a less stringent test is applicable (e.g., see [41).
This is because the maximum pure chance criterion does not allow
for the fact that the syster, must defy the odds by predicting
individuals in the smaller group. While this is true, the
more stringent maximum pure chance criterion is used in this
chapter to satisfy even the hardiest of critics. !Table 4-B
presents a schematic outline of the approach used to obtain
the results presented in the following section.
Least the practical usefulress of all of the foregoing be
lost, it is worth repeating that what has been advanced
thus far is a way to identify aircraft owners who are likely
to equip their aircraft with avionics. Representative sample
89

FAA's AIRCRAFT OWNER SAMPLE
NONCOMPANY COMPANYOWNERS OWNERS
DEVELOP SYSTEM
CHARACTERISTICS OF: OWNERS & AIRCRAFT
: SYSTEM
OETIMALLY DISCRIMINATES
N PEQUIPPEDU
PREDICT PREDICT
EQUIPPED &EQUIPPED &NONEQUIPPE]&D NONEQUIPPED
TESTPREDICTIONS
SYSTEM PREDICTIONVERSUS
PURE CHANCE RESULTS
EFFECTIVE -OR- NOT EFFECTIVE
DISCRIMINATOR DISCRIMINATOR
Table 4-B
OUTLINE OF DISCRIMINANT ANALYSIS APPROACH
90

data has been used to develop such a system and the
system is stringently tested (see Section 4.3). The results
identify those characteristics or factors that are important
in the avionics equipage decision, thus describing areas of
profitable market concentration to manufacturers, and ear-
marking key indicators to watch for FAA manpower and facility
planning purposes. These results are representative of the
universe of all GA aircraft owiners, and are obtained at a
fraction of the cost associated with a complete survey of
each and every GA aircraft owner.
4.3 RESULTS
This section presents the results of the analysis for each
of the eight separate categories of avionics. The results
are presented using bar-charts and pie-charts. The bar-charts
(odd numbered Figures 4-1 through 4-15) show the relative
importance of each factor in discriminating or explaining the
difference between the avionics equipped and nonequipped
groups. Since the discriminatory power of a particular
factor is not quantitatively effected by its sign (positive
or negative), the direction of impact is not shown in the
bar-charts. The following subsections present a detailed
discussion of the direction of impact for each of the
discriminatory factors. As an aid to the reader, Table 4-C
presents the results for the direction of impact for each factor.

TABLE 4-C
DIRECTION OF IMPACT OF FACTORS ON AVIONICS EQUIPAGE
FACTOR DIRECTION OF IMPACT
Average Cruising Speed +
Pre-1960 Vintage
Itinerant Hours +
Instructional Use
Personal Use
Industrial Use
Rental Use
Key:
+ means that an increase in this factor (for factorsexpressed in continuous form--cruising speed anditinerant hours) or possession of this attribute (forthe age and use factors) increases the likelihood ofbelonging to the avionics equipped group.
- means that this factor varies inversely with thelikelihood of being avionics equipped.
92
H

For readers interested in the direction of impact
as well as the importance of a factor, Table 4-C nay be used
as a handy reference in conjunction with the bar-charts
presented in each of the following subsections.
The results of the predictions for each of the avionics
categories are presented using pie-charts (even numbered
Figures 4-2 through 4-16). These predictions are derived
from the systems presented in the bar-charts. The pie-charts
show the percentage of correct and incorrect predictions.
Two important comments must be kept in mind when using the
pie-charts. First, the raw numerical values given in the
pie-charts refer to the number of sample observations,
not to the number of aircraft equipped with avionics in
the GA fleet. Second, the predictions for the nonequipped
group are not shown. This is done to focus the discussion
on the equipped group. However, the nonequipped group is
included in the percentages associated with the "total."
Thus, for example in Figure 4-2, for roncompany owners,
71.8 percent correct predictions for the total means that
including both the predictions made for the equipped and
nonequipped groups, 71.8 percent of these predictions were
correct. This computation is referred to in the previous
section as (nll + n22 )/N. However, in Figure 4-2, 65.8 percent
correct predictions for the equipped group means that for the
aircraft equipped with avionics, 65.8 percent of the predictions
for this group were correct and the remainder were incorrect.
93

This computation is referred to in the previous section as the
column sum divided into its respective number of correct
predictions for that group. While there is no way to discern
the actual percentage of correct and incorrect predictions
for the nonequipped group from the information given in the
pie-charts, the percentage of correct predictions associated
with the total is always somewhere between the percentages
of correct predictions associated with the equipped and the
nonequipped groups. Thus, when the percentage of coirect
prediction associated with the total is high, and the
corresponding percentage for the equipped group is low, it
can be assumed that the percentage of correct predictions
for the nonequipped group is very high. Figure 4-10
demonstrates the extreme case. This figure shows that for
noncompany owners, the percentage of correct predictions for
equipage and nonequipage is quite high (85.2 percent), while
the percentage of correct predictions for the avionics equipped
group is considerably lower (5.7 percent). Then the number
of correct predictions for the ronequipped group (not shown)
must be very high, i.e., greater than GE.2 percent. In fact,
the number of correct predictions for the nonequipped group
is 99.3 percent.)
The format for the discussion in the remainder of this
chapter is as follows. A separate subsection is devoted
to each cf the eight types of avionics, and each subsection
S 4LI

begins with a thumbnail sketch of the purpose of the type
of avionics under consideration.* Within each subsection
the relative importance of each of the factors comprising
the discriminating system is discussed, this is followed
by a breakout of the correct and incorrect predictions
for the total and for the equipped groups--first for
noncompany owners and then for company owners. Perember
that the systems described in the bar-charts were developed
using noncompany owner data, hence the prediction results
fcr noncompany owners cannot be used to judge the effectiveness
of the system to distinguish between the avionics equipped
and nonequipped groups. The true test is Lased on the
prediction results obtained when the system is applied to the
heretofore unconsidered company owner data. Thus, the final
part of each subsection discusses the company owner results
as tested against the pure chance criterion. The results
of this test determine the predictive efficacy of the system.
4.3.1 INSTRUMENT LANDING SYSTEM (ILS)
As the name implies, this type of avionics is used by
aircraft performing a precision approach to land under
instrument flight rules, that is, an operation that is controlled
by an approach control facility. Hence, instrument approaches
may utilize one or more of the following subcategories of ILS
capabilities: (a) ILS localizer--receives a signal, emanating
from an airport, which serves to guide the aircraft down the
* A more detailed description of the various avionicsfunctions may be found in Reference 5.
Um===5

center of the runway; (b) ILS glide slope--receives a signal,
emanating from an airport, which serves to guide the aircraft
down the proper landing slope; (C) ILS marker beacon--the
aircraft receives signals from marker beacons, which are
placed in series at discrete intervals from the beginning
of the airport runway, and these signals indicate that the
pilot should begin his descent or that the aircraft is at
minimum altitude for the approach. In this chapter an aircraft
is counted as ILS equipped if it had any one of these avionics
subcategories on board.
Figure 4-1 shows that the most important factor in discrimi-
nating or explaining the difference between the ILS equipped
and nonequipped groups is aircraft cruising speed. This
factor is included as a surrogate for aircraft type. Because
turboprops and turbojets are structually designed for
longer distance and high altitude flights, requiring avionics
for communications and navigation, and the smaller piston
aircraft are not, cruising speed has a positive impact on
avionics equipage. As will be evident from the following
subsections, this factor is by far the most powerful
discriminator between the equipped and nonequipped groups.*
The pre-1960 vintage factor (designating aircraft manufactured
* Given its importance, it should be noted that alternativerepresentations of the type of aircraft factor, includingseparate indicators for each type of aircraft were tested inthe preliminary stages of the analysis. These alternativeformulations were not acceptable, most commonly becausethey did not work well when used with other factors (i.e.,multicollinearity problems) considered to be important indiscriminatina between the avionics equipped and nonequippedgroups.
96

6
3 3
2
SPEED PRE-1960 ITINERANT INSTRUC- PERSONAL INDUSTRIALHOURS TIONAL
Figure 4- 1
RELATIVE IMPORTANCE OF FACTORS INI LS AVIONICS EQUIPAGE
97

prior to 1960) and the personal use factor are the next most
ir~portant factors. The deleterious effects of age/use on
utilization rates for pre-1960 vin~tage aircraft, their lower
market values, and their shorter expected useful life, relative
to more recent vintage aircraft, argues against the installation
of costly avionics for these aircraft (direction of impact is
negative). The aircraft owner's type of use factors are
identical to those used in Chapter 3. In the present chapter
they are utilized to reflect variations in avionics equipage
due to type of use. Since business users, the category held
constant, are more likely than the other users to fly in
congested airspace (e.g., around large cities), where FAA
avionics requirements are especially stringent, the user group
factors have a negative influence on avionics equipage. As
may be noted from Figure 4-1 the rental category is not among
the final set of factors utilized to differentiate between
the ILS equipped and nonequipped owners. Without entering
a lengthy statistical discussion, this is because when
this factor was tried as an entrant, after the other factors
were selected, it did not add any significant information
to the existing system. Itinerant hours rank slightly
higher than the two remaining user factors in its discriminating
power. Because of the added pilot safety margin derived from
avionics equipage, especially on trips where origin and
destination differ, itinerant hours exert a positive influence
on avionics equipage.
98

When the system described in Figure 4-1 is applied to non-
company owners, the data set which was used to generate that
system, to predict the ILS equipped and nonequipped group
membership the results depicted in Figure 4-2 are obtained.
This figure shows that when both the equipped and nonequipped
group predictions are considered, 71.8 percent of the predictions
are correct and 28.2 percent are incorrect (cross-hatching
indicates incorrect predictions in all the pie-charts). When
only the predictions for the avionics equipped group are
considered 65.8 percent of the predictions are correct and
34.2 percent are incorrect.
Figure 4-2 also shows the results obtained for company
owners. That is, the system described in Figure 4-1 is
applied to predict ILS group membership for data not
previously utilized in the analysis. The results obtained
for company owners' ILS avionics are impressive. 74.3
percent of the total predictions (i.e., predictions for
the equipped and nonequipped groups) are correct and
25.7 percent are incorrect. For the ILS equipped group,
76.2 percent of the company owner predictions are correct.
Since there are 1,950 total owners in the ILS sample and
1,215 of these are equipped with ILS avionics and the
remainder are nonequipped, by pure chance it is expected
that 62.3 percent (i.e., 1,215/1,950 = 62.3 percent*) are
* Multiplying the proportion by 100 gives the percentageresult.
99
- -.---- '

NONCOMPANY OWNERS COMPANY OWNERS
TOTAL =3,351 TOTAL =1,950
65.8%76.2%
EQUIPPED= 1,366 EQUIPPED= 1,215
Figure 4.- 2
ILS: PERCENTAGE OF CORRECT ANDINCORRECT PREDICTIONS
100

correct predictions. Thus, the 76.2 percent correct
predictions for the company owner ILS equipped group exceeds
that which could be expected by the pure chance criterion.
As explained in Section 4.2, the relevant pure chance criterion
value against which to judge the system's 74.3 percent total
correct predictions is the maximum or highest of the pure
chance expectations for the equipped group (62.3 percent) and the
nonequipped group (i.e., the higher probability between
62.3 percent and 37.7 percent is 62.3 percent).* Thus, the
74.3 percent correct predictions for the total exceeds
the maximum correct guesses that could be expected from
pure chance, 62.3 percent. These results strongly support
the effectiveness of the system described in Figure 4-1 to
predict ILS avionics equipage.
In the following subsections the reasons supporting a
factor's inclusion in the system will not be repeated.
Since the direction of impact of each factor and its
supporting hypothesis do not vary with the type of
avionics, the arguments are identical to those presented
in this subsection. Table 4-C is furnished as a quick
reference guide. In addition, while the following
sub~sections present the relevant pure chance criteria values
for company owners, the computation per se is not given.
'The pure chance criterion value for the nonequipped groupis computed as the number nonequipped (1,950-1,215 -735)divided by the total number in the sample (735/1,950), ormore simply 100.0 -62.3 - 37.7 percent.
101
* = A

The pie-charts provide all the necessary information should
the reader wish to check the given pure chance criterion
values. The number of company owners equipped can be subtracted
from the total to obtain the number nonequipped. For each type
of avionics, the pure chance criterion value applicable to
the percentage correctly predicted for the equipped group is
obtained by dividing the number equipped by the total number.
A similar computation for the nonequipped group giveE its
relevant pure chance criterion. The latter is relevant only
in so far as it is used to arrive at the maximum pure chance
criteria--the value against which the system's total correct
predictions obtained for company owners are judged. The
maximum pure chance criterion is the greater between the
two pure chance values obtained for the equipped and nonequipped
groups.
4.3.2 VERY HIGH FREQUENCY OMNI-DIRECTIONAL RECEIVER IVOR)
VOR is used to keep the aircraft on the desired origin-
destination flight path by receiving a specific VOR signal.
That is, once the angle cf flight froin origin to destination
is computed and the VOR receiver indicator is set at this
"heading" (cruise bearing), all the pilot need do is to keep
the aircraft adjusted such that the VOR indicator remains
centered on this predetermined degree angle.
Figure 4-3 shows that the most important factor in
differentiating between the VOR equipped and nonequipped groups
102
- x I *

6
5
4
2
i '-""'-0.3
SPEED PRE-1960 ITINERANT PERSONAL INDUSTRIAL RENTAL
Figure 4 - 3
RELATIVE IMPORTANCE OF FACTORS INVOR AVIONICS EQUIPAGE
103

NONCOMPANY OWNERS COMPANY OWNERS
78.7% 88.6%
TOTAL =4,153 TOTAL =2,210
4.30h
94.4% 95.7%
EQUIPPED =3,427 EQUIPPED = 1,943
Figure 4 -4
VOR: PERCENTAGE OF CORRECT ANDINCORRECT PREDICTIONS
104
......... ......

is the industrial use factor, followed closely by aircraft
cruising speed. The pre-1960 vintage factor is the third
most important factor. These results are similar to those
obtained for ILS (subsection 4.3.1) in that the aircraft
speed and age factors achieve relatively high levels of
importance as discriminators between the avionics equipped
and nonequipped groups. The most striking difference
between the results obtained for ILS (Figure 4-1) and those
obtained for VOR (Figure 4-3) is the varying level of importance
achieved by the industrial use factor. Its powerful position as
a discriminator in the VOR results may be attributed to the
function of this type of avionics. That is, industrial use
activity is not generally compatible with longer inter-city
flights, whereas VOR equipment is very useful on such flights.
Hence, its strongly negative impact on equipage with VOR
avionics. Instructional use did not enter the VOR system
since it failed to add any significatly new discriminatory
information in addition to that obtained from the other factors.
Figure 4-4 shows the results obtained when the system
described in Figure 4-3 is applied to noncompany owners. Of
the total predictions, 78.7 percent correctly identified
the aircraft owner as being VOR equipped or nonequipped.
When the equipped group is taken separately, 94.4 percent of
the predictions were correct.
105
AI

P44-Figure 4-4 also shows the results of applying the system
described in Figure 4-3 to company owners. The results
obtained are very impressive. The system correctly identified
88.6 percent of the owners as to their equipage disposition
(i.e., equipped or nonequipped). When only the VOR equipped
group is considered, 95.7 percent were correctly identified.
Comparable expectations using the pure chance criterion
are 87.9 percent correct guesses for both the total and for
the equipped group. Thus, similar to the results for the
previous subsection, the system once again beats the odds. As
was pointed out in Section 4.2 this is very impressive
because not only is the system required to pick the "winner"
(the equipped group) but also the "loser" (the nonequipped
group).
4.3.3 DISTANCE MEASURING EQUIPMENT (DME)
DME avionics is generally used simultaneously with VOR
Aequipment. DME equipment automatically computes and
displays the distance from origin to destination. This
is done in two stages. The signal received via the VOR
receiver and DME receiver is used to compute the azimuth
and distance of a current flight position from the origin
point. The low and high altitude enroute charts inform
the pilot as to when he should change to the destination
frequency. When the latter point is reached, the DME unit
106

computes and displays the distance of current flight posi-
tion from the destination point. The VOR and DME avionics
may be used alone or may be used with ILS equipment. For
example, when the DME indicates a certain minimum distance
from an airport, the ILS equipment may be used by the pilot
to govern the aircraft's descent slope and altitude configuration
as well as to center the aircraft on the runway.
Figure 4-5 illustrates the relative strength of the factors
in differentiating between the DME equipped and nonequipped
groups. The results for DME are considerably different
than those obtained for either ILS or VOR avionics in that
four factors receive about equal importance as discriminators.
Results obtained for ILS and VOR were clearly more decisive
as to the relative importance of the discriminatory ability
of the factors. This result is interesting because it implies
that, although DME equipment may be compatible in use withI
other types of avionics, it would be misleading to use the
results obtained for complementary avionics categories as a
~ Ibasis for determining DME equipage. Detailed examination of
why the relative importance of the factors vary for
compatible types of avionics (i.e., whether it may be attributable
to a real and structurally different method of assessment in
the equipage decision based on the incremental benefits acquired
by the "add-one," or simply a function of a larger number of
owners having only one or the other type of avionics) is beyond
the scope of this chapter. Figure 4-5 shows that aircraft cruising
107
iK

7
4
2 2 2 2
SPEED PRE-1960 ITINERANT INSTRUC- PERSONAL INDUSTRIAL RENTALHOURS TIONAL
Figure 4 - 5
RELATIVE IMPORTANCE OF FACTORS INDME AVIONICS EQUIPAGE
108
w~1

speed is clearly the dominant factor in explaining the
r Idifference between the DME equipped and nonequipped group.
Since DMF equipment is especially suited to higher altitude
and longer distance flights, which are highly compatible with
turboprop and turbojet activities, this result is not surprising.
Personal use is the second most important discriminating
factor--explained by its high noncompatibility (negative impact)
with the application of VOR avionics.
Fiaure 4-6 shows the results of the DME predictions. For
noncompany owners, the system illustrated in Figure 4-5
predicts 80.2 percent of the total correctly. When the
equipped group is taken alone, 40.1 percent of the predic-
tions are correct. When the system is applied to company
owner data, 74.0 percent of the predictions for the equipped
and nonequipped groups are correct and 59.8 percent of the
predictions for the equipped group are correct. The per-
centage of correct predictions for the equipped group, for
both noncompany and company owners, is somewha-t lower for
DME than for that obtained in the other avionics cases
examined previously. However, as may be noted the equipped
group for DME represents a smaller proportion of the total
than for any of these other avionics categories. Thus, the
degree of difficulty of correctly identifying members of this
smaller group increases more than proportionally. In any
case, the critical test to ascertain the predictive efficacy
109

NONCOMPANY OWNERS COMPANY OWNERS
80.2%740
TOTAL = 4,145 TOTAL = 2,210
5.%59.8%
EQUIPPED 599 EQUIPPED = 809
Figure 4 - 6
DME: PERCENTAGE OF CORRECT ANDINCORRECT PREDICTIONS
110

of the system is how the predicted results (percentage of
correct predictions) for company owners compare with the
pure chance criterion. For DME the pure chance expectations
are 63.4 percent correct guesses for the total and 36.6 per-
cent correct for the DME equipped group. The percentage of
correct predictions obtained using the system for company
owners (Figure 4-6) far exceed the pure chance criterion.
Thus, the system is judged to be an effective discriminator
between the DME equipped and nonequipped groups.
4.3.4 AUTOMATIC DIRECTION FINDER (ADF)
The ADF receives signals from a commercial radio station
or low frequency transmitter, say in the city of destination,
and the indicator on the ADF unit shows the direction
(compass degree angle) of the source of transmission from
the current position of the aircraft. Similar to the
VOR receiver, the pilot's task is to maintain the indicated
angle to achieve the proper flight path.
Figure 4-7 illustrates the relative strengths of the factors
in differentiating between the ADF equipped and nonequipped
groups. This figure shows that aircraft cruising speed
is more than twice as important as any other factor in
explaining the ADF equipage decision. Similar to the
results obtained for DME (Figure 4-5), several factors
appear to share equal importance in their respective
contributions to differentiating between the ADF equipped
111
. ... .. . .. . ... ... ,, -

(9
7
3 3 3
2 2
SPEED PRE-1960 ITINERANT INSTRUC- PERSONAL INDUSTRIAL RENTALHOURS TIONAL
Figure 4 -7
RELATIVE IMPORTANCE OF FACTORS INADF AVIONICS EQUIPAGE
112
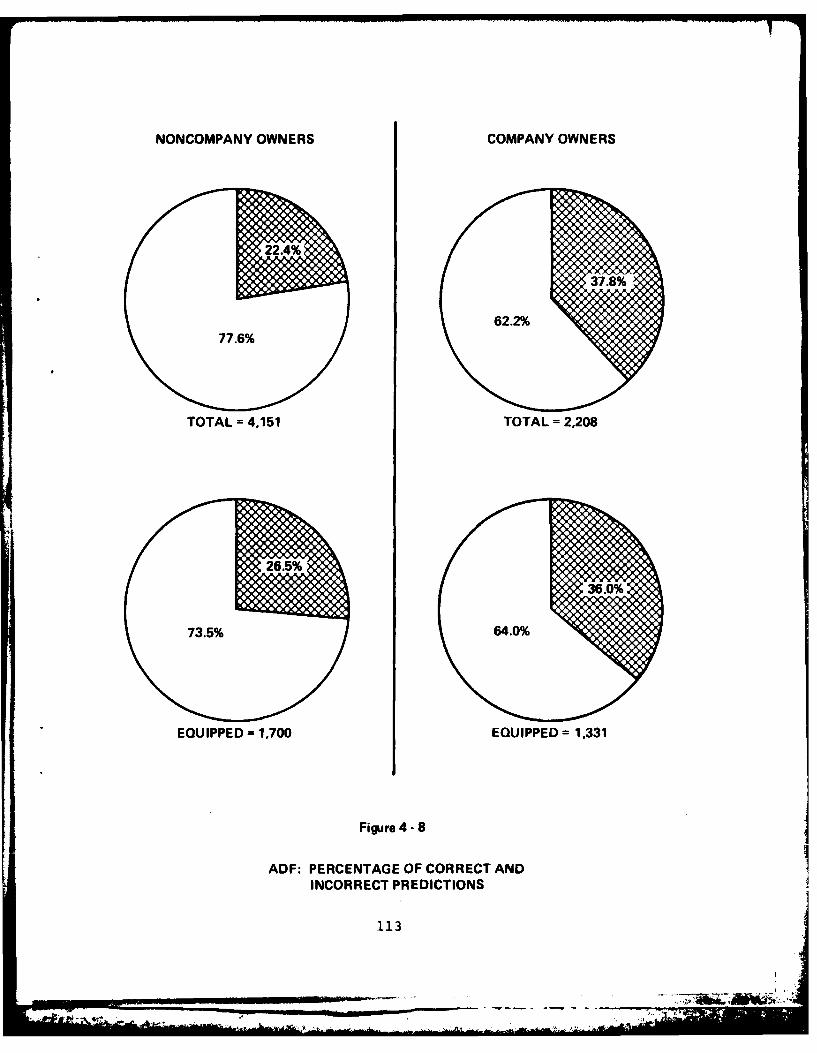
NONCOMPANY OWNERS COMPANY OWNERS
77.6%
TOTAL =4,151 TOTAL =2,208
EQUIPPED =1,700 EQUIPPED= 1,331
Figure 4 - 8
ADF: PERCENTAGE OF CORRECT ANDINCORRECT PREDICTIONS
113

and nonequipped groups. While factors of equal rank are
about equal in importance, it must be remembered that they
are not redundant in the sense that they describe the same
aspect of the equipage decision. Rather, this type of result
suggests that the equipage decision is multifaceted and several
factors share equal importance in that decision.
The results of the ADF predictions for noncompany owners
(Figure 4-8) show that 77.6 percent of the total predictions
are correct and that 73.5 percent of the predictions for
the equipped group are correct. When the system illustrated
in Figure 4-7 is applied to company owners, 62.2 percent of
the total prediction are correct and 64.0 percent of the
ADF equipped group predictions are correct. Since the
pure chance criterion indicates that 60.3 percent correct
predictions are expected for both the total and the
equipped group, the system described in Figure 4-7 is
considered to be an effective discriminator between the
ADF equipped and nonequipped groups.
4.3.5 WEATHER RADAR
As the name implies, the purpose of this avionics is to
display weather information to the pilot.
Figure 4-9 shows the relative discriminatory power of the
factors for weather radar. The very high degree of impor-
tance achieved by aircraft cruising speed is supported by
114
-- A 4

9
2 2
SPEED PRE-1960 ITINERANT INSTRUC-HOURS TIONAL
Figure 4 - 9
RELATIVE IMPORTANCE OF FACTORS INRADAR AVIONICS EQUIPAGE
115
I.-

the fact that this type of avionics is extremely useful
at high altitude longer distance flights. Since this type
of flying is highly compatibile with turboprops and turbo-
jets, the result that aircraft speed is four and one-half
times more important than any other factor is not too
surprising. The rental, industrial, and personal use
factor failed to add any significant discriminatory
information beyond that obtained by the system presented
in Figure 4-9.
The results presented in Figure 4-10 are interesting. This
figure shows that, for both noncompany and company owners,
while the percentage of correct predictions for the total
(equipped and nonequipped groups) are respectable, the
percentage of correct predictions for the equipped group
is considerably lower. This case is particularly interesting
because it offers an opportunity to enhance the reader's
understanding, by practical example, of several important
points about the nature of the research results. That is,
because the percentage of the system's correct predictions for
the equipped group is low does not, by itself, automatically
lead to the conclusion that the system is not an effective
discriminator. As pointed out in Section 4.2, assessment
of the effectiveness of the system is based on how well it
correctly predicts the total, not on one or the other of the
components of the total. The logic supporting the use of
116
'I : " .. ' ' ',i. .. .

the total as the primary basis of ascertaining the predictive
efficacy of the system is that predictions for both the
avionics equipped and nonequipped groups are important. The
present case exemplifies this in that the large percentage
of correct predictions for the nonequipped group represents
valuable information to avionics manufacturers. As pointed out
in Section 4.3, the system illustrated in Figure 4-9 correctly
predicts over 99.0 percent of the nonequipped group for both
noncompany and company owners. Thus, despite the low
percentage of correct predictions for the weather radar
equipped group, avionics manufacturers (utilizing the system
presented in Figure 4-9) could identify, with a high degree
of accuracy, the group least likely to purchase this avionics.
As a second best solution, marketing strategies could be
geared to minimize attention to this group and concentrate
on the remaining owners.&F
Another important point to be gleaned from the results
presented in Figure 4-10 is that even a low percentage of
successful prediction may be useful. Here the basis for L
assessing the usefulness of such predictions is somewhat
arbitrary and arises because of necessity. To explain,
the low percentage of correct predictions for the weather
radar equipped group exhibited in Figure 4-10 is to a large
extent a function of the few number of owners, relative
to the total, equipped with this avionics. Hence the high
117i i [

NONCOMPANY OWNERS COMPANY OWNERS
85.2%
TOTAL 4,146 TOTAL 2,210
27.9%
EQUIPPED 60 EQUIPPED = 244
Figure 4- 10
RADAR: PERCENTAGE OF CORRECTAND INCORRECT PREDICTIONS
118

degree of difficulty of correctly identifying these owners.
The pure chance criterion as applied to the total simply
selects the highest standard to judge the system, and ignores
the significant problem of defying the odds. However, it
may well be that pure chance, when applied to identifying the
equipped owners, cannot do as well as the system. This is
because the degree of difficulty of identifying members of
a group with significantly fewer members holds for all
alternative schemes of identification. If predictions
about the equipped group are required, the system presented
in Figure 4-9 may provide better results than the pure chance
alternative. Thus, while the system's percentage of
correct predictions in toto may not meet the stringent
maximum pure chance criterion, the system's correct
predictions for the equipped group--albeit low in the absolute
sense--may be greater than that expected by pure chance.
In the latter case, the system could still be considered
(on the basis of a judgmental assessment) useful. The
predictive efficacy of the system illustrated in Figure 4-9
is ascertained in the following paragraph in light of the
above discussion.
For noncompany owners Figure 4-10 shows that 85.2 percent
of the total predictions are correct and 5.7 percent of
the predictions for the radar equipped group are correct.
For company owners, the system described in Figure 4-7
119

identifies 72.1 percent of the total correctly and
correctly predicts 27.9 percent of the radar equipped
group. By pure chance it is expected that 89.0 percent
of the total is correctly identified and 11.0 percent
of the guesses for the equipped group are correct. Thus,
although the system cannot be judged effective as discrimi-
nating between the groups based on the results for the
total, it exceeds the pure chance criterion for correct
predictions for the radar equipped group.
4.3.6 AREA NAVIGATION EQUIPMENT (ANE)
ANE automatically computes and displays both the distance
and the proper compass degree heading from any city to any
other city utilizing a mini-computer. That is, it receives
standard VHF (to - from) transmissions for known city pairs,
and computes the above information points. The information
is continually updated, utilizing the most appropriate
known city pair information, as the flight progresses.
Figure 4-11 presents the relative weights attained by the
factors in the ANE equipage decision. The aircraft's age
(pre-1960 vintage) and cruising speed are the two most
powerful discriminating factors. The powerful impact of
older aircraft on this avionics equipage decision is
supported by the noncompatibility in ANE equipment use
and its relatively expensive purchase price versus the
120

6
5
4 4
3 3
SPEED PRE-1960 INSTRUC- PERSONAL INDUSTRIAL RENTALTIONAL
Figure 4- 11
RELATIVE IMPORTANCE OF FACTORS INANE AVIONICS EQUIPAGE
121
- ,. . . .. t: ' w . h:, 'p , ! ' _-. - ° , . . .

likely shorter missions and useful life or older vintage
aircraft. The relatively high positive impact of aircraft
speed is supported by a contrary argument--compatibility of
longer mission length with the more mechanically and
aerodynamically sophisticated aircraft. Itinerant hours
flown did not enter the system presented in Figure 4-11
because it did not add any additional discriminating
information.
Figure 4-12 presents the results of the ANE predictions.
The results for the ANE equipped group are similar to
those obtained for weather radar (Figure 4-10) in that
the equipped group represents a low proportion of the
total and the percentage of correct predictions are
considerably lower for the equipped group than for the
total. Thus, the discussion presented in the preceding
subsection, regarding the low percentage of correct predictions
for the group with few members and the assessment of system
results versus pure chance, applies equally here. For
noncompany owners, 57.0 percent of the predictions for the
equipped and nonequipped groups are correct and 11.7 percent
of the ANE equipped group predictions are correct. For
company owners, 46.2 percent of the members of each group
are correctly identified in total and 18.7 percent of the
ANE equipped group are correctly identified. Using the pure
chance criterion, it is expected that 85.8 percent of the
total is correctly identified and 14.2 percent of the guesses
122

NONCOMPANY OWNERS COMPANY OWNERS
43.00% 46.0% 54.0
TOTAL 4,144 TOTAL 2,551
11.7%18.7%
EQUIPPED =342 EQUIPPED = 361
Figure 4- 12
ANE: PERCENTAGE OF CORRECT ANDINCORRECT PREDICTIONS
123

for the equipped group are correct. Thus, similar to the
results obtained for weather radar (subsection 4.3.5),
the system (Figure 4-11) cannot be judged to effectively
discriminate between the equipped and nonequipped groups
in toto. However, the percentage of correct predictions
using the system described in Figure 4-11 for the ANE
equipped group exceeds the nunmber of correct guesses that
is expected by pure chance.
4.3.7 TRANSPONDER
Basically, transponder equipment is used in conjunction
with ground radar to allow the air traffic controller
to identify that particular aircraft. That is, the
transponder transmits a specific code, requested by the
with the aircraft "blip" on the ground radar scope.
Figure 4-13 shows that the most important factors in
discriminating between the transponder equipped and
nonequipped groups are aircraft cruising speed and age
of aircraft. They are each more than one and one-half
times more powerful in discriminatory ability as the next
most important factor, itinerant hours. Contrary to
almost all of the results obtained previously (the only
exception is weather radar), none of the user group factors
are very powerful in discriminating between the transponder
eqiupped and nonequipped groups.
124

5 5
3
2 2
0.4
SPEED PR-90ITINERANT INSTRUC- PERSONAL INDUSTRIAL RENTALHOURS TIONAL
Figure 4 -13
RELATIVE IMPORTANCE OF FACTORS INTRANSPONDER AVIONICS EQUIPAGE
125
- .a

NONCOMPANY OWNERS COMPANY OWNERS
78.3% 80.0%
TOTAL- 3,596 TOTAL =1,916
77.9%702
EQUIPPED = 1,745 EQUIPPED =1,363
Figure 4- 14
TRANSPONDER: PERCENTAGE OF CORRECTAND INCORRECT PREDICTIONS
* 126

Figure 4-14 shows that the system illustrated in Figure 4-13
predicts 78.3 percent of the noncompany owner equipped and
nonequipped group members correctly. For the equipped
group taken separately, this system predicts 77.9 percent
of the member correctly. When the system is applied to
company owners, 80.0 percent correct predictions are
obtained for the total and 70.2 percent correct predictions
are recorded for the transponder equipped group. For
comparison, the relevant pure chance criterion for both
the total and the transponder equipped group is 71.1 percent.
Thus, based on the results for the total, the system described
in Figure 4-14 is judged to be an effective discriminator
between the transponder equipped and nonequipped groups.
4.3.8 ALTITUDE ENCODING TRANSPONDER
This avionics is a transponder equipped with an altitude
encoder. It automatically computes, displays, and broad-
casts to the air traffic controller the altitude of the
aircraft.
Figure 4-15 shows that aircraft cruising speed is the most
powerful discriminator between the altitude encoding trans-
ponder equipped and nonequipped groups. Itinerant hours
is the second most important factor. It may be noted that
itinerant hours achieve this high level of importance only
in the weather radar (Figure 4-9) and altitude encoding
127

5
4
3 3
2 2
SPEED PRE-1960 ITINERNAT INSTRUC- PERSONAL INDUSTRIALHOURS TIONAL
Figure 4- 15
RELATIVE IMPORTANCE OF FACTORS INALTITUDE ENCODING TRANSPONDER
AVIONICS EQUIPAGE
128

NONCOMPANY OWNERS COMPANY OWNERS
148
85.2% 80.6%
TOTAL = 2,636 TOTAL= 1,173
46.9% 531
EQUIPPED 356 EQUIPPED = 464
Figure 4- 16
ALTITUDE ENCODING TRANSPONDER:PERCENTAGE OF CORRECT AND
INCORRECT PREDICTIONS
129

transponder results. Since among avionics devices, the
latter two are particularly useful at higher altitude
flights (which are generally longer itinerant flights)
these results are understandable. The older vintage and
personal use actors share equally the position of the third
most important discriminators.
When the system described in Figure 4-15 is applied to noncompany
ouners, Figure 4-16 shows that 85.2 percent correct predictions
are obtained when both the equipped and nonequipped groups
are considered. When the avionics equipped group only
is considered, 46.9 percent of the predictions made using
the system are correct. For the company owners, the system
correctly predicts 80.6 percent of both the equipped and
nonequipped groups in total, and it correctly predicts
68.8 percent of the altitude encoding transponder equipped
group. The percentage of correct predictions for noncom-
pany owners are considereably higher than those which could
be expected by pure chance. That is, the pure chance
criterion for both the total and the equipped group is
60.3 percent. Thus, the system illustrated in Figure 4-15
is judged to be an effective discriminator between the altitude
encoding transponder equipped and nonequipped groups.
4.4 CONCLUSIONS
The results presented in this section have shown that,
in general, aircraft cruising speed and age of aircraft
130
are the two most powerful factors discriminating between
avionics equipped and nonequipped aircraft owners. Utili-
zation rate becomes especially important for two types of
avionics--weather radar and altitude encoding transponders.
In general, the results suggest that the systems developed
for each type of avionics are effective in discriminating
between, or correctly predicting, members of the avionics
equipped and nonequipped groups. The systems developed
for radar and ANE to predict the correct avionics disposi-
tion (equipped or nonequipped) did not meet the maximum
pure chance criterion in total. However, for each of
these two type of avionics, the systems developed to predict
the members of their respective equipped groups surpassed
the relevant pure chance criterion. Thus, even for these
two types of avionics the results are not as bleak as they
might have at first appeared.
131

CHAPTER 4 REFERENCES
1. Cooley, W.W. and Lohnes, P.R. Multivariate Data Analysis(Chapter 9). New York: John Wiley and Sons, Inc., 1971.
2. Frank, R.E.; Massy, W.F.; and Morrison, D.C. "Bias inMultiple Discriminant Analysis," Journal of MarketingResearch, II (Augues, 1965), 250-258.
3. Morrison, D.G. "Discriminant Analysis" in Handbook ofMarketing Research (Part E, Chapter 8) ed. Robert Ferber.New York: McGraw-Hill Book Company, 1974.
4. Morrison, D.G. "On the Interpretation of DiscriminantAnalysis" Journal of Marketing Research, VI (May 1969),156-163.
5. Federal Aviation Administration, Office of ManagementSystems, General Aviation Avionics Statistics: 1974.Springfield, Virginia: National Technical InformationService, 1977.
132


![WELCOME [webuser.bus.umich.edu]webuser.bus.umich.edu/.../2015SpotlightBook.pdf · GM GPSC GE Aviation ... Mechanical Engineering, Electrical Engineering, Manufacturing, etc.) ...](https://static.fdocuments.us/doc/165x107/5adbadcb7f8b9afc0f8e2d0f/welcome-gpsc-ge-aviation-mechanical-engineering-electrical-engineering.jpg)


