Average revenue regulation and regional price structure
20
Regional Science and Urban Economics 21 (1991) 89-108. North-Holland Average revenue regulation and regional price structure Ian Bradley and Catherine Price University of Leicester, Leceister LEI 7RH, UK Received April 1988, final version received April 1990 Some newly privatised industries in the U.K. are subject to a constraint on an average revenue yield. This paper analyses the likely effect of such a constraint on the regional pattern of the industry’s prices and output, and the implications for economic efiiciency, extending this analysis to other aspects of price structure. It shows that such a constraint gives the industry incentives to charge economically inefficient prices and to restrict the area which is supplied. The paper discusses why such a constraint may have been imposed and concludes with an account of U.K. industries subject to such regulation. 1. Introduction Some recently privatised U.K. industries have been subject to a constraint on their average revenue. Such regulation takes one of two forms: control on the average (current weighted) revenue realised for certain services; or a tariff basket constraint which limits the weighted average of current prices, the weights being quantities sold in the previous year. Such constraints have been applied to industries where there is some element of natural monopoly, where competition is impracticable in the near future and the most econom- ically efftcient pricing policy, marginal cost pricing, leads to losses. Although these constraints appear superficially similar, they have very different implications for economic efticiency, and the continuing imposition of both forms by government makes further analysis relevant. This paper examines the most commonly applied constraint (an average revenue con- straint) and considers the incentives it generates, its likely effects on price structure, and implications for future policy. The model is developed in a spatial context because several of the regulated companies are network industries (public utilities) where regional pricing is itself an issue. However, the model is sufficiently general to analyse by analogy price structures in non-spatial contexts. As a benchmark, average revenue con- straint is compared with Ramsey pricing, which maximises economic efficiency subject to a minimum profit constraint. The application of average 0166-0462/91/%03.50 0 1991-Elsevier Science Publishers B.V. (North-Holland)
-
Upload
ian-bradley -
Category
Documents
-
view
215 -
download
2
Transcript of Average revenue regulation and regional price structure

Regional Science and Urban Economics 21 (1991) 89-108. North-Holland
Average revenue regulation and regional price structure
Ian Bradley and Catherine Price
University of Leicester, Leceister LEI 7RH, UK
Received April 1988, final version received April 1990
Some newly privatised industries in the U.K. are subject to a constraint on an average revenue yield. This paper analyses the likely effect of such a constraint on the regional pattern of the industry’s prices and output, and the implications for economic efiiciency, extending this analysis to other aspects of price structure. It shows that such a constraint gives the industry incentives to charge economically inefficient prices and to restrict the area which is supplied. The paper discusses why such a constraint may have been imposed and concludes with an account of U.K. industries subject to such regulation.
1. Introduction
Some recently privatised U.K. industries have been subject to a constraint on their average revenue. Such regulation takes one of two forms: control on the average (current weighted) revenue realised for certain services; or a tariff basket constraint which limits the weighted average of current prices, the weights being quantities sold in the previous year. Such constraints have been applied to industries where there is some element of natural monopoly, where competition is impracticable in the near future and the most econom- ically efftcient pricing policy, marginal cost pricing, leads to losses.
Although these constraints appear superficially similar, they have very different implications for economic efticiency, and the continuing imposition of both forms by government makes further analysis relevant. This paper examines the most commonly applied constraint (an average revenue con- straint) and considers the incentives it generates, its likely effects on price structure, and implications for future policy. The model is developed in a spatial context because several of the regulated companies are network industries (public utilities) where regional pricing is itself an issue.
However, the model is sufficiently general to analyse by analogy price structures in non-spatial contexts. As a benchmark, average revenue con- straint is compared with Ramsey pricing, which maximises economic efficiency subject to a minimum profit constraint. The application of average
0166-0462/91/%03.50 0 1991-Elsevier Science Publishers B.V. (North-Holland)

90 I. Bradley and C. Price, Average revenue regulation and regional price structure
revenue constraint in specific industries in the U.K. is discussed in the final section of the paper.
The constraint is of the general form that the increase in average revenue must not exceed the increase in the retail price index less a certain figure X, i.e. average revenue should fall by X per year in real terms. This can be written
where AR, is average revenue in the year t and RPZ, is the value of the retail price index in that year. The general case of an average revenue constraint on a monopolist supplying different markets can be formulated easily enough.
The monopolist maximises
subject to
where R, is revenue, Ci costs and 4i sales in market i. p* is the constrained maximum average revenue.
Forming a Lagrangean
gives a first-order condition for constrained profit maximisation:
MRi-MCi+I(p*-MRi)=O,
where MC and MR represent marginal cost and marginal revenue. Rewriting this as
MRi-MCi/(l-A)= -Lp*/(l-A), (1)
one can see that, unlike the case for an unconstrained monopolist, marginal profitability in different markets will only be equal if marginal costs in the markets are equal. If the constraint is effective, then clearly marginal profitability will be negative in some markets at least, and since O< 2 < 1,

1. Bradley and C. Price, Average revenue regulation and regional price structure 91
marginal pro&ability will be higher in the more costly markets. The intuitive explanation is that supplying a costly market requires a higher price for the same profit than supplying a cheaper market. The high price affects average revenue adversely. To justify supplying the costly market requires a higher level of profitability. This result is independent of demand or demand elasticity in the various markets but demand, of course, plays a part in determining the overall price pattern. For instance, for markets with the same costs the usual result that price will be higher the more inelastic is demand still holds, as is shown later.
We can compare the first-order conditions with that for ‘Ramsey’ pricing in which social surplus is maximised subject to a minimum profit constraint [see for instance Rees (1984)].
We want to maximise
C(CSi+Ri-Ci)
(where CSi is consumer surplus in market i), subject to the constraint that
Forming a Lagrangean,
we have as the first-order condition for Ramsey pricing that
i.e.
(Pi-MC,) (MCi-MRi)=p’O’
that is, marginal profitability is proportional to the difference between price and marginal cost. In this case marginal profitability is negative in all markets and clearly the conditions produce a very different pattern of prices from the constrained average revenue case. To examine the likely con- sequence of the average revenue constraint on the pattern of prices in regulated industries it simplifies matters somewhat to separate the effects caused by cost differences from those due to variations in demand.
The analysis is conducted in a spatial context although it is also applicable to markets in which costs and demand characteristics vary through time - for example, the peak load pricing problem. The spatial content is appropri-

92 1. Bradley and C. Price, Average revenue regulation and regional price structure
ate because fixed supply networks constitute the main element of natural monopoly of privatised industries.
2. Markets with identical demand hut different costs
Consider first a producer supplying a number of markets, all with the same demand, spaced at an even distance from a single supply point. The only non-zero marginal costs are transport costs, which are t per unit distance from the supply point. Thus, for a market distance s from the point of supply, marginal costs are ts per unit. If the range of the market is 0, a profit maximising firm subject to an average revenue constraint will choose p(s), (the price at s), and G to maximise
subject to an average revenue constraint
Forming a Lagrangean,
L,=j (pq-tsq)ds+A. P*jqds-ipqds ,
0 0 0 1 gives a first-order condition corresponding to the one for the general case above as follows:
For ease of arithmetic but with some loss of generality we assume that demand is linear:
4(s) = 1 -P(S).
Then
2p- 1 =(ts-Ap*)/(l -A), (2)
i.e. price is a linear function of distance.

I. Bradley and C. Price, Average revenue regulation and regional price structure 93
P
, ._._. ,,.... . . . . . . ...**. .I..
3p*-l a 2 I/
a!* 1 r
21 t
Fig. 1
To find the range of the market supplied we require
i.e.
(l-A)*p(a)-ta+Ip*=O,
p(a)=(ta-Ap*)/(l-il).
Hence using (2) p(o) = 1. Fig. 1 illustrates the pricing policy at each point in the market for a given
p*. If the equation of this price line is
p=a+bs,
which for q(s) = 1 -p(s) yields
p* = (1 - 2a)/3,
or, equivalently,
a = (3p* - 1)/2. (3)
Thus all linear pricing schemes which charge the same price to the nearest
R.S.U.E.-D

94 I. Bradley and C. Price, Average revenue regulation and regional price structure
part of the market generate the same average revenue. This is a helpful characteristic when comparing different strategies which yield the same average revenue.
Using the expression for p* in eq. (3) with the first-order condition for regulated profit maximisation given by (2) enables us to write
and
1= [3p* - 2]/[2(p* - l)]
p(s) = (3p* - 1)/2 + [( 1 - p*)/p*] . ts. (4)
Unconstrained profit is maximised when
and
p(s) = (1 + ts)/2
p* = 213.
Thus for p* 2213 the constraint is not binding, and the standard price discrimination result, with the monopolist absorbing half the freight costs, holds.
The size of the market supplied is given by p = 1 (q = 0), i.e.
1 = (3p* - 1)/2 + [( 1 - p*)/p*] . to,
and hence c = 3p*/2t. For unconstrained profit maximisation, with p* =2/3, the size of the
market is l/t. As p* is reduced from 213, so also will be the size of the market served. In general a stricter p* raises the price to those distant from the point of supply and lowers it for nearby consumers. This arises because the firm attempts to protect its profit level while satisfying the average revenue constraint by reducing supply to high cost (and high revenue) markets.
This is illustrated in fig. 2. There is less freight absorption and a smaller market served the more stringent is the constraint. Along the unconstrained monopolist’s price path marginal profitability is zero at every point. For the constrained monopolist, marginal profitability is negative for markets up to s* away from the point of supply but is positive for markets further away than s*. For these distant markets the constraint has the apparently perverse effect of increasing prices because the monopolist restrains demand in order to keep the overall average price down. A reduction in price in these markets would unambiguously benefit both the consumer and the producer.
The effect of an average revenue constraint on economic efficiency is

I. Bradley and C. Price, Average revenue regulation and regional price structure 95
, AR constrained
unconstrained
monapolirt
I I
I I .
s* r
Fig. 2
important for policy decisions. If p* is chosen so as to yield maximum total market surplus for a profit maximising monopolist under an average revenue constraint, then it can easily be shown that p* should be equal to 0.5. In this case there will be no freight absorption (i.e. the difference between prices charged in each market equals the difference in marginal costs of supply). However, even with this ‘optimally chosen’ revenue constraint the firm cannot be constrained to use marginal cost pricing, but continues to charge a price (uniformly) higher than marginal cost in each market. Thus an average revenue constraint can never achieve optimal prices at any point in the market. Similarly, the range of the market supplied will be less than optimal, and less than that supplied by an unconstrained monopolist. This is relevant to industries which have been subject to (at least a nominal) marginal cost pricing guideline in the public sector before privatisation.
We may also compare the pattern of prices resulting from regulated profit maximisation with that of Ramsey pricing which, by definition, yields the highest social surplus for any particular level of profits.
The pattern of Ramsey prices can be deduced from the general result given earlier or directly, as follows, for this particular case. The sum of consumers surplus, and profits is maximised subject to a profit constraint. That is, maximise
0 0
subject to
G&(1-p)--ts(l-p)]ds. 0

96 I. Bradley and C. Price, Average revenue regulation and regional price structure
Fig. 3a. AR constrained and Ramsey pricing yielding similar average revenue.
P ,
1
0.5
I * 1 f
r
Fig. 3b. Average revenue constrained and Ramsey pricing yielding similar profit
The solution to this is that D= l/t and
p(s)=a+(l --a)@
where a is higher the higher is G (the minimum profit level). Thus we can compare average revenue constrained pricing to Ramsey
pricing yielding the same average revenue (see fig. 3a) or yielding the same profits (see fig. 3b).
The results of the comparison on price structure are unambiguous, since maximising profits subject to a maximum level of average revenue will entail higher prices throughout the market than the set of Ramsey prices which yields the same average revenue. It will also consequently entail supplying a

I. Bradley and C. Price, Average revenue regulation and regional price structure 91
smaller range of market - Ramsey pricing will always supply the same range as in marginal cost pricing, raising proftts above their (zero) marginal cost pricing level by increasing prices to the markets close to the source of supply. (Under Ramsey pricing marginal profit is negative in all markets except the furthest.) This is in marked contrast to the constrained monopolist who raises prices to distant (high cost and revenue) markets. Ramsey pricing, will, of course, always be superior in welfare terms to the behaviour of a constrained monopolist with the same profit, since Ramsey pricing is defined as the most efficient strategy with a given level of profit. Under Ramsey pricing there is always some freight absorption which is less the lower the minimum profit requirement, For the same profit level there is more freight absorption with Ramsey pricing than for the average revenue constrained monopolist. One is tempted to say that there is more price discrimination under Ramsey pricing than for the average revenue constrained case, but a hypothetical gradual tightening of the constraint would result in the monop- olist reducing freight absorption and (for p* ~0.5) actually imposing phantom freight.
3. Similar costs, different demands
The results so far derived depend on the same demand and varying costs throughout the market. However, in practice the average revenue constraint is likely to apply across differing demands, as well as differing costs. There may well be regional variation in demand as well as in costs of supply, particularly according to climate, the extent of urban development, or competition with other industries which have a regional price pattern. In a non-spatial context varying demand is relevant in the peak load problem.
Some insight into the effects of the average revenue constraint in markets between which demand varies, can be gained by considering the special case of constant and equal marginal costs in all markets.
Our condition [eq. (l)] for average revenue constrained profit maximisa- tion is
I=(MCi-MRi)J(p*-MR,)
and as we noted before with constant and equal marginal costs, marginal loss will be the same in all markets, with price higher the more inelastic is demand.
In contrast with Ramsey pricing, where
p=(Pi-MCi)/(MCi-MRi)
for markets with equal marginal costs of supply, both price and marginal loss are higher the more inelastic is demand. Hence while, like Ramsey

98 I. Bradley and C. Price, Average revenue regulation and regional price structure
unconstrained prices
I =o
/
/’
/ *
MCj ‘j
Fig. 4
pricing, the average revenue constraint leads to higher prices in inelastic markets, it does so in a more exaggerated fashion. Price discrimination resulting from demand differences will be greater than is economically efficient.
In fig. 4 good i is less elastic than good j. The point where the Ramsey pattern and the average revenue constrained pattern yield the same prices is the unconstrained profit maximising position. Whereas with Ramsey pricing a commodity will never be sold below its marginal cost of production the average revenue constraint can clearly lead to such a situation. To allow high prices and a very profitable output level in a market with inelastic demand (i) an average revenue constrained monopolist may well be at a position like E in fig. 4 where Pi< MC,.
Further comparisons are straightforward. Consider a series of isoprotit curves such as LI,, Zl,, II2 on fig. 4. Moving from a point on the Ramsey pricing line, to one on the average revenue constrained line which yields equal profits will always entail higher prices in markets with inelastic demand and lower prices in markets with more elastic demand and, of course, will yield less social welfare. We now have two results: in markets with similar demands and different costs all prices would be higher under an average revenue constraint than they would be under Ramsey pricing yielding the same average revenue; in markets with similar costs but different demands we would expect prices under an AR constraint to be higher in inelastic demand markets than they would be under Ramsey pricing, while in markets with elastic demand prices would be lower.
4. Different costs, different demands
Examples of markets with different demands and different costs arise not

I. Bradley and C. Price, Average revenue regulation and regional price structure 99
only in a regional context but also in the peak/off-peak case. This is a common feature of monopolies recently privatised, or now in the process of privatisation and the optimal peak load pricing policy has been the subject of considerable analysis [see Crew and Kleindorfer (1979)].
We can use the results of our previous analysis to intimate likely pricing policies of constrained monopolies facing problems of demand with signili- cant peaks.
We have seen that the average revenue constraint leads to too high a price in a costly market compared to Ramsey pricing yielding the same profit. Thus cost differences would encourage too high a price for peak supplies (capacity provision less than efficient level) and too low a price for off-peak supplies. This may be exaggerated or tempered by the elasticities of peak and off-peak demand. If peak demand is relatively elastic however, then the inefficiency caused by the constraint and the difference in costs may be offset. We can examine this possibility in a little more detail.
Suppose the firm is producing Qi and Qj in markets i and j. The effect on profit of a small change in Qi is given by
d”,MRi+M~j.~_*Ci_MCj.~, dQi I dQi
and the average revenue constraint requires
p* I+!!% =MR,+MR,.dQ’ [ 1 dQi dQi'
Hence
dll -=p * dQ, [ 1 dQ,
dQi 1+-1 -MC,-MC..--1
dQi ’ dQi
= [p* - MC,] $$f+ [p* - MC,]. I
With this expression it is easy to see if an average revenue constraint could ever yield marginal cost pricing.
Suppose MC,> MC,, then with marginal cost pricing, MCj< P* < MCI. Since dQj/dQi<O, this would imply that with marginal cost pricing dlI/dQ, < 0.
The firm could benefit, while keeping to the average revenue constraint in reducing the more costly output. That is, in the peak load case the firm will

100 I. Bradley and C. Price, Average reuenw regulation and regional price structure
provide less than optimum capacity. What this means is that even if demand is more elastic at peak an average revenue constraint can never yield first- best marginal cost pricing. Clearly, as is the case with marginal cost pricing, if elasticity of demand plays no role in determining efficient prices, then the distortions caused by the constraint through cost differences predominate. If prices that were on average considerably above marginal costs were required to cover full costs, or earn some required profit level, then it is possible for the distortions caused by cost differences to be accidentally mitigated by distortions caused by demand differences if there is an association of higher elasticity and higher costs. There seems no reason why this should be so. Indeed for the relevant utilities, intuition and evidence suggest that demand may be less elastic at peak than at off-peak.
5. Regulation in the U.K.
By definition an average revenue constraint cannot be more efficient than Ramsey pricing, but there are important policy implications beyond analys- ing the nature of the distortions from efficient pricing that the constraint generates. For although some natural monopolies privatised in the U.K. have been subject to average revenue regulation, others have had prices controlled by a tariff basket constraint. This constraint restricts prices that may be set in the current period by restricting the hypothetical total revenue that would be raised if the quantities sold in the previous period had been sold at the new prices. It can be shown that unlike average revenue regulation, tariff basket control may lead to Ramsey pricing [Bradley and Price (1988a)]. Average revenue regulation is therefore a seemingly inferior constraint from an economic efficiency point of view and yet has been applied to more industries. Are there any reasons for such an apparently perverse policy?
Economic efficiency is not, of course, the only appropriate measure of welfare. Although it ensures maximisation of market surplus it pays no heed to the distribution of the surplus, and raises efhciency by increasing relatively the prices of goods in inelastic demand. Such goods may be inelastic in demand because they are basic necessities, so that the increase in their price acts as a regressive tax on consumers. (Cost of connection to some fuel networks is an obvious example.) Separate constraints placed on standing charges in industries subject to price regulation reflect concern that these charges might be used in just such a way, and suggest that in these cases efficiency considerations should be secondary to those of distribution. However, average revenue constraint is less efficient because price differences due to different demand elasticities are exaggerated even further than under Ramsey pricing; in this case lower efficiency seems to coincide with less desirable distributional effects.

I. Bradley and C. Price, Average revenue regulation and regional price structure 101
The imposition of tariff basket control in some industries and an average revenue constraint in others may have something to do with operational advantages or other factors that are particular to the individual industries. The first industry to be privatised and regulated was British Telecom, which is subject to a tariff basket constraint, while British Gas and the British Airports Authority which followed (and later, Manchester Airport) operate with an average revenue constraint. The two most recent industries to be privatised reflect a similar mixture - water is broadly regulated by a tariff basket constraint (although this is obscured by the fact that most domestic consumers pay only a fixed charge for their water, independent of consump- tion), while the electricity industry is to operate with an average revenue constraint.
This continuing mixture suggests that despite the theoretical superiority of the tariff basket constraint on the grounds of economic efficiency the government has made no clear decision in principle between the two forms of constraint.
The average revenue constraint has no clear operational advantages over the tariff basket constraint. The weighting of prices in the average revenue constraint is by current sales, while the tariff basket constraint uses sales in the previous time period. This characteristic makes the outcome of the average revenue constraint subject to greater uncertainty, since average revenue is not known until the end of the period in question (with a tariff basket constraint it can be calculated from previous sales as soon as current prices are determined). This uncertainty necessitates an ‘adjustment’ clause in the regulation formulae for industries concerned, which is an additional administrative complication.
Indeed while in general there has been little discussion of the relative merits and demerits of the constraints, an independent report commissioned by the Department of Transport (1986) recommended that the tariff basket approach be adopted for regulating BAA on the grounds that its relative lack of uncertainty gave it considerable operational advantages. This recommen- dation was overturned, but there has been no published discussion of any reasoning behind the choice of an average revenue constraint for BAA.
The average revenue constraint has a political advantage if it is laxer than tariff basket regulation for the same nominal level of constraint. Both forms of constraint are expressed as a limitation upon the rate of increase of a price index. (Prices as measured by this index must not increase by more than the rate of the retail price index minus X.) X is thus taken as a measure of the fall in real prices. If for the same X one constraint is laxer than the other in terms of potential profits for the firm, then particularly at the time of the process of privatisation this constraint will look relatively appealing to a government. It can claim the benefits of ‘measured price falls’ to consumers equal to those with the alternative constraint together with the prospects of
102 I. Bradley and C. Price, Average revenue regulation and regional price structure
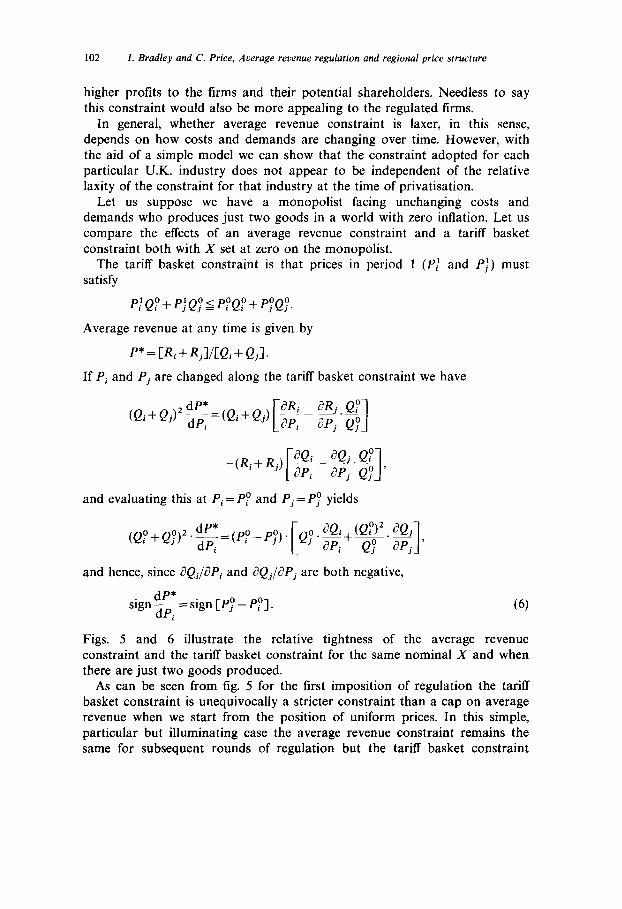
higher profits to the firms and their potential shareholders. Needless to say this constraint would also be more appealing to the regulated firms.
In general, whether average revenue constraint is laxer, in this sense, depends on how costs and demands are changing over time. However, with the aid of a simple model we can show that the constraint adopted for each particular U.K. industry does not appear to be independent of the relative laxity of the constraint for that industry at the time of privatisation.
Let us suppose we have a monopolist facing unchanging costs and demands who produces just two goods in a world with zero inflation. Let us compare the effects of an average revenue constraint and a tariff basket constraint both with X set at zero on the monopolist.
The tariff basket constraint is that prices in period 1 (P! and P;) must satisfy
P;Q~+P,lQ~jP;Q;+P~QQ.
Average revenue at any time is given by
P*=[R,+Rj]/[Qi+Qj].
If Pi and Pj are changed along the tariff basket constraint we have
(Qi+Qj)Z~=(Qi+Qj) !?!! _ !?!kg L api apj ~9 1
-(R.+R.) aQi _ aQ,.$!f I J api 1 apj ~9 ’
and evaluating this at Pi = P" and Pj = Pg yields
and hence, since i3Qi/aPi and dQj/aPj are both negative,
dP* . sign dPi = sign [Pi” -PO].
Figs. 5 and 6 illustrate the relative tightness of the average revenue constraint and the tariff basket constraint for the same nominal X and when there are just two goods produced.
As can be seen from fig. 5 for the first imposition of regulation the tariff basket constraint is unequivocally a stricter constraint than a cap on average revenue when we start from the position of uniform prices. In this simple, particular but illuminating case the average revenue constraint remains the same for subsequent rounds of regulation but the tariff basket constraint

I. Bradley and C. Price, Average revenue regulation and regional price structure 103
'i
Pia --_____
Tariff basket constraint
Pj PP pj Fig. 5. Constraints with X zero. Prices of goods equal in base year.
average revenue constraint
c
pj
Fig. 6. Constraints with same nominal X. Prices of goods not equal in base year.
moves. However, even when this is taken into account the average revenue constraint remains in the long run a laxer regulation.
Suppose the regulated firm raises Pi and lowers Pj along the tariff basket constraint. Average revenue falls (the constraint is tighter than the constant average revenue constraint). In the next period, with costs and demands unchanged we have a new constraint and the tariff basket regulated firm will

104 I. Bradley and C. Price, Average revenue regulation and regional price structure
again adjust Pi upwards and will lower Pj. Again [from eq. (6)] we can see that this reduces average revenue further and hence we must stay with lower prices than the original average revenue constraint would allow.
Thus we can certainly say that industries when privatised inheriting a uniform price structure and faced with the possibility of an RPZ - X form of regulation are going to lobby for an average revenue regulation rather than a tariff basket constraint with the same X.
More than this we can see that if prices are not uniform, then the relative laxity of the constraints depends upon whether the firm wants to relatively raise or lower the higher price. Our argument starting from uniform prices suggests that if you wish to make the current relatively expensive good more expensive, then again for the same X, average revenue is the laxer constraint.
With this in mind we can look at the industries that have been privatised and regulated. British Telecom was given an RPI -3 tariff basket constraint. Prior to privatisation there was certainly no ‘uniform’ pricing policy - telephone call charges being differentiated by distance, time of day, etc. There is little doubt that whatever the constraint, a profit maximising enterprise would have rebalanced the call charges to lower the price of expensive long- distance calls and increase the relative price of local calls. [See OFTEL (1986) for instance.] In terms of our model, British Telecom wished to reduce relatively the price of the ‘expensive’ good, has consistently practised such rebalancing over the last live years, and hence for the same nominal X the tariff basket constraint has been laxer.
Average revenue constraint may well have been used for British Gas because of the industry’s pre-existing commitment to uniform pricing, despite suggestions that it consider alternatives [Energy Committee (1985)]. With a uniform tariff (standing charge plus running rate) for all consumers in the regulated sector, a tariff basket constraint would have required the creation of divisions between regions and categories of demand which would be artificial in terms of existing price structures - however desirable in terms of economic efficiency. The same argument cannot be used either for BAA or the electricity industry - both of which have strongly differentiated prices, but it may explain the origin of the average revenue constraint. Whether or not this be the case, our argument leads to the conclusion that for British Gas an average revenue constraint was an unequivocally laxer regulation than tariff basket control would have been.
We have mentioned already that in the case of BAA while there was at least some public discussion of the relative merits of the two price con- straints, an average revenue constraint was settled upon despite a strong contrary recommendation. There was already considerable price differentia- tion prior to privatisation. Prices varied according not only to the airport used but also peak times were recognised, and aircraft were distinguished by route and size. The current average revenue regulation simply restricts the

I. Bradley and C. Price, Average revenue regulation and regional price structure 105
maximum average revenue per passenger. Total revenue is made up of many charges: landing charges per aircraft, charges per arriving passenger, aircraft parking charges, etc. These individual charges continue to be dependent on airport, time of day, etc. Efficient prices would also depend on such characteristics. However, an average revenue regulation provides incentives to move these prices in such a way as to underprovide capacity at the most popular airport, and overprovide aircraft movements at the less preferred times of day. This is an additional distortion to the obvious one caused by regulating only part of BAA’s activities. The provision of shopping facilities (including duty-free), catering, car parking, and suchlike are not regulated and account for roughly half of BAA’s profits. The current regulation encourages the provision of all night shoppers’ paradises rather than the efficient movement of passengers.
The report by NERA made it clear that BAA should in the interests of both profits and efficiency increase the differential between peak and off-peak prices [Department of Transport (1986, paragraphs 8.21; 8.24; 8.37; 8.49)]. Here again, then, our model indicates that the laxer constraint for the same nominal X has been chosen, and incentives created to generate a long-run inefficient price structure.
The view that this is not coincidental is reinforced by the later regulation of Manchester Airport in 1987. While Manchester Airport is small compared to BAA (which includes Heathrow and Gatwick), it was deemed to be of sufficient significance to be regulated, but not necessarily regulated in the same manner as BAA. The Monopolies and Mergers Commission (1987) investigated the most appropriate form of regulation, repeating the argu- ments used for the case of BAA, and concluding that a tariff basket RPZ - 1 constraint was the best regulation. Manchester Airport plc appealed against this arguing for an average revenue RPZ+2 regulation. The regulators (Civil Aviation Authority (1988)] decided to keep the nominal RPZ - 1 formula, but to change from the recommended tariff basket approach to average revenue. In doing this, the regulators explicitly recognised that this allowed Manches- ter Airport higher profits and basically ignored any arguments about economic efficiency. ‘In reaching its conclusion, the Authority has to set off a perceived detriment to Manchester in terms of revenue loss against what are to some extent theoretical considerations about one formula rather than another’ (Paragraph 28).
The decision was remarkable either in its apparent contempt of economic analysis or in the implied cynicism of choosing a regulation that allows one to claim that prices are falling. However, this adds to the evidence that the choice of an average revenue constraint for some industries, rather than a more desirable price regulation is not mere happenstance.
An aside caveat is necessary here. While we argue that some price regulations are more desirable than others, we acknowledge the commonly

106 I. Bradley and C. Price, Average revenue regulation and regional price structure
recognised potential drawbacks to all. In this context some reference to the pre-privatisation regime may be appropriate. Nationalised industries were subject to some kind of marginal cost pricing rule, although in the case of natural monopolies a combination of cross-subsidisation (from non-natural monopoly parts of the industry) and Ramsey pricing was recommended. (Government guidelines were unclear, and in any case not widely accepted by the industries.) However, one reason for privatising these industries was the suspicion that their costs were higher than necessary, so that the marginal costs to which prices were related were unnecessarily high. Price constraints were introduced as a method of control in order to reinforce the incentive to lower costs which is inherent in profit maximisation. It is difficult to measure either the extent to which costs were unduly high, or how far they have been reduced since privatisation, though various studies have been undertaken [see for example Pryke (1981), Millward (1982) and Bishop and Kay (1988)]. Results are not conclusive.
However, there are concerns that any reductions in cost may have been at the expense of quality, since the product can be redefined in terms of reliability of service. It is clear that a price constrained profit maximising monopolist may choose sub-optimal quality [Sheshinski (1976)], and public disquiet about some industries, for example, British Telecom, suggests that this may have occurred; safeguards for quality have been vigorously debated in the electricity and water privatisation programmes (the latter is compli- cated by quality standards imposed by the EEC). One response to this is the establishment of a set of quality requirements to safeguard minimum standards. Such rigid regulations are unlikely to reflect optimal quality standards because of their inability to adapt to changing technology or consumer preferences, even if they can be chosen appropriately in the first instance.
In the model we have assumed that the monopolist will maximise profits myopically subject to the average revenue constraint. However, the level of profits realised will itself have implications for future regulation, and particularly for the tightness of the constraint. Revision of the constraint is generally the task of the regulator (although its initial level is determined politically as part of the privatisation process) and the main indicator for such revision is the level of profit made by the industry [see OFTEL (1988)]. The industry thus has an incentive to depress apparent profits [Sappington (1980)] and the regulation then acts as if it were a constraint on profits. There is some evidence that this is indeed how industries have reacted to regulation, particularly towards the end of a regulatory period [see Bradley and Price (1988b)].
The effect of profits in determining the extent of regulation is complicated by the co-existence of regulated and unregulated sectors in each industry. Profitability in the regulated sector depends crucially on the allocation of

I. Bradley and C. Price, Average revenue regulation and regional price structure 107
costs, and the four industries so far regulated have inputs common to both regulated and unregulated sectors. In principle the unregulated sector requires no constraint because there is sufficient competition or potential competition to prevent the industry exploiting monopoly power. But in all cases there has been public concern about the industry’s behavior in this unregulated sector, and in the case of gas, the Monopolies and Mergers Commission (MMC) recommended new practices which have been imple- mented. The incentives for the industry to use different accounting techniques in various circumstances is obvious so long as its behaviour is under different forms of constraint - and the MMC commented upon BG’s apparently contradictory cost figures produced for different purposes [MMC (1988)]. Such evidence suggests that myopic profit maximising behaviour in one sector of the industry may only be part of a much broader strategy.
6. Conclusion
This paper has shown that there are unnecessary losses in efficiency imposed by average revenue regulation. Any form of price control may give rise to some strategic behaviour to reduce apparent profits and may have an adverse effect on quality. The potential gain in managerial efficiency from privatisation without explicit rate of return control could equally well be achieved by tariff basket regulation, which is superior on grounds of economic efficiency and appears to have no relative disadvantages. The existing price regulated monopolies in the U.K. have as yet too short a history to analyse the precise costs of the choice of regulation. That is no reason not to reconsider the form of price regulation now, both for industries coming newly to regulation (such as the electricity industry) and for those whose regulation is to be reviewed.
References
Bishop, M. and J. Kay, 1988, Does privatisation work? (London Business School, London). Bradley, I. and C. Price, 1988a, The economic regulation of private industries by price
constraints, Journal of Industrial Economics 37,99-106. Bradley, I. and C. Price, 1988b, The regulation of British Telecom’s prices, Discussion paper 72
(University of Leicester, Leicester). Civil Aviation Authority, 1988, Airports Act 1986. In the matter of Manchester Airport plc,
Conditions as to airport charges (Civil Aviation Authority, London). Crew, M. and P. Kleindorfer, 1979, Public utility economics (Macmillan, London). Department of Transport, 1986, Economic regulation of the British Airports Authority plc
(H.M.S.O., London). Energy Committee, 1985, The development and depletion of the U.K.‘s gas resources, HCP 97-l
(H.M.S.O., London). Millward, R., 1982, The comparative performance of public and private enterprise, in: Lord Roll,
ed., The mixed economy (Macmillan, London). Monopolies & Mergers Commission (MMC), 1987, Manchester Airport plc, C.A.A. (H.M.S.O.,
London).

108 I. Bradley and C. Price, Average revenue regulation and regional price structure
Monopolies & Mergers Commission, 1988, Gas Cm 500 (H.M.S.O., London). OFTEL, 1986, Review of British Telecom’s tariff changes, November 1986 (OFTEL, London). OFTEL, 1988, The regulation of British Telecom’s prices; a consultative document (OFTEL,
London). Pryke, R., 1981, The national&d industries (Martin Robertson, Oxford). Rees, R., 1984, Public enterprise economics, 2nd ed. (Weidenfeld and Nicolson, London). Sappington, D., 1980, Strategic firm behaviour under a dynamic regulatory adjustment process,
The Bell Journal of Economics 11. 360-372. Sheshinski, E., 1976, Price, quality and quantity regulation in monopoly situations, Economica
43, 127-137.