average palay yield in the Philippines has not gone beyond ... · PDF file3 Data and Data...
15
A STUDY ON RICE SELF-SUFFICIENCY IN MINDANAO Emelie Gloria-Pelicano and Dr. Edmundo B. Prantilla 1 1 M.S. Economics graduate and Faculty member respectively, School of Applied economics University of Southeastern Philippines, Obrero, Davao City Abstract The main objective of the study is to determine the rice self-sufficiency in Mindanao in period 1990-2009. It specifically aims to determine the trend of palay/rice production and requirement, and rice self-sufficiency in regional and provincial levels, and to project rice self- sufficiency in Mindanao, by region and by province in period 2010 to 2020. Results of the study showed that Mindanao palay production generally increasing at a rate of 3% per year in 1990 -2009. SOCCSKSARGEN leads production that shared 32% to total palay production while the Caraga Region had the lowest share of 11%. Palay production in all regions has increased except Davao region. The increase in production in Zamboanga Peninsula and Northern Mindanao was due to improvements in yield per hectare while those in Central Mindanao, Caraga, and ARMM were due to area expansion. In the provincial level, 21% of the provinces in Mindanao showed an increasing trend in palay production and 36% manifested a declining area harvested to palay. Results of the study revealed that Mindanao did not achieve rice self-sufficiency under varying postharvest losses. Regional level analysis showed that SOCCSKSARGEN experienced rice self-sufficiency, and in the provincial level, 39% of the provinces in Mindanao had achieved rice self-sufficiency. It is projected that rice self-sufficiency status in Mindanao can be achieved in 2017 with minimum postharvest losses. In the regional level, SOCCSKSARGEN rice self- sufficiency status will be sustained. The Zamboanga Peninsula and Caraga regions is projected to have minimal rice shortage with minimum postharvest losses while Davao region, Northern Mindanao, and ARMM have the greatest risk of rice shortage under varying levels of postharvest losses. In provincial level, 21% are projected to experience rice self-sufficiency and 25% at the less than 50% level. KEYWORDS: Rice, palay, rice/palay production and requirement, rice self-sufficiency 1. Introduction Rice 2 (Oryza sativa) is the most important food crop in the Philippines. More than 90% of all Philippine households consider rice as the staple food item and it takes up a quarter (25%) of household total food budget of Filipino families (Tolentino, 2001). According to the Resource Center for People's Development, "rice nourishes almost 80% of Filipinos everyday and supports the livelihood of at least half the country's work force (Pabuayon, 2002). The demand for rice in the Philippines, however, has been rarely met by domestic production. Experts say the potential of rice production in the Philippines is one of the highest in Asia. However, the Philippines have performed way below this potential. The International Rice Research Institute (IRRI) set the maximum attainable rice yield per hectare at 6.30 tons, while the required yield to attain rice self-sufficiency stands at 5.30 tons per hectare. The 2 Rice denotes milled palay, while palay denotes un-milled grains.
Transcript of average palay yield in the Philippines has not gone beyond ... · PDF file3 Data and Data...
A STUDY ON RICE SELF-SUFFICIENCY IN MINDANAO
Emelie Gloria-Pelicano and Dr. Edmundo B. Prantilla1
1 M.S. Economics graduate and Faculty member respectively,School of Applied economics University of Southeastern
Philippines, Obrero, Davao City
Abstract
The main objective of the study is to determine the rice self-sufficiency in Mindanao inperiod 1990-2009. It specifically aims to determine the trend of palay/rice production andrequirement, and rice self-sufficiency in regional and provincial levels, and to project rice self-sufficiency in Mindanao, by region and by province in period 2010 to 2020.
Results of the study showed that Mindanao palay production generally increasing at arate of 3% per year in 1990 -2009. SOCCSKSARGEN leads production that shared 32% tototal palay production while the Caraga Region had the lowest share of 11%. Palayproduction in all regions has increased except Davao region. The increase in production inZamboanga Peninsula and Northern Mindanao was due to improvements in yield per hectarewhile those in Central Mindanao, Caraga, and ARMM were due to area expansion. In theprovincial level, 21% of the provinces in Mindanao showed an increasing trend in palayproduction and 36% manifested a declining area harvested to palay.
Results of the study revealed that Mindanao did not achieve rice self-sufficiencyunder varying postharvest losses. Regional level analysis showed that SOCCSKSARGENexperienced rice self-sufficiency, and in the provincial level, 39% of the provinces inMindanao had achieved rice self-sufficiency.
It is projected that rice self-sufficiency status in Mindanao can be achieved in 2017with minimum postharvest losses. In the regional level, SOCCSKSARGEN rice self-sufficiency status will be sustained. The Zamboanga Peninsula and Caraga regions isprojected to have minimal rice shortage with minimum postharvest losses while Davao region,Northern Mindanao, and ARMM have the greatest risk of rice shortage under varying levels ofpostharvest losses. In provincial level, 21% are projected to experience rice self-sufficiencyand 25% at the less than 50% level.KEYWORDS: Rice, palay, rice/palay production and requirement, rice self-sufficiency
1. IntroductionRice2 (Oryza sativa) is the most important food crop in the Philippines. More than
90% of all Philippine households consider rice as the staple food item and it takes up aquarter (25%) of household total food budget of Filipino families (Tolentino, 2001). Accordingto the Resource Center for People's Development, "rice nourishes almost 80% of Filipinoseveryday and supports the livelihood of at least half the country's work force (Pabuayon,2002).
The demand for rice in the Philippines, however, has been rarely met by domesticproduction. Experts say the potential of rice production in the Philippines is one of the highestin Asia. However, the Philippines have performed way below this potential. The InternationalRice Research Institute (IRRI) set the maximum attainable rice yield per hectare at 6.30 tons,while the required yield to attain rice self-sufficiency stands at 5.30 tons per hectare. The
2 Rice denotes milled palay, while palay denotes un-milled grains.
2
average palay yield in the Philippines has not gone beyond 3.07 tons per hectare (Pabuayon,2002).
In Mindanao, production of palay showed an increasing trend from 1995 to 2004 withan average growth rate of 2% per year. The increase in production is attributed to theexpansion of harvested area and higher yield per hectare due to the improved rice varietiesused by the farmers. In addition, increased yield could be also due to the expansion in rainfedand irrigated harvested areas as a result of good water supply from both irrigation systemsand rainfall (DA, 2005).
In 2005, the problem of crop shifting in the Davao Region was observed. Data fromthe Department of Agriculture showed that area harvested to palay decreased from 108,374hectares in 2005 to 97,487 hectares in 2007, a drop of more than10%. In general, areasplanted to rice were shifted to banana farms due to a huge demand for bananas in the exportmarket. Davao del Norte recorded the highest conversion of rice land to bananas. As a result,the province registered the largest decrease in the area planted to rice. In Compostela Valley,4,984 hectares of rice lands were also converted to banana farms (DA, 2008). It is alsoobserved that a large portion of areas converted to banana farms are irrigated farms.
The result of the national census of 2000 showed that the population of Mindanaoreached 18.1 million or roughly 24% of the country’s total population, with an annual growthrate of 2.44 %. Among the regions of Mindanao, Northern Mindanao has the highest urbanpopulation (78.75 %) while ARMM has the highest rural population. The population ofMindanao in 2007 reached more than 21 million (NSO, 2007).
Rationale
The prevailing perception is that Mindanao is the breadbasket of the Philippines,second to Central Luzon, which is considered the rice granary of the country. Mindanao is amajor source of cereals of the Philippines. This perception seems to have been based on theagricultural area of Mindanao and the fact that historically, Mindanao has been considered asrice and corn surplus area of the country. At present, however, this perception is now beingquestioned, basically because, Mindanao has experienced shortage in rice, and a number ofprovinces of Mindanao in fact are deficit rice-producing areas.
At present, Mindanao has to depend on rice imports to meet its rice consumptionrequirement. In the past, there seems to be no problem in importing rice to cover the deficit indomestic rice production. However, the world supply of cereals is becoming tight and isexpected to be tighter in the future. This means that the available world supply of rice will belimited and that the price of rice is expected to increase in the near future. Accordingly, theaccepted rice policy of importing a country’s rice requirement in the past, while producing highvalued crops and other commodities, does not look attractive anymore.
The projected decline of rice surplus in the world market requires Philippines toexamine other policy options to meet its rice requirement. For Mindanao, one of thesealternatives is to assess the capacity of Mindanao for rice self-sufficiency. To address suchalternative, this study was conducted to assess the land and other resources of Mindanao todetermine its existing rice self-sufficiency status. This includes an analysis of the trend of areaharvested, production and yield of palay under different environment and under differenttechnologies. This considered population growth and population projection of Mindanao,consumption patterns of cereals, and demand on rice. Finally, among others, the studyprojected the rice self-sufficiency for 10 years using different assumptions on land useutilization, income, population growth, technology of production, and post harvest losses.
Objectives
The overall objective of the study was to measure the rice self-sufficiency inMindanao. Specifically, it aimed to:
1. Determine the trend of total provincial, regional and Mindanao palay/riceproduction;
2. Determine the trend of total provincial, regional, and Mindanao rice requirement;3. Calculate the past trend of rice-self sufficiency status of each province, region and
the whole of Mindanao; and4. Project the rice self-sufficiency status of each province, region and the whole of
Mindanao using different scenario for the period 2010 to 2020.
3
Data and Data Sources
The data used in this study were taken from the offices and websites of differentagencies. Palay production, area harvested, seed allowances, feeds, and other uses datacame from the Metadata for National Agricultural Statistics of the Philippines of the Bureau ofAgricultural Statistics (BAS). Population and growth rate in census year were taken fromNational Statistics Office (NSO) and National Statistics Coordination Board (NSCB) websites.Data on irrigated and non-irrigated areas were from National Irrigation Administration (NIA).Total rice imports per region were taken from National Food Authority (NFA) website.Postharvest losses came from the studies conducted by IRRI and others. Buffer stock followsthe requirement set by the NFA which is equal to 30-day average national consumption.
2. Methodology
Conceptual Framework
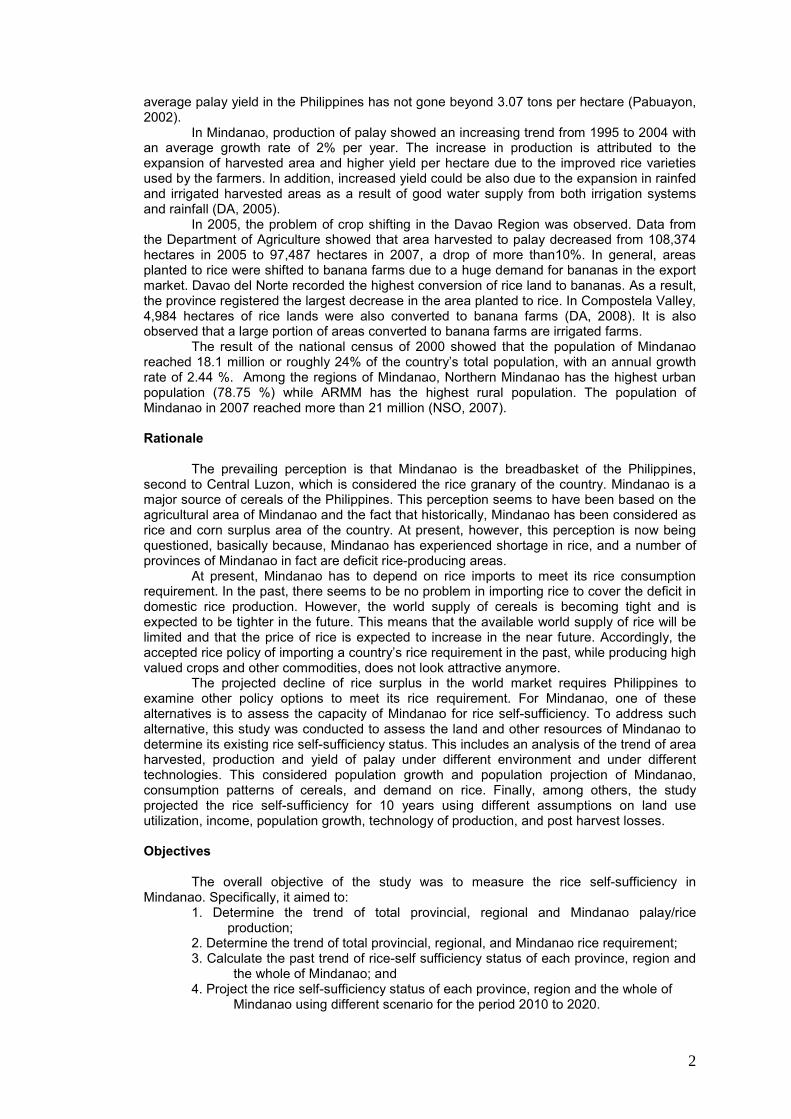
Fig.1. Conceptual framework showing rice self-sufficiency in Mindanao.
Rice Self-Sufficiency Measurement
The total annual domestic rice supply (Sr), in metric tons (mt) is expressed as:
Srt = {Ʃ AitYit– (Zit + Sit)} (0.65) (1)
where:Ait = area harvested by environment (irrigated or rainfed) of the ith
region or province in year tQit = palay output by environment of the ith region or province in year tYit = palay yield per hectare by environment of the ith region or province in
year tZit =postharvest losses by environment of the ith region or province in year t
Area Harvested
Palayoutput
Postharvestlosses
Seedallowance
Riceequivalent
TotalRicesupply
Rice imports
Yield per hectare
Population
Rice per capitaconsumption
Human riceconsumptionrequirement
Buffer stockrequirement
feeds
Other uses
Rice surplus(deficit)
Total ricerequirement
4
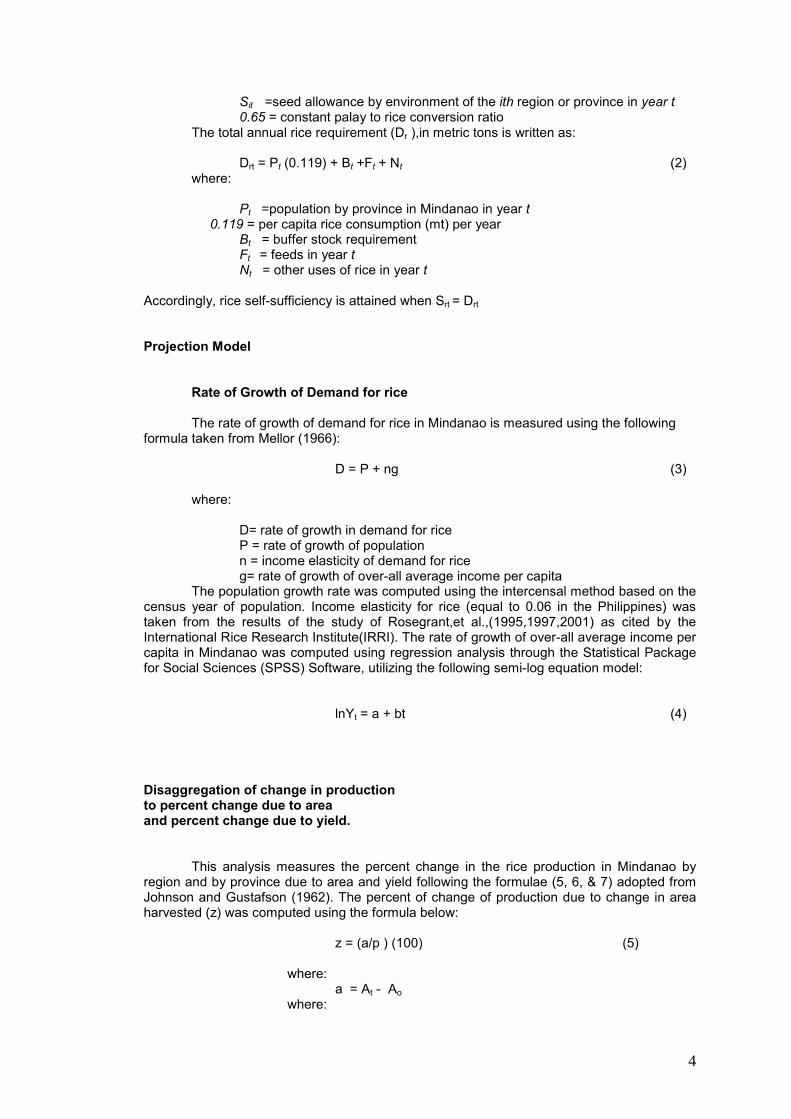
Sit =seed allowance by environment of the ith region or province in year t0.65 = constant palay to rice conversion ratio
The total annual rice requirement (Dr ),in metric tons is written as:
Drt = Pt (0.119) + Bt +Ft + Nt (2)where:
Pt =population by province in Mindanao in year t0.119 = per capita rice consumption (mt) per year
Bt = buffer stock requirementFt = feeds in year tNt = other uses of rice in year t
Accordingly, rice self-sufficiency is attained when Srt = Drt
Projection Model
Rate of Growth of Demand for rice
The rate of growth of demand for rice in Mindanao is measured using the followingformula taken from Mellor (1966):
D = P + ng (3)
where:
D= rate of growth in demand for riceP = rate of growth of populationn = income elasticity of demand for riceg= rate of growth of over-all average income per capita
The population growth rate was computed using the intercensal method based on thecensus year of population. Income elasticity for rice (equal to 0.06 in the Philippines) wastaken from the results of the study of Rosegrant,et al.,(1995,1997,2001) as cited by theInternational Rice Research Institute(IRRI). The rate of growth of over-all average income percapita in Mindanao was computed using regression analysis through the Statistical Packagefor Social Sciences (SPSS) Software, utilizing the following semi-log equation model:
lnYt = a + bt (4)
Disaggregation of change in productionto percent change due to areaand percent change due to yield.
This analysis measures the percent change in the rice production in Mindanao byregion and by province due to area and yield following the formulae (5, 6, & 7) adopted fromJohnson and Gustafson (1962). The percent of change of production due to change in areaharvested (z) was computed using the formula below:
z = (a/p ) (100) (5)
where:a = At - Ao
where:

5
At = log of area at the end period, average of 5 years of endperiod
Ao= log of area at the beginning period, average of beginning5 years of starting period
p= Pt – Po (6)where:
Pt = log of production at the end period, average of last 5years of end period
Po = log of production at the beginning period, average oflast 5 years of starting period
The percent of change of production due to change in yield (y) was computed usingthe formula below:
y = (e/p )100 (7)where:
e = Et – Eowhere:
Et= log of yield at the end period, average of last 5 years atthe end of the period
Eo =log of yield at the beginning period, average of beginning5 years at the starting period.
Δa + Δe = 100% (8)
The logarithmic interpolation (L.I.) term is equal to [100- (Δa + Δe)]
Effects of changes in area distributionon palay yields during the periods1990- 1995 to 2005 -2009
The effects of changes in hectarage distribution on palay yields in Mindanao wascomputed for a 5-year average period using the formula adopted from Johnson andGustafson(1962) as shown below.
(1) Beginning /Base Year (1990-1995)
, i= 1,2,…,6 (9)
(10)
(11)
(12)
where:
Ai = area harvested to palay in the ith regionYi = yield per hectare of palay in the ith region
3. Results

6
Mindanao palay production has an average of 3.1 million metric tons and stillincreasing at a rate of 3 % (Fig. 2) and potential yield was not yet attain. SOCCSKSARGENhas the biggest area harvested while the Davao region has the smallest (Fig. 3).

7
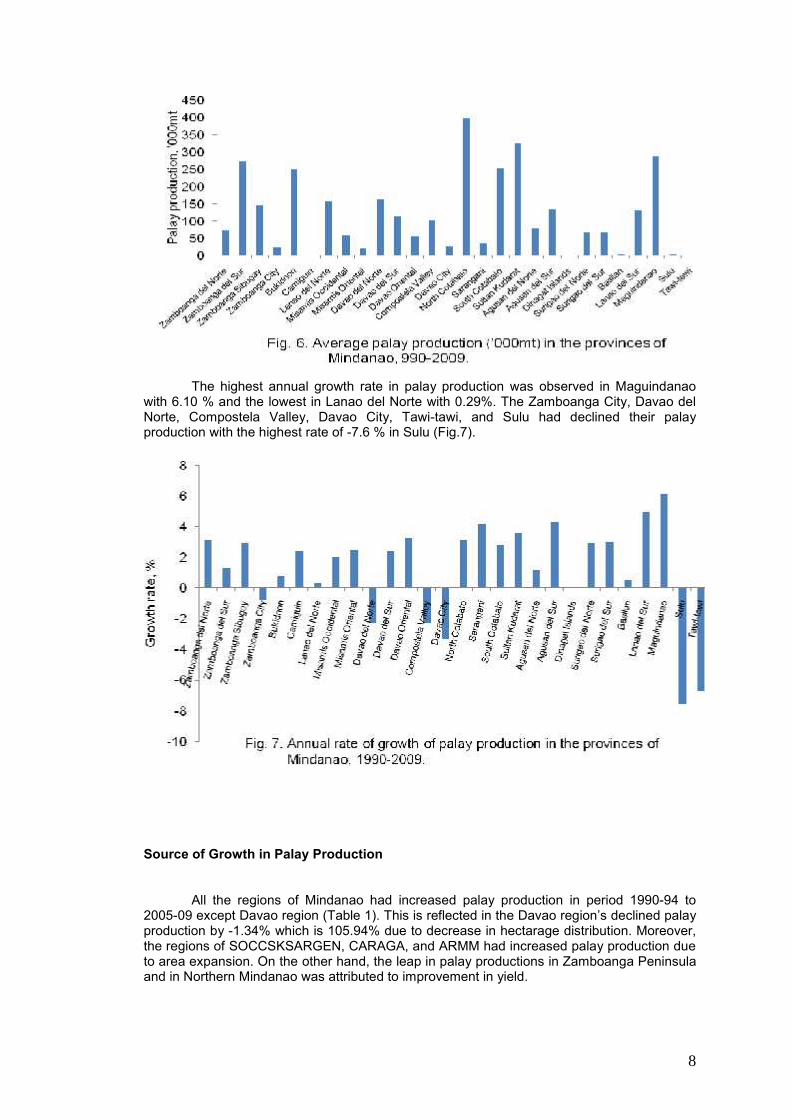
However, the Davao region registered the highest yield per hectare while the lowestwas recorded in ARMM. Annual growth rates of palay production, area harvested, and yieldper hectare in regions of Mindanao are summarized in Figure 4. In regional level,SOCCSKSARGEN shares the biggest in the total palay production in Mindanao whileCARAGA region shares lowest (Fig.5). In provincial level, Zamboanga del Sur, NorthCotabato, Sultan Kudarat and Maguindanao had the biggest palay production whilesignificantly lowest in Camiguin, Dinagat Islands, Sulu, and Tawi-tawi (Fig.6).
8
The highest annual growth rate in palay production was observed in Maguindanaowith 6.10 % and the lowest in Lanao del Norte with 0.29%. The Zamboanga City, Davao delNorte, Compostela Valley, Davao City, Tawi-tawi, and Sulu had declined their palayproduction with the highest rate of -7.6 % in Sulu (Fig.7).
Source of Growth in Palay Production
All the regions of Mindanao had increased palay production in period 1990-94 to2005-09 except Davao region (Table 1). This is reflected in the Davao region’s declined palayproduction by -1.34% which is 105.94% due to decrease in hectarage distribution. Moreover,the regions of SOCCSKSARGEN, CARAGA, and ARMM had increased palay production dueto area expansion. On the other hand, the leap in palay productions in Zamboanga Peninsulaand in Northern Mindanao was attributed to improvement in yield.
9
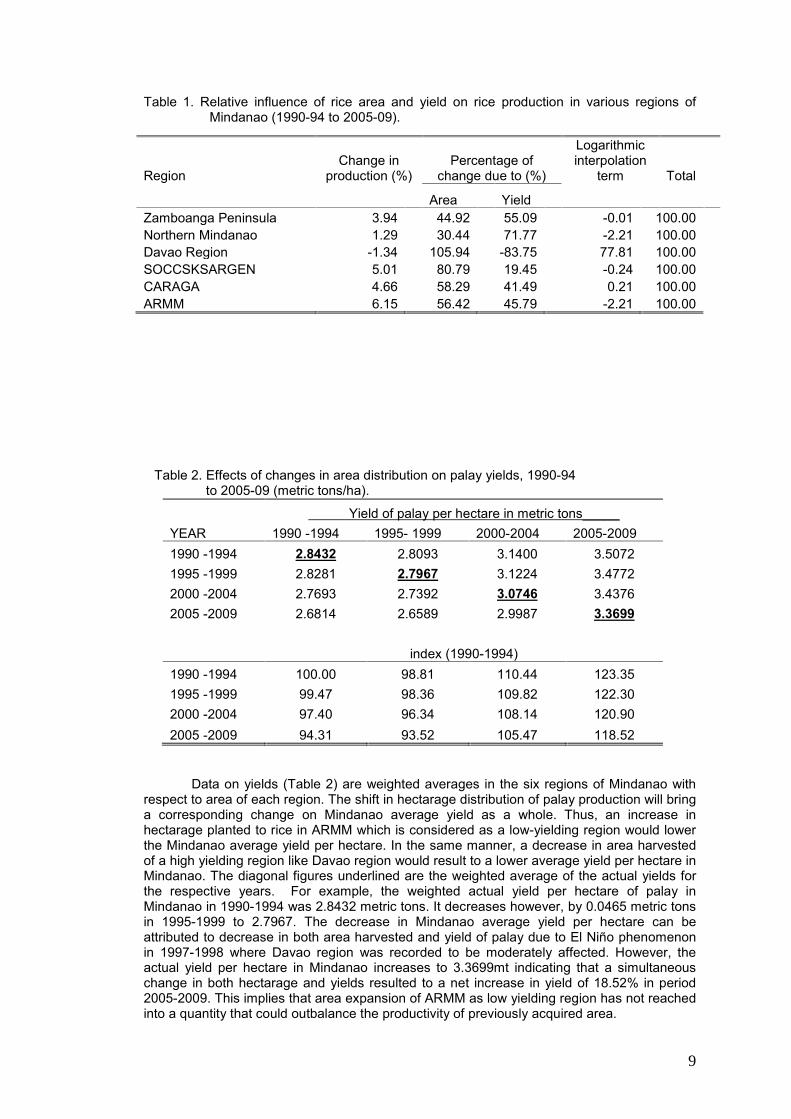
Table 1. Relative influence of rice area and yield on rice production in various regions ofMindanao (1990-94 to 2005-09).
Table 2. Effects of changes in area distribution on palay yields, 1990-94to 2005-09 (metric tons/ha).
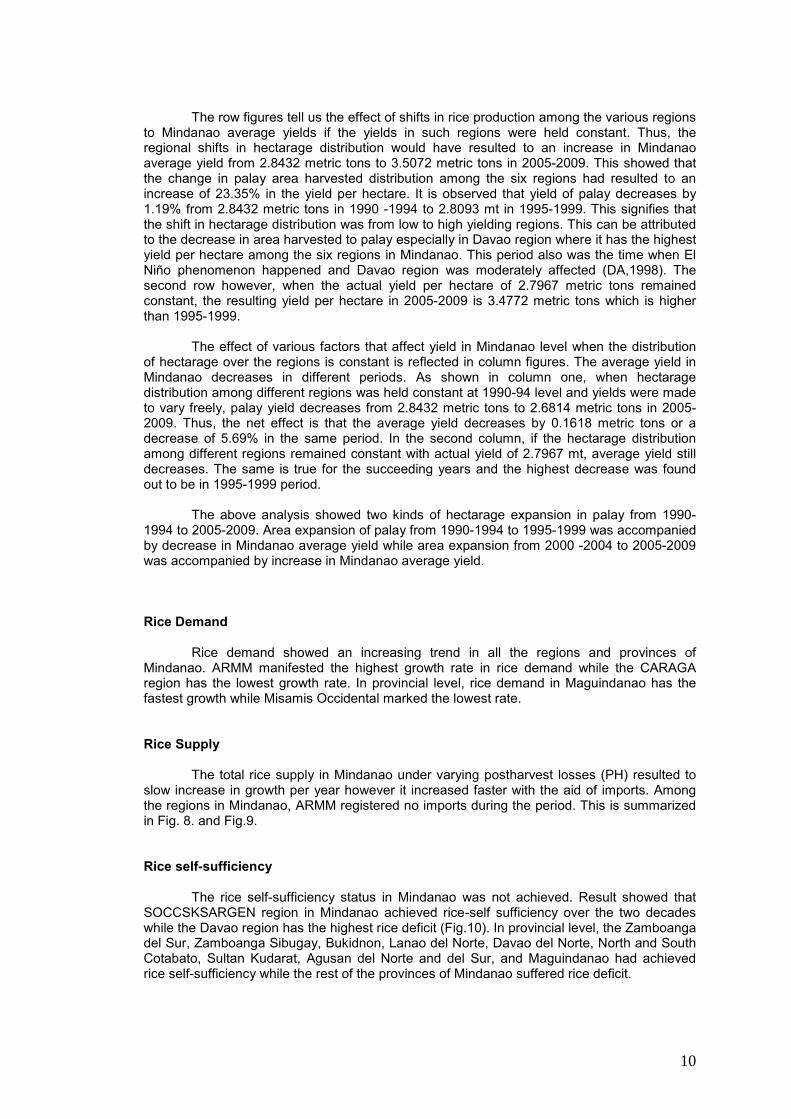
Yield of palay per hectare in metric tons_____YEAR 1990 -1994 1995- 1999 2000-2004 2005-20091990 -1994 2.8432 2.8093 3.1400 3.50721995 -1999 2.8281 2.7967 3.1224 3.47722000 -2004 2.7693 2.7392 3.0746 3.43762005 -2009 2.6814 2.6589 2.9987 3.3699
index (1990-1994)1990 -1994 100.00 98.81 110.44 123.351995 -1999 99.47 98.36 109.82 122.302000 -2004 97.40 96.34 108.14 120.902005 -2009 94.31 93.52 105.47 118.52
Data on yields (Table 2) are weighted averages in the six regions of Mindanao withrespect to area of each region. The shift in hectarage distribution of palay production will bringa corresponding change on Mindanao average yield as a whole. Thus, an increase inhectarage planted to rice in ARMM which is considered as a low-yielding region would lowerthe Mindanao average yield per hectare. In the same manner, a decrease in area harvestedof a high yielding region like Davao region would result to a lower average yield per hectare inMindanao. The diagonal figures underlined are the weighted average of the actual yields forthe respective years. For example, the weighted actual yield per hectare of palay inMindanao in 1990-1994 was 2.8432 metric tons. It decreases however, by 0.0465 metric tonsin 1995-1999 to 2.7967. The decrease in Mindanao average yield per hectare can beattributed to decrease in both area harvested and yield of palay due to El Niño phenomenonin 1997-1998 where Davao region was recorded to be moderately affected. However, theactual yield per hectare in Mindanao increases to 3.3699mt indicating that a simultaneouschange in both hectarage and yields resulted to a net increase in yield of 18.52% in period2005-2009. This implies that area expansion of ARMM as low yielding region has not reachedinto a quantity that could outbalance the productivity of previously acquired area.
RegionChange in
production (%)Percentage of
change due to (%)
Logarithmicinterpolation
term Total
Area YieldZamboanga Peninsula 3.94 44.92 55.09 -0.01 100.00Northern Mindanao 1.29 30.44 71.77 -2.21 100.00Davao Region -1.34 105.94 -83.75 77.81 100.00SOCCSKSARGEN 5.01 80.79 19.45 -0.24 100.00CARAGA 4.66 58.29 41.49 0.21 100.00ARMM 6.15 56.42 45.79 -2.21 100.00
10
The row figures tell us the effect of shifts in rice production among the various regionsto Mindanao average yields if the yields in such regions were held constant. Thus, theregional shifts in hectarage distribution would have resulted to an increase in Mindanaoaverage yield from 2.8432 metric tons to 3.5072 metric tons in 2005-2009. This showed thatthe change in palay area harvested distribution among the six regions had resulted to anincrease of 23.35% in the yield per hectare. It is observed that yield of palay decreases by1.19% from 2.8432 metric tons in 1990 -1994 to 2.8093 mt in 1995-1999. This signifies thatthe shift in hectarage distribution was from low to high yielding regions. This can be attributedto the decrease in area harvested to palay especially in Davao region where it has the highestyield per hectare among the six regions in Mindanao. This period also was the time when ElNiño phenomenon happened and Davao region was moderately affected (DA,1998). Thesecond row however, when the actual yield per hectare of 2.7967 metric tons remainedconstant, the resulting yield per hectare in 2005-2009 is 3.4772 metric tons which is higherthan 1995-1999.
The effect of various factors that affect yield in Mindanao level when the distributionof hectarage over the regions is constant is reflected in column figures. The average yield inMindanao decreases in different periods. As shown in column one, when hectaragedistribution among different regions was held constant at 1990-94 level and yields were madeto vary freely, palay yield decreases from 2.8432 metric tons to 2.6814 metric tons in 2005-2009. Thus, the net effect is that the average yield decreases by 0.1618 metric tons or adecrease of 5.69% in the same period. In the second column, if the hectarage distributionamong different regions remained constant with actual yield of 2.7967 mt, average yield stilldecreases. The same is true for the succeeding years and the highest decrease was foundout to be in 1995-1999 period.
The above analysis showed two kinds of hectarage expansion in palay from 1990-1994 to 2005-2009. Area expansion of palay from 1990-1994 to 1995-1999 was accompaniedby decrease in Mindanao average yield while area expansion from 2000 -2004 to 2005-2009was accompanied by increase in Mindanao average yield.
Rice Demand
Rice demand showed an increasing trend in all the regions and provinces ofMindanao. ARMM manifested the highest growth rate in rice demand while the CARAGAregion has the lowest growth rate. In provincial level, rice demand in Maguindanao has thefastest growth while Misamis Occidental marked the lowest rate.
Rice Supply
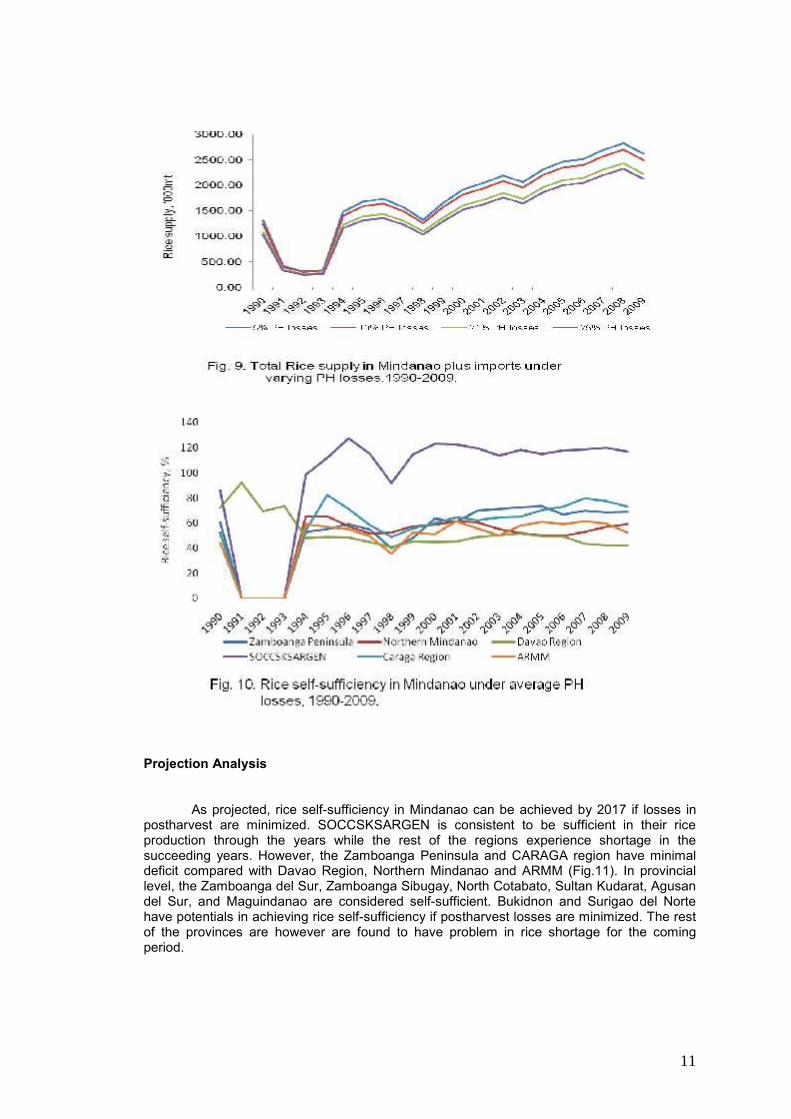
The total rice supply in Mindanao under varying postharvest losses (PH) resulted toslow increase in growth per year however it increased faster with the aid of imports. Amongthe regions in Mindanao, ARMM registered no imports during the period. This is summarizedin Fig. 8. and Fig.9.
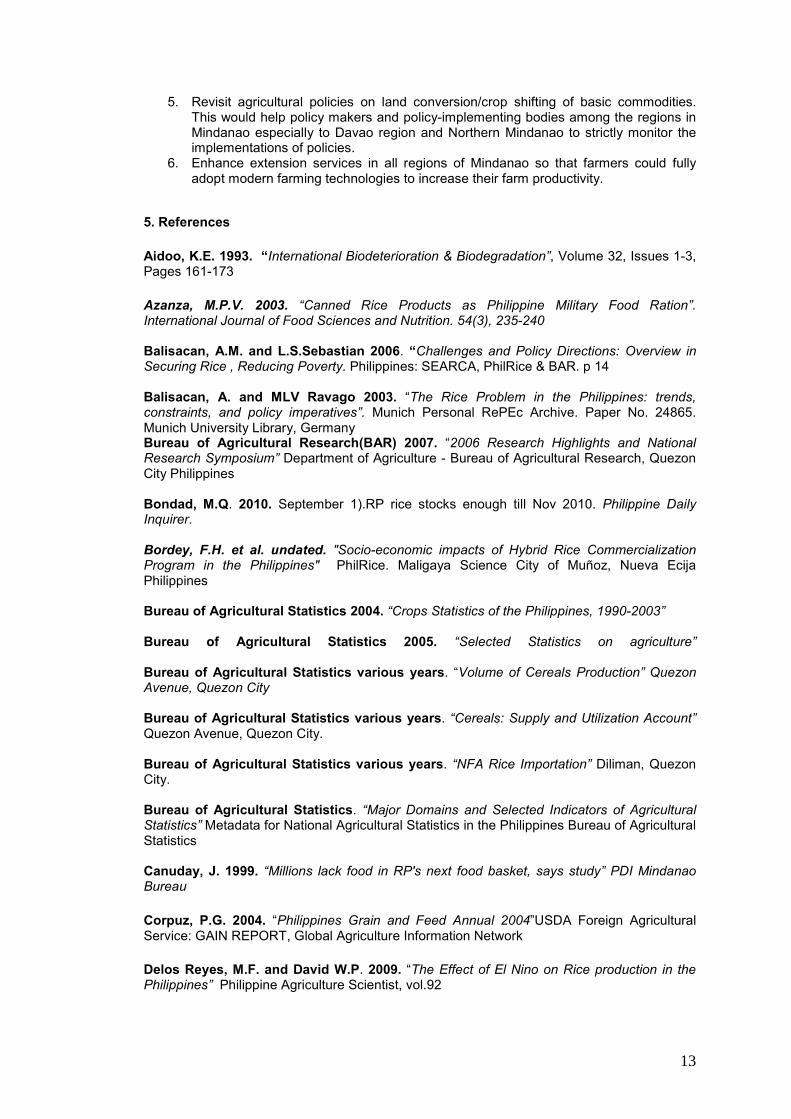
Rice self-sufficiency
The rice self-sufficiency status in Mindanao was not achieved. Result showed thatSOCCSKSARGEN region in Mindanao achieved rice-self sufficiency over the two decadeswhile the Davao region has the highest rice deficit (Fig.10). In provincial level, the Zamboangadel Sur, Zamboanga Sibugay, Bukidnon, Lanao del Norte, Davao del Norte, North and SouthCotabato, Sultan Kudarat, Agusan del Norte and del Sur, and Maguindanao had achievedrice self-sufficiency while the rest of the provinces of Mindanao suffered rice deficit.
11
Projection Analysis
As projected, rice self-sufficiency in Mindanao can be achieved by 2017 if losses inpostharvest are minimized. SOCCSKSARGEN is consistent to be sufficient in their riceproduction through the years while the rest of the regions experience shortage in thesucceeding years. However, the Zamboanga Peninsula and CARAGA region have minimaldeficit compared with Davao Region, Northern Mindanao and ARMM (Fig.11). In provinciallevel, the Zamboanga del Sur, Zamboanga Sibugay, North Cotabato, Sultan Kudarat, Agusandel Sur, and Maguindanao are considered self-sufficient. Bukidnon and Surigao del Nortehave potentials in achieving rice self-sufficiency if postharvest losses are minimized. The restof the provinces are however are found to have problem in rice shortage for the comingperiod.

12
4. Conclusions
Based on the results, the following are concluded:1. The area contraction in Davao region and Northern Mindanao are generally due
to crop shifting and prevalent land conversion to other uses prevailing in thearea.
2. The slow area expansion in Zamboanga Peninsula, Central Mindanao andCARAGA region implies that Mindanao is reaching the limit of rice productionand slow expansion of irrigated area and low efficiency of existing irrigationsystems are present.
3. The negative growth rates of yield per hectare in Central Mindanao and ARMMwhile very slow in Northern Mindanao imply that the use of modern technologyis not widespread in the region and possible inefficiency of existing irrigationfacilities.
4. The decline in area harvested in Zamboanga City, Davao del Norte,Compostela Valley, Davao City, Sulu and Tawi-tawi which resulted to greaterrice insufficiency maybe due to crop shifting and conversion of land to otheruses.
5. Low productivity among the provinces of Mindanao implies that rice farmers arestill using low-yielding rice varieties, lack extension services and of goodirrigation facilities.
6. Rice self-sufficiency in Mindanao is possible if postharvest losses areminimized.
Policy Implications
Based on the results of the study, the following policy implications are advanced:1. Provide infrastructure support and improved rice postharvest facilities and equipment
to rice farmers.2. Expand and increase irrigation and postharvest facilities in all regions of Mindanao
with priority given to rice producing areas.3. Adoption of high yielding varieties among rice farmers in Mindanao should be
encouraged through intensive extension services.4. Policies on land conversion under the Strategic Agriculture and Fisheries
Development Zone (SAFDZ) should be strictly implemented in all regions or solutionsfor further land conversion should be made since the region is favorable for riceproduction.
13
5. Revisit agricultural policies on land conversion/crop shifting of basic commodities.This would help policy makers and policy-implementing bodies among the regions inMindanao especially to Davao region and Northern Mindanao to strictly monitor theimplementations of policies.
6. Enhance extension services in all regions of Mindanao so that farmers could fullyadopt modern farming technologies to increase their farm productivity.
5. References
Aidoo, K.E. 1993. “International Biodeterioration & Biodegradation”, Volume 32, Issues 1-3,Pages 161-173
Azanza, M.P.V. 2003. “Canned Rice Products as Philippine Military Food Ration”.International Journal of Food Sciences and Nutrition. 54(3), 235-240
Balisacan, A.M. and L.S.Sebastian 2006. “Challenges and Policy Directions: Overview inSecuring Rice , Reducing Poverty. Philippines: SEARCA, PhilRice & BAR. p 14
Balisacan, A. and MLV Ravago 2003. “The Rice Problem in the Philippines: trends,constraints, and policy imperatives”. Munich Personal RePEc Archive. Paper No. 24865.Munich University Library, GermanyBureau of Agricultural Research(BAR) 2007. “2006 Research Highlights and NationalResearch Symposium” Department of Agriculture - Bureau of Agricultural Research, QuezonCity Philippines
Bondad, M.Q. 2010. September 1).RP rice stocks enough till Nov 2010. Philippine DailyInquirer.
Bordey, F.H. et al. undated. "Socio-economic impacts of Hybrid Rice CommercializationProgram in the Philippines" PhilRice. Maligaya Science City of Muñoz, Nueva EcijaPhilippines
Bureau of Agricultural Statistics 2004. “Crops Statistics of the Philippines, 1990-2003”
Bureau of Agricultural Statistics 2005. “Selected Statistics on agriculture”
Bureau of Agricultural Statistics various years. “Volume of Cereals Production” QuezonAvenue, Quezon City
Bureau of Agricultural Statistics various years. “Cereals: Supply and Utilization Account”Quezon Avenue, Quezon City.
Bureau of Agricultural Statistics various years. “NFA Rice Importation” Diliman, QuezonCity.
Bureau of Agricultural Statistics. “Major Domains and Selected Indicators of AgriculturalStatistics” Metadata for National Agricultural Statistics in the Philippines Bureau of AgriculturalStatistics
Canuday, J. 1999. “Millions lack food in RP's next food basket, says study” PDI MindanaoBureau
Corpuz, P.G. 2004. “Philippines Grain and Feed Annual 2004”USDA Foreign AgriculturalService: GAIN REPORT, Global Agriculture Information Network
Delos Reyes, M.F. and David W.P. 2009. “The Effect of El Nino on Rice production in thePhilippines” Philippine Agriculture Scientist, vol.92

14
Daño, E.C. & Samonte E.D. 2007. “State of the Rice Industry in Mindanao” Rice Watch andAction Network and Food Sovereignty Watch – Mindanao
Drillon, J.D. and Sangit, D.F. 1978. “Rice Post-Production and Processing: Its Significanceto Agricultural Development in Accelerated Agricultural Development” SERCA College,Laguna, Philippines
David, C.C. 1995. “Philippine Irrigation Development: Overview, Determinant, and PolicyIssues” DISCUSSION PAPER SERIES NO.95-26.Philippine Institute for DevelopmentStudies
David, W.P. 2000. “Constraints, Opportunities and Options in Irrigation Developmen”Philippines Institute for Development Studies, Discussion Paper
Department of Agriculture 2005. “Focusing on Increasing Provincial Productivity” Rice Self-Sufficiency Plan 2009-2010
Drummond, H.E. and Goodwin J. 2001. “ Introduction to Agricultural Economics. PrenticeHall Inc
Duque, L.V. 2010. “Subsidizing the National Food Authority: Is It a Good Policy?” PolicyBrief
Food and Agriculture Organization of the United Nations 1997. “Estimated Post-HarvestLosses of Rice in Southeast Asia.” Available online at:http://www.fao.org/News/FACTFILE/FF9712-E.HTM .
Go, M. V. 2008, April 28. http://www.philstar.com/index.php.Monday.
Gonzales, N. undated. “NFA Buffer Stock requirement”
Hernandez, M.E. 2007. “Hybrid Rice Over Inbred Rice: A Socio-economic Assessment”Volume 9, Issue No. 3
Johnson, D.G. and Gustafson, R.L. 1962. “Grain Yields and the American Food Supply, AnAnalysis of Yield Change and Possibilities” The University of Chicago Press, Chicago, p.17-21
Kenji, C. and Hironori, Y. 2001. “Agricultural and Rural Development in the Transition inVietnamese Agriculture under Market-Oriented Economy” Agricultural Publishing House.Hanoi, Vietnam
Lantin, Ray. 1996. “Rice: Postharvest Operations” International Rice Research Institute
McConnell, C. R. and S.L. Brue 2005. “Macroeconomics: Principles, Problems, andPolicies” McGraw-Hill
MEDCo 2005. “2004 Mindanao Year-End Economic Report”
MEDCo 2004. “A Summary Report on Selected Mindanao DevelopmentStatistics “ 1st Semester 2004
Mellor, JW. 1966. “The Economics of Agricultural Development” Ithaca New York: CornellUniversity Press, p. 75.Table 9
"Microeconomics." Microsoft® Encarta® 2007 [DVD]. Redmond, WA: MicrosoftCorporation, 2006.

15
Obanil, R. and Daño, E. 2005. “Attaining Rice-Self-Sufficiency in the Philippines: Lessonsfrom Major Rice Producing Countries”
Pabuayon, T.K.M. 2002. “Hybrid Rice: the future of rice farming in the Philippines” Volume 4,No. 1
Pabuayon T.K.M. 2002. “The regional rice RDE agenda: for farmers” Bureau of AgriculturalResearch Archives. Volume 4 No. 2
Phan H.H. and L.H. Nguyen 1995. “Drying Research and Application in the Mekong Delta ofVietnam,” in Proceedings of the 17th ASEAN Technical Seminar on Grain PostharvestTechnology
Remo, A.R. 2008, April 21. “P10B-needed-for-98-rice-self-sufficiency. Philippine DailyInquirer. http://newsinfo.inquirer.net/breakingnews/nation/view/20080421-131829/P10B-needed-for-98-rice-self-sufficiency--DA-exec.2008
Remo, AR. 2008. “Marcos Masagana 99” made RP rice exporter, self-sufficient” PhilippineDaily Inquirer
Rimando,L.abs-cbnNEWS.com/Newsbreak
Saunders R.M., et al. 1978. “Rice Postharvest Losses in Developing Countries”
Tanchuling, H A. 2010. “Rice Sufficiency Outlook for 2010” Rice Self-Sufficiency Bulletin
Tolentino, B., et al. 2001. “Facts About Rice in the Philippines” Global AgricultureInformation Network
Other Online Sources:
http://www.agribusinessweek.com/tag/rice\
http://www.fao.org/News/FACTFILE/FF9712-E.HTM. Food and Agriculture Organization ofthe United Nations (FAO)
http://www.abs-cbnnews.com/storypage.aspx?StoryId=113334. 2008