Available online at ... · 47 International Journal of Water Research 2015; 5(2): ... (methyl...
11
47 International Journal of Water Research 2015; 5(2): 47-57 ISSN 2348 – 2710 Original Article Synthesis and Characterization of Poly (methyl methacrylate-g–starch) Composite Cation Exchange Membrane for the Electrolysis of Sodium Chloride Savita Dixit a , Sandhya Pal b and S.N.Yadev c a,b, Maulana Azad National Institute of Technology Bhopal c Central Institute of Plastic Engineering and Technology, Chennai (Tamilnadau), India Corresponding Author: Dr. Savita Dixit Tel: +91-755-4051653 Email: [email protected] Fax: +91-755- 2670562 Received 14 August 2015; accepted 27 October 2015 Abstract We have reported the preparation and characterization of poly (mma-g-starch) cation exchange membrane used for the electrodialysis of sodium chloride solution. The syrup of polymers was synthesized by means of free radical polymerization of methyl methacrylate using benzoyl peroxide and azo-bisisobutyronitrile (AIBN) as initiators and dimethylaniline (DMA) as an accelerator in a water medium. Copolymers were synthesized through free radical polymerization of starch derivatives in methyl methacrylate (MMA). The syrup is casted on a wet porous clay support to prepare a non-interpenetrating graft membrane. The composite membrane is modified by using gas phase nitration, followed by amination with hydrazine hydrate, and further reaction with dichloroethane and potassium hexa fluoro phosphate to introduce hexa fluoro phosphate Chloride (KPF6Cl - ) charges on its surface. The modification effect was studied with FTIR, AFM, SEM, water uptake capacity, contact angle, and the ion exchange capacity measurement. The experimental results of the electrodialysis of sodium chloride were reported and presented in the terms of current efficiency and energy consumption for NaOH production. The effect of different operating parameters like salt concentration, current density, and circulation rates on the current efficiency has been investigated. Prepared membrane has an ion exchange capacity of 0.794 meq./g which is near to that of the commercially available Nafion-117 membrane having an ion exchange 0.9 meq./g capacity and the current efficiency for the electro dialysis process of sodium sulfat has more than 90% and specific energy consumption of 0.1kW/Mol at 2N concentration of the salt at 1000A/m2. The prepared grafted membrane used for electro dialysis of sodium chloride has a current efficiency of 94.5% and a power consumption of about 0.1032 kW/mol at the same concentration of salt and at a current density of 254 A/m 2 . . © 2015 Universal Research Publications. All rights reserved Key words Polymethyl Methacrylate, Starch, sodium chloride, membrane, electro dialysis. 1. Introduction The development of biotechnology and chemical in the expanded area depends on reliable green technology for the downstream processes which incorporate purification, separation and isolation of the molecules [1-4]. Electro property based membrane separation process involving ion exchange membranes are not only part of electro chemistry, but also involve in the different field like separation techniques i.e. elect dialysis (ED), electro-electro dialysis and electrode ionization [5, 6]. The most popular industrial application of ED is the production of drinking water from brackish water and sea water. This process is widely used for the purification by demineralization of solutions of widely varying industrial fluids encountered in the food, pharmaceutical and chemical industries [7, 8]. In view of this, development of strong and cost effective cation and anion exchange membrane with good psychochemical and electrochemical properties is the highly desired for the desalination process 1 . In Chlor-alkali electrolysis an aqueous solution of sodium chloride is decomposed electrolytically by direct current, producing chlorine at the anode, hydrogen as a cathode and sodium hydroxide solution in the catalyst chamber. Earlier it was carried either in a mercury cell or in a diaphragm Available online at http://www.urpjournals.com International Journal of Water Research Universal Research Publications. All rights reserved
Transcript of Available online at ... · 47 International Journal of Water Research 2015; 5(2): ... (methyl...

47 International Journal of Water Research 2015; 5(2): 47-57
ISSN 2348 – 2710
Original Article
Synthesis and Characterization of Poly (methyl methacrylate-g–starch)
Composite Cation Exchange Membrane for the Electrolysis of Sodium Chloride
Savita Dixita, Sandhya Palb and S.N.Yadevc
a,b, Maulana Azad National Institute of Technology Bhopal c Central Institute of Plastic Engineering and Technology, Chennai (Tamilnadau), India
Corresponding Author: Dr. Savita Dixit
Tel: +91-755-4051653
Email: [email protected]
Fax: +91-755- 2670562
Received 14 August 2015; accepted 27 October 2015 Abstract
We have reported the preparation and characterization of poly (mma-g-starch) cation exchange membrane used for the
electrodialysis of sodium chloride solution. The syrup of polymers was synthesized by means of free radical
polymerization of methyl methacrylate using benzoyl peroxide and azo-bisisobutyronitrile (AIBN) as initiators and
dimethylaniline (DMA) as an accelerator in a water medium. Copolymers were synthesized through free radical
polymerization of starch derivatives in methyl methacrylate (MMA). The syrup is casted on a wet porous clay support to
prepare a non-interpenetrating graft membrane. The composite membrane is modified by using gas phase nitration,
followed by amination with hydrazine hydrate, and further reaction with dichloroethane and potassium hexa fluoro
phosphate to introduce hexa fluoro phosphate Chloride (KPF6Cl-) charges on its surface. The modification effect was
studied with FTIR, AFM, SEM, water uptake capacity, contact angle, and the ion exchange capacity measurement. The
experimental results of the electrodialysis of sodium chloride were reported and presented in the terms of current efficiency
and energy consumption for NaOH production. The effect of different operating parameters like salt concentration, current
density, and circulation rates on the current efficiency has been investigated. Prepared membrane has an ion exchange
capacity of 0.794 meq./g which is near to that of the commercially available Nafion-117 membrane having an ion
exchange 0.9 meq./g capacity and the current efficiency for the electro dialysis process of sodium sulfat has more than 90%
and specific energy consumption of 0.1kW/Mol at 2N concentration of the salt at 1000A/m2. The prepared grafted
membrane used for electro dialysis of sodium chloride has a current efficiency of 94.5% and a power consumption of about
0.1032 kW/mol at the same concentration of salt and at a current density of 254 A/m2.
.
© 2015 Universal Research Publications. All rights reserved
Key words Polymethyl Methacrylate, Starch, sodium chloride, membrane, electro dialysis.
1. Introduction
The development of biotechnology and chemical in the
expanded area depends on reliable green technology for the
downstream processes which incorporate purification,
separation and isolation of the molecules [1-4]. Electro
property based membrane separation process involving ion
exchange membranes are not only part of electro chemistry,
but also involve in the different field like separation
techniques i.e. elect dialysis (ED), electro-electro dialysis
and electrode ionization [5, 6]. The most popular industrial
application of ED is the production of drinking water from
brackish water and sea water. This process is widely used
for the purification by demineralization of solutions of
widely varying industrial fluids encountered in the food,
pharmaceutical and chemical industries [7, 8]. In view of
this, development of strong and cost effective cation and
anion exchange membrane with good psychochemical and
electrochemical properties is the highly desired for the
desalination process1.
In Chlor-alkali electrolysis an aqueous solution of sodium
chloride is decomposed electrolytically by direct current,
producing chlorine at the anode, hydrogen as a cathode and
sodium hydroxide solution in the catalyst chamber. Earlier
it was carried either in a mercury cell or in a diaphragm
Available online at http://www.urpjournals.com
International Journal of Water Research
Universal Research Publications. All rights reserved

48 International Journal of Water Research 2015; 5(2): 47-57
cell. The former utilizes mercury as the cathode for the
electrolytic reaction, as well as for absorbing sodium ions
as mercury amalgam, which is next reacted with deionised
water to produce the caustic soda solution, also only a
small fraction of salt is decomposed per pass through the
cell [9]. This process produces high purity NaOH at high
concentration (50-52 weight %), but causes poisonous
mercury pollution. The diaphragm cell process utilizes
asbestos, to separate caustic soda and chlorine produced
during the electrolysis. This process suffers from low
current efficiency (30-40%) and produces weak cell liquor,
containing 12-14 weight% NaOH [10]. A new type of cells,
membrane cells have now replaced both the mercury and
diaphragm cells [11]. A typical membrane electrolytic cell
consists of two compartments separated by a cation
permeable membrane. Concentrated brine flows through
anode compartment where chlorine gas is produced. The
cathode compartment has NaOH solution (typical
concentration values of 23-35 wt. %) where the hydrogen
evolution takes place with simultaneous production of the
OH¯ ions. The sodium ions diffuse through the membrane
from the anode compartment to cathode compartment to
form NaOH.
The advantage in using cation selective lies in the selected
transport of cation (Na+) and reduced transport of anion,
thus giving higher current efficiency and low chloride
concentration in the NaOH compartment. In addition, a
higher concentration of alkali can be used which means
lower resistance of the cell and a low voltage across the cell
leading lower electrical power requirements [12] (Figure 1
and reaction1).
Electrolysis of NaCl at anode:
2Cl- Cl2 + 2e-
Electrolysis of water at Cathode:
2H2O +2e- H2 +2OH-
Overall Reaction:
2NaCl +2H2O Cl2 +H2 +2NaOH (1)
Cation exchange membranes were the first of the
electrically charged membranes, which were
commercialized and put into extensive industrial
applications. They allow only cation to pass through them.
Therefore, 90% of all planned Chlor-alkali industry
expansion is in ion exchange membrane cell processes. The
type of functional groups found on the cation exchange
membranes are usually sulfonic acid, carboxylic acid or
phosphoric acid groups etc. Polymers used for these types
of membranes are polystyrene, polyphosphazene, PS-DVB,
PVDF [13-15], etc.
The major commercially used membranes are Nafion®
(DuPont), Aciplex (Asahi chemicals) and Fleming (Asahi
glass). These membranes are very expensive and get
denatured at high
working temperatures (>1000C). Cation exchange
membranes have been developed in the literature based on
synthetic polymers like Polysulfone [16], Polyether sulfone
[17], Polyether ether ketone [18], Poly (styrene-co-divinyl
benzene) [19], and natural and synthetic blend polymer
like, Poly (methylmethacrylate-g-starch) [20-22]
Polyaniline-g-starch [23] and poly (vinyl alcohol/Chitosan)
[24] etc. Among all these membranes, Poly
(methylmethacrylate -g- starch) based membranes have
been stated to be the best for use in electro dialysis [25, 26]
because of this blend material is environmental benign
(biodegradable), nontoxic and biocompatible. The cross-
linked membranes Poly (mma-g-starch) have reactive sites
for fictionalization reactions like nitration,
chloromethylataion, and sulfonation, etc. Cation exchange
membranes based on Poly (mma-g-starch) have been
obtained by blending of Poly methylmethacrylate (mma)
and starch, followed by nitration using sodium nitrite with
sulfuric acid in the presence of ferrous sulfate. Therefore,
there is a need to develop chemically and thermally stable,
highly selective, biodegradable, inexpensive and easy to
manufacture ion exchange membranes [27].
In this way, we have prepared ceramic supported poly
(mma-g-starch) based cation exchange membrane modified
using a multi step process, low temperature reaction with
different chemical for the modification process on the
surface. The membrane prepared has a high charge density
of functional groups on its surface and has been
characterized using SEM, AFM, and FTIR, ion exchange
capacity, current voltage characteristics, contact angle
measurements and water content. Further, this has been
used for the electrolysis of sodium chloride and the
efficient membrane has been investigated in terms of
current efficiency and power requirements. We have also
studied the effect of various parameters like, salt
concentrations, current density and flow rates on the
membrane performance.
2. Experimental
2.1. Materials
Analytical grade calcium carbonate, benzoyl peroxide
(BPO), azo-bis-isobutyronitrile (AIBN) is procured from
S.D. Fine Chemicals (Bombay, India). Analytical grade
tetraethylorthosilicate (TEOS), Dimethylaniline (DMA),
Sodium nitrite, Ferrous Sulfate, hydrazine hydrate,
imidizole, di-chloroethane, Potassium hexa Fluoro
phosphate, Sodium chloride, sodium hydroxide, polyvinyl
alcohol, di-sodium hydrogen phosphate, hydrochloric acid,
toluene, methanol and fused calcium chloride are obtained
from Qualigens, Bombay. Methylmethacrylate (MMA)
kaolin, ball clay, pyrophallite, calcium carbonate, feldspar,
quartz and starch are obtained from Loba (India). Before
polymerization, MMA is first washed with 5% NaOH
solution and then vacuum distilled to remove all the

49 International Journal of Water Research 2015; 5(2): 47-57
inhibitors. The AIBN and BPO are recrystallized in
methanol before being used as initiators for
methylmethacrylate (MMA) polymerization reaction. All
the other chemicals are used as received.
2.2 Preparation of Membrane assembly
The method of preparing a membrane assembly is given in
Figure 2 and consists of steps, such as preparation of
support, synthesis of polymer syrup, the casting of
membrane over the support and finally modifying the
membrane to chemically bind the ionic liquid moiety with
it. Clay
mixture
Mixing
Casting
Drying 24 hrs
Room
Temperature
SupDrying 24 hrs
1000CSup
Drying 24 hrs
2500CSup
9000C
SupTEOSSup10000C
Sup
Membrane
CastingNitrationNO2
Amination
NH2
CH2CH2Cl2N
CH2CH2Cl
CH2CH2Cl
Imidazole
N
CH2CH2
CH2CH2
KPF6
PSN
CH2CH2
CH2CH2
PS
PS PS
PS N
N N
Cl-
N
Cl-
NN
NN
Cl-
+
+
Cl-KPF6
KPF6
++
PS
+
Sup
Sup= Support
PS= polymer syrup Figure 2. Preparation of Membrane assembly (included
clay support preparation, polymer synthesis, polymer
casting in support and chemical modification of
membrane). In this Figure, Sup = Support and PS =
Polymer syrup
2.3 Preparation of clay supports
The composite membrane prepared in this work consists of
a clay support and a polymer film deposited on its surface.
The clay support must have pores that are connected
continuously from the feed stream to permeate stream,
otherwise no permeation through the support is possible.
The clay support provides mechanical, chemical and
thermal stability to the membrane. Ceramic support is
prepared by mixing of clays of kaolin, ball clay, red mud,
calcium carbonate, fly ash, and quartz in water according to
the reference [19, 26]. Whereas we replaced the feldspar
and pyrophyllite of the some industrial waste materials like
red mud and fly ash [28]. Firstly the all clay materials are
mixed well to give a thick paste which is used to cast the
support into a flat disk over a gypsum plate. During casting,
care is taken to ensure that no air gaps are present in it and
is spread into a metal ring of a desired dimension.
Firebricks are placed over the supports to ensure a uniform
drying on both surfaces.
Then, they are dried at different temperatures (1000C,
2500C and 9000C) so as to impart sufficient mechanical
strength. The supports are polished on a silicon abrasive
paper to get the final smooth clay discs of 2-3 mm
thickness and a diameter of 65mm. The supports are
washed and dried at 1000C overnight, and then dipped in a
solution of the TEOS solution (tetraethyl orthosilicate, 49
ml mixed with 1ml 35% HCl and 6.5ml water in the molar
ratio of 1:0.04:2). Than the supports are calcined at 10000C
for a period of 3-4 h in a furnace and after this, the supports
are again washed with water and dried [29].
2.4. Synthesis of polymer syrup
Methyl methacrylate polymerized using a dual initiator
system (BPO and AIBN) in the presence of DMA
(dimethylaniline) to get a homogeneous viscous polymer
solution. A typical procedure to prepare PMMA was
followed which involved placing 20 ml of MMA, 0.15 g
(0.75%) of BPO (benzoyl peroxide) and 0.1082 g of ABIN
(azo-bisisobutyronitrile) in 100 ml of water and 0.5 g of
PVA (poly vinyl alcohol) and 5 g of di-sodium hydrogen
phosphate in a 250 ml flask and the solution was stirred for
1h at 800C to complete the polymerization of monomer
[30]. Thick PMMA syrup collects by the separating funnel.
Starch (5% 1.23g) dissolves in Dimethyl sulphoxide
solution. Then after PMMA slurry and starch salutation
mix with each other and sonicate at least two hours in
sonicater [22, 31]. Assumed structure of the Pmma-g-starch
polymer given in Figure 3.
Figure 3. Assumed structure of Pmma-g-starch polymer22
2.4. Membrane Preparation
2.4.1 Composite membrane casting
The support is placed over wet polyurethane foam and a
thin, uniform layer of syrup of approximately 2g is applied
on the surface and is allowed to dry over it for 30 min. The
significance of wet polyurethane foam is that whenever
membrane is cast over wet ceramic support, the polymer
does not pierce inside the pores. The polymer film is
allowed to dry in the atmosphere for 6 h so that the
untreated monomer gets evaporated. The polymer
composite membrane, thus formed is then kept in an oven
for cross linking at 700C for four hours.
2.4.2. Chemical modification of PMMA-g -starch
membrane The steps are involved to modify the membrane to make
the charge on the surface and hydrophilic in nature. Surface
modification of the composite membrane is carried out to
introduce fixed negative charges (KPF6Cl-) on its surface.
The steps of modifications of the membrane are as follows.
The nitration is carried out in a glass reactor, which has a
stainless steel lid. It has a rubber septum in the center for

50 International Journal of Water Research 2015; 5(2): 47-57
creating the vacuum inside the reactor and injecting the
gases with the help of a needle. In this work, NOx is
produced in a 1.5 liter two neck flask by reacting sodium
nitrite (10 g) with sulfuric acid (25 ml) in the presence of
ferrous sulfate (5 g). The reactor is then filled with 500 ml
of NOx (a mixture of NO and NO2) gases and kept at 800C
for 3 hrs for nitrating the Poly (mma-g-starch) clay
composite membrane [32-34] (reaction 2).
2NaNO2 + H2SO4 Na2SO4 + 2HNO2
3HNO2 H2O + HNO3 +2NO
FeSO4 +NO (Fe NO) SO4
2NO+O2 2NO2 (2)
The nitrated polystyrene clay composite membrane is
aminated by using 50% hydrazine hydrate/water mixture at
500C for two hours in a water bath. The aminated clay
composite membrane, thus prepared is modified with 1% 1,
2 dichloroethane solution in methanol at 500C for 45 min. It
is then modified with 2% imidazole solution in water at
500C for 45 min. Finally, the imidazole membrane is
modified with 2% hexa Fluoro phosphate solution in water
at 500C for 45 min.
3. Membrane characterization
3.1. FT-IR The chemical structure and the chemical modification of
unmodified and modified membranes were investigated by
using bruker FT-IR (Vertex-70) spectrometer in the range
of 500–4000 cm−1. The spectra are obtained by making a
pellet of 1mg powder of crushed polymer films as samples
and 200 mg of IR spectroscopic grade KBr pellets.
3.2. Scanning electron microscopy (SEM)
The Scanning electron microscope (Joel-JSM (Model 840
A) is used to view the structural morphology and
asymmetric nature of the graft clay-composite membrane.
The membrane samples are dipped in liquid nitrogen and
sputtered with gold to a thickness of approximately 150 Å
to create a conducting surface, before being analyzed. This
analysis has been carried out for both unmodified and
modified membranes to observe the changes in structural
morphology of the surfaces upon chemical modification.
3.3. Atomic Force Microscopy (AFM) The Atomic force microscope is the advanced
characterization tool which has been applied extensively
for studying ultra-filtration and nano filtration membranes.
AFM have eliminated the tedious process of sample
preparation as it can image non-conducting samples and is
used to determine the average pore size and surface
roughness of the membrane. All the samples were scanned
using Molecular Imaging (MI), USA made AFM
equipment in Acoustic AC (AAC) mode. A sharp
cantilever tip scans the surface of the membrane and
generates a line profile of the surface. This line profile is
used to find the pore sizes, pore size distribution and also
the surface roughness.
3.4. Contact angle measurement
The contact angle made by water on the unmodified and
modified PS membranes is measured by using Rame`-Hart
Inc. (RHI) made Goniometer (model 100-00-230). The
measurement of the contact angle helps in the estimation of
the extent of the hydrophilic nature of the membrane.
3.5. Water uptake capacity Water uptake capacity calculated by according to the
ASTM standards. Water uptake measurement was
performed by dipping the dried membranes (dried at 150
°C for 1 hour) in distilled water for 24 hours at room
temperature. The membranes were taken out, wiped with
blotting paper and then weighed. The water uptake capacity
of the membrane was calculated by using the following
equation:
Water Uptake (%) = Wwet -Wdry*100/Wdry (3)
3.6. Cation Exchange Capacity (CEC)
The cation exchange capacity is an important
electrochemical property of an ion exchange membrane and
is a measure of no. of fixed charges per unit weight of dry
membrane. In order to determine CEC, the modified film
was first immersed in distilled water for a period of 24 h
and then in 1M HCl aqueous solution for another 24 h to
convert it to H+ forms. The film was then washed with
distilled water to remove excess acid. The film was finally
equilibrated with 0.5N NaOH aqueous solution for 24 h and
the cation exchange capacity was determined from the
reduction in alkalinity by back titration. The cation
exchange capacity (CEC) was calculated from the
following equation [19, 35].
CEC = (N1-N2) *V/W (4)
Where, where, N1 is the normality of NaOH before
equilibration, N2 is the normality of NaOH after
equilibration; V is the volume of NaOH taken for titration
and W is the weight of modified poly (mma-g-starch) film.
3.7. Current-Voltage characteristics
The current-voltage curve, which is an important
characterization technique to determine the limiting current
density of a membrane, was found out by using a test cell
as shown in Figure 4. This cell consists of two
compartments arranged between Platinum anode and SS
cathode with membrane in the canter. Before the actual
experiment, both the compartments were filled with 1N salt
solution and circulated using peristaltic pumps for two
hours to reach an equilibrium state. Then the current-
voltage curve was obtained by slowly increasing the current
across the membrane in small intervals and noting the cell
voltage after waiting for the current to reach a steady value
[19, 36].
Figure 4. Cell arrangement for measuring the potential
drop across the membrane

51 International Journal of Water Research 2015; 5(2): 47-57
3.8. Experimental set up for electrolysis
The experimental setup used for Electro dialysis using the
membrane is shown in Figure 5. which consists of two
detachable compartments, each having a volume of 75 ml
with the provision for fixing a membrane between the
compartments. The inlets are connected to peristaltic
pumps for the continuous flow of the electrolyte solutions.
The two electrodes used, namely the cathode are made of
Stainless steel and the anode is made of Platinum wires.
The two solutions anolyte (NaCl) and catholyte (water) are
circulated through two 1 litre glass reservoirs using
peristaltic pumps. The solutions are continuously stirred
with magnetic stirrers and the power is supplied using
constant DC power source (0–32V 10 A). A potential
difference is applied across the electrodes and a constant
current density through the membrane is maintained [19].
Samples of catholyte are taken for every 30 min time
interval and the concentrations of NaOH produced are
measured volumetrically by the titration method. Each
electro dialysis run typically carried out for 90 min under
the different operating conditions like salt concentration,
current density and flow rate. For the determination of the
total energy consumption in the electro dialysis process, the
voltage should be approximately constant between two
consecutive readings. The current efficiency (%) and the
energy consumption (kWh/mol NaOH produced) are
determined by the following formulae:
Where ΔC is the change in concentration of NaOH (mol/l)
in time Δt seconds, v is the volume of catholyte solution in
liters, I is the current in amperes, F is the Faraday constant,
VAvg is the average cell voltage for each electrolysis run,
and ΔN is the moles of NaOH produced during the
electrolysis run for time t.
Figure 5. Schematic diagram of the experimental setup for
the electrolysis of sodium chloride
4. Result and Discussion
4.1 FT-IR
The FTIR spectra of the unmodified and modified
membranes are given (in the range of 4000-500cm-1). Fig.
6a depicts the FT–IR spectra of Pmma-g-starch
(unmodified membrane). It is confirmed that all the two
spectra are similar except for a few changes in the spectra
of the composites. The features that is similar to identify
the presence of PMMA in all of them. The characteristic
vibration bands of PMMA appear at 1722 n (C=O) and
1600 n (C–O). The bands at 3329 and 2925 cm–1
correspond to the C–H stretching of the methyl group
(CH3) while the bands at 1304 and 1481 cm–1 are
associated with C–H symmetric and asymmetric stretching
modes, respectively [30]. The band at 3025n represents the
O-H stretching of starch. The 1246 cm–1 band is assigned to
torsion of the methylene group (CH2) and the 1170 cm–1
band corresponds to the vibration of the ester group C–O,
while C–C stretching bands are at 1073 and 888 cm–1. The
FTIR analysis has been carried out to confirm the presence
of nitrate, amine, dichloroethane, imidazole and KPF6
functional groups on the modified membranes. Fig. 6b
shows an additional peak at 1588 cm-1 for NO2 group. The
spectra of aminated show no extra peak for the amine
group, but all the NO2 groups disappear confirming the
amination of the membrane. Imidazole group shows peaks
at 2780 cm-1. The spectra of KPF6 membrane in show no
extra peak, but all the imidazole groups disappear
confirming the Poly (mma-g-starch) membrane modified
with KPF6.
0.5
0.6
0.7
0.8
0.9
1
1.1
400100016002200280034004000
Wavelength(cm-1)Tr
ansm
ittan
ce
Figure 6a. Unmodified spectra of poly (mma-g-starch)
0
0.2
0.4
0.6
0.8
1
1.2
400100016002200280034004000
Wavelength(cm-1)
Tran
smitt
ance
Figure 6b. Modified spectra of poly (mma-g-starch)
4.2. Scanning electron microscopy (SEM) The membrane samples were dipped in liquid nitrogen and
covered with gold to a thickness of approximately 150 Å to
create a conducting surface, before being analyzed.

52 International Journal of Water Research 2015; 5(2): 47-57
This analysis has been carried out for both unmodified and
modified membranes to observe the changes in structural
morphology of the surfaces upon chemical modification.
The SEM pictures of the unmodified and modified
membranes are shown in Figure.7a and Fig.7b. In Fig.7a, a
smooth layer of unmodified membrane at 15K
magnification is clearly visible with agglomerate particles
of polymer running across the surface. These particles on
higher magnifications show a cleavage due to evaporation
of untreated monomers, The SEM picture of the modified
membrane is shown in Fig.7b at the same magnification of
Fig.7a.
The modified membrane indicates that the cracks are not
continuous. Different chemical modification process
overcoat the graft membrane and filled the cracks of the
surface. There are some pores also present in surface. The
pore size of the membrane is confirmed by AFM analysis.
The image 7c is the cross section image of membrane with
ceramic support. In this image, the dense part depicts the
ceramic material with some agglomerated particles that
show the silica particles of tetraethyl-orthosilicate. Another
cross section view is the polymer layer, which is coated
layer by layer on ceramic support. The polymer has not
impregnated in the ceramic support it is clearly visible in
this image.
Figure 7a. SEM picture of unmodified membrane
Figure7b. SEM picture of modified membrane
Figure7c. SEM picture of modified membrane

53 International Journal of Water Research 2015; 5(2): 47-57
4.3. Atomic Force Microscopy (AFM)
The AFM images of the unmodified and modified
membranes are shown in Fig. 8a and Fig. 8b. The dark
regions in the image are the probable pores and the bright
regions are the peaks on the membrane surface. The
average pore size of the membrane was found to be around
40-60 nm from the line profiles of the different regions.
Figure 8a. AFM image of unmodified membrane
Figure 8b. AFM image of modified membrane
4.4. Contact angle measurement The contact angle made by the water on the unmodified and
modified membranes was determined following the
procedure given in section 3.4. The average angle measured
is 820 on the unmodified membrane and of the modified
membranes, 750 of nitrated membrane, 580 on aminated
membrane, 520 on 1, 2 dichloroethane membrane, 460 on
imidazole membrane and 420 on KPF6 membrane. The
decrease in the contact angle indicates that the graft
membrane was becoming hydrophilic in nature of chemical
modification.
4.5. Water uptake capacity
The swelling behavior, not only investigated mechanical
properties and dimensional stability of the membrane, it
also influences its ability of ion selectivity and electrical
resistance. The swelling behavior of the membrane is
investigated in terms of the water content and it is
determined for the modified composite membrane reported
in this work. As per the procedure given in section 3.5, the
modified and unmodified film was first immersed in
distilled for a period of 24 h and then dried at 600C for 5
hours until a constant weight is obtained [19]. The
unmodified poly (mma-g-starch) membrane denote the
hydrophobic nature and thus shows only 22.8% water
uptake, whereas the modified membrane has hydrophilic
chloride functional groups on its surface and so its water
uptake capacity is found to be 29.5%. In the comparison of
unmodified and modified membranes, the commercially
available Nafion-117 membrane showing more
hydrophobic nature with 14% water absorption capacity.
The modified membranes have a high water uptake
capacity, but secure dimensional stability because the
membranes have been cross-linked during preparation and
absorption of water take place at the sites of functional
groups.
4.6. Cation exchange capacity (CEC)
The cation exchange capacity of the modified film was
determined using the procedure given in the section 3.6.
This procedure is taken by ASTM standards.
The cation exchange capacity of the modified poly (mma-
g-starch) films has been determined from the reduction in
alkalinity by back titration to be 0.0.784 meq./g, according
to the procedure given by ASTM standards.. The cation
exchange capacity of Poly (mma-g-starch) membrane is
0.784 meq./g and commercially available Nafion-117
membrane having 0.9 meq./g. This is amongst the most
commonly used cation exchange membranes. The prepared
membrane can be successfully replaced the Nafion
membrane [37, 38].
4.7. Current voltage characteristics (I-V curve)
The current-voltage characteristic curve is used to
determine the limiting current density of the prepared poly
(mma-g-starch) cation exchange membrane. The I-V curve
is obtained by using the membrane in the electro dialysis
set-up and following the procedure given in the
section 3.7. The curves are shown in Figure 9a and 9b. It
can be seen from the I-V curve, there is first a linear
segment and then followed by another very steep linear
segment. The point at which current shows the steady state
behaviour (not fluctuation) with respect of voltage that

54 International Journal of Water Research 2015; 5(2): 47-57
Fig. 9a and 9b, I–V characteristics of poly (mma-g-starch) cation exchange membranes
segment defines the minimum current density. The first
point where there is a change in the slope of the curve
corresponds to the limiting current density and is found to
be 515 A/m2 at 0.5N and 405 A/m2 at 1N for our
membrane. These values are compared very well with the
values reported in the literature [39].
5. Effect of operating conditions on membrane
performance
The suitability of developed cation exchange membrane for
the electro-membrane applications was assessed in terms of
current efficiency and energy consumption for the salt
removal experimental condition. The current efficiency is a
measure as a fraction of current carried by sodium ions
through the cation exchange membrane. The salt
concentration current density and flow rates are the main
parameters, which affect the current efficiency and energy
requirement.
During the experiments to determine the influence of one
parameter the other variables are kept in standard
conditions of 1N NaCl, 254 A/m2 of current density, and
circulation rate of 99 ml/min. The current efficiency and
power consumption at the base condition are 91.5% and
0.1215 kWh/mol NaOH production. According to literature
[40], we can easily notice prepayerd membrane shows
highest current efficiency and low energy consumption
with respect of Nafion membrane.
The overall performance of the cation exchange membrane
(CEM) including the current efficiency, cell voltage
(average values), sodium ion transport number and energy
consumption over a period of 90 min is given in Table1.
5.1 Effect of current density on current efficiency and
power consumption
The effect of current density is shown in Table1. Figure 10
shows the effect of current density over the current
efficiency at standard conditions. It is observed that there is
a slight increase in current efficiency up to 254 A/M2 and
further decreases at higher current densities. The same was
reported earlier by Tzanetakis et al [40] where it has been
indicated that the electro dialysis at higher current densities
might have been performed above the limiting current. So
when operated above the limiting current density, the
concentration polarization will come into picture reducing
55 International Journal of Water Research 2015; 5(2): 47-57
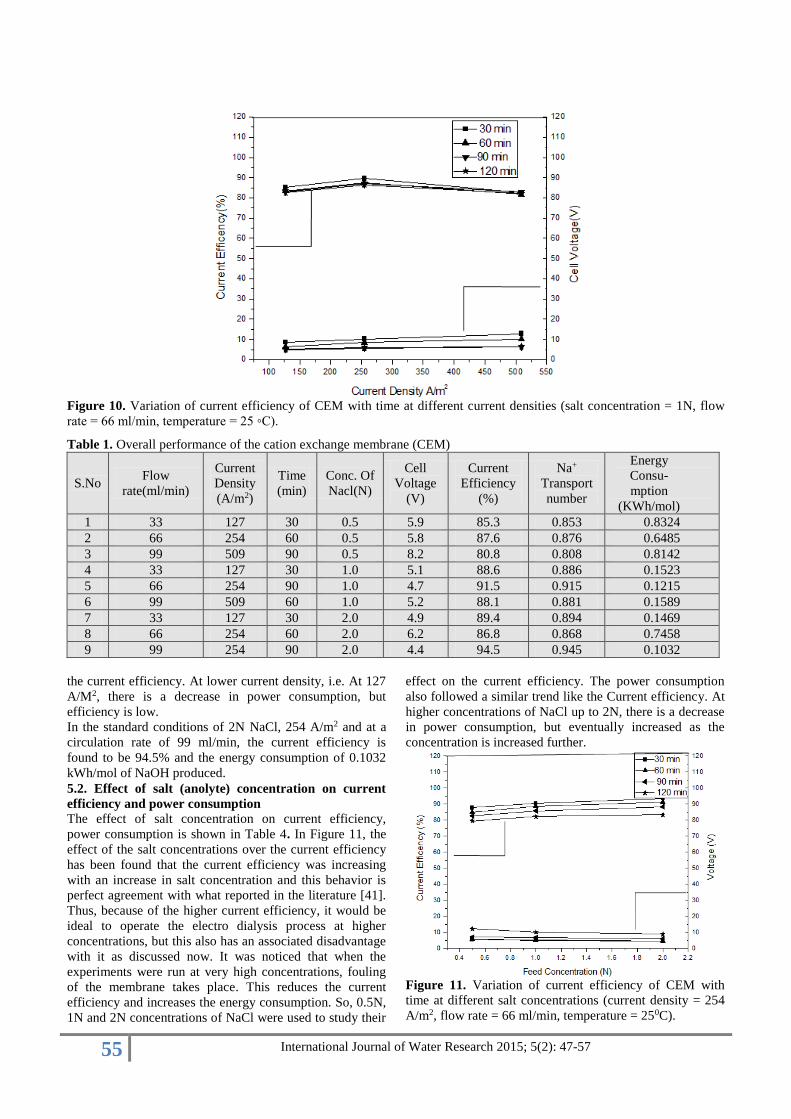
Figure 10. Variation of current efficiency of CEM with time at different current densities (salt concentration = 1N, flow
rate = 66 ml/min, temperature = 25 ◦C).
Table 1. Overall performance of the cation exchange membrane (CEM)
S.No Flow
rate(ml/min)
Current
Density
(A/m2)
Time
(min)
Conc. Of
Nacl(N)
Cell
Voltage
(V)
Current
Efficiency
(%)
Na+
Transport
number
Energy
Consu-
mption
(KWh/mol)
1 33 127 30 0.5 5.9 85.3 0.853 0.8324
2 66 254 60 0.5 5.8 87.6 0.876 0.6485
3 99 509 90 0.5 8.2 80.8 0.808 0.8142
4 33 127 30 1.0 5.1 88.6 0.886 0.1523
5 66 254 90 1.0 4.7 91.5 0.915 0.1215
6 99 509 60 1.0 5.2 88.1 0.881 0.1589
7 33 127 30 2.0 4.9 89.4 0.894 0.1469
8 66 254 60 2.0 6.2 86.8 0.868 0.7458
9 99 254 90 2.0 4.4 94.5 0.945 0.1032
the current efficiency. At lower current density, i.e. At 127
A/M2, there is a decrease in power consumption, but
efficiency is low.
In the standard conditions of 2N NaCl, 254 A/m2 and at a
circulation rate of 99 ml/min, the current efficiency is
found to be 94.5% and the energy consumption of 0.1032
kWh/mol of NaOH produced.
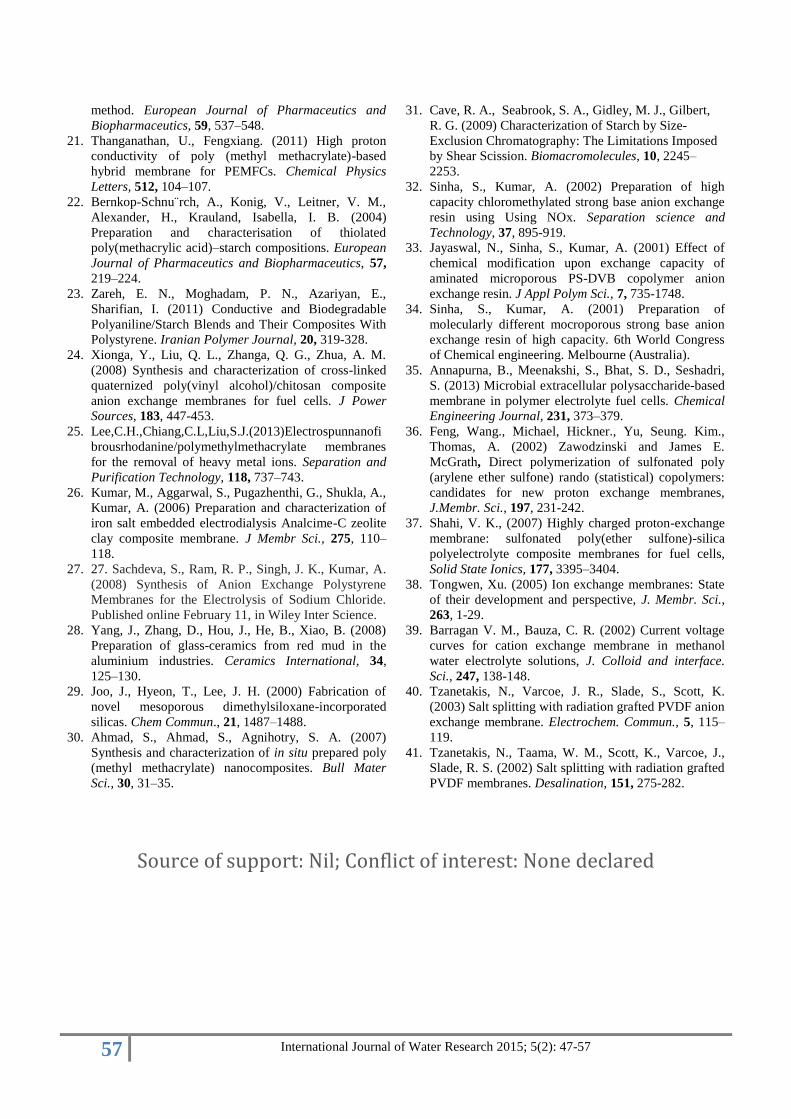
5.2. Effect of salt (anolyte) concentration on current
efficiency and power consumption
The effect of salt concentration on current efficiency,
power consumption is shown in Table 4. In Figure 11, the
effect of the salt concentrations over the current efficiency
has been found that the current efficiency was increasing
with an increase in salt concentration and this behavior is
perfect agreement with what reported in the literature [41].
Thus, because of the higher current efficiency, it would be
ideal to operate the electro dialysis process at higher
concentrations, but this also has an associated disadvantage
with it as discussed now. It was noticed that when the
experiments were run at very high concentrations, fouling
of the membrane takes place. This reduces the current
efficiency and increases the energy consumption. So, 0.5N,
1N and 2N concentrations of NaCl were used to study their
effect on the current efficiency. The power consumption
also followed a similar trend like the Current efficiency. At
higher concentrations of NaCl up to 2N, there is a decrease
in power consumption, but eventually increased as the
concentration is increased further.
Figure 11. Variation of current efficiency of CEM with
time at different salt concentrations (current density = 254
A/m2, flow rate = 66 ml/min, temperature = 250C).

56 International Journal of Water Research 2015; 5(2): 47-57
5.3. Effect of circulation rate on current efficiency and
power consumption
The effect on the circulation rates of the catholyte and
anolyte on current efficiency for CEM is shown in Figure
12. If the circulation rate increase then the current
efficiency will be increased, this is proved by the Figure.12.
This may have been due to the transport behaviour
associated with gas evolution is not the rate limiting step in
the narrow cell channel at the low flow rates. The current
efficiency is slightly high at lower flow rates, which can be
explained because of the good mass transport behavior
associated with the gas evolution in the narrow cell
channel. The trend of power consumption is also following
the same trend as the current efficiency. With increased
circulation rates up to 66 ml/min, the power consumption
decreased and then again increased further with higher flow
rate of 99 ml/min [41, 6].
6. Conclusion
An ultra-filtration, cross linked poly (mma-g-starch) clay
composite membrane has been successfully prepared by
chemically modifying by step by step process. Prior to the
membrane casting, the support was dipped in TEOS
(tetraethoxysilane) and was found to withstand longer runs
of experimentations without collapsing. The cation
exchange membrane, thus prepared was characterized by
scanning electron microscopy (SEM), FTIR spectroscopy,
water content, contact angle measurement, atomic force
microscopy (AFM) and cation exchange capacity. Finally
membrane has been tested for at least for four months and
we could get similar results within 6% of variation of that
reported here. The effect of operating parameters (current
density, circulation rate and salt concentration) on the
performance of the membrane has been studied. The
current efficiency of the membrane is found to decrease
slightly for higher current densities, and increased with an
increase in salt concentration and flow rates. In the standard
conditions of 2N NaCl, 254 A/m2 and at a circulation rate
of 99 ml/min, the current efficiency is found to be 94.5%
and the energy consumption of 0.1032 kWh/mol of NaOH
produced. The current efficiency, increased with an
increase in flow rate and salt concentration, but decreased
slightly with an increase in current density. Recent
advances in the development of cation-exchange membrane
may encourage the suitability of these membranes for
different types of electro-membrane applications.
References
1. Nagarale, R. K., Gohil, G. S., Shahi, V. K. (2006)
Recent developments on ion-exchange membranes and
electro-membrane processes. Adv. Colloid Interface
Sci,. 119, 97–130.
2. Kumar, M., Tripathi, B. P., Saxena, A., Shahi, V. K.
(2009) Electrochemical membrane reactor: Synthesis
of quaternary ammonium hydroxide from its halide by
in situ ion substitution. Electrochim Acta,. 54, 1630–
1637.
3. Kumar, M., Singh, S., Shahi, V. K. (2010) Cross-
linked Poly(vinyl alcohol)-Poly(acrylonitrile-co-2-
dimethylamino ethylmethacrylate) based anion-
exchange membranes in aqueous media. J Phys Chem
B., 114, 198–206.
4. Chakrabarty, T., Rajesh, M. A., Jasti, A., Thakur, K.
A., Singh, K. A., Prakash, S., Kulshrestha, V., Shahi,
K. V., (2011) Stable ion-exchange membranes for
water desalination by electrodialysis. Desalination,
xxx, xxx–xxx.
5. 5 Strathman, H., Ho, WSW., Sirkar, K. K., (1992)
Membrane Handbook, Van Nostrand Reinhold. New
York, 219–262.
6. Korngold, E. Electrodialysis" membranes and mass
transfer, in: G. Belfort (Ed.), Synthetic Membrane
Processes. Academic Press. New York. 1984, 192–
219.
7. Strathmann, H. (2010) Electrodialysis, a mature
technology with a multitude of new applications.
Desalination, 264, 268–288.
8. Sato, K., Sakairi, T., Yinemato, T., Tadaki, T. (1995)
The desalination of a mixed solution of an amino acid
and an inorganic salt by means of electrodialysis with
charge-mosaic membranes. J Membr Sci., 100, 209–
216.
9. Kent, J. A. (2003) Riegel’s Handbook of Industrial
Chemistry, 10th edition. Kluwer Academic/Plenum
publications. NY. 442-456.
10. Elvers, B., Hawkins, S., Harrer, R. (2003) Ullman’s
Encyclopedia of Industrial Chemistry. 6th edition.
Wiley-VCH. NY. 33, 235-245.
11. Phadnis, A. M. and Joshi, V. K. (2007) Chemical
Industry Digest, 44-48.
12. Strathmann, H. (2004) Ion exchange membrane
separation processes, Elsevier. Amsterdam.
13. Kang, M. S., Choi, Y. J., Choi, I. J., Yoon, T., Moon,
S. H. (2003) Electro chemical characterization of
sulfonated poly (arylene ether sulfone)(S-PES) cation
exchange membranes. J Membr Sci., 216, 39-53.
14. Nasef, M. M., Saidi, H. (2003) Preparation of
crosslinked cation exchange membranes by radiation
grafting of styrene/divinylbenzene mixtures onto PFA
films. J Membr Sci., 216, 27-38.
15. Tzanetakis, N., Taama, W. M., Scott, K., Varcoe, J.,
Slade, R. S. (2002) Salt splitting with radiation grafted
PVDF membranes. Desalination, 151, 75-282.
16. Ersoz, M. (2001) The electrochemical properties of
polysulfone ion-exchange membranes. J Colloid
Interface Sci., 243, 420–426.
17. Shahi, V. K. (2007) Highly charged proton-exchange
membrane: sulfonated poly (ether sulfone)-silica
polyelectrolyte composite membranes for fuel cells.
Solid State Ionics., 177, 3395–3404.
18. Wilhelm, F .G., Punt, I. G. M., van, der, Vegt, N. F.
A., Strathmann, H., Wessling, M. (2002) Cation
permeable membranes from blends of sulfonated
poly(ether ether ketone) and poly(ether sulfone). J
Membr Sci., 199, 167–176.
19. Savari, S., Sachdeva, S., Kumar, A. (2008) Electrolysis
of sodium chloride using composite poly(styrene-co-
divinylbenzene) cation exchange membranes. Journal
of Membrane Science., 310, 246–261.
20. Bravo-Osuna, I., Ferrero, C. (2005) Water sorption–
desorption behaviour of methyl methacrylate–starch
copolymers: effect of hydrophobic graft and drying
57 International Journal of Water Research 2015; 5(2): 47-57
method. European Journal of Pharmaceutics and
Biopharmaceutics, 59, 537–548.
21. Thanganathan, U., Fengxiang. (2011) High proton
conductivity of poly (methyl methacrylate)-based
hybrid membrane for PEMFCs. Chemical Physics
Letters, 512, 104–107.
22. Bernkop-Schnu¨rch, A., Konig, V., Leitner, V. M.,
Alexander, H., Krauland, Isabella, I. B. (2004)
Preparation and characterisation of thiolated
poly(methacrylic acid)–starch compositions. European
Journal of Pharmaceutics and Biopharmaceutics, 57,
219–224.
23. Zareh, E. N., Moghadam, P. N., Azariyan, E.,
Sharifian, I. (2011) Conductive and Biodegradable
Polyaniline/Starch Blends and Their Composites With
Polystyrene. Iranian Polymer Journal, 20, 319-328.
24. Xionga, Y., Liu, Q. L., Zhanga, Q. G., Zhua, A. M.
(2008) Synthesis and characterization of cross-linked
quaternized poly(vinyl alcohol)/chitosan composite
anion exchange membranes for fuel cells. J Power
Sources, 183, 447-453.
25. Lee,C.H.,Chiang,C.L,Liu,S.J.(2013)Electrospunnanofi
brousrhodanine/polymethylmethacrylate membranes
for the removal of heavy metal ions. Separation and
Purification Technology, 118, 737–743.
26. Kumar, M., Aggarwal, S., Pugazhenthi, G., Shukla, A.,
Kumar, A. (2006) Preparation and characterization of
iron salt embedded electrodialysis Analcime-C zeolite
clay composite membrane. J Membr Sci., 275, 110–
118.
27. 27. Sachdeva, S., Ram, R. P., Singh, J. K., Kumar, A.
(2008) Synthesis of Anion Exchange Polystyrene
Membranes for the Electrolysis of Sodium Chloride.
Published online February 11, in Wiley Inter Science.
28. Yang, J., Zhang, D., Hou, J., He, B., Xiao, B. (2008)
Preparation of glass-ceramics from red mud in the
aluminium industries. Ceramics International, 34,
125–130.
29. Joo, J., Hyeon, T., Lee, J. H. (2000) Fabrication of
novel mesoporous dimethylsiloxane-incorporated
silicas. Chem Commun., 21, 1487–1488.
30. Ahmad, S., Ahmad, S., Agnihotry, S. A. (2007)
Synthesis and characterization of in situ prepared poly
(methyl methacrylate) nanocomposites. Bull Mater
Sci., 30, 31–35.
31. Cave, R. A., Seabrook, S. A., Gidley, M. J., Gilbert,
R. G. (2009) Characterization of Starch by Size-
Exclusion Chromatography: The Limitations Imposed
by Shear Scission. Biomacromolecules, 10, 2245–
2253.
32. Sinha, S., Kumar, A. (2002) Preparation of high
capacity chloromethylated strong base anion exchange
resin using Using NOx. Separation science and
Technology, 37, 895-919.
33. Jayaswal, N., Sinha, S., Kumar, A. (2001) Effect of
chemical modification upon exchange capacity of
aminated microporous PS-DVB copolymer anion
exchange resin. J Appl Polym Sci., 7, 735-1748.
34. Sinha, S., Kumar, A. (2001) Preparation of
molecularly different mocroporous strong base anion
exchange resin of high capacity. 6th World Congress
of Chemical engineering. Melbourne (Australia).
35. Annapurna, B., Meenakshi, S., Bhat, S. D., Seshadri,
S. (2013) Microbial extracellular polysaccharide-based
membrane in polymer electrolyte fuel cells. Chemical
Engineering Journal, 231, 373–379.
36. Feng, Wang., Michael, Hickner., Yu, Seung. Kim.,
Thomas, A. (2002) Zawodzinski and James E.
McGrath, Direct polymerization of sulfonated poly
(arylene ether sulfone) rando (statistical) copolymers:
candidates for new proton exchange membranes,
J.Membr. Sci., 197, 231-242.
37. Shahi, V. K., (2007) Highly charged proton-exchange
membrane: sulfonated poly(ether sulfone)-silica
polyelectrolyte composite membranes for fuel cells,
Solid State Ionics, 177, 3395–3404.
38. Tongwen, Xu. (2005) Ion exchange membranes: State
of their development and perspective, J. Membr. Sci.,
263, 1-29.
39. Barragan V. M., Bauza, C. R. (2002) Current voltage
curves for cation exchange membrane in methanol
water electrolyte solutions, J. Colloid and interface.
Sci., 247, 138-148.
40. Tzanetakis, N., Varcoe, J. R., Slade, S., Scott, K.
(2003) Salt splitting with radiation grafted PVDF anion
exchange membrane. Electrochem. Commun., 5, 115–
119.
41. Tzanetakis, N., Taama, W. M., Scott, K., Varcoe, J.,
Slade, R. S. (2002) Salt splitting with radiation grafted
PVDF membranes. Desalination, 151, 275-282.
Source of support: Nil; Conflict of interest: None declared