Availability, use, and removal of oil palm biomass in ... residues... · Availability, use, and...
39
Availability, use, and removal of oil palm biomass in Indonesia Christopher Teh Boon Sung Dept. Land Management, Fac. of Agriculture, Uni. Putra Malaysia Report prepared for the International Council on Clean Transportation Date: January 2016 Keywords: Oil palm, palm oil, palm residues, empty fruit bunches, EFB, palm fronds, Indonesia, nutrient balance, trunk, carbon sequestration, biochar 1. Executive Summary Oil palm is Indonesia’s largest source of agriculture biomass. In 2013, Indonesia is estimated to have produced 570 mil. t of oil palm biomass, among which 299 mil. t is OPF (oil palm fronds), 134 mil. t is OPT (oil palm trunk), and 28 mil. t is EFB (empty fruit bunches). This biomass are conventionally applied in the oil palm plantations as soil mulch and fertilizer. This is because they contain large quantities of nutrients, and decomposition studies have shown that these biomass can fully decompose in the field within one to two years (two to three years for OPT), during which the nutrients stored in the biomass are released in a gradual manner into the soil. How fast and how much of these nutrients are released depend on how much biomass is applied in the field, how easily decomposable the biomass is, and how much nutrients the biomass contains. How the biomass is processed for mulching is also important. The industrial process of converting the EFB into a carpet-like material known as Ecomat (ECO), for instance, would effectively reduce the bulk volume of EFB, but at the cost of losing 30 to 70% of the nutrients in the EFB and lowering the rate of decomposition. In contrast, OPT’s much slower decomposition rate can be hastened by chopping or shredding the OPT into smaller pieces. This would increase the total surface area for a faster decomposition rate and in turn allow the OPT to release larger amounts of its nutrients. Although different biomass types release their nutrients at different rates and quantities, they are generally effective in improving a myriad of soil physical and chemical properties (such as increasing soil pH and the soil nutrient and soil water levels) and, in some cases, increasing the oil palm yields. Increases in soil C levels have also been observed, where usually less than 5% of the total C in the biomass in sequestrated in the soil within a year. There is a growing competition today to use the oil palm biomass as either mulch and fertilizer in the fields or to remove this biomass from the fields for fuel, fiber, timber, animal feed, chemicals, and manufacturing bio-based products. Removing this oil palm biomass for the latter use could result in considerable nutrient losses. Complete FFB (fresh fruit bunches) removal at harvest, for instance, would result in 260 kg ha -1 yr -1 loss of nutrients; this amount of loss is one third of the oil palm’s annual nutrient demand. Even if the FFB are returned to the fields and applied as EFB mulch, this would replenish only 27% of the nutrient losses. Furthermore, removing all the pruned oil palm fronds and trunks would exacerbate the nutrient losses by a further 740 kg ha -1 yr -1 , considering that between 35 to 40 t ha -1 of fronds are produced annually, and at the time of replanting, trunk dry weights could reach as high as between 37 to 75.5 t ha -1 . At the end, these nutrient losses must be replenished with the addition of more fertilizers; otherwise, soil nutrient pools will eventually be depleted. The requirement of more external fertilizers counters sustainable agriculture practices. Moreover, fertilizer costs already make up 50 to 70% of oil palm field operational cost and that a third of all Indonesia’s fertilizers are diverted to oil palm plantations. Nonetheless, some amount of biomass can still be removed from the fields, provided highly effective soil conservation methods are practised to greatly reduce the amount of nutrient losses due to erosion and leaching in the fields. This is so that the amount Working paper
-
Upload
truongdiep -
Category
Documents
-
view
225 -
download
7
Transcript of Availability, use, and removal of oil palm biomass in ... residues... · Availability, use, and...

Availability, use, and removal of oil palm biomass in IndonesiaChristopher Teh Boon Sung Dept. Land Management, Fac. of Agriculture, Uni. Putra Malaysia
Report prepared for the International Council on Clean Transportation
Date: January 2016
Keywords: Oil palm, palm oil, palm residues, empty fruit bunches, EFB, palm fronds, Indonesia, nutrient balance, trunk, carbon sequestration, biochar
1. Executive SummaryOil palm is Indonesia’s largest source of agriculture biomass. In 2013, Indonesia is estimated to have produced 570 mil. t of oil palm biomass, among which 299 mil. t is OPF (oil palm fronds), 134 mil. t is OPT (oil palm trunk), and 28 mil. t is EFB (empty fruit bunches). This biomass are conventionally applied in the oil palm plantations as soil mulch and fertilizer. This is because they contain large quantities of nutrients, and decomposition studies have shown that these biomass can fully decompose in the field within one to two years (two to three years for OPT), during which the nutrients stored in the biomass are released in a gradual manner into the soil. How fast and how much of these nutrients are released depend on how much biomass is applied in the field, how easily decomposable the biomass is, and how much nutrients the biomass contains. How the biomass is processed for mulching is also important. The industrial process of converting the EFB into a carpet-like material known as Ecomat (ECO), for instance, would effectively reduce the bulk volume of EFB, but at the cost of losing 30 to 70% of the nutrients in the EFB and lowering the rate of decomposition. In contrast, OPT’s much slower decomposition rate can be hastened by chopping or shredding the OPT into smaller pieces. This would increase the total surface area for a faster decomposition rate and in turn allow the OPT to release larger amounts of its nutrients.
Although different biomass types release their nutrients at different rates and quantities, they are generally effective in improving a myriad of soil physical and chemical properties (such as increasing soil pH and the soil nutrient and soil water levels) and, in some cases, increasing the oil palm yields. Increases in
soil C levels have also been observed, where usually less than 5% of the total C in the biomass in sequestrated in the soil within a year.
There is a growing competition today to use the oil palm biomass as either mulch and fertilizer in the fields or to remove this biomass from the fields for fuel, fiber, timber, animal feed, chemicals, and manufacturing bio-based products. Removing this oil palm biomass for the latter use could result in considerable nutrient losses. Complete FFB (fresh fruit bunches) removal at harvest, for instance, would result in 260 kg ha-1 yr-1 loss of nutrients; this amount of loss is one third of the oil palm’s annual nutrient demand. Even if the FFB are returned to the fields and applied as EFB mulch, this would replenish only 27% of the nutrient losses. Furthermore, removing all the pruned oil palm fronds and trunks would exacerbate the nutrient losses by a further 740 kg ha-1 yr-1, considering that between 35 to 40 t ha-1 of fronds are produced annually, and at the time of replanting, trunk dry weights could reach as high as between 37 to 75.5 t ha-1. At the end, these nutrient losses must be replenished with the addition of more fertilizers; otherwise, soil nutrient pools will eventually be depleted. The requirement of more external fertilizers counters sustainable agriculture practices. Moreover, fertilizer costs already make up 50 to 70% of oil palm field operational cost and that a third of all Indonesia’s fertilizers are diverted to oil palm plantations.
Nonetheless, some amount of biomass can still be removed from the fields, provided highly effective soil conservation methods are practised to greatly reduce the amount of nutrient losses due to erosion and leaching in the fields. This is so that the amount
Working paper

2 Working paper
of nutrients saved from such losses then becomes the maximum allowable amount of biomass nutrients that can be removed from the fields. Based on this premise, it is estimated that, very approximately, no more than 3 to 5 t ha-1 yr-1 of additional biomass can be removed from a mature oil palm plantation that is producing 30 t FFB ha-1 yr-1. Note that this amount of biomass removal (3-5 t ha-1 yr-1) is in addition to the 30 t ha-1 yr-1 FFB biomass that would be removed from the field at harvest, and the EFB would not be returned to the fields. In other words, a total of no more than 33 to 35 t ha-1 yr-1 of biomass can be removed from the field, without requiring additional amount of fertilizers than what is currently applied in the fields. Removing more biomass than this threshold level would require a considerable amount of fertilizers to replace nutrient shortfalls.
Accurately working out how much oil palm biomass can be removed from the fields would require a detailed life cycle analysis and economic analysis to ultimately determine the optimum utilization level of oil palm biomass. Finding this optimum level will be highly site specific partly because oil palm’s nutrient balance for achieving high FFB yields can vary considerably between different environments, palm age, and planting materials used. This optimum level also depends on whether the nutrient demand for high oil palm yields can be met by the nutrient sources in the field, after accounting for nutrient losses.
Lastly, converting EFB into biochar is one promising option to sequester soil C. The production of EFB biochar can be carbon-negative (at least, for Malaysia), and EFB biochar is overall an effective soil amendment, especially in mitigating soil toxicity and soil acidity problems.
2. Background
Palm oil is the world’s most important vegetable oil; in 2012 and 2013 palm oil comprised 39% of total world vegetable oil consumption. Furthermore, the demand for world vegetable oil is projected to increase to between 201 and 340 mil. t by 2050 (Corley, 2009).
Palm oil is a major industry in Indonesia. It is the third largest export-earner in Indonesia, and the industry is estimated to directly employ a total of 7.5 mil. people in the country (3.72 mil. people in the oil palm plantations and palm oil mills and
a further 3.75 mil. people in the midstream and downstream activities) (TAMSI-DMSI, 2010). Indonesia and Malaysia are the two largest producers of palm oil in the world. Together, both these countries account for 87% of the 53 mil. t of world crude palm oil (CPO) (USDA-FAS, 2013). Indonesia however has been the world’s largest producer of CPO, having overtaken Malaysia, since 2006 (Yuliansyah et al., 2009). Between 1995 to 2006, the total land area in Indonesia planted with oil palm (Elaeis guineensis) has increased by three times to 6.6 mil. ha. In 2013, this single crop alone covered nearly 6%, or 10.5 mil. ha, of Indonesia’s total land area (Directorate General of Estate Crops, 2014), and this is expected to further expand to 17 mil. ha by 2025. With ample availability of land in Indonesia, high seed sales, and high energy and vegetable oil prices, USDA (2007) expects Indonesia to remain the world’s highest producer of palm oil for many more years.
According to Directorate General of Estate Crops (2014), oil palm is grown in 23 out of 33 provinces in Indonesia, with most oil palm plantations located in Sumatra (80%) and the rest in Kalimantan (17%), Sulawesi (2%), and Java and Papua New Guinea (1%). Over half of Indonesia’s oil palm plantations are private-owned (52%) and the remaining are owned by smallholders (39%) and the government (8%). The size of private- and government-owned oil palm plantations is between 3,000 to 20,000 ha, whereas smallholder plantations are smaller than 50 ha, averaging 2 ha each (Pauli et al., 2014).
Over the last 10 years, the average palm oil yield in Indonesia has been 3.3 t ha-1, with some plantations obtaining yields up to 6 to 8 t ha-1. Yield differences between plantations are large, but on average, government-owned plantations have the highest average oil yields (3.7 t ha-1), followed by private-owned plantation (3.2 t ha-1), and smallholders (2.8 t ha-1) (Directorate General of Estate Crops, 2014). Although many factors can affect palm yields, Donough et al. (2009) remarked that high palm yields are more strongly linked to better management practices than to more favorable environmental conditions. One essential management practice in oil palm plantations concerns conserving the soil fertility and water, but this practice is not widely followed, particularly by the smallholders (Comte et al., 2012).
Protecting the soil against degradation is an important challenge in any agriculture field, but especially so for oil palm plantations. This is because more than 95% of oil palm in Southeast Asia is
Table 1. Mean properties of some soils commonly planted with oil palm in Southeast Asia (adapted from Mutert, 1999).
Soil order pH Organic C (%) Total N (%) Available P
(mg kg-1)Exchangeable (cmol kg-1)
Ca Mg K AlHistosols 3.8 24.5 1.1 35 0.85 1.56 0.24 9.50Inceptisols 4.1 2.5 0.2 18 0.18 0.20 0.32 12.50
Oxisols 4.4 1.5 0.2 11 0.57 0.37 0.20 1.90
Ultisols 4.5 1.1 0.1 9 0.46 0.11 0.10 1.30Andisols 4.8 6.4 0.5 8 1.86 0.25 0.07 0.80

Working paper 3
planted on highly weathered acidic soils that have low fertility and low buffering capacities (Table 1). These soils, predominantly from soil orders Inceptisols (which comprise 39% of all Indonesia’s soils; Tan, 2008), Ultisols (24%), Oxisols (8%), and Histosols (7%), are characterized by low pH (<5) and have very low to low N, available P, and exchangeable K for oil palm (Table 1 and 2). Half of these soils also have low exchangeable Mg. Consequently, large amounts of fertilizers are required to mitigate the soil’s low fertility and to boost oil palm yields.
Indonesia’s use of fertilizers grew by 31% between 1971 to 2007, making this country one of the largest users of mineral fertilizers in Southeast Asia (Selman et al., 2008). Oil palm is the second largest user of mineral fertilizers in Indonesia, consuming nearly a third, or 1.5 mil. t, of all NPK fertilizers in Indonesia between 2010 to 2011 (Heffer and Prud’homme, 2013).
This high use of fertilizers in Indonesia also means that the cost of fertilizers is typically 50-70% of field operational cost and 25% of the total production cost of palm oil (Goh and Härtner, 2003). Besides incurring high costs, continuous and high application of mineral fertilizers will further lower the soil’s pH and buffering capacities, increasing the risk, for instance, of Al and Mn toxicities which could damage the oil palm roots (Lee et al., 2013). Moreover, high application of N-based fertilizers risks large amounts of N being leached to water sources (causing eutrophication, for instance) and the emission of nitrous oxide, a greenhouse gas more potent than carbon dioxide, which could in turn help to form ground-level ozone, a gaseous pollutant that could damage the oil palm leaves, disrupt photosynthesis, and ultimately, reduce yield.
Consequently, there is a growing interest in Indonesia to rely less on mineral fertilizers by increasing the use of organic fertilizers. IPNI (International Plant Nutrition Institute), for instance, has developed a series of management practices, known as BMP (Best Management Practices), which aims to increase the productivity in oil palm plantations, one of which is through better nutrient management and crop recovery by increasing the use of organic fertilizers and returning the oil palm biomass to the fields (Pauli et al., 2014). Unfortunately, there is scant data available on fertilizer practices in industrial plantations, let alone smallholder plantations, in Indonesia. Moreover, few long-term studies have been carried out in Indonesia to examine the effects of mineral and organic fertilizers applications on the soil and oil palm properties. One of the few such studies is by Comte et al. (2013) who observed that soils receiving regular applications
of organic fertilizers for seven years produced soils with higher pH, organic carbon, cation exchange capacity (CEC), and total N than soils receiving regular applications of only mineral fertilizers.
Could oil palm biomass be used as organic fertilizer? How effective is it and how much should be applied? And finally, what are the detriments on soil fertility if the oil palm biomass was removed from the fields? To answer these questions, this paper will review: 1) the availability of several types of oil palm biomass and their usage in Indonesia, 2) the nutrient content and field decomposition rate of these biomass types, 3) the effects these biomass types have on soil properties and oil palm when these biomass types are used as soil mulch, and 4) the nutrient demand of oil palm and the nutrient sources and losses in an oil palm plantation.
3. Oil palm biomass availability and nutrient content
Oil palm is Indonesia’s largest source of agriculture biomass. Indonesia is estimated to have generated 246 mil. t of agricultural biomass in 2012 (Conrad and Prasetyaning, 2014), but this value is grossly underestimated because it excludes the sizeable contribution from oil palm fronds (OPF) and trunk (OPT) (Table 3).
Crude palm oil (from the mesocarp) and crude palm kernel oil (from the kernel) make up only 10% of the whole oil palm tree or 21% of the oil palm’s fresh fruit bunches (FFB) (Fauzianto, 2014). So, this leaves 90% of the oil palm tree as potential biomass. The oil palm’s standing biomass varies depending on tree age and planting density. At 1.5 years old, the standing biomass of oil palm at 148 palms ha-1 is 10.4 t ha-1, which could increase to more than 90 t ha-1 for eight-year-old palms (Table 4). Most of the young palm’s standing biomass is from the fronds (78%), but as the palm ages, the contribution of the fronds to the tree’s standing biomass declines to about 20% at nearly 28 years of age. In contrast, the biomass partitioning to the trunk increases from about 11 to 56% within this same period. The biomass partitioning to the roots, however, fluctuates between about 10 to 25%, averaging at 16%.
96% of the oil palm’s total annual dry matter production is aboveground (trunk, fronds, and bunches) (Corley and Tinker, 2007), and the amount of nutrients stored in the oil palm standing biomass is huge. Ng et al. (1968), for instance, reported that the
Table 2. Classification of soil fertility for oil palm (adapted from Goh, 1997; Mutert, 1999).
Fertility status pH Organic C (%) Total N (%)Total P (mg
kg-1) Available P (mg kg-1)
Exchangeable (cmol kg-1)Mg K
Very low <3.5 <0.8 <0.08 <120 <8 <0.08 <0.08Low 4.0 1.2 0.12 200 15 0.20 0.20Moderate 4.2 1.5 0.15 250 20 0.25 0.25High 5.5 2.5 0.25 400 25 0.30 0.30Very high >5.5 >2.5 >0.25 >400 >25 >0.30 >0.30

4 Working paper
Table 3. Annual availability of various oil palm biomass types in Indonesia (in 2013).
Biomass Estimated annual fresh weight (mil. t)
Fresh fruit bunches (FFB) - 100% 133.6
Palm oil mill effluent (POME) - 58% 77.5
Empty fruit bunches (EFB) – 21% 28.1
Mesocarp fibers – 15% 20.0
Kernel shells – 6% 8.0
Fronds (OPF)
From pruning activity 277.3
From replanting activity* 21.6
Total 298.9
Trunk (OPT)* 134.4Total 566.9
* based on 5% replanting rate
Sources: Astimar (2014); Conrad and Prasetyaning (2014)
Table 4. Standing biomass of oil palm.
Age(years)
Density(palms ha-1)
Biomass dry weight (t ha-1) Partitioning (%)
Fronds Trunk Roots Total Fronds Trunk Roots1.5 148 8.0 1.1 1.3 10.4 76.9 10.6 12.5
2.5 148 19.6 2.9 2.4 24.9 78.7 11.6 9.6
4.5 122 12.7 6.0 4.4 23.1 55.0 26.0 19.0
6.5 122 14.4 10.7 5.0 30.1 47.8 35.5 16.6
8 130 25.5 21.2 14.1 60.8 41.9 34.9 23.2
8 130 44.4 39.3 9.7 93.4 47.5 42.1 10.4
8.5 122 12.2 13.7 5.4 31.3 39.0 43.8 17.3
10.5 122 19.7 19.0 6.0 44.7 44.1 42.5 13.4
14.5 122 20.5 29.8 8.4 58.7 34.9 50.8 14.3
17 128 12.2 37.2 16.4 65.8 18.5 56.5 24.9
17.5 122 17.1 36.9 7.5 61.5 27.8 60.0 12.2
27.5 122 14.1 37.7 16.0 67.8 20.8 55.6 23.6
Sources: Rees and Tinker (1963), Corley et al. (1971), Dufrêne (1989), Lamade and Setiyo (1996)
standing biomass for 14-year-old oil palm trees at 136 palms ha-1 was 94 t ha-1, with biomass nutrient levels for N, P, K, Mg, and Ca at 588, 58, 1112, 151, and 173 kg ha-1, respectively.
The palm oil industry generates huge amounts of wastes and residues, and they can be categorized into two groups: 1) those from harvesting and replanting in plantation fields, and 2) those from the milling process in the palm oil mills.
The biomass from the plantation fields are in the forms of OPF and OPT. One or two fronds are typically pruned once a month in mature oil palm plantations (Moraidi et al., 2012), and this activity generates a dry weight of 12 t OPF ha-1 yr-1. Replanting of oil palm trees occurs once every 25 years, and this further generates dry weights of 14 t OPF ha-1 yr-1 and 74.5 t OPT ha-1 yr-1 (Astimar, 2014). In 2005, for instance, 43.05 mil. t OPF and 13.95 mil. t OPT were generated by the Indonesian plantations (Yuliansyah et al., 2012).
Working paper 5
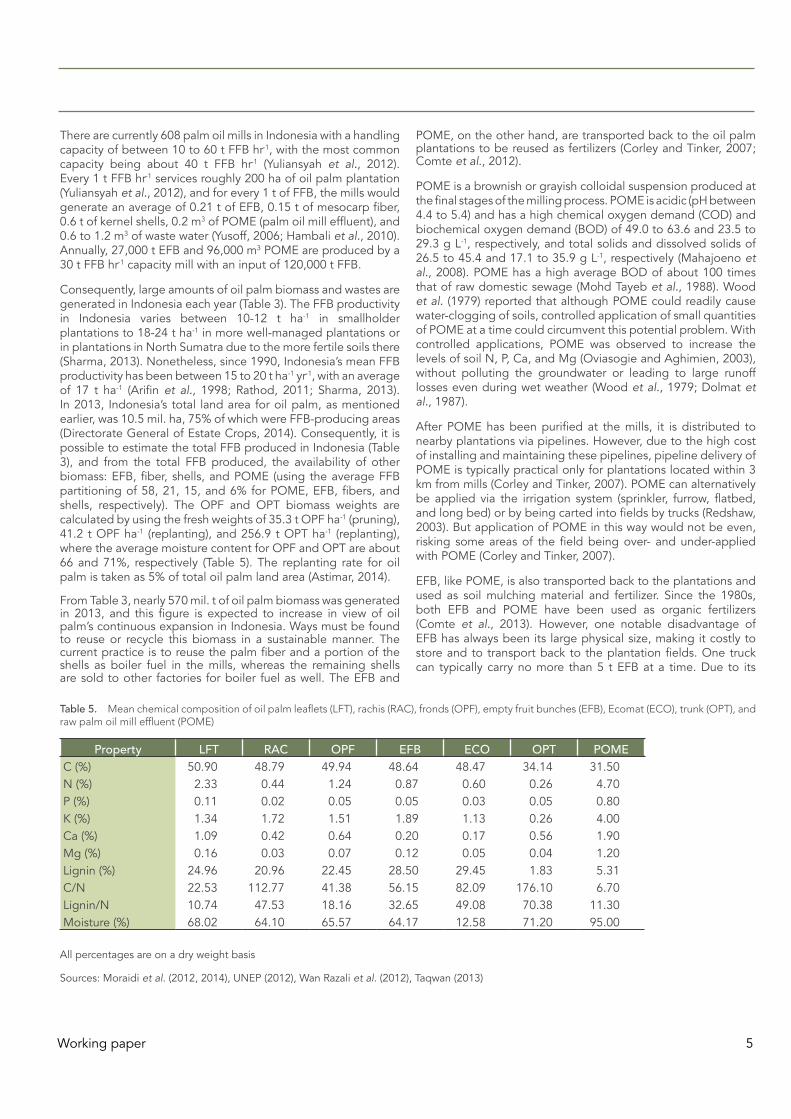
There are currently 608 palm oil mills in Indonesia with a handling capacity of between 10 to 60 t FFB hr-1, with the most common capacity being about 40 t FFB hr-1 (Yuliansyah et al., 2012). Every 1 t FFB hr-1 services roughly 200 ha of oil palm plantation (Yuliansyah et al., 2012), and for every 1 t of FFB, the mills would generate an average of 0.21 t of EFB, 0.15 t of mesocarp fiber, 0.6 t of kernel shells, 0.2 m3 of POME (palm oil mill effluent), and 0.6 to 1.2 m3 of waste water (Yusoff, 2006; Hambali et al., 2010). Annually, 27,000 t EFB and 96,000 m3 POME are produced by a 30 t FFB hr-1 capacity mill with an input of 120,000 t FFB.
Consequently, large amounts of oil palm biomass and wastes are generated in Indonesia each year (Table 3). The FFB productivity in Indonesia varies between 10-12 t ha-1 in smallholder plantations to 18-24 t ha-1 in more well-managed plantations or in plantations in North Sumatra due to the more fertile soils there (Sharma, 2013). Nonetheless, since 1990, Indonesia’s mean FFB productivity has been between 15 to 20 t ha-1 yr-1, with an average of 17 t ha-1 (Arifin et al., 1998; Rathod, 2011; Sharma, 2013). In 2013, Indonesia’s total land area for oil palm, as mentioned earlier, was 10.5 mil. ha, 75% of which were FFB-producing areas (Directorate General of Estate Crops, 2014). Consequently, it is possible to estimate the total FFB produced in Indonesia (Table 3), and from the total FFB produced, the availability of other biomass: EFB, fiber, shells, and POME (using the average FFB partitioning of 58, 21, 15, and 6% for POME, EFB, fibers, and shells, respectively). The OPF and OPT biomass weights are calculated by using the fresh weights of 35.3 t OPF ha-1 (pruning), 41.2 t OPF ha-1 (replanting), and 256.9 t OPT ha-1 (replanting), where the average moisture content for OPF and OPT are about 66 and 71%, respectively (Table 5). The replanting rate for oil palm is taken as 5% of total oil palm land area (Astimar, 2014).
From Table 3, nearly 570 mil. t of oil palm biomass was generated in 2013, and this figure is expected to increase in view of oil palm’s continuous expansion in Indonesia. Ways must be found to reuse or recycle this biomass in a sustainable manner. The current practice is to reuse the palm fiber and a portion of the shells as boiler fuel in the mills, whereas the remaining shells are sold to other factories for boiler fuel as well. The EFB and
POME, on the other hand, are transported back to the oil palm plantations to be reused as fertilizers (Corley and Tinker, 2007; Comte et al., 2012).
POME is a brownish or grayish colloidal suspension produced at the final stages of the milling process. POME is acidic (pH between 4.4 to 5.4) and has a high chemical oxygen demand (COD) and biochemical oxygen demand (BOD) of 49.0 to 63.6 and 23.5 to 29.3 g L-1, respectively, and total solids and dissolved solids of 26.5 to 45.4 and 17.1 to 35.9 g L-1, respectively (Mahajoeno et al., 2008). POME has a high average BOD of about 100 times that of raw domestic sewage (Mohd Tayeb et al., 1988). Wood et al. (1979) reported that although POME could readily cause water-clogging of soils, controlled application of small quantities of POME at a time could circumvent this potential problem. With controlled applications, POME was observed to increase the levels of soil N, P, Ca, and Mg (Oviasogie and Aghimien, 2003), without polluting the groundwater or leading to large runoff losses even during wet weather (Wood et al., 1979; Dolmat et al., 1987).
After POME has been purified at the mills, it is distributed to nearby plantations via pipelines. However, due to the high cost of installing and maintaining these pipelines, pipeline delivery of POME is typically practical only for plantations located within 3 km from mills (Corley and Tinker, 2007). POME can alternatively be applied via the irrigation system (sprinkler, furrow, flatbed, and long bed) or by being carted into fields by trucks (Redshaw, 2003). But application of POME in this way would not be even, risking some areas of the field being over- and under-applied with POME (Corley and Tinker, 2007).
EFB, like POME, is also transported back to the plantations and used as soil mulching material and fertilizer. Since the 1980s, both EFB and POME have been used as organic fertilizers (Comte et al., 2013). However, one notable disadvantage of EFB has always been its large physical size, making it costly to store and to transport back to the plantation fields. One truck can typically carry no more than 5 t EFB at a time. Due to its
Table 5. Mean chemical composition of oil palm leaflets (LFT), rachis (RAC), fronds (OPF), empty fruit bunches (EFB), Ecomat (ECO), trunk (OPT), and raw palm oil mill effluent (POME)
Property LFT RAC OPF EFB ECO OPT POMEC (%) 50.90 48.79 49.94 48.64 48.47 34.14 31.50N (%) 2.33 0.44 1.24 0.87 0.60 0.26 4.70P (%) 0.11 0.02 0.05 0.05 0.03 0.05 0.80K (%) 1.34 1.72 1.51 1.89 1.13 0.26 4.00Ca (%) 1.09 0.42 0.64 0.20 0.17 0.56 1.90Mg (%) 0.16 0.03 0.07 0.12 0.05 0.04 1.20Lignin (%) 24.96 20.96 22.45 28.50 29.45 1.83 5.31C/N 22.53 112.77 41.38 56.15 82.09 176.10 6.70Lignin/N 10.74 47.53 18.16 32.65 49.08 70.38 11.30Moisture (%) 68.02 64.10 65.57 64.17 12.58 71.20 95.00
All percentages are on a dry weight basis
Sources: Moraidi et al. (2012, 2014), UNEP (2012), Wan Razali et al. (2012), Taqwan (2013)
6 Working paper
large size, EFB are also more difficult to apply in the fields. The large physical size of EFB can greatly be reduced by incinerating the EFB into ash, where the resultant ash is a mere 2% of the weight of EFB (Redshaw, 2003). The bunch ash contains (in percent dry weight) 42% C, 0.8% N, 0.06% P, 2.4% K, and 0.2% Mg (Yuliansyah et al., 2012), and is a source of K-rich fertilizer. Bunch ash is also strongly alkaline with a pH of 12 which can be useful to ameliorate peat and acid sulfate soils (Redshaw, 2003). Nonetheless, bunch ashing is an environmental hazard because ashing produces dangerous particulates and gases such as SO2, CO2, CO, and NO. Considerable energy is also lost during EFB incineration. Consequently, EFB incineration for bunch ash is no longer practised today.
One recent method to reduce EFB’s bulkiness is to compress the EFB into a carpet-like material (20 mm in thickness) known as EFB mat or Ecomat (ECO). According to Yeo (2007), ECO is produced by shredding the EFB into its raw fiber and then combed out, after which EFB undergoes a high-pressure hydraulic press to remove impurities such as water, sludge, and oil traces. EFB is then dried, using high temperature, to about 15% gravimetric water content before being trimmed to the desired size. Ecomat is less bulky, more flexible (e.g., can be rolled up), and easier to handle than EFB. However, Moraidi et al. (2012, 2014) reported that the high heat and pressure used to turn EFB into ECO had reduced the nutrient concentration of N, P, K, Ca, and Mg in the mulch by 30 to 70% and increased the C/N ratio by two times, making it harder to decompose in the field.
Another way to reduce EFB’s bulk is to compost it together with POME, typically in a 1:3 ratio (EFB:POME) by weight. Composting
is typically done in windrows that are fully opened (or at least closed for only the first few weeks of composting), measuring 3 m wide and 2 m high, and where the windrows are frequently turned to increase aeration (Redshaw, 2003). The time taken to complete composting varies from 10 to 22 weeks, depending on the desired composting properties such as achieving an initial 20 to 40 C/N ratio, 45-65% moisture content, 43-65 °C process temperature, 5% oxygen level, and a particle size below 50 mm (Lord et al., 2002). Composting not only reduces the EFB’s volume by up to 70% (Redshaw, 2003) but also concentrates the nutrients and lowers the C/N ratio (thus, increasing the rate of biomass decomposition and nutrients release in the field). However, as for ECO, composting would reduce the nutrient levels, but by a smaller margin of 10 to 30% for macronutrients (Abner and Foster, 2006).
Tohiruddin and Foster (2013) composted EFB with POME (1:3 ratio by weight) in an open windrow system over 25 days. They observed that compost applications of 10 to 20 t ha-1 yr-1 for three years increased oil palm yields by 16 to 21%, increased soil K and Mg by 133 to 150%, and increased leaf N, P, and Mg levels by 2 to 9%. The EFB-POME compost of 15 t ha-1 they produced was equivalent to 105 kg N (or 1.9 kg urea), 16 kg P (1.0 kg rock phosphate), 168 kg K (2.5 kg muriate of potash), 26 kg Mg, and 1.8 kg S. Using this amount of compost, as calculated by Tohiruddin and Foster (2013), would also save the cost of mineral fertilization by between 39 to 177%.
Pruned oil palm fronds (OPF) are placed in frond heaps between planting rows, where these heaps act as soil mulch and fertilizer. During replanting, the oil palm tree is often cut down and the
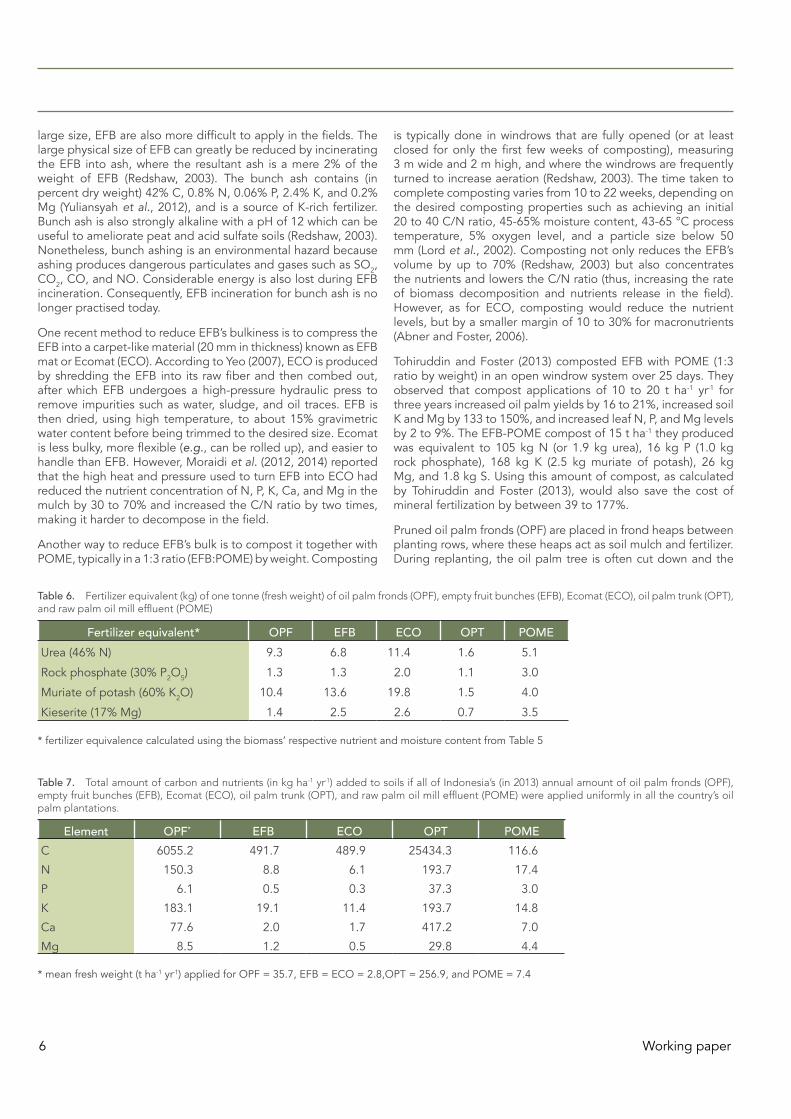
Table 6. Fertilizer equivalent (kg) of one tonne (fresh weight) of oil palm fronds (OPF), empty fruit bunches (EFB), Ecomat (ECO), oil palm trunk (OPT), and raw palm oil mill effluent (POME)
Fertilizer equivalent* OPF EFB ECO OPT POMEUrea (46% N) 9.3 6.8 11.4 1.6 5.1
Rock phosphate (30% P2O5) 1.3 1.3 2.0 1.1 3.0
Muriate of potash (60% K2O) 10.4 13.6 19.8 1.5 4.0
Kieserite (17% Mg) 1.4 2.5 2.6 0.7 3.5
* fertilizer equivalence calculated using the biomass’ respective nutrient and moisture content from Table 5
Table 7. Total amount of carbon and nutrients (in kg ha-1 yr-1) added to soils if all of Indonesia’s (in 2013) annual amount of oil palm fronds (OPF), empty fruit bunches (EFB), Ecomat (ECO), oil palm trunk (OPT), and raw palm oil mill effluent (POME) were applied uniformly in all the country’s oil palm plantations.
Element OPF* EFB ECO OPT POMEC 6055.2 491.7 489.9 25434.3 116.6
N 150.3 8.8 6.1 193.7 17.4
P 6.1 0.5 0.3 37.3 3.0
K 183.1 19.1 11.4 193.7 14.8
Ca 77.6 2.0 1.7 417.2 7.0
Mg 8.5 1.2 0.5 29.8 4.4
* mean fresh weight (t ha-1 yr-1) applied for OPF = 35.7, EFB = ECO = 2.8,OPT = 256.9, and POME = 7.4
Working paper 7
trunk cut or chopped into smaller pieces and left on the ground to decompose. However, due to the very high C/N ratio of oil palm trunks (OPT) (Table 5), the trunk can take as long as two to three years to fully decompose in the field (Kee, 2004). The trunk can also be shredded or pulverized into much finer pieces to increase their decomposition rate, but this remains a rare practice due to the high cost and lack of availability of trunk shredder machines.
Using these various oil palm biomass types as fertilizer is highly advantageous because they contain many essential nutrients (Table 5) needed by oil palms which would otherwise be lost if this biomass were removed from the fields. Reusing it as fertilizer also reduces the amount of mineral fertilizers needed (Table 6). The total amount of carbon and nutrients added to the oil palm plantations in Indonesia in 2013, as shown in Table 7, was calculated by assuming that all of the oil palm biomass that was produced in the country (in the amounts as shown in Table 3 and with their respective carbon and nutrient concentrations in Table 5) were applied uniformly in all of Indonesia’s oil palm plantation fields.
4. Biomass decomposition and nutrient release rates
Applying biomass in the form of crop residues or wastes as a soil mulch is an effective method to protect the soil against degradation and to conserve or increase soil fertility. At least 70% ground cover is considered sufficient for full soil protection (Morgan, 2005). By covering the soil surface with organic materials, for instance, the surface is physically protected against water erosion such as by rain splash impact and runoff, reducing soil and nutrient losses. Covering the soil surface with mulch also reduces weed growth and in particular, soil water loss by evaporation.
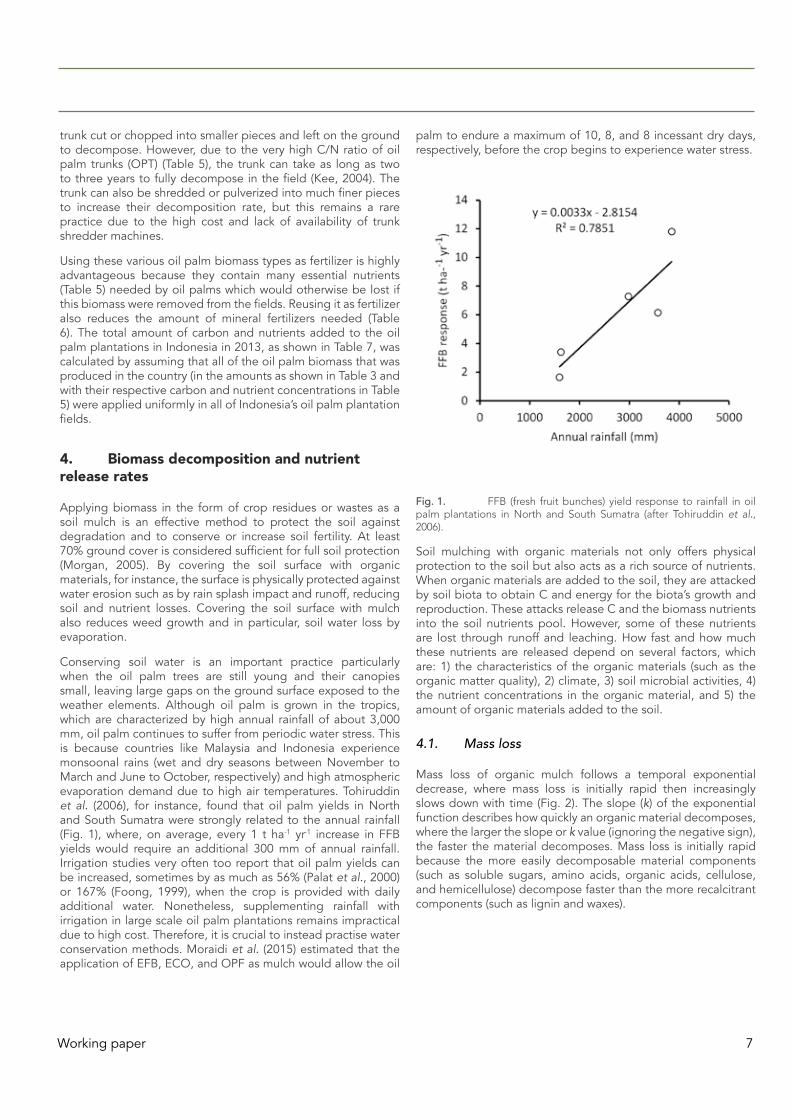
Conserving soil water is an important practice particularly when the oil palm trees are still young and their canopies small, leaving large gaps on the ground surface exposed to the weather elements. Although oil palm is grown in the tropics, which are characterized by high annual rainfall of about 3,000 mm, oil palm continues to suffer from periodic water stress. This is because countries like Malaysia and Indonesia experience monsoonal rains (wet and dry seasons between November to March and June to October, respectively) and high atmospheric evaporation demand due to high air temperatures. Tohiruddin et al. (2006), for instance, found that oil palm yields in North and South Sumatra were strongly related to the annual rainfall (Fig. 1), where, on average, every 1 t ha-1 yr-1 increase in FFB yields would require an additional 300 mm of annual rainfall. Irrigation studies very often too report that oil palm yields can be increased, sometimes by as much as 56% (Palat et al., 2000) or 167% (Foong, 1999), when the crop is provided with daily additional water. Nonetheless, supplementing rainfall with irrigation in large scale oil palm plantations remains impractical due to high cost. Therefore, it is crucial to instead practise water conservation methods. Moraidi et al. (2015) estimated that the application of EFB, ECO, and OPF as mulch would allow the oil
palm to endure a maximum of 10, 8, and 8 incessant dry days, respectively, before the crop begins to experience water stress.
Fig. 1. FFB (fresh fruit bunches) yield response to rainfall in oil palm plantations in North and South Sumatra (after Tohiruddin et al., 2006).
Soil mulching with organic materials not only offers physical protection to the soil but also acts as a rich source of nutrients. When organic materials are added to the soil, they are attacked by soil biota to obtain C and energy for the biota’s growth and reproduction. These attacks release C and the biomass nutrients into the soil nutrients pool. However, some of these nutrients are lost through runoff and leaching. How fast and how much these nutrients are released depend on several factors, which are: 1) the characteristics of the organic materials (such as the organic matter quality), 2) climate, 3) soil microbial activities, 4) the nutrient concentrations in the organic material, and 5) the amount of organic materials added to the soil.
4.1. Mass loss
Mass loss of organic mulch follows a temporal exponential decrease, where mass loss is initially rapid then increasingly slows down with time (Fig. 2). The slope (k) of the exponential function describes how quickly an organic material decomposes, where the larger the slope or k value (ignoring the negative sign), the faster the material decomposes. Mass loss is initially rapid because the more easily decomposable material components (such as soluble sugars, amino acids, organic acids, cellulose, and hemicellulose) decompose faster than the more recalcitrant components (such as lignin and waxes).

8 Working paper
Fig. 2. Changes in dry matter mass loss (100% - %dry matter remaining) due to decomposition, as described by an exponential function, where a and k are empirical coefficients.
Note: The slope of the curve (k), however, is of particular importance because it measures how quickly the biomass decomposes. The larger the k (ignoring the negative sign), the faster the biomass decomposes.
Organic matter quality denotes how fast an organic material decomposes (Swift et al., 1979; Brady and Weil, 2002). The quality of an organic material can be characterized by several parameters such as N, P, lignin, and polyphenol contents, as well as taking the ratios of C/N, lignin/N, polyphenol/N, and (Iignin+polyphenol)/N (Yavitt and Fahey 1986; Melillo et al., 1989; Taylor et al., 1989; Tian et al., 1992; Seneviratne, 2000; Nicolardot et al., 2001; Soon and Arshad, 2002). However, the most often used indicators of organic matter quality are C/N and lignin/N ratios, where the lower these ratios, the higher the organic material quality and the faster the material decomposes.
Consequently, based on these two ratios, the organic matter quality for the oil palm biomass types from Table 5 declines in the following order: POME > LFT > OPF > EFB > ECO > RAC > OPT.
Moraidi et al. (2012, 2014) are perhaps the only ones who have studied the simultaneous decomposition and nutrient release rates of EFB, OPF (and its LFT and RAC components), and ECO in the same environment. They reported that mass loss was most rapid for LFT, followed by EFB, then ECO, OPF, and RAC (following the order of organic matter quality, as given earlier). After eight months of field decomposition, LFT had lost 86% of its initial mass, EFB 79%, OPF 68%, and RAC 58%. The overall decomposition rate (k) for these oil palm residues are as shown in Table 8, and from these values, it is possible to estimate how long these residues would reach 10% of their initial weights. Moraidi et al. (2012, 2014) calculated that LFT, due to its highest decomposition rate, would reach 10% of its initial mass in 9 months, followed by EFB in 12 months. ECO, OPF, and RAC would take longer than a year: 13, 15, and 19 months, respectively. At the beginning, OPF comprised 35% LFT and 65% RAC, but over a period of eight months of decomposition, the LFT fraction reduced to 15% and RAC increased to 85% (Fig. 3). The increasing proportion of the recalcitrant RAC to the easily decomposable LFT is one reason why the decomposition of OPF slows down with time.
Fig. 3. Changes in the fraction of oil palm rachis (RAC) and leaflets (LFT) in the fronds during frond decomposition (from Moraidi et al., 2014).
Other studies have reported similar observations to that by Moraidi et al. (2012, 2014). Wingkis (1998) and Zaharah and Lim (2000), for example, observed that EFB lost 50% of its dry matter weight within 3 months, 70% within 8 months (Zaharah and Lim, 2000), and 90% within 10 months (Wingkis, 1998). Nevertheless, EFB decomposition would become much faster if N and P fertilizers were added to the soil to accelerate the mineralization process. Caliman et al. (2001) reported that 50% of EFB weight was lost just within the first month when additional
Table 8. Decomposition rate constant (k) for several oil palm biomass types.
Biomass types k (% month-1)Leaflets (LFT) 0.26
Rachis (RAC) 0.12
Fronds (OPF) 0.15
Empty fruit bunches (EFB) 0.20
Ecomat (ECO) 0.18
Trunk (OPF)
Shredded (pulverized) 0.11
Chopped 0.07
Sources: Kee (2004), Teh et al. (2011), Moraidi et al. (2012, 2014), Taqwan (2013)

Working paper 9
N and P fertilizers were applied with EFB. ECO experienced slower decomposition than EFB. ECO lost 55% of its weight within 6 months, followed by nearly complete mass loss within 12 months (Wan Asma, 2006). Khalid et al. (2000) observed a faster decomposition rate for LFT than for RAC. LFT and RAC, they reported, lost 90% of their weights within 12 and 18 months, respectively.
In the past, oil palm replanting involved burning the oil palm trunks and other biomass during land clearing activities. Besides contributing to air pollution, burning the biomass also greatly reduces the N and S content in the system (Redshaw, 2003). Since 1999, Indonesia, together with other ASEAN countries, has adopted the zero burning policy, where felled trunks, along with other biomass, are left to decompose naturally in the fields (ASEAN Secretariat, 2003). This practice of zero burning is much more environmentally friendly than burning, but the decomposing felled trunks can become nests to pests such as the Oryctes beetles and rats, as well as a host to the Ganoderma fungus disease. One way to reduce these problems is to chop or shred the felled trunks into smaller pieces, which would also increase the total surface area for a faster decomposition rate.
Although experience have shown us that oil palm trunks take the longest to fully decompose in the field compared to other oil palm biomass, their decomposition is perhaps the least rigorously studied of all oil palm biomass types. Taqwan (2013) and Nurul Hidayah (2014) observed that the mass loss of shredded OPT, like other biomass types, also followed an exponential decrease. Mass loss was initially rapid because the easily decomposable inner parts of the trunk such as the soft parenchyma tissues and vascular bundles were first to decompose, leaving behind the more recalcitrant components such as the outermost lignified layer of the trunk (Khalid et al., 2000). After five months of decomposition, shredded OPT had lost about 45% of its initial mass. The decomposition rate (k) of shredded OPT was determined by Nurul Hidayah (2014) as 0.11 % month-1, and at this rate, shredded OPT would reach 10% of its initial weight in nearly two years (23 months).
Shredding the trunk into finer pieces increased the OPT’s decomposition rate because of the higher total surface area exposed for soil biota to attack. Kee (2004) observed that merely chopping the OPT (cutting the trunk into large wedges or blocks) resulted in a much slower decomposition rate, such that the chopped OPT took 18 months to lose 72% of its initial mass. With the calculated decomposition rate (k) of 0.07 % month-1, chopped OPT would take nearly three years (32 months) to
reach 10% of its initial mass. Consequently, trunk decomposition in the field can be hastened by about 1.5 times if the trunk is shredded rather than chopped, which is usual in today’s practice. And despite having a lower organic matter quality than RAC, the OPT, if shredded, has a similar decomposition rate as RAC (Table 5 and 8).
4.2. Nutrients release
How fast and how much nutrients are released into the soil depends on several factors, three of which, as mentioned earlier, are the amount of organic material added to the soil, nutrient concentrations in the organic material (e.g., Table 5), and the decomposition rate of the organic material (e.g., Table 8).
Moraidi et al. (2012, 2014) studied the simultaneous decomposition and nutrient release of OPF (which comprises LFT and RAC), EFB, and ECO in the same environment. They applied each biomass type as soil mulch at 37 t ha-1 yr-1. This rate is similar to that practiced in large oil palm plantations. In Indonesia, EFB is typically applied at a rate of about 40 to 60 t ha-1 yr-1 (Caliman et al., 2001; Pauli et al., 2014), where EFB are heaped between four palms so that each EFB heap covers approximately 30 m2 land surface area (Moraidi et al., 2012, 2013). Oil palm fronds, as mentioned previously, are pruned once a month where one or two fronds are removed per tree. This pruning activity supplies an annual total of 3,552 OPF (assuming two pruned fronds per month per tree in a 148 palms ha-1 area) which in turn provides 37 t ha-1 yr-1 of OPF, where one fresh frond weighs 10.5 kg (Moraidi et al., 2012, 2014). In normal field practice in oil palm plantations, the pruned fronds are heaped along every alternate planting row, covering 60% of total plantation land area (Moraidi et al., 2012, 2014). ECO is still not widely available; thus, its use as a mulching material is seldom practised in oil palm plantations. Nonetheless, Moraidi et al. (2012, 2014) applied ECO as a single mat layer between four palms at the same rate of 37 t ha-1 yr-1 , where each ECO mulching site covered 8 m2 area. Table 9 shows the amount of fresh and dry matter weight from mulch added per unit surface area for each biomass type, using the moisture and C contents of the respective biomass type from Table 5.
Biomass weight loss, as discussed earlier, follows an exponential decrease with time (Fig. 2). Thus, nutrient release would also follow a similar decreasing trend: nutrients will be released faster and at larger amounts at the beginning than at the later stages of biomass decomposition. Of the five oil palm biomass
Table 9. Amount of fresh and dry matter added over the mulched area by oil palm fronds (OPF), empty fruit bunches (EFB), and Ecomat (ECO).
Annual application of mulch OPF EFB ECOFresh mulch applied (kg m-2 yr-1) 12.4 33.3 3.7
Dry matter in mulch (%) 34.4 35.8 87.4
Dry matter applied from mulch (kg m-2 yr-1) 4.3 11.9 3.2
C applied from mulch (kg m-2 yr-1) 2.1 5.8 1.6
Source: Moraidi et al. (2013)

10 Working paper
types, LFT released their nutrients the fastest and after eight months of decomposition, 90% or more of their nutrients had been released, the highest among all the oil palm biomass types (Table 10). In contrast, RAC, followed by ECO, released their respective nutrients the slowest. Recall that LFT have the highest initial concentration of nutrients (except for K) and the highest organic matter quality, and RAC and ECO the two lowest for both properties (Table 5).
OPF, which comprise both LFT and RAC, released nutrients at rates that were either significantly higher (for N and Ca) or not significantly different (for P and Mg) than EFB. The industrial process of using high heat and high pressure to convert EFB into ECO had resulted in a loss of some nutrients in ECO, as well as a decrease in its organic matter quality. Compared to ECO, EFB had higher concentrations particularly for N, K, and Mg. Thus, as expected, EFB released N, K and Mg nutrients at significantly higher rates than ECO.
The C/N ratios for all oil palm biomass types decrease with time (Table 10). Biomass with lower organic matter quality (RAC,
ECO, and EFB) experienced larger decreases in their respective C/N ratios than those with higher organic matter quality (LFT and OPF). The mean monthly reduction in C/N ratio for RAC, ECO, EFB, OPF, and LFT was 9.0, 7.9, 5.4, 1.5, and 0.5 units, respectively. Rosenani and Hoe (1996) recorded that EFB’s C/N ratio declined from 57 to 31 in 15 weeks of EFB decomposition. The C/N ratio of biomass declines with time because of the slower mineralization rate of N than the rate of C loss (Moraidi et al., 2012, 2014).
Different nutrients in organic materials are released at different rates. Khalid et al. (2000) found that the release rates of nutrients from the OPF were in the order of K > Ca > Mg > P > N, and that LFT, due to their higher decomposition rate, had higher release rates for all these nutrients as compared to RAC. Similarly, Lim and Zaharah (2002) found that 90% K in EFB was released within just six months, compared to nearly none for N even after 10 months. They observed only significant amounts of N released in the second year of EFB mulch application. Likewise, Rosenani and Wingkis (1999) observed only 50% of EFB’s N released within nine months of EFB decomposition, and in studies by Moraidi et
Table 10. Temporal carbon and nutrient release (%) by the decomposition of oil palm leaflets (LFT), rachis (RAC), fronds (OPF), empty fruit bunches (EFB), and Ecomat (ECO).
Decomposition (months) Properties LFT RAC OPF EFB ECO
3 C 67.3 44.3 52.6 57.4 54.8
N 49.0 2.3 36.7 9.7 2.8
C/N 14.7 64.7 34.2 26.0 38.5
P 42.9 14.8 35.4 19.2 15.2
K 65.2 37.1 45.0 55.5 50.8
Ca 48.8 18.6 36.9 28.3 22.8
Mg 43.3 14.7 36.8 36.6 27.6
6 C 88.7 64.2 73.3 82.7 78.4
N 84.2 12.9 66.1 38.7 36.5
C/N 16.8 48.7 35.5 15.8 27.2
P 83.4 27.6 67.7 49.2 45.8
K 93.2 72.9 78.4 87.3 78.2
Ca 87.3 54.5 73.5 53.1 45.5
Mg 81.1 22.7 67.3 61.9 47.4
8 C 92.6 73.8 80.8 87.6 86.4
N 90.0 25.4 72.9 48.9 43.1
C/N 18.0 40.6 33.0 13.7 20.1
P 90.4 36.4 75.3 57.8 54.1
K 95.5 78.9 83.3 95.5 86.0
Ca 91.5 56.8 77.4 60.3 58.2
Mg 89.8 40.0 77.8 70.2 55.7
Source: Moraidi et al. (2012)

Working paper 11
al. (2012, 2014), nearly 50% of N released within eight months (Table 10). The slow release of N by EFB is due to EFB’s high C/N ratio (Table 5). Moore et al. (2006) reported that materials with high C/N ratios are more stable, retaining a greater proportion of their N at a given decomposition stage than materials with low C/N ratios. From Table 10, K is the nutrient most quickly released for all oil palm biomass types. K is released at a much faster rate than other nutrients because K is not a part of the structural element of plant biomass (unlike N and P) but a part of the plant cell sap. Consequently, K is more mobile than other nutrients and is quickly released even within the early stages of biomass decomposition. Moraidi et al. (2012, 2014) observed that the temporal nutrient release patterns for N, P, and Mg were similar with one another.
By multiplying the amount of dry matter added to the soil by OPF, EFB, and ECO (Table 9) with their respective nutrient concentrations (Table 5) and nutrient release rates (Table 10), we could determine the total amount of C and nutrients released into per unit mulched land area after eight months of decomposition (Table 11).
EFB released the highest amount of C and nutrients (except for Ca) per unit mulched area compared to OPF and ECO. This is mainly because EFB had the highest loading rate, as well as having the higher K and Mg concentrations compared to both these biomass types (Table 5 and 9). In addition to ECO having the lowest loading rate, nutrient losses during EFB’s industrial conversion into ECO and ECO’s slower decomposition rate meant that ECO released the lowest amount of C and nutrients compared to EFB and OPF. Despite having nearly three times
Table 11. Total amount of carbon and nutrients released over the mulched area from oil palm fronds (OPF), empty fruit bunches (EFB), and Ecomat (ECO) after eight months of biomass decomposition.
Element (g m-2) OPF* EFB ECOC 1730 4990 1350N 30 70 10P 2 6 1K 41 215 31Ca 21 17 3Mg 2 10 1
* dry weights 4.28, 11.93, and 3.23 kg m-2 for OPF, EFB, and ECO, respectively.
Source: Moraidi et al. (2012)
Table 12. Temporal carbon and nutrient release (%) by the decomposition of OPT (oil palm trunk) when the trunk is: a) chopped and b) shredded.
a) Chopped OPT
Decomposition (months) C* N P K Ca Mg1 15.4 -22.0 -19.3 -8.5 -17.5 -14.0
3 38.7 -22.8 -8.8 8.5 -6.5 -8.7
6 43.1 -13.0 0.9 28.9 1.3 0.5
12 63.3 -28.5 9.6 66.2 5.0 -0.5
18 72.2 -1.6 36.8 79.6 2.4 55.0
* %C released from chopped OPT is estimated by taking the initial dry trunk biomass as 67 t ha-1 (Kee, 2004), decomposition rate as 0.07 % month-1 (Table 8), and assuming a constant 34% C in the whole trunk (Table 5) throughout the decomposition period. Source: Kee (2004)
b) Shredded OPT
Decomposition (months) C N P K Ca Mg3 42.2 -83.4 -0.7 67.4 0.0 30.8
6 65.7 -55.3 -51.2 92.5 -28.1 82.8
9 84.2 7.3 -13.7 95.3 66.7 87.9
12 88.8 26.9 19.2 96.7 72.6 96.0
Sources: Taqwan (2013), Nurul Hidayah (2014)
12 Working paper
lower loading rate than EFB, OPF still released a higher amount of Ca than EFB. This is because the Ca concentration in LFT (which is a component of OPF) is five times higher than EFB (Table 5). Nearly two-thirds of OPF’s weight is RAC (Fig. 3), and although RAC has a lower organic matter quality than ECO, OPF still released higher amounts of C and nutrients than ECO because OPF has a higher loading rate than ECO and about a third of OPF is the nutrient-rich and easily decomposable LFT.
OPT has the lowest organic matter quality. Consequently, it took the longest compared to OPF, EFB, and ECO to decompose. Very little Ca was released (< 5%) by chopped OPT even after 18 months of decomposition (Table 12a). During the early stages of trunk decomposition, there was instead a net increase in the trunk nutrient concentrations, leading to negative (not positive) nutrient release rates. Even after 18 months, there was no net amount of N released by the trunk. Kee (2004) attributed this to the translocation of N from the soil into the trunk by the soil fungal colonies, N-fixation by soil microbes that have been stimulated by the increased availability of C sources, migration of small fauna into the decomposing trunk, and inputs from wet and dry depositions (such as N from rainfall). Despite a gradual loss of trunk biomass with time (70% loss within 18 months), most nutrients remained immobile in the trunk and very little were released. Only after 12 months of decomposition was there appreciable amounts released for P and Mg nutrients.
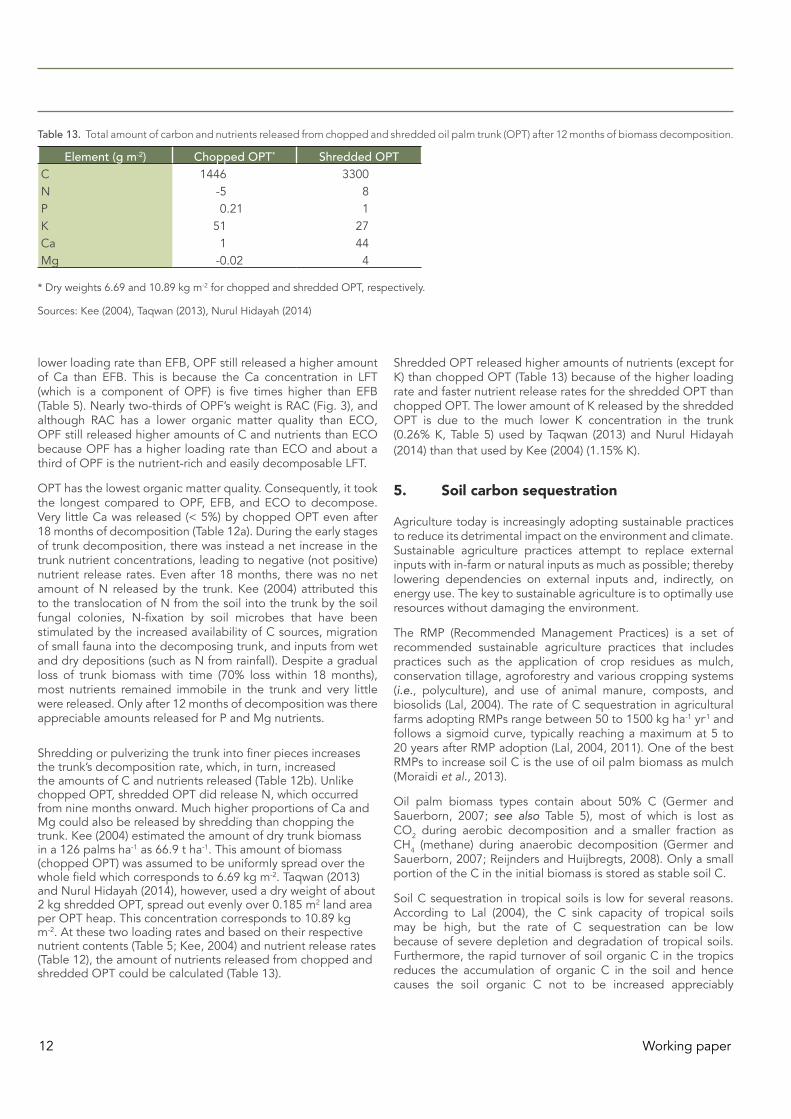
Shredding or pulverizing the trunk into finer pieces increases the trunk’s decomposition rate, which, in turn, increased the amounts of C and nutrients released (Table 12b). Unlike chopped OPT, shredded OPT did release N, which occurred from nine months onward. Much higher proportions of Ca and Mg could also be released by shredding than chopping the trunk. Kee (2004) estimated the amount of dry trunk biomass in a 126 palms ha-1 as 66.9 t ha-1. This amount of biomass (chopped OPT) was assumed to be uniformly spread over the whole field which corresponds to 6.69 kg m-2. Taqwan (2013) and Nurul Hidayah (2014), however, used a dry weight of about 2 kg shredded OPT, spread out evenly over 0.185 m2 land area per OPT heap. This concentration corresponds to 10.89 kg m-2. At these two loading rates and based on their respective nutrient contents (Table 5; Kee, 2004) and nutrient release rates (Table 12), the amount of nutrients released from chopped and shredded OPT could be calculated (Table 13).
Shredded OPT released higher amounts of nutrients (except for K) than chopped OPT (Table 13) because of the higher loading rate and faster nutrient release rates for the shredded OPT than chopped OPT. The lower amount of K released by the shredded OPT is due to the much lower K concentration in the trunk (0.26% K, Table 5) used by Taqwan (2013) and Nurul Hidayah (2014) than that used by Kee (2004) (1.15% K).
5. Soil carbon sequestration
Agriculture today is increasingly adopting sustainable practices to reduce its detrimental impact on the environment and climate. Sustainable agriculture practices attempt to replace external inputs with in-farm or natural inputs as much as possible; thereby lowering dependencies on external inputs and, indirectly, on energy use. The key to sustainable agriculture is to optimally use resources without damaging the environment.
The RMP (Recommended Management Practices) is a set of recommended sustainable agriculture practices that includes practices such as the application of crop residues as mulch, conservation tillage, agroforestry and various cropping systems (i.e., polyculture), and use of animal manure, composts, and biosolids (Lal, 2004). The rate of C sequestration in agricultural farms adopting RMPs range between 50 to 1500 kg ha-1 yr-1 and follows a sigmoid curve, typically reaching a maximum at 5 to 20 years after RMP adoption (Lal, 2004, 2011). One of the best RMPs to increase soil C is the use of oil palm biomass as mulch (Moraidi et al., 2013).
Oil palm biomass types contain about 50% C (Germer and Sauerborn, 2007; see also Table 5), most of which is lost as CO2 during aerobic decomposition and a smaller fraction as CH4 (methane) during anaerobic decomposition (Germer and Sauerborn, 2007; Reijnders and Huijbregts, 2008). Only a small portion of the C in the initial biomass is stored as stable soil C.
Soil C sequestration in tropical soils is low for several reasons. According to Lal (2004), the C sink capacity of tropical soils may be high, but the rate of C sequestration can be low because of severe depletion and degradation of tropical soils. Furthermore, the rapid turnover of soil organic C in the tropics reduces the accumulation of organic C in the soil and hence causes the soil organic C not to be increased appreciably
Table 13. Total amount of carbon and nutrients released from chopped and shredded oil palm trunk (OPT) after 12 months of biomass decomposition.
Element (g m-2) Chopped OPT* Shredded OPTC 1446 3300N -5 8P 0.21 1K 51 27Ca 1 44Mg -0.02 4
* Dry weights 6.69 and 10.89 kg m-2 for chopped and shredded OPT, respectively.
Sources: Kee (2004), Taqwan (2013), Nurul Hidayah (2014)
Working paper 13
(Ross, 1993; Craswell and Lefroy, 2001; Johnston, 2011). For example, Johnston (2011) reported that 75% of C in farmyard manure, 64% of C in biosolids, and 60% of C in compost was lost during decomposition. Six et al. (2002) further showed that mean residence time of C in the soil surface of tropical soils (35 years) was 0.56 times of that for temperate soils (63 years) which confirms the faster C decomposition in the tropical than in the temperate soils. Besides the rapid decomposition, the loss of organic C by erosion and runoff (Craswell and Lefroy, 2001; Katyal et al., 2001; Powlson et al., 2011) and by leaching of dissolved organic C (Powlson et al. (2011) causes the soil C sequestration in the tropics (characterized by high amount and intense rainfall) to be low.
Nonetheless, Comte et al. (2013) reported that the continuous use of organic fertilizers (comprising EFB and/or POME) for seven years (2004 to 2010) had resulted in higher soil C in loamy soils (which covered 92% of the 4000-ha oil palm plantation in the Riau province, Sumatra) by 1.6 to 1.8 times than soils receiving only mineral fertilizers. However, they found that soil C would quickly decline if the applications of organic fertilizers were stopped or became infrequent.
Pauli et al. (2014) further reported that oil palm plantations in Sumatra and Kalimantan that applied oil palm biomass (fronds and EFB) as mulch experienced an increase in soil C by an average of 1.2 times (equivalent to an increase of 3 g C kg-1 soil). Likewise, Abu Bakar et al. (2011) reported that after ten years of annual application of 20 t EFB ha-1, soil C had increased from 1.49 to 2.50% compared with the control (no mulch). Doubling the EFB rate to 40 t EFB ha-1 further increased soil C, but only to 2.73%. This is only a small gain in soil C, but it is important to remember that the benefits of mulching are not only in increasing soil C sequestration but also in providing nutrients to crops. Abu Bakar et al. (2011) observed that only by doubling the EFB application rate to 40 t EFB ha-1 did the oil
palm yields respond positively. The lower rate of 20 t EFB ha-1 failed to increase oil palm yields compared to control.
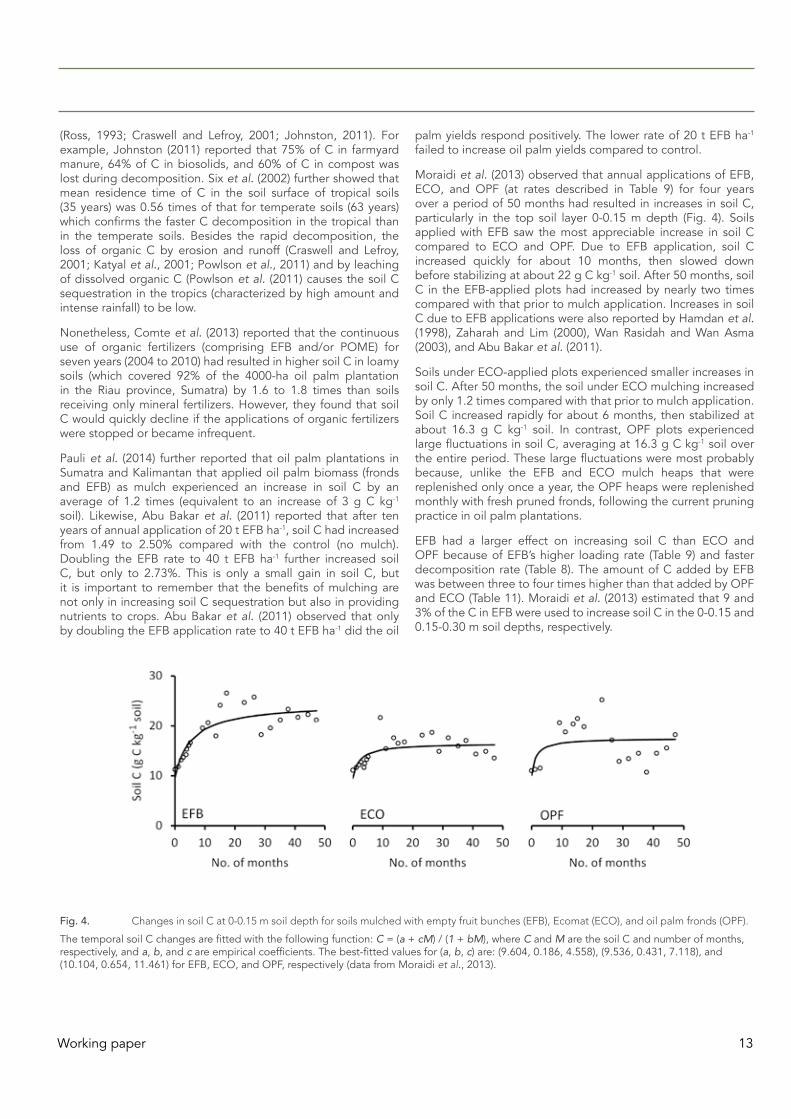
Moraidi et al. (2013) observed that annual applications of EFB, ECO, and OPF (at rates described in Table 9) for four years over a period of 50 months had resulted in increases in soil C, particularly in the top soil layer 0-0.15 m depth (Fig. 4). Soils applied with EFB saw the most appreciable increase in soil C compared to ECO and OPF. Due to EFB application, soil C increased quickly for about 10 months, then slowed down before stabilizing at about 22 g C kg-1 soil. After 50 months, soil C in the EFB-applied plots had increased by nearly two times compared with that prior to mulch application. Increases in soil C due to EFB applications were also reported by Hamdan et al. (1998), Zaharah and Lim (2000), Wan Rasidah and Wan Asma (2003), and Abu Bakar et al. (2011).
Soils under ECO-applied plots experienced smaller increases in soil C. After 50 months, the soil under ECO mulching increased by only 1.2 times compared with that prior to mulch application. Soil C increased rapidly for about 6 months, then stabilized at about 16.3 g C kg-1 soil. In contrast, OPF plots experienced large fluctuations in soil C, averaging at 16.3 g C kg-1 soil over the entire period. These large fluctuations were most probably because, unlike the EFB and ECO mulch heaps that were replenished only once a year, the OPF heaps were replenished monthly with fresh pruned fronds, following the current pruning practice in oil palm plantations.
EFB had a larger effect on increasing soil C than ECO and OPF because of EFB’s higher loading rate (Table 9) and faster decomposition rate (Table 8). The amount of C added by EFB was between three to four times higher than that added by OPF and ECO (Table 11). Moraidi et al. (2013) estimated that 9 and 3% of the C in EFB were used to increase soil C in the 0-0.15 and 0.15-0.30 m soil depths, respectively.
Fig. 4. Changes in soil C at 0-0.15 m soil depth for soils mulched with empty fruit bunches (EFB), Ecomat (ECO), and oil palm fronds (OPF).
The temporal soil C changes are fitted with the following function: C = (a + cM) / (1 + bM), where C and M are the soil C and number of months, respectively, and a, b, and c are empirical coefficients. The best-fitted values for (a, b, c) are: (9.604, 0.186, 4.558), (9.536, 0.431, 7.118), and (10.104, 0.654, 11.461) for EFB, ECO, and OPF, respectively (data from Moraidi et al., 2013).

14 Working paper
For ECO, about 4% of its C was used to increase soil C in the 0-0.15 as well as the 0.15-0.30 m soil depths. For OPF, the fractions were 5 and 2% in the respective aforementioned soil depths. Even after 50 months, only a small portion of the oil palm biomass C was sequestrated in the soil, the much larger portion of C presumably lost as CO2 emission, erosion runoff, leaching, and soil biota use.
Application of shredded OPT (at the rate specified in Table 13) as soil mulch also increased soil C in the 0-100 mm soil depth at a rate of 0.157 g C kg-1 soil per month for nearly a year (Fig. 5). After 10 months, shredded OPT increased soil C by 1.3 times, from which about 3% of the C in the shredded OPT had been sequestrated in this soil depth. Although appreciable increases in soil C by shredded OPT was observed within the first ten months, these increases would not continue indefinitely. As exemplified in Fig. 4, increases in soil C were initially rapid for the first six to ten months, depending on the mulch material, after which these increases slowed down before the soil C reached some constant level.
Fig. 5. Changes in soil C in the 0-100 mm soil depth due to mulching with shredded oil palm trunk (OPT). The fitted line is a linear function with a slope of 0.157 and intercept of 10.613 (data from Wan Nurul Ain, 2013; Siti Hawa, 2014).
6. Mulching effects on soil physico-chemical properties and oil palm
Compared to other oil palm biomass types, much more has been studied on EFB’s impact on soil and oil palm properties. The application of EFB as mulch has been shown to increase the levels in soil chemical properties such as pH, exchangeable K, Ca, and Mg, CEC, C, N, and P (Ortiz et al., 1992; Rosenani and Wingkis, 1999; Zaharah and Lim, 2000; Lim and Zaharah, 2002; Budianta et al., 2010; Kheong et al., 2010; Zolkifli and Tarmizi, 2010), as well as oil palm leaf K and N levels (Lim and
Zaharah, 2002). EFB mulching has also led to higher vegetative growth parameters (such as leaf area and rachis length) and subsequently higher oil palm yields (Chan et al., 1980; Ortiz et al., 1992; Hamdan et al., 1998).
Caliman et al. (2001) reported that 60 t ha-1 of EFB mulch application in Indonesian oil palm plantations resulted in increases in soil pH from 4.5 to 7 only after two months. That EFB application increases soil pH is important. Oil palm is very often planted on acidic soils with low buffering capacities. Continuous and long-term use of mineral fertilizers, coupled with high rainfall and leaching in the tropics, would exacerbate the low fertility of such soils. Consequently, many researchers recommend the addition of organic fertilizers such as the application of EFB and POME which would, among other benefits, provide a liming effect to the soil by raising the its pH.
Soil pH typically rises with application of organic fertilizers because of the alkalinity (organic anion content) in the organic fertilizers (Mokolobate and Haynes, 2002) or the decarboxylation process during microbial activities that would cause proton consumption (Barekzai and Mengel, 1993). Release of basic cations such as K from fresh organic matter can displace acidic anions such as Al and H from soil surfaces (Li et al., 2008); thus, raising soil pH. As noted in Table 5, oil palm biomass types are particularly high in K content, and as shown in Table 10 to 13, K is a mobile nutrient and is released quickly and in large amounts during biomass decomposition. Moraidi et al. (2012) reported EFB mulching produced the highest increase in soil pH compared to ECO and OPF mulching because EFB released the highest amount of K (as well as in Ca and Mg) into the soil.
ECO, which is a mat or carpet made of the fibers from EFB, is a recent development. Consequently, studies on ECO have only started recently. Soil mulching with ECO has been shown to increase the vegetative growth of oil palm by between 5 to 14% and oil palm’s nutrient uptake by 10 to 24% (MPOB, 2003; Khalid and Tarmizi, 2008). Furthermore, ECO mulching can help to conserve soil water by as much as 17 and 9% in the 0-0.20 and 0.20-0.40 m soil depths, respectively (Xin-Fu, 2004) and 44% in the 0-0.20 m soil depth (Liu et al., 2005).
Teh et al. (2010, 2011), Moradidalini et al. (2011), and Moraidi et al. (2012, 2013, 2014, 2015) comprehensively compared the simultaneous mulching effects of EFB, ECO, and OPF on several properties of soil and oil palm. They reported that EFB mulching, compared with ECO and OPF, produced the highest increase in all measured soil chemical properties: pH, C, N, P, K, Ca, and Mg. The largest improvement in soil properties was from EFB because of its highest loading rate (Table 9), fastest decomposition rate (Table 8), and nutrient-rich content (Table 5). Since all oil palm biomass was applied on the soil surface, the top soil (0-0.15 m) experienced the largest beneficial effects of mulching compared to lower soil depths. EFB mulching also resulted in the highest leaf nutrient contents for N, P, K, and Mg compared to ECO and OPF. Nonetheless, these beneficial effects by EFB were only observed two years after mulching had begun. Leaf Ca in the EFB mulching plots was however not increased because of the antagonistic effect between K and Ca uptake (Lazaroff and Pitman, 1966; Freeman, 1967). The high K uptake in the EFB mulching plots had reduced the Ca uptake. In

Working paper 15
contrast, N and P has a synergistic effect on their uptake. High N uptake leads to high P uptake as well, and this was as observed in the EFB mulching plots.
EFB released the highest amount of organic matter, mostly in the form of humic acids, as measured by Lee et al. (2012), as well as the highest amounts of soil-stabilizing cations such as K, Ca, and Mg. This resulted in the largest improvement in several soil physical properties in the EFB mulching plots. Over a period of two years, EFB, compared with OPF and ECO, resulted in higher soil aggregation (higher by an average of 5%), aggregate stability (29%), relative soil mesopores (0.2 – 3 mm) (16%), and available (30%) and total (16%) soil water content (Moraidi et al., 2015). The infiltration rate of water was also the highest in the EFB mulching plots. The water infiltration rates into the soil in the EFB, ECO, and OPF plots were 31.0, 21.0, and 10.7 mm hr-1, respectively (Junaidah, 2009).
EFB mulching plots had the largest soil microbial population compared with ECO and OPF (Fig. 6). Similar results were obtained by Hsiao-Hang (2015) who reported that the mean soil fauna feeding activity (in the first 80 mm soil depth) under EFB mulch in an oil palm plantation in Sumatra was 92% higher than in a nearby secondary forest and 15% higher than that under OPF heaps, harvesting paths, and palm circles (Fig. 7).
Fig. 6. Changes in soil microbial population over several weeks under empty fruit bunches (EFB), Ecomat (ECO), and oil palm fronds (OPF) mulch (from Moraidi et al., 2015). Note: ‘cfu’ denotes colony-forming unit.
The differences between the physical characteristics of EFB and ECO (Table 14) are also important to explain the better overall performance of EFB to ECO. Compared with ECO, EFB is less compact by two times and has slightly higher total porosity by 1.12 times and a higher saturated hydraulic conductivity by 1.5 times (Teh et al., 2010, 2011). EFB also has a lower water retention curve slope. These differences means that EFB could
absorb more water than ECO, and because EFB has a lower water retention curve slope, EFB could release the held water more gradually into the soil than ECO. These properties have helped EFB mulching to achieve a higher soil water content than ECO. For both years, EFB mulching conserved an average of 12 and 20% more total soil water content than ECO and OPF mulching, respectively (Table 15). Particularly for the drier year of 2008, EFB mulching conserved 20 and 35% more total soil water content than ECO and OPF mulching, respectively.
Fig. 7. Mean soil fauna feeding activity (in soil depth 0-80 mm) under empty fruit bunches (EFB), oil palm fronds (OPF), palm circles (CIRCLE), harvesting paths (HARVEST), and in a nearby secondary forest (data from Hsiao-Hang et al., 2015).
As mentioned earlier, Moraidi et al. (2015) estimated that the application of EFB, ECO, and OPF as mulch would allow the oil palm to endure a maximum of 10, 8, and 8 incessant dry days, respectively, before the crop begins to experience water stress. These values were determined by assuming 5 mm day-1 soil water loss (via evapotranspiration), active oil palm roots residing within the first 0.60 m soil depth, and a threshold of 65% available water content (AWC, calculated as the differ-ence in soil water content held at field capacity and that held at permanent wilting point), below which oil palm suffers from water stress (Allen et al., 1998). The mean measured soil AWC (by volume) under EFB, ECO, and OPF mulch was 13.0, 10.2, and 9.9 %, respectively.
Nevertheless, EFB, ECO, and OPF mulching did not result in significant increases in oil palm growth or yield (unpublished data). This could be because this mulching experiment was only conducted for a period of three years, too short perhaps for any beneficial effects from mulching on oil palm growth and yield to be observed. As revealed previously, increases in leaf nutrient content by EFB mulching, for instance, were only observed two

16 Working paper
years after mulching had begun. Abu Bakar et al. (2011) found that even after ten years of annual 20 t EFB ha-1 applications, there was no significant increase in FFB (fresh fruit bunches) yield. However, doubling the EFB annual application rate to 40 t ha-1 managed to significantly increase FFB yield but by only 9% within the ten years. Similarly, a series of experiments conducted in North Sumatra showed that applications of 20 to 40 t EFB ha-1 yr-1 did not significantly increase the yields of immature palms after one year, but mature palms showed significant yield increase after two years by 5 and 13% from 40 and 80 t EFB ha-1 yr-1 applications, respectively (BLRS, 1998). Redshaw (2003) reviewed several EFB trials conducted in Malaysia, Indonesia, Nigeria, and Papua New Guinea and observed that maximum oil palm yields are usually only achieved when EFB application is supplemented with mineral fertilizers.
Much less have been studied on the effects of OPT on soil properties. Wan Nurul Ain (2013) and Siti Hawa (2014), however, observed that the application of shredded OPT over a period of a year resulted in higher levels of soil exchangeable Mg (by 5.9 times), K (4.2), and Ca (3.3) compared with the control (no mulching). The soil moisture content under shredded OPT mulch was also higher by 1.3 times (or 33%) compared to the control. Soil total N, available P, pH, and CEC levels, however, only experienced marginal increases due to OPT mulching. This is because relatively low amounts of N and P were released by
shredded OPT even after a year (Table 12 and 13). Due to the slower decomposition rate of chopped OPT (Table 8), we can expect chopped OPT to give lower or slower improvements in soil chemical properties compared to shredded OPT.
Lastly, yield increases of 12 to 29% have been reported where POME has been applied in oil palm plantations in Malaysia (Singh, 1994), where other benefits include increases in soil pH, water retention, CEC, and soil nutrient levels of available P and exchangeable K, Ca, and Mg. Nonetheless, yield increases by POME are likely also due to the high moisture content in the liquid POME (Redshaw, 2003; Table 5). Recall that oil palm yields respond strongly to additional water whether via increased rainfall (e.g., Fig. 1) or irrigation.
7. Empty fruit bunches biochar as a carbon sink and soil amendment
One area of active research is on the conversion of EFB into biochar (biological charcoal) and its use as a soil amendment in agriculture soils. Today there is attention on biochar because biochar is a recalcitrant carbon-rich material that is highly resistant to microbial degradation, making biochar a very stable carbon sink. Organic materials, when left in the ground, will decompose and a large portion of their C will be lost during this
Table 14. Physical characteristics of empty fruit bunches (EFB) and Ecomat (ECO).
Property EFB ECODensity (Mg m-3) 0.11 0.24
Total porosity (%, v/v) 91.53 81.54
Saturated hydraulic conductivity (mm s-1) 5.40 3.50
Negative slope of water retention curve (power function) 0.13 0.23
Source: Teh et al. (2010, 2011)
Table 15. Table 15. Mean daily soil water content (in mm) for two years under oil palm fronds (OPF), empty fruit bunches (EFB), and Ecomat (ECO) mulch.
Mulch Year*Soil depth (m)
0.0-0.15 0.15-0.30 0.30-0.45 0.45-0.60 0.60-0.75 AllOPF 2008 39.48 42.93 39.96 45.61 52.04 220.02
2009 49.28 52.64 51.05 52.57 55.92 261.46
Both 45.82 49.21 47.13 50.11 54.55 246.82
EFB 2008 63.04 49.31 54.37 60.86 68.92 296.51
2009 59.53 55.29 55.34 58.88 66.87 295.91
Both 60.77 53.18 54.99 59.58 67.59 296.12
ECO 2008 55.80 45.43 41.87 50.20 55.17 248.50
2009 56.71 51.50 49.87 55.36 60.28 273.73
Both 56.40 49.36 47.04 53.54 58.48 264.82
* annual rainfall for 2008 and 2009 were 2264 and 2403 mm, respectively
Sources: Moradidalini et al. (2011) and Moraidi et al. (2015)

Working paper 17
decomposition process, leaving behind only a small C fraction to be stored in the soil. Moreover, soils have limited capability to store C. Addition of C into soils will indeed increase soil C levels but only up to a certain maximum level usually within 5 to 20 years (Lal, 2004, 2011), and should these C additions cease or become infrequent, soil C levels may start to decline, as observed by Comte et al. (2012).
As discussed earlier, less than 10% (usually 5% or less) of total C in biomass such as EFB, ECO, OPF, and shredded OPT are used to increase the soil C level. The C content in these organic materials is typically between 35 to 50% (Table 5), but the C content in biochar can be as high as 90%. Mahmood et al. (2015), for instance, produced biochar from OPF and EFB, and the C content of these substances was 91 and 75%, respectively.
Biochar is produced by a process called pyrolysis, whereby the organic materials are combusted under high temperatures (300 °C or more) in the absence of or under low concentration levels of oxygen. The plant material in the pyrolysis process undergoes chemical transformation into refractory molecular structures, making the end product, the biochar, extremely inert. But as it turns out that how the pyrolysis process is carried out (such as differences in the heating rate, maximum temperature, and residence time) will greatly affect the biochar properties. Claoston et al. (2014) used three temperatures (350, 500, and 650 °C) in the pyrolysis process to convert EFB into biochar.
Higher temperatures produced lower biochar yields (i.e., less biochar for the same amount of organic material combusted) and decreased CEC in the biochar and its C and N concentrations (Table 16). However, higher temperatures increased the total surface area of the biochar, its pH, and its Al, Ca, Mg, Na, P, and K concentrations. Claoston et al. (2014) further remarked that EFB biochar should not be produced at pyrolysis temperatures below 300 °C or above 800 °C, because the former causes incomplete biochar formation and the latter excessive destruction to the biochar internal structures.
Several studies have shown biochar is effective as a soil amendment to improve soil physico-chemical properties such as soil structure and water retention, nutrient availability, soil pH, and reduced Al3+ toxicity (Peter, 2007; Major et al., 2010; Zhang et al., 2011). Increases in crop productivity due to biochar application have also been observed, although most biochar studies have so far been on short term crops.
Rosenani et al. (2015) reported that, compared to the control (no biochar application), the addition of EFB biochar (at rates 10, 20, and 40 t ha-1) in a potted experiment with acid sulfate soil increased wet rice yield by between 141 to 472% and increased soil pH from 3.5 (in control) to 6.0 (at maximum biochar rate). The decreasing Al3+ levels in the flood water with increasing biochar rates showed that EFB biochar had successfully mitigated the Al3+ toxicity. Similar observations have been reported by Rabileh
Table 16. EFB (empty fruit bunches) biochar yield and chemical properties produced at three pyrolysis temperatures (after Claoston et al., 2014).
Property 350 °C 500 °C 650°CYield (%) 37.57 24.07 20.93
pH 8.31 9.89 10.29
EC (mS cm–1) 2.87 5.36 6.75
CEC (cmol kg–1) 21.5 14.6 12.03
Elemental analysis (% by weight)
C 61.96 65.88 64.53
N 1.08 0.87 0.72
S 0.02 0.01 0.02
H 7.67 4.23 3.1
O 29.29 29.02 31.65
H/C molar ratio 1.49 0.77 0.58
O/C molar ratio 0.35 0.33 0.37
Al 0.045 0.065 0.06
Ca 0.381 0.544 0.561
Fe 0.096 0.304 0.15
Mg 0.26 0.396 0.415
Si 0.033 0.036 0.017
Na 0.046 0.056 0.058
P 0.104 0.151 0.19
K 4.18 5.60 6.55

18 Working paper
et al. (2015). They observed that applications of EFB biochar up to 20 t ha-1 increased soil pH, decreased Al3+ toxicity, and increased plant growth parameters such as height, total root length, and total dry weight of maize grown on an Ultisol soil under glasshouse conditions. Abdulrazzaq et al. (2015) further reported that the applications of 15 and 30 t ha-1 EFB biochar increased the shoot dry weight of sweet corn by about three and six times, respectively, and plant height by about three times for both biochar rates. EFB biochar also increased soil hydraulic conductivity and decreased bulk density.
Biochar however has not always been successful in increasing crop growth and yield or improving soil properties. Abdulrazzaq et al. (2015) reported that about half of the reviewed literature reported positive effects of biochar on soil properties, including ameliorating soil toxicity due to excessive toxic metals, and mitigating climate change effects (Jaiswal et al., 2014; Masto et al., 2013; Tian et al., 2012). However, about a third of the reviewed studies reported no significant benefits, and the rest of the effects were found to be negative (Devereux et al., 2012; Gajic and Koch, 2012; Kloss et al., 2014). The negative effects of biochar could be due to its inherent high pH (Table 16), so when added to a soil with already high pH, the biochar could cause nutrient imbalance and reduce plant growth (van Zwieten et al., 2010; Haefele et al., 2011). Another possible reason could be due to increase in N immobilization after biochar application, causing less N to be available for plants (Bruun et al., 2011).
Another potential problem of biochar is the energy sources required for the organic material combustion in the pyrolysis process. This could make biochar carbon-positive, meaning that producing biochar would add more carbon than its removal from the atmosphere. Nonetheless, Hansen et al. (2012) carried out a life cycle assessment (LCA) on the conversion of EFB into biochar in Malaysia and reported a maximum total equivalent CO2-savings of 210 kg CO2,e t-1 EFB. In 2013, Indonesia is estimated to have produced 28.1 mil. t EFB (Table 3), and even if 75% of which are returned to the oil palm plantations, a potential reduction in equivalent CO2,e emission of 4.4 mil. t CO2,e yr-1 can be achieved if the EFB are converted into biochar instead (assuming the savings in CO2,e for Malaysia apply for Indonesia as well).
Biochar’s stability, benign characteristics in the soil, and high C content make it an effective sink for carbon, and studies such as Rabileh et al. (2015) and Rosenani et al. (2015), as discussed earlier, have shown that EFB biochar is an overall effective soil amendment, particularly for soils with toxicity or low pH problems, where the latter is often a key problem for highly weathered tropical soils.
8. Nutrient balance for high oil palm yields
8.1. Nutrient demand, immobilization, and removal
Nutrient demand by oil palm is small in the first year following field planting as the tree is still establishing its rooting system (Fig. 8 and Table 17). However, nutrient demand increases steeply in the next two to four years, after which it stabilizes to a rather constant level.
Fig. 8. Nutrient uptake of N, P, K, and Mg by oil palm for the first ten years after field planting (after Ng, 1977).
A large part of nutrients in the oil palm tree are stored in the oil palm fresh fruit bunches (FFB), where between 20 to 45% of all N, P, K, Ca, and Mg nutrients in the oil palm are contained in this single component (Table 18). A yield of 30 t ha-1, for instance, results in the removal of N, P, K, Ca, and Mg from the field by as much as 88, 13, 111, 24, and 23 kg ha-1, respectively, amounting to a total loss of 260 kg ha-1 (Table 19 and 20). These are large losses in nutrients, particularly for K, which would require their losses to be replaced by the addition of fertilizers. However, after the palm oil milling process, if all the FFB are returned to the field as EFB, then the nutrient losses in the FFB would be reduced by between 9 to 38%, or overall, by 27% (Table 20).
Table 17. Nutrient demand (kg ha-1 yr-1) by oil palm.
Age (years) N P K Ca Mg0-3 40 6 55 13 73-9 191-267 32-42 287-387 85-114 48-67
Sources: Tan (1976, 1977)

Working paper 19
The total annual nutrient uptake by the oil palm trunk is low compared to the leaves and bunches (Table 21), but the nutrients accumulated over a life span of 25 to 30 years would mean that the trunk would become a large sink of nutrients (Goh and Härter, 2003). These trunk nutrients would eventually be returned to the soil at replanting unless the trunks are brought out of the fields for timber or burned; the latter would result in large losses in N and S, as described previously. Trunk decomposition, as shown earlier, are slow, but can be hastened by shredding or chopping the trunk into smaller pieces, so that complete trunk decomposition can occur between two to three years. The nutrients in the living trunk are thought to be immobilized, but there are speculations that they could be remobilized to meet the oil palm demand when there is a shortfall of nutrients (Teo et al., 2000; Goh and Härter, 2003).
A large proportion of nutrient uptake is needed for fruit bunches compared to immobilization in the trunk and roots (Table 21). Ng et al. (1999) reported that, for a targeted yield of 25 t ha-1 yr-1, the annual nutrient uptake in the fruit bunches was two times more than what was immobilized in the new biomass.
Pruned fronds account for 34-36% (N, P, K, and Mg) and 62% (Ca) of total uptake (Table 18), and the leaflets are a rich source of nutrients that would be released rapidly during decomposition (Table 5 and 10). In field practice, one or two fronds are pruned once a month, and these pruned fronds, along with the discarded male inflorescences, are left as soil mulch between planting rows.
All these show that removal of oil palm biomass from the fields, particularly EFB and pruned fronds, results in nutrient losses which must be replaced by addition of fertilizers. Biomass removal also deprives the oil palm of the beneficial effects of biomass mulching, which not only provides nutrients but also covers the soil surface to reduce weeds, erosion, and soil water evaporative losses. Nonetheless, these mulching benefits can be replaced by planting leguminous cover crops (LCC) such as Mucuna bracteata or Pueraria phaseoloides. One significant drawback of LCC is their rapid growth rate which requires the area around the palm trees (e.g., palm circle) to be regularly weeded; otherwise, these cover crops would encroach into the palm circle and ultimately climb up and envelop the trees,
Table 18. Partitioning of nutrients (%) between various oil palm components.
Component N P K Ca MgVegetative dry matter 21 12 22 14 19Pruned fronds (OPF) 35 34 35 62 36Fresh fruit bunches (FFB) 38 45 37 20 34Male inflorescence 6 9 6 4 11Total 100 100 100 100 100
Sources: Ng and Thamboo (1967), Ng et al. (1968)
Table 19. Nutrient content in the fresh fruit bunches (FFB).
kg t-1 FFB g t-1 FFBN P K Ca Mg Mn Fe B Cu Zn
2.94 0.44 3.71 0.81 0.77 1.51 2.47 2.15 4.76 4.93
Sources: Ng and Thamboo (1967), Ng et al. (1968)
Table 20. Net loss of nutrients from the field if 30 t ha-1 of FFB (fresh fruit bunches) are removed, then returned to the field as EFB (empty fruit bunches) mulch.
Nutrient lost/added (kg ha-1)* %Nutrient Lost by FFB removal Added by EFB return Returned
N 88.2 19.6 22.3P 13.2 1.1 8.6K 111.3 42.7 38.3
Ca 24.3 4.5 18.6Mg 23.1 2.7 11.7
Total 260.1 70.7 27.2
* Note: these values are calculated based on the nutrient content of FFB (Table 19) and EFB (Table 5) and taking 21% of FFB as being converted into EFB (Table 3).

20 Working paper
complicating field operations such as harvesting, pruning, and fertilizing.
8.2. Nutrient inputs and losses
Soil nutrient input or supply in oil palm plantations comes from various sources such as dissolved nutrients from atmospheric deposition (such as precipitation), nutrients recycled from oil palm biomass (pruned fronds, empty fruit bunches, trunks, and male inflorescences), nutrients leached by rainfall from the oil palm canopies (leaf wash), nutrient returns from leguminous cover crops, available nutrients currently present in the soil, and fertilizer applications (Goh and Härdter, 2003).
The nutrients contained in rainfall are often present in significant amounts to become an important source of nutrients for oil palm (Table 22). The main sources for nutrient loading in the atmosphere are sea-spray, terrestrial dust, and anthropogenic sources such as from industrial and land use activities (Yusop et
al., 1989). Thus, atmospheric nutrient loading can vary between regions, although, as shown in Table 22, the phosphorus loading is low, no more than 0.5 kg P ha-1 yr-1.
Not all rainfall reaches the ground. A portion of gross rainfall is intercepted by the canopies and the rest falls directly and unimpeded to the ground. Some of the intercepted rainfall will still reach the ground as leaf drip and stemflow (water flowing down along the trunk). Nonetheless, a small portion of the stemflow water will be absorbed into the trunk and will not reach the ground.
Squire (1984) discovered that rainfall interception by oil palm canopies was between 17 to 22%, depending on the palm age, erectness of the canopies, and rainfall intensity. The average amount of rainfall reaching the ground (i.e., net rainfall) in mature oil palm plantations, measured over various regions in Indonesia and Malaysia, is 73% of gross rainfall (Chong, 2012; Fig. 9). This average value lies within the measured 70-78% range, as reported by Kee et al. (2000).
Table 21. Nutrient uptake in different oil palm tree components (after Comte et al., 2012)
FFB yield Nutrient uptake (kg ha-1 yr-1)Component (t ha-1 yr-1) N P K Mg Ca Sources*
Production
Harvested FFB (fresh fruit bunches)
24 72.5 12.1 93.2 20.7 - 1, 225 73.2 11.6 93.4 20.8 19.5 230 99.1 15.6 129.3 33.3 - 430 97.6 10.0 105.4 18.2 - 5
Immobilized
Trunk 30 42.4 4.1 121.6 10.2 - 4Roots - 16.6 1.1 2.8 0.4 - 3Trunk and roots 30 18.5 2.4 61.9 3.8 - 5New biomass 25 40.0 3.1 55.7 11.5 13.8 2
Recycled
Pruned fronds and male inflorescences 24 78.4 11.3 102.1 28.1 - 1, 2
* Sources: 1 - Ng and Thamboo (1967), 2- Ng et al. (1968), 3 – Corley et al. (1971), 4 – Ng et al. (1999), 5 - Tarmizi and Mohd.Tayeb (2006)
Table 22. Annual atmospheric nutrient loading (in kg ha-1 yr-1) for some Indonesian and Malaysian locations.
LocationAnnual rainfall
(mm) N P K Ca MgIndonesia
Java 4670 15.4 0.4 9.6 9.8 4.0Papua New Guinea 3800 6.5 0.2 7.3 3.6 1.3
MalaysiaPasoh 2380 13.5 na* 6.4 4.2 0.7Berembun 1979 10.7 0.1 6.7 52.2 18.6
* na – not available
Sources: Manokaran (1980), Edwards (1982), Bruijnzeel (1989), Yusop et al. (1989)

Working paper 21
Fig. 9. Net rainfall is, on average, 73% of gross rainfall in mature oil palm plantations in Indonesia and Malaysia (data from Chong, 2012).
Although net rainfall has not been measured for partially opened oil palm canopies, we can regard that the net rainfall will constitute roughly between 100% for fully opened canopies (which has a leaf area index or LAI = 0) to 73% for fully closed canopies (LAI ≥ 5). Thus, the portion of net rainfall to gross rainfall is simply a linear interpolation between these two canopy extremes, or mathematically,
Pn = Pg ×MAX 0.73, 1−0.0541× LAI( )⎡⎣
⎤⎦
[1]
where Pn and Pg are the net and gross rainfall (mm), respectively; LAI is the leaf area index (m2 leaf m-2 ground); and MAX is the maximum function, so that the net rainfall does not exceed 73% of gross rainfall when the canopies are fully closed (LAI ≥ 5).
Nutrient losses occur in oil palm plantations via runoff, eroded sediments, and leaching. Most studies on such nutrient losses have been carried out in Malaysia. Most of the oil palm root biomass is found within the first 1 m soil depth, but the active oil palm roots reside within a shallow depth of the first 0.30 m, increasing the risk of nutrient leaching losses (Comte et al. 2012). A field lysimeter study conducted on a clayey soil in Malaysia, for
Table 23. Nutrients lost via a) leaching and b) runoff and eroded sediments in some Malaysian oil palm plantations (after Comte et al., 2012).
a)
Soil order
Annual rainfall (mm)
Palms ha-1
Palm age (years)
Leached (% of applied fertilizer)
Source*N P K MgOxisols 1909 145 1 26.5 trace 19.5 169.4 1
1495 2 10.9 trace 3.4 8.4
2729 3 12.2 1.4 10.4 53.6
2787 4 16.8 5.8 5.6 47.6
2391 5 2.7 1.7 1.9 5.4
2193 6 4.8 1.4 3.3 6.6
Ultisols 2352 na# na 10.4 na 5.1 na 2Oxisols na na 1-4 16.6 1.8 9.7 69.8 3
5-8 1.2 1.6 2.5 11.5
9-14 3.0 1.5 2.9 15.5
b)
Soil order TransportLosses by erosion (kg ha-1 yr-1)
Source*N P K Mg CaUltisols Runoff 9.93 1.43 10.40 1.82 4.04 4
Sediments 5.57 3.63 8.79 21.10 7.40
Ultisols Runoff 5.85 0.90 26.90 5.20 na# 5
Sediments 0.65 0.90 trace 0.10 na
# na – not available
* Sources: 1 – Foong et al. (1983), 2 – Chang and Zakaria (1986), 3 – Foong (1993), 4 – Maena et al. (1979), 5 – Kee and Chew (1996)

22 Working paper
instance, reported 10-17% losses in applied N and K nutrients for palm ages 1 to 4 years, but these losses declined to 1-3% for palm ages 5-14 years (Foong, 1993; Table 23a). High leaching losses occur when the palms are immature because older oil palms have a larger nutrient demand and deeper and more extensive rooting system which would utilize the soil nutrients to a greater extent. However, a stronger nutrient demand by oil palms would require more fertilizers which in turn could increase the amount of nutrient loss by leaching. In general, P losses due to leaching are low due to the relative immobility of P in acidic, weathered tropical soils (Goh et al., 2003).
Nutrients lost via surface runoff and eroded sediments can be large, particularly in high rainfall tropical areas. Water erosion is particularly severe immediately after land clearing for oil palm planting or when the palms are still young and their canopies are not fully closed, leaving large areas of the soil surface exposed to the weather elements. Nonetheless, most oil palm plantations apply pruned fronds as mulch and/or plant leguminous cover crops to cover the soil surface. Maena et al. (1979) reported that, on average, 11% of applied fertilizers are lost via runoff and sediments in an oil palm plantation (Table 23b). However, erosion losses are not uniform over the whole field. Greater erosion losses were observed from the uncovered and compacted harvesting rows and the lowest erosion losses from the covered soil under the frond heaps. The amount of nutrients lost via erosion depend on soil texture, palm age, topography, rainfall intensity, soil infiltrability, and lag time between fertilizer application and rainfall (Banabas et al., 2008).
The types of mineral and organic fertilizers and their respective application rates used in major oil palm plantations in Indonesia are shown in Table 24. We can also prepare a nutrient balance sheet (Table 25) to determine approximately the amount of fertilizer inputs to apply in the field to meet the nutrient demand by oil palm, after accounting for the various nutrient sources and losses in the field.
A mature oil palm plantation producing 30 t FFB ha-1 yr-1 would require, in kg ha-1 yr-1, 125 N, 20 P, 251 K, 40 Ca, and 35 Mg (Table 25). This amount of nutrients can be reduced if all the FFB are returned to the field as EFB. Since EFB comprises 21% of FFB (Table 3), then about 6 kg EFB ha-1 yr-1 is returned to the field as mulch and fertilizer. This amount of EFB is equivalent to, in kg ha-1 yr-1, 20 N, 1 P, 43 K, 5 Ca, and 3 Mg (see Table 5 for the nutrient content in EFB). This addition of nutrients would reduce the nutrient requirement by oil palm by between 5 to 15%. However, if 40 t EFB ha-1 yr-1 were to be applied, following field practice of major oil palm plantations (Table 24), then the amount of nutrient requirement would be greatly reduced by between 30 to 96%. The biggest savings would be the reduction in the N and K requirements by 92 and 96%, respectively. As discussed earlier, EFB is usually in applied in the field as EFB stacks or heaps rather than uniformly applied over the whole field. Each EFB heap, applied over a 30 m2 ground area, is located at the center of four palm trees, so that each heap is assumed to provide nutrients to only these four palm trees. The field arrangement of EFB heaps is in such a way so that each palm tree receives EFB nutrients from only one EFB heap (i.e., no one palm tree gets nutrients from two or more EFB heaps).
We can calculate that adding even higher amounts of EFB would further reduce the nutrient requirements. Larger EFB rates up 80 t ha-1 (in two split applications) can be applied for young palms (18 months old), but Redshaw (2003) cautioned against using rates higher than this level because trials in Papua New Guinea that had applied 120 t EFB ha-1 caused anaerobic soil conditions that adversely affected fruit bunches.
It is important to realize that the nutrient balance sheet as shown in Table 25 is merely a rough approximation with several important caveats, one of which is that the nutrient supply by rainfall over Java is assumed applicable to all of Indonesia. Furthermore, the data on the nutrient losses used in the cur-rent nutrient balance sheet were taken from Malaysian trials conducted over a limited range of conditions. But as discussed earlier, the nutrient losses are strongly dependent on many soil, environmental, and meteorological conditions. Nutrient losses via runoff and eroded sediments, for instance, are expected to be larger for hilly and steep areas than for flat, level areas. The addition of EFB mulching would likely also increase the amount of additional nutrient losses via erosion and leaching, but calcu-lations in Table 25 simply assumed that the nutrient losses are in proportion to the additional amount of nutrients supplied by the EFB.
In mature oil palm plantations, the nutrient demand by the trunk and FFB components only need to be considered. The oil palm fronds have been fully developed at this stage, so provided that all pruned fronds are returned to the soil as mulch, we can
Table 24. Types of mineral and organic fertilizers used and their respective rates applied in major oil palm plantations in Indonesia.
Fertilizers* Rates (kg ha-1 yr-1)Organic fertilizers#
POME (treated) 750,000
EFB 40,000-60,000
Mineral fertilizers
Urea (46% N) 35-560
RP (30% P2O5) 105-490
DAP (46-53% P2O5) 35-560
TSP (42-50% P2O5) 35-350
MOP (60% K2O) 35-700
Kieserite (17% Mg) 35-280
Dolomite (12% Mg) 70-210
* POME – palm oil mill effluent, EFB – empty fruit bunches, TSP – triple super phosphate, MOP – muriate of potash, RP – rock phosphate, DAP – diammonium phosphate
# Not all plantations apply EFB or POME. However, those that do (mostly government- and private-owned plantations have access to POME and EFB) will usually apply them at the above listed rates. Sources: Caliman et al. (2001), Comte et al. (2013)

Working paper 23
consider the net nutrient demand by the fronds component to be zero, as all the nutrients in the fronds are returned to the soil during the frond decomposition. But if these fronds are removed from the fields, then this would lead to a considerable increase in the nutrient requirement to replace the lost nutrients. On average, a dry weight of 12 t ha-1 yr-1 of pruned fronds is produced from oil palm plantations (Astimar, 2014). Removal of this amount of pruned fronds would increase the nutrient requirement by between 35 to 230%, the largest increases being for N and Ca requirements. The rooting system of mature palms are regarded also as fully grown; thus, there is a zero net nutrient
demand for roots because root turnover would return the nutrients in the roots into the soil, much like leaving the pruned fronds on the ground to decompose.
Table 26 shows the amount of fertilizers that would be applied to meet the nutrient requirements of oil palm (with and without EFB mulching) as calculated earlier in the nutrient balance sheet (Table 25). The amount of fertilizers (without EFB mulching) is within the range usually applied in oil palm plantations (Table 24).
Table 25. A nutrient balance sheet to determine the approximate amount of nutrients required by mature oil palms that are producing 30 t FFB (fresh fruit bunches) ha-1 yr-1 (adapted from Goh and Teo, 2011).
Nutrient balance Nutrients (kg ha-1 yr-1)N P K Ca Mg
1. Nutrient inputsa. Rainfall * 15 0.4 10 10 4b. 6 t EFB ha-1 yr-1 # 20 1 43 5 3c. 40 t EFB ha-1 yr-1 125 7 271 29 17
2. Nutrient lossesa. Runoff, leaching, and sediments § -10 -3 -28 -11 -6b. Losses due to 6 t EFB ha-1 yr-1 ¶ -2 0 -5 -1 -1c. Losses due to 40 t EFB ha-1 yr-1 ¶ -10 -1 -30 -8 -3
3. Nutrient demand ‡
Trunk -42 -4 -122 -15 -10FFB yield -88 -13 -111 -24 -23
Net balanceNo EFB mulching (1a+2a+3) -125 -20 -251 -40 -356 t EFB ha-1 yr-1 (1a+1b+2a+2b+3) -107 -19 -213 -36 -3340 t EFB ha-1 yr-1 (1a+1c+2a+2c+3) -10 -14 -10 -19 -21
* Rainfall nutrient supply taken from Table 22 (Java location).
# 21% of 30 t FFB produces 6 t EFB (Table 3).
§ Erosion losses data taken from Table 23b: data on the losses via erosion from Kee and Chew (1996) and via leaching from Goh and Teo (2011). Data on erosion loss for Ca are taken from Maena et al. (1979), but no leaching for Ca is assumed.
¶ Nutrient losses are assumed to increase in proportion to the amount of added nutrients by EFB.
‡ Nutrient demand by the trunk is taken from Ng et al. (1999) (Table 21) and nutrient demand by FFB is determined by its nutrient content (Table 19).
Table 26. Fertilizer amounts (kg ha-1 yr-1) to meet the nutrient requirements of mature oil palms producing 30 t FFB (fresh fruit bunches) ha-1 yr-1.
Nutrient requirementN P K Ca Mg
Urea RP* MOP CaO KieseriteWithout EFB mulch 272 150 502 56 206
With 6 t EFB ha-1 yr-1 233 143 426 50 194
With 40 t EFB ha-1 yr-1 22 105 20 27 124
* RP – rock phosphate, MOP – muriate of potash
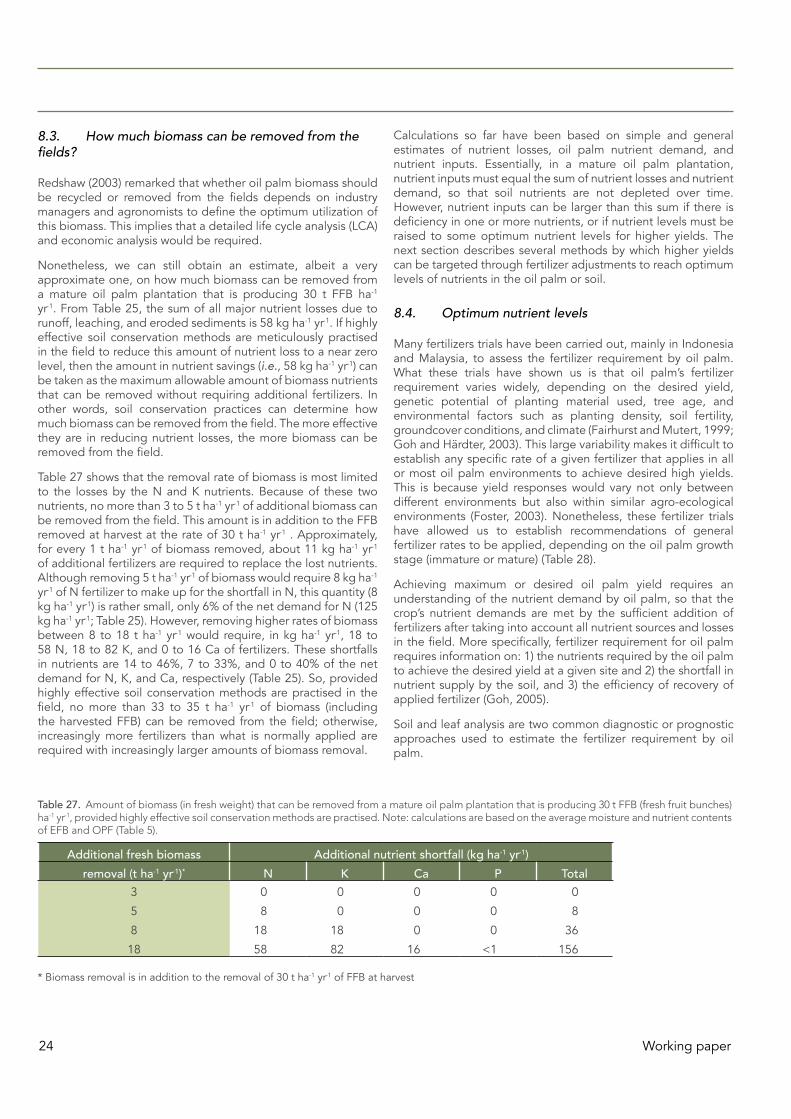
24 Working paper
8.3. How much biomass can be removed from the fields?
Redshaw (2003) remarked that whether oil palm biomass should be recycled or removed from the fields depends on industry managers and agronomists to define the optimum utilization of this biomass. This implies that a detailed life cycle analysis (LCA) and economic analysis would be required.
Nonetheless, we can still obtain an estimate, albeit a very approximate one, on how much biomass can be removed from a mature oil palm plantation that is producing 30 t FFB ha-1 yr-1. From Table 25, the sum of all major nutrient losses due to runoff, leaching, and eroded sediments is 58 kg ha-1 yr-1. If highly effective soil conservation methods are meticulously practised in the field to reduce this amount of nutrient loss to a near zero level, then the amount in nutrient savings (i.e., 58 kg ha-1 yr-1) can be taken as the maximum allowable amount of biomass nutrients that can be removed without requiring additional fertilizers. In other words, soil conservation practices can determine how much biomass can be removed from the field. The more effective they are in reducing nutrient losses, the more biomass can be removed from the field.
Table 27 shows that the removal rate of biomass is most limited to the losses by the N and K nutrients. Because of these two nutrients, no more than 3 to 5 t ha-1 yr-1 of additional biomass can be removed from the field. This amount is in addition to the FFB removed at harvest at the rate of 30 t ha-1 yr-1 . Approximately, for every 1 t ha-1 yr-1 of biomass removed, about 11 kg ha-1 yr-1 of additional fertilizers are required to replace the lost nutrients. Although removing 5 t ha-1 yr-1 of biomass would require 8 kg ha-1 yr-1 of N fertilizer to make up for the shortfall in N, this quantity (8 kg ha-1 yr-1) is rather small, only 6% of the net demand for N (125 kg ha-1 yr-1; Table 25). However, removing higher rates of biomass between 8 to 18 t ha-1 yr-1 would require, in kg ha-1 yr-1, 18 to 58 N, 18 to 82 K, and 0 to 16 Ca of fertilizers. These shortfalls in nutrients are 14 to 46%, 7 to 33%, and 0 to 40% of the net demand for N, K, and Ca, respectively (Table 25). So, provided highly effective soil conservation methods are practised in the field, no more than 33 to 35 t ha-1 yr-1 of biomass (including the harvested FFB) can be removed from the field; otherwise, increasingly more fertilizers than what is normally applied are required with increasingly larger amounts of biomass removal.
Calculations so far have been based on simple and general estimates of nutrient losses, oil palm nutrient demand, and nutrient inputs. Essentially, in a mature oil palm plantation, nutrient inputs must equal the sum of nutrient losses and nutrient demand, so that soil nutrients are not depleted over time. However, nutrient inputs can be larger than this sum if there is deficiency in one or more nutrients, or if nutrient levels must be raised to some optimum nutrient levels for higher yields. The next section describes several methods by which higher yields can be targeted through fertilizer adjustments to reach optimum levels of nutrients in the oil palm or soil.
8.4. Optimum nutrient levels
Many fertilizers trials have been carried out, mainly in Indonesia and Malaysia, to assess the fertilizer requirement by oil palm. What these trials have shown us is that oil palm’s fertilizer requirement varies widely, depending on the desired yield, genetic potential of planting material used, tree age, and environmental factors such as planting density, soil fertility, groundcover conditions, and climate (Fairhurst and Mutert, 1999; Goh and Härdter, 2003). This large variability makes it difficult to establish any specific rate of a given fertilizer that applies in all or most oil palm environments to achieve desired high yields. This is because yield responses would vary not only between different environments but also within similar agro-ecological environments (Foster, 2003). Nonetheless, these fertilizer trials have allowed us to establish recommendations of general fertilizer rates to be applied, depending on the oil palm growth stage (immature or mature) (Table 28).
Achieving maximum or desired oil palm yield requires an understanding of the nutrient demand by oil palm, so that the crop’s nutrient demands are met by the sufficient addition of fertilizers after taking into account all nutrient sources and losses in the field. More specifically, fertilizer requirement for oil palm requires information on: 1) the nutrients required by the oil palm to achieve the desired yield at a given site and 2) the shortfall in nutrient supply by the soil, and 3) the efficiency of recovery of applied fertilizer (Goh, 2005).
Soil and leaf analysis are two common diagnostic or prognostic approaches used to estimate the fertilizer requirement by oil palm.
Table 27. Amount of biomass (in fresh weight) that can be removed from a mature oil palm plantation that is producing 30 t FFB (fresh fruit bunches) ha-1 yr-1, provided highly effective soil conservation methods are practised. Note: calculations are based on the average moisture and nutrient contents of EFB and OPF (Table 5).
Additional fresh biomass Additional nutrient shortfall (kg ha-1 yr-1)removal (t ha-1 yr-1)* N K Ca P Total
3 0 0 0 0 0
5 8 0 0 0 8
8 18 18 0 0 36
18 58 82 16 <1 156
* Biomass removal is in addition to the removal of 30 t ha-1 yr-1 of FFB at harvest

Working paper 25
Soil analysis requires several chemical, physical, and mineralogical properties to be assessed to determine their nutrient supply to oil palm. Assessing nutrient demand via soil analysis is however fraught with difficulties because soil fertility is affected by a myriad of soil factors such as texture, structure, consistency, terrain, moisture content and retention, and mineralogy, as well as by environmental factors.
A soil rich in K, for instance, may not readily supply large amounts of K to the oil palm, in particular if the soil has a silty clay texture and poor soil structure, as discovered by Goh et al. (1994). Tohiruddin et al. (2006) further observed that oil palm responded differently to N fertilization even under similar soils within the same region (Sumatra). They found that oil palm plantations in areas of high rainfall (>3000 mm) did not respond to soil N fertilization, whereas yield responded significantly to N fertilization only in areas of lower rainfall (<1700 mm). They further observed a positive linear relationship between soil total N and annual rainfall but a negative relationship between soil total N and FFB yield response (Fig. 10). They surmised that the effect of soil N levels on oil palm yield is not a direct relationship but one compounded by rainfall amount.
Despite weaknesses in the soil analysis approach, this approach remains useful because it provides a general assessment of soil fertility for oil palm (Table 29).
Fig. 10. Relationship between soil total N, annual rainfall, and oil palm FFB (fresh fruit bunches) yield response (difference from maximum yield) (after Tohiruddin et al., 2006).
The second approach of leaf (foliar) analysis is more reliable than soil analysis because clearer and more stable relationships have been obtained between leaf nutrient levels and oil palm yields than soil nutrient levels and oil palm yields. Moreover, leaf nutrient levels reflect nutrient uptake by the crop, whereas high soil nutrient levels may not always lead to high nutrient uptake for reasons as discussed earlier. However, as warned by Foster (2003), leaf diagnosis is an empirical system, one that is still based on statistical relationships between one or more given leaf nutrients and oil palm yield. The existence and strength
Table 28. Recommended fertilizer application rates (kg ha-1 yr-1) for oil palm in South East Asia (after Comte et al., 2012).
Palm stage N P K Mg B Sources*
Immature 35-105 42-56 42-420 8.4-35 1.4 1
Mature 35-245 56-98 42-420 42-105 2.1-4.9
Immature 45 24 108 28 0.6 2
Mature 120 22 286 24 0.6
Immature 50-120 22-48 54-216 7-24 1.2-3.7 3
Mature 120-200 30-87 183-581 0-36 2.5-5.6
* Sources: 1 - Goh et al. (2003), 2- FAO (2006), 3 – von Uexküll (2007)
Table 29. Classification of soil nutrient status for oil palm.
Properties Very low Low Moderate High Very high
pH <3.5 3.5-4.0 4.0-4.2 4.2-5.5 >5.5
Org. C (%) <0.8 0.8-1.2 1.2-1.5 1.5-2.5 >2.5
Total N (%) <0.08 0.08-0.12 0.12-0.15 0.15-0.25 >0.25
Total P (mg g-1) <150 150-250 250-350 350-500 >500
Available P (mg g-1) <10 10-25 25-40 40-60 >60
Exchangeable K (cmol kg-1) <0.08 0.08-0.20 0.20-0.25 0.25-0.30 >0.30
Exchangeable Mg (cmol kg-1) <0.08 0.08-0.20 0.20-0.25 0.25-0.30 >0.30
CEC (cmol kg-1) <6 6-12 12-15 15-18 >18
Sources: Goh (1997, 2005)

26 Working paper
of their relationships remain susceptible to change from one environment to another.
The relationship between crop yield and leaf nutrient content can be divided into five zones (Fig. 11), although the luxury nutrient uptake (Zone D) is likely not to occur in oil palm (Fairhurst and Mutert, 1999).
Fig. 11. Yield response in relation to deficient, optimum, and toxic leaf nutrient concentrations (after Hartley, 1988).
The critical nutrient level is of great interest because it indicates the minimum level a leaf nutrient should have for maximum yield (Table 30). However, the critical or optimum nutrient level is very often not a single ubiquitous value but a range of values (Table 31), depending on various crop and environmental factors, as listed earlier.
Specifically for K and Mg, the nutrient status can be individually assessed, albeit very approximately, based on the nutrient’s respective proportion of the amount of total leaf cations (TLC) (Table 32). TLC is calculated by
Leaf %K Leaf %Mg Leaf %Ca 100039.1 1 24.3 2 40.1 2
TLC
[2]
where TLC is in unit cmol kg-1, and the leaf nutrient levels (%) are on a dry weight basis. As shown by Fairhurst and Mutert (1999), if leaf K, Mg, and Ca levels are 0.91, 0.23, and 0.56%,
respectively, then TLC, determined by Eq. 2, is 70.16 cmol kg-1. Thus, K and Mg levels are 33 and 27% of TLC, respectively, so that from Table 31, K status is classified as ‘sufficient’ and Mg as ‘low’ (or moderately deficient).
One main disadvantage of the critical nutrient levels as listed in Table 31 is these levels were established ignoring possible nutrient interactions. Foster (2003) remarked that oil palm yield at a particular site can be highly correlated with the level of a single leaf nutrient, but only when all other leaf nutrients are non-limiting. Foster and Chang (1977) reported that on a Ren-gam soil series (an Ultisol) in Malaysia, where P and Mg were non-limiting, oil palm yields could be predicted fairly accurately simply by measuring the leaf nutrient levels for N and K (Fig. 12). This yield map shows that lower yields can be achieved more easily because of the wider possible range of leaf N and K levels, but reaching higher yields would require an increas-ingly specific range of leaf N and K levels. For instance, 30 t ha-1 yr-1 yield is achieved only at a unique combination of leaf N and K levels of about 3.0 and 1.2%, respectively.
Fig. 12. Oil palm yield (t ha-1 yr-1) map for a trial conducted on Rengam soil series (an Ultisol) with non-limiting P and Mg (after Foster and Chang, 1977). Leaf nutrient levels (%) are on a dry weight basis.
Fig. 13 shows the oil palm yield response (difference from maximum yield) due to different levels of leaf N, K, and Mg levels, averaged from about 50 fertilizer trials carried out over a wide range of environments in Malaysia. Foster (1995) reported that yield response becomes more strongly related to leaf nutrient levels if the various yield responses are grouped according to the amount of total leaf cations or TLC (Eq. 2). The nonlinear yield response due to the individual four leaf nutrients in Fig. 13 can be approximated by the following function:
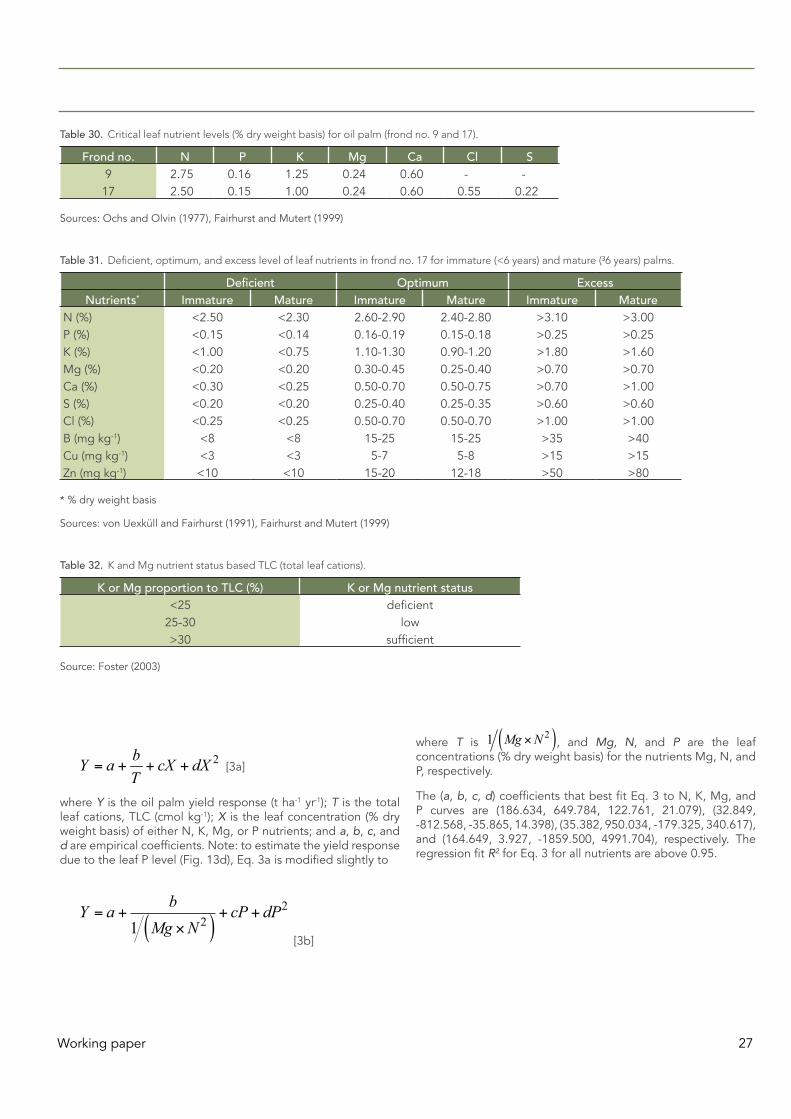
Working paper 27
2bY a cX dXT
= + + + [3a]
where Y is the oil palm yield response (t ha-1 yr-1); T is the total leaf cations, TLC (cmol kg-1); X is the leaf concentration (% dry weight basis) of either N, K, Mg, or P nutrients; and a, b, c, and d are empirical coefficients. Note: to estimate the yield response due to the leaf P level (Fig. 13d), Eq. 3a is modified slightly to
2
21bY a cP dP
Mg N
[3b]
where T is 21 Mg N , and Mg, N, and P are the leaf concentrations (% dry weight basis) for the nutrients Mg, N, and P, respectively.
The (a, b, c, d) coefficients that best fit Eq. 3 to N, K, Mg, and P curves are (186.634, 649.784, 122.761, 21.079), (32.849, -812.568, -35.865, 14.398), (35.382, 950.034, -179.325, 340.617), and (164.649, 3.927, -1859.500, 4991.704), respectively. The regression fit R2 for Eq. 3 for all nutrients are above 0.95.
Table 30. Critical leaf nutrient levels (% dry weight basis) for oil palm (frond no. 9 and 17).
Frond no. N P K Mg Ca Cl S9 2.75 0.16 1.25 0.24 0.60 - -17 2.50 0.15 1.00 0.24 0.60 0.55 0.22
Sources: Ochs and Olvin (1977), Fairhurst and Mutert (1999)
Table 31. Deficient, optimum, and excess level of leaf nutrients in frond no. 17 for immature (<6 years) and mature (³6 years) palms.
Deficient Optimum ExcessNutrients* Immature Mature Immature Mature Immature Mature
N (%) <2.50 <2.30 2.60-2.90 2.40-2.80 >3.10 >3.00P (%) <0.15 <0.14 0.16-0.19 0.15-0.18 >0.25 >0.25K (%) <1.00 <0.75 1.10-1.30 0.90-1.20 >1.80 >1.60Mg (%) <0.20 <0.20 0.30-0.45 0.25-0.40 >0.70 >0.70Ca (%) <0.30 <0.25 0.50-0.70 0.50-0.75 >0.70 >1.00S (%) <0.20 <0.20 0.25-0.40 0.25-0.35 >0.60 >0.60Cl (%) <0.25 <0.25 0.50-0.70 0.50-0.70 >1.00 >1.00B (mg kg-1) <8 <8 15-25 15-25 >35 >40Cu (mg kg-1) <3 <3 5-7 5-8 >15 >15Zn (mg kg-1) <10 <10 15-20 12-18 >50 >80
* % dry weight basis
Sources: von Uexküll and Fairhurst (1991), Fairhurst and Mutert (1999)
Table 32. K and Mg nutrient status based TLC (total leaf cations).
K or Mg proportion to TLC (%) K or Mg nutrient status<25 deficient
25-30 low>30 sufficient
Source: Foster (2003)

28 Working paper
a) b)
c) d)
Fig. 13. Maximum yield response in Malaysia to leaf nutrient levels (% dry weight basis) and TLC (total leaf cations). Yield response to levels in: a) leaf N, b) leaf K, c) leaf Mg, and d) leaf P (after Foster, 1995).
Compared to other major nutrients, yield responses to P fertilizer are more difficult to predict based solely on leaf P levels (Foster, 2003). Yields were found to respond well to leaf P for some soils (which were low in P) but not when soil fertility was high (Foster et al., 1988). For some inland Malaysian soils, leaf N and Mg appeared to influence the yield response to leaf P (Foster, 1995; Fig. 13d), but for some volcanic soils in North Sumatra, it was instead leaf N and Ca that appeared more influential (Foster and Prawobo, 1996). Consequently, Foster (2003) recommended that the optimum leaf P levels be instead determined from the optimum leaf N levels. The optimum levels for both these nutrients are linearly related with each other and their relationship remarkably similar for both Malaysian and Indonesian (Sumatra)
conditions (Fig. 14). Their linear relationship can alternatively be depicted by the linear equation given by Tampubolon et al. (1990) as
0.0487 0.039P N= + [4]
where P and N are the leaf P and N levels (% dry weight basis), respectively.

Working paper 29
Fig. 14. Relationship between optimum leaf N and P concentrations for trials conducted in Malaysia and Sumatra, Indonesia (after Foster, 2003). Leaf nutrient levels (%) are on a dry weight basis.
Foster (2003) recommended that the minimum and maximum optimum leaf nutrient levels be determined for yield responses of 2.0 and 0.5 t ha-1 yr-1, respectively. Targeting yield responses below 0.5 t ha-1 yr-1 would unlikely be worthwhile as it could require uneconomical amounts of additional fertilizer inputs for little gains in yield. On the other hand, a yield response of at least 2.0 t ha-1 yr-1 should be targeted because Foster (2003) reported that the regression of yield responses on leaf nutrient levels and TLC (Fig. 13a-c) had residual errors between 1.8 to 2.6 t ha-1 yr-1. Thus, Foster (2003) deemed that the benefits of applying additional fertilizer inputs can be observed (become significant) only when they can produce a yield response of 2.0 t ha-1 yr-1 or more.
Based on the estimated yield responses, nutrient deficiencies can then be classified according to Table 33 and the fertilizer rates adjusted accordingly. Foster (2003) cautioned that two or more nutrients may be deficient, and nutrient deficiency must be corrected in a stepwise manner, starting with the most to least deficient nutrient. Readers are referred to Foster (1995) and Goh (2005) on how fertilizers are adjusted based on nutrient deficiencies.
It is important to realize that optimum leaf nutrient levels do not remain constant but will vary according to environment and tree age (Foster and Chang, 1977; Foster, 2003). Data averaged over a large number of commercial oil palm fields in North Sumatra indicated a marked decrease in the levels of all major nutrients with palm age (BLRS, 1991). And as leaf nutrient levels decline with tree age, TLC would likewise decline (see Eq. 2) which in turn lowers the optimum leaf nutrient levels (see Fig. 13). Trials in Sumatra showed that between palm ages of 5 and 21 years, TLC declined from about 90 to 70 cmol kg-1, whereas a trial in Malaysia showed a larger decline in TLC from 85 to 45 cmol kg-1 between palm ages of 3 to 21 years (Foster, 2003). Use of TLC in determining optimum leaf nutrient levels is thus convenient because TLC indirectly accounts for site and tree age variations, so that optimum leaf levels can be determined solely based from leaf data without requiring additional measurements on the environmental conditions or information about the tree age.
The yield responses to leaf nutrient levels as shown in Fig. 13 are based on a large number of fertilizer trials carried out in various regions in Malaysia. Unfortunately, much less extensive data from fertilizer trials are available for Indonesian conditions. Foster and Prawobo (2006) and Tohiruddin et al. (2006) reported yield responses to several leaf nutrient levels from six trials (carried out for at least six years) in North and South Sumatra (Fig. 15).
Probably due to insufficient data, TLC curves could be drawn only for the yield response to leaf N levels (Fig. 15a) but not to other nutrients (Fig. 15b-d). Overall, the optimum leaf nutrient levels for Sumatra are higher than for Malaysia. However, if we target a yield response of between 0.5 and 2 t ha-1 yr-1, as recommended by Foster (2003), then Sumatra’s optimum leaf nutrient levels are either within or slightly above Malaysia’s optimum range (compare the curves in Fig. 13 with Fig. 15). Foster and Prabowo (2006) further discovered that the oil palm yield responses were more closely related with the nutrient levels in the rachis than in the leaf. Notice in Fig. 16 that, for the same nutrient, the regression fit R2 for the rachis nutrient curve is always higher than that for the leaf nutrient curve. Based on the drawn yield response curves, Foster and Prabowo (2006) recommended that if a yield response of 1 t ha-1 yr-1 is assumed as the minimal economic level, then the optimum rachis nutrient levels for N, P, K, and Mg should be 0.55, 0.09, 1.40, and 0.07%, respectively.
Another nutrient balance approach is the Diagnosis and Recommendation Integrated System (DRIS) (Beaufils, 1973).
Table 33. Classification of nutrient deficiency, yield responses, and appropriate fertilizer adjustments for urea, triple superphosphate (TSP), muriate of potash (MOP), and kieserite to normal application rates applied (after Foster, 2003).
Nutrient deficiency rating Potential yield response (t ha-1 yr-1)
Fertilizer adjustment* (kg palm-1 yr-1)
Excessive 0 -0.5 to -1Satisfactory 0 to 1 0Low 1 to 2 0 to 1Deficient 2 to 3 0 to 2Very deficient >3 0 to 3
* to normal application rates applied

30 Working paper
DRIS is a set of calculations and comparisons which involves the computation of all possible ratios between major leaf nutrients and comparisons of these ratios with the “optimum” values of the same ratios in a high-yielding or otherwise desirable crop population. The idea is to identify and rank nutrients from most deficient to most excessive. Ultimately, DRIS computes an overall index called Nutrient Balance Index (NBI) which indicates the overall nutrient balance, where the smaller the absolute NBI value, the lesser is the imbalance among nutrients.
DRIS has been successfully applied for a many crops such as sugarcane, potato, apple, mango, rice, corn, and tomatoes (Bangroo et al., 2010). However, DRIS has not been widely utilized for oil palm. Foster (2003) remarked that although the correlations between DRIS indices with oil palm yield responses
were stronger than those between individual leaf nutrient levels with yield responses, the DRIS indices were found to be more sensitive than individual leaf nutrient levels to changes in the environment. Furthermore, multiple regressions involving leaf nutrient levels and TLC (e.g., Fig. 13) produced stronger relationships with yield response than if the multiple regressions included only the DRIS indices.
Nonetheless, Ginting (2013) utilized DRIS to determine the nutrient balance for oil palm in Indonesia. Ginting (2013) obtained the leaf and soil nutrient data from various oil palm plantations in Sumatra (North, South, and West), Jambi, Riau, Lampung, Java, and Kalimantan (East, West, and South) provinces. The palm ages sampled were between 4 to 15 years old and the planting densities were between 126 to 145 palms ha-1.
a) b)
c) d)
Fig. 15. Maximum yield response in Sumatra to leaf nutrient levels (% dry weight basis) for: a) N, b) P, c) K, and d) Mg (after Tohiruddin et al., 2006). Note: TLC is the total leaf cations, and the yield response to leaf N levels can be described by Eq. 3a.
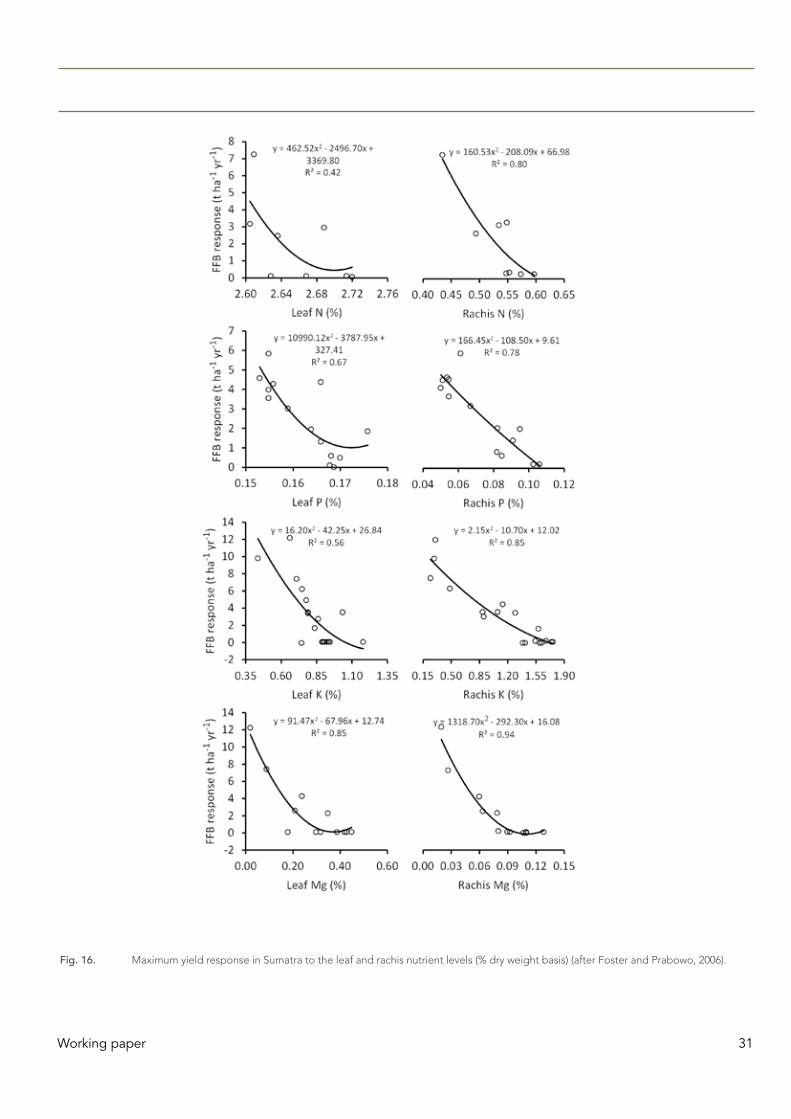
Working paper 31
Fig. 16. Maximum yield response in Sumatra to the leaf and rachis nutrient levels (% dry weight basis) (after Foster and Prabowo, 2006).

32 Working paper
Following DRIS methodology, Ginting (2013) found that high-yielding oil palm areas in Indonesia are those with FFB yields greater than 25.96 t ha-1 yr-1. Table 34 lists the averages (or norms, in DRIS terminology) and ranges of important leaf nutrient concentration ratios in high-yielding oil palm areas in Indonesia. Based on calculated DRIS indices, Ginting (2013) further reported that Indonesian oil palm plantations in general were most deficient in K and most excessive in Mg. The ranking of nutrients from most deficient to most excessive for Indonesian oil palm plantations were: K, P, N, Ca, and Mg. At the yield threshold of 25.96 t ha-1 yr-1, the calculated NBI was 81. Recall that NBI reflects the overall nutrient balance, where the lower the NBI, the lower the nutrient imbalance. At the lowest NBI value of zero (i.e., perfect nutrient balance), the theoretical FFB yield, as determined by Ginting (2103), would be at least 36 t ha-1 yr-1. This theoretical maximum yield is only slightly higher than that estimated by Tandiono et al. (2010), who calculated that with additional fertilizer inputs, oil palm yields in North and South Sumatra could reach a maximum of 34.0 and 32.7 t ha-1 yr-1, respectively.
Lastly, Ginting (2013) reported that soil nutrient ratios involving only K, Ca, and Mg could be used to distinguish high- from low-yielding oil palm areas (Table 35).
Achieving high oil palm yields requires precise information about the nutrient demand by oil palm and matching that demand to the sufficient and timely addition of nutrients after accounting for all important nutrient sources and losses in the environment. Works as discussed in this section have removed a great deal of uncertainties about fertilizer recommendations for oil palm, but, as remarked by Goh and Härdter (2003), some subjectivity through use of heuristics rules are still necessary in some cases. The current challenge is to update our information about nutrient
uptake by newer planting materials and the partitioning of the nutrients among the oil palm tree components.
9. Conclusion
Oil palm biomass such as OPF, LFT, RAC, EFB,ECO, and OPT contain large amounts of nutrients, and field decomposition studies have shown that this biomass can fully decompose in the field within one to two years (two to three years for the trunk), during which the nutrients in this biomass would be gradually released into the soil. Consequently, application of this biomass as soil mulch has often been shown to improve several soil physico-chemical properties and in some cases, increase oil palm yields.
Recent interests to reuse this oil palm biomass for fuel, fiber, timber, animal feed, chemicals, and bio-based products could result in considerable amounts of nutrient losses from the oil palm fields. Complete FFB removal at harvest, for instance, would result in 260 kg ha-1 yr-1 loss of nutrients (Table 20). This amount of loss is equivalent to one third of the oil palm’s annual nutrient demand (Table 17). Even returning all the FFB back to the fields as EFB would replenish only 27% of these losses. Furthermore, if all the pruned oil palm fronds and trunks were removed from the fields, the nutrient losses would be exacerbated. Between 35 to 40 t ha-1 of fronds are produced annually, and at the time of replanting, trunk dry weights could reach as high as 37 to 75.5 t ha-1 (Chan et al., 1980; Kee, 2004; see also Table 4). The complete removal of both these biomass types would result in a further nutrient loss of nearly 740 kg ha-1 yr-1.
At the end, these nutrient losses must be replenished with the addition of more fertilizers; otherwise, soil nutrient pools will eventually be depleted in the long run. The requirement of more fertilizers counters sustainable agricultural practices, as more external resources and energy use are required. At present, fertilizer costs already make up 50 to 70% of Indonesia’s oil palm field operational cost, and one third of all Indonesia’s fertilizers are consumed by a single crop alone: the oil palm.
Whether oil palm biomass should be recycled or removed from the fields depends on industry managers and agronomists to define the optimum utilization of oil palm biomass. Finding
Table 34. Leaf nutrient concentration ratios in high-yielding oil palm areas (>25.96 t ha-1 yr-1) in Indonesia (after Ginting, 2013).
Leaf nutrient ratio Average (norm) RangeN/P 15.92 14.87-16.98N/K 2.53 2.31-2.76
N/Ca 3.87 3.52-4.21N/Mg 10.12 8.97-11.28K/P 6.35 5.86-6.84
Ca/P 4.17 3.81-4.53Mg/P 1.62 1.42-1.81K/Ca 1.55 1.36-1.75K/Mg 4.05 3.52-4.57
Ca/Mg 2.65 2.31-2.99
Table 35. Soil nutrient concentration ratios in high-yielding oil palm areas (>25.96 t ha-1 yr-1) in Indonesia (after Ginting, 2013).
Soil nutrient ratio RangeCa/K 5.6-10.1
Ca/Mg 2.1-3.8Mg/K 2.1-4.5
Working paper 33
this optimum level will be highly site specific partly because oil palm’s nutrient balance for achieving high FFB yields (section 7.4) can vary considerably between different environments, palm age, and planting materials used. How much biomass can be removed from a site partly depends on if the nutrient demand for high palm oil yields can be met by the nutrient sources in the field, after accounting for nutrient losses.
Very approximately, in a high-yielding mature oil palm plantation that is producing an FFB yield of 30 t ha-1 yr-1, no more than 3 to 5 t ha-1 yr-1 of additional biomass can be removed from the field. This amount is in addition to the FFB removed at harvest. Consequently, a total of no more than 33 to 35 t ha-1 yr-1 can be removed from the field, provided highly effective soil conservation methods are practiced to greatly reduce the amount of nutrient losses by erosion and leaching in the field. Removing any more biomass than this threshold would lead to considerable amount of additional fertilizers needed to replace the nutrient shortages.
Lastly, converting EFB into biochar is one promising option to sequester C. Studies have shown that, at least for Malaysia, production of EFB biochar can be carbon-negative, and that EFB biochar is an overall effective soil amendment, especially in mitigating soil toxicity and soil acidity problems.
10. References
Abdulrazzaq H., Hamdan J., Husni A., Rosenani A.B. (2015) Biochar from empty fruit bunches, wood, and rice husks: effects on soil physical properties and growth of sweet corn on acidic soil. Journal of Agricultural Science, 7, 192.200.
Abner J.S., Foster H.L. (2006) Optimal use of compost in the oil palm nursery. In Proceedings of Agriculture Conference, International Oil Palm Conference (IOPC), pp. 112. Nusa Dua, Bali. Indonesia: Indonesian Oil Palm Research Institute.
Abu Bakar R., Darus S.Z., Kulaseharan S., Jamaluddin N. (2011) Effects of ten year application of empty fruit bunches in an oil palm plantation on soil chemical properties. Nutrient Cycling in Agroecosystems, 89, 341–349.
Allen R.G., Pereira L.S., Raes D., Smith M. (1998) Crop Evapo-transpiration: Guidelines for Computing Crop Water Requirements. Irrigation and Drainage Paper No. 56. Rome, Italy: FAO.
Arifin S., Susila W.R., Luntungan H., Goenadi D.H. (1998) Production and development of oil palm and coconut planta-tions in major producing countries. In World Conference on Palm and Coconut Oils for the 21st Century; Sources, Processing, Applications, and Competition, pp. 16-23. Eds E. Charles Leonard, E.G. Perkins and A. Cahn. Champaign, Ill.: AOCS Press.
ASEAN Secretariat (2003) Guidelines for the Implementation of the ASEAN Policy of Zero Burning. Jarkata, Indonesia: The ASEAN Secretariat.
Astimar A.A. (2014) Green technology on oil palm biomass. Asia Palm Oil Magazine, 4, 56-59.
Banabas M., Turner M. A., Scotter D.R., Nelson P.N. (2008) Losses of nitrogen fertiliser under oil palm in Papua New Guinea: 1. Water balance, and nitrogen in soil solution and runoff. Australian Journal of Soil Research, 46, 332–339.
Bangroo S.A., Bhat M.I., Tahir A., Aziz M.A., Bhat M.A., Mushtaq A.W. (2010) Diagnosis and recommendation integrated aystem (DRIS) - a review. International Journal of Current Research, 10, 84-97.
Barekzai A., Mengel K. (1993) Effect of microbial decomposition of mature leaves on soil pH. Zeitschrift für Pflanzenernährung und Bodenkunde, 156, 93–94.
Beaufils E.R. (1973) Diagnosis and Recommendation Integrated System (DRIS). A General Scheme for Experimentation and Calibration based on Principles Developed from Research in Plant Nutrition. Soil Science Buletin No. 1. Pietermaritzburg: Univ. of Natal, Dep. of Soil Science and Agrometeorology.
BLRS (1991) Annual Report 1991. Bah Lias Research Station. Indonesia: PTPP London Sumatra.
BLRS. (1998) Annual Report 1998. Bah Lias Research Station. Indonesia: PTPP London Sumatra.
Brady N.C.,Weil R.R. (2002) The Nature and Properties of Soils. 13th edn. Upper Saddle River, NJ, USA: Pearson-Prentice Hall.
Bruijnzeel L.A. (1989) Nutrient content of bulk precipitation in south-central Java, Indonesia. Journal of Tropical Ecology, 5, 187-202.
Bruun E.W., Hauggaard-Nielsen H., Ibrahim N., Egsgaard H., Ambus P., Jensen P.A., Dam-Johansen K. (2011) Influence of fast pyrolysis temperature on biochar labile fraction and short-term carbon loss in a loamy soil. Biomass & Bioenergy, 35, 1182-1189.
Budianta D., Wiralaga A.Y.A, Lestari W. (2010) Changes in some soil chemical properties of Ultisol applied by mulch from empty fruit bunches in an oil palm plantation. Jurnal Tanah Tropika, 15, 111–118.
Caliman J.P., Budi M., Saletes S. (2001) Dynamic of nutrient release from empty fruit bunches in field conditions and soil characteristics changes. In Proceedings of the 2001 PIPOC International Palm Oim Congress, pp. 550–556. Bangi, Malaysia: Malaysian Palm Oil Board.
Chan K.W., Watson I., Lim K.C. (1980) Use of oil palm waste material for increased production. In Proceedings of the Conference on Soil Science and Agricultural Development in Malaysia, Kuala Lumpur, 10–12 Apr. 1980, pp. 213–242. Eds E. Pushparajah and S.L. Chin. Kuala Lumpur, Malaysia: Incorporated Society of Planters.

34 Working paper
Chang K.C., Zakaria A. (1986) Leaching losses of N and K fertil-isers from mature fields of perennial crop in Malaysia — a review of local work. The Planter, 62, 468–487.
Chong S.Y. (2012) Development of Simple Equations to Estimate Net Rainfall Under Closed Canopies. M.Sc. Dissertation. Serdang, Malaysia: Uni. Putra Malaysia.
Claoston N., Samsuri A.W., Husni M.H.A., Mohd Amran M.S. (2014) Effects of pyrolysis temperature on the physicochem-ical properties of empty fruit bunch and rice husk biochar. Waste Management & Research, 32, 331–339.
Comte I., Colin F., Grünberger O., Follain S., Whalen J., Caliman J.P. (2013) Landscape-scale assessment of soil response to long-term organic and mineral fertilizer application in an industrial oil palm plantation, Indonesia. Agriculture, Ecosystems and Environment, 169, 58-68.
Comte I., Colin F., Whalen J., Grünberger O., Caliman J.P. (2012) Agricultural practices in oil palm plantations and their impact on hydrological changes, nutrient fluxes and water quality in Indonesia: a review. Advances in Agronomy, 116, 71-124.
Conrad L., Prasetyaning I. (2014) Overview of the Waste-to-Energy Potential for Grid-connected Electricity Generation (Solid Biomass and Biogas) in Indonesia. Jakarta, Indonesia: Directorate General for New and Renewable Energy and Energy Conservation (DG NREEEC), Ministry of Energy and Mineral Resources.
Corley R.H.V. (2009) How much palm oil do we need? Environ-mental Science & Policy, 12, 134-139.
Corley R.H.V., Gray B.S., Ng S.K. (1971) Productivity of the oil palm (Elaeis guineensis Jacq.) in Malaysia. Experimental Agriculture, 7, 129-136.
Corley R.H.V., Tinker P.B. (2007) The Oil Palm. Oxford, UK: Blackwell Science.
Craswell E.T., Lefroy R.D.B. (2001) The role and function of organic matter in tropical soils. Nutrient Cycling in Agroecosystems, 61, 7-18.
Devereux R.C., Sturrock C.J., Mooney S.J. (2012) The effects of biochar on soil physical properties and winter wheat growth. Earth and Environmental Science Transactions of the Royal Society of Edinburgh, 103, 13-18.
Directorate General of Estate Crops. (2014) Tree Crop Estate Statistics of Indonesia 2013-2015. Jakarta, Indonesia: Ministry of Agriculture.
Dolmat M.T., Lim K.H., Zakaria Z.Z., Hassan A.H. (1987) Recent studies on the effects of land application of palm oil mill effluent on oil palm and the environment. In Proceedings of the International Oil Palm/Palm Oil Conferences, pp. 596–604. Eds H.A.H. Halim, P.S. Chew, B.J. Wood and E. Pushparajah. Kuala Lumpur, Malaysia: Palm Oil Research Institute of Malaysia and Incorporated Society of Planters.
Donough C.R., Witt C., Fairhurst T.H. (2009) Yield intensification in oil palm plantations through best management practice. Better Crops, 93, 12–14.
Dufrêne E. (1989) Photosynthèse, consommation en eau et modélisation de la production chez le palmier à huile (Elaeis guineensis Jacq). PhD Dissertation. Orsay, Paris: Universite´ de Paris XI.
Edwards P.J. (1982) Studies of mineral cycling in a montane rainforest in New Guinea V. Rate of cycling in throughfall and litterfall. Journal of Ecology, 70, 807-827.
Fairhurst T.H., Mutert E. (1999) Interpretation and management of oil palm leaf analysis data. Better Crops, 13, 48-51.
FAO (2006) Fertilizer Use by Crop in Indonesia. Rome, Italy: FAO, Natural Resources Management and Environment.
Fauzianto R. (2014) Implementation of bioenergy from palm oil waste in Indonesia. Journal of Sustainable Development Studies, 5, 100-115.
Foong S.F., Syed Sofi S.O., Tan P.Y. (1983) A lysimetric simulation of leaching losses from an oil palm field. In Proceedings of the Seminar on Fertilizers in Malaysian Agriculture, pp. 45–68. Eds C.P. Soon, K.B. Lian, W.S.W. Harun and Z.Z. Zakaria. Kuala Lumpur, Malaysia: Malaysian Society of Soil Science.
Foong S.F. (1993) Potential evaporation, potential yields and leaching losses of oil palm. In Proceeding of the 1991 PORIM International Palm Oil Conference , pp. 105–119. Eds Y. Basiron, S. Jalani, K.C. Chang, S.C. Cheah, I.E. Henson, N. Kamarudin, K. Paranjothy, N. Rajanaidu and D. Mohd. Tayeb. Kuala Lumpur, Malaysia: Agriculture Palm Oil Research Institute.
Foong S.F. (1999) Impact of moisture on potential evapotranspi-ration, growth and yield of oil palm. In Proceedings of the International Oil Palm Congress – Emerging Technologies and Opportunities in the Next Millennium, pp. 64-86. Bangi, Malaysia: Palm Oil Research Institute of Malaysia.
Foster H.L. (1995) Experience with fertilizer recommendation systems for oil palm. In Proceedings of the 1993 PORIM International Palm Oil Congress—Agriculture, pp. 313–328. Eds B.S. Jalani, D. Ariffin, N. Rajanaidu, D. Mohd Tayeb, K. Paranjothy, W. Mohd Basri, I.E. Henson and K.C. Chang. Kuala Lumpur, Malaysia: Palm Oil Research Institute of Malaysia.
Foster H.L. (2003) Assessment of oil palm fertilizer requirements. In Oil Palm: Management for Large and Sustainable Yields, pp. 231–278. Eds T. Fairhurst and R. Härdter. Singapore: Potash & Phosphate Institute/Potash & Phosphate Institute of Canada and International Potash Institute.
Foster H.L., Chang K.C. (1977) The diagnosis of the nutrient status of oil palms in West Malaysia. In International Development in Oil Palms, pp. 290-312. Eds D.A. Earp and W. Newal. Kuala Lumpur, Malaysia: Incorporated Society of Planters.

Working paper 35
Foster H.L., Hj. Dolmat M.T., Singh G. (1988) The effect of fertil-izers on oil palm bunch components in Peninsular Malaysia. In International Oil Palm/Palm Oil Conferences: Progress and Prospects. Conference I: Agriculture, 23-26 June 1987, pp. 294-304. Eds H.A.H. Hj. Hassan, P.S. Chew, B.J. Wood and E. Pushparajah. Kuala Lumpur, Malaysia: Palm Oil Research Institute of Malaysia and Incorporated Society of Planters.
Foster H.L., Prabowo N.E. (1996) Yield response of oil palm to P fertilizers on different soils in north Sumatra. In Interna-tional Conference on Sustainability of Oil Palm Plantations: Agronomic and Environmental Perspectives. Kuala Lumpur, Malaysia: International Society of Oil Palm Agronomists and Palm Oil Research Institute of Malaysia.
Foster H.L., Prabowo N.E. (2006) Partition and transfer of nutrients in the reserve tissues and leaves of oil palm. In Workshop on Nutrient Needs in Oil Palm. A Dialogue Among Expert, October 17-18, 2006, pp. 1-17. Singapore: Potash & Phosphate Institute of Canada and International Potash Institute.
Freeman G.G. (1967) Studies on potassium nutrition of plants. I. Effects of potassium concentration on growth and mineral composition of vegetable seedlings in sand culture. Journal of the Science of Food and Agriculture, 18, 171–176.
Gajic A., Koch H. J. (2012) Sugar beet (L.) growth reduction caused by hydrochar is related to nitrogen supply. Journal of Environmental Quality, 41, 1067-1075.
Germer J., Sauerborn J. (2007) Estimation of the impact of oil palm plantation establishment on greenhouse gas balance. Environment, Development and Sustainability, 10, 697-716.
Ginting E.N. (2013) Model of Nutrients Balance Related to Oil Palm (Elaeis guineensis Jacq.) Productivity. M.Sc. Disserta-tion. Bogor, Indonesia: Bogor Agricultural University.
Goh K.J. (1997) Interpretations of analytical data from soil survey reports for manuring recommendations: some pointers. In Annual Journal/Report 1997, pp. 25-30. Johor, Malaysia: Royal Johore Planters’ Association.
Goh K.J. (2005) Fertilizer recommendation systems for oil palm: estimating the fertilizer rates. In Proceedings of MOSTA Best Practices Workshops: Agronomy and Crop Management, March to August 2004, pp. 235-268. Eds C.P. Soon and T.Y. Pau. Petaling Jaya, Malaysia: Malaysian Oil Scientists’ and Technologists’ Association.
Goh K.J., Chew P.S., Teoh K.C. (1994) K Nutrition for Mature Oil Palms in Malaysia. IPI Research Topics 17. Basel, Switzerland: International Potash Institute.
Goh K.J., Härdter R. (2003) General oil palm nutrition. In Oil Palm: Management for Large and Sustainable Yields, pp. 191–230. Eds T. Fairhurst and R. Härdter. Singapore: Potash & Phosphate Institute of Canada and International Potash Institute.
Goh K.J., Härdter R., Fairhurst T. (2003) Fertilizing for maximum return. In Oil Palm: Management for Large and Sustain-able Yields, pp. 279-306. Eds T. Fairhurst and R. Härdter. Singapore: Potash & Phosphate Institute of Canada and International Potash Institute.
Goh K.J., Teo C.B. (2011) Agronomic principles and practices of fertilizer management of oil palm. In Agronomic Principles & Practices of Oil Palm Cultivation, pp. 241–338. Eds K.J. Goh, S.B. Chiu and S. Paramananthan. Petaling Jaya, Malaysia: Agricultural Crop Trust.
Haefele S.M., Konboon Y., Wongboon W., Amarante S., Maarifat A.A., Pfeiffer E.M., Knoblauch, C. (2011) Effects and fate of biochar from rice residues in rice-based systems. Field Crops Research, 121, 430-440.
Hambali E., Thahar A., Komarudin A. (2010) The potential of oil palm and rice biomass as bioenergy feedstock. In 7th Biomass Asia Workshop, 29 November and 1 December 2010. Jakarta, Indonesia: Economic Research Institute for ASEAN and East Asia.
Hamdan A.B., Ahmad Tarmizi, M., Mohd Tayeb D. (1998) Empty fruit bunch mulching and nitrogen fertilizer amendment: The resultant effect on oil palm performance and soil properties. PORIM Bulletin, 37, 1–14.
Hansen S.B., Olsen S.I., Ujang Z. (2012) Greenhouse gas reductions through enhanced use of residues in the life cycle of Malaysian palm oil derived biodiesel, Bioresource Technology, 104, 358-366.
Hartley C.W.S. (1988) The Oil Palm. 3rd edn. Tropical Agriculture Series. Harlow, Essex, UK: Longman Scientific & Technical.
Heffer P., Prud’homme M. (2013) Fertilizer Outlook 2013-2017. Paris, France: International Fertilizer Industry Association.
Hsiao-Hang T., Snaddon J.L., Slade E.M., Wahyu R., Caliman J.P., Willis K.J. (2015) Effects of empty fruit bunch (EFB) applica-tion on soil fauna feeding activity in oil palm plantations. In Sustainable Management of Soil in Oil Palm Plantings. Proceedings of a Workshop Held in Medan, Indonesia, 7–8 November 2013. ACIAR Proceedings No. 144, pp. 35-39. Eds M.J. Webb, P.N. Nelson, C. Bessou, J.P. Caliman, and E.S. Sutarta. Canberra, Australia: Australian Centre for Inter-national Agricultural Research.
Jaiswal A.K., Elad Y., Graber E.R., Frenkel O. (2014) Rhizoctonia solani suppression and plant growth promotion in cucumber as affected by biochar pyrolysis temperature, feedstock and concentration. Soil Biology & Biochemistry, 69, 110-118.
Johnston J. (2011) Soil organic matter changes towards an equilibrium level appropriate to the soil and cropping system. Better Crops, 95, 7-8.
Junaidah S. (2009) Effects of Soil Conservation Methods on Hydraulic Conductivity of Soils in an Oil Palm Estate. B. Agric. Sc. Final Year Project Report. Serdang, Malaysia: Universiti Putra Malaysia.

36 Working paper
Katyal J.C., Rao N.H., Reddy M.N. (2001) Critical aspects of organic matter management in the Tropics: the example of India. Nutrient Cycling in Agroecosystems, 61, 77-88.
Kee K.K. (2004) Nutrient reserves and recycling from oil palm (Elaeis guineensis Jacq.) trunks at replanting. In Proceed-ings for the 4th International Crop Science Congress, 26 September – 1 October 2004. Eds T. Fischer, N. Turner, J. Angus, L. McIntyre, M. Robertson, A. Borrell and D. Lloyd. Brisbane, Australia: The Regional Institute Ltd.
Kee K.K., Chew P.S. (1996) Nutrient losses through surface runoff and soil erosion—Implications for improved fertilizer efficiency in mature oil palms. In Proceedings of the PORIM Internation Palm Oil Congress, pp. 153–169. Eds A. Ariffin, M.B. Wahid, N. Rajanaidu, D. Mohd Tayeb, K. Paranjothy, S.C. Cheah, K.C. Chang and S. Ravigadevi. Kuala Lumpur, Malaysia: PORIM (Palm Oil Research Institute of Malaysia).
Kee K.K., Goh K.J., Chew P.S. (2000) Water cycling and balance in a mature oil palm agroecosystem in Malaysia. In Proceed-ings of the International Planters Conference, pp. 153–169. Ed E. Pushparajah. Kuala Lumpur, Malaysia: The Incorpo-rated Society of Planters.
Khalid H., Tarmizi A. (2008) Techniques of soil and water conserva-tion and nutrient recycling in oil palm plantations on inland soils. Oil Palm Bulletin, 56, 1–11.
Khalid H., Zin Z.Z., Anderson J.M. (2000) Decomposition processes and nutrient release patterns of oil palm residues. Journal of Oil Palm Research, 12, 46–63.
Kheong L.V., Rahman Z.A., Musa M.H., Hussein A. (2010) Empty fruit bunch application and oil palm root proliferation. Journal of Oil Palm Research, 22, 750–757.
Kloss S., Zehetner F., Wimmer B., Buecker J., Rempt F., Soja G. (2014) Biochar application to temperate soils: effects on soil fertility and crop growth under greenhouse conditions. Journal of Plant Nutrition and Soil Science, 177, 3-15.
Lal R. (2004) Soil carbon sequestration impacts on global climate change and food security. Science, 304, 1623-1627.
Lal R. (2011) Sequestering carbon in soils of agro-ecosystems. Food Policy, 36 (Supplement 1), S33-S39.
Lamade E., Setiyo I.E. (1996) Test of Dufrêne’s production model on two contrasting families of oil palm in North Sumatra. In Proceedings of the 1996 PORIM International Palm Oil Congress: Competitiveness for the 21st century, pp. 427–435. Ed D. Ariffin. Kuala Lumpur, Malaysia: Palm Oil Research Institute of Malaysia.
Lazaroff N., Pitman M.G. (1966) Calcium and magnesium uptake by barley seedlings. Australian Journal of Biological Sciences, 19, 991–1005.
Lee Y.P., Goh K.J., Teh C.B.S. (2013) Effects of various acidity levels on the growth of oil palm seedlings and their nutrients uptake. In Advances in Tropical Soil Science, vol. 2, pp.
55-69. Eds J. Hamdan and J. Shamsudin. Serdang, Malaysia: Uni. Putra Malaysia Press.
Lee Y.P., Teh C.B.S., Goh K.J., Moraidi A. (2012) Effects of four soil conservation methods on soil aggregate stability. Malaysian Journal of Soil Science, 16, 43-56.
Li Z.A., Zou B., Xia H.P., Ding Y., Tan W., Fu S.L. (2008) Role of low-molecule-weight organic acids and their salts in regulating soil pH. Pedosphere, 18, 137–148.
Lim K.C., Zaharah A.R. (2002) The effects of oil palm empty fruit bunches on oil palm nutrition and yield, and soil chemical properties. Journal of Oil Palm Research, 14, 1–9.
Liu P., Ma L., Hao Y. (2005) Effect of Ecomat on soil temperature and water content and weed of afforestation in river-beach. Science of Soil and Water Conservation, 3, 77-81.
Lord S., Hoare M.K., Thompson N.M. (2002) Composting for zero discharge – NBPOL’s solution. In Proceedings Chemistry & Technology Conference 2002, pp. 244-252. Nusa Dua, Bali, Indonesia: Indonesian Oil Palm Research Institute.
Maena L.M., Thong K.C., Ong T.S., Mokhtaruddin A.M. (1979) Surface wash under mature oil palm. In Proceedings of the Symposium on Water Agriculture in Malaysia, pp. 203–216. Ed E. Pushparajah. Kuala Lumpur, Malaysia: Malaysian Society of Soil Science.
Mahajoeno E., Bibiana W.L., Surjono H.S. (2008) Potential liquid waste palm oil factory for biogas production. Biodiversity 2008, 9, 48-52.
Mahmood W.M.F.W., Ariffin M.A., Harun Z., Md. Ishak N.A.I., Ghani J.A., Ab. Rahman M.N. (2015) Characterisation and potential use of biochar from gasified oil palm wastes. Journal of Engineering Science and Technology, Special Issue 6, 45-54.
Major J., Rondon M., Molina D., Riha S.J., Lehmann J. (2010) Maize yield and nutrition during 4 years after biochar appli-cation to a Colombian savanna Oxisol. Plant and Soil, 333, 117-128.
Manokaran N. (1980) The nutrient contents of precipitation, throughfall and stemflow in a lowland tropical rain forest in Peninsular Malaysia. Malaysian Forester, 43, 266-289
Masto R.E., Ansari M.A., George J., Selvi V.A., Ram, L.C. (2013) Co-application of biochar and lignite fly ash on soil nutrients and biological parameters at different crop growth stages of Zea mays. Ecological Engineering, 58, 314-322.
Melillo J.M., Aber J.D., Linkin A.E., Ricca A., Fry B., Nadelhoffer K.J. (1989) Carbon and nitrogen dynamics along the decay continuum: plant litter to soil organic matter. Plant and Soil, 115, 189–198.
Mohd. Tayeb D., Lim K.H., Zin Z.Z., Abd. Halim H. (1988) Recent studies on the effects of land application of palm oil mill effluent on oil palm and the environment. In 1987 Interna-tional Oil Palm/Palm Oil Conferences. Progress Prospects,

Working paper 37
June 23-26 1987, pp. 596-604. Eds . Kuala Lumpur, Malaysia: Palm Oil Research Institute of Malaysia.
Mokolobate M.S., Haynes R.J. (2002) Comparative liming effect of four organic residues applied to an acid soil. Biology and Fertility of Soils, 35, 79–85.
Moore T.R., Trofymow J.A., Prescott C.E., Fyles J., Titus B.D. (2006) Patterns of carbon, nitrogen and phosphorus dynamics in decomposing foliar litter in Canadian forests. Ecosystems, 9, 46–62.
Moradidalini A., Bohluli M., Teh C.B.S., Goh K.J. (2011) Effective-ness of silt pits as a soil, nutrient and water conservation method on non-terraced slopes. In Advances in Tropical Soil Science, vol. 1, pp. 68-91. Eds J. Hamdan and J. Shamsudin. Serdang, Malaysia: Universiti Putra Malaysia Press.
Moraidi A., Teh C.B.S., Goh K.J., Husni M.H.A., Fauziah C.I. (2013) Soil organic C sequestration due to different oil palm residue mulch. In Advances in Tropical Soil Science, Vol. 2, pp. 169-186. Eds J. Hamdan and J. Shamshudin. Serdang, Malaysia: Universiti Putra Malaysia Press.
Moraidi A., Teh C.B.S., Goh K.J., Husni M.H.A., Fauziah C.I. (2015) Effect of four soil and water conservation practices on soil physical processes in a non-terraced oil palm plantation. Soil and Tillage Research, 145, 62-71.
Moraidi A., Teh C.B.S., Goh K.J., Husni M.H.A., Fauziah C.I. (2014) Decomposition and nutrient release temporal pattern of oil palm residues. Annals of Applied Biology, 164, 208-219.
Moraidi A., Teh C.B.S., Goh K.J., Husni M.H.A., Fauziah C.I. (2012) Evaluation of four soil conservation practices in a nonterraced oil palm plantation. Agronomy Journal, 104, 1727-1740.
Morgan R.P.C. (2005) Soil Erosion and Conservation. 3rd edn. UK: Blackwell Publishing
MPOB (2003) Consultancy Services on the Use of Mulching Mat, Ecomat, as a Mulch for Young Palm. Bangi, Malaysia: Malaysian Palm Oil Board.
Mutert E. (1999) Suitability of soils for oil palm in Southeast Asia. Better Crops, 13, 36-38.
Ng P.H.C., Chew P.S., Goh K.J., Kee K.K. (1999) Nutrient require-ments and sustainability in mature oil palms—an assessment. The Planter, 75, 331–345.
Ng S.K. (1977) Review of oil palm nutrition and manuring – scope for greater economy in fertilizer usage. Oléagineux, 32, 107-209.
Ng S.K., Thamboo S. (1967) Nutrient contents of oil palms in Malaya. I. Nutrients required for reproduction: fruit bunches and male inflorescence. The Malaysian Agricultural Journal, 46, 3-45.
Ng S.K., Thamboo S., de Souza P. (1968) Nutrient contents of oil palms in Malaya. II. Nutrients in vegetative tissues. The Malaysian Agricultural Journal, 46, 332-391.
Nicolardot B., Ricous S., Mary B. (2001) Simulation of C and N mineralization during crop residue decomposition: a simple dynamic model based on the C:N ratio of the residues. Plant and Soil, 228, 83–103.
Nurul Hidayah I. (2014) Decomposition Rate of Pulverized Oil Palm Trunk Mulch within Thirteen Months. B. Agric. Sc. Final Year Project Report. Serdang, Malaysia: Uni. Putra Malaysia.
Ochs R., Olivin J. (1977) Le diagnostic foliaire pour le controle de la nutrition des plantations de palmiers à huile: prélèvement des échantillions foliares. Oléagineux, 32, 211-216.
Ortiz R.A., Villalobos E., Fernández O. (1992) Mulch and fertilizer effects on soil nutrient content, water conservation and oil palm growth. ASD Oil Palm Papers, 6, 1–11.
Oviasogie P.O., Aghimien A.E. (2003) Macronutrient status and speciation of Cu, Fe, Zn and Pb in soil containing palm oil mill effluent. Global Journal of Pure Applied Science, 9, 71-80.
Palat T., Smith B.G., Corley R.H.V. (2000) A review of 15 years of oil palm irrigation research in Southern Thailand. International Journal of Oil Palm Research, 6, 146-154.
Pauli N., Donough C., Oberthür T., Cock J., Verdooren R., Rahmadsyah, Abdurrohim G., Indrasuara K., Lubis A., Dolong T., Pasuquin J.M. (2014) Changes in soil quality indicators under oil palm plantations following application of ‘best management practices’ in a four-year field trial. Agriculture, Ecosystems and Environment, 195, 98-111.
Peter W. (2007) Biochar and bioenergy production for climate change mitigation. New Zealand Science Review, 64, 5-10.
Powlson D.S., Gregory P.J., Whalley W.R., Quinton J.N., Hopkins D.W., Whitmore A.P., Hirsch P.R., Goulding K.W.T. (2011) Soil management in relation to sustainable agriculture and ecosystem services. Food Policy, 36, 572-587.
Rabileh M.A., Shamshuddin J., Panhwar Q.A., Rosenani A.B., Anuar A.R. (2015) Effects of biochar and/or dolomitic limestone application on the properties of Ultisol cropped to maize under glasshouse conditions. Canadian Journal of Soil Science, 95, 37-47.
Rathod T. (2011) Oil Palm in India: A Necessity, An Opportu-nity. ADMISI Commodity Research Report. Mumbai, India: ADMISI Commodities Private Limited.
Redshaw M. (2003) Utilization of field residues and mill by-products. In Oil Palm: Management for Large and Sustainable Yields, pp. 307-320. Eds T. Fairhurst and R. Härdter. Singapore: Potash & Phosphate Institute of Canada and International Potash Institute.
Rees A.R., Tinker P.B. (1963) Dry-matter production and nutrient content of plantation oil palms in Nigeria. I. Growth and dry-matter production. Plant and Soil, 19, 19–32.

38 Working paper
Reijnders L., Huijbregts M.A.J. (2008) Palm oil and the emission of carbon-based greenhouse gases. Journal of Cleaner Production, 16, 477-482.
Rosenani A.B., Hoe S.F. (1996) Decomposition of oil palm empty fruit bunches in the field and mineralization of nitrogen. In Progress in Nitrogen Cycling Studies, pp. 127–132. Eds O. van Cleemput, G. Hoffman and A. Vemoesen. The Dordrecht, Netherlands: Kluwer.
Rosenani A.B., Wingkis, R. (1999) Empty fruit bunch application on newly transplanted oil palm: Its decomposition and nutrient release. In Proceedings of Soil Science Conference of Malaysia, 15–18 Apr. 1999, p. 112–129. Eds S. Zauyah, A.B. Rosenani and M.S. Halimi. Serdang, Malaysia: Malaysian Society of Soil Science.
Rosenani A.B., Zahidah A.B. Siti Hajar A., Bahi J.S-B, Tsong L.C., Cheah P.M. (2015) Influence of oil palm empty fruit bunch biochar on floodwater pH and yield components of rice cultivated on acid sulphate soil under rice intensification practices. Plant Production Science, 18, 491-500.
Ross S.M. (1993) Organic matter in tropical soils: current conditions, concerns and prospects for conservation. Progress in Physical Geography, 17, 265-305.
Selman M., Sugg Z., Greenhalgh S., Diaz R. (2008) Eutrophication and Hypoxia in Coastal Areas: a Global Assessment of the State of Knowledge. WRI Policy Note. Water quality: eutrophication and hypoxia. Washington: No. 1. World Resource Institute.
Seneviratne G. (2000) Litter quality and nitrogen release in tropical agriculture: a synthesis. Biology and Fertility of Soils, 31, 60–64.
Sharma M. (2013) Sustainability in the cultivation of oil palm – issues & prospects for the industry. Journal of Oil Palm & The Environment, 4, 47-68.
Singh G. (1994) Management and utilisation of oil palm by-products. In Utilisation of Oil Palm Tree and Other Palms, 27-29 September 1994, pp. 19-48. Eds M.P. Koh, M.N. Mohd Yusof, K.C. Khoo and N. Mohd Nasir. Kuala Lumpur, Malaysia: Forest Research Institute of Malaysia.
Siti Hawa Z. (2014) One-Year Effect of Pulverized Oil Palm Trunk Mulch on Soil Chemical Properties. B. Agric. Sc. Final Year Project Report. Serdang, Malaysia: Uni. Putra Malaysia.
Six J., Feller C., Denef K., Ogle S.M., de Moraes Sa J.C.D., Albrecht A. (2002) Soil organic matter, biota and aggrega-tion in temperate and tropical soils – effects of no-tillage. Agronomie, 22, 755-775.
Soon Y., Arshad M. (2002) Comparison of the decomposition and N and P mineralization of canola, pea and wheat residues. Biology and Fertility of Soils, 36, 10–17.
Squire G. R. (1984) Techniques in environmental physiology of oil palm. 2. Partitioning of rainfall above ground. PORIM Bulletin, 9, 1–9.
Swift M.J., Heal O.W., Anderson J.M. (1979) Decomposition in Terrestrial Ecosystems: Studies in Ecology. Volume 5. Oxford, UK: Blackwell Scientific Publications.
Tampubolon F.H., Daniel C., Ochs R. (1990) Oil palm responses to nitrogen and phosphate fertilizer in Sumatra. Oléagineux, 45, 475-486.
TAMSI-DMSI (Indonesia Palm Oil Advocacy Team - Indonesian Palm Oil Board) (2010) Facts of Indonesian Oil Palm. Jakarta, Indonesia: Indonesian Palm Oil Board.
Tan K.H. (2008) Soils in the Humid Tropics and Monsoon Region of Indonesia. Boca Raton, Florida: CRC Press.
Tan K.S. (1976) Development, Nutrient Contents and Productivity in Oil Palm on Inland Soils of West Malaysia. M.Sc. Disserta-tion, Singapore: University of Singapore.
Tan K.S. (1977) Efficient fertilizer usage for oil palm on inland soils. In International Development in Oil Palm. Malaysian International Agricultural Oil Palm Conference, 14-17 June 1976, pp. 262-288. Eds D.A. Earp and S. Newall. Kuala Lumpur, Malaysia: Incorporated Society of Planters.
Tandiono J., Tohiruddin L., Prabowo N.E., Foster H.L. (2010) Influence of market conditions on optimal fertiliser rates for oil palm in Sumatra. In Proceedings of International Oil Palm Conference, 1-3 June 2010. Yogyakarta, Indonesia: Indonesian Oil Palm Research Institute.
Taqwan, M. (2013) Decomposition Rate of Pulverized Oil Palm Trunk Mulch. B. Agric. Sc. Final Year Project Report. Serdang, Malaysia: Uni. Putra Malaysia.
Tarmizi M.A., Mohd Tayeb D. (2006) Nutrient demands of Tenera oil palm planted on inlands soils of Malaysia. Journal of Oil Palm Research, 18, 204–209.
Taylor B.R., Parkinson D., Parsons W.F.J. (1989) Nitrogen and lignin content as predictors of litter decay rates: a microcosm test. Ecology, 70, 97–104.
Teh C.B.S., Goh K.J., Kamarudin,, K.N. (2010) Physical changes to oil palm empty fruit bunches (EFB) and EFB Mat (Ecomat) during their decomposition in the field. Pertanika Journal of Tropical Agriculture, 33, 39–44.
Teh C.B.S., Goh K.J., Law C.C, Seah T.S. (2011) Short-term changes in the soil physical and chemical properties due to different soil and water conservation practices in a sloping land oil palm estate. Pertanika Journal of Tropical Agricul-ture, 34, 41–62.
Teo L., Ong K.P., Zainuriah A. (2000) Effects of fertiliser withdrawal prior to replanting on oil palm performance. In International Planters Conference on Plantation Tree Crops in the New Millenium: The Way Ahead. Vol. 1. Technical papers, pp. 233-249. Ed E. Pushparajah. Kuala Lumpur, Malaysia: Incor-porated Society of Planters.
Tian G., Kang B.T., Brussaard L. (1992) Biological effects of plant residues with contrasting chemical compositions under

Working paper 39
humid tropical conditions – decomposition and nutrient release. Soil Biology and Biochemistry, 24, 1051–1060.
Tian Y., Sun X.Y., Li S.Y., Wang H.Y., Wang L.Z., Cao J.X., Zhang L. (2012) Biochar made from green waste as peat substitute in growth media for Calathea rotundifola cv. Fasciata. Scientia Horticulturae, 143, 15-18.
Tohiruddin L., Foster H.L. (2013) Superior effect of compost derived from oil palm mill by-products as a replacement for inorganic fertilisers applied to oil palm. Journal of Oil Palm Research, 25, 123-137.
Tohiruddin L., Prabowo N.E., Foster H.L. (2006) Comparison of the response of oil palm to fertilisers at different locations in North and South Sumatra. In Proceedings of Agriculture Conference, International Oil Palm Conference (IOPC), pp. 188–200. Nusa Dua, Bali, Indonesia: Indonesian Oil Palm Research Institute.
UNEP (2012) Converting Waste Oil Palm Trees into a Resource. Osaka, Japan: United Nations Environment Programme, Division of Technology, Industry and Economics, International Environmental Technology Centre.
USDA (2007) Indonesian Palm Oil Production. Available at: http://www.pecad.fas.usda.gov/highlights/2007/12/Indonesia_palmoil/. (consulted on Dec 21st, 2015).
USDA-FAS (2013) Oilseeds World Markets and Trade. Circular Series. Washington, DC: US Department of Agriculture–Foreign Agricultural Service.
van Zwieten L., Kimber S., Morris S., Chan K., Downie A., Rust J., Cowie A. (2010) Effects of biochar from slow pyrolysis of papermill waste on agronomic performance and soil fertility. Plant and Soil, 327, 235-246.
von Uexküll H.R. (2007) Oil Palm (Elaeis guineensis Jacq.). E. & S.E. Asia Program for the Potash & Phosphate Institute/International Potash Institute. Singapore: International Potash Institute.
von Uexküll H.R., Fairhurst T.H. (1991) Fertilizing for High Yield and Quality. The Oil Palm. Bern, Switzerland: International Potash Institute.
Wan Asma I. (2006) Optimization of Mulch Mat Production from Oil Palm Empty Fruit Bunches and its Effects on Growth Performance of Acacia Hybrid Seedlings on Sandy Tailings. Ph.D. Dissertation. Serdang, Malaysia: Uni. Putra Malaysia.
Wan Nurul Ain W.E. (2013) The Effect of Pulverized Oil Palm Trunk Mulch on Soil Chemical Properties. B. Agric. Sc. Final Year Project Report. Serdang, Malaysia: Uni. Putra Malaysia.
Wan Rasidah K., Wan Asma I. (2003) Effect of oil palm empty fruit bunch mulch on forest soil fertility. In Proceedings of the Malaysian Society of Soil Science Conference, Kota Bharu, Kelantan, April 15-16, 2003, pp. 198-201. Eds Z. Eusof, C.I. Fauziah, Z.Z. Zakaria, K.J. Goh, Z. Malik and R. Abdullah. Serdang, Malaysia: Malaysian Society of Soil Science.
Wan Razali W.A., Baharuddin A.S., Talib A.T., Sulaiman A., Naim M.N., Hassan M.A., Shirai Y. (2012) Degradation of oil palm empty fruit bunches (OPEFB) fibre during composting process using in-vessel composter. Bioresources, 7, 4786-4805.
Wingkis R. (1998) Chemical Composition of Oil Palm Empty Fruit Bunch and its Decomposition in the Field. M.Sc. disserta-tion. Serdang, Selangor: Uni. Putra Malaysia.
Wood B.J., Pillai K.R., Rajaratnam J.A. (1979) Palm oil mill effluent disposal on land. Agricultural Wastes, 1, 103-127.
Xin-Fu J. (2004) Studies on Ecomat Used in Desert Remediation in Beijing (Effects on Soil Physical and Chemical Qualities and Tree Growth). M.Sc. Dissertation. Beijing: Beijing Forestry University.
Yavitt J.B., Fahey T.J. (1986) Litter decay and leaching from the forest floor in Pinus contorta (lodgepole pine) ecosystems. Journal of Ecology, 74, 525–545.
Yeo K.L. (2007) Processing empty fruit bunch (EFB) to fiber. In Proceedings of Seminar on Ecomat Research and Promotion: Towards Enrichment of the Environment, pp. 38–39. Bangi, Malaysia: Malaysian Palm Oil Board.
Yuliansyah A.T., Hirajima T., Rochmadi. (2009) Development of the Indonesian Palm Oil Industry and Utilization of Solid Waste. Journal of the Mining and Materials Processing Institute of Japan, 125, 583-589.
Yusoff S. (2006) Renewable energy from palm oil - innovation on effective utilization of waste. Journal of Cleaner Production, 14, 87-93.
Yusop Z., Abdul Rahim N., Anhar S., Mohd Fauzi Z. (1989) Rainfall chemistry and nutrient loading in a Peninsular Malaysia forest site. Journal of Tropical Forest Science, 1, 201-214.
Zaharah A.R., Lim K.C. (2000) Oil palm empty fruit bunch as a source of nutrient and soil ameliorant in oil palm plantations. The Malaysian Agricultural Journal, 4, 51–66.
Zhang A.F., Liu Y.M., Pan G.X., Hussain Q., Li L.Q., Zheng J.W., Zhang X.H. (2011) Effect of biochar amendment on maize yield and greenhouse gas emissions from a soil organic carbon poor calcareous loamy soil from Central China Plain. Plant and Soil, 351, 263-275.
Zolkifli H., Tarmizi A.M. (2010) Phosphorous fractions in soil amended with empty fruit bunches and phosphorous fertilizer - an incubation study. Journal of Oil Palm Research, 22, 823–834.x