Autumn in Colorado
35
18 Autumn in Colorado
-
Upload
louis-albert -
Category
Documents
-
view
15 -
download
0
description
Autumn in Colorado. 18. 2011 SME Annual Meeting Feb. 27-Mar. 2, 2011, Denver, Colorado, US. - PowerPoint PPT Presentation
Transcript of Autumn in Colorado

18
Autumn in Colorado

Economic Evaluation and Sensitivity-Risk Analysis of Zarshuran Gold Mine ProjectEconomic Evaluation and Sensitivity-Risk Analysis of Zarshuran Gold Mine Project
Authors:Authors:
Kazem Oraee; University of Stirling, UK
Ahmad Sayadi; Tarbiat Modares University, Iran
Mahdi Tavassoli; Tarbiat Modares University, Iran
2011 SME Annual MeetingFeb. 27-Mar. 2, 2011, Denver, Colorado, US

Outline
2011 SME Annual Meeting, Feb. 27-Mar. 2, 2011, Denver, Colorado, US 3
Introduction Methodology Case Study Cost and Income Estimation Discounted Cash Flow (DCF) Analysis Sensitivity Analysis Risk Analysis Conclusions

Economic Evaluation of Mining Projects
Case StudyIntroduction Conclusion
Discounted Cash Flow- the most suitable method
Constraints
Uncertainty of internal data
Uncertainty of external data
Methodology Cost & Income Estimation DCF Sensitivity Analysis Risk Analysis
2011 SME Annual Meeting, Feb. 27-Mar. 2, 2011, Denver, Colorado, US 4

Risk Analysis of Mining Projects
Case StudyIntroduction ConclusionMethodology Cost & Income Estimation DCF Sensitivity Analysis Risk Analysis
2011 SME Annual Meeting, Feb. 27-Mar. 2, 2011, Denver, Colorado, US 5
Sensitivity Analysis
Scenario Analysis
Decision Tree
Root Sum of Squares (RSS)
Mont Carlo Method

Methodology
Case StudyIntroduction ConclusionMethodology Cost & Income Estimation DCF Sensitivity Analysis Risk Analysis
2011 SME Annual Meeting, Feb. 27-Mar. 2, 2011, Denver, Colorado, US 6
Develop an economic model by COMFAR software- DCF table construction. NPV, IRR and Payback are calculated
Sensitivity Analysis
Finding the most effective parameters on variations of NPV
To determine the probability distribution of the most effective parameters
To perform the probability analysis of NPV with the help of Mont Carlo simulation by @Risk software

Zarshuran Gold Mine Project
Case StudyIntroduction ConclusionMethodology Cost & Income Estimation DCF Sensitivity Analysis Risk Analysis
2011 SME Annual Meeting, Feb. 27-Mar. 2, 2011, Denver, Colorado, US 7
The most important gold deposit in Iran
Discovered by: Anglo American Company in 1995
Owned by: IMIDRO, a state-owned company

Zarshuran Gold Mine Project
Case StudyIntroduction ConclusionMethodology Cost & Income Estimation DCF Sensitivity Analysis Risk Analysis
2011 SME Annual Meeting, Feb. 27-Mar. 2, 2011, Denver, Colorado, US 8
Tonnage of inferred ore: 55 tons of Gold

Zarshuran Gold Mine Project
Case StudyIntroduction ConclusionMethodology Cost & Income Estimation DCF Sensitivity Analysis Risk Analysis
2011 SME Annual Meeting, Feb. 27-Mar. 2, 2011, Denver, Colorado, US 9
The mine is in construction phase/ planning stage
Planned ore production:
750,000 tons/year
Ultimate stripping ratio: 13.6
Zarshuran Gold Mine Project
Case StudyIntroduction ConclusionMethodology Cost & Income Estimation DCF Sensitivity Analysis Risk Analysis
2011 SME Annual Meeting, Feb. 27-Mar. 2, 2011, Denver, Colorado, US 10
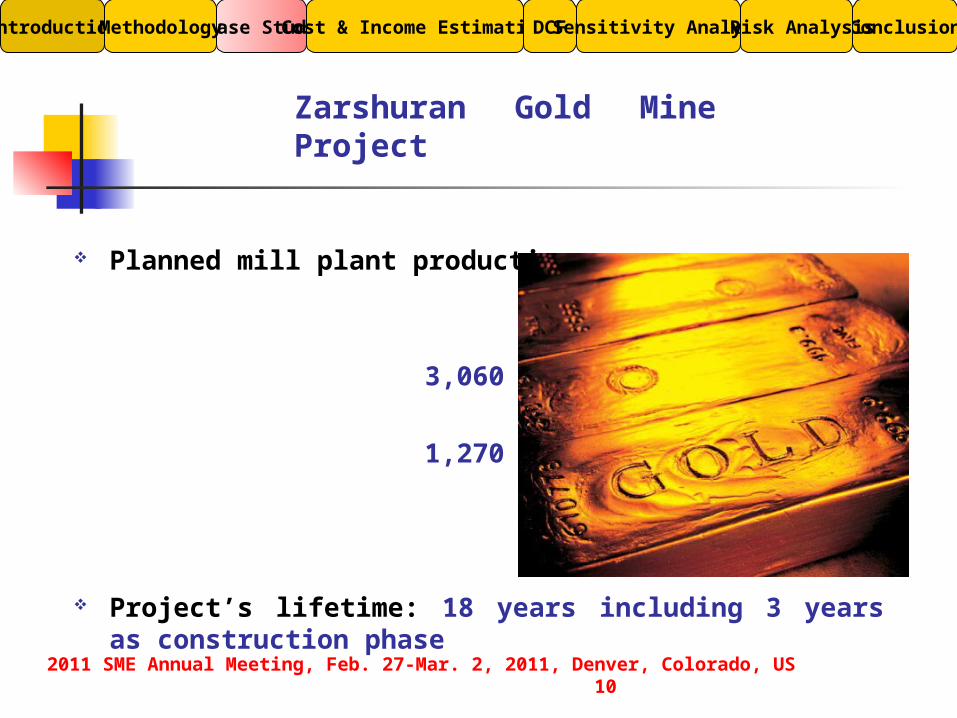
Planned mill plant production:
3,060 kg of gold
1,270 kg of silver
Project’s lifetime: 18 years including 3 years as construction phase

Initial investment for the mine
Case StudyIntroduction ConclusionMethodology Cost & Income Estimation DCF Sensitivity Analysis Risk Analysis
2011 SME Annual Meeting, Feb. 27-Mar. 2, 2011, Denver, Colorado, US 11
Cost items $ Million Share (%)
Buildings 0.46 1.92
Infrastructure 0.55 2.25
Trucks 6.89 28.42
Loaders 4.13 17.04
Auxiliary machinery 3.14 12.96
Administration costs 0.50 2.07
Development costs 5.5 22.68
Other costs 1.06 4.37
Working capital 2.01 8.29
Total 24.25 100

Initial investment for the mill plant
Case StudyIntroduction ConclusionMethodology Cost & Income Estimation DCF Sensitivity Analysis Risk Analysis
2011 SME Annual Meeting, Feb. 27-Mar. 2, 2011, Denver, Colorado, US 12
Cost items $ Million Share (%)
Land 0.42 0.63
Infrastructure 4.16 6.21
Civil works 17.28 25.78
Equipment and machinery 33.51 51.00
Erection costs 3.67 5.48
Reclamation costs 0.21 0.32
Administration costs 0.32 0.47
Other costs 2.98 4.44
Working capital 4.48 6.68
Total 67.04 100
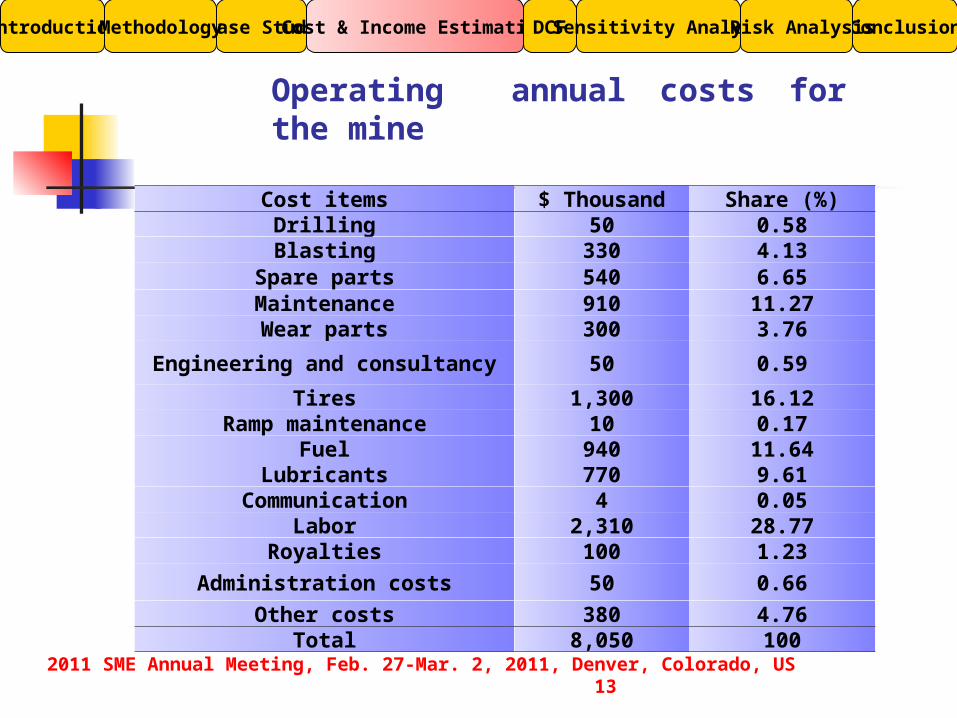
Operating annual costs for the mine
Case StudyIntroduction ConclusionMethodology Cost & Income Estimation DCF Sensitivity Analysis Risk Analysis
2011 SME Annual Meeting, Feb. 27-Mar. 2, 2011, Denver, Colorado, US 13
Cost items $ Thousand Share (%)Drilling 50 0.58Blasting 330 4.13
Spare parts 540 6.65Maintenance 910 11.27Wear parts 300 3.76
Engineering and consultancy 50 0.59
Tires 1,300 16.12Ramp maintenance 10 0.17
Fuel 940 11.64Lubricants 770 9.61
Communication 4 0.05Labor 2,310 28.77
Royalties 100 1.23
Administration costs 50 0.66
Other costs 380 4.76Total 8,050 100

Operating annual costs for the mill plant
Case StudyIntroduction ConclusionMethodology Cost & Income Estimation DCF Sensitivity Analysis Risk Analysis
2011 SME Annual Meeting, Feb. 27-Mar. 2, 2011, Denver, Colorado, US 14
Cost items $ Million Share (%)
Consumable materials 10.6 59.19
Energy 3.5 19.55
Spare parts 0.97 5.4
Maintenance 0.72 4
Administration costs 0.05 0.3
Labor 1.22 6.81
Other costs 0.85 4.76
Total 17.91 100

Annual income
Case StudyIntroduction ConclusionMethodology Cost & Income Estimation DCF Sensitivity Analysis Risk Analysis
2011 SME Annual Meeting, Feb. 27-Mar. 2, 2011, Denver, Colorado, US 15
Average gold price (2003-2009): 621.17 $/oz
0
200
400
600
800
1000
1200
200720052004 2006 200920082003
$/oz
2010

Annual income
Case StudyIntroduction ConclusionMethodology Cost & Income Estimation DCF Sensitivity Analysis Risk Analysis
2011 SME Annual Meeting, Feb. 27-Mar. 2, 2011, Denver, Colorado, US 16
Average silver price (2003-2009): 10.34 $/oz
0
4
8
12
16
20
200720052004 2006 200920082003
$/oz
2010

Annual income
Case StudyIntroduction ConclusionMethodology Cost & Income Estimation DCF Sensitivity Analysis Risk Analysis
2011 SME Annual Meeting, Feb. 27-Mar. 2, 2011, Denver, Colorado, US 17
Total Annual Income
=3,060 (kg/year) × 621.17 ($/oz) × 32.15 (oz/kg)
+1,270 (kg/year) × 10.34 ($/oz) × 32.15 (oz/kg)
=
$ 61.5 Million

Net Present Value of the Project
Case StudyIntroduction ConclusionMethodology Cost & Income Estimation DCF Sensitivity Analysis Risk Analysis
2011 SME Annual Meeting, Feb. 27-Mar. 2, 2011, Denver, Colorado, US 18
NPV = + $ 36.6 Million
Discount rate = % 15.4 (The average inflation rate for the last 7 years)

Net Present Value and Internal Rate of Return
Case StudyIntroduction ConclusionMethodology Cost & Income Estimation DCF Sensitivity Analysis Risk Analysis
2011 SME Annual Meeting, Feb. 27-Mar. 2, 2011, Denver, Colorado, US 19
IRR = 22.5%
($ Million)

Cumulative Value of the Project(Payback Period)
Case StudyIntroduction ConclusionMethodology Cost & Income Estimation DCF Sensitivity Analysis Risk Analysis
2011 SME Annual Meeting, Feb. 27-Mar. 2, 2011, Denver, Colorado, US 20
Year $ Million
1 - 45.45
2 - 79.69
3 - 109.64
4 - 74.06
5 - 38.48
6 - 2.90
7 32.67
8 52.53
9 88.11
Year $ Million
10 123.69
11 159.27
12 194.85
13 214.71
14 243.14
15 271.57
16 300.00
17 328.43
18 348.98

Cumulative Net Present Value of the Project (Discounted Payback Period)
Case StudyIntroduction ConclusionMethodology Cost & Income Estimation DCF Sensitivity Analysis Risk Analysis
2011 SME Annual Meeting, Feb. 27-Mar. 2, 2011, Denver, Colorado, US 21
Year $ Million
1 - 39.38
2 - 65.10
3 - 84.59
4 - 64.52
5 -47.14
6 - 32.07
7 - 19.02
8 - 12.71
9 - 2.90
Year $ Million
10 5.59
11 12.95
12 19.33
13 22.42
14 26.24
15 29.56
16 32.43
17 34.92
18 36.60

Case StudyIntroduction ConclusionMethodology Cost & Income Estimation DCF Sensitivity Analysis Risk Analysis
2011 SME Annual Meeting, Feb. 27-Mar. 2, 2011, Denver, Colorado, US 22
($ Million)
Cumulative Net Present Value of the Project (Discounted Payback Period)

Sensitivity Analysis
Case StudyIntroduction ConclusionMethodology Cost & Income Estimation DCF Sensitivity Analysis Risk Analysis
2011 SME Annual Meeting, Feb. 27-Mar. 2, 2011, Denver, Colorado, US 23
DescriptionMinus
($ Million)Base Case($ Million)
Plus($ Million)
Gold and Silver Price ±10% 14.58 36.60 58.62
Operating Costs ± 10% 47.23 36.60 25.97
Purchase Price ± 10% 44.45 36.60 28.75
Discount Rate ± 10% 48.81 36.60 26.23

Sensitivity Analysis
Case StudyIntroduction ConclusionMethodology Cost & Income Estimation DCF Sensitivity Analysis Risk Analysis
2011 SME Annual Meeting, Feb. 27-Mar. 2, 2011, Denver, Colorado, US 24
Therefore, instead of absolute numbers for most
effective parameters:
Gold Price, Silver Price and Discount Rate
probability distributions are used

Probability distribution of gold price($/oz Thousand)
Case StudyIntroduction ConclusionMethodology Cost & Income Estimation DCF Sensitivity Analysis Risk Analysis
2011 SME Annual Meeting, Feb. 27-Mar. 2, 2011, Denver, Colorado, US 25

Probability distribution of silver price($/oz)
Case StudyIntroduction ConclusionMethodology Cost & Income Estimation DCF Sensitivity Analysis Risk Analysis
2011 SME Annual Meeting, Feb. 27-Mar. 2, 2011, Denver, Colorado, US 26

Probability distribution of inflation rate
Case StudyIntroduction ConclusionMethodology Cost & Income Estimation DCF Sensitivity Analysis Risk Analysis
2011 SME Annual Meeting, Feb. 27-Mar. 2, 2011, Denver, Colorado, US 27

Results of Mont Carlo simulation
Case StudyIntroduction ConclusionMethodology Cost & Income Estimation DCF Sensitivity Analysis Risk Analysis
2011 SME Annual Meeting, Feb. 27-Mar. 2, 2011, Denver, Colorado, US 28
DescriptionNPV
($ Million)
Minimum -67.35
Maximum 16,253.96
Mean 49.65
Standard Deviation
122.40
Variance 141,259,016
Skewness 0.003
Mode -65.88
NPV = $ 49.65 Million
This is the most probable NPV and
not $ 36.6 Million

Sensitivity ranking by Mont Carlo Method
Case StudyIntroduction ConclusionMethodology Cost & Income Estimation DCF Sensitivity Analysis Risk Analysis
2011 SME Annual Meeting, Feb. 27-Mar. 2, 2011, Denver, Colorado, US 29
Description Correlation
Gold Price 0.91
Discount Rate - 0.37
Silver Price 0.01

Case StudyIntroduction ConclusionMethodology Cost & Income Estimation DCF Sensitivity Analysis Risk Analysis
2011 SME Annual Meeting, Feb. 27-Mar. 2, 2011, Denver, Colorado, US 30
NPV is most sensitive to Gold Price
Future price estimation:
Average price taken here to be 621.17 $/oz
World Bank forecasts that gold price will be 1,000 $/oz in
2020. This corresponds to growth in gold price of 5.4 % per year
Risk Analysis Based on Forecast Data

Case StudyIntroduction ConclusionMethodology Cost & Income Estimation DCF Sensitivity Analysis Risk Analysis
2011 SME Annual Meeting, Feb. 27-Mar. 2, 2011, Denver, Colorado, US 31
If total costs increase by less than 5.4 % per year,
NPV will increase
Therefore:
Risk Analysis Based on Forecast Data
Conclusion
Case StudyIntroduction ConclusionMethodology Cost & Income Estimation DCF Sensitivity Analysis Risk Analysis
2011 SME Annual Meeting, Feb. 27-Mar. 2, 2011, Denver, Colorado, US 32
Sensitivity Analysis showed that the selling price of
gold and silver; and discount rate are the most
important parameters. This is often the case in
mining projects.

Conclusion
Case StudyIntroduction ConclusionMethodology Cost & Income Estimation DCF Sensitivity Analysis Risk Analysis
2011 SME Annual Meeting, Feb. 27-Mar. 2, 2011, Denver, Colorado, US 33
The NPV and IRR of the project are calculated to be
+ $ 36.6 Million and %22.5 respectively. This is an
attractive project for most investors. Based on the
results of risk analysis, the average value for NPV is
+ $ 49.65 Million. We call this expected NPV.

Conclusion
Case StudyIntroduction ConclusionMethodology Cost & Income Estimation DCF Sensitivity Analysis Risk Analysis
2011 SME Annual Meeting, Feb. 27-Mar. 2, 2011, Denver, Colorado, US 34
Mont Carlo simulation also ranks the importance of
important parameters to be:
Gold Price
Discount Rate
Silver Price

Thank youfor your attention