Autonomous Vehicles Educational Forum
57
Autonomous Vehicles Educational Forum Arlington Town Hall Auditorium November 14, 2017 7:00 PM – 8:30 PM AGENDA 7:00-7:10 Town of Arlington – Introduction and Welcome 7:10-7:30 What are Autonomous Vehicles? 7:30-7:50 Potential Impacts to Public Infrastructure and Land Use 7:50-8:10 Potential Fiscal and Economic Impacts 8:10-8:25 Question and Answer Period 8:25-8:30 Town of Arlington – Closing Remarks
Transcript of Autonomous Vehicles Educational Forum

Autonomous Vehicles Educational Forum
Arlington Town Hall Auditorium
November 14, 2017
7:00 PM – 8:30 PM
AGENDA
7:00-7:10 Town of Arlington – Introduction and Welcome
7:10-7:30 What are Autonomous Vehicles?
7:30-7:50 Potential Impacts to Public Infrastructure and Land Use
7:50-8:10 Potential Fiscal and Economic Impacts
8:10-8:25 Question and Answer Period
8:25-8:30 Town of Arlington – Closing Remarks

Autonomous Vehicles Educational Forum
Arlington Town Hall Auditorium
November 14, 2017
7:00 PM – 8:30 PM
Scott Smith, Senior Operations Research Analyst
Volpe Center/ U.S. Department of Transportation
Eric Bourassa, Transportation Director
Metropolitan Area Planning Council
Rafael Mares, Vice President and Director, Healthy Communities and
Environmental Justice, Conservation Law Foundation

Automated VehiclesAutonomous Vehicles Educational Forum
Town Hall, Arlington, Massachusetts
Advancing transportation innovation for the public good
14 November 2017

4
Agenda
What are automated vehicles?
When will automated vehicles be on our roads?
What are their potential impacts?

5
Disclaimer
Statements made during this presentation are opinions of the speaker and do not represent official positions of
the U.S. Department of Transportation.
5

6
What are automated vehicles?

7
What are automated vehicles?

8
Varying levels of automation (SAE J3016)
Automated Driving Systems (ADS) Adapted from SAE J3016 Standard

9
How do automated vehicles work? Sensors
Radar
Cameras
Lidar
Ultrasonic
Infrared
Sensor data may be combined with other data inputs: Highly detailed mapping data
V2V/V2I Messages
Automated image processing Feature extraction
Machine vision
Machine Learning/Artificial Intelligence Based on what an AV can “see” and
what it predicts nearby objects are likely to do, it can make decisions about speed and steering inputs
Image Adapted from the Texas Instruments ADAS Solutions Guide
Image Source: Popular Science

10
When will automated vehicles be
on our roads?

11
Automated vehicles are…here today
Most major manufacturers currently offer Level 1 systems (e.g., lane keep assist, adaptive cruise control)
Some offer Level 2 systems (e.g., Tesla Autopilot, Audi Traffic Jam Assistant)
Image Sources (left to right): Mercedes-Benz, Volvo, The Verge

12
Automated vehicles are…in testing
Image Sources (left to right, top to bottom): Uber, Google, Otto, Local Motors
Dozens of manufacturers and technology companies are currently testing AVs
They are not only testing passenger vehicles, but also heavy duty commercial and small transit-like vehicles

13
Automated vehicles are…in testing
Source: http://www.ncsl.org/research/transportation/autonomous-vehicles-legislation.aspx

14
Automated vehicles are…coming soon
Many manufacturers are targeting 2020 (or potentially sooner) to introduce Level 3 and 4 automated vehicles...
BMW says self-driving car to be level 5
capable by 2021 - Reuters,16 March 2017
GM will test fully autonomous cars
'in quarters not years,' CEO Mary
Barra says – CNBC, 24 October 2017
Ford's self-driving car 'coming
in 2021‘ – BBC 17 August 2016
Toyota to test self-driving, talking
cars by about 2020 – Reuters, 16
October 2017
Arlington (Texas) to Roll Out Milo Autonomous Shuttle Pilot Program
August 26, 2017
Navya driverless shuttles to begin ferrying University of Michigan
students this fall – Techcrunch, 21 June 2017

15
But…
adoption timelines are a moving target
1957
America's Independent Electric Light and Power Companies 1957 advertisement (image of the future in 10 years)
16
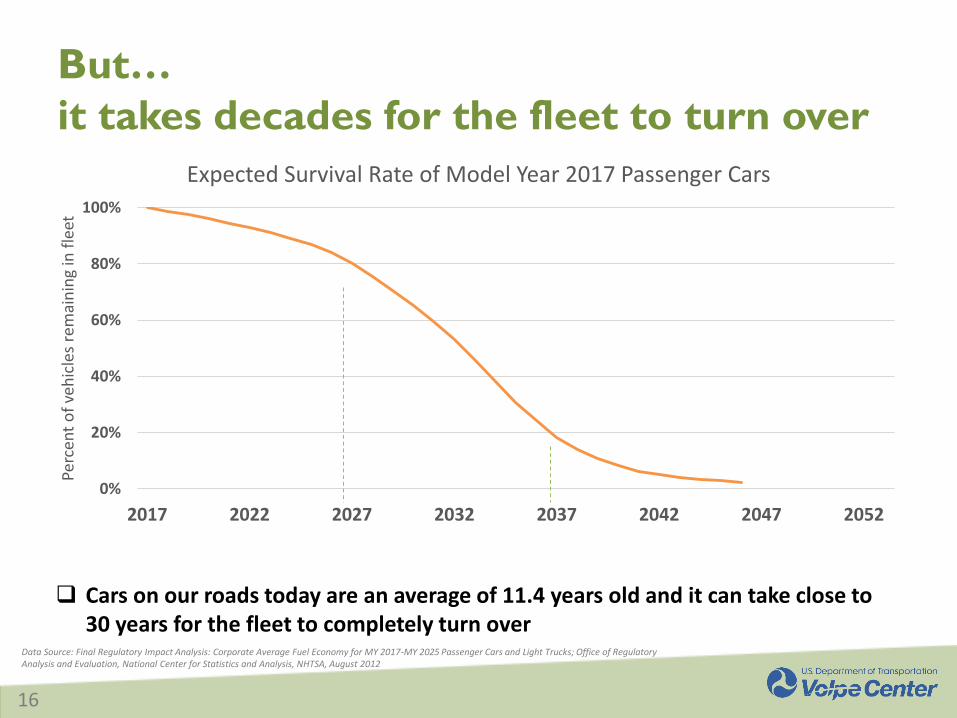
But…
it takes decades for the fleet to turn over
0%
20%
40%
60%
80%
100%
2017 2022 2027 2032 2037 2042 2047 2052
Perc
ent
of
veh
icle
s re
mai
nin
g in
fle
et
Expected Survival Rate of Model Year 2017 Passenger Cars
Data Source: Final Regulatory Impact Analysis: Corporate Average Fuel Economy for MY 2017-MY 2025 Passenger Cars and Light Trucks; Office of Regulatory Analysis and Evaluation, National Center for Statistics and Analysis, NHTSA, August 2012
Cars on our roads today are an average of 11.4 years old and it can take close to 30 years for the fleet to completely turn over

17
Different approaches to automation
Geographic Extent
Level of Automation
Traditional Automotive Industry
Technology Disruptors
All Roads
SAE Automation Level 5
Highly automated vehicles (L4) operating in a limited geographic extent
Increasingly sophisticated driver assistance functions (L1), moving towards partial automation (L2)

18
How will automation impact us?

19
Potential benefits and significant uncertainty
Impact Area Potential Benefit Potential Dis-Benefit
Safety Reduction in crashes New types of crashes
Personal MobilityMore options, especially for those unable/unwilling to drivePotentially cheaper
Can everyone access the automated vehicles?
Energy Use and Pollution
Smoother speed profiles, platooning, light-weighting could improve efficiency
Increases in VMT couldincrease fuel use/pollution
Network Efficiency May increase throughputMay increase congestion,via increased trips
Public HealthImproved access to medical care,work and recreation for non-motorists
May reduce use of active modes
Travel Behavior andVehicle Ownership
May decrease need for ownership, potentially reducing fleet size
May lead to more trips, with ability to safely multi-task enroute
Land UseMay encourage density by freeing up space currently devoted to parking
May encourage sprawl

20
Areas of uncertainty
Future of AVs and their use
Technology
User Response
Policy

21
USDOT voluntary guidance
21
• Automated Driving Systems 2.0: A Vision for Safety released in September 2017.
• Replaces 2016 Federal Automated Vehicles Policy
• More information available on NHTSA website: https://www.nhtsa.gov/technology-innovation/automated-vehicles

22
For more information
Scott Smith
Technology Innovation and Policy Division
www.volpe.dot.gov

Autonomous Vehicles Educational Forum
Eric Bourassa, Transportation Director
Metropolitan Area Planning Council
Adoption of New Technologies Can be Rapid
Testing Today in Boston
Planning and Policy Considerations

Automobile Influence on Land Use
Outside of Clinton
Source: Wikimedia – Nick Allen
Wellesley Office Park
Source: Bing
Route 1, Saugus
Source: Bing

Where is the Car?
1900
New York
City
5th Avenue
Source: National Archive: https://www.archives.gov/files/research/american-cities/images/american-cities-101.jpg
Inspiration from Tony Seba’s lecture, Clean Disruption of Energy & Transportation, 2017

Where is the Car?
1900
New York
City
5th Avenue
Source: National Archive: https://www.archives.gov/files/research/american-cities/images/american-cities-101.jpg
Inspiration from Tony Seba’s lecture, Clean Disruption of Energy & Transportation, 2017

Where is the Horse?
1913
New York
City
5th Avenue
Source: http://www.shorpy.com/node/204
Inspiration from Tony Seba’s lecture, Clean Disruption of Energy & Transportation, 2017

Where is the Horse?
1913
New York
City
5th Avenue
Source: http://www.shorpy.com/node/204
Inspiration from Tony Seba’s lecture, Clean Disruption of Energy & Transportation, 2017

Adoption Rate of New Technologies Can be Rapid
Source: Asymco

Autonomous Vehicle Testing in Boston
Off-site testing
100 miles, Marine Industrial Park,
day time only,
good weather
100 miles, Marine Industrial Park,
day and night time,
mixed weather
200 miles, South Boston
Waterfront, day time only,
good weather
200 miles in South Boston
Waterfront, day and night,
mixed weather
400 miles in City of Boston ,
day time only,
good weather
City of Boston
day and night time,
mixed weather
A
B
1
B
2
C
1
C
2
D
1
D
2
Source: Kris Carter, Mayor’s Office of New Urban Mechanics, City of Boston
Testing Sites Testing Phases

Polaris GEM e4 and e6 Audi Q5Renault Zoe
200 miles in South Boston
Waterfront, day and night,
mixed weather, with passengers
C3
100 Miles, Marine Industrial Park, night-time and light rain
B
2
100 miles, Marine Industrial Park,
day time only,
good weatherB
merger occurring
Source: Kris Carter, Mayor’s Office of New Urban Mechanics, City of Boston
Autonomous Vehicle Testing in Boston

Transportation as a Service
Instead of consumers owning the asset (car, bike, bus) a third party
provides it for a small fee.
New business models dependent on smart-phone technology.
Standardized and simplified payment methods.
Can combine public and private transportation providers through
a unified system.
Example Services: ride hailing, car sharing, bike sharing,
transit route planning, instant home delivery, parking applications.
Example Companies: Uber, Lyft, Zipcar, Hubway, Instacart, GrubHub.

Convergence of Technologies
Electric
Vehicles
Autonomous
Vehicles
Ridehailing/
Ridesharing

Growth in Ridehailing
Boston Region
Uber arrived in Boston in 2011, followed by Lyft in 2013.
Number of trips with Uber exceeded 115 million between 2012 and 2015.
Approximately 70,000 trips between Friday and Saturday in Boston
from10:00 PM to 4:00 AM.
Source: Uber

Rate of Ridehailing
New York City Ridehailing tripled between June 2015 and Fall 2016.
Added 600 million miles of travel between 2013 and 2015.
San Francisco On a typical weekday, there are more than 170,00 vehicle trips within
San Francisco, representing 15% of all intra-city vehicle trips in 2016.
At peak periods, ridehailing trips are estimated to comprise 20-26%
of vehicle trips in downtown areas in 2016.

Critical Areas for State and Local Government Planning
Regulatory
Framework
Data
Land Use
Impacts
Infrastructure
Parking
Coordination
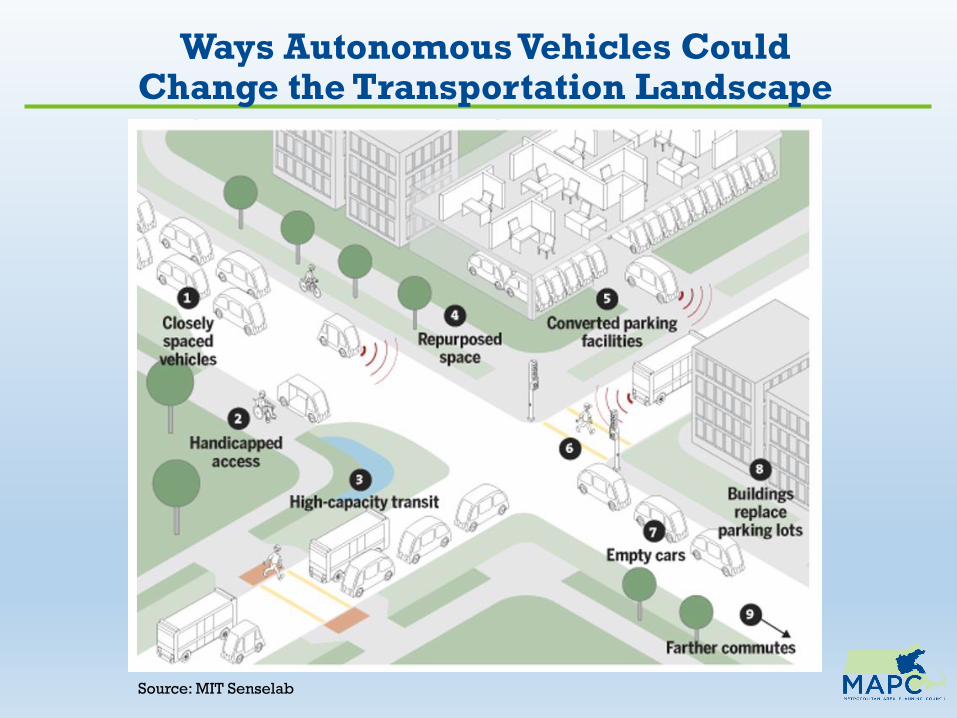
Ways Autonomous Vehicles Could Change the Transportation Landscape
Source: MIT Senselab

Imagining Future Places
Source: Making Better Places: Autonomous Vehicles and Future Opportunities WSP|Parsons Brinckerhoff
Flexible Spaces for
People, Not Cars
No Permanent
On-Street Parking
Enhanced
Bicycle
and
Pedestrian
Access

Imagining Future Places
Source: Envisioning Florida’s Future: Transportation and Land Use in an Automated Vehicle World
Redevelop Surface
Parking to Infill
Development and/or
Parks and Public Space

Arlington Center Parking Regulations and Supply
Off Street 496 SpacesOn-Street 1,147 SpacesTOTAL1,643 spaces
Source: Arlington Center Parking Study, Nelson Nygaard, May 2014

Gas Stations
in Arlington

Source: US Census Data – American Community Survey - 2015
Transportation Mode to Work for Arlington Residents
0
10
20
30
40
50
60
70
DroveAlone
Carpooled PublicTransit
Bicycle Walked Worked atHome
6%
18%
3%6%
2%
Pe
rce
nt
%
64%

Where is the Car?
1900
New York
City
5th Avenue
Source: National Archive: https://www.archives.gov/files/research/american-cities/images/american-cities-101.jpg
Inspiration from Tony Seba’s lecture, Clean Disruption of Energy & Transportation, 2017

AUTONOMOUS VEHICLES EDUCATIONAL FORUM
Will self-driving cars also drive your budget?
The Fiscal and Economic Impacts of Autonomous Vehicles
November 14, 2017
Rafael MaresVice President & Program Director
Healthy Communities and Environmental Justice

TODAY’S ROAD MAP
Current Motor Vehicle Revenue Sources.
Current Motor Vehicle Revenue Sources.
AV Budget Drivers. AVs and
Municipal Revenue Sources.
AVs and State Revenue Sources.
The costs and benefits of AVs.
What we have learned along the way.
Policies that can help us benefit from AVs.
Municipal Budgets State
Budgets
TrendsProjected Fiscal Impacts
Projected Economic Impacts Lessons
LearnedRecommendations

CURRENT MUNICIPAL MOTOR VEHICLE REVENUE SOURCES
Parking:
Street ParkingParking PermitsParking Violations
Fines:Moving Violations
Excise Tax:$25 per thousand is assessed annually upon the value of the vehicle by the community where the motor vehicle is customarily garaged.

Revenue Sources for FY 2015
Fuels Tax:gas tax,
special fuels (diesel), etc.
($756M)
Motor Vehicle Sales Tax:
6.25% of sales (or book price
value)($789M)
Tolls:Metropolitan
Highway System and
Western Turnpike ($427M)
RMV Fees: License, title,
and registration
fees. ($511M)
Moving Violation: speeding tickets. ($24M)
CURRENT STATE OF REVENUE SOURCES
TOLL

TRENDS: AV BUDGET DRIVERS
Traffic: studies estimate VMT increase of 37% to 90%.
Parking: reduced need for parking.
Zero-Emissions Vehicles: introduction of electric AVs.
Sharing: introduction of ride-sharing (v. ride-hailing).
Accessibility to non-drivers
Increased willingness to travel longer distance
Diversion from the MBTA
Zombie vehicles
AVs can park closer together and let each other out.
AVs can circle the block or drive home.
MA Goal: 300,000 vehicles by 2030
Currently: 11,000 ZEVs

Jan 2017 ||
nuTonomytested the first autonomous vehicle in MA
2018 ||
Tesla to release fully autonomous vehicles
2020 ||
Toyota, Ford, Audi, and Waymo to release fully autonomous vehicles
2021 ||
According to Mobileye, fully autonomous vehicles to be widely used in cities
2023 ||
According to Mobileye, fully autonomous vehicles to be widely used in all settings
BMW to release fully autonomous vehicles
TIMELINE: INTRODUCTION OF AVS
2017 2018 2020 2021 2023

PROJECTED IMPACT: AVS AND MUNICIPAL REVENUE SOURCES
Overall: Parking revenue will decline.
Urban: Short-term loss; long-term balance
Major sources of motor vehicle-related revenue are street parking and parking fines (52 to 60%). Boston and nearby cities will see significant decline (e.g., $35M or 27% of motor vehicle-related revenue in Boston at 20% market penetration). After high penetration of AVs, opportunities for increase in property taxes because fewer parking garages will be needed.
Rural/Suburban: Less impact expected, because parking revenue is
small (3% to 15%) compared to urban municipalities.

Overall: Excise tax largely dependent on private ownership rate.
AVs will be more expensive in the beginning (but this impact will largely disappear as additional costs of technology decline).
If more AVs are used in ride-sharing (but would be balanced out partially due to larger turnover of vehicles).
If more AVs are owned privately or used for ride-hailing (could impact different municipalities differently).
Urban: Excise tax is smaller source of motor vehicle-related revenue
(40% to 48%), but greater expectation that AVs will be used in ride-sharing.
Rural/Suburban: Excise tax is larger source of motor vehicle
funding (84% to 97%), but may not see large decline in excise tax, because private ownership of AVs more likely.
PROJECTED IMPACT: AVS AND MUNICIPAL REVENUE SOURCES

Fuels Tax: Will be slightly higher as a result of increase in VMT (at 20% market penetration).Significantly increased (at 100%), unless there is significant ride-sharing.If fleet is electric, fuels tax will decrease (at 20%) and plummet (at 100%).
MV Sales Tax: Pulled up due to higher cost (private ownership)Pulled down due to reduction in vehicles (ride-sharing), but larger turn over mitigates or makes up for it.
Tolls: Increase due to higher VMT (at 20%).Large increase (at 100%).Small increase for ride-sharing.
RMV fees: Increase (private ownership).Decrease (ride-sharing).
Moving violations: Significant decrease (at 20%).Elimination (at 100%).
PROJECTED IMPACT: AVS AND STATE REVENUE SOURCES

Congestion: Increased traffic will cost consumers, businesses, and government between $375M to $750M (at 20%) annually and $3.7B/year (at 100%).
Greenhouse Gases: In the short term, GHG will cost an estimated $28M annually. In the longer term an increase in GHG will cost about $113M per year.
Air pollution: Another $30M/year can be expected in the short term from air pollution and $144M/year at 100% market penetration.
Safety: $660M annual (at 20%) and $3.3B (at 100%)
Road Maintenance: $10 to $42M at 100%.
PROJECTED ECONOMIC IMPACTS: THE COSTS AND BENEFITS OF AVS

No tradeoff necessary between different economic impacts (e.g., can improve safety, traffic, and GHG at the same time).
Tradeoff between negative fiscal and positive economic impacts can be avoided (e.g., replace gas tax and reap benefits from electric vehicles).
AV analyses need to keep benefits of self-driving technology separate from independent improvements in automobile technology (e.g., fuel economy, electric vehicles, sharing, and safety).
Huge difference in fiscal and economic impacts between ride-hailing and ride sharing.
An increase in VMT, continued use of the ICE and private ownership a disastrous combination for air quality and GHG emissions.
MBTA budget could take hit if low-cost driving pulls riders who can afford it away from the T, leaving behind those who cannot.
LESSONS LEARNED

Limits on Zero-Occupancy Vehicles: Restrict distance zombie vehicles can travel.
Zero-Emissions Vehicles: Incentivize electric vehicles.
Real Sharing: Providing incentives for ride-sharing (over ride-hailing and private ownership).
Replacing the Gas Tax: introduce mileage-based fees.
Bridge for Parking Revenue: cities need to replace parking revenue in short term.
Job training: large-scale programs to retrain drivers.
POLICY RECOMMENDATIONS

Rafael MaresVice President and Program DirectorHealthy Communities and Environmental JusticeConservation Law Foundation
62 Summer StreetBoston, MA 02110
P: 617-850-1739E: [email protected]
For a thriving New England

Autonomous Vehicles Educational Forum -Questions?
Arlington Town Hall Auditorium
November 14, 2017
7:00 PM – 8:30 PM
Scott Smith, Senior Operations Research Analyst
Volpe Center/ U.S. Department of Transportation
Eric Bourassa, Transportation Director
Metropolitan Area Planning Council
Rafael Mares, Vice President and Director, Healthy Communities and
Environmental Justice, Conservation Law Foundation


![Autonomous vehicles[1]](https://static.fdocuments.us/doc/165x107/54bf07bb4a7959cb478b4592/autonomous-vehicles1.jpg)