Autonomous FACULTY OF SCIENCE AND ENGINEERING Lab-on-a …
92
Autonomous Lab-on-a-chip: solutions and fast prototyping tools Linköping Studies in Science and Technology Dissertation No. 2149 Germán Comina Bellido
Transcript of Autonomous FACULTY OF SCIENCE AND ENGINEERING Lab-on-a …

Autonomous Lab-on-a-chip:solutions and fast prototyping tools
Linköping Studies in Science and TechnologyDissertation No. 2149
Germán Comina Bellido
Germán Com
ina Bellido Autonomous Lab-on-a-chip: solutions and fast prototyping tools 2021
FACULTY OF SCIENCE AND ENGINEERING
Linköping Studies in Science and Technology, Dissertation No. 2149, 2021 Department of Physics, Chemistry and Biology (IFM)
Linköping UniversitySE-581 83 Linköping, Sweden
www.liu.se


Linköping Studies in Science and Technology
Dissertation No. 2149
Autonomous Lab-on-a-chip: solutions and fast prototyping tools
Germán Comina Bellido
Division of Sensor and Actuator Systems Department of Physics, Chemistry and Biology (IFM)
Linköping University, SE-581 83 Linköping, Sweden
Linköping 2021

The front cover of this thesis is the pixelated version of an artistic composition made using images of 3D-printed-lenses-and-waveguide developed during the thesis work. The raw image appeared on the cover of the journal Analytical Methods, 2016, Vol. 8, 32, where the fifth paper of this thesis was published.
Copyright © Germán Comina Bellido 2021, unless otherwise noted.
All rights reserved.
Autonomous Lab-on-a-chip: solutions and fast prototyping tools
ISBN 978-91-7929-648-3
ISSN 0345-7524
Printed in Sweden by LiU-Tryck Linköping 2021
This work is licensed under a Creative Commons Attribution-NonCommercial 4.0 International License.https://creativecommons.org/licenses/by-nc/4.0/

Dedicated to Dora Ana Bellido Ojeda a wonderful person that happens to be my mother

v
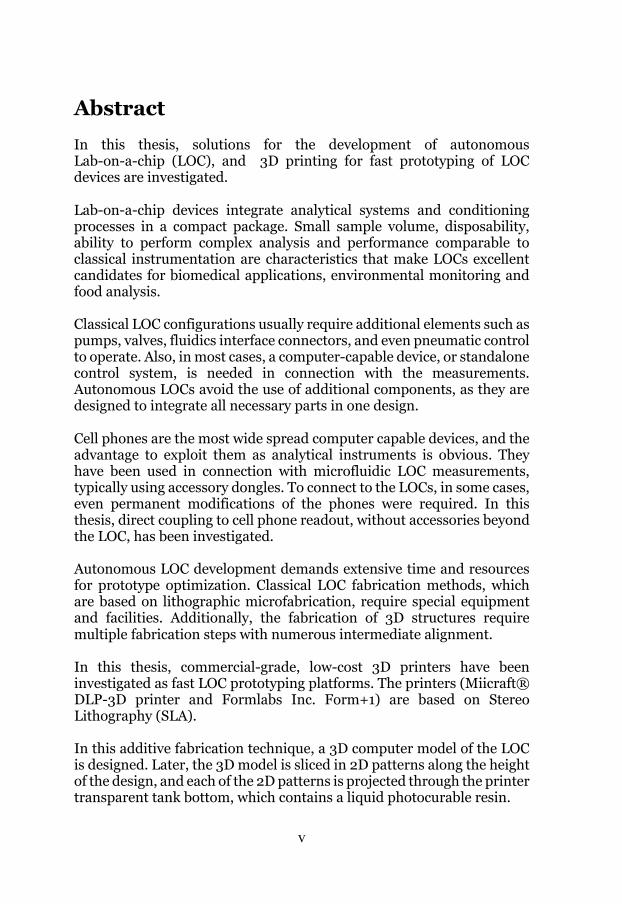
Abstract In this thesis, solutions for the development of autonomous Lab-on-a-chip (LOC), and 3D printing for fast prototyping of LOC devices are investigated. Lab-on-a-chip devices integrate analytical systems and conditioning processes in a compact package. Small sample volume, disposability, ability to perform complex analysis and performance comparable to classical instrumentation are characteristics that make LOCs excellent candidates for biomedical applications, environmental monitoring and food analysis. Classical LOC configurations usually require additional elements such as pumps, valves, fluidics interface connectors, and even pneumatic control to operate. Also, in most cases, a computer-capable device, or standalone control system, is needed in connection with the measurements. Autonomous LOCs avoid the use of additional components, as they are designed to integrate all necessary parts in one design. Cell phones are the most wide spread computer capable devices, and the advantage to exploit them as analytical instruments is obvious. They have been used in connection with microfluidic LOC measurements, typically using accessory dongles. To connect to the LOCs, in some cases, even permanent modifications of the phones were required. In this thesis, direct coupling to cell phone readout, without accessories beyond the LOC, has been investigated. Autonomous LOC development demands extensive time and resources for prototype optimization. Classical LOC fabrication methods, which are based on lithographic microfabrication, require special equipment and facilities. Additionally, the fabrication of 3D structures require multiple fabrication steps with numerous intermediate alignment. In this thesis, commercial-grade, low-cost 3D printers have been investigated as fast LOC prototyping platforms. The printers (Miicraft® DLP-3D printer and Formlabs Inc. Form+1) are based on Stereo Lithography (SLA). In this additive fabrication technique, a 3D computer model of the LOC is designed. Later, the 3D model is sliced in 2D patterns along the height of the design, and each of the 2D patterns is projected through the printer transparent tank bottom, which contains a liquid photocurable resin.

vi
Each exposure cures a thin layer of the resin, and the procedure is repeated adding layer after layer until the 3D printout is completed. With this technique it was possible to obtain real 3D LOC structures with unlimited number of 3D features in one step, within the hour, and at low-cost for prototyping, which constitutes a superb tool for fast and affordable sophistication of LOC architecture. The process was extended in this thesis to another area of complex and costly development: the manufacture of optical components. It was shown that optical components with arbitrary geometry could be obtained within the hour and typically for less than 1€/prototype. The first use of the technique was to produce templates for classical LOCs of polydimethylsiloxane (PDMS) on glass. The procedure was the first, to our knowledge, implemented with consumer grade printers, and included a demonstration of template fabrication for the development of a multilayer PDMS-LOC for colorimetric detection of glucose. The technique then evolved to the complete replacement of the PDMS stage, by conceiving the LOC architecture as a single monolithic printout. This concept was coined Unibody LOC (ULOC) and was used in this thesis for the development of all the autonomous Lab on a Chip solutions. Numerous solutions towards autonomous LOCs were developed such as: multidimensional adaptors that connect for example 1.6mm diameter tubing directly to 50µm wide microfluidic channels, several on plane and multilayer mixers, hybrid ULOC with paper channels, finger-pumps, check-valves, optical couplers and 3D printed optics. Time-dependent optical response bio-chemical reactions were identified as key to implement the link between autonomous LOC with cell phones without other accessories, and relying on ambient light as illumination. Such approach improves the analytical resolution of a colorimetric measurement using essentially the same camera. Finally, all those solutions were integrated to develop a chemical sensing interface for universal cell phone readout, and a 3D printed device for quantitative enzymatic detection using cell phones. Keywords: Autonomous Lab-on-a-chip, bio-chemical sensing, sensor fabrication, biosensing cell phone, 3D printed fluidics, 3D printed optics.

vii
Populärvetenskaplig sammanfattning “Autonomt Lab-on-a-chip: lösningar och snabba prototypverktyg”. Ett Lab-on-a-chip är en liten enhet som potentiellt kan utföra tester motsvarande de som görs i konventionella laboratorier. De flesta applikationer som rapporterats i vetenskapliga tidskrifter påträffas inom biomedicin, miljöövervakning och livsmedelsanalys. Många av de LOC-baserade lösningarna kräver ytterligare utrustning som pumpar, ventiler eller detekteringsutrustning. Man kan i det här fallet fråga sig om en LOC verkligen är ett laboratorium i ett chip, eller ett chip inom ett laboratorium. För att LOC-enheter verkligen ska vara användbara måste de vara autonoma, på ett sådant sätt att de integrerar alla processer från extraktionen av provet till den slutliga mätningen. Mobiltelefoner är i praktiken datorer distribuerade över hela världen och anslutna till ett nätverk. Enligt International Telecommunication Union (ITU) har antalet abonnemang världen över under det sista kvartalet 2019 varit 108 per 100 invånare. Det är uppenbart att det skulle vara en stor fördel att använda dem för analytiska mätningar. Under senare år har tillsatstillverkningen med hjälp av 3D-skrivare påskyndat utvecklingen inom olika kunskapsområden. Dessa skrivare tillåter tillverkning av tredimensionella objekt baserat på Computer Aided Designs (CAD). En speciell typ av 3D-skrivare, baserad på stereolitografi, gör det möjligt att skriva ut högkvalitativa objekt med upplösningar i storleksordningen tiotals µm och till en låg kostnad. I denna doktorsavhandling ges olika lösningar för utveckling och snabb tillverkning av autonoma LOC-prototyper. Användningen av billiga, kommersiella stereolitografiska 3D-skrivare som plattform för snabb prototypning av LOC: er studerades och validerades. Denna alternativa plattform gjorde det möjligt att skapa LOC: er med flernivå- och 3D-geometrier, vilket skulle kräva många steg, utrustning och specialfaciliteter, om den traditionella metoden att tillverka LOC: er användes. Det påskyndar också optimeringsprocessen i utvecklingen av LOC: er, eftersom denna process är baserad på testning

viii
och modifiering av prototyper tills de önskade egenskaperna har erhållits. Olika integrerade lösningar utvecklades för autonoma LOC, såsom: fingerpump, blandningsventiler, strukturer för schemalagd transport, 3D-tryckt optik, och pappersfluidik integrerad i LOC-kanalerna. En metod utvecklades också för att mäta det optiska svaret för autonoma LCO: er med hjälp av mobiltelefonkameran, utan att behöva modifiera telefonen, helt enkelt genom att placera LOC på kameran. Alla dessa studier behandlar området utveckling och tillverkning av autonoma Lab-on-a-chips.

ix
Preface This thesis is the result of my PhD studies at the Optical Devices Laboratory, Division of Sensor and Actuator Systems at the Department of Physics, Chemistry and Biology (IFM), Linköping University. My main supervisor has been Prof. Daniel Filippini and co-supervisor Dr. Anke Suska. Dr. Edwin Jager has been my main supervisor for the last eight months guiding the completion of the defense process. My thesis work gives solutions to the development of autonomous Lab- on-a-Chip (LOC) devices, strategies for its use with any unmodified cell phone, and methods to employ 3D printers as a fast Lab-on-a-chip prototyping platform. This thesis work is based on five papers. The first paper, when published, was the first to report the development of templates for classical polydimethylsiloxane (PDMS) with consumer grade printer. The second paper introduces the concept of Unibody LOC where a monolithic 3D printout can be used directly as LOC. The third paper relates to 3D printing fabrication methods, solutions and characterization. The fourth reports methods to 3D print optics and autonomous chemical sensing interface for universal cell phone readout. Finally the fifth takes the previous solutions and integrate them in a LOC device for quantitative enzymatic detection using cell phones. Germán Comina Linköping, January 2021

x

xi
List of papers and contributions
Papers included in this thesis. Paper I: PDMS lab-on-a-chip fabrication using 3D printed templates. Germán Comina, Anke Suska and Daniel Filippini, Lab Chip, 2014, 14, 424-430. (My contribution: design, optimization for PDMS curing, fabrication, characterization and writing) Paper II: Low cost lab-on-a-chip prototyping with consumer grade 3D printer. Germán Comina, Anke Suska and Daniel Filippini, Lab Chip, 2014, 14, 2978-2982 (My contribution: design, optimization for sealing, fabrication, characterization and writing) Paper III: 3D Printed Unibody Lab-on-a-chip: Features Survey and Check-Valves Integration. Germán Comina, Anke Suska, Daniel Filippini, Micromachines, 2015, 6, 437-451. (My contribution: design, optimization of check valves, fabrication, characterization and writing) Paper IV: Autonomous Chemical Sensing Interface for Universal Cell Phone Readout. Germán Comina, Anke Suska and Daniel Filippini, Angewandte Chemie International Edition , 2015, 54, 8708-8712. (My contribution: optics design and fabrication, fluidics optimization, fabrication, characterization and writing)

xii
Paper V: A 3D printer device for quantitative enzymatic detection using cell phones. Germán Comina, Anke Suska and Daniel Filippini, Analytical Methods, 2016, 8, 6135-6142. (My contribution: optics design and fabrication, fluidics optimization, fabrication, characterization and writing)
Other paper not included in the thesis.
Paper VI. Towards autonomous lab-on-a-chip devices for cell phone biosensing. Germán Comina, Anke Suska, Daniel Filippini, Biosens. Bioelectron, 2016, 77, 1153–1167. (Review paper. My contribution: Literature search, part in writing)

xiii
Conference Contributions. Integrated passive check-valves for 3d printed fluidics. German Comina, Anke Suska, Daniel Filippini 2nd International Conference on MicroFluidic Handling Systems. 8-10 October 2014, University of Freiburg Germany (Poster). Unibody three channels injector with integrated manual pumps. Anke Suska, German Comina, Daniel Filippini 2nd International Conference on MicroFluidic Handling Systems 8.-10. October 2014, University of Freiburg Germany (Poster). Generic disposable devices for label free detection on cell phones. P. Preechaburana, G. Comina, A. Suska, D. Filippini 2nd International Conference on Label-Free Technologies 12-14 March 2015, Boston Marriott Cambridge, MA, USA. 3D printed disposable optics and lab-on-a-chip devices for chemical sensing with cell phones. G. Comina, A. Suska, D. Filippini. (2017). Progress in Biomedical Optics and Imaging - Proceedings of SPIE, , 10061 doi:10.1117/12.2256021.

xiv

xv
Acknowledgements First, I would like to express my great gratitude to my main supervisor, Prof. Daniel Filippini, not only for giving me the chance of grow as a professional and person next to him by giving me the opportunity to do my doctoral studies with him, but also for being so patient, kind and full of support in so many moments during all those years. Thank you very much dear Daniel, thanks indeed! I would like to express my deepest thanks to Dr. Edwin Jager, for becoming my main supervisor during the last eight months, and for giving me all the help, support and guidance during the defense process. Your help Edwin has been invaluable for me, thank you very much. I would also like to give my deepest thanks to Dr. Anke Suska, my co-supervisor, for helping me during all these years-always when I needed her advice or support Dr. Suska was ready to help. Working with Dr. Suska has been a great experience of scientific excellence, respect and friendship. Thank you very much Anke, I greatly appreciate it. Also, I give my deepest thanks to Dr. Stefan Klinström, Forum Scientium Director, for all the help and guidance you gave me Stefan since the first time I visited IFM, and now during my defense process too, thank you so much. I also express my thanks to the wonderful people that I had the pleasure to meet at IFM: Dr. Mike Andersson, one of the first people I met, and one of the first friends I made at IFM, for all the fantastic moments and help in Linköping. Prof. Fredrik Winquist, for all those great ideas, talks and moments during all these years, since I was at IFM. Dr. Marek Szymanski, for the conversations, great moments and help during my stay at Linköping. I would like to thank Prof. Uno Wennergren, for always reviewing the advances of my studies at IFM.

xvi
I specially would like to express my deep gratitude to Dr. Brian Tracey and M.Sc. Martin Nissfolk, for their fast replies and very valuable suggestions while I was writing this thesis. Thank you so much! I would like to thank deeply my family for always being there, and for always supporting my endeavors, Thank you very much! Finally, I would like to express my thanks to all my friends and all the persons who made living and studying in Linköping an enrichment experience and a real pleasure, tack så mycket!
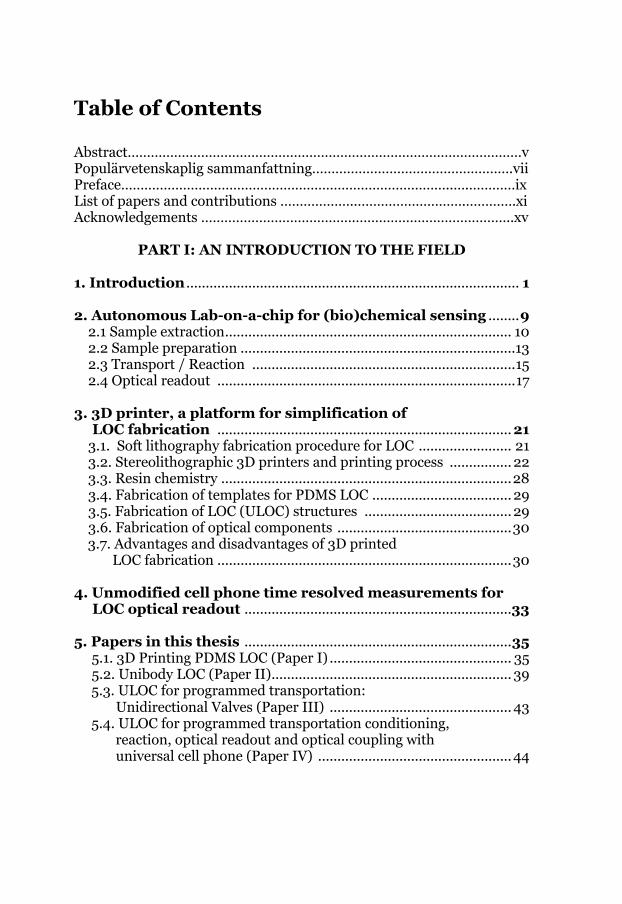
Table of Contents Abstract…………………………………………………………………………………………v Populärvetenskaplig sammanfattning…………………………………………….vii Preface…………………………………………………………………………..….…………ix List of papers and contributions ………………..……………………….………….xi Acknowledgements ………………………………….…………………………………..xv
PART I: AN INTRODUCTION TO THE FIELD
1. Introduction ...................................................................................... 1 2. Autonomous Lab-on-a-chip for (bio)chemical sensing ........ 9
2.1 Sample extraction .......................................................................... 10 2.2 Sample preparation ....................................................................... 13 2.3 Transport / Reaction .................................................................... 15 2.4 Optical readout ............................................................................. 17
3. 3D printer, a platform for simplification of LOC fabrication ............................................................................ 21
3.1. Soft lithography fabrication procedure for LOC ........................ 21 3.2. Stereolithographic 3D printers and printing process ................ 22 3.3. Resin chemistry ........................................................................... 28 3.4. Fabrication of templates for PDMS LOC .................................... 29 3.5. Fabrication of LOC (ULOC) structures ...................................... 29 3.6. Fabrication of optical components ............................................. 30
3.7. Advantages and disadvantages of 3D printed LOC fabrication ............................................................................ 30
4. Unmodified cell phone time resolved measurements for LOC optical readout ..................................................................... 33 5. Papers in this thesis ..................................................................... 35
5.1. 3D Printing PDMS LOC (Paper I) ............................................... 35 5.2. Unibody LOC (Paper II) .............................................................. 39
5.3. ULOC for programmed transportation: Unidirectional Valves (Paper III) ............................................... 43
5.4. ULOC for programmed transportation conditioning, reaction, optical readout and optical coupling with
universal cell phone (Paper IV) .................................................. 44

5.5. Autonomous 3D printed device for (bio)chemical detection using cell phones (Paper V) ....................................................... 47
6. Conclusions .................................................................................... 51 7. Future Work .................................................................................. 53 Bibliography ...................................................................................... 55
PART II: PAPERS
Paper I ................................................................................................. 67 Paper II ................................................................................................ 77 Paper III .............................................................................................. 87 Paper IV ............................................................................................ 105 Paper V ................................................................................................ 121

PART 1
An introduction to the field


Chapter 1. Introduction
1
Chapter 1
Introduction Lab-on-a-chip (LOC) devices integrate and concentrate, in a small volume, microfluidic and sample conditioning procedures otherwise performed at standard laboratories [1]. Microfluidics is “the science and technology of systems that manipulate small (10-9 to 10-18 liters) amounts of fluids” [2]. Since the 1960s, using integrated-circuits (IC) fabrication technologies, silicon etching lithography based processes, have made it possible to create piezoelectric diaphragms [3], accelerometers [4], and devices that handle fluids [5]. By 1979, Terry et.al. [6] reported the development of a miniaturized gas chromatographic air analyzer. It was made on a 5cm diameter silicon wafer, where all, a 1.5m spiral capillary column, valve, and holes for gas input and output were made on the wafer. Additionally, a thermal conductivity detector was integrated to the wafer. This work demonstrated the potential of IC microfabrication processes for the development of all-in-one miniaturized flow devices that integrate sample preparation and detection. During the 1980s, the development of thin-films microstructures, their integration with metal-oxide-semiconductor (MOS) electronics, and the development of micromechanisms were reported [7]. By the beginning of 1990s the fabrication of microelectromechanical systems (MEMs), that integrate sensors, actuators and control functions was achieved [7]. In 199o, the concept of Miniaturized Total Analysis System (µ-TAS) was coined by Manz et.al. [8] and was referred to the development of a modular-miniaturized device that performs sample pretreatment and detection. At that time the µ-TAS were fabricated using MEMs on silicon, and were used for molecular biology and for military proposed as miniaturized system in warfare agent detection. From theses uses, the term Lab-on-a-chip (LOC) was introduced, and is used as a synonym for µ-TAS [9].
Chapter 1. Introduction
2
In 1998 Duffy et.al. [10] proposed to use the elastomer poly(dimethylsiloxane) (PDMS) as a soft material, and soft lithography as method, to fabricate LOC devices. The procedure starts with the design of the channels network using a computer drawing software. A high definition printer was used to print the design in a transparency sheet, which is used as a lithographic template. The transparency was located on a silicon wafer that had a photoresist film on it. Then, the set was irradiated with UV light. The development of the photoresist creates a relief on the silicon that was used as a master to cast the PDMS. After, the PDMS was casted against the master, to yield replicas containing the channel network, it was oxidized with plasma in order to both create hydrophobic surfaces and seal the casted PDMS with a PDMS flat slab. In spite of the fact that this procedure requires special facilities and equipment for handling reagents like the photoresist and its developer, LOCs made of PDMS, and PDMS on glass, became widely used for LOC fast prototyping. In 2000 Unger et.al. [11], used multilayer soft lithography to develop monolithic valves and pumps. In this work, two independent elastomer-layers were fabricated; a 40µm thin “sample-layer”, where the sample fluid passes through its microfluidic channels, and a 4mm thick “control-layer”, where air (control fluid) passes through their microfluidic channels. The “control-layer” sealed on the “sample-layer”, in the way that its “control-channels” are set perpendicularly to the “sample-channels”. When air passes through each of the control channels, it pushes down the thin layer over the sample channel, closing it. Using just one control-channel and one sample-channel, an on-off valve was created. Similarly, a peristaltic pump was fabricated using three control-channels and one sample-channel, which was later extended to the fabrication of a grid of on-off valves and switching valves. In 2001 Love et.al. [12] reported the Microscope Projection Lithography (MPL), a method for fast prototyping of templates, with micrometric features, used in soft lithography applications. This method is based on a direct-microscope, where a transparent mask that contains the pattern to be projected, is placed in the field stop of the microscope, and a substrate with a photoresist film is placed on the microscope stage. The illumination goes through the transparency containing the pattern, and is projected thought the microscopy objective, becoming reduced in size and exposing the photoresist transferring the microscopic features of the illuminating pattern on it.

Chapter 1. Introduction
3
Maskless alternatives for microstructures fabrication were also demonstrated, in which a computer image of a pattern is projected using a digital micromirror device (DMD) or a Liquid Christal Display Projector (LCDP) [13], the modulated light passes through a microscope objective, similarly to MPL, the micro pattern illuminates the photoresist and creates the micro features on the substrate. In 2010 Preechaburana et.al. [14] reported a method and platform for rapid prototyping of 3D microstructures. An inverted microscope was used as a fabrication platform. A DMD projector was used as modulated light source. Illuminating gray patterns (8 bits) were designed using several types of software (PowerPoint, MATLAB, among others). The patterned light spot went through the microscope optical path and when passing through the 10x objective lens was reduced and illuminated the photoresist (SU-8 /S1818) film on the glass substrate, located at the sample holder. In this technique the photoresist/glass ensemble can be irradiated from the photoresist side and from the glass side. Using this method and platform, monolithic 3D aligned microstructures tested for microfluidic handling were demonstrated. Microfluidics service areas and cantilever suspended structures were also shown. Additive Fabrication (AF) relates to the fabrication of computer designed complex 3D geometries. In the process, a 3D computer model is segmented in 2D layers, and each of these layers is fabricated sequentially on top of each other. 3D printers are equipment that enable the additive fabrication. They usually work with a computer and associated software that handles the file that contains the digital 3D model (usually a STL extension file). The file resets some aspects of the printing model such as: rotation, fabrication axis, orientation, magnification, among others, and slices the 3D model in 2D layers that the internal 3D printer processor can interpret and create according to its additive fabrication method. Additive fabrication processes can be classified according to the fabrication material in: solid, liquid and powder. And each of them according to the fixing method for each material: melting, polymerization, lamination, and binding [15]. The Fuse Deposition Modeling (FDM) or “thermoplastic extrusion”3D printer, uses a plastic filament that feeds a hot extruder nozzle that usually has movement on “Z” axis and a formation base that has horizontal “XY” movement. The melted filament is extruded on a surface

Chapter 1. Introduction
4
(formation base) and in places defined by the 2D layers. When the melted filament starts to solidify, it creates a 2D layer. Later, the extruder moves up, and starts creating a new layer. This process is repeated until the 3D solid is fabricated layer by layer. This is the most common type of 3D printers in the market, and there are several popular brands like Makerbot ® [16] and Ultimaker ® [17]. Stereo Lithography (SL), or Micro Stereo Lithography (MS, due to resolution <100µm) 3D printers, are based on the photo polymerization, by a UV laser, of a mixture of monomer/oligomer/photo-initiator (resin). The resin is kept in a UV tank with a transparent bottom, and a mobile flat metal platform, controlled by a linear stage, is introduced vertically (“Z” axis) into the tank, until a small layer of resin is created between the tank base and the metal platform. The minimum achievable distance between both surfaces defines the “Z” printer resolution (“dZ”). The first 2D layers sliced from the digital 3D model is projected to the base of the transparent tank, polymerizing the resin between the base and the platform. Later the base moves, detaching the polymerized layer from the base, and the platform moves the distance “dZ”, allowing the resin to cover the space between the tank base and the first layer. After this, the second digital 2D layer is projected, creating the second layer, and the process is repeated until all the layers are added to form the 3D object. According to the procedure used to project the 2D layers on the tank base the SL 3D printers can be: - SL-DLP 3D printer: when a Digital Light Processor (DLP) unit is
used to reflect the UV LED light, projecting simultaneously a 2D layer UV-image on the resin tank base. In this case the “XY” resolution is based on the DLP pixel resolution.
- SLA 3D printer: When an optical projection system based on two rotating mirrors, deflects the UV laser, drawing sequentially the 2D digital layer at the tank base. In this case the “XY” resolution is based on the projector resolution on the tank base. The fabrication time of this kind of printers is usually longer than the DLP printer. SLA stands for Stereo Lithographic Apparatus.
- SL-LCD 3D printer: when each pixel of a Liquid Cristal Display (LCD) unit is used to transmit or not UV LED light modulated according to the 2D layers. Each of the 2D layers UV-image are

Chapter 1. Introduction
5
projected on the resin tank base. In this case the “XY” resolution is based on the LCD display resolution.
The usage of 3D printers in microfluidics, according to Lee [18], could be the start point of the third decade of microfluidic revolution. In 2012 Kitson et.al. [19], reported the development of a “3D-printed milli-fluidic and microfluidic ‘lab on a chip’ reaction ware”. In this work, a FDM 3D printer (3DTouchTM) was used to print three devices. The first (two input-one output) was tested to perform a inorganic reaction (imine formation and reduction), and an Attenuated Total Reflective IR spectrometer (ATR-IR) was used to monitor its output. The second (three-input-one-output) was used to perform an organic (reductive amination under flow conditions), and its output was monitored by ATR-IR. The third was a one channel device that has two containers for solid materials. They were filled with reagents (Na2MoO4 •2H2O and NH2NH2•2HCl) before finishing the 3D fabrication. A third liquid reagent (aqueous hydrochloric acid) passed through the channel (i.e. the containers), producing molybdenum-based polyoxometalates ({Mo36} and {Mo154}) at its output. PAPER I [20] in this thesis was published in 2013, and demonstrates the use of a low-cost consumer grade MS-DLP 3D printer (Miicraft®) to produce templates for classical PDMS on glass microfluidic LOCs. This method enabled the fabrication of complex geometries, which are difficult to make using classical photolithography for PDMS. In 2014, PAPER II [21], used the same printer to fabricate, in a single step, LOCs that integrate all 3D geometrical features in a monolithic body. This concept was coined as Unibody Lab-on-a-chip, and is a simple yet powerful tool for LOC prototyping. Small in size, high surface to volume ratio, integration of sample handling and detection, are characteristics features of LOCs. These characteristics, if achieved at low cost, make LOCs an attractive platform for disease diagnosis/detection if connection to telemedicine/analysis systems is provided. The advantages of LOC technology has been explored for clinical diagnostics, but also find applications in food analysis, environment monitory or industrial scenarios [22]. Mobile phones are the most used technological platform worldwide. According to the statistics data of the International Telecommunication Union (ITU) [23], by October 28 2019 the number of mobile cell phone subscriptions worldwide was 108 per 100 inhabitants. And the number
Chapter 1. Introduction
6
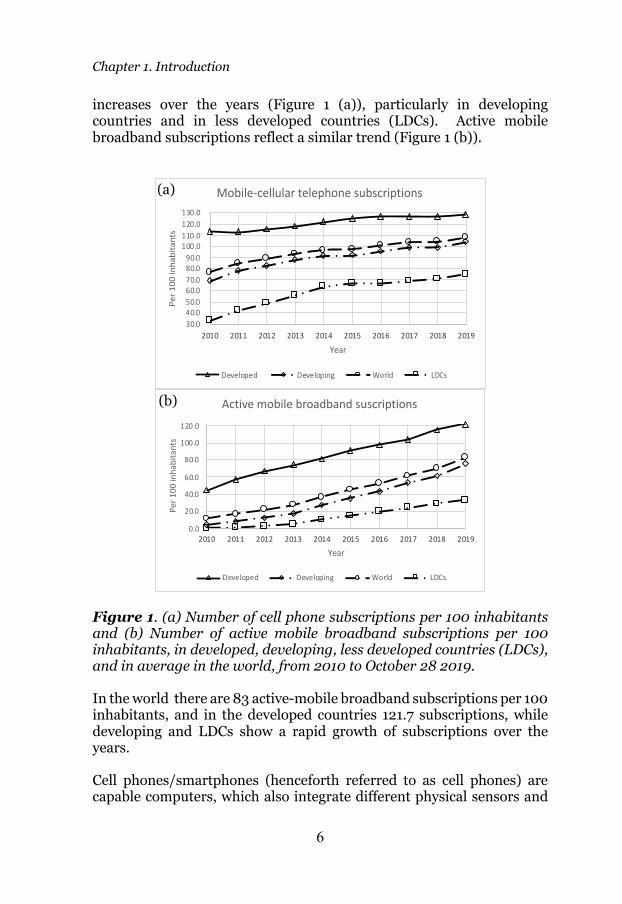
increases over the years (Figure 1 (a)), particularly in developing countries and in less developed countries (LDCs). Active mobile broadband subscriptions reflect a similar trend (Figure 1 (b)).
Figure 1. (a) Number of cell phone subscriptions per 100 inhabitants and (b) Number of active mobile broadband subscriptions per 100 inhabitants, in developed, developing, less developed countries (LDCs), and in average in the world, from 2010 to October 28 2019. In the world there are 83 active-mobile broadband subscriptions per 100 inhabitants, and in the developed countries 121.7 subscriptions, while developing and LDCs show a rapid growth of subscriptions over the years. Cell phones/smartphones (henceforth referred to as cell phones) are capable computers, which also integrate different physical sensors and
30.0 40.0 50.0 60.0 70.0 80.0 90.0
100.0 110.0 120.0 130.0
2010 2011 2012 2013 2014 2015 2016 2017 2018 2019
Per 1
00 in
habi
tant
s
Year
Mobile-cellular telephone subscriptions
Developed Developing World LDCs
0.0
20.0
40.0
60.0
80.0
100.0
120.0
2010 2011 2012 2013 2014 2015 2016 2017 2018 2019
Per 1
00 in
habi
tant
s
Year
Active mobile broadband suscriptions
Developed Developing World LDCs
(a)
(b)

Chapter 1. Introduction
7
actuators, GPS, radio transceiver, audio input and output, video cameras, a large programmable area multi-touch screen, high intensity illuminator, etc. Most of those sub-systems and user interfaces can be managed by software applications (Apps). Apps can be programmed to numerous purposes. Those characteristics make the cell phones powerful ubiquitous and mobile computing platforms for developing worldwide decentralized solutions for health and environment. Nevertheless (bio)chemical sensing, necessary for such uses, conflicts to reusable sensors that could be integrated in cell phones. In this thesis, solutions for development of autonomous LOCs and fast prototyping tools where investigated in the following instances:
1. Use of SL-DLP and SLA printers for fast prototyping of LOC fabrication (demonstrated in all papers).
2. 3D printing of masks for PDMS LOCs fabrication (Paper I) [20].
3. Direct printing of unibody LOC (ULOC), a LOC build on a monolithic 3D printout (Paper II) [21].
4. Hybrid 3D printed LOC for lateral flow technology (Paper II) [21].
5. Development of integrated: mixers, check-valve, multidimensional connector, 3D multilayer microchannels, and finger pumps (Paper III) [24].
6. Development of chemical sensing interface for universal cell
phone readout, and 3D printed optics. (Paper IV) [25].
7. Development of a 3D printed device for quantitative enzymatic detection using unmodified cell phones (Paper V) [26].

Chapter 1. Introduction
8

Chapter 2. Autonomous Lab-on-a-chip for (bio)chemical sensing
9
Chapter 2 Autonomous Lab-on-a-chip for (bio)chemical sensing Lab-on-a-chip (LOC) devices usually use external accessories, like pumps, valves, optic components, among others, to perform measurement protocols. Those devices are sometimes larger than the LOC and difficult to miniaturize and integrate [27]. The integration of actuation accessories in LOC is technical challenging and faces cost constraints to produce solutions compatible with a disposable LOC unit. Ahn et.al. [28] developed a disposable plastic biochip. The LOC was fabricated on stacked aligned layers of micro-machined injection molded plastic. It contained on-chip pressurized air for microfluidic manipulation, mixers and functionalized electrodes for electrochemical detection of oxygen, glucose, and lactate. Also, an electronic card was developed, to which the device (LOC) was electronically attached, to perform electrochemical measurements. It is worth mentioning that a tool for injection molding costs in excess of 20000 €, for a single design. Qiu et.al. [29] developed a finger-actuated, self-contained immunoassay cassette. The microfluidic cassette (the LOC) has two separated parts when stored. The top storage component, made of polyethylene, contains the reagents and has flexible pouches. The bottom processing component, made of polycarbonate, entails aligning interconnecting needles, connection channels, a mixer and detection chamber. To operate, the storage component part (top part) and the processing component part (bottom part) are pressed against each other, forcing the needles to penetrate the storage, establishing the connection. When the flexible pouching areas in the storage part are pressed, air propels the volumes that are in the storage part, lateral flow buffer and sample, into the processing part. The mixing chamber in the processing part leads the fluids to a lateral flow immunoassay (LFIA) to detect antibodies for HIV in saliva samples. Floris et.al. [30] created a disposable microfluidic LOC device, based on electrophoresis and conductivity, to measure the lithium concentration

Chapter 2. Autonomous Lab-on-a-chip for (bio)chemical sensing
10
in blood . The LOC was made by fusion bounding of two glass wafers. The first wafer entails the channels, reservoirs and through-holes. The second wafer contains the high voltage (HV) electrophoresis anode and cathode, and the electrodes for conductivity measurement. The LOC was filled with the buffer using vacuum and later placed in a plastic cartridge to be stored. In order to operate, a standalone electronic reader was developed. After a drop of blood is inserted in the LOC, the electronic reader delivers the HV needed for electrophoresis and also measures the conductivity to determine the lithium content. In addition, several groups have investigated autonomous LOC devices [31], but often incorporating standalone readers in the measurement process. Unmodified cell phones can also be used as quantitative readers, if the concepts for readout, robust-detection and integrated-calibration are adjusted during the LOC design. So, the quantitative measure is kept independent from the cell phone model, user settings or operative system. The concept of an autonomous disposable LOC device for cell phone analysis (ADDCA) requires integration of the following procedures: sample extraction, sample preparation, transport/reaction, integrated calibration and readout (Figure 2).
Figure 2. Procedures required by an autonomous LOC. In this thesis this readout is based on optical detection.
2.1. Sample extraction Three attractive concepts for sample extraction in autonomous LOCs were identified: vacuum-needle system, finger pumps and lateral flow.
Sample Extraction
Sample Preparation
Transport / Reaction
Readout (Optical)

Chapter 2. Autonomous Lab-on-a-chip for (bio)chemical sensing
11
2.1.1. Vacuum-needle system Li et.al. [32] developed a vacuum-needle blood extraction system based on a PDMS chamber connected to a microneedle at its base. Before use, the microneedle hollow was caped and the air inside the PDMS chamber extracted. To preserve the vacuum inside it, the chambers external surface was coated with a parylene film. During operation, when the needle is pressed against the skin, it perforates the cap connecting the vacuum chamber with the blood stream, enabling the sample extraction. While the system is self-sufficient and yet simple, the use of vacuum creates new challenges for interconnections with the rest of microfluidics structures, which are kept at atmospheric pressure. 2.1.2. Finger pumps The concept is based on pressing with the finger a flexible zone in the LOC, for pumping air, or an inert liquid, into the system channels to make the microfluidics to work. Begolo et.al [33] created a 3D printed pumping lid and a guiding mechanism, that when the lid is pressed, creates a positive pressure on the sample, making it enter into the microfluidic system. When it is pulled, a negative pressure is created. In paper IV [25], a 3D printed LOC has been fabricated with an input terminal, where a silicone tube is connected to an internal check-valve (Figure 3). After the silicone tube is filled with the sample, it is pressed by a finger, and the PDMS valve opens and pushes the sample into the channel. When the silicone tube is released, the valve closes so the sample does not return. This diode-like behavior solves the problem of having negative pressure and samples escaping from the input. The finger action provides the energy needed, so complications related to other energy sources like vacuum are eliminated, and the concept is not restricted to a fixed pumping volume. In all these cases pressure difference drives the fluid through the channels.

Chapter 2. Autonomous Lab-on-a-chip for (bio)chemical sensing
12
Figure 3. Finger pump and check-valve solution for sample extraction. 2.1.3. Lateral flow (capillarity extraction) This technology is based on capillarity, and has been successfully implemented in commercial pregnancy tests [34, 35, 36, 37]. Usually, lateral flow test devices have functionalized readout zones, in which the sample responds through a colorimetric reaction. Lateral flow is not only a solution for a single parameter, but for multiple detection parameters, as has been shown for paper fluidic devices [38, 39 , 40, 41]. Switches and valves have been integrated to paper fluidics [42, 43], and also the possibility of combining paper capillarity extraction and classical microfluidic. This hybrid transport concept was reported by Wang et.al. [44] and Kokalj et.al. [45]. For biosensing medical applications, blood provides the most convenient sample [46]. Hypodermic needles and finger prickers
Silicone tube

Chapter 2. Autonomous Lab-on-a-chip for (bio)chemical sensing
13
are commercial devices used for blood extraction. Nevertheless, the systems described before: “pumping-lid and guidance mechanism” [33], as well as the “silicon tube finger pump plus check-valve” fabricated in paper IV [25], both easily integrated in a LOC, could be modified, so the lid pump or the silicon tube can be used to extract blood. Urine, in contrast to blood, is non-invasively extracted and available in larger volumes. Coskun et.al. [47] developed an albumin test for urine using a cell phone for readout. In this solution, a 3D printed cell phone attachment holds, in front of the phone camera, two custom-fabricated tubes (one for control and the other for sample) containing fluorescent regents for albumin detection, illuminated by a 532 nm wavelength laser. When used, 25 µl urine is injected in the sample tube and a cell phone App computes the albumin concentration based on the fluorescence. Saliva is one of the most patient-friendly samples to obtain. However, saliva is altered by several factors, like diet, bacteria, blood contaminations etc., so its collection requires specific protocols and sample treatment methods [48]. Lateral flow colorimetric testing using cell phones was shown by Carrio et.al. [49], who demonstrated an automated low cost cell phone based lateral flow saliva test reader for detection of drug abuse. Oncescu et.al. [50] reported a saliva based cholesterol testing with a cell phone. In both cases, the solution requires a reusable readout hardware, which consist of a booth that supports the lateral flow assay, and where the smartphone is attached. The booth is equipped with a flash diffuser which ensures controlled illumination and the cell phone with dedicated software for image acquisition and evaluation. When cell phones are used as measurement platforms, the design of the autonomous LOC must guarantee that the cell phone is not exposed to the sample. In this thesis, solutions for sample extraction has been reported in Paper II (capillarity extraction-transport) and Papers IV and V (finger pump). 2.2. Sample preparation After extraction, sample preparation must ensure the solution meets the characteristics needed for the respective measurement. Dilution, mixing,

Chapter 2. Autonomous Lab-on-a-chip for (bio)chemical sensing
14
filtration, separation, combination with reagents, concentration, are processes used alone or combined, depending on the application. In the case of blood analysis, Yang et.al. [51] developed a blood-plasma separation device, which is based on flow rates difference (Zweifach–Fung effect). When in a bifurcated structure (“Y” shape LOC structure) is used, there is a different flow between the bifurcated branches, the red blood cells tend to follow the stream that flows along the branch with higher flow rate. A device for separation of red blood cells from plasma, based on differences in microchannel width, has been developed by VanDelinder et.al. [52]. Haeberle et.al. [53], created a microfluidic disk structure for centrifugal extraction of plasma from whole blood. In this case, the plasma obtained (2µl from 5µl whole blood) could be driven inside the chip to other microfluidic components for further processing. Fan et.al. [54], developed a microfluidic LOC device for analysis of proteins in blood. The separation between plasma and red blood cells was also based on the Zweifach–Fung effect. Although the previous techniques have been proven to accomplish blood separation, they still need external accessories like pumps, valves and rotational systems to work, whereas in an autonomous LOC structure such elements should be integrated. Another published strategy to separate plasma employs a deep trench across the microchannel to capture red blood cells. This simple yet effective means of blood separation was reported by Dimov et.al. [55]. The device is made on PDMS and is sealed between two microscope glasses. The upper glass lid seals the LOC allowing only the input to be opened. On its surface, biotin-avidin lines are printed for fluorometric detection. Prior to use, the device was located and packaged in vacuum. So, when a small volume of blood is placed at the device input, it is propelled inside by the evacuated microchannels. Park et.al. [56] used Ratchet architectures in LOC devices for cells concentration. Lateral-flow configurations incorporate membranes for blood separation in Lateral flow immunoassay analysis (LFIA) devices [57]. LOC microchannels filled with beads is another alternative for blood separation [58]. When blood enters the channel, the plasma passes

Chapter 2. Autonomous Lab-on-a-chip for (bio)chemical sensing
15
through it, while the red blood cells are kept trapped in the spaces between beads. In urine samples the biomarkers are present at lower concentrations, so pre-concentration and purification are common procedures for urine preparation. There are commercial kits available for urine concentration and purification (e.g. ProteoSpinTM), which operate by spin column chromatography [59]. Several LOC solutions described for on-chip concentration [60, 61, 62, 63] could also be adapted into an autonomous LOC for cell phone reading. Preparation of saliva samples usually involves filtration, separation and concentration or amplification. Amplification using polymerase chain reaction (PCR) implies to combine the filtrated/separated sample with the suitable primers and then cyclically heat the solution. LOCs for PCR have been reported in the literature [64 , 65]. Pjescic, et.al. [66] developed a LOC for one-step genotyping from saliva. The disposable device was made of microscopic slides and double-sided tape. The tape was cut to create the channels, mounted on a glass slide equipped with microstructures (xurographic technique [67]) and sealed. This device integrates lysing, DNA melting and PCR analysis processes. The sample-analysis path is a single serpentine channel composed by 42 segments guiding the sample through a steady-state temperature gradient, optimized for either PCR or DNA melting analysis. A CCD camera was used for fluorescence readout. Although this LOC is a disposable and simple platform for DNA amplification and detection, it needs an additament for heating up the LOC, besides a camera for fluorescence measurement. Several mixer structures has been reported in Paper I (PDMS based), Papers II and III (direct 3D printed), and solutions for programmed sample preparation in Papers IV and V. 2.3. Transport / Reaction The control and timing of chemical reactions, that are based on passive control or manual operation, are relevant concepts for autonomous LOCs.

Chapter 2. Autonomous Lab-on-a-chip for (bio)chemical sensing
16
Paper-fluidics is well established for transport of substances. Lutz et.al. [68], demonstrated both the control of the arrival time of reagents to a specific reaction zone and the “shut-off” time of each reagent from a single source. Geometry and nitrocellulose combined in the same design define the time control. Autonomous capillary systems have been demonstrated by microfabrication, instead of paper. This option not only is compatible with classical LOC architectures, but also expands the possible detection techniques. Zimmerman et.al. [69], demonstrated that pump flow rates can be modulated by geometry, while Gervais et.al [70] developed a point-of-care immunodiagnostics that uses only capillary-driven microfluidics for sample transport. LOCs precise fabrication and surface conditioning are key parameters to use capillary forces for sample transport. Combination of paper-fluidics with classical LOC architectures, where paper is used as pump has been demonstrated by Kokaj [45]. In this device a suction pump is created by using a working fluid between two valves, the first valve is connected to the paper and the other to the analytical region. When the working fluid is finger-pressure-triggered, the fluid reaches the paper and becomes absorbent, creating suction in the analytical channel. Phase guide controlled flow is another way of timing control. This concept was show by Vulto et al. [71], and Hakenberg et.al. [72]. Using the meniscus-pinning effect, it was possible to control the advancement of the liquid-air interface, thus filling and emptying arbitrary geometries. Du et.al. [73], developed the “Slipchip”, a LOC for microfluidics transport and reaction, without using pumps or valves. The Slipchips are composed by two plates, where the first slides respect to the other, changing connections or overlapping areas in order to mix fluids in the process. The top plate has empty micro-wells, while the bottom plate has micro-wells prefilled with diverse reagents, as well as empty ducts which are complementary to the empty micro-wells of the top plate. When those empty geometries are aligned, they create a channel. After sample

Chapter 2. Autonomous Lab-on-a-chip for (bio)chemical sensing
17
loading, the top plate is slid respect to the bottom plate, mixing and reacting the confined sample volumes with the preloaded reagents. Applying the Slipchip concept, F. Shen et.al. [74], developed a digital PCR, Liu et. al. [75] implemented an immunoassays, and C. Shen et.al. [76], developed a Slipchip for studying bacterial chemotaxis. Qin et.al. [77] used a chemical reaction to drive the fluidics in a LOC. A Pt/Ag pin was finger-pushed in a reservoir containing a H2O2 solution triggering the catalytic generation of oxygen. The rising pressure is used to drive the fluidics, while the expansion produced by the oxygen is regulated by the H2O2 initial concentration. An empty chamber and the H2O2 concentration serve as protection mechanism to avoid damaging the LOC. They are set, so each time the Pt/Ag pin is re-inserted in the H2O2 solution, the oxygen pressure rises, and when the pin is withdrawn from the solution the pressure drops, modulating in this way the driving pressure. This concept has been used by Qin et.al. [77] to develop a LOC for whole human blood protein identification. In this thesis, several solutions for transport and reaction have been developed and reported in Paper I (3D printed template for PDMS embedded tubing and device for multilevel fluidics), Paper II ( 3D printed Unibody LOC (ULOC) with integrated connectors, hybrid ULOC-paper fluidic device), Paper III (ULOC with integrated check-valves for programming transport), Paper IV and V (ULOC with programmed transport and reaction) 2.4. Optical readout Cameras on cell phones have evolved over the years with clear improvement in pixel resolution and optical quality, whereas the intensity resolution has remained unchanged in 8 bits per channel. Cell phone cameras acquire color images, using a Bayer filter on the camera sensor. A Bayer filter is a matrix of optical band pass filters for high (red), middle (green), and low (blue) wavelengths within the visible spectrum (400 nm-600 nm). Cell phones acquire images with 8 bits color resolution for each of the red, green and blue channels. Although single-lens reflex (SRL) cameras have a 12 bits or 16 bits converter, those features are currently not present in cell phone cameras.
Chapter 2. Autonomous Lab-on-a-chip for (bio)chemical sensing
18
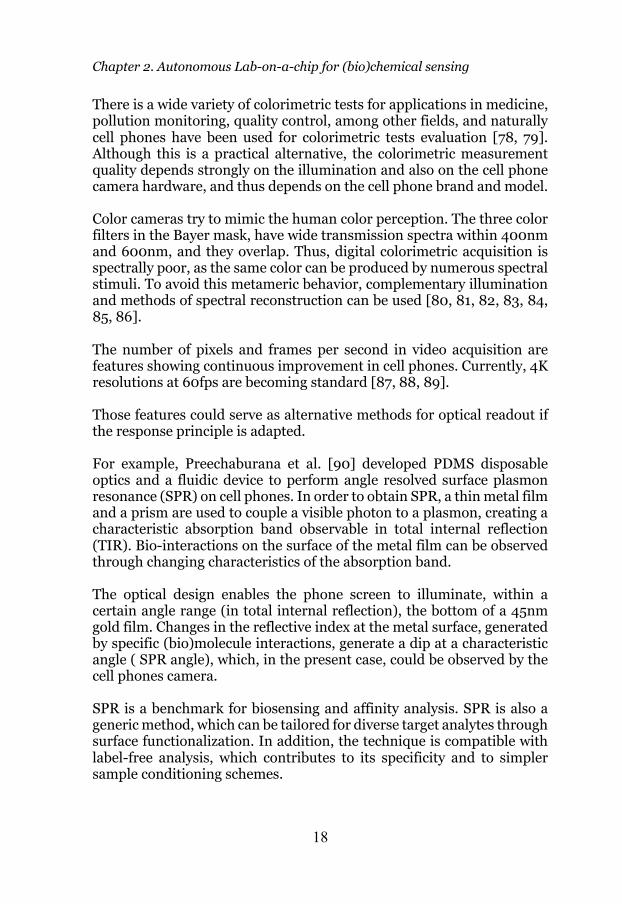
There is a wide variety of colorimetric tests for applications in medicine, pollution monitoring, quality control, among other fields, and naturally cell phones have been used for colorimetric tests evaluation [78, 79]. Although this is a practical alternative, the colorimetric measurement quality depends strongly on the illumination and also on the cell phone camera hardware, and thus depends on the cell phone brand and model. Color cameras try to mimic the human color perception. The three color filters in the Bayer mask, have wide transmission spectra within 400nm and 600nm, and they overlap. Thus, digital colorimetric acquisition is spectrally poor, as the same color can be produced by numerous spectral stimuli. To avoid this metameric behavior, complementary illumination and methods of spectral reconstruction can be used [80, 81, 82, 83, 84, 85, 86]. The number of pixels and frames per second in video acquisition are features showing continuous improvement in cell phones. Currently, 4K resolutions at 60fps are becoming standard [87, 88, 89]. Those features could serve as alternative methods for optical readout if the response principle is adapted. For example, Preechaburana et al. [90] developed PDMS disposable optics and a fluidic device to perform angle resolved surface plasmon resonance (SPR) on cell phones. In order to obtain SPR, a thin metal film and a prism are used to couple a visible photon to a plasmon, creating a characteristic absorption band observable in total internal reflection (TIR). Bio-interactions on the surface of the metal film can be observed through changing characteristics of the absorption band. The optical design enables the phone screen to illuminate, within a certain angle range (in total internal reflection), the bottom of a 45nm gold film. Changes in the reflective index at the metal surface, generated by specific (bio)molecule interactions, generate a dip at a characteristic angle ( SPR angle), which, in the present case, could be observed by the cell phones camera. SPR is a benchmark for biosensing and affinity analysis. SPR is also a generic method, which can be tailored for diverse target analytes through surface functionalization. In addition, the technique is compatible with label-free analysis, which contributes to its specificity and to simpler sample conditioning schemes.

Chapter 2. Autonomous Lab-on-a-chip for (bio)chemical sensing
19
Preechaburana et al. [90], used the number of pixels of the cell phone camera to measure the displacement the SPR dip angular coordinates upon reaction. The benefit is that the displacement recording is robust to ambient light variations, and the thousands of pixels used to the recorded dip position can provide better resolution than the 8 bit internally resolution. Another strategy for cell phone readout is attaching external lenses, or even microscopes to the cell phone. Using this alternative, malaria parasites [91], cells, bacteria and single DNA molecules [92] have been identified and analyzed. Depending on the magnification needed, this alternative usually leads to development of bulky and mechanical focusing-dependent devices. Lens-free digital holographic microscopy is an elegant option where the sample image is obtained digitally by reconstructing it from the holographic image produced by the combination of the illuminating light and the light that passes through the sample, which is projected on the raw image sensor. This technique has been used to visualize red and white blood cells, platelets, a waterborne parasite and microscopic particles [93]. Although this is a very powerful way for obtaining microscopic images, the cell phone hardware needs to be modified, removing the optics and enabling the hologram to be created on the raw sensor surface. In this thesis, LOC optical readout has been explored with the idea to use the camera of any unmodified cell phone, of any brand and model. The acquisition rate feature was instead investigated as alternative to colorimetry. The biochemical reactions used for detection were tuned, so they produce a peak of color response or have a consistent color change. Calibration is performed using high (H) and low (L) concentrations of the sample (S) to be measured. The time dependent behavior of the biochemical tests were video recorded with unmodified cell phones, for the measurement of glucose (Papers II, IV), H2O2 (Paper II) and glutamate (Paper V) concentrations. Finally, the use of the screen for illumination was also investigated in Paper V. Figure 4, illustrates a generic concept of an autonomous disposable device for cell phone analyses (ADDCA) discussing all the concepts summarized so far and published in Paper VI [94] .

Chapter 2. Autonomous Lab-on-a-chip for (bio)chemical sensing
20
Figure 4. Prototype of an autonomous disposable device for cell phone analyses (ADDCA). All the mechanisms for extraction/collection, transport and sample preparation are self-powered. Calibration range generation and a chemical response configured to best exploit unmodified cell phone camera readout resources. Reproduced from Paper VI [94] with permission from Elsevier.

Chapter 3. 3D printer, a platform for simplification of LOC fabrication
21
Chapter 3 3D printer, a platform for simplification of LOC fabrication 3.1. Soft lithography fabrication procedure for LOC Soft lithography LOC fabrication processes rely on the design and the use of templates generally fabricated using photo-lithography, where cleanroom facilities and special equipment are needed. In photo-lithography, a uniform thickness film of photoresist (commonly SU-8) is deposited on top of a substrate, usually using a spin coater (Figure 5, step 1). A mask is placed above the set, and UV light is used to harden the illuminated areas (Figure 5, step 2), and the following development process removes the areas that were not illuminated (Figure 5, step 3). The resulting SU-8 structure (all the features have the same thickness) serves as a template for LOC fabrication or can also be used as LOC structures depending on the design. Nevertheless, if different thicknesses are needed in the LOC structures, the previous steps need to be repeated, with the addition of mask alignment steps. For example, to fabricate a structure composed by a 100 µm height strip and a 1.50 mm pillar, as shown in Figure 5, six fabrication steps, the use of two masks, and one alignment procedure, are needed.
Figure 5. Steps for fabrication of SU-8 templates.

Chapter 3. 3D printer, a platform for simplification of LOC fabrication
22
The most used materials for LOC devices fabrication are polydimethylsiloxane (PDMS) and glass. PDMS is a silicone elastomer, which is transparent, non-fluorescent and biocompatible. The material has been used extensively in medical devices including implants [95]. After the template is ready, uncured PDMS is poured on the template, and heated to polymerize the PDMS. After the PDMS has cured on the template, it is peeled out, and such replica of the template is placed on a glass creating a LOC device. PDMS on glass devices constitute a prevalent LOC configuration and a comprehensive source of proven solutions [96]. The Dow Corning Sylgard® 184 kit was used during the experimental work to make the PDMS structures described in the papers. Developing and optimizing prototypes by this classical fabrication process, usually requires modifying the template several times and repeating the fabrication procedure which typically escalates the costs This classical process is inherently two-dimensional or 2.5D given the typical small thickness of the templates. The fabrication of complex 3D-LOC structures requires the user to repeat the fabrication, and stack structures. Multiple alignment and the use of several templates increase the fabrication complexity and budget. 3.2. Stereolithographic 3D printers and printing process Micro-stereolithography (MSL), is an additive micro manufacturing process that produces 3D microstructures by solidifying a photo-polymer layer by layer [97]. Stereolithographic (SL) 3D printers use the MSL additive process to create 3D objects and they entail three basic parts (Figure 6): The resin tank, with a transparent bottom to allow UV light to polymerizate the liquid resin contained in the tank.
The mobile base, the 3D object is created by adding layer upon layer of polymerized resin.
The projector, that illuminates the bottom of the resin tank with the pattern that defines each layer. Thus, when a 3D model is designed, a

Chapter 3. 3D printer, a platform for simplification of LOC fabrication
23
software slices the 3D model into 2D layers that define the illumination pattern for each layer of the printout. There are four important fabrication parameters: Exposure time, which is the time that each layer of the printout is exposed.
Printing speed, which is measured as how many mm/s in the Z direction it takes to print the model.
Vertical step size, which is the minimum possible displacement in the vertical direction. Smaller steps increase the resolution of the printout but take longer to print. For instance, the same model printed at 25µm resolution takes about 4 times longer than at 100 µm resolution.
X/Y resolution, is the smallest feature that the printer can create in the projection plane of each layer.
Figure 6. Generic diagram of a SL 3d printer. The additive fabrication procedure is performed in four steps: 3D model design, 2D slicing, projection and post processing.

Chapter 3. 3D printer, a platform for simplification of LOC fabrication
24
3D model design A computer added design program (CAD) is used to create the 3D model. In this thesis, Autodesk® Inventor ® Fusion, by Autodesk Inc. was used to create the CAD designs. The models were exported as STL (standard triangle language) extension files, a universal format interpreted by 3D printers. 2D slicing The CAD design, once uploaded to the printer as a STL file, is sliced perpendicular to the axis of fabrication, creating the 2D pattern used to expose each layer of the 3D printout (Figure 7).
Figure 7. CAD model of a device that has two mixers. Layers (1), (2) and (3) will be projected sequentially during the fabrication process. This direction of fabrication is a special case for LOCs fabricated using SLA printers.

Chapter 3. 3D printer, a platform for simplification of LOC fabrication
25
Choosing the slicing direction is extremely important. In some cases, if the slicing direction is not chosen properly, some features like channels cannot be created. Projection Two 3D printers were used during the experimental work, the “Miicraft” Digital Light Processing (DLP) 3D printer and the “FormLabs Form 1+” Stereolithographic (SLA) 3D printer. The DLP printer modulates light using a digital micromirror device (DMD). The DMD is composed of an 2D array of microscopic mirrors that move independently and, when illuminated, deviate the reflected light in different directions. This DMD and a set of lenses (DLP chip) ensure that each white pixel on the layer image (Figure 8), is focused at the bottom of the resin tank, and the black pixels in the image are focused elsewhere, creating enough contrast to only expose the bright pixels.
Figure 8. Schematic diagram of a DLP 3D printer.

Chapter 3. 3D printer, a platform for simplification of LOC fabrication
26
The SLA 3D printer is based on a mirror galvanometer which is a system composed of two tilting mirrors, aligned in the x and y directions and a UV laser. To expose a layer, the electronic controller commands the rotating mirrors to tilt (Figure 9), describing a 2D illuminating path to cure a resin layer.
Figure 9. Schematic diagram of a SLA 3D printer. In both printers the fabrication process is similar, as the illuminating patterns to define each layer are projected sequentially from the bottom of the tank containing the resin. Each image is projected for a certain time (“exposure time”). The “mobile base” lifts at a certain speed (“printing speed”) and with a defined step resolution (“vertical step size”). The 3D printers have following characteristics: Miicraft DLP 3D Printer (Miicraft®):
• X/Y Resolution: 450ppi (56 µm)

Chapter 3. 3D printer, a platform for simplification of LOC fabrication
27
• Z-Axis (single layer thickness): 100 µm.
• Build Size (footprint): 43 mm x 27 mm x 180 mm.
• Resin with proprietary (not disclosed) composition.
• Software provided: Miicraft Suite software (Rays Optics Inc.)
• Light source: UV LED.
Form1+ (FormLabs Inc.):
• X/Y Resolution: 300 µm
• Z-Axis (single layer thickness): 25 µm, 50 µm , 100 µm .
• Build Size (Footprint): 125 mm x 125 mm x 165 mm.
• Resin with proprietary (not disclosed) composition.
• Software provided: Preform software (FormLabs Inc.)
• Light source: UV Laser, 405nm. Post-processing In general, SLA models confine the curing process in the hours after printed. Some vendors also provide curing stations that provide a heated chamber with UV illumination to accelerate the completion of the curing process. Other post-processing procedures are specific to the process of the device.

Chapter 3. 3D printer, a platform for simplification of LOC fabrication
28
3.3. Resin chemistry The 3D printer resins have proprietary formulations, nevertheless the usual formulation for 3D printer resins includes an oligomer, a monomer and a photo-initiator. The mixture monomer/oligomer, when polymerized, grants specific characteristics to the final device, like hardness, heat resistance, impact strength, weatherability, chemical resistance, etc. [98]. The photo-initiator is usually a single molecule (type I photo-initiator) that absorbs a specific spectral band and thereby producing radical fragments [98]. The free radicals thus start to crosslink the double bounds in the monomer/oligomer mixture, polymerizing them. The conditions of viscosity and wetting behavior are critical to create a layer on top of the layer previously polymerized. The critical exposure energy (Ec) to cure the resin inside the tank is:
!! = !"#!"#$% (3.1)
$# = $
%.' %['] (3.2) Where !! : Critical exposure to cure the resin (mJ/cm2) !" : Energy per area that reaches the resin (mJ/cm2) "# : Curing depth (cm) #$ : Penetration depth (cm) $ : Molar extension coefficient (M-1 cm-1) [I]: Photo-initiator concentration (M) The 3D printer parameters “exposure time”, “printing speed” and “vertical step size” are configured for the resin chemistry. The light
Chapter 3. 3D printer, a platform for simplification of LOC fabrication
29
characteristics, the mechanical precision, in most printers, are pre-determined for each type of resin. 3.4 Fabrication of templates for PDMS LOC In order to eliminate the uncured resin, the templates were sonicated in industrial ethanol and then air-dried. Dry templates were UV irradiated in the Miicraft 3D printer post-curing chamber. Due to the particular composition of the Miicraft resin, the PDMS does not cure in contact with the polymerized material. Different procedures were tested empirically, and the solution for the Miicraft-blue-resin was found by sonicating the templates for 2 min in industrial grade ethanol, and immediately air drying the template, which was then coated with permanent ink. 3.5. Fabrication of LOC (ULOC) structures After printing, structures were cleaned from uncured resin by sonication in ethanol and then drying with air. ULOC structures are designed with channels and connections open on at least one side. This feature facilitates the removal of uncured resin, enables the fabrication of arbitrary long channels and contributes to the fidelity of the printed geometries. In the case of the Form 1+ printer the surface roughness is significant, and to allow the correct tape adhesion, the ULOC surface was polished with sand paper, rinsed with industrial ethanol, and once dried sealed with tape. The Miicraft printer produces remarkably smooth surfaces in the standing plane, and the devices are printed in the Z direction of the Figure 8, to exploit this property and to minimize printing time. The sub-micrometric surface roughness enables direct taping of the open structures without any additional surface treatment.

Chapter 3. 3D printer, a platform for simplification of LOC fabrication
30
3.6. Fabrication of optical components After 3D printing and regular cleaning, the parts where optical transparency are needed (for instance in integrated lenses) were converted with a simple step. Accordingly, uncured resin was deposited on the printed part and spread out on the surface, taking care that no bubbles are formed. Then a UV light is used to harden the coating. Two ways were developed: -Illuminating the surface using a UV lamp. - Scanning all the surface with a UV laser. 3.7. Advantages and disadvantages of 3D printed LOC fabrication Advantages: - Economy of prototyping
A central advantage of 3D printed LOC, is the versatility to create complex structures with any number of 3D features with a single step, using inexpensive resources, such as SLA and DLP 3D printers, and without requiring clean rooms. In addition, the fabrication is transferred from painfully acquired microfabrication-skills to a process carried out by a machine. The economy of 3D printed LOCs increases drastically with the complexity of the design. The optimization of a model, which is a process that requires repeating the fabrication and testing of a device until the optimum performance is achieved, is easier. In this thesis, it is shown that using inexpensive SLA or SLA-DLP 3D printers, it is possible to fabricate LOCs devices efficiently, with less steps, and without specialized equipment or facilities for microfabrication. In classic fabrication, a structure with 6 thickness levels, as shown on Figure 10, requires minimally 1 spin-coating, 1 exposure, and 1 development for each level. In addition it involves 6 different masks and 5 alignment procedures. All of those must be carried out by trained operators, and modifications involve time and money to create new masks and define processes.

Chapter 3. 3D printer, a platform for simplification of LOC fabrication
31
In contrast, for any number of levels, 3D printed structures involve only one manufacturing step, and is carried out by the printer. Modification along the development interaction cost the same no matter the number of changes and an entirely new ULOC design can be fabricated and tested within the hour.
Figure 10. (a) multilevel 3D design for PDMS LOC template (b) 3D printout. And comparison of fabrication steps between 3D printed and classic fabrication. Adapted from Paper I by permission of The Royal Society of Chemistry. Disadvantages:
- Resolution. The main disadvantages of the 3D printed LOCs are the resolution and lack of well-defined material. The DLP 3D printer used in this work has a resolution of ~56µm on the plane and 50µm in the vertical, whereas the SLA has 300µm horizontal resolution and up to 25µm vertically. In these conditions, it was possible to fabricate fully operative templates for

Chapter 3. 3D printer, a platform for simplification of LOC fabrication
32
LOC on PDMS with multiple level features, integrated multilayer LOCs (Unibody LOC), service structures such check valves, flow connectors for manual pumps and optical devices. Certainly, if the size of the structures would have required to be smaller, then, the classical method of fabrication would have been necessary. Nowadays, it is possible to acquire more precise 3D printers like the Photonic Professional GT from Nanoscribe, which has sub-micrometric resolution and is based on two-photon polymerization. Naturally, the price of this technology is higher (around 500K USD, while the 3D printers used for this thesis are around 5K USD). However, it is also worth noticing that 3D printers can produce structures with remarkably large aspect ratios. For instance a 500µm feature can be hundreds of mm high. In many cases the high resolution in classical fabrication is required to control the aspect ratio of structures which are very shallow (2.5D). The results in many cases is that the chip operates at slow flow rates, limited by the pressure the structure can take. Associated with this, the flow regime is typically laminar, which complicates mixing. On the other hand, 3D printed LOCs profit from larger cross sections that facilitate mixing in regular channels [99]. The other disadvantage of 3D printed LOCs is the material. Most of the resins used acrylates and are not biocompatible, nevertheless nowadays, efforts have been made to have biocompatible resins and there are already some resins commercialized for dentistry.
- Fabrication time. As most additive manufacturing processes, the fabrication of a 3D LOC is done layer by layer, so fabrication is not suitable for high-throughput. Nevertheless, for prototyping, as in the case of this thesis, the additive fabrication has shown to be an excellent alternative enabling to make LOCs (integrating microfluidics and optics) with great versatility to iterate and optimize designs, and at the fraction of the time and cost of classical fabrication.

Chapter 4. Unmodified cell phone time resolved measurements for LOC optical readout.
33
Chapter 4
Unmodified cell phone time resolved measurements for LOC optical readout. A cell phone recorded video is a time-lapse picture series and can be represented by the matrix: " = "!,#,$..&,' (4.1) Where i, j, 1..3, f are the number of horizontal (i) and vertical (j) pixels of colour image frames (f) in the video, with 1..3 representing the red, green and blue colour layer of information of each frame. When imaging a LOC, and to collect the response of the system, not all areas of the image are relevant for evaluation, hence regions of interest (ROIs) are defined, for instance where the device produces the optical response. If a test responds in one particular colour channel, only that colour dimension is used for evaluation of the ROIs intensity. Thus, if infor-mation is for example only in the red channel, ROIs are processed as:
!"##%&'%()&*+&&),'& =∑ ∑ !",$,1,&"=1..)*=1..+
)+ , ∀), 01!"#" (4.2) i, j keep it consistent with equation 4.1. Where: K: number of rows in the ROI. L: number of columns in the ROI. &: for a video acquired at 30 frames/s, the t resolution is 1/30=33 ms.

Chapter 4. Unmodified cell phone time resolved measurements for LOC optical readout.
34
In this thesis, the frame acquisition rate feature was used as alternative to colorimetry for the LOCs biochemical measurements. Cell phones are not analytical instruments, and quantitative measurement cannot rely on a device calibration. Instead, a fresh quantitative range is measured in each detection by integrating such ranges in the LOC. The biochemical measurement LOCs reported in Papers II, IV and V integrate three optical readout zones and their ROIs correspond to high (H), sample (S) and low, or control (C), concentrations. Figure 11 schematizes the intensities of the three ROIs computed using the equation (4.2). The values, where the largest difference between H, S and C concentrations occurs, were used to calculate sample concentration.
Figure 11. Schematic the intensity of a channel video, where the largest difference between Control, Sample and High concentration occurs is highlighted by a rectangle.

Chapter 5. Papers in this thesis
35
Chapter 5
Papers in this thesis 5.1. 3D Printing PDMS LOC (Paper I) This study demonstrates that it is possible to use a MS-DLP 3D printer (Miicraft ®) for micro-fabrication of templates for soft lithography and for development of PDMS LOCs . This procedure overcomes the limitations of classical fabrication methods, regarding the requirement of special equipment, facilities and training for microfabrication of photoresist templates (SU8 or similar). The procedure reduces the number of fabrication steps involved in classical photo lithographic methods. Not only does the economy of fabrication efforts drastically improve with the complexity of the architecture, but the remarkable aspect ratios achievable with 3D printers enable use of pillars several millimeter high combined with 100µm deep channels to created guides for enabled tight connectors to external services (Figure 12). During this work the problem generated by the resin, that does not allow the PDMS to cure, was solved by ink coating the finished template. The development of multiple height features, fabricated with a single template (Figure 12), was demonstrated; a chaotic mixer supported by 3D printed templates for PDMS; and the fabrication of multilevel PDMS LOC, with cell phone optical readout for glucose quantification. A template combining vertical structures with heights that range from 2.0 mm down to 50 µm was designed and fabricated. These capabilities were used to connect directly 1.6mm external tubing to 50 µm microfluidic channels (Figure 12 (a)). Patterns observed in Figure 12 (b) correspond to the pixel size projected at the tank bottom, which, despite of being visible in the figure, do not affect the remarkable surface roughness of less than 200 nm.

Chapter 5. Papers in this thesis
36
Figure 12. (a) CAD design of a multidimensional template for PDMS LOC with features of 50 µm and 2 mm in the same design. (b) 3D printout of the structure in (a). (c) Pillar guide for tubing integration. (d) Tube-channel connection embedded in the PDMS. Adapted from Paper I with permission of the Royal Society of Chemistry.
Figure 13. (a) CAD design containing both mixers, diffusional and chaotic. The pillars serve as guides for silicone tubing integration and the external frame avoids the PDMS to pour out during curing. The image corresponds to the cured PDMS replica with integrated tubing, before it is extracted from the template. (b) Diffusion mixer showing a mixture of 1 mM fluorescein with 1 mM rhodamine B (c) Chaotic mixer imaged in the same conditions as in (b). Adapted from Paper I with permission of the Royal Society of Chemistry.
(b)
(c)
(a)

Chapter 5. Papers in this thesis
37
To validate the 3D printing of templates for PDMS on glass, a chaotic-mixer (Figure 13) was demonstrated. A regular microfluidic serpentine, created with a 3D printed template, operates identical to the classical counterpart, and mixing between laminar flows occurs only by diffusion, making the process very inefficient (Figure 13 (b)). Diverse complex configurations exist to improve the mixing efficiency of such a design. One that tests the resolution of the technique, involves the construction of a chaotic mixer (Figure 13 (c)), that improves the mixing efficiency by successive expansions of the flow along the channel. In this article, it is demonstrated that the 3D printed templates are capable of resolving the geometric details necessary to accomplish such a chaotic mixer. In order to demonstrate the feasibility of multilayer LOC fabrication, two templates for PDMS casting were printed following the established procedure. The templates were designed specifically in a way, that the PDMS casted structures were complementary (Figure 14). The upper contains service structures for external tubing and the lower closes microfluidic channels and creates a measurement chamber. To test the device, the PDMS measure chamber was functionalized with a (bio)chemical assay based on glucose oxidase (GOx), horseradish peroxidase (HRP) and a non-coloured substrate (Amplex Red), and was used for glucose detection. During the reaction process, the colour of the test mixture goes from colourless to red fluorescent, and returns to colourless. The time in which the colour reaches a red peak depends on the samples glucose concentration.

Chapter 5. Papers in this thesis
38
Figure 14. (a) CAD designs for multilevel fluidics. The PDMS replica from the lower template is flipped respect to the ss’ axis and the measurement chamber is functionalized. The upper PDMS replica is placed on the lower, creating the interconnections and sealing the multilevel device. (b) Initial time before injecting fluorescein (c) After injecting fluorescein during 130 ms. The device shows excellent sealing and multilevel channels connections. Adapted from Paper I with permission of the Royal Society of Chemistry. To measure the time-dependent biochemical glucose test, a Samsung Galaxy Note 2 rear camera was used to record a video (30 fps, Full HD). The LOC was placed on a glass stage, where the back of the device was illuminated with an Ipod Touch screen, set to pure white (255, 255, 255). Figure 15 shows the dynamical response of the chemical reaction and its correlation with the glucose concentration.
Lower template
Upper template

Chapter 5. Papers in this thesis
39
Figure 15. Response of the time-dependent biochemical test for glucose concentrations of 2.5 mM, 5 mM and 10 mM . Images of the measurement chamber showing changes in colour for control and 10 mM glucose concentration. Adapted from Paper I with permission of the Royal Society of Chemistry. 5.2. Unibody LOC (Paper II) Unibody LOCs (ULOC) are designed and fabricated as monolithic 3D printouts incorporating all the architectural features necessary to host functional components. ULOCs can adopt to endless configuration possibilities, essentially reproducing most functions possible by classical fabrication. ULOC geometries were designed with open channels to enable the release of uncured resin. Once cleaned, the channels were sealed with tape. The ULOC body was designed so it can integrate connectors for tubing, multilevel microfluidic channels, detection and readout zones for three solutions: control (C), sample (S), high-level (H). They are running inside three independent microfluidic channel circuits, such as shown in Figure 16 (a). After passing by the measurement/readout zone (sector 2), the microfluidic channels are united to a single ULOC waste reservoir (sector 3). A PDMS slab was functionalized with a H2O2 fluorescent detection chemistry and placed on sector 2 (detection region) of the ULOC.

Chapter 5. Papers in this thesis
40
Silicon tubing was connected at the three ULOC inputs. 3 µl of solution with different concentration of H2O2 were pipetted into the silicone tubes. The samples were manually pumped to the detection region using a Teflon tube plugged to a syringe. The ULOC incorporates the Control (C) and High concentration (H) reference samples, which is crucial for an autonomous LOC using this kind of measurements, because it counteracts uncertainty of reference condition by integrating the calibration range in each measurement.
Figure 16. (a) Unibody CAD design. (b) Fluorescence image of the detection region for three H2O2 concentrations, control (C), sample (S) and high level (H). (c) Time response plot of the H2O2 assay for the three concentrations. The rectangle indicates the interval used for response quantification. Adapted from Paper II with permission of the Royal Society of Chemistry. Paper fluidics drive the flow by capillarity forces and thus is a popular passive alternative for autonomous LOC. A hybrid ULOC with paper fluidic was also integrated in Paper II and demonstrated for glucose detection. Figure 17 (a) shows open ULOC channels, which have been filled with cellulose paste. When the cellulose was dried, in the
Detection region

Chapter 5. Papers in this thesis
41
measurement zones (functionalized tracks), a colorimetric glucose (bio)chemical test (“iodine test”) was deposited at the detection regions for the glucose solutions of high concentration (H, 10 mM), control (C, no glucose) and the sample (S).
Figure 17. (a) Image of the hybrid ULOC. The channels are filled with cellulose powder and functionalized for glucose detection, transforming the ULOC into a lateral flow analysis device. (b) Time response of the glucose assay for samples with different concentrations: control (C), 5 mM (S) and 10 mM (H). Inside the rectangle are highlighted the signals at the steady response on a dry assay. (c) Calibration curve for quantification of the glucose concentration obtained from the signals at the steady response. Reproduced from Paper II with permission of the Royal Society of Chemistry. The response (formation of brown iodine) was measured dynamically taking a time-lapse 20 s images using a Galaxy Note 2, 8 Mpx rear side camera. The measurement was done analysing the green channel of the image and when the cellulose was completely dried (Figure 17 (b), (c)).
Functionalized tracks

Chapter 5. Papers in this thesis
42
Paper fluidics is one of the most popular biosensor configurations, used for example in lateral flow immunoassays (LFIA), such as in pregnancy tests. The other existing alternative are 3D paper fluidics and paper analytical devices (PAD) developed in the past decade. To our knowledge, the hybrid ULOC paper configuration was the first adding an alternative to the other two, when it was published. Three ULOC mixers with 400 µm wide x 200 µm deep channels were designed (Figure 18 (a)). The first is a diffusion mixer (Figure 18 (b)), the second has a hole in the mixing point (Figure 18 (c)), and the third is similar to the previous, but glass beads were placed inside the mixing point reservoir (Figure 18 (d)). To characterize them, 1 mM fluorescein and 1 mM rhodamine B flowed at 30 µl min−1. As expected, the mixer with the beads is more effective, due to the creation of turbulences at the mixing point.
Figure 18. ULOC mixers. (a) CAD design of the through hole ULOC mixer showing how glass beads are placed. (b) Diffusion mixer image. The “x” symbol shows the position were the two solutions, 1 mM fluorescein and 1 mM rhodamine B, mix. (c) Mixer with a through hole, the flows mixed earlier. (d) Mixer with through hole filled with microbeads. The mixing is faster than (b) and (c). Reproduced from Paper II with permission of the Royal Society of Chemistry.

Chapter 5. Papers in this thesis
43
5.3. ULOC for programmed transportation: Unidirectional Valves (Paper III) Check-valves are fluidic elements that enable the liquid to flow only in one direction. Such fluidic diodes contribute to programmed flow circuits, necessary to autonomous LOC development. The test ULOC was designed with two input microfluidic channels entering, from below 1 mm-deep, 2 x 3 mm2 microchambers (Figure 19 (a)). Inside the microchamber, a flexible PDMS element bends, allowing the fluid to pass in the forward direction. If the fluid comes from the other opposite direction, it presses the PDMS slab again the ULOC structure, preventing the backward flow. To characterize the ULOC check-valves, 100 ms pressure pulses of colored water were delivered by a microinjector. Figure 19 (b) shows no backward flow with pressure up to 70 Psi. Figure 19 (c), shows the flow rate versus pressure behavior in the entire tested range. Figure 19. (a) Digital design of the ULOC containing two check-valves. (b) Valves characterization, the flow behavior was video recorded while controlled pressure pulses were introduced into the channels. (c) Forward and back pressure pulses, 100 ms-long, with pressures between 10 psi and 70 psi were used to test the valves response. No backward flow was found at 100 psi. Reproduced from Paper III under the open access license.

Chapter 5. Papers in this thesis
44
5.4. ULOC for microfluidic programmed transport, conditioning, reaction, optical readout and optical coupling for universal cell phones (Paper IV) Programming fluidic transport is an important step towards autonomous LOC development. Inside the chip, precise volumes of samples and reagents need to be mixed in a certain sequence. Also, for an optical readout, the autonomous LOC should integrate the optics and, as the objective of this thesis, the measurement should be done with an unmodified cell phone. This study (paper IV) shows the fabrication of a disposable ULOC with programmed transport and optical glucose measurement, the development of ULOC optics, and the use of the system as an autonomous chemical sensing interface for universal cell phone readout. The autonomous LOC is based on two parts; first, a microfluidics ULOC where pump, check-valve, microfluidic circuitry for mixing of fixed volumes of sample and reactants, and functionalized glucose measurement area are integrated, and second, an optical component, which consists of a 3D printed lens, that serves as coupler for unmodified cell phone optical readout. The fluidics ULOC (Figure 20 (a)) is located on top of the optics and sits on the cell phone camera. The lens depth of field was optimized to image the measurement area with different cell phone models and an Ipod, see Figure 20 (b). At 5 mm distance between microfluidics ULOC and ULOC lens, the ULOC microfluidics measurement area is focused enough for all following different cell phones: Nokia 6720 classic, Galaxy Note 2, Galaxy S3 mini and iPodTouch 4th Generation. The microfluidics (Figures 21 (a-c)) was designed to hold a volume of 5 µL of reference high glucose concentration (10 mM), low glucose concentration (2.5 mM) and a sample (5 mM). It also integrates reagent 1 (r1), which is a 0.5µL mixture of glucose oxidase (GOx) and horseradish peroxidase (HRP), and reagent 2 (r2), Ampliflu Red (substrate for HRP).
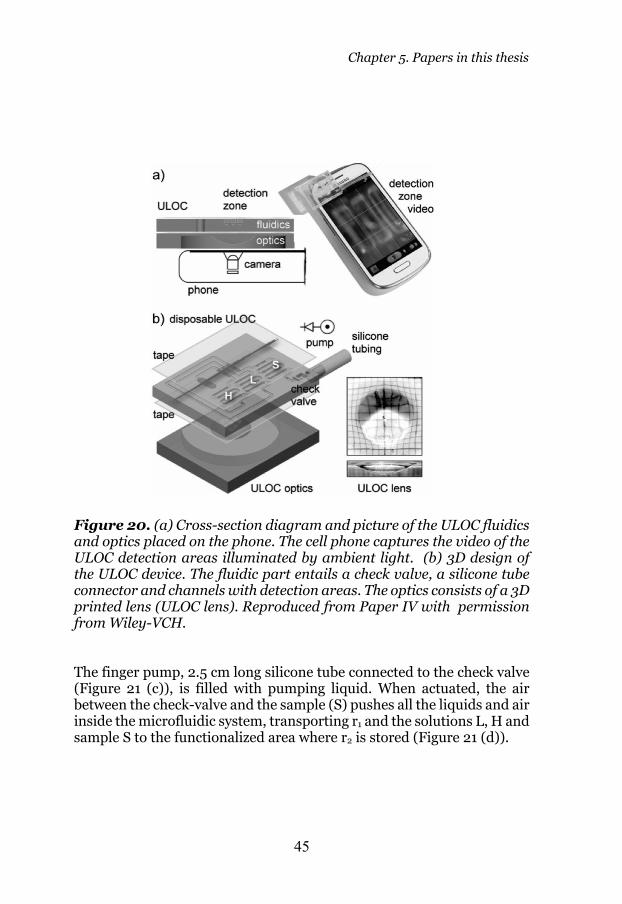
Chapter 5. Papers in this thesis
45
Figure 20. (a) Cross-section diagram and picture of the ULOC fluidics and optics placed on the phone. The cell phone captures the video of the ULOC detection areas illuminated by ambient light. (b) 3D design of the ULOC device. The fluidic part entails a check valve, a silicone tube connector and channels with detection areas. The optics consists of a 3D printed lens (ULOC lens). Reproduced from Paper IV with permission from Wiley-VCH. The finger pump, 2.5 cm long silicone tube connected to the check valve (Figure 21 (c)), is filled with pumping liquid. When actuated, the air between the check-valve and the sample (S) pushes all the liquids and air inside the microfluidic system, transporting r1 and the solutions L, H and sample S to the functionalized area where r2 is stored (Figure 21 (d)).

Chapter 5. Papers in this thesis
46
Figure 21. (a) Fluidic part of the device, highlighting the areas reserved for reagent 1 (r1, 0.5 µL), and reagent 2 (r2, 0.5 µL). (b-c) Device filled-up with 5µL solutions of low reference concentration (L), high concentration (H) and sample (S). (d) Fluid transport when the finger pump is activated. Adapted from Paper IV with permission from Wiley-VCH. To record the glucose response, a Galaxy S3 Mini was used to acquire a video of the fluidic ULOC measurement area, and the optical coupling between the measurement area and the cell phone camera, was provided by the printed lens. Following the digital image analysis described in Chapter 4, the intensity values in the green channel, at the ULOC r2 areas (Figure 21 (a)), for H, S and L concentrations, were computed. Figure 22 (a) shows the plots of the variation in intensity in the green channel for the H, L concentrations and the sample (S). Times for maxima were computed, and S time was transformed to concentration using the calibration samples H, L (Figure 22(b)).

Chapter 5. Papers in this thesis
47
Figure 22. (a) Assay responses to 2.5 mM (L), 5 mM (S) and 10 mM (H) glucose concentrations. The average intensity in the green channel within the regions of interest (ROIs) vs. time. (b) Linear calibration for glucose concentration based on H and L values. Error bars are shown increased 100 times. Reproduced from Paper IV with permission from Wiley-VCH. 5.5. Autonomous 3D printed device for (bio)chemical detection using cell phones (Paper V) The development of an autonomous LOC for (bio)chemical detection using unmodified cell phones was reported in Paper V. In this device, the cell phone screen can be used as controlled light source, which is shown on a (bio)chemical test for glutamate. The device is based on two ULOCs, a microfluidic ULOC that integrates a finger pump, check-valve, mixers, a detection region based on a (bio)chemical test for measure glutamate concentration, and an optical ULOC that contains a prism, that uses the cell phone screen to illuminate the microfluidics ULOC detection zone, plus a lens for direct optical coupling with the cell phone camera and illumination (Figure 23).

Chapter 5. Papers in this thesis
48
Figure 23. (a) Fully integrated fluidic-optical ULOC for glutamate quantification with unmodified cell phone readout. The screen provides the illumination and the camera the image acquisition. (b) 3D design of the geometries for fluidics and optical elements. Adapted from Paper V with permission of The Royal Society of Chemistry. After printed, the same resin was used to coat the optical components in the ULOC, and the device was irradiated with UV light to cure the resin. In the case of the prism and plane surfaces, a Teflon film was placed on the plane coated parts and then UV cured. Also in this work, 3D printed optical devices such as lenses and waveguides (Figure 24) were fabricated and characterized.

Chapter 5. Papers in this thesis
49
Figure 24. (a) 3D printed Lens with 1.530 magnification. (b) Waveguide not coated (left), coated and laser illuminated (right). (c) 3D printout of convex lens designs with radii 3 mm, 2 mm, 0.8 mm and 0.4 mm. Upper pictures, cleaned printout, lower pictures resin coated. Adapted from Paper V supplementary information by permission of The Royal Society of Chemistry. In the microfluidic ULOC, a programmed sequence for reagent-sample mixing was implemented. Three microfluidic circuits are connected to the check-valve, so when the pump actuates, the loaded volumes of H, S, L (High, “unknown”-Sample and Low concentrations) are pumped, and the air trapped between liquids makes the reagents move to the ULOC detection regions (Figure 25 (a)). After 6 s pumping, the solutions are mixed with the reagents r1 and r2 at the ULOC detection region. Using a Galaxy S3 mini cell phone, the ULOC optical response was video recorded at 30 fps. Performing the digital image processing described at Chapter 4, the signal intensity in the green channel was obtained (Figure 25 (b)). Because after 160 s no stabilization of the response signal is detected, the cumulative intensity was computed between 35 s and 40 s (Figure 25 (c)). Each point corresponds to the cumulative of 1 s at 30 fps.

Chapter 5. Papers in this thesis
50
The quantitative computation of the unknow S concentration was done using the calibration points H, L (Figure 25(d)).
Figure 25. (a) Microfluidic ULOC for programmed mixing at t0 (b) average intensity signal in the green channel for solutions (H,S,L) mixed with reagents at detection region. (c) Cumulative intensity for H, S and L samples computed between 35 s and 40 s. (d) Computation of the unknown sample concentration (S) by linear calibration of known concentrations. Adapted from Paper V with permission of The Royal Society of Chemistry.
loaded solutions H, S, L
reagents (r1, r2) mixed with each solution (H, S, L)

Chapter 6. Conclusions
51
Chapter 6
Conclusions This thesis, based on five published papers, gives solutions towards the development of autonomous Lab-on-a-chip systems, and their use with an unmodified universal cell phone, which nowadays is the most used and wide-spread computer-capable, broadband-connected device in the world. To develop this autonomous disposable device for cell phone analyses, the capability to implement optical-time-dependant (bio)chemical reactions was combined with the capacity of a cell phone to record videos and time-lapsed images. This strategy is more robust than colorimetric measurements, and extracts better resolution using literally the same camera. Also in this thesis 3D printing, specifically using Micro-Stereo Lithographic low-cost commercial 3D printers with resolutions between 50 µm and 100µm, has been explored as a platform for LOC fast prototyping. Using this platform and the developed surface treatments, 3D printed templates for microfluidic PDMS LOCs have been developed and examples of PDMS-on-glass LOC and multilayer PDMS LOC were reported in Paper I. Unibody LOC (ULOC) entails a monolithic 3D printout that has all LOC major geometries. To be functional, these systems need to be sealed, and if needed, connected to tubing to load reagents, possess pre-functionalized surfaces, etc. All LOCs reported in papers II, III, IV and V have been fabricated using this method. Several solutions towards autonomous LOCs have being demonstrated including: in-chip ULOC micromixers, check-valves, connectors for external tubing-microfluidic channels interfacing and optical components for readouts including quantitative enzymatic detection for universal cell phone.

Chapter 6. Conclusions
52

Chapter 7. Future Work
53
Chapter 7
Future Work New low-cost consumer-grade 3D printers come to the market each year. In this thesis, the capabilities of MSL-DLP-3D and SLA-3D printers have been demonstrated for microfluidic LOC fabrication. Fabrication time depends on the complexity of the design, but this time will decrease as new faster printers will be deployed in the market. Resolution is another parameter that has evolved over the last years. Nowadays 3D printers based on two photon polymerization [100] give sub-micrometre resolution, but they are still expensive, which restricts widespread use. Nevertheless, they appear as an option for fast, high-resolution LOC prototyping. Near Field Communication (NFC), is a protocol implemented in several cell phones which enables users to power and communicate wirelessly with external circuits. NFC based sensors for food safety and healthcare have been reported [101]. This is interesting option for implementation of electrochemical readout in autonomous disposable devices for cell phone analyses. Currently, low-power-low-cost potentiostat-in-a-chip [102] and NFC electronics are available. This opens research opportunities like fabrication of microelectrodes, and development of low-power-low-cost NFC electronics for autonomous solutions. Another area of focus could be the study of transport mechanisms. In this thesis, the liquid transport in the LOC channels was done by pressure difference or capillarity. Electrowetting-on-dielectric is an effect in which the contact angle of a polarizable liquid on a hydrophobic surface changes due to the application of voltage, forcing the liquid to move. Digital microfluidics platforms [103], in which instead of microchannels, drops of samples or reagents move, electrically driven, over a matrix of electrodes, could benefit from 3D printing for creating hybrid platforms.

Chapter 7. Future Work
54

Bibliography
55
Bibliography [1] Y. H. Ghallab, Lab-on-a-chip: techniques, circuits, and
biomedical Applications, Artech House publishing, 2010, Norwood Massachusetts, pp. 1-2.
[2] G. M. Whitesides, The origins and the future of microfluidics, Nature, 2006, 442, 368-373.
[3] O. N. Tufte, P. W. Chapman, D. Long, Silicon Diffused-Element Piezoresistive Diaphragms, J. Appl. Phys, 1962, 33, 3322-3327.
[4] L. M. Roylance and J. B. Angell, A batch-fabricated silicon accelerometer, IEEE Trans. Electron Devices, 1979, 26, 1911-1917.
[5] L. Kuhn, N. Bassous, R. Lane, Silicon Charge Electrode Array for Ink Jet Printing, IEEE Trans. Electron Devices, 1978, 25, 1257 – 1260.
[6] S. C. Terry, G. H. Jerman, J. B. Angell, A Gas Chromatographic Air Analyzer Fabricated on a Silicon Wafer, IEEE Trans. Electron Devices, 1979, 26, 1880–1886.
[7] J. M. Bustillo, R. T. Howe, R. S. Muller, Surface Micromachining for Microelectromechanical Systems, Proc. IEEE, 1998, 86, 1552-1574.
[8] A. Manz, N. Graber, H. M. Widmer, Miniaturized Total Chemical Analysis Systems: A Novel Concept for Chemical Sensing, Sens. Actuators B, 1990, 1, 244–248.
[9] D.R. Reyes, D. Iossifidis, P. Auroux, A. Manz, Micro total analysis systems. 1. Introduction, theory, and technology, Anal. Chem, 2002, 74, 2623-2636.
[10] D.C. Duffy, J.C McDonald, O.J.A. Schueller, G.M. Whitesides, Rapid Prototyping of Microfluidic Systems in Poly(dimethylsiloxane), Anal. Chem, 1998, 70, 4974-4984.

Bibliography
56
[11] M. A. Unger, H. P. Chou, T. Thorsen, A. Scherer, S. R. Quake, Monolithic microfabricated valves and pumps by multilayer soft lithography, Science, 2000, 288, 113–116.
[12] J. C. Love, D. B. Wolfe, H. O. Jacobs, G. M. Whitesides, Microscope Projection Photolithography for rapid prototyping of masters with Micron-Scale features for use in Soft Lithography, Langmuir, 2001, 17, 6005-6012.
[13] K. Itoga, J. Kobayashi, Y. Tsuda, M. Yamato, T. Okano, Second-Generation Maskless Photolithography Device for Surface Micropatterning and Microfluidic Channel Fabrication, Anal. Chem, 2008, 80, 1323-1327.
[14] P. Preechaburana, D. Filippini, Fabrication of monolithic 3D micro-systems, Lab Chip, 2011, 11, 288-295.
[15] K. V. Wong, A. Hernandez, A review of additive manufacturing, ISRN Mechanical Engineering, 2012, 2012:208760 doi:10.5402/2012/208760.
[16] MakerBot Industries, LLC, Makerbot 3D printers, https://www.makerbot.com/3d-printers, accessed: January 29th, 2020.
[17] Ultimaker B.V, Ultimaker 3D printers, https://ultimaker.com/3d-printers, accessed: January 29th, 2020.
[18] A. Lee, The third decade of microfluidics, Lab Chip, 2013, 13, 1660-1661.
[19] P. J. Kitson, M. H. Rosnes, V. Sans, V. Dragone, L. Cronin, Configurable 3D-Printed millifluidic and microfluidic ‘lab on a chip’ reactionware devices, Lab Chip, 2012, 12, 3267–3271.
[20] G. Comina, A. Suska, D. Filippini, PDMS lab-on-a-chip fabrication using 3D printed templates, Lab Chip, 2014, 14, 424-430.
[21] G. Comina, A. Suska, D.Filippini, Low cost lab-on-a-chip prototyping with consumer grade 3D printer, Lab Chip, 2014, 14, 2978-2982.

Bibliography
57
[22] W. Jung , J. Han, JW. Choi, C. H. Ahn, Point-of-care testing (POCT) diagnostic systems using microfluidic lab-on-a-chip technologies, Microelectronic Engineering, 2015, 132, 46–57.
[23] International Telecommunication Union (ITU), Global and regional ICTD data, download time series of ICT data for the world by geographic regions and by level of development for the following indicators (2005-2019; excel), https://www.itu.int/en/ITU-D/Statistics/Pages/stat/ accessed: January 24th, 2020.
[24] G. Comina, A. Suska, D. Filippini, 3D Printed Unibody Lab-on-a-chip: Features Survey and Check-Valves Integration, Micromachines, 2015, 6, 437-451.
[25] G. Comina, A. Suska and D. Filippini, Autonomous Chemical Sensing Interface for Universal Cell Phone Readout, Angew. Chem Int. Ed, 2015, 54, 8708-8712.
[26] G. Comina, A. Suska, D. Filippini, A 3D printed device for quantitative enzymatic detection using cell phones, Anal. Methods, 2017, 8, 6135-6142.
[27] M. I. Mohammed, S. Haswell, I. Gibson, Lab-on-a-chip or Chip-in-a-lab: Challenges of commercialization lost in translation, Procedia Technology, 2015, 20, 54–59.
[28] C. H. Ahn, J. Choi, G. Beaucage, J.H. Nevin, J. Lee, A. Puntambekar, J. Y. Lee, Disposable smart lab on a chip for point-of-care clinical diagnostics, Proc. IEEE, 2004, 92, 154–173.
[29] X. Qiu, J. A. Thompson, Z. Chen, C. Liu, D. Chen, S. Ramprasad, M. G. Mauk, S. Ongagna, , C. Barber, W. R. Abrams, D. Malamud, P. L. A. M. Corstjens, H. H. Bau, Finger-Actuated, Self-Contained Immunoassay Cassettes, Biomed. Microdevices, 2009, 11, 1175–1186.�
[30] A. Floris, S. Staal, S. Lenk, E. Staijen, D. Kohlheyer, J. Eijkel, A. van den Berg, A prefilled, ready-to-use electrophoresis based lab-on-a-chip device for monitoring lithium in blood, Lab Chip, 2010, 10, 1799–1806.

Bibliography
58
[31] R. Bharadwaj, A. K. Singh, Autonomous Lab-on-a-Chip Technologies. In: D. Filippini (eds), Autonomous Sensor Networks. Springer Series on Chemical Sensors and Biosensors (Methods and Applications), vol 13, Springer, 2013, Berlin, Heidelberg, pp. 217-235.
[32] C. G. Li, M. Dangol, C. Y. Lee, , M. Jang, H. Jung, A self- powered one-touch blood extraction system: a novel polymer-capped hollow microneedle integrated with a pre-vacuum actuator, Lab Chip, 2015, 15, 382–390.
[33] S. Begolo, D. V. Zhukov, D. A. Selck, L. Lib, R. F. Ismagilov, The pumping lid: investigating multi-material 3D printing for equipment-free, programmable generation of positive and negative pressures for microfluidic applications, Lab Chip, 2014, 14, 4616–4628.
[34] K.M. Koczula, A. Gallotta, Lateral flow assays, Essays Biochem, 2016, 60, 111–120.
[35] Clearblue®, pregnancy test, https://uk.clearblue.com/preg-nancy-tests, accessed: February 1st, 2020.
[36] FirstresponseTM , pregnancy test, https://www.firstre-sponse.com/en/product-listings/early-result-pregnancy-test, accessed: February 1st, 2020.
[37] E.p.tTM, pregnancy test, https://www.eptfamily.com/preg-nancy-tests.html, accessed: February 1st, 2020.
[38] M. L. Sin, J. Gao, J.C. Liao, P. K. Wong, System Integration - A Major Step toward Lab on a Chip, J. Biol. Eng, 2011, 5/6, 1–21.
[39] A. K. Yetisen, M. S. Akram, C. R. Lowe, Paper-based microfluidic point-of-care diagnostic devices, Lab Chip, 2013, 13, 2210–2251.��
[40] A. W. Martinez, S. T. Phillips, , G. M. Whitesides, Three- dimensional microfluidic devices fabricated in layered paper and tape, Proc. Natl. Acad. Sci, 2008, 105, 19606–19611.
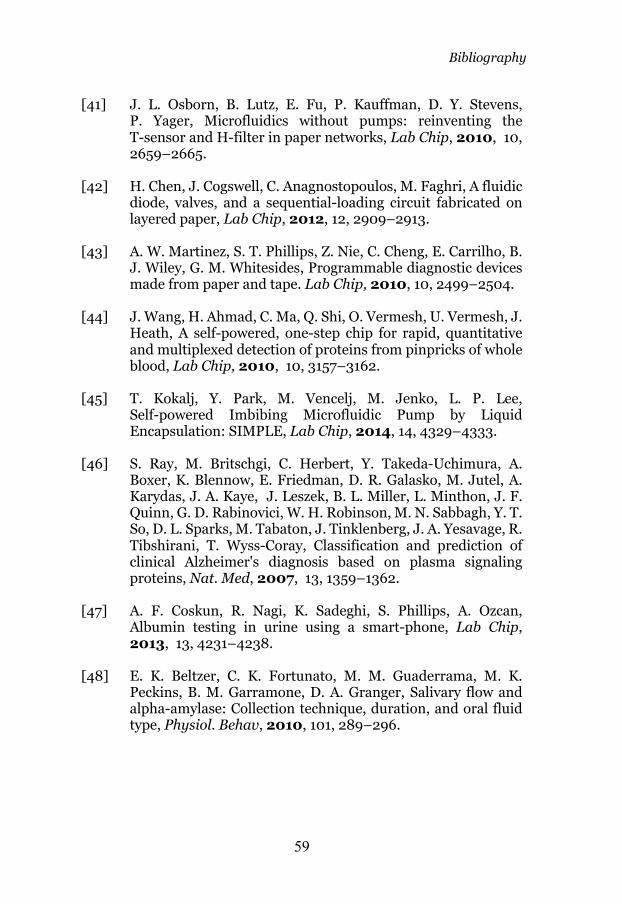
Bibliography
59
[41] J. L. Osborn, B. Lutz, E. Fu, P. Kauffman, D. Y. Stevens, P. Yager, Microfluidics without pumps: reinventing the T-sensor and H-filter in paper networks, Lab Chip, 2010, 10, 2659–2665.
[42] H. Chen, J. Cogswell, C. Anagnostopoulos, M. Faghri, A fluidic diode, valves, and a sequential-loading circuit fabricated on layered paper, Lab Chip, 2012, 12, 2909–2913.
[43] A. W. Martinez, S. T. Phillips, Z. Nie, C. Cheng, E. Carrilho, B. J. Wiley, G. M. Whitesides, Programmable diagnostic devices made from paper and tape. Lab Chip, 2010, 10, 2499–2504.
[44] J. Wang, H. Ahmad, C. Ma, Q. Shi, O. Vermesh, U. Vermesh, J. Heath, A self-powered, one-step chip for rapid, quantitative and multiplexed detection of proteins from pinpricks of whole blood, Lab Chip, 2010, 10, 3157–3162.
[45] T. Kokalj, Y. Park, M. Vencelj, M. Jenko, L. P. Lee, Self-powered Imbibing Microfluidic Pump by Liquid Encapsulation: SIMPLE, Lab Chip, 2014, 14, 4329–4333.
[46] S. Ray, M. Britschgi, C. Herbert, Y. Takeda-Uchimura, A. Boxer, K. Blennow, E. Friedman, D. R. Galasko, M. Jutel, A. Karydas, J. A. Kaye, J. Leszek, B. L. Miller, L. Minthon, J. F. Quinn, G. D. Rabinovici, W. H. Robinson, M. N. Sabbagh, Y. T. So, D. L. Sparks, M. Tabaton, J. Tinklenberg, J. A. Yesavage, R. Tibshirani, T. Wyss-Coray, Classification and prediction of clinical Alzheimer's diagnosis based on plasma signaling proteins, Nat. Med, 2007, 13, 1359–1362.
[47] A. F. Coskun, R. Nagi, K. Sadeghi, S. Phillips, A. Ozcan, Albumin testing in urine using a smart-phone, Lab Chip, 2013, 13, 4231–4238.
[48] E. K. Beltzer, C. K. Fortunato, M. M. Guaderrama, M. K. Peckins, B. M. Garramone, D. A. Granger, Salivary flow and alpha-amylase: Collection technique, duration, and oral fluid type, Physiol. Behav, 2010, 101, 289–296.
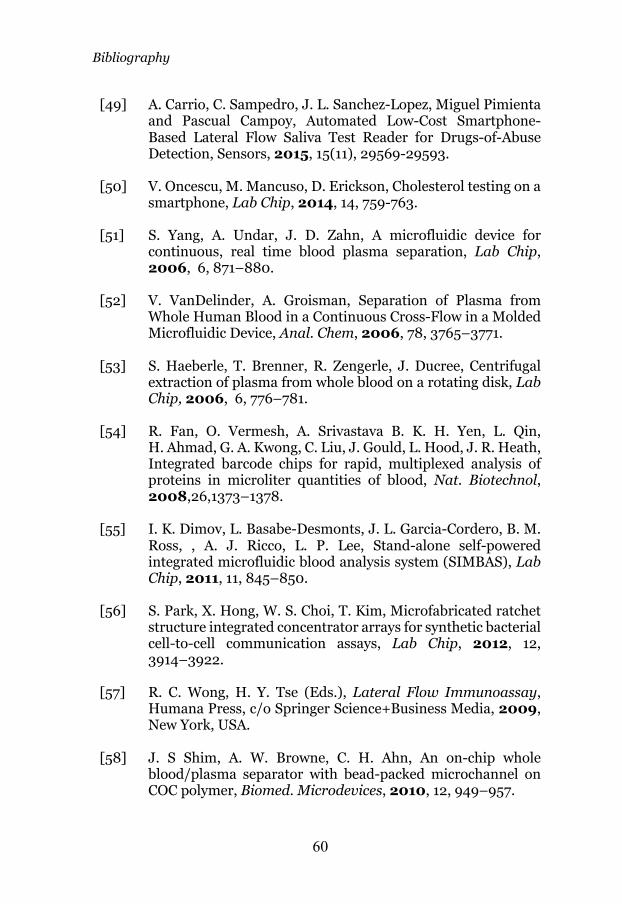
Bibliography
60
[49] A. Carrio, C. Sampedro, J. L. Sanchez-Lopez, Miguel Pimienta and Pascual Campoy, Automated Low-Cost Smartphone-Based Lateral Flow Saliva Test Reader for Drugs-of-Abuse Detection, Sensors, 2015, 15(11), 29569-29593.
[50] V. Oncescu, M. Mancuso, D. Erickson, Cholesterol testing on a smartphone, Lab Chip, 2014, 14, 759-763.
[51] S. Yang, A. Undar, J. D. Zahn, A microfluidic device for continuous, real time blood plasma separation, Lab Chip, 2006, 6, 871–880.
[52] V. VanDelinder, A. Groisman, Separation of Plasma from Whole Human Blood in a Continuous Cross-Flow in a Molded Microfluidic Device, Anal. Chem, 2006, 78, 3765–3771.
[53] S. Haeberle, T. Brenner, R. Zengerle, J. Ducree, Centrifugal extraction of plasma from whole blood on a rotating disk, Lab Chip, 2006, 6, 776–781.
[54] R. Fan, O. Vermesh, A. Srivastava B. K. H. Yen, L. Qin, H. Ahmad, G. A. Kwong, C. Liu, J. Gould, L. Hood, J. R. Heath, Integrated barcode chips for rapid, multiplexed analysis of proteins in microliter quantities of blood, Nat. Biotechnol, 2008,26,1373–1378.
[55] I. K. Dimov, L. Basabe-Desmonts, J. L. Garcia-Cordero, B. M. Ross, , A. J. Ricco, L. P. Lee, Stand-alone self-powered integrated microfluidic blood analysis system (SIMBAS), Lab Chip, 2011, 11, 845–850.
[56] S. Park, X. Hong, W. S. Choi, T. Kim, Microfabricated ratchet structure integrated concentrator arrays for synthetic bacterial cell-to-cell communication assays, Lab Chip, 2012, 12, 3914–3922.
[57] R. C. Wong, H. Y. Tse (Eds.), Lateral Flow Immunoassay, Humana Press, c/o Springer Science+Business Media, 2009, New York, USA.
[58] J. S Shim, A. W. Browne, C. H. Ahn, An on-chip whole blood/plasma separator with bead-packed microchannel on COC polymer, Biomed. Microdevices, 2010, 12, 949–957.

Bibliography
61
[59] ProteoSpin™ Urine Protein Concentration Micro Kit, Norgen Biotek Corp, https://norgenbiotek.com/product/urine-pro-tein-concentration-micro-kit, accessed: September 14th, 2020.
[60] R. Mariella, Sample preparation: the weak link in microfluidics-based biodetection, Biomed. Microdevices, 2008, 10, 777–784.
[61] A. González Crevillén, M. Hervás, M. A. López, M. C. González, A. Escarpa, Real sample analysis on microfluidic devices Talanta, 2007, 74, 342–357.
[62] A. J. Mello, N. Beard, Focus. Dealing with ‘real’ samples: sample pre-treatment in microfluidic systems, Lab Chip, 2003, 3, 11N–20N.
[63] Y. C. Lim, A. Z. Kouzani, W. Duan, Lab-on-a-chip: a component view, Microsyst. Technol, 2010, 16, 1995–2015.
[64] M. Köhler, PCR Lab-on-Chip Devices. In: Li D. (eds) Encyclopedia of Microfluidics and Nanofluidics, Springer, 2014, Boston, MA.
[65] C. D. Ahrberg, A. Manz, B. Geun Chung, Polymerase chain reaction in microfluidic devices, Lab Chip, 2016,16, 3866-3884.
[66] I. Pjescic, N. Crews, Genotyping from saliva with a one-step microdevice, Lab Chip, 2012, 12, 2514–2519.
[67] J. I. Martínez-López, M. Mojica, C. A. Rodríguez, H. R. Siller Xurography as a Rapid Fabrication Alternative for Point-of-Care Devices: Assessment of Passive Micromixers, Sensors, 2016, 16, 705.
[68] B. R. Lutz, P. Trinh, C. Ball, E. Fu, P. Yager, Two-dimensional paper networks: programmable fluidic disconnects for multi-step processes in shaped paper, Lab Chip, 2011, 11, 4274–4278.
[69] M. Zimmermann, H. Schmid, P. Hunziker, E. Delamarche, Capillary pumps for autonomous capillary systems, Lab Chip, 2007, 7, 119–125.

Bibliography
62
[70] L. Gervais, E. Delamarche, Toward one-step point-of-care
immunodiagnostics using capillary-driven microfluidics and PDMS substrates, Lab Chip, 2009, 9, 3330–3337.
[71] P. Vulto, S. Podszun, P. Meyer, C. Hermann, A. Manz, G. A. Urban, Phaseguides: a paradigm shift in microfluidic priming and emptying, Lab Chip, 2011, 11, 1596–1602.
[72] S. Hakenberg, M. Hügle, M. Weidmann, F. Hufert, G. Dame, G. A. Urban, A phaseguided passive batch microfluidic mixing chamber for isothermal amplification, Lab Chip, 2012, 12, 4576–4580.
[73] W. Du, L. Li, K. P. Nichols, R. F. Ismagilov, SlipChip, Lab Chip, 2009, 9, 2286–2292.
[74] F. Shen, W. Du, J. E. Kreutz, A. Fok, R. F. Ismagilov, Digital PCR on a SlipChip, Lab Chip, 2010, 10, 2666–2672.
[75] W. Liu, D. Chen, W. Du, K. P. Nichols, R. F. Ismagilov, SlipChip for immunoassays in nanoliter volumes, Anal. Chem, 2010, 82, 3276–3282.
[76] C. Shen, P. Xu, Z. Huang, D. Cai, SJ. Liu, W. Du, Bacterial chemotaxis on SlipChip, Lab Chip, 2014, 14, 3074–3080.
[77] L. Qin, O. Vermesh, Q. Shi, J. R. Heath, Self-powered microfluidic chips for multiplexed protein assays from whole blood, Lab Chip, 2009, 9, 2016–2020.
[78] S. Wang, X. Zhao, I. Khimji, R. Akbas, W. Qiu, D. Edwards, D. W. Cramer, B. Ye, U. Demirci, Integration of cell phone imaging with microchip ELISA to detect ovarian cancer HE4 biomarker in urine at the point-of-care, Lab Chip, 2011, 11, 3411.
[79] L. Shen, J. A. Hagen, I. Papautsky, Point-of-care colorimetric detection with a smartphone, Lab Chip, 2012, 12, 4240–4243.
[80] D. Filippini, I. Lundström, Spectroscopic information retained in screen photo-assisted techniques, Anal. Chim. Acta, 2004, 521, 237–244.

Bibliography
63
[81] D. Filippini, I. Lundström, Measurement strategy and
instrumental performance of a computer screen photo- assisted technique for the evaluation of a multi- parameter colorimetric test strip, Analyst, 2006, 131, 111–117.
[82] M. A. Malik, E. Gatto, S. Macken, C. DiNatale, R. Paolesse, A. D’Amico, I. Lundström, D. Filippini, Imaging fingerprinting of excitation emission matrices, Anal. Chim. Acta, 2009, 635, 196–201.
[83] G. Wyszecki, W. Stiles, Color Science: Concepts and Methods, Quantitative Data and Formulae, Wiley, 1982, New York, pp. 183-212.
[84] S. Macken, I. Lundström, D. Filippini, Optical properties of microstructures for computer screen photoassisted experiments, Appl. Phys. Lett, 2006, 89, 254104.
[85] P. Preechaburana, A. Suska, D. Filippini, Interfacing diagnostics with consumer electronics, In: K. Iniewsky, W. Karlen, (Eds.), Mobile Point-of-Care Monitors and Diagnostic Device Design. CRC Press, 2015, Boca Raton, Ch. 1, pp. 3–22.
[86] S. Westland, C. Ripamonti, Computational Colour Science using MATLAB, John Wiley and Sons Ltd, 2004, Chichester, West Sussex, England, pp. 163-170.
[87] Apple ®, iphone 11 pro specifications, https://www.apple.com/iphone-11-pro/specs/, accessed: December 4th, 2019.
[88] Samsung ®, Galaxy S10 specifications, https://www.samsung.com/global/galaxy/galaxy-s10/specs, accessed: December 4th, 2019.
[89] Huawai ®, P30 pro specifications, https://consumer.huawei.com/en/phones/p30-pro/specs/, accessed: December 4th, 2019.

Bibliography
64
[90] P. Preechaburana, M. Collado Gonzalez, A. Suska, D. Filippini, Surface plasmon resonance chemical sensing on cell phones, Angew. Chem. Int. Ed, 2012, 51, 11585–11588.
[91] T. E. Agbana, J-C. Diehl, F. van Pul, S. M. Khan, V. Patlan, M. Verhaegen, G. Vdovin, Imaging & identification of malaria parasites using cellphone microscope with a ball lens, PLoS ONE, 2018, 13(10): e0205020.
[92] R. Dendere, N. Myburg, T.S. Douglas, A review of cellphone microscopy for disease detection, Journal of Microscopy, 2015, 260, 248–259.
[93] D. Tseng, O. Mundayali, C. Oztoprak, S.O. Iskikman, I. Sencan, O. Yaglidere, A. Ozcan, Lensfree microscopy on a cellphone, Lab Chip, 2010, 10, 1787–1792.
[94] G. Comina, A. Suska, D. Filippini, Towards autonomous lab-on-a-chip devices for cell phone biosensing, Biosensors and Bioelectronics, 2016, 77, 1153–1167.
[95] A. Mata, A. J. Fleischman, S. Roy, Characterization of Polydimethylsiloxane (PDMS) Properties for Biomedical Micro/Nanosystems, Biomed Microdevices, 2005, 7, 281-293.
[96] S. Mitra, S. Chakraborty, Microfluidics and Nanofluidics Handbook, Fabrication, Implementation, and Applications, CRC Press Taylor & Francis Group, 2012, Boca Raton.
[97] X. Zhang, X. N. Jiang, C. Sun, Micro-stereolithography of polymeric and ceramic microstructures, Sensors and Actuators, 1999, 77, 149–156.
[98] S. C. Ligon, R. Liska, J. Stampfl, M. Gurr, R. Mülhaupt, Polymers for 3D Printing and Customized Additive Manufacturing, Chem. Rev, 2017, 117, 10212−10290.
[99] A. Suska, D. Filippini, Autonomous lab-on-a-chip generic architecture for disposables with integrated actuation, Sci. Rep, 2019, 9, 20320.
[100] Nanoscribe GmbH, Photonic Professional GT2 3D printer, http://www.nanoscribe.com/, accessed: February 1st, 2020.
[101] Z. Cao, P. Chen, Z. Ma, S. Li, X. Gao, R. Wu, L. Pan, Y. Shi, Near-Field Communication Sensors, Sensors, 2019, 19, 3947.

Bibliography
65
[102]
Texas Instrumments Inc., LMP91000 Configurable AFE Potentiostat for Low-Power Chemical Sensing Applications, http://www.ti.com/product/LMP91000, accessed: February 1st, 2020.
[103] M. Alistar, U. Gaudenz, OpenDrop: An Integrated Do-It-Yourself platform for personal use of Biochips, Bioengineering, 2017, 4(2), 45.

Bibliography
66

PART 2
Papers


Papers
The papers associated with this thesis have been removed for
copyright reasons. For more details about these see:
http://urn.kb.se/resolve?urn=urn:nbn:se:liu:diva-175544

Autonomous Lab-on-a-chip:solutions and fast prototyping tools
Linköping Studies in Science and TechnologyDissertation No. 2149
Germán Comina Bellido
Germán Com
ina Bellido Autonomous Lab-on-a-chip: solutions and fast prototyping tools 2021
FACULTY OF SCIENCE AND ENGINEERING
Linköping Studies in Science and Technology, Dissertation No. 2149, 2021 Department of Physics, Chemistry and Biology (IFM)
Linköping UniversitySE-581 83 Linköping, Sweden
www.liu.se