
AUTONIO · Figure 1- Autonio Application 1. LIVE TRADING ... analyst Welles Wilder that compares...
20
i AUTONIO User Manual V1
Transcript of AUTONIO · Figure 1- Autonio Application 1. LIVE TRADING ... analyst Welles Wilder that compares...

i
AUTONIO User Manual V1

1
Table of Contents
AUTONIO 0
User’s Manual V.1 0
1. LIVE TRADING 2
1.1 CHART ANALYSIS 2
1.2 STOP LOSS (%) 3
1.3 TAKE PROFIT (%) 3
1.4 PORTFOLIO PERCENTAGE (%) 3
2. BACKTEST 4
2.1 EXCHANGE 4
2.2 PAIR 4
2.3 INDICATOR INTERVAL 4
2.4 START DATE AND END DATE 4
3. INDICATORS 5-17
4. TRADING ADVICE 16
5. ALGORITHM MARKETPLACE 17
6. GENETIC ALGORITHM 18
7. SETTINGS 19

2
Figure 1- Autonio Application
1. LIVE TRADING Always backtest your strategy settings before live trading. First, you must set your API Keys from
the desired exchange before starting a live trade. Jump to Section 7 to get additional
information regarding API keys.
1.1 CHART ANALYSIS
Options to use different chart analyzing tools are located on the upper right-hand side.
Figure 2 - Chart Analysis

3
Figure 3
1.2 STOP LOSS (%)
A stop-loss order is designed to limit an investor’s loss on a position in a token. Although
most investors associate a stop-loss order only with a long position, it can also be used
for a short position, in which case the token would be bought if it trades above a
defined price. The best trailing stop-loss percentage to use is either 15% or 20% If you
use a pure momentum strategy a stop loss strategy can help you to completely avoid
market crashes, and even earn you a small profit while the market loses 50%.
1.3 TAKE PROFIT (%)
A take-profit order (T/P) is an order used by currency traders specifying the exact rate or
number of pips from the current price point where to close out their current position for
a profit. The rate deemed to be the level where the trader wants to take a profit is
sometimes referred to as the "take-profit point". For example, if you are long a
currency pair position and believe the price will rise to a certain level, but are unsure
what it will do beyond that level, placing a take-profit order at that point will
automatically close out your position allowing you to lock in profit. Example: Buy $100
worth of Yen at 107.4 Yen per dollar = 100*107.40 = 10,740 Yen.
Place a take-profit order at 108.80. Price then rises from 107.40 to 108.80 Take-profit
order automatically executed to sell $100 and buy 10,880 Yen.
1.4 PORTFOLIO PERCENTAGE (%)
Percentage of your portfolio that you’re allowing Autonio to execute trades with.

4
2. BACKTEST This section is used to backtest your strategies. Always backtest your strategies before live
trading to make sure you have the right strategy in place.
Figure 4
2.1 EXCHANGE
Here you can choose the exchange you want to backtest. As in V1 release, there are
currently five exchanges to choose from.
Bitfinex, OKCoin, Kraken, Bittrex, Bitstamp
2.2 PAIR
Here you can choose the currency pair you want to trade.
e.g. BTCUSD, LTCUSD, BTCLTC, ETHLTC, ETCUSD etc.
2.3 INDICATOR INTERVAL
The specified time period of the indicator. Options are:
15 Minutes, 30 Minutes, 1 Hour, 2 Hours, 4 Hours, 12 Hours and 1 Day.
2.4 START DATE AND END DATE
Start date and end date to backtest your strategy.

5
3. INDICATORS
3.1 ACCUMULATION DISTRIBUTION LINE (ADL):
Accumulation/Distribution Line is a momentum indicator that attempts to gauge supply
and demand by determining whether investors are generally "accumulating" (buying) or
"distributing" (selling) a certain token by identifying divergences between token price
and volume flow. The accumulation/distribution is calculated by first calculating the
money flow multiplier, and then multiplying the money flow multiplier by the period's
volume. If a token's price is in a downtrend while the accumulation/distribution line is in
an uptrend, the indicator shows there may be buying pressure and the token's price
may reverse. Consequently, the token may reverse and trend up. Conversely, if a token's
price is in an uptrend while the accumulation/distribution line is in a downtrend, the
indicator shows there may be selling pressure, or high distribution. This may cause the
token's price to reverse and turn into a downtrend.
More info: ADL-Investopedia, ADL-OnlineTradingConcepts
3.2 AVERAGE DIRECTIONAL INDEX (ADX):
The Average Directional Index (ADX) is used to measure the strength and momentum of
an existing trend.
Figure 5 - Average Directional Index (ADX)
More info: ADX-StockCharts, ADX-Investopedia

6
3.3 AVERAGE TRUE RANGE (ATR):
The true range indicator is the greatest of the following:
• current high less the current low
• the absolute value of the current high less the previous close
• the absolute value of the current low less the previous close.
ATR is an exponential moving average of the true range. Additionally, it does not
indicate the price direction, rather it is used primarily to measure volatility caused by
gaps and limit up or down moves.
Figure 6 - Average True Range (ATR)
More info: ATR-Investopedia

7
3.4 BOLLINGER BANDS (BB)
A Bollinger Band is plotted two standard deviations away from a simple moving average.
They consist of a center line and 2 price channels (bands) above and below it. The center
line is an exponential moving average; the price channels are the standard deviations of
the token being studied. The bands will expand and contract as the price action of an
issue becomes volatile (expansion) or becomes bound into a tight trading pattern
(contraction). Many traders believe that the closer the prices move towards the upper
band, the more overbought the market, and the closer the prices move towards the
lower band, the more oversold the market.
Figure 7 - Bollinger Bands (BB)
More info: BB-Investopedia, BB-StockCharts
3.5 COMMODITY CHANNEL INDEX (CCI):
Commodity Channel Index (CCI) is a versatile indicator that can be used to identify a new
trend or warn of extreme conditions. In general, CCI measures the current price level
relative to an average price level over a given period of time. CCI is relatively high when
prices are far above their average. CCI is relatively low when prices are far below their
average. In this manner, CCI can be used to identify overbought and oversold levels.
CCI measures the difference between a token's price change and its average price
change. High positive readings indicate that prices are well above their average, which is
a show of strength. Low negative readings indicate that prices are well below their
average, which is a show of weakness.
More info: CCI-StockCharts, CCI-OnlineTradingConcepts

8
3.6 FORCE INDEX (FI):
The Force Index (FI) can be used to reinforce the overall trend, identify playable
corrections, or foreshadow reversals with divergences. There are three essential
elements to a token's price movement: direction, extent and volume. The Force Index
combines all three as an oscillator that fluctuates in positive and negative territory as
the balance of power shifts.
The Force Index uses both price and volume to measure buying and selling pressure. The
price portion covers the trend, while the volume portion determines the intensity. At its
most basic, chartists can use a long-term Force Index to confirm the underlying trend.
The bulls have the edge when the 100-day Force Index is positive. The bears have the
edge when the 100-day Force Index is negative. Armed with this information, traders
can then look for short-term setups in harmony with the larger trend, such as bullish
setups in a larger uptrend or bearish setups within a larger downtrend.
More info: FI-StockCharts
3.7 KNOW SURE THING (KST):
Know Sure Thing (KST) is a two-line indicator used to determine momentum in token
trends. As an oscillator it fluctuates above and below zero, providing trade signals and
analytical insight based on divergence with price and KST and signal Line crossovers. The
indicator formula utilizes four different time frames to show overall momentum, and
not just momentum over one specific timeframe:
RoCMA1 = 10-Period SMA of 10-Period Rate-of-Change
RoCMA2 = 10-Period SMA of 15-Period Rate-of-Change
RoCMA3 = 10-Period SMA of 20-Period Rate-of-Change
RoCMA4 = 15-Period SMA of 30-Period Rate-of-Change
KST Line = (RoCMA1 x 1) + (RoCMA2 x 2) + (RoCMA3 x 3) + (RoCMA4 x 4)
Signal Line = 9-period SMA* of KST
*SMA stands for Simple Moving Average and RoC stands for Rate-of-Change.
Buy signals occur when the KST crosses above the zero line, or when the KST crosses
above its signal line. Sell signals occur when the KST crosses below the zero line, or
when the KST crosses below the signal line. When the KST stays above zero during an
uptrend, it confirms the trend. When KST stays below zero during a downtrend, it
confirms the downtrend.
More info: KST-StockCharts

9
3.8 MOVING AVERAGE CONVERGENCE DIVERGENCE (MACD):
Moving Average Convergence Divergence (MACD) is a trend-following momentum
indicator that shows the relationship between two moving averages of prices. The
MACD is calculated by subtracting the 26-day exponential moving average (EMA) from
the 12-day EMA. A nine-day EMA of the MACD, called the "signal line", is then plotted
on top of the MACD, functioning as a trigger for buy and sell signals.
Figure 8 - Moving Average Convergence Divergence (MACD)
More info: MACD-StockCharts, MACD-Investopedia
3.9 ON BALANCE VOLUME (OBV):
On Balance Volume (OBV) is used to measure positive and negative volume flow.
Chartists can look for divergences between OBV and price to predict price movements
or use OBV to confirm price trends. There are three rules implemented when calculating
the OBV. They are:
● If today's closing price is higher than yesterday's closing price, then: Current
OBV = Previous OBV + today's volume
● If today's closing price is lower than yesterday's closing price, then: Current
OBV = Previous OBV - today's volume
● If today's closing price equals yesterday's closing price, then: Current OBV =
Previous OBV
More info: OBV-StockCharts, OBV-Investopedia

10
3.10 PARABOLIC STOP AND REVERSE (PSAR):
The Parabolic Stop and Reverse (PSAR) indicator combines price and time components
in an attempt to generate potential buy and sell signals. The PSAR advertises itself as an
effective tool to determine where to place stop loss orders.
Figure 9 - Parabolic Stop and Reverse (PSAR)
More info: PSAR-StockCharts, PSAR-Investopedia
3.11 RATE OF CHANGE (ROC):
The Rate of Change (ROC) indicator measures the percentage change of the current
price as compared to the price a certain number of periods ago. The ROC indicator
might be used to confirm price moves or detect divergences; it might also be used as a
guide for determining overbought and oversold conditions.
Rate of Change: [(Current Price / Price n periods ago) - 1] x 100
Generally, the Rate of Change is calculated based on 14-periods for input n, but of
course can be modified to any trader preferred period.
More info: ROC-StockCharts

11
3.12 RELATIVE STRENGTH INDEX (RSI):
The Relative Strength Index (RSI) is a momentum indicator developed by noted technical analyst Welles Wilder that compares the magnitude of recent gains and losses over a specified time period to measure speed and change of price movements of a token. It is primarily used to attempt to identify overbought or oversold conditions in the trading of an asset.
The relative strength index is calculated using the following formula:
RSI = 100 - 100 / (1 + RS)
Where RS = Average gain of up periods during the specified time frame / Average loss of down periods during the specified time frame
Figure 10 - Relative Strength Index (RSI)
More info: RSI-StockCharts
12
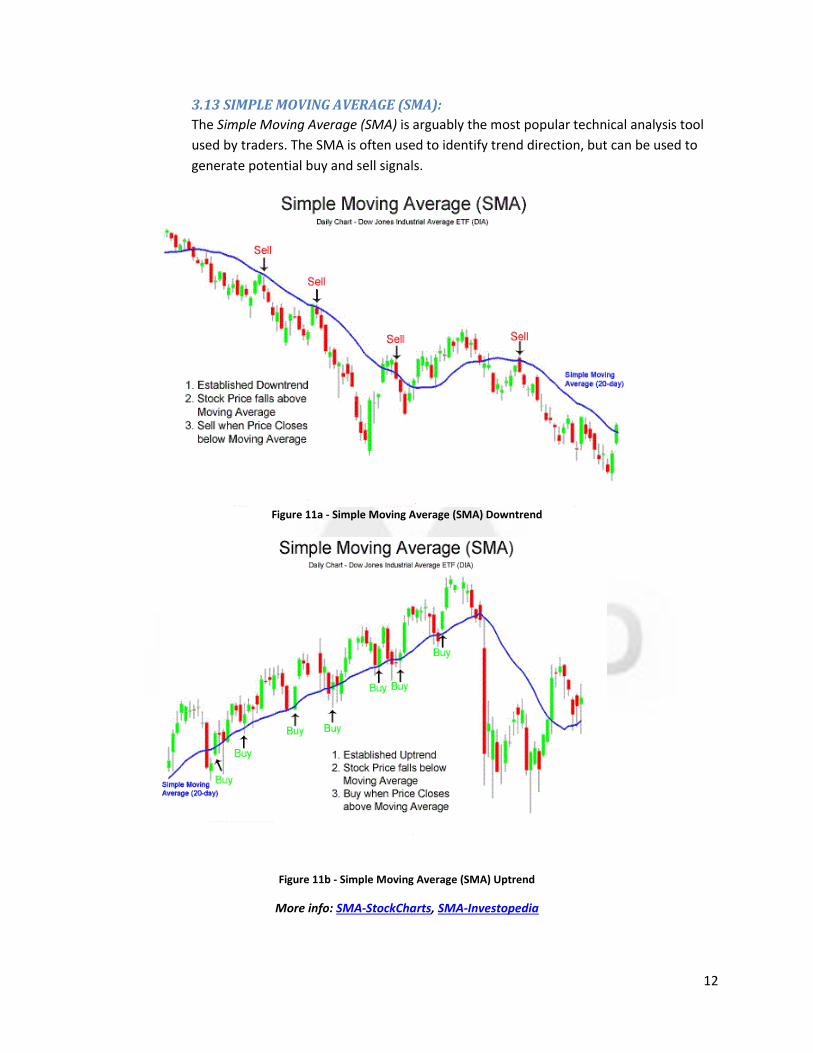
3.13 SIMPLE MOVING AVERAGE (SMA):
The Simple Moving Average (SMA) is arguably the most popular technical analysis tool
used by traders. The SMA is often used to identify trend direction, but can be used to
generate potential buy and sell signals.
Figure 11a - Simple Moving Average (SMA) Downtrend
Figure 11b - Simple Moving Average (SMA) Uptrend
More info: SMA-StockCharts, SMA-Investopedia

13
3.14 STOCHASTIC OSCILLATOR (KD)
The Stochastic Oscillator (KD) compares the closing price of a token to the range of its
prices over a certain period of time. The sensitivity of the oscillator to market
movements is reducible by adjusting that time period or by taking a moving average of
the result.
Figure 12 - Stochastic Oscillator (KD)
More info: Stochastic Oscillator-StockCharts
3.15 TRIPLE EXPONENTIALLY SMOOTHED AVERAGE (TRIX)
Triple Exponentially Smoothed Average (TRIX) is used by technical traders that shows
the percentage change in a triple exponentially smoothed moving average. When TRIX is
applied to triple smoothing of moving averages, it is designed to filter out price
movements that are considered insignificant or unimportant.
More info: TRIX-StockCharts, TRIX-Investopedia
3.16 VOLUME-WEIGHTED AVERAGE PRICE (VWAP):
Volume-Weighted Average Price (VWAP) is exactly what it sounds like: the average price
weighted by volume. VWAP equals the dollar value of all trading periods divided by the
total trading volume for the current day. The calculation starts when trading opens and
ends when trading closes. Because it is good for the current trading day only, intraday
periods and data are used in the calculation.
More info: VWAP-StockCharts, VWAP-Investopedia

14
3.17 EXPONENTIAL MOVING AVERAGE (EMA)
The Exponential Moving Average (EMA) weighs current prices more heavily than past
prices. This gives the Exponential Moving Average the advantage of being quicker to
respond to price fluctuations than a Simple Moving Average; however, that can also be
viewed as a disadvantage because the EMA is more prone to ‘whipsaws’.
Figure 13 - Exponential Moving Average (EMA)
More info: EMA-StockCharts, EMA-Investopedia
3.18 WEIGHTED MOVING AVERAGE (WMA)
The Weighted Moving Average (WMA) places more importance on recent price moves;
therefore, the Weighted Moving Average reacts more quickly to price changes than the
regular Simple Moving Average. A basic example (3-period) of how the Weighted
Moving Average is calculated is presented below:
● Prices for the past 3 days have been $5, $4, and $8.
● Since there are 3 periods, the most recent day ($8) gets a weight of 3, the second
recent day ($4) receives a weight of 2, and the last day of the 3 periods ($5)
receives a weight of just 1.
● The calculation is as follows: [(3 x $8) + (2 x $4) + (1 x $5)] / 6 = $6.17
The Weighted Moving Average value of 6.17 compares to the Simple Moving Average
calculation of 5.67. Note how the large price increase of 8 that occurred on the most
recent day was better reflected in the Weighted Moving Average calculation.
More info: MAWeighted-OnlineTradingConcepts

15
3.19 WILDER’S SMOOTHING (SMOOTHED MOVING AVERAGE, WEMA)
Wilder’s Smoothing and the EMA are actually the same indicator, despite being very
different in how they are calculated. To reveal the equivalent EMA simply multiply the
period by two and subtract one, test it for yourself; a 50 period WS-MA is equivalent to
a 99 period EMA. You can also reveal the EMA smoothing period from any two data sets
using the following formula:
N = (2-( (MA-MA[1]) / (Close-MA[1]) ) ) / ( (MA-MA[1]) / (Close-MA[1]) )
More info: Wilders-Smoothing
3.20 WILLIAMSR (W%R)
Williams %R, sometimes referred to as the Williams Percent Range, is a momentum
indicator that measures overbought and oversold levels, comparable to a stochastic
oscillator. The Williams %R is used to establish entry and exit points in the market. It
compares the close of a token to the high-low range over a period of time, typically 14
days.
More info: Williams%R-OnlineTradingConcepts, Williams%R-Investopedia

16
4. TRADING ADVICE You can consult traders to help you develop strategies and get a deeper understanding of both
the platform and trading. If you are professional trader, you can apply to be a consultant to help
other people develop trading strategies in exchange for a fee paid in NIO
Figure 14

17
5. ALGORITHM MARKETPLACE Best algorithms will be sorted in the form of a leaderboard. Users can buy/sell these strategies from
the Algorithm marketplace
Figure 15

18
6. GENETIC ALGORITHM This section is currently under development. It will be available in a future update.
Figure 16

19
7. SETTINGS
Figure 17
● Get API Keys for Bitfinex:
○ https://support.bitfinex.com/hc/en-us/articles/115002349625-API-Key-Setup-Login
● Get API Keys for Kraken:
○ https://www.kraken.com/help/api
● Get API Keys for Bittrex:
○ https://bittrex.com/home/api
● Get API Keys for Bitstamp:
○ https://www.bitstamp.net/article/api-key-implementation


![Optimal Step-wise Parameter - uniroma1.itbibdis/RePEc/aeg/report/... · 2019. 1. 21. · strategy proposed by J. Welles Wilder Jr in [citazione libro wilder]. 3.1 Basic Notions The](https://static.fdocuments.us/doc/165x107/610b0f1a6cb51c099a66f052/optimal-step-wise-parameter-bibdisrepecaegreport-2019-1-21-strategy.jpg)