AUTOMOTIVE MANUFACTURING INVESTMENT … · AY 2012 AUTOMOTIVE MANUFACTURING INVESTMENT...
67
AY 2012 AUTOMOTIVE MANUFACTURING INVESTMENT ATTRACTIVENESS OF 5 ASEAN COUNTRIES SINEEPHAN PIYANARAPORN Major in Business Administration 35102328-4 GRADUATE SCHOOL OF COMMERCE WASEDA UNIVERSITY C.E. PROF . HIDEO HOHGI D.E. PROF . SHIGERU NISHIYAMA PROF . SEIICHI FUJITA
Transcript of AUTOMOTIVE MANUFACTURING INVESTMENT … · AY 2012 AUTOMOTIVE MANUFACTURING INVESTMENT...

AY 2012
AUTOMOTIVE MANUFACTURING
INVESTMENT ATTRACTIVENESS OF 5 ASEAN COUNTRIES
SINEEPHAN PIYANARAPORN
Major in Business Administration 35102328-4
GRADUATE SCHOOL OF COMMERCE
WASEDA UNIVERSITY
C.E. PROF. HIDEO HOHGI D.E.
PROF. SHIGERU NISHIYAMA
PROF. SEIICHI FUJITA

i
TABLE OF CONTENTS
CHAPTER 1.CHAPTER 1.CHAPTER 1.CHAPTER 1. INTRODUCTIONINTRODUCTIONINTRODUCTIONINTRODUCTION ............................................................................................................................................................................................................................................................................................................................................ 1111
SECTION 1. INDUSTRY BACKGROUND ............................................................................. 1 SECTION 2. OBJECTIVES ................................................................................................. 2 SECTION 3. METHODOLOGY ............................................................................................ 2 SECTION 4. CHAPTER OVERVIEW.................................................................................... 2
CHAPTER 2.CHAPTER 2.CHAPTER 2.CHAPTER 2. AUTOMOTIVE INDUSTRY AUTOMOTIVE INDUSTRY AUTOMOTIVE INDUSTRY AUTOMOTIVE INDUSTRY BACKGROUNDBACKGROUNDBACKGROUNDBACKGROUND ............................................................................................................................................................ 5555
SECTION 1. AUTOMOTIVE INDUSTRY DEVELOPMENT ..................................................... 5 SECTION 2. CHARACTERISTICS ....................................................................................... 9 SECTION 3. GLOBAL VALUE CHAIN IN AUTOMOTIVE INDUSTRY .................................. 10
CHAPTER 3.CHAPTER 3.CHAPTER 3.CHAPTER 3. BACKGROUND ON ASEANBACKGROUND ON ASEANBACKGROUND ON ASEANBACKGROUND ON ASEAN .................................................................................................................................................................................................................................................................... 17171717
SECTION 1. ASEAN PROFILE ....................................................................................... 17 SECTION 2. MACROECONOMIC TREND.......................................................................... 18 SECTION 3. RECENT ECONOMIC TRENDS ..................................................................... 20 SECTION 4. ASEAN COUNTRIES POLICY CHALLENGE .................................................. 22 SECTION 5. ASEAN AND JAPAN ................................................................................... 25
CHAPTER 4.CHAPTER 4.CHAPTER 4.CHAPTER 4. RESEARCH METHODOLOGYRESEARCH METHODOLOGYRESEARCH METHODOLOGYRESEARCH METHODOLOGY .................................................................................................................................................................................................................................................... 28282828
SECTION 1. RESEARCH DESIGN .................................................................................... 28 SECTION 2. GENERAL DESCRIPTION OF INTERVIEW SHEET......................................... 29 SECTION 3. DATA ANALYSIS .......................................................................................... 32
CHAPTER 5.CHAPTER 5.CHAPTER 5.CHAPTER 5. RESEARCH ANALYSISRESEARCH ANALYSISRESEARCH ANALYSISRESEARCH ANALYSIS ................................................................................................................................................................................................................................................................................................ 33333333
SECTION 1. INTERVIEW RESULTS ................................................................................. 33 SECTION 2. EACH COUNTRY CIRCUMSTANCE ............................................................... 36 SECTION 3. MYANMAR .................................................................................................. 47
CHAPTER 6.CHAPTER 6.CHAPTER 6.CHAPTER 6. CONCLUSIONS AND RECOCONCLUSIONS AND RECOCONCLUSIONS AND RECOCONCLUSIONS AND RECOMMENDATIONSMMENDATIONSMMENDATIONSMMENDATIONS ............................................................................................................................................ 50505050
SECTION 1. JAPANESE AUTOMOTIVE INVESTMENT INFLUENCING FACTORS ............... 50 SECTION 2. FIVE ASEAN COUNTRIES AND MYANMAR BUSINESS ENVIRONMENT ...... 51 SECTION 3. RECOMMENDATIONS .................................................................................. 54
REFERENCESREFERENCESREFERENCESREFERENCES ……………………………………………………………………………………………………………………………………………………………………………………………………………………………………………………………………………………………………………………………………………………58585858
APPENDIX 1: EVALUATIAPPENDIX 1: EVALUATIAPPENDIX 1: EVALUATIAPPENDIX 1: EVALUATION SHEET OF TEN FACTON SHEET OF TEN FACTON SHEET OF TEN FACTON SHEET OF TEN FACTORS INFLUENCING ORS INFLUENCING ORS INFLUENCING ORS INFLUENCING
MANUFACTURING INVESTMANUFACTURING INVESTMANUFACTURING INVESTMANUFACTURING INVESTMENT OF JAPANESE AUTMENT OF JAPANESE AUTMENT OF JAPANESE AUTMENT OF JAPANESE AUTOMOTIVE COMPANIES.OMOTIVE COMPANIES.OMOTIVE COMPANIES.OMOTIVE COMPANIES. .... 60606060
APPENDIX 2: INTERVIEAPPENDIX 2: INTERVIEAPPENDIX 2: INTERVIEAPPENDIX 2: INTERVIEW SHEET: EACH COUNTRW SHEET: EACH COUNTRW SHEET: EACH COUNTRW SHEET: EACH COUNTRY SITUATIONY SITUATIONY SITUATIONY SITUATION .................................................................................................... 61616161
APPENDIAPPENDIAPPENDIAPPENDIX 3: COMMENTS ON MYAX 3: COMMENTS ON MYAX 3: COMMENTS ON MYAX 3: COMMENTS ON MYANMARNMARNMARNMAR .................................................................................................................................................................................................................................................................... 62626262

ii
LIST OF FIGURES
Figure 1: Structure of the Automotive Industry .................................................................................. 10 Figure 2: Automotive production in Asia ............................................................................................ 14 Figure 3: Japanese Automotive Industry Production and export ........................................................ 15 Figure 4: The nested geographic and organizational structure of the automotive industry ................ 16 Figure 5: Production of motor vehicles and components in 2011 ....................................................... 21 Figure 6: Production volume of JAMA members in ASEAN ............................................................. 26 Figure 7: Sale by country ............................................................................................................ 25
Figure 8: No. of jobs by JAMA members in ASEAN ......................................................................... 26 Figure 9: 5-scales used in interview for the factor influential l .......................................................... 31 Figure 10: 5-scale used in interview of each ASEAN country satisfaction ........................................ 31 Figure 11: Indonesia competitiveness by WEF ................................................................................... 35 Figure 12: Indonesia attractiveness by interviews .............................................................................. 37 Figure 13: Malaysia competitiveness by WEF ................................................................................... 38 Figure 14: Malaysia attractiveness by interviews ............................................................................... 39 Figure 15: Philippines competitiveness by WEF ................................................................................ 39 Figure 16: Philippines attractiveness by interview ............................................................................. 41 Figure 17:Thailand competitiveness by WEF ..................................................................................... 42 Figure 18: Thailand attractiveness by interview ................................................................................. 43 Figure 19: Vietnam competitiveness by WEF..................................................................................... 44 Figure 20: Vietnam attractiveness by interview .................................................................................. 46 Figure 21: Myanmar investment summit 2012’a participants ............................................................ 49

iii
LIST OF TABLES
Table 1: 5 ASEAN countries’ profile .................................................................................................. 18 Table 2: Real GDP growth rate of 6 ASEAN countries ...................................................................... 19 Table 3: Medium-term development of 5 ASEAN countries .............................................................. 22 Table 4: Summary of medium-term policy challenges and responses ................................................ 25 Table 5: Interview result of level of factors influence to manufacturing investment decision ........... 35 Table 6: Group of factors influencing Japanese automaker on manufacturing investment ................. 50

iv
LIST OFACRONYMS AND ABBREVIATIONS
ABCIs Asian Business Cycle Indicators ADB Asian Development Bank AEC ASEAN Economic Community AFTA ASEAN Free Trade Area AFTA-CEPT ASEAN Free Trade Area – Common Effective Preferential Tariff ASEAN Association of Southeast Asian Nations ASEAN4 Indonesia, Malaysia, the Philippines and Thailand ATIGA ASEAN Trade in Goods Agreement BBC Brand to Brand Complementation BOI Board of Investment BRICs Brazil, Russia, India and China CBU Completely Built Up CKD Completely Knocked Down CQD Cost Quality Delivery FDI Foreign Direct Investment GATT General Agreement of Tariff and Trade GCI Global Competitiveness Index GDP Gross Domestic Product GVC Global Value Chain ICT Information and Communication Technology IMD International Institute for Management Development IMV Innovative International Multi-purpose Vehicle IPSI Industry Policy and Strategy Institute JAMA Japan Automobile Manufacturers Association KD Knocked Down KPK Corruption Eradication Commission MFN Most Favored Nation MNC Multinational Corporation MOIT Ministry of Industry and Trade MRA Mutual Recognition Arrangement MVPMAP Motor Vehicle Parts Manufacturers Association of the Philippines NAFTA North American Free Trade Agreement NAP National Automotive Policy OECD Organization for Economic Co-operation and Development OEM Original Equipment Manufacturer PPP Public Private Partnerships PPP Purchasing Power Parity QCD Quality, Cost and Delivery SCM Supply Chain Management SKD Semi Knocked Down SME Small and Medium Enterprises TAI Thailand Automotive Industry TEVT Technical Education and Vocational Training TIV Total Industry Volume VER Voluntary Export Restriction WEF World Economic Forum WTO World Trade Organization
1
CHAPTER 1. INTRODUCTION
This research aims to analyze the attractiveness for automobile investment of ASEAN
countries. In order to understand driving factors influencing manufacturing investment decision, data
was gathered by interviewing with three respected Japanese automotive companies. This research
focuses on five ASEAN countries that Japanese automotive company built their factories. Those
countries consisted of Indonesia, Malaysia, the Philippines, Thailand and Vietnam. The result shows
the comparison of attractiveness on automotive foreign investment among five ASEAN countries.
Recommendation section will describe insights regarding country-wise FDI attractiveness from
Japanese automaker’s view point. Furthermore, some references for Japanese manufacturing’s future
policy in ASEAN region will also be provided. This chapter presents information on research
background, research objectives, methodology and the overview of following chapters.
Section 1. INDUSTRY BACKGROUND
Thanks to the overflowing of automotive investments, the industry has been generating jobs
and bringing a lot of money into ASEAN countries. Japan is one of the countries who made major
automotive investment in ASEAN area. When foreign investors make a decision on which country to
invest, they look into many factors of “attractiveness” of each country. Thailand has been the country
that received the largest total investment. Therefore, Thailand is the most developed in automotive
industry when compared to other ASEAN countries. The evidence can be seen in the construction of
regional headquarters in Thailand by most major automotive companies. Even though Thailand is
currently the most attractive country for automotive investment, the situation can be changed. Once
business environment or economic changed, the trend of investment is also altered as well.
However, even though there were many attractiveness evaluations from many organizations
such as World Economic Forum (WEF) and International Institute for Management Development
(IMD). Those evaluations are overviews situation of the country. They do not go into specific detail
into automotive sector. More importantly, the overview attractiveness cannot represent attractiveness
2
in automotive industry. For example, even though Singapore is ranked second in WEF ranking, there
is no investment for automobile manufacturing factory in Singapore. Therefore, factors used in
determining overall attractiveness differently affect the attractiveness in automotive industry. So,
those factors will be used with the interviewees of automotive companies to see the real effect of
each factor specifically in automotive investment.
Section 2. OBJECTIVES
The objectives of this thesis are to study factors influencing Japanese automotive investment
decision in ASEAN countries. The thesis will study those factors from automotive manufacturing
business environment of ASEAN countries. Once influencing factors are realized, they will be linked
to prospective investments decision making process. The results can be references for investors to
get a better understanding of automotive industry in ASEAN. Recommendation will provide insights
regarding country-wise FDI attractiveness from Japanese automaker’s view point. In order to attract
more investment to countries, Japanese automaker’s requirements on car manufacturing is also
presented.
Section 3. METHODOLOGY
In order to understand factors influencing Japanese automobile investment decision in those
five Southeast Asia countries, the author has conducted a research with two major processes. The
first one is to research on the most updated information of each country situations and strategies in
various reliable articles, journals and textbooks. And the second process is to interview with three
persons in charge of automotive manufacturing investment strategies in Asia-Oceania area.
Section 4. CHAPTER OVERVIEW
This thesis contains six chapters; chapter 1: introduction, chapter 2: automotive industry,
chapter 3: background on ASEAN, chapter 4: research methodology, chapter 5: research analysis and
chapter 6: conclusions and recommendations.

3
Chapter 1 introduces the overview of the thesis. This chapter consists of four sections
including industry background, objectives, methodology and chapter overview. Industry background
section provides a brief outline of current ASEAN automotive industry. Then, the objective of this
thesis is presented in objective section. It is followed by how to reach the objective in methodology
section. And the last section of chapter overview is a structure of this thesis.
Chapter 2, automotive industry, gives a more detail information regarding the situation of
automotive industry in ASEAN countries. Section 1 of this chapter is automotive industry
development. This section provides a global history of automotive industry. Characteristic section is
a section 2 with information on the structure automotive industry. Section 3, global value chain in
automotive industry, shows the chain of activities around the world in automotive manufacturing
business.
Chapter 3 is the chapter that presents information on ASEAN, country by country. Each
country general characteristics will be presents in the first section of ASEAN profile. It is followed
by section 2 with the recent economic trends of ASEAN countries. Section 3, ASEAN countries
policy challenge, is then presents with the information of problem in policies ASEAN countries’
governments are facing. The last section will then give the relation between ASEAN and Japan since
Japan is the biggest investor in automotive segment in the area.
Chapter 4 is the chapter of research methodology. This chapter goes into more detailed on
how the research of this thesis was conducted. The first section is about research design. Research
design will presents the process of getting relevant information that will be used in the interviews
sheet. Once the interview sheet is generated, it will be showed in general description of an interview
sheet section. And the last section, section 3, gives the process of analysis of obtained data from the
interviews.
Chapter 5 presents the research analysis. This chapter starts with the results from the
interview in the first section. Then, it will conclude the current situation of each ASEAN country in
each country circumstance section. The last section in this chapter will provides an opinion on a
newly open country, Myanmar, from Japanese automotive investor company perspective.

4
Chapter 6, the last chapter, is conclusions and recommendations. Summary of the study from
analysis in previous chapters will be presented.
5
CHAPTER 2. AUTOMOTIVE INDUSTRY BACKGROUND
Automotive industry is one of the most important economic sectors in the world by revenue.
This chapter presents the past and present situation of the industry. The chapter starts with section 1
of “automotive industry development”. This section provides historical information on how the
industry came to be the present state. Followed by section 2, “the characteristics”, the data regarding
automotive industry’s current characteristic is presented. The last section, section 3, is “global value
chain in automotive industry”. This section gives an overview on how the industries in each country
are connected throughout the world.
Section 1. AUTOMOTIVE INDUSTRY DEVELOPMENT
Automotive industry has been expanding globally since the first practical car with petrol
engine was built by Karl Benz in 1885 in Germany. The production in large volume of automobiles
began in the early 1890s in Europe. France and Germany were the largest automotive manufacturers
with small domestic markets1.
In 1903, Ford entered the automotive industry and reduced the prices of cars from USD 850
in 1908 to USD 360 in 1916. In 1913, Fordism mass production was introduced by Henry Ford. It
increased U.S. car production to 84% of world car production during the 1920s. In 1929, the U.S.
was able to export 10% of its production, which accountable for 35% of the world market. Due to
the expansion of U.S. production, European governments have to intervene by protecting their
domestic car producers and endorsing their national automotive industries.
In 1950, another significant movement was the enactment of General Agreement of Tariff
and Trade (GATT). The agreement focused on reducing tariffs and tackling trade barriers2. This
agreement combined automotive market between Europe and U.S. GATT also enabled international
trading and production.
1 Griffin, James M., and Craig, T. (2005) Price Asymmetry in Energy Demand Models: A Proxy for Energy Saving Technical Change?”, The Energy Journal, 26(2), p 1-22. 2 World Trade Organization (2008) Understanding the WTO - The GATT years: from Havana to
Marrakesh
6
In 1970, Ford, GM and Chrysler drove the production to 11 million units. Automobile
industry went global from technology transfer of Fordism mass production model. The spread was
from the U.S. to Western Europe and Japan following both World Wars I and II. Two important
trends were raised from this technology transfer. The first one is the advancements in
industrialization that led to significant increase in the growth and production of the Japanese and
German automotive markets. The second trend was the export of fuel efficient cars from Japan to the
U.S. due to the oil restriction from 1973 to 19743.
At the same time, Japan began to step into the global market by expanding its car into foreign
markets with accelerated growth. Passenger car exports rose from 100,000 in 1965 to 1,827,000 in
1975. With their famous “Lean production system”, Japanese manufacturers produced efficiently and
became the largest car producer in the world in 2000. The expansion of Japanese automotive
industry threatened domestic production in the U.S. and Europe. It urged the U.S. and European
governments to apply intervention policies such as import quotas, tariffs and Voluntary Export
Restriction (VER). The differences between craft production, Fordism mass production and Japanese
lean production is summarized in Table 1.
3Biswajit, N. et al. (2007, July) Changing Features of the Automobile Industry in Asia: Comparison of
Production, Trade and Market Structure in selected Countries, Asia-Pacific Research and Training
Network on Trade, 37.
7
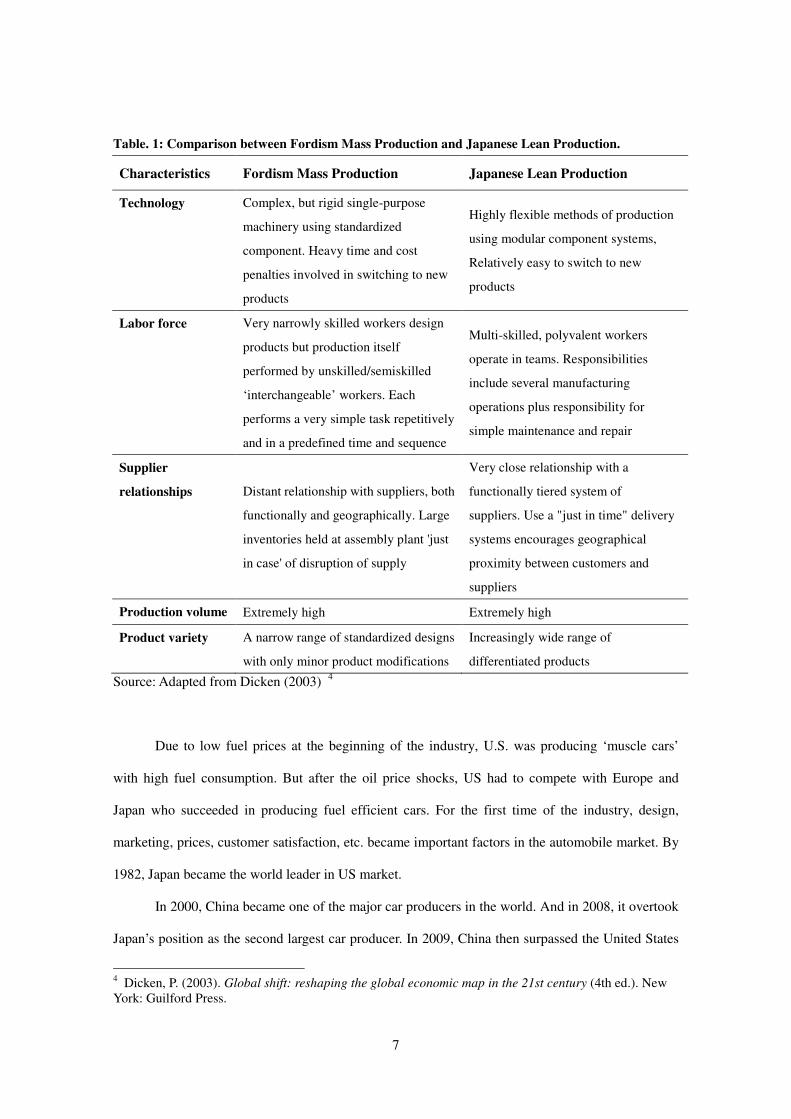
Table. 1: Comparison between Fordism Mass Production and Japanese Lean Production.
Characteristics Fordism Mass Production Japanese Lean Production
Technology Complex, but rigid single-purpose
machinery using standardized
component. Heavy time and cost
penalties involved in switching to new
products
Highly flexible methods of production
using modular component systems,
Relatively easy to switch to new
products
Labor force Very narrowly skilled workers design
products but production itself
performed by unskilled/semiskilled
‘interchangeable’ workers. Each
performs a very simple task repetitively
and in a predefined time and sequence
Multi-skilled, polyvalent workers
operate in teams. Responsibilities
include several manufacturing
operations plus responsibility for
simple maintenance and repair
Supplier
relationships Distant relationship with suppliers, both
functionally and geographically. Large
inventories held at assembly plant 'just
in case' of disruption of supply
Very close relationship with a
functionally tiered system of
suppliers. Use a "just in time" delivery
systems encourages geographical
proximity between customers and
suppliers
Production volume Extremely high Extremely high
Product variety A narrow range of standardized designs
with only minor product modifications
Increasingly wide range of
differentiated products
Source: Adapted from Dicken (2003) 4
Due to low fuel prices at the beginning of the industry, U.S. was producing ‘muscle cars’
with high fuel consumption. But after the oil price shocks, US had to compete with Europe and
Japan who succeeded in producing fuel efficient cars. For the first time of the industry, design,
marketing, prices, customer satisfaction, etc. became important factors in the automobile market. By
1982, Japan became the world leader in US market.
In 2000, China became one of the major car producers in the world. And in 2008, it overtook
Japan’s position as the second largest car producer. In 2009, China then surpassed the United States
4 Dicken, P. (2003). Global shift: reshaping the global economic map in the 21st century (4th ed.). New York: Guilford Press.

8
as the world's largest automobile producer by volume. China was able to produce 13.79 million
automobiles.5 In 2010, both sales and production topped 18 million units, with 13.76 million
passenger cars delivered. India also showed substantial growth in their car production and its share
in the global car production. Indian car production increased significantly from 1.5% in early 2000
to almost 5% in 2010.
5 The Economist (2009, October 23) China's car market: Motoring ahead
9
Section 2. CHARACTERISTICS
The automotive industry is one of the biggest and the most knowledge-intensive industries in
the world. The automotive industry’s complex6 creates more than eight million positions in vehicle
assembling, and more than forty million positions indirectly involved in related manufacture and
services sectors.7 The Automotive is essentially an assembly industry. It brings together an immense
number and a variety of components. The center of the automobile production circuit is a complex
set of relationships between assemblers of vehicle and the suppliers of component, which accounted
for 50-70% of the cost of the average car4. As figure 1 shows, there are three major processes prior
to final assembly: the manufacture of bodies, of components, and of engines and transmissions.
Those processes may be performed by the assemblers as a part of a vertically integrated sequence.
However, there is a strong trend towards the deverticalization of automobile production as
assemblers pass more responsibility to the suppliers. Figure 2 shows only three tiers of suppliers,
although there can be more8.
� First-tier suppliers supply parts which integrate whole systems such as brake
systems or internal seating directly to final assembly with intensive R&D and product
development.
� Second-tier suppliers provide modules and component parts or support services
to the first-tier suppliers to integrate into the systems supplied to final assembly.
� Third-tier suppliers supply raw materials or more generic engineering
components and services such as mechanical tools, metal castings, rubber and plastics to the
supply chain.
In essence, the automotive industry is a strongly producer-driven industry, as opposed to the
predominantly buyer-driven nature of other industry such as apparel.
6 Hülsemann, K. (2004). Purchasing in the Automotive Industry in the Process of Changes. 7 OICA (2007) Automotive Employment. 8 UNIDO (2003) The Global Automotive Industry Value Chain: What Prospects for Upgrading
by Developing Countries? Vienna: UNIDO.

10
Figure 1: Structure of the Automotive Industry
Source: Dicken9
Section 3. GLOBAL VALUE CHAIN IN AUTOMOTIVE INDUSTRY
Global Value Chain (GVC) typically consists of lead firms and suppliers. In case of
automotive industry, lead firms will be OEMs who decide strategy, final goods production volume
and take financial responsibility.
Globalization of Japanese automotive industry started around 1960s. Japanese companies
developed a local company around the world by doing joint ventures with local companies because
1) to sustain product supply in local market and 2) Policy of countries in East Asia supported
9 Dicken, P. (2003). Global shift: reshaping the global economic map in the 21st century (4th ed.). New
York: Guilford Press.
11
domestic production rather than import10
. This can be seen in high custom duties on finished import
products policy11
and a lot of joint ventures with the local capital12
. Almost all parts and components
for automobile production were exported out of Japan and assembled in overseas factories, also
known as the semi knocked down (SKD) or knocked down (KD) process10
. Actually, one of the
reasons that Japanese companies set up the local firms and joint corporations was to expand the
localization content and products as well13
.
In 1970s, Japanese automotive companies had to adjust currency exchange rate as it was
fixed at 308 yen per US dollar in 1971 and then it was shifted to a floating rate system in 1973. The
strong yen in 1971 impacted the management of Japanese companies in Southeast Asia. The KD
production turned out to be inefficient as it did not consider the comparative economies of scale of
each country. There were plenty of small-scale companies but they are inefficient.
In Malaysia and Indonesia, their automobile assembly industry was tied up with foreign
companies in Europe, US, and Japan. Their industry became flooded with various kinds of
small-scale companies that made production inefficient. The automobile company that invested early
in this area was Toyota and Mitsubishi Motors14
. Mitsubishi Motors developed the first Asian car in
the Philippines in 197413
.
The 1980s was the time that Japanese automotive company significantly accelerated the
Foreign Direct Investment (FDI), a global production and cross-border trade. The most influential
factor that drove this change was the appreciation of the yen according to Plaza Accord in 1985.
Since Japanese companies knew that Asian currencies were related with US dollar, investment for
production facilities became larger. The aim was to develop production base in Asia in order to
export finished car to the West. In addition, Brand to Brand Complementation Scheme (BBC), which
10 Amano, T. (2004). [Internationalization into East Asia and the growth of Japanese firms: Understanding the economic effects of global allocation and division] MMRC Discussion Paper No. 8. University of Tokyo. 11 Nakajima, J. (2000). [Japanese MNCs - A trace to millennium], Chiuokeizaisha. 12 Okamoto, Y. (1987) [Multinational enterprise and the multinationalization of Japanese business enterprise] The Journal of Economics 53(1):2-37. 13 Morimoto, H. (2006). [Interfirm differences of strategic behaviors among Japanese firms under the environment of East Asia], Japan Academy of International Business Studies 12:291-305. 14 Shimokawa, K. (1998). [Direct investment and the development of international division of labor in Japanese automobile companies in Asia] The Hosei Journal of Business 35(3): 45-60
12
could reduce parts’ import duties, also started implementation in this period. BBC was implemented
by Toyota, Mitsubishi, Nissan, and other car manufacturers14
. The emergence of global sourcing
patterns has been and encouraged by trade and investment liberalization through World Trade
Organization (WTO) agreements.
In 1990s, Plaza Accord in 1985 still impacted Japanese car export negatively. Together with
the bubble economy, Japanese companies increased their production activities to East Asia which
has continued to industrialize. They either re-exported the products to advanced nations or even
return to Japan (re-import). The formation of such a route resulted in trade frictions with advanced
nations and reduced roundabout export10
. Developed country, or advanced nation, suppliers have
increased their own involvement in FDI and trade, while developing country suppliers have
increased their capabilities. The largest suppliers, all based in developed countries, have become
‘global suppliers’ with multinational operations and an ability to provide goods and services to a
wide range of lead firms15
. ASEAN concentrated in the production of parts such as transmission,
steering gear, floor panel, and radiator, which were being supplies to other countries. The automobile
industry in East Asia is considered a “national industry” where the government intervenes, except in
Singapore. Therefore, part import duties are high in ASEAN. Moreover, there is an uncertainty that a
future tariff rate is also influenced by the government16
.
After 2000, in the last 15 years10
, “the production shift to East Asia of Japanese companies
was a structural adjustment through international division of labor rather than the hollowing out of
Japanese industry.” Although Japanese companies were performing measures of internal resource
utilization types, such as “maintenance of a new base,” “localization of research and development,”
“introduction of a supply chain,” and “reexamination of procurement and sales” in Asia,
management risk would still be high. Consequently, Japanese companies had to carry out a strategic
15 Sturgeon, T.J. and Lester, R.K. (2004) ‘The new global supply-base: New challenges for local
suppliers in East Asia’ in Shahid, Y., Anjum, A.M. and Nabeshima, K. (Eds): Global Production
Networking and Technological Change in East Asia 16 Okamoto, Y. (ed.). (1998). [Japanese companies in East Asia] Yuhikaku.

13
alliance with the West and with Asian companies17
.
Due to trade liberalization, the competition in the automobile industry has become more
global. Therefore, car manufacturers realize the benefits from a global viewpoint of reorganizing
their production bases in Asia. The reorganizing includes (a) the formation of an export base in
Thailand, (b) the maintenance of regional division of labor, and (c) having a regional base for the
ASEAN4 (Indonesia, Malaysia, Philippines, and Thailand). Japanese companies thus initiated
regional division of labor to substitute for the constraints of ASEAN4 (i.e., small domestic markets).
They began to apply this regional division of labor strategy globally18
. Keeping in sync with current
themes like “China market”, the key to the growth of the Asian car manufacturing industry is
“supply chain management (SCM),” and “environmental technology”. Furthermore, Toyota
launched the IMV (Innovative International Multi-purpose Vehicle) project, which emphasized on
involving local workers in the design process. From the procurement point of view,
local-design-vehicle will strengthen auto parts suppliers in ASEAN. It will let the suppliers have a
higher possibility of being exposed to the wave of selection19
.
17 Uchibori, H. (2004). [Reviewing the Asian strategy of Japanese companies: An analysis of the present state and future prospects of Asian business from the survey on Japanese companies] Japan Academy of
International Business Studies 10:169-178. 18 Mori, M. (2004). [The strategy for East Asia of Japanese automaker which strengthens a global inclination], RIM Taiheiyo Business Joho 4(13)54-74. 19 Yamada, Y. (2006). [Measuring ability of the Asian motor parts industry - Mainly on ASEAN, China, Indian competitive power investigation] JETRO Sensor, December 2006, 24-32.
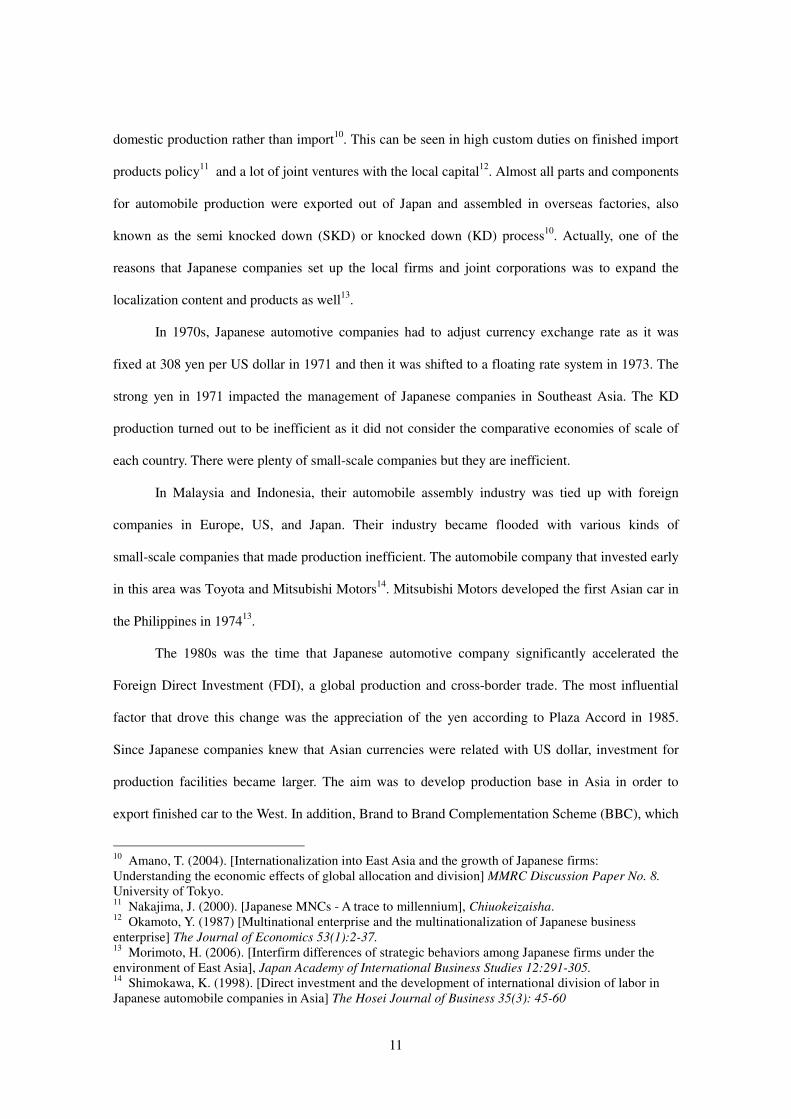
14
Figure 2: Automotive production in Asia
Source: Dicken10

15
Figure 3: Japanese Automotive Industry Production and export
Source: Japan Automobile Manufacturers Association, Inc. (JAMA)
Currently, automotive companies focus at final vehicle assembly. And by extension, parts
production is largely close to end markets because of political sensitivities. In many countries, high
levels of motorization and the tendency for automakers to ‘build where they sell’ have also
encouraged the dispersion of final assembly.
In addition, while the automotive industry has become more unified globally since the
mid-1980s, it has also established strong regional-scale patterns of integration. In contrast, other
high-volume, consumer-oriented manufacturing industries, like apparel and electronics, have
developed global-scale patterns of integration.
Another feature of the automotive industry is that there are few fully generic parts
sub-systems that can be used in different end products without heavy customization. Parts and
sub-systems tend to be specific to particular vehicle models. The absence of open, industry-wide
standards weakens value chain modularity. It also ties suppliers to lead manufacturers, limiting
economies of scale in production and economies of scope in design. Suppliers are often the sole
source for specific parts or module. This creates the need for close collaboration, raises the costs for
suppliers that serve multiple customers and concentrates most design work into a few geographic

16
clusters. Because value chain modularity is limited, relationships between lead firms and suppliers
tend to be relational or confined in character.
A grander degree of global integration in the automotive industry has developed at the level
of design, as global firms pursued to leverage design efforts across products sold in multiple markets.
The work of vehicle design and development remains to be concentrated in the headquarters of lead
firms. In addition, suppliers have taken on a larger role in design and have established their own
design centers nearby their major customers for better collaboration. Because centrally designed
vehicles are tailored to local markets and parts are manufactured in multiple regions. Therefore,
design activities and buyer–supplier relationships typically span multiple production regions. This
led to local, national and regional value chains in the automotive industry being ‘nested’ within the
global organizational structures, as shown in Figure 4
Figure 4: The nested geographic and organizational structure of the automotive industry
Source: Sturgeon; Van Biesebroeck and Gereffi20
20 Sturgeon, Timothy; Van Biesebroeck, Johannes; and Gereffi, Gary. (2007) “Prospects for Canada in
the NAFTA Automotive Industry: A Global Value Chain Analysis.” Industry Canada, Research Report.

17
CHAPTER 3. BACKGROUND ON ASEAN
ASEAN, Association of Southeast Asian Nations, is a geo-political and economic
organization of countries in Southeast Asia. This chapter provides information regarding ASEAN
countries. The chapter will be divided into 4 sections of: ASEAN profile, recent economic trends,
ASEAN countries policy challenge and ASEAN and Japan.
Section 1. ASEAN PROFILE
In 2009, ASEAN has a population of 592 million people with a combined GDP of US$1.49
trillion. Comparing to the world’s two most populated nations, China or India, ASEAN’s population
is around one-half and its GDP is about one-fifth to the US, which is the country with world’s largest
economy. ASEAN’s labor force excluding Cambodia, Laos and Myanmar was 244 million in 2008,
with an average growth rate of 1.7 percent per annum since 2000. With only 28% of population
below 15 years old and 5.7 percent of post-retirement group of above 65 years old, the majority of
ASEAN’s labor force is considerably young. In term of geographical location, ASEAN is
strategically located at the crossroads of world shipping and air routes surrounded by China, Japan
and Korea in the northeast, India in the west and Australia and New Zealand in the south. This
makes ASEAN waters one the busiest sea with 60% of the world’s maritime trade passes through.
As Asia economic grows, owing to the rise of China and India, ASEAN’s location advantage is also
set to increase. ASEAN has a diversity of unique natural resource with its land area of 4.4 million
square kilometer. Eight of the ASEAN member countries (Brunei, Cambodia, Indonesia, Malaysia,
Myanmar, the Philippines, Thailand and Vietnam) have oil and gas resources. Three of those (Brunei,
Malaysia and Indonesia) rank in the world’s top six liquefied natural gas producers.
Despite the historical and political conflicts between border nations, ASEAN has been
promoting peace and stability in the region by banning the use, or threat, of force to manage
disagreement between nations. Although there are occasional disputes, there has been no war among
the members since ASEAN inception. ASEAN countries share the same geographical area but they

18
are very diverse in many aspects, resulting in a diverse cultures and traditions and wide
social-economic disparity.
In terms of population, Indonesia is considered the largest with 228 million, which is 40
percent of ASEAN’s population. The second most populated country is Vietnam with 86 million
people. The smallest population country, Brunei, has 0.4 million people. Looking at size of economy,
Indonesia is also the largest with 34 percent of ASEAN’s total GDP. It is then followed by Thailand,
with 20 percent, and Malaysia, with 14 percent. Laos has the smallest economy with a GDP of 0.5
percent (Table 2).
Table 1: 5 ASEAN countries’ profile
Source: Adapted from OECD 2012
Section 2. MACROECONOMIC TREND
ASEAN region faced its largest drop in GDP annual growth in 2009 of 1.2 % since the Asian
financial crisis of 1997-9821
. However, ASEAN showed a dramatic recovery in 2010 at average
GDP annual growth of 7.1% thanks to the increase in exports in the manufacturing sector and
increase in domestic demand. From increase in manufacturing output, it led a more solid labor
21 Wong, M., Shankar, R., Toh, R. (2010) ASEAN competitiveness report 2010.
Indonesia Malaysia The Philippines Thailand Viet nam
Medium-term economic outlook
GDP growth
(2012-16 average, % change)6.6 5.3 4.9 4.5 6.3
Current account balance
(2012-16 average, % of GDP)-1.0 9.1 2.3 2.5 -4.0
Fiscal balance
(2012-16 average, % of GDP)-1.1 -4.4 -2.8 -2.4 -3.5
Basic data (in 2010)
Total population 238 million 28 million 93 million 67 million 87 million
Population of capital city 9.6 million 1.7 million11.6 million
(in 2007)10.2 million 6.6 million
GDP per capital at PPP
(current USD)4,394 14,670 3,737 9,187 3,134

19
markets and higher wage.22
Six Southeast Asian countries, Indonesia, Malaysia, The Philippines,
Thailand, Singapore and Viet Nam, have an average GDP growth of 5.0% in 2011. Though
moderate, it is expected to remain this strong through 2016, according to the OECD Development
Centre’s Medium-term Projection Framework. The six ASEAN countries are predicted to
accomplish the pre-crisis level, which is an average gross domestic product (GDP) growth rate of
5.9%, by 201622
.
The leader of growth in this region is likely to be Indonesia with its flexible domestic
demand. Malaysia will also have robust growth in the medium term due to its relatively strong
investment.
The Philippines economy also shows strengths thanks to domestic demand and remittances of
workers. Due to weaker global trade flows, growth rate of Singapore is expected to be lower than the
2003-07 rate. For Thailand, the unprecedented scale of floods has added more risk to its near-term
prospect. Viet Nam’s tightening of monetary policies to bring inflation under control seems to affect
the near-term growth, though the medium term outlook remains robust.3
Table 2: Real GDP growth rate of 6 ASEAN countries
Note: The cut-off date of data is 1 November 2011
Sources: Adapted from OECD Economic Outlook, No. 90
22 OECD (2012), Southeast Asian Economic Outlook 2011/12, OECD Publishing. [online] Available at: http://dx.doi.org/10.1787/9789264166882-en [Accessed: February 15, 2012]
2010 2011 2016 Average 2003-07 Average 2012-16
Indonesia 6.1 6.3 6.9 5.5 6.6
Malaysia 7.2 4.6 5.6 6.0 5.3
The Philippines 7.3 4.5 5.1 5.7 4.9
Singapore 14.5 5.6 4.8 7.5 4.6
Thailand 7.8 2.5 4.9 5.6 4.5
Vietnam 6.8 5.9 6.7 8.1 6.3
Average of six countries 7.6 5

20
Section 3. RECENT ECONOMIC TRENDS
Recent trade data shows that some decreasing in exports of several ASEAN countries,
according to Asian Business Cycle (ABCIs), due to less demand in OECD countries. Even though
the whole region’s domestic demand is robust, there are substantial differences among countries. For
example, there is strong domestic demand in Indonesia but relatively weak in The Philippines.
Pressures from inflations also still exist in the region, particularly in Malaysia and Thailand. And
global economic slowdown will too affect ASEAN.
There are many key events that hindrance ASEAN economy, most of which are external.
Such events are high oil prices, insecure economy of United States, the re-emergence of the
sovereign debt problems in Europe and the Japan disaster, the great east Japan earthquake in 2011.
The impact of the earthquake not only severely affects Japanese economy for the first two quarter. It
also responsible for major power shortages in Japan, which lead to crippled production of key
components in Japan. This results in global supply chains disruption especially in automotive and
electronics sectors. The effect of this disruption was severely suffered in Thailand and the
Philippines where production of motor vehicles and components decreased significantly from March
to May 2011. Indonesia and Malaysia also saw smaller declines in production. The Great Tohoku
Earthquake momentarily impacted activities and exports in some ASEAN countries such as
Indonesia, the Philippines and Thailand. But the scale of the negative impact seems to have been
brief.
Not so long after recuperate from the impacts of great earthquake, the supple chains of global
automotive chains was disrupted again by Thailand’s worst flood in almost 70 years. The shutdowns
of factory in Thailand caused by floods have paused many production lines. It then led to a parts
shortage for auto production in Japan and North America. In November 2011, some automakers,
Mitsubishi, Nissan and Mazda, resumed their production after suspended the operation for about one
month.

21
(index, January, 2011=100)
Figure 5: Production of motor vehicles and components in 2011
Source: CEIC
After the flooding event, Thai government takes necessary steps to prevent future floods and
to rebuild damaged infrastructure. Companies are now prone to weighing the benefits of current
clustering plants in Thailand against the benefits of risk reduction by diversifying production sites to
other countries. This could lead to investments rechanneling to neighboring countries in the region.
In order to stimulate economic growth and attract foreign investment, many ASEAN
countries have made significant investments in transportation infrastructure. In Indonesia, the
Philippines, Thailand and Viet Nam, billions worth of infrastructure projects are under construction.
On the other hand, Malaysia and Singapore are focusing on infrastructure of information and
communications technology. Singapore also is investing in research and development to optimize
possible underground space usage.
In September, ASEAN and the Asian Development Bank (ADB) announced the founding of
the ASEAN Infrastructure Fund, with an initial equity contribution of USD 485.2 million (ADB,
2011). The fund’s total lending commitment will amount to about USD 4 billion through to 2020. It
is expected to leverage more than USD 13 billion in infrastructure financing by 2020 with
0
20
40
60
80
100
120
140
Jan Feb Mar Apr May Jun Jul Aug Sep
Indonesia Malaysia Philippines Thailand
The Great Tohoku
Earthquake in Japan
The floods
in
Thailand

22
anticipated 70% co-financing by the ADB. With the commitment to improve infrastructure in the
regions, various medium-term plans growth looks promising.
Section 4. ASEAN COUNTRIES POLICY CHALLENGE
Many Asian countries experienced that outstanding growth rates in the region have brought
about an increase in real income levels and accelerated the process of moving up the value chain.
Consequently, those countries adapt their development strategies to reflect the changing growth
dynamism in the region and international market conditions. Several new elements were put in their
medium-term development plans (in most cases, five-year plans) (Table 3.0.1).
Table 3: Medium-term development of 5 ASEAN countries
Country Period Theme/Vision
Indonesia 2010-14 Towards the realization of an Indonesia that is prosperous, democratic
and just
Malaysia 2011-15 Charting development towards a high-income nation
The Philippines 2011-16 In pursuit of inclusive growth
Thailand 2012-16 A happy society with equity, fairness and resilience under the
philosophy of Sufficiency Economy
Vietnam 2011-15 Note: Vietnam's forthcoming medium-term plan as in the process of
formulation
Source: OECD Development Center based on national sources
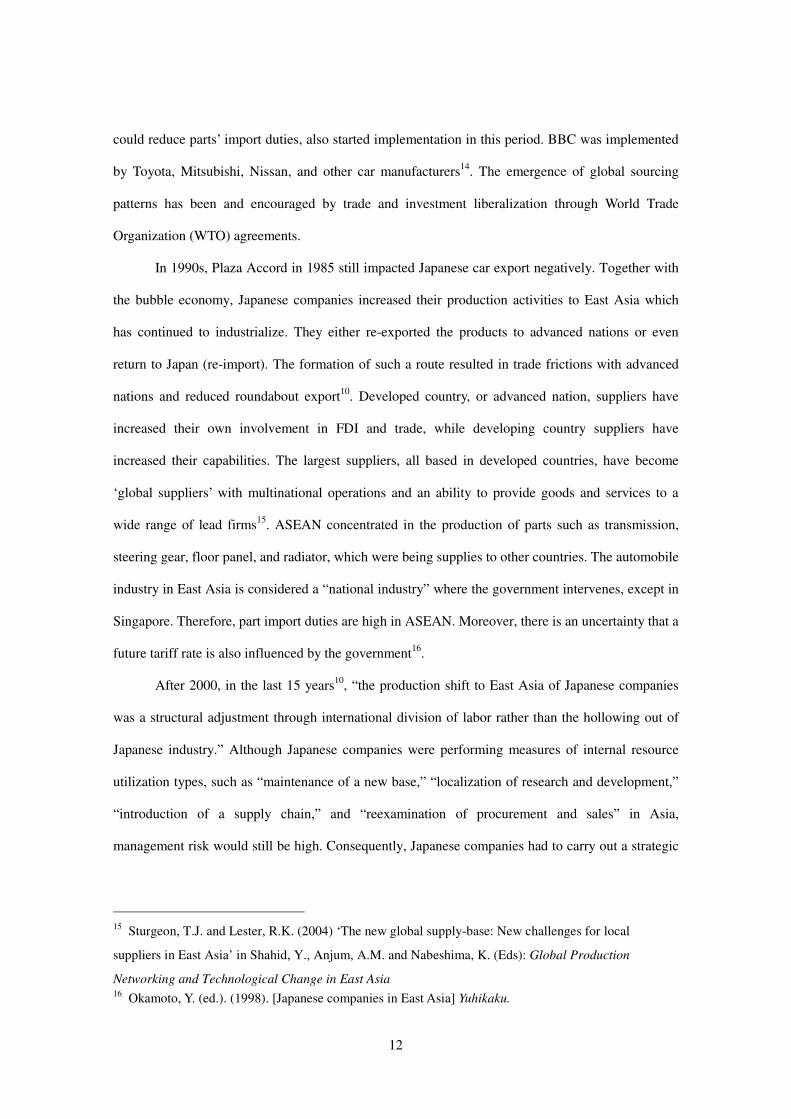
Even though different countries have different policy challenges, overall the priority areas
identified in the national plans focus on human capital development, infrastructure investment,
public sector efficiency (in particular taxation), product market liberalization and labor market
reform. The overlap across priority areas is large but, even within the same broad policy area,
challenges facing each country differ depending on their different economic circumstances, such as
their income levels and regulatory frameworks.

23
Human capital development has been identified as a key policy area in all the development
plans. This reflects the need to meet the requirement for labor with ever increasing skills amid rapid
transformation of economic structures. The outstanding growth performance of the region over the
past decade has led to increased real incomes, effecting in a decline of international competitiveness
in labor-intensive industries in some countries, while at the same time the upgrading of industrial
structures to higher levels on the value chain have increased the demand for more skilled labor. To
develop high skill and knowledge intensive industries and strengthen their competitiveness in the
medium to long term, a flexible education system that is responsive to industry needs is needed.
Overall, the region has been relatively successful in increasing education levels through
increasing enrolment rates. However, education systems need to be more outcome-oriented to
guarantee a high-quality labor force. The particular areas countries have prioritized in their
development plans to achieve this objective differ someway. For example, Indonesia needs to pay
more attention to improving the outcomes of tertiary education, in particular to ensure that the skills
of graduates correspond to those required by industry. Observing outcomes of the education system
in Thailand are not so satisfied. Stronger Technical Education and Vocational Training (TEVT) is
important in the Philippines and Viet Nam in order to help their industries to move up in the value
chain. Infrastructure investment is a bottleneck to growth in several economies in the region. This is
especially critical in Indonesia and the Philippines, where the lack of adequate transport
infrastructure impedes efficient trade activities; outdated information and communications
technology (ICT) infrastructure delays business transactions; and insufficient or unreliable basic
utilities make economic activities impossible altogether in some areas. While improvement in
infrastructure will depend mainly on individual country efforts, there is also a need for co-ordination
across countries in the region. Intra-regional infrastructure needs to be further developed to reap the
full benefits of regional integration. The comparatively low level of tax revenue in ASEAN countries
(which averages 15% of GDP in the region)1suggests that there is room for domestic resource
mobilization through tax reforms. Reforming tax systems is required to meet development needs
such as infrastructure investment, education and health services (partly due to an ageing population).

24
Strengthening small and medium enterprises (SME) development is also crucial for ASEAN
countries, given that most of these economies are SME-based. In particular, fostering an SME base
that is competitive in the international market is key to sustaining growth. The internationalization of
SMEs should be supported by government-sponsored training and capacity building programs and
should be part of an integrated framework aimed at promoting growth, enhancing competitiveness
and fostering innovation. Support services targeted at SMEs need to be better co-ordinated among
provider agencies in order to reduce the administrative burden on SMEs and to assist them to fully
reap the benefits of available schemes.
25
Table 4: Summary of medium-term policy challenges and responses
Source: OECD Development Centre
Section 5. ASEAN AND JAPAN
In 2010, combined automotive sales in the ASEAN’s six main markets, Thailand, Indonesia,
Vietnam, The Philippines, Singapore, and Malaysia, ASEAN marked record-high automobile
production and sales volumes. Indeed, ASEAN represents one of the fastest-growing production
bases and automobile markets in the world. In 2010, Japanese auto manufacturers achieved a total
InfrastructureSpeed up transport infrastructure development by imporving the
regulatory environment..
Human capital
development
Improve the outcome of higher educatio and reduce urban-rural
disparities in access to educational infrastructure
Labor market Reform labor market regulation to increase employment
SME developmentEnhance SME development with special attention to capacity
building and innovation
Human capital
development
Strengthen the link between industries and academic institutions to
improve labor force skills and to enhance research and development
Taxation and fiscal
system
Reform the tax regime and improve efficiency of public spending to
bolster the sustainabiliry of public finances
InfrastructureIncrease funding for infrastructure development and attract more
private participation
Human capital
development
Improve the access to and the quality of basic education and
strengthen technical education and vocational training
TaxationReform the tax system by enhancing tax collection and widening
the tax base
HealthReform health care schemes to provide a higher quality of and
equal access to services
Human capital
developmentImprove outcomes in education and reduce urban-rural dispariries
Agriculture Enhance agricultural productivity and improve jobs in the farm sector
Enterprise
development
Speed up the reform of state-owned enterprises, particularly by
improving the governance and management
Macroeconomic
managementEstablish and adequate monetary policy framework to control inflation
Human capital
developmentIncrease skilled labor by education reform
Philippines
Thailand
Viet Nam
Indonesia
Malaysia
26
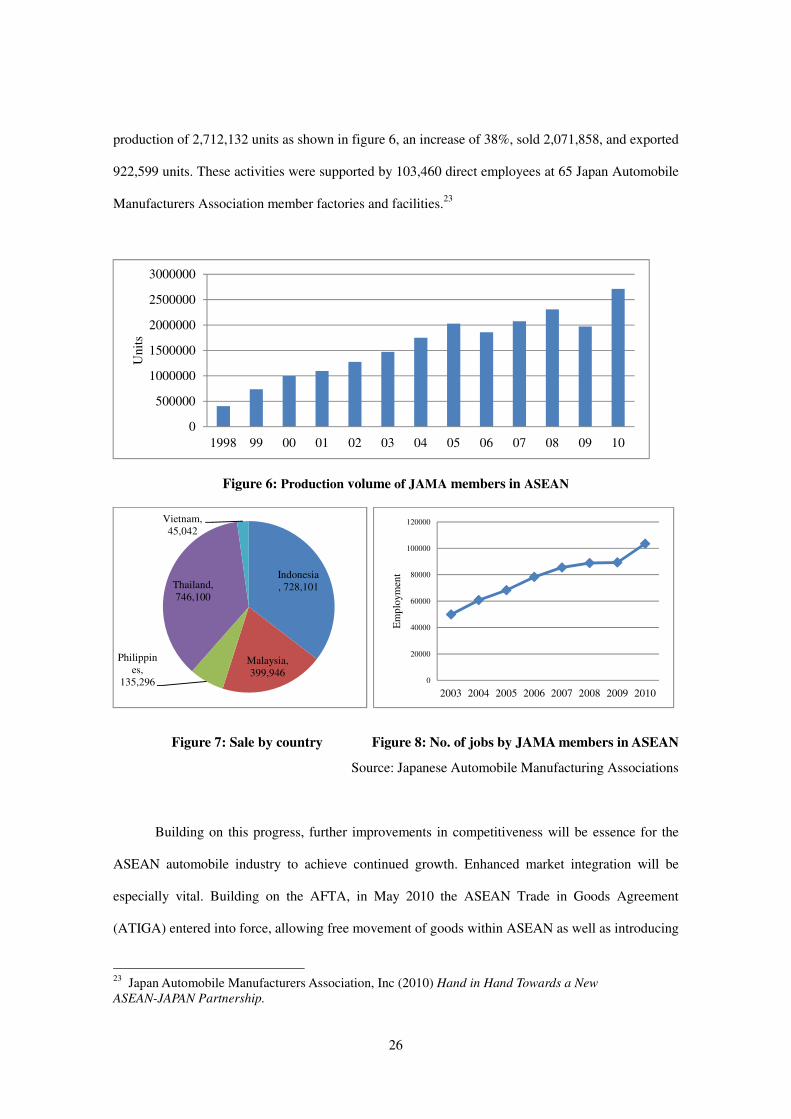
production of 2,712,132 units as shown in figure 6, an increase of 38%, sold 2,071,858, and exported
922,599 units. These activities were supported by 103,460 direct employees at 65 Japan Automobile
Manufacturers Association member factories and facilities.23
Figure 6: Production volume of JAMA members in ASEAN
Figure 7: Sale by country
Figure 8: No. of jobs by JAMA members in ASEAN
Source: Japanese Automobile Manufacturing Associations
Building on this progress, further improvements in competitiveness will be essence for the
ASEAN automobile industry to achieve continued growth. Enhanced market integration will be
especially vital. Building on the AFTA, in May 2010 the ASEAN Trade in Goods Agreement
(ATIGA) entered into force, allowing free movement of goods within ASEAN as well as introducing
23 Japan Automobile Manufacturers Association, Inc (2010) Hand in Hand Towards a New
ASEAN-JAPAN Partnership.
0
500000
1000000
1500000
2000000
2500000
3000000
1998 99 00 01 02 03 04 05 06 07 08 09 10
Unit
s
Indonesia, 728,101
Malaysia, 399,946
Philippines,
135,296
Thailand, 746,100
Vietnam, 45,042
0
20000
40000
60000
80000
100000
120000
2003 2004 2005 2006 2007 2008 2009 2010
Em
plo
ym
ent

27
new policies not yet sufficiently specified within the existing AFTA-CEPT, including elimination of
nontariff measures, trade facilitation, Rules of Origin refinements, and the establishment of
provisions on standards, technical regulations and conformity assessment procedures. ATIGA is
anticipated to contribute significantly to the realization of the ASEAN Economic Community (AEC)
by 2015.
ASEAN cooperation has made steady progress with a goal to create an ASEAN Community
by 2015 that will be built on the three pillars of an ASEAN Economic Community (AEC), ASEAN
Political-Security Community and ASEAN Socio-Cultural Community. Implementation has fallen
behind schedule, as almost 20 percent of deliverables under the AEC Blueprint for 2008-2009 still
have not been achieved by October 2010. Measures that have not been implemented mainly involve
the ratification of important economic agreements by individual members. Within the AEC context,
promoting harmonization and mutual recognition of automotive technical standards is an important
issue for the automobile industry. ASEAN has also been expanding its linkages with external
partners, with a widening network of free trade agreements, which have been concluded with China,
Japan, Korea, Australia and New Zealand, and India to-date. ASEAN is concurrently considering
proposals for an East Asian Free Trade Area for ASEAN+3 countries and a Comprehensive
Economic Partnership for East Asia involving ASEAN+6 countries. ASEAN also cooperates with
the Plus Three partners of China, Japan and South Korea on a number of financial initiatives, the
most significant of which is the Chiang Mai Initiative Multilateralization in 2010, which is the
multilateralization of a currency swap arrangement established to address short-term liquidity
problems among participants and strengthen regional financial stability.
ASEAN has devoted a great deal of attention to the establishment of the ASEAN Mutual
Recognition Arrangement (MRA), anticipated in 2012. Concepts like the Single Window System
(enhancing simplification of customs procedures) and a pilot project covering self-declaration of
origin have been highlighted as important topics and are currently being discussed. A lot of
collaboration initiated in ASEAN aim to enhance economic in the region by serving requirement for
FDI.
28
CHAPTER 4. RESEARCH METHODOLOGY
Chapter 4 presents the process of obtaining data in this thesis from existing studies and from
interviews. This chapter consists of 3 sections including research design, general description of
interview sheet and data analysis.
Section 1. RESEARCH DESIGN
This comparative research aims to analyze attractiveness of each ASEAN country (Indonesia,
Malaysia, Philippines, Thailand and Vietnam) in automotive manufacturing investment. In order to
understand the actual situation and factors influencing Japanese automaker investment decision in those 5
Southeast Asia countries, the author has conducted a research on the following.
1. Research on the most updates information of each country situations and strategies
in various reliable articles, journals and textbooks.
2. Interview with 3 persons in charge of automotive manufacturing investment
strategies in Asia-Oceania area.
Interviews were conducted by utilizing Global Competitiveness Index (GCI) developed by
Professor Xavier Sala-I- Martin from World Economic Forum (WEF). GCI is a comprehensive tool
that measures the microeconomic and macroeconomic foundations of national competitiveness.
There are many determinants driving productivity and competitiveness. WEF has grouped these
components into 12 pillars of competitiveness:
1) Institutions, 2) Infrastructure, 3) Macroeconomic environment, 4) Health and primary
education, 5) Higher education and training, 6) Goods market efficiency, 7) Labor market efficiency,
8) Financial market development, 9) Technological readiness, 10) Market size, 11) Business
sophistication, and 12) Innovation
However, factor 8 and factor 12 are cut off from this research. Factor number 8, financial
market development, is cut off because the financial support, such as loans or well-regulated
securities exchanges, is not necessary for Japanese Automaker since they bring their own money to

29
invest. The same reason can be apply to factor 12, Innovation, because they also bring their own
technology to produce a car. Therefore, only remaining 10 factors were used in the interview.
Section 2. GENERAL DESCRIPTION OF INTERVIEW SHEET
In order to understand actual factors influence country selection for investment in automotive
manufacturer among five ASEAN countries, 10 factors modified from GCI of WEF24
are used in the
interview sheet which can be divided into 3 parts.
Part I: Factors influence analysis:
All 10 factors are listed for interviewees to weight influential level on country selection for
investment. These factors are; 1st factor: Institutions
This factor considers the quality of both public and private institutions. Elements in
consideration are government efficiency, security levels, corporate governance, and
perceived fairness and transparency of public institutions.
2nd
factor: Infrastructure
Good infrastructure results in economic growth and poverty reduction. Related elements
are quality and extent of general and specific infrastructure. This includes roads, railroads,
ports, air transport, electricity, and telephony.
3rd
factor: Macroeconomic environment
The economy can sustainably grow with a stable macroeconomic environment. The
stability includes the government budget balance, public debt, inflation, the national
savings rate, the interest rate spread, and the country credit rating.
4th
factor: Heath and primary education
Efficient operations and high productivity require a healthy labor force with quality
education. This extent of this factor can be determined by general health level of a
country’s population and the quality of, and access to, basic education.
24 World Economic Forum. (2011). The Global Competitiveness Report 2011-2012

30
5th
factor: Higher education and training
Higher education is crucial for economies that want to move up in the value chain. This
includes the quality of, and access to, secondary and university level education and the
quality of on-the-job training.
6th
factor: Goods market efficiency
Healthy market competition is important in driving market efficiency. The elements to
measure good market efficiency are the extent of domestic and foreign competition in a
given market and the quality of demand conditions.
7th
factor: Labor market efficiency
The flexibility of the labor market ensures the efficient allocation and use of talent.
Therefore, this factor looks into the ability to shift workers from one economic activity to
another rapidly and at low cost.
8th
factor: Technological readiness
The penetration of information and communication technologies (ICT) and firms’ capacity
to adopt and leverage technology to enhance their productivity, both are the measurement
of Technological readiness of the country.
9th
factor: Market size
The market size factors consider both the size of the domestic market as well as the export
markets. The size of the market affects productivity because large markets allow firms to
exploit economies of scale.
10th
factor: Business sophistication
Business sophistication is about the quality of country’s business network and the quality
of individual firms operations. It looks at the degree of sophistication of operations and
company strategies and the presence and development of clusters.
Interviewees are required to check on influential level of each factor. Figure 9 show scale
used for the factor influential level to investment decision. More detail can be found in appendix 1.

31
Very small
influence
Small
influence
Influence Quite
influence
Very large
influence
1 2 3 4 5
Figure 9: 5-scales used in interview for the factor influential l
Part II Each country situation:
Current status of five Southeast Asia (Indonesia, Malaysia, Philippines, Thailand and
Vietnam) will be considered against automotive company expectation based on those 10 factors.
Each country will be evaluated by each factor with 5-scales as shown in figure 10. Interview sheet is
attached in appendix 2.
Very poor Poor Acceptable Satisfied Very satisfied
1 2 3 4 5
Figure 10: 5-scale used in interview of each ASEAN country satisfaction
Part III Comments on Myanmar:
As Myanmar is opening up, it has a potential to be an emergence as Asia’s next tiger economy.
Many businesses have interest in investment in Myanmar such as infrastructure, banking and mining.
This part aims to gather information about Japanese automotive industry in Myanmar from
automotive investor point of view. Interview form can be seen in appendix 3.

32
Section 3. DATA ANALYSIS
After all data are collected by interviewing with people in charge of Japanese automotive
manufacturing investment and researching on previous studies, data analysis will be done with
following processes;
1. The first process aims to pick up factors that significantly influence investment decision
from the total of 10 factors. The method that will be used to filter out the significant
factors from other factors is selecting factors by using responses from personnel working
in automotive manufacturer investment. The author will choose significant factors by
using the level of influence determine by those three interviewees’ perspective.
2. The second process will evaluate current status of each country. It will be done by using
factors retrieved from the first process. The analysis will concentrate on explaining the
reason behind such evaluation on each significant factor in each country. Once analyzed,
the conclusion on, current and prospective, overall attractiveness of automotive
investment from Japanese investor perspective will be drawn.
3. The third process will focus on Myanmar attractiveness in automotive investment. The
evaluation process will be done with data from the interview and factsheets of current
Myanmar condition. Due to the new entrant status of Myanmar, this part aims to find the
requirements automotive manufacturer investors are looking for in the country.

33
CHAPTER 5. RESEARCH ANALYSIS
Chapter 5 presents the analysis of the result. This chapter contains three sections with
interview results, each country circumstances and Myanmar. The first section focuses on the factors
that influence Japanese automotive investment decision by using data from the interviews. Followed
by each country circumstances, this section presents interviewees’ opinion on each ASEAN
countries. Finally, since Myanmar is a newly opened country, the last section denote to interviewees’
view on this emerging market.
Section 1. INTERVIEW RESULTS
In order to understand factors influencing investment decision in actual practice, the author
conducted interviews with person in charge or person related to Asia-Oceania investment strategies
of three respected global automotive companies. Among ten factors modified from GCI of WEF, all
three companies emphasize “Market size” as the most influential factor for selecting country to
invest. Both company A & B consider domestic market size much more heavily than export potential
to foreign market (with the portion of 80:20). Access to large market allows company to benefit from
economies of scale in its production. According to company C, target investment country could be
separated into three types, categorized by market environment as follows:
1. Market for only selling car such as Singapore
2. Market for only car production such as Indonesia and Malaysia
3. Market for both domestic selling and production for export such as Thailand
Since “Market size” is the most influential factor for investment, according to the interview,
Thailand is considered to be the regional hub of these respectable global automotive companies. This
is due to the ability of Thailand to be both a market for domestic and a production site for
international exports.
“Macroeconomic environment” was considered as a very large influence factor for company
B and C for the reason of sustainable growth in long-term. However it is only considered as a fair

34
influence for company A. “Institution” factor influences these 3 companies differently. It has very
large influence on company C, large influence on company B and fair influence on company A.
Points of concern in institutions are about long term, consistency and reliable government policy in
supporting of auto industry.
Good infrastructure is also important for company A and B to select country to invest.
Infrastructure is necessary because assembly factory needs sufficient parts to be supplied in
designate time. Finished cars need to be sent to dealers all over country for domestic market and to
overseas dealers for foreign market, both requiring decent infrastructure as well.
Competitive advantage such as trade tariff or trade barrier is important for company A and B.
Therefore, “Goods market efficiency” is considered to be a large influence factor to investment
decision for those companies. Tax and tariff structure is important for both demand and production
as tax and tariff are treated as an additional cost. Therefore, demand can be affected by rising in
selling prices from extra tax and tariff cost.
“Business sophistication” is also crucial for investment decision as this factor is considered
as a very large influence factor for company A and large influence factor for company B. Japanese
automotive company is well-known in supplier network or keiretsu. Therefore, to apply the system
to another country, efficient in business sophistication is required. It is required because it could
support the value chain, supplier operation, production process sophistication. Efficient in business
sophistication will increase ability to compete both in cost and quality.
Another interesting factor is “Labor market efficiency” which is considered as a very large
influence for company A and fair influence for company B. Automotive assembly factory requires a
large labor force, so the cost is also excessive. The cheaper labor wage, the more cost
competitiveness company can tradeoff. Therefore, country with cheaper labor cost will have
attractiveness in investment especially for manufacturing company.
For other 3 factors i.e. “Higher education-training”, health and primary education and
technological readiness are considered fair influence and small influence to investment decision for
all three companies. The reason is those companies have their own education and training system.
35
Training will be conducted internally so public education is not crucial for business operation.
Similar to technological readiness, each company will transfer its own technology. The companies
also build the technology up themselves such as outsourcing satellite for overseas video call.
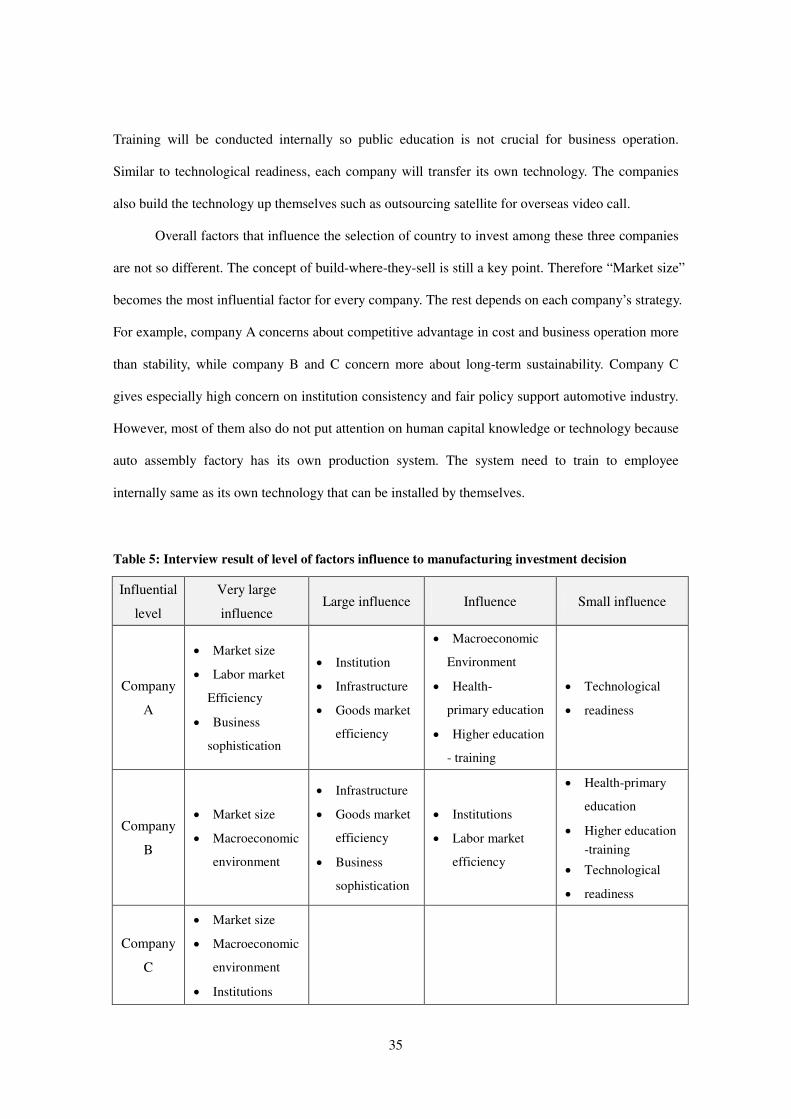
Overall factors that influence the selection of country to invest among these three companies
are not so different. The concept of build-where-they-sell is still a key point. Therefore “Market size”
becomes the most influential factor for every company. The rest depends on each company’s strategy.
For example, company A concerns about competitive advantage in cost and business operation more
than stability, while company B and C concern more about long-term sustainability. Company C
gives especially high concern on institution consistency and fair policy support automotive industry.
However, most of them also do not put attention on human capital knowledge or technology because
auto assembly factory has its own production system. The system need to train to employee
internally same as its own technology that can be installed by themselves.
Table 5: Interview result of level of factors influence to manufacturing investment decision
Influential
level
Very large
influence Large influence Influence Small influence
Company
A
• Market size
• Labor market
Efficiency
• Business
sophistication
• Institution
• Infrastructure
• Goods market
efficiency
• Macroeconomic
Environment
• Health-
primary education
• Higher education
- training
• Technological
• readiness
Company
B
• Market size
• Macroeconomic
environment
• Infrastructure
• Goods market
efficiency
• Business
sophistication
• Institutions
• Labor market
efficiency
• Health-primary
education
• Higher education
-training
• Technological
• readiness
Company
C
• Market size
• Macroeconomic
environment
• Institutions

36
Section 2. EACH COUNTRY CIRCUMSTANCE
Second part of the interview is about each country situation against these three respected
global automotive companies’ expectation. The responses are as followings;
Indonesia
Indonesia is highly evaluated among 3 interviewees from respected global automotive
companies. Indonesia receives satisfaction level of “satisfied” in “Institutions”, “Macroeconomic
environment”, “Health-primary education”, “Higher education-training”, “Goods market efficiency”,
“Labor market efficiency” and “Market size”. Technological readiness and “Business sophistication”
factors are at “acceptable” level. And Indonesian infrastructure is considered as “poor” level.
After research in more detail into Indonesia current situation, Indonesia ranks at 44 out of
142 countries of WEF in 2010 to 2012. Its institutions ranks at 61st with a score of 4.0 out of 7, a
little lower than average score of ASEAN countries (4.3). In automotive industry perspective,
Indonesia is now the third-largest car market in Southeast Asia after Thailand. Indonesia overtook
Malaysia in 2008 and became the second-largest car market in ASEAN behind only Thailand.
Indonesia then dropped back behind Malaysia again in 2009.25
In terms of “Institutions”, corruption was a major problem in the past decades. The
Corruption Eradication Commission (known as KPK for its Bahasa acronym), created in 2002, is an
independent organization that has power against corruption. However, in 2010, Indonesian
executives who participated in the Executive Opinion Survey rated that corruption was the 2nd
most
problematic factor for doing business. About 30% of them selected it as the most problematic one.
25
Business Monitor International, Indonesia Autos Report Q2 2010, February 2010, p.7, and Malaysia
Auto Report Q2 2010, February 2010, p.17
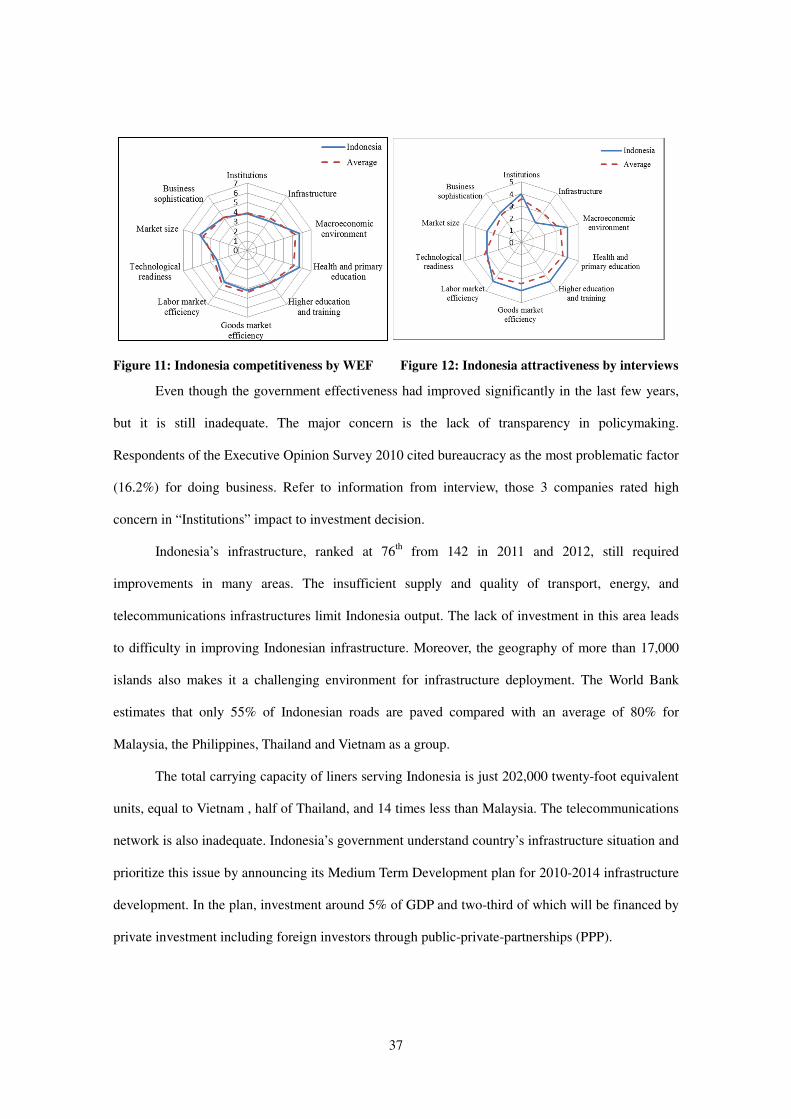
37
Figure 11: Indonesia competitiveness by WEF Figure 12: Indonesia attractiveness by interviews
Even though the government effectiveness had improved significantly in the last few years,
but it is still inadequate. The major concern is the lack of transparency in policymaking.
Respondents of the Executive Opinion Survey 2010 cited bureaucracy as the most problematic factor
(16.2%) for doing business. Refer to information from interview, those 3 companies rated high
concern in “Institutions” impact to investment decision.
Indonesia’s infrastructure, ranked at 76th
from 142 in 2011 and 2012, still required
improvements in many areas. The insufficient supply and quality of transport, energy, and
telecommunications infrastructures limit Indonesia output. The lack of investment in this area leads
to difficulty in improving Indonesian infrastructure. Moreover, the geography of more than 17,000
islands also makes it a challenging environment for infrastructure deployment. The World Bank
estimates that only 55% of Indonesian roads are paved compared with an average of 80% for
Malaysia, the Philippines, Thailand and Vietnam as a group.
The total carrying capacity of liners serving Indonesia is just 202,000 twenty-foot equivalent
units, equal to Vietnam , half of Thailand, and 14 times less than Malaysia. The telecommunications
network is also inadequate. Indonesia’s government understand country’s infrastructure situation and
prioritize this issue by announcing its Medium Term Development plan for 2010-2014 infrastructure
development. In the plan, investment around 5% of GDP and two-third of which will be financed by
private investment including foreign investors through public-private-partnerships (PPP).

38
Over the past five years, Indonesia has cut budget deficits and reduced its debt-to-GDP ratio
to below 30%. This made Indonesia successfully brought inflation under control. The savings rate is
quite high (33% of its GDP) comparing to international standards. This means Indonesia’s stock of
assets is not just growing but also incorporating more technology in order to generate productivity
gain. In addition, further reduction in debt and an improved country credit rating, would result in
lower interest payments and free up additional financial resources.
Indonesia ranks 5th
in “Market size” among all developing countries, behind only the BRICs
(Brazil, Russia, India and China). Indonesian has a population of almost 240 million people.
Between 1999 and 2009, the share of the middle class citizen has increased dramatically from
around 25 to 43% of population. Indonesia is ASEAN’s largest market, accounting for almost 40%
of the group’s GDP and population. The large size of the Indonesian population and the low level of
car ownership in the country suggest that there is a lot of potential for expansion in the automotive
industry. This makes Indonesia a base for investors interested in penetrating this fast-growing
market.
Another factor which is rated large influence to automotive investment decision is “Business
sophistication”. This factor includes quality and quantity of national business networks and
supporting industry. Auto assemble factory and its suppliers are interconnected in geographically
proximate groups (clusters) for efficient operation and innovation creation. The country has
relatively well-developed clusters with a lot of local suppliers but the products are still considered as
medium quality supplies.
Last factor is “Labor market efficiency” . Indonesia’s labor markets, ranked at (), are assessed
as less efficient than Thailand (30th
), Vietnam (46th
) and Malaysia (20th
). Severance payments for
permanent employees are equivalent to 103 weeks of salary, twice of Malaysia. This inflexibility has
a certain level of impact on the country’s economy.
Indonesia plans to follow Thailand’s footstep by offering incentives for the production of
fuel-efficient cars. The incentives are not expected to be available before 2012, but automotive
manufacturers are pleased to know that producing “greener” vehicles will become more competitive

39
in Indonesia. Nonetheless, Indonesia is still expected to be one of the better performing economies in
the ASEAN region and this should be reflected in vehicle purchases and annual sales data.26
Malaysia
According to the interview result, Malaysia’s attractiveness for global automotive company
from Japan was ranked 3rd
behind Thailand and Indonesia. According to WEF, Malaysia ranks 21 out
of 142 countries in competitiveness level. From interviewees’ expectations, Malaysia’s overall
situation is at acceptable level except “Market size” and “Business sophistication” factors are in poor
level.
Figure 13: Malaysia competitiveness by WEF Figure 14: Malaysia attractiveness by interviews
Source: Adapted WEF 2011-12
Overall, Malaysia is considerably competitive among ASEAN countries. Its world rank
competitiveness from WEF is 21st out of 142 countries. Due to domestic national car programs and a
focus on car sales and production, Malaysia has retained the highest level of passenger car sales in
ASEAN for 2009. It possesses clear strength in microeconomic competitiveness but weakness on
macroeconomic competitiveness. Malaysia’s strongest point in microeconomic competitiveness is
26
Business Monitor International (2009), “Industry News – Incentives Aim at ‘Green’ Car Production,”
Asia Pacific Automotives Insight, July 28, 2009.
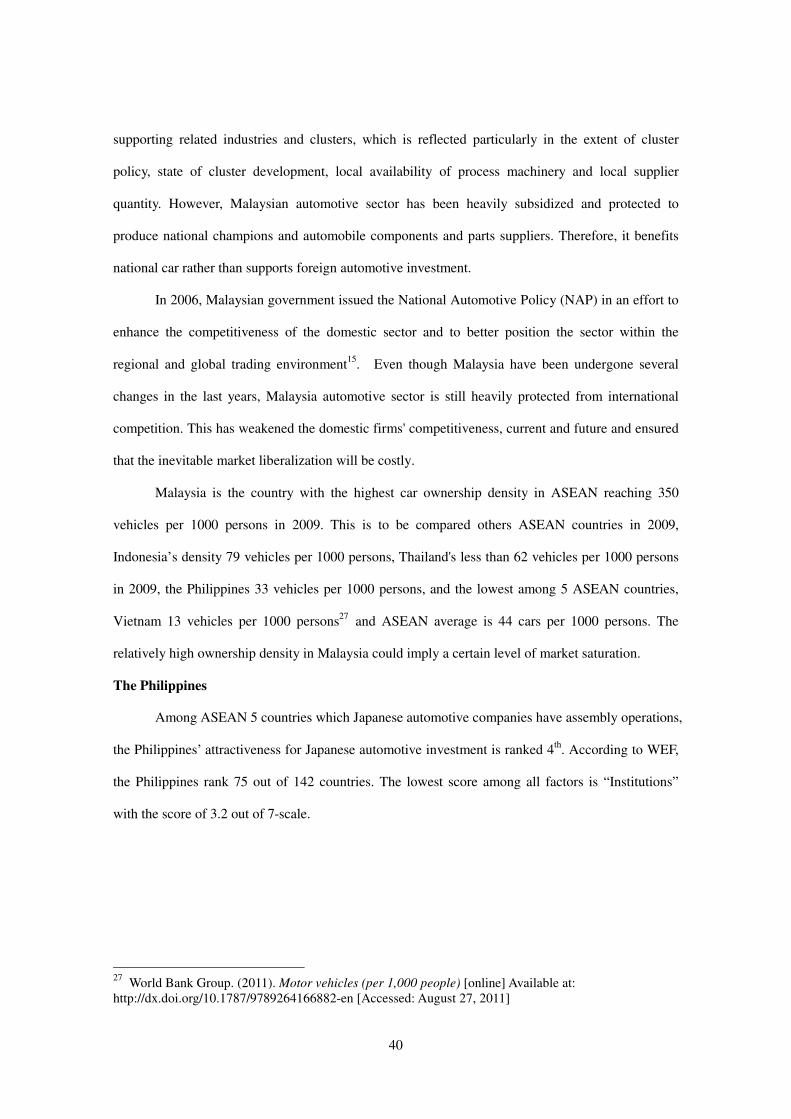
40
supporting related industries and clusters, which is reflected particularly in the extent of cluster
policy, state of cluster development, local availability of process machinery and local supplier
quantity. However, Malaysian automotive sector has been heavily subsidized and protected to
produce national champions and automobile components and parts suppliers. Therefore, it benefits
national car rather than supports foreign automotive investment.
In 2006, Malaysian government issued the National Automotive Policy (NAP) in an effort to
enhance the competitiveness of the domestic sector and to better position the sector within the
regional and global trading environment15
. Even though Malaysia have been undergone several
changes in the last years, Malaysia automotive sector is still heavily protected from international
competition. This has weakened the domestic firms' competitiveness, current and future and ensured
that the inevitable market liberalization will be costly.
Malaysia is the country with the highest car ownership density in ASEAN reaching 350
vehicles per 1000 persons in 2009. This is to be compared others ASEAN countries in 2009,
Indonesia’s density 79 vehicles per 1000 persons, Thailand's less than 62 vehicles per 1000 persons
in 2009, the Philippines 33 vehicles per 1000 persons, and the lowest among 5 ASEAN countries,
Vietnam 13 vehicles per 1000 persons27
and ASEAN average is 44 cars per 1000 persons. The
relatively high ownership density in Malaysia could imply a certain level of market saturation.
The Philippines
Among ASEAN 5 countries which Japanese automotive companies have assembly operations,
the Philippines’ attractiveness for Japanese automotive investment is ranked 4th
. According to WEF,
the Philippines rank 75 out of 142 countries. The lowest score among all factors is “Institutions”
with the score of 3.2 out of 7-scale.
27
World Bank Group. (2011). Motor vehicles (per 1,000 people) [online] Available at: http://dx.doi.org/10.1787/9789264166882-en [Accessed: August 27, 2011]
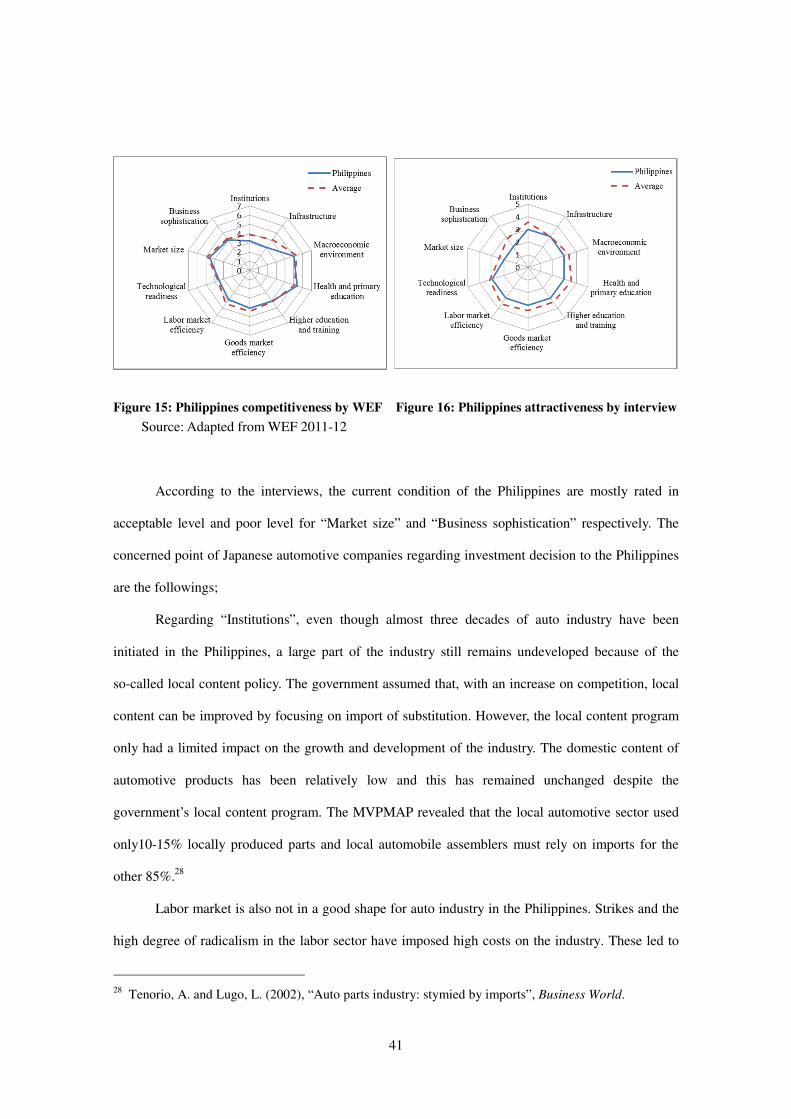
41
Figure 15: Philippines competitiveness by WEF Figure 16: Philippines attractiveness by interview
Source: Adapted from WEF 2011-12
According to the interviews, the current condition of the Philippines are mostly rated in
acceptable level and poor level for “Market size” and “Business sophistication” respectively. The
concerned point of Japanese automotive companies regarding investment decision to the Philippines
are the followings;
Regarding “Institutions”, even though almost three decades of auto industry have been
initiated in the Philippines, a large part of the industry still remains undeveloped because of the
so-called local content policy. The government assumed that, with an increase on competition, local
content can be improved by focusing on import of substitution. However, the local content program
only had a limited impact on the growth and development of the industry. The domestic content of
automotive products has been relatively low and this has remained unchanged despite the
government’s local content program. The MVPMAP revealed that the local automotive sector used
only10-15% locally produced parts and local automobile assemblers must rely on imports for the
other 85%.28
Labor market is also not in a good shape for auto industry in the Philippines. Strikes and the
high degree of radicalism in the labor sector have imposed high costs on the industry. These led to
28 Tenorio, A. and Lugo, L. (2002), “Auto parts industry: stymied by imports”, Business World.

42
very costly delays, as affected firms must readily import the materials that cannot be delivered by the
striking company otherwise the whole production assembly line is stalled. Another labor-related
weakness is a relatively high cost of labor comparing to Asian neighbor countries. The daily
minimum wage rate in the Philippines is around US$8.34-9.18, while in Vietnam: US$1.83-2.04,
Shanghai: US$1.96-5.63, Jakarta: US$2.00-3.73, and Thailand: US$5.00-6.8229
. Moreover, the
country’s labor policy requiring firms to hire its workers as regulars after a period of six months is
also hurting the industry. The industry argues that in other ASEAN countries, firms are allowed to
hire contractual workers up to two to three years. Given the wide fluctuations in the industry, this
policy has added up to their costs. Since they are unable to regularize their workers, they have to hire
and train new workers each time demand peaks up30
.
In terms of business sophistication, quality of suppliers is insufficient. This is the result of
hindered tariff structure to auto industry. First is a dramatically reduction on a MFN tariff of CKD
packs for motor vehicles 30% between 1981 and 1992. This declined to 20% in 1993 and 1994,
dropped to 10 percent in 1995 and further to 3 percent during the years 1996-1997. As a result of this
tariff reduction, tariffs on locally produced parts and components ranged from 10 to 35% (except for
carpet whose tariff rate was 50%) while CKD imports were levied a much lower tariff of only 3%.
With this tariff structure, it would be cheaper to import parts than to procure them locally. Therefore,
it is not necessary for Japanese auto companies to transfer their technology to local companies. Thus,
the import substitution negatively impacts Filipino’s auto industry in long run. Suppliers also could
not develop their skill to produce parts meet the cost quality-delivery (CQD) requirements of the
Japanese assemblers. Moreover, the industry is also hurt from the “unfair competition” from cheap
second-hand used CBUs which are priced at 30-50% lower. Industry sources reported that because
of second-hand imports, they are losing sales of about 20,000 vehicles annually29
.
The industry also points out infrastructure problems in the country due to the high cost of
power and distribution. These contribute to the high production costs in the industry which is already
29 http://nwpc.dole.gov.ph/pages/statistics/Asean%20Wages%202010.pdf 30 Aldaba, R.M. (2007), Assessing the Competitiveness of the Philippine Auto Parts Industry, Philippine Institute for Development Studies.

43
saddled by a weak supply base and a small domestic market that is allegedly being eroded by the
influx of smuggled vehicles. Though the country’s population ranked second among five ASEAN
countries, the market is not so attractive. In 2009, potential consumer (upper-middle and wealthy
income group) are less than 6.58% of population and expected to slightly increase to 18% of
population in 2020.31
In sum, the Philippines’s government is the key to turn-around automotive industry to be
more attractive. There are a lot of rooms to be improved, for instance, consistency in policy
supporting the industry, tariff, labor condition and also infrastructure.
Thailand
Thailand got the highest rate of attractiveness for Japanese automotive investment.
Interviewees were very satisfied in 4 factors of Thailand; “Institutions”, “Health-primary education”,
“Goods market efficiency” and “Business sophistication”. For factors rated in satisfied level were
“Macroeconomic environment”, “Higher education-training”, “Labor market efficiency” and
technological readiness. The factor rated at the lowest for Thailand current situation was “Market
size”, rated in acceptable level. In terms of country competitiveness ranked by WEF, Thailand
ranked 39 following Singapore (2nd
) and Malaysia (21st) among ASEAN countries.
Figure 17: Thailand competitiveness by WEF Figure 18: Thailand attractiveness by interview
Source: Adapted from WEF 2011-12
31 Iuchi, S. (2012). Opportunity of ASEAN Emerging Business in the Global Arena.

44
Thailand is ASEAN’s Automotive Hub with the largest vehicle assembling capacity and the
highest quality parts manufacturing capability of any nation in the region, according to the Japan
Automobile Manufacturers Association (JAMA). Local part manufacturers supply approximately,
80% of parts used in the assembly of pickup trucks, and just under 50% of parts used in the assembly
of passenger cars.
In terms of “Market size”, Thailand population is relatively low compare to Indonesia. Thai
population is around 67 million. According to interview, Thailand Total Industry Volume (TIV) is
about 2 million, divided into new car for 1 million and used car for almost 1 million. However,
Indonesia TIV is around 4 million with new car around almost 1 million and used car around 3
million. Even though, Thailand’s market size does not look so attractive for automotive investment,
there are other attractive areas as follows.
For decades, the government’s support and promotion of automobile industry has been quite
consistent. Policy and procedure have been set to assist the process in which the automobile industry
would grow. Initially, government’s policy was quite protective. But in post AFTA period, it became
quite liberal and many MNCs are poised to take advantage of the situation. Earlier, automobile
sector was developed through an import substitution policy where import tariff was set high,
components import was restricted and promotion of domestic investment was regarded as important.
The Thai Government is working with major automakers in order to prepare a draft of the next
five-year strategic plan for the country’s automotive industry.32
However, even though Thai
government has good policy support auto industry, other parts of political institutions that impact
negatively to auto industry also need improved such as government stability and transparency.
For “Goods market efficiency”, the government of Thailand made a decision in the 1980s to
promote truck production rather than following Malaysia’s lead with a national car program such as
the Proton. In fact, excise taxes for vehicles range from 30 to 50%, and pick-up trucks are taxed at a
rate of 3%. As a result, pick-up trucks account for nearly 70 percent of all vehicles produced and
32 Business Monitor International, Competitive Landscape, Thailand,Q2 2010, March 12, 2010, p.4

45
over 50 percent of domestic sales.33
In addition, the Board of Investment (BOI) offers many
compelling tax and non-tax incentives to investors in the Thai automotive industry such as work
permit and visa facilitation for expatriate employees.
In terms of business sophistication, government is focusing on industrial clusters for
providing opportunities to new entrants. In case of component sector, careful attention is being given
to sketch the plans for the missing link sub-sectors of the value chain to reduce importable
components. For the reason that incentives the Thai automotive industry has been shifting toward an
export orientation since 1996. Thailand Automotive Industry (TAI) has developed an 8.7 billion baht
(US $ 217.5 million) plan to further develop the sector. This plan includes human resource
development program, automotive experts dispatching program to establish clusters and upgrade
auto parts manufacturing technology, generation of fund for the establishment of research and
development centers, development of information center to analyze industry data and automobile
export promotion center.
Last comment from interview, the reason that Thailand could attract auto investment the
most is because Thailand is good place to stay, it is safe, the food taste good, the weather is
comfortable, and the people are nice. Even though labor cost is competitive, but Thailand is rising up
minimum wage and unemployment rate is almost 0% so labor supply is going to be inadequate.
Therefore, the attractiveness in labor market efficiency moves from Thailand to Indonesia instead.
Vietnam
Vietnam’s attractiveness to Japanese automotive investment was at the bottom among 5
ASEAN countries. Only the labor efficiency was rated in satisfied level. Factors of “Institutions”,
“Macroeconomic environment”, health and primary education, “Higher education-training”, and
technological readiness were rated in acceptable level. The remaining factors; Infrastructure, “Goods
market efficiency”, “Market size”, and “Business sophistication” were rated in poor satisfaction
level. For world competitiveness rank by WEF, Vietnam ranked at 65th
.
33 U.S. Trade Representative, “2010 National Trade Estimates Report for Foreign Trade Barriers – Thailand”, p. 358

46
Figure 19: Vietnam competitiveness by WEF Figure 20: Vietnam attractiveness by interview
Source: Adapted from WEF 2011-12
According to the market size, Vietnam's vehicle production industry is one of the smallest
among the member states of the Association of South East Asian Nations (ASEAN). The
underdevelopment of supporting industries has much to do with the size of demand. According to
the data from the Industry Policy and Strategy Institute (IPSI) of MOIT in 2009, one Japanese
automotive assembler had a localization ratio of only 9% because domestic demand for automobiles
is too small for efficient operation. On the other hand, the motorcycle assembler had a localization
ratio of 86% based on domestic demand. However, regarding the interview, Vietnam is a potential
market in the future. In 2007, Vietnam population is more than Thailand with around 20 million. But
car ownership in the country was 9 times smaller than Thailand (Vietnam car ownership is 13
vehicles per 1000 people while Thailand has 125 vehicles per 1000 people).26
This shows that even
though Vietnam current market is not so attractive but the potential does exist.
since the country has a large and young population, with 90% below or within working age.
In 2009, total population of Vietnam is 87 million with the share of working age (15-64 years old)
has increase to 67.18%. Therefore, in terms of labor force, Vietnam has entered the period of a
“golden population structure” with total workforce around double size of the non-working
population.

47
For “Business sophistication”, there are various issues in supply chain. Another IPSI survey
on the capability of local suppliers conducted in 2008 revealed trouble in value chain. The troubles
include no local company supply relatively “easy” parts and components made of cast iron, steel or
plastic continue to be imported. Domestic suppliers also could not make the complicated parts
because their engineering and technical capabilities are generally low. And they lack the ability to
perform required QCD (quality, cost and delivery) and etc.
Generally, suppliers are small and medium sized companies, and government policies do not
have policies support this group. Small-sized foreign enterprises always face difficulties because the
industrial zones of Vietnam only focus on big investors. In local clusters, firms face problems of
infrastructure and long distances from customers who are usually assemblers in industrial zones near
main roads, harbors and airports.
Furthermore, Vietnam has not even started to seriously build industrial linkages. The
government needs a special program for business linkages in the automotive industry. There is only
“Master plan of supporting industries in Vietnam until 2010, vision of 2020” approved in 2007.
These policies aims to promote supporting industries including; develop high-quality university
education, technical training for engineers and workers, management consultation, incentives, proper
tax and tariff structures, finance, matching and linkages, full use of business associations, public
private partnership, international and regional cooperation, and constant organizational reform to
revitalize and coordinate various policy elements. These industrial policies designed similarly to
Malaysia and Thailand policy.
Section 3. MYANMAR
Republic of the Union of Myanmar is the 40th largest country in the world. It has a total
perimeter of 1,930 kilometer and is the second largest country in Southeast Asia. Myanmar is also
the 24th
most populated country in the world with over 60.28 million people.34
According to CIA
World Fact Book statistics, Myanmar has only 3,200 km of paved roads compared to a land area of
34 Asian Development Bank (2010), Asian Development Bank &Myanmar Fact Sheet, [online] http://www.adb.org/publications/myanmar-fact-sheet [Accessed : July 8, 2011].
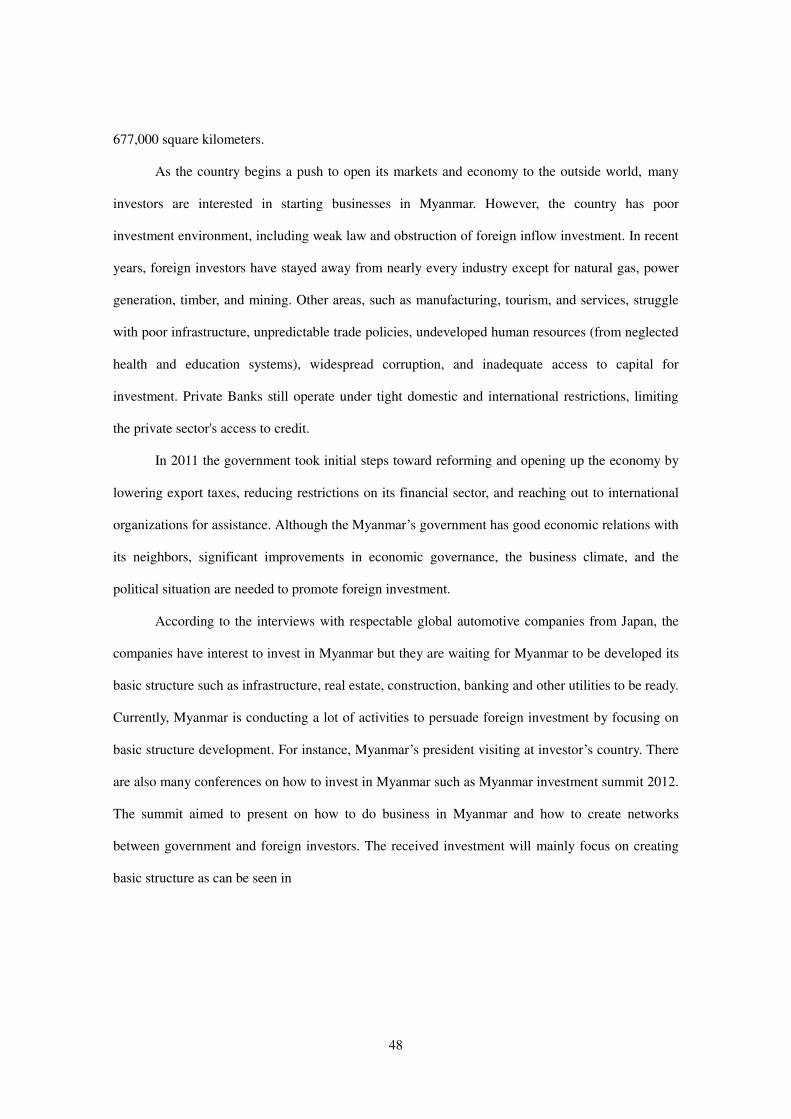
48
677,000 square kilometers.
As the country begins a push to open its markets and economy to the outside world, many
investors are interested in starting businesses in Myanmar. However, the country has poor
investment environment, including weak law and obstruction of foreign inflow investment. In recent
years, foreign investors have stayed away from nearly every industry except for natural gas, power
generation, timber, and mining. Other areas, such as manufacturing, tourism, and services, struggle
with poor infrastructure, unpredictable trade policies, undeveloped human resources (from neglected
health and education systems), widespread corruption, and inadequate access to capital for
investment. Private Banks still operate under tight domestic and international restrictions, limiting
the private sector's access to credit.
In 2011 the government took initial steps toward reforming and opening up the economy by
lowering export taxes, reducing restrictions on its financial sector, and reaching out to international
organizations for assistance. Although the Myanmar’s government has good economic relations with
its neighbors, significant improvements in economic governance, the business climate, and the
political situation are needed to promote foreign investment.
According to the interviews with respectable global automotive companies from Japan, the
companies have interest to invest in Myanmar but they are waiting for Myanmar to be developed its
basic structure such as infrastructure, real estate, construction, banking and other utilities to be ready.
Currently, Myanmar is conducting a lot of activities to persuade foreign investment by focusing on
basic structure development. For instance, Myanmar’s president visiting at investor’s country. There
are also many conferences on how to invest in Myanmar such as Myanmar investment summit 2012.
The summit aimed to present on how to do business in Myanmar and how to create networks
between government and foreign investors. The received investment will mainly focus on creating
basic structure as can be seen in
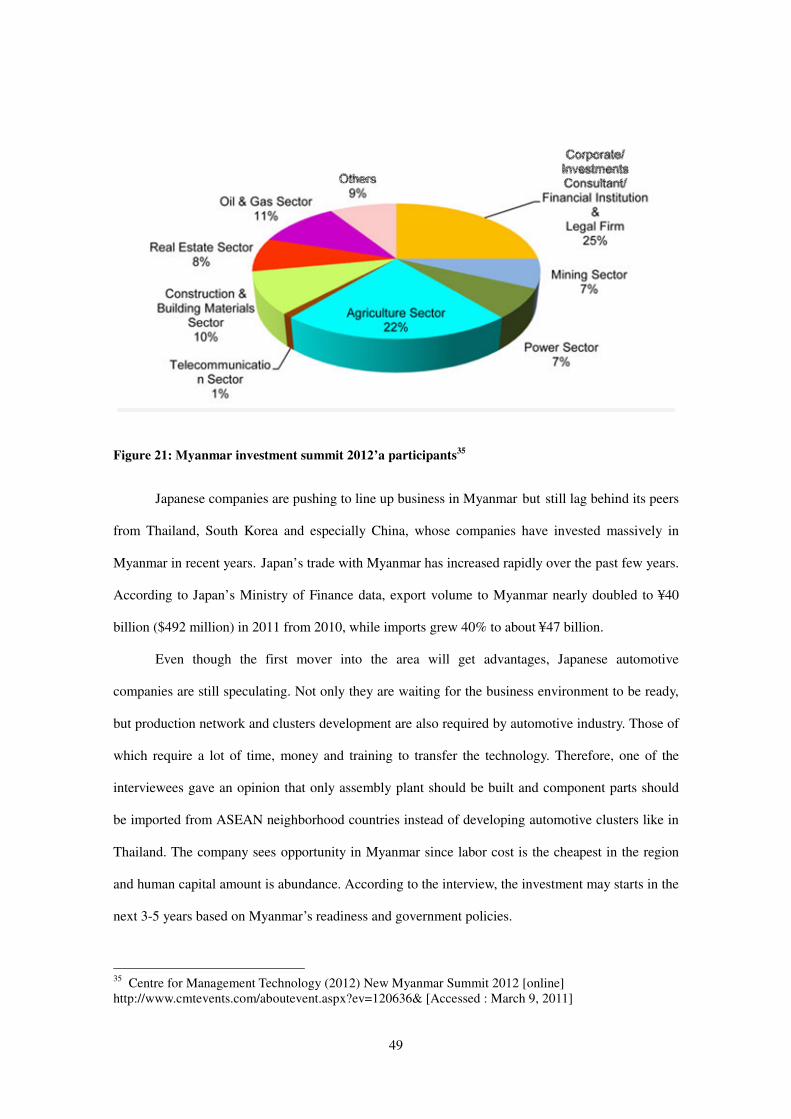
49
Figure 21: Myanmar investment summit 2012’a participants35
Japanese companies are pushing to line up business in Myanmar but still lag behind its peers
from Thailand, South Korea and especially China, whose companies have invested massively in
Myanmar in recent years. Japan’s trade with Myanmar has increased rapidly over the past few years.
According to Japan’s Ministry of Finance data, export volume to Myanmar nearly doubled to ¥40
billion ($492 million) in 2011 from 2010, while imports grew 40% to about ¥47 billion.
Even though the first mover into the area will get advantages, Japanese automotive
companies are still speculating. Not only they are waiting for the business environment to be ready,
but production network and clusters development are also required by automotive industry. Those of
which require a lot of time, money and training to transfer the technology. Therefore, one of the
interviewees gave an opinion that only assembly plant should be built and component parts should
be imported from ASEAN neighborhood countries instead of developing automotive clusters like in
Thailand. The company sees opportunity in Myanmar since labor cost is the cheapest in the region
and human capital amount is abundance. According to the interview, the investment may starts in the
next 3-5 years based on Myanmar’s readiness and government policies.
35 Centre for Management Technology (2012) New Myanmar Summit 2012 [online] http://www.cmtevents.com/aboutevent.aspx?ev=120636& [Accessed : March 9, 2011]
50
CHAPTER 6. CONCLUSIONS AND RECOMMENDATIONS
In Chapter 6, the summary of the study is stated by using information from the findings and
analysis on the Chapter 5. Then the findings and analysis are presented to achieve the thesis
objectives. The objectives are 1) Study driving factors influencing to the country selection for car
manufacturing investment of Japanese automaker. 2) Review current circumstances that support or
discourage the FDI from Japanese automaker. To achieve these objectives, information was gathered
from various sources such as World Economic Forum (WEF), journals, news. Information gathering
also includes the interviews with three experienced managers in Asia-Oceania department of three
respectable global automotive companies. The finding of this research will be provided with insight
regarding country-wise FDI attractiveness from Japanese automaker’s view point. On the other hand,
this research results might provide some references for Japanese manufacturing’s future policy in
ASEAN region.
Section 1. JAPANESE AUTOMOTIVE INVESTMENT INFLUENCING FACTORS
According to the result, 10 factors were used in the interview. The factors can be categorized
into 3 groups. The grouping was based on influential level on the country selection for car
manufacturing investment of Japanese automaker. The categorization is shown in table 6.
Table 6: Group of factors influencing Japanese automaker on manufacturing investment
Very large influential factors Large to medium influential factors Small influential factors
• Market size
• Macroeconomic environment
• Institutions
• Business sophistication
• Infrastructure
• Goods market efficiency
• Labor market efficiency
• Health and primary education
• Higher education-training
• Technological readiness
It can be seen that the group of large influential factor mainly concerned country’s capability
in car selling. From the result, the most influential factor to Japanese automaker investment decision

51
is “Market size”. Those three automotive companies expect their finished car to be sold well
domestically. Furthermore, potentiality of exporting to foreign market is also crucial. The second
most influential factor was “Macroeconomic environment”. Those companies considered this factor
as an indicator of country’s readiness. Investment can be started or added if macroeconomic
indicator is sustainable or increasing. The third most influential factor was “Institutions”. Those
automotive companies considered that the government of the countries represented this factor rather
than any other institutions. The government has a power to issue policies supporting the industry.
Also, government reliability, consistency and transparency could impact country’s stability. Those
elements play a large role in attracting or repelling FDI inflow.
The factors in large to medium influence group were rather related to manufacturing
operation and cost efficiency. For “Business sophistication”, the manufacturer would select country
with better clusters development. Therefore, companies can utilize this advantage to be both
competitive and drive down the costs of inputs to raise their profit. It is similar to “Labor market
efficiency” and “Infrastructure” which impacts directly to cost and quality of product. “Goods
market efficiency” concerns elements effecting supply and demand of the market. Elements impact
supply side, such as tariff and trade barrier, could increase company competitiveness in cost
efficiency production. Demand condition, such as customer sophistication, can create competitive
advantage or disadvantage to the company as well.
Three other factors; “Health-primary education”, “Higher education-training”, and
technological readiness, were considered as a small influence to investment decision. The reason is
that Japanese automaker will train and transfer own technology. Therefore, local education and
technology are not necessary.
Section 2. FIVE ASEAN COUNTRIES AND MYANMAR BUSINESS ENVIRONMENT
Among five ASEAN countries, the automotive interviewees rated Thailand as the most
attractive for FDI. This interview result was consistent with actual FDI inflow in Thailand. Over the
past decade, Thailand has been receiving the highest FDI inflow from Japanese automotive

52
companies. One of main reasons was government support. Many policies offered incentive to
Japanese automotive investors. Consequently, Thailand automotive industry was developed the most
by those Japanese companies. Many global automotive companies decided to establish Regional
Head Quarters in Thailand. Apart from government support, Thailand also has other good conditions
to build car manufacturing factory. The conditions include policy consistency, strength in auto
clusters development, and adequacy of infrastructure both in quality and quantity. However,
Thailand also has some disadvantage. For instance, market size and macroeconomic growth are
relatively medium compare to other ASEAN countries. Labor cost is also increasing. The changes in
those factors may cause FDI to shift to other ASEAN country such as Indonesia.
Indonesia, as of interview time, was the second most attractive for FDI. However, Indonesia
is very attractive for future FDI. The country positioning is better than the other five ASEAN
countries in this research. The country’s macroeconomic environment stands out, robust growth and
stable. With around 240 million of population, Indonesia boasts a large pool of potential
consumers. The number of population that has purchasing power (middle-income to upper-middle
income group) is increasing rapidly. There are abundant of labor supply which is also cheap. Among
five ASEAN countries, Indonesian current labor regulations are too strict and distorting labor market.
Fortunately, the government recognized that it needed to be reformed. In addition, government has
policy supporting automotive industry. However, in order to build up foreign investor’s confidence,
the policy-making process should be more transparent and predictable. One of the most concerns
from the interview was Indonesia’s infrastructure. Its roads are generally poor, the capacity of
seaports is limited and electricity supply is inadequate. Nevertheless, although infrastructure
problem exist, the country still is expected to be the most attractive location for Japanese car
manufacturing factory investment in the near future.
Malaysia is the only country that promotes own nation car. The government has been
protecting it since establishment. Highly protection through incentive has been making its nation car
succeed in sale volume. Unfortunately, the successfulness was not from the real strength of the
company but from the government protection. On the contrary, the protection decreases nation car

53
competitive ability. In terms of market size, Malaysia has biggest portion of upper-middle income to
wealthy group among five ASEAN countries. However, the number of population is the least and
current car ownership ratio is the most. Therefore, Malaysia market is not particularly attractive for
FDI. Overall, the country is quite competitive for general business operation due to its solid
institutions, good infrastructure and high quality of labor. Nonetheless, Malaysia is not so attractive
for Japanese automotive investor because of government nation car protection policy. The
government tries to encourage automotive industry with two approaches. The first approach is
changing incentive scheme to attract more FDI inflow. The second approach is improving local
industry by strengthening the link between industries and academic institutions. This will also
improve labor force skills and R&D capability for further development of industry.
The Philippines attractiveness in Japanese automotive FDI was rated at a similar level as
Malaysia. All ten factors were rated in acceptable to poor level. Inadequate transport network and
unreliable power suppliers obstruct economic growth. Main issue of the Philippines was inefficient
business sophistication. The country automotive cluster does not function well. The number of
suppliers is inadequate. Even so, existing suppliers are not capable to produce and supply parts as
assemblers required. The requirements include good quality, designated amount and on time delivery.
This problem is the consequent of government imported part tax reduction policy. The policy made
the cost of imported parts lower than locally produced parts since 1990s. Foreign automotive did not
see necessity to transfer their technology to local suppliers. Subsequently, importing part became a
logical choice for car assembling. As a result, the industry as a whole could not be developed and
could not move forward as it should be. Besides, Labor forces are not qualified enough. Despite the
fact that the country’s population ranked second among five ASEAN countries, the market is not so
attractive. Potential customer portion (upper-medium to wealthy income group) is relatively small.
Overall, the Philippines has long way to go to be able to compete in automotive industry among
ASEAN countries.
Vietnam was at the bottom of attractiveness ranking from the interview. The country was
rated poor level in “Infrastructure”, “Goods market efficiency”, “Business sophistication” and

54
“Market size”. Similar to the Philippines, Vietnam infrastructure is inadequate both in quantity and
quality. Goods market efficiency is less favor because import duty existing. For “Business
sophistication”, Vietnam automotive clusters are still behind other 5 ASEAN countries. Current
market size is not so attractive because of low income demographic. Conversely, the market has a
potential to grow due to car per capita has a long way to reach market saturated level. The most
attractive factor of Vietnam is “Labor market efficiency”. There are abundant of cheap labor forces
to offer. Lastly, Vietnam becomes one of the more attractive choices to invest. This happens after
Japanese firm got damaged by big flooding in Thailand last year.
After Myanmar opened the country, the government put effort to attract FDI for country
development. The main focus is on society utilities and infrastructure development. Many industries
have interest to invest in Myanmar since the domestic demand would be high as a new open-up
country. But investors still do not have confident in Myanmar’s ability and its policies. For Japanese
automotive companies, they rather wait and see how the government performs for around 3-5 years
before making a decision to invest. The investors also would like to wait for country to be ready for
automotive business operation. Because automotive industry requires a lot of factors to operate
efficiently such as effective infrastructure, skilled and cheap labor, market efficiency, etc. For
Myanmar, important factors to attract FDI from Japanese automaker are both the country economy
readiness and consistent government policy support industry.
Section 3. RECOMMENDATIONS
This research aims to define driving factors influencing to the country selection for car
manufacturing investment of Japanese automaker. Together, this research aims to review current
circumstances that support or discourage the FDI from Japanese automaker. With these main
objectives, the research described requirements from investor point of view. Then, the research
evaluated on each ASEAN country’s abilities to support those requirements.
Interesting point regarding country’s attractiveness of five ASEAN countries in this moment
is the shifting of attention from Thailand to Indonesia. Even though Thailand has been receiving the
55
largest amount of FDI inflow from Japanese automotive in the past decade, the country is losing
attractiveness to Indonesia according to the interview. Thailand market size satisfied Japanese
automaker but not as good as Indonesia. Thailand has only 67 million of population with car per
capita of 165 (per 1000), while Indonesia has around 280 million peoples with car per capita of only
79 (per 1000). Indonesia is obviously in the best position for domestic market size. In terms of
purchasing power, Indonesia population of upper-middle income level is expected to reach 70
million, the largest among five ASEAN countries. Regarding macroeconomic environment,
Indonesia’s annual GDP during 2012-2016 is expected to grow at 6.6% per annum. This GDP
growth rate is the highest among five ASEAN countries. Government also considers releasing
policies supporting automotive industry. In addition, labor cost is also cheaper. Although Indonesia
automotive clusters development is still behind Thailand, it is better than other three ASEAN
countries. Certainly, Indonesia will surpass Thailand in terms of FDI inflow from Japanese
automotive investor in the near future. Indonesia also has a high potential to be the biggest car
manufacturer for both domestic and international market. However, the country needs to develop its
infrastructure to be sufficient for doing business efficiently. Lastly, strategic incentive policy will
encourage new investment such as low tax for importing machine for new plant establishment.
With a huge investment in the past decade, Thailand’s automotive industry becomes the most
developed among five ASEAN countries. However, Thailand is losing its competitiveness in terms
of economic of scale and labor cost. Fortunately, Thailand has been receiving strong support from
Japanese automotive. The country’s automotive clusters development became the most advanced.
Thus, many global automotive companies selected Thailand to establish their Regional Head
Quarters. With these advantages, Thailand can position itself as a manufacturing support to other
ASEAN countries on behalf of respective company. Government should focus on human resources
development from both internal and external sources. An example of an external source is
technology transfer from Japanese automaker. On the other hand, an internal source can be
developed by creating links between local academic institutions and industry. This internal source
can solve the problem of higher labor cost by promoting high skilled labor, technician and engineer.

56
Lastly, Thailand should give consideration concerning natural disaster prevention. Last year big
flood damaged severely to Japanese car manufacturers both manufacturing machine and finished car.
Many Japanese companies are considering changing location such as Shiseido decided to move its
factory to Vietnam. Even though car manufacturing is a heavy industry, which is difficult to change
location, there is a possibility of investors moving the factories to another country. If flood damages
the industry once again, investors may lose confident to continue operating in Thailand. This lost
does not only apply to automotive industry but also apply to overall business environment in
country.
Malaysia automotive industry is quite strong in terms of microeconomic. The strength can
be reflected in cluster policy, local availability of process machinery and local supplier quantity.
Nevertheless, this strength does not make Malaysia to be competitive enough in foreign market due
to government policy of protecting the nation car. Consequently, the country automotive industry
becomes weaker. In order to increase its attractiveness to FDI and develop local competitiveness,
partnership with Japanese automaker is recommended. This partnership creates mutual benefits
between foreign investors and local manufacturers. Foreign automotive investors can share its
technology. At the same time, local authorities can provide some incentive back to those investors.
This will create competitive environment to local market. Thus, it will force local manufacturers to
improve the ability to catch up with competitors in the market. According to the interview, the
country does not have any outstanding attractive factors over Thailand and Indonesia. But with
strong domestic market, Malaysia should focus on improving its own manufacturer capability for
further market expansion.
The Philippines automotive industry is in a difficult situation. With an increasing competition
from international firms, domestic firms have to improve their manufacturing efficiency. However,
with limited technology and R&D capability, the Philippines’ firms can partners with foreign firms
to absorb the required technology. In order to further improve the firms’ competitiveness,
government support is also needed. The government can help the firms by pursuing market
expansion policies. This will trigger the demand for domestically produced parts-components and
57
for domestically assembled vehicles. Human resources development and labor policy issues are also
needed to be improved by the government. Concerning high cost of raw materials, tariff reduction
can be provided to address the problem in some sectors where tariff on major raw materials are
greater than finished goods. Finally, the government needs to improve infrastructure provision in the
country, such as utilities and transportation, to help firms bring down their operating costs.
The only remarkable attractive factor of Vietnam is labor cost. Among five ASEAN
countries, Vietnam seems to face the greatest hurdle. The country needs to develop its infrastructure
to be sufficient for business operation. A good infrastructure will also encourage country economy to
grow further. There are rooms for growth in Vietnam automotive market since current car per capita
is still low. The most important action that Vietnam should take immediately is developing the
country’s infrastructure to attract foreign automotive investors.
Automotive development in each five ASEAN country has different approached which
leaded to different results. There are countries that have fruitful development in automotive industry.
On the other hand, there are countries with sluggish development. It is good for Myanmar to learn
and find out the best practice for the country. Many ASEAN countries have been developing their
automotive industry with supporting from Japanese automotive companies for a long time. Therefore,
Myanmar may need to find its unique advantage position for foreign automotive investment and
clearly set direction and policy. For instance, Myanmar has to choose between developing local
clusters as a whole and only focusing on assembly manufacturing from parts import.

58
REFERENCES
[1] Aldaba, R.M. (2007), Assessing the Competitiveness of the Philippine Auto Parts Industry,
Philippine Institute for Development Studies.
[2] Amano, T. (2004). [Internationalization into East Asia and the growth of Japanese firms:
Understanding the economic effects of global allocation and division] MMRC Discussion
Paper No. 8. University of Tokyo.
[3] Asian Development Bank (2010), Asian Development Bank &Myanmar Fact Sheet, [online]
http://www.adb.org/publications/myanmar-fact-sheet [Accessed : July 8, 2010].
[4] Biswajit, N. et al. (2007, July) Changing Features of the Automobile Industry in Asia:
Comparison of Production, Trade and Market Structure in selected Countries, Asia-Pacific
Research and Training Network on Trade, 37.
[5] Business Monitor International (2009), “Industry News – Incentives Aim at ‘Green’ Car
Production,” Asia Pacific Automotives Insight, July 28, 2009.
[6] Business Monitor International (2010), Competitive Landscape, Thailand,Q2 2010, March 12,
2010, p.4
[7] Business Monitor International (2010), Indonesia Autos Report Q2 2010, p.7, and Malaysia
Auto Report Q2 2010, p.17
[8] Centre for Management Technology (2012) New Myanmar Summit 2012 [online]
http://www.cmtevents.com/aboutevent.aspx?ev=120636& [Accessed : March 9, 2011]
[9] Dicken, P. (2003). Global shift: reshaping the global economic map in the 21st century (4th ed.).
New York: Guilford Press.
[10] Dicken, P. (2011) Global Shift: Reshaping the Global Economic Map in the 21st century. (4th
ed.) London: Sage Publications.
[11] Griffin, James M. and Craig, T. (2005) Price Asymmetry in Energy Demand Models: A Proxy
for Energy Saving Technical Change?, The Energy Journal, 26(2), p 1-22.
[12] Hülsemann, K. (2004). Purchasing in the Automotive Industry in the Process of Changes.
Automotive Cluster of Slovenia, 2nd Annual ACS Convention on Developmental Trends in
the Automotive Supplier Industry.
[13] Iuchi, S. (2012). Opportunity of ASEAN Emerging Business in the Global Arena. ASEAN
Business Forum 2012
[14] Japan Automobile Manufacturers Association, Inc (2010) Hand in Hand Towards a New
ASEAN-JAPAN Partnership.
[15] Mori, M. (2004). [The strategy for East Asia of Japanese automaker which strengthens a global
inclination], RIM Taiheiyo Business Joho 4(13)54-74.
[16] Morimoto, H. (2006). [Interfirm differences of strategic behaviors among Japanese firms under
the environment of East Asia], Japan Academy of International Business Studies
12:291-305.
[17] Nakajima, J. (2000). [Japanese MNCs - A trace to millennium], Chiuokeizaisha.
[18] National Wages and Productivity Commission (2010), Comparative wages in selected countries
[online] http://nwpc.dole.gov.ph/pages/statistics/Asean%20Wages%202010.pdf [Accessed:
August 27, 2011]
[19] OECD (2012), Southeast Asian Economic Outlook 2011/12
[20] OICA (2007) Automotive Employment. [online] Available at:
http://oica.net/category/economic-contributions/auto-jobs/ [Accessed: May 2, 2012]

59
[21] Okamoto, Y. (1987) [Multinational enterprise and the multinationalization of Japanese business
enterprise] The Journal of Economics 53(1):2-37.
[22] Okamoto, Y. (ed.). (1998). [Japanese companies in East Asia] Yuhikaku.
[23] Shimokawa, K. (1998). [Direct investment and the development of international division of
labor in Japanese automobile companies in Asia] The Hosei Journal of Business 35(3):
45-60.
[24] Sturgeon, T.J. and Lester, R.K. (2004) ‘The new global supply-base: New challenges for local
suppliers in East Asia’ in Shahid, Y., Anjum, A.M. and Nabeshima, K. (Eds): Global
Production Networking and Technological Change in East Asia, The World Bank and
Oxford University Press, Washington, DC.
[25] Sturgeon, T.J., Memodovic, O, Biesebroeck, J.V., and Gereff, G (2009) Globalisation of the
automotive industry: mainfeatures and trends. International Journal of Technological
Learning, Trade and Development 2, 1-2: 7-24
[26] Tenorio, A. and Lugo, L. (2002), “Auto parts industry: stymied by imports”, Business World.
[27] The Economist (2009, October 23) China's car market: Motoring ahead, [online] Available at:
http://www.economist.com/node/14732026?story_id=14732026&fsrc=nwl [Accessed:
January 23, 2012]
[28] U.S. Trade Representative (2010), “2010 National Trade Estimates Report for Foreign Trade
Barriers – Thailand”, p. 358
[29] Uchibori, H. (2004). [Reviewing the Asian strategy of Japanese companies: An analysis of the
present state and future prospects of Asian business from the survey on Japanese
companies] Japan Academy of International Business Studies 10:169-178.
[30] UNIDO (2003) The Global Automotive Industry Value Chain: What Prospects for Upgrading
by Developing Countries? Vienna: UNIDO.
[31] Wong, M., Shankar, R., Toh, R. (2010) ASEAN competitiveness report 2010.
[32] World Bank Group. (2011). Motor vehicles (per 1,000 people) [online] Available at:
http://dx.doi.org/10.1787/9789264166882-en [Accessed: August 27, 2011]
[33] World Economic Forum. (2011). The Global Competitiveness Report 2011-2012
[34] WTO – Home page (2012) Understanding the WTO - The GATT years: from Havana to
Marrakesh, [online] Available at: http://www.wto.org/English/thewto_e/whatis_e/
tif_e/fact4_e.htm [Accessed: January 3, 2012]
[35] Yamada, Y. (2006). [Measuring ability of the Asian motor parts industry - Mainly on ASEAN,
China, Indian competitive power investigation] JETRO Sensor, December 2006, 24-3

60
APPENDIX 1: EVALUATION SHEET OF TEN FACTORS INFLUENCING
MANUFACTURING INVESTMENT OF JAPANESE AUTOMOTIVE COMPANIES.
Very small
influence
Small
InfluenceInfluence
Large
Influence
Very large
Influence
A. Public institutions 80
B. Private institutions 20
A. Transport infrastructure 50
B. Energy and telephony infrastructure 50
○
A. Health 60
B. Primary education 40
A. Quantity of education 70
B. Quality of education 30
A. Competition 60
B. Quality of demand conditions 40
A. Flexibility 60
B. Efficient use of talent 40
A. Technological adoption 80
B. ICT use 20
A. Domestic market size 80
B. Foreign market size 20
○
FactorsContribution
to Factor
Influencial level to investment decision
3.Macroeconomic environment
○
1.Institutions
2.Infrastructure
4.Health and primary education
○
7.Labor market efficiency
5.Higher education and training
○
○
6.Goods market efficiency
○
○
○
○
8.Technological readiness
10.Business sophistication
9.Market size

61
APPENDIX 2: INTERVIEW SHEET: EACH COUNTRY SITUATION
Very poor Poor Acceptable Satisfied Very satisfied
~20% ���� 21% - 40% 41% - 60% ���� 61% - 80% 80% up ☺☺☺☺
1.Institutions
Comment
C
2.Infrastructure
Comment
3.Macroeconomic environment
Comment
4.Health and primary education
Comment
5.Higher education and training
Comment
6.Goods market efficiency
Comment
7.Labor market efficiency
Comment
8.Technological readiness
Comment
9.Market size
Comment
10.Business sophistication
Comment
Country's name
Evaluation % reach expectation
Factors

62
APPENDIX 3: COMMENTS ON MYANMAR
Myanmar is opening up, has a potential to be an emergence as Asia’s next tiger economy.
Many businesses are interested to invest in Myanmar such as infrastructure, Banking, Mining
Please kindly suggest your concern about Automotive industry in Myanmar from automotive investor
point of view.
1. Does your company have interest to invest in Myanmar? Why?
Answer: YesWhy: We expect that Myanmar market will be incresing up ,because population is big (5th in ASEAN).
And most interesting point is the cheapest labor wage in ASEAN.
2. What do you think about future of Automotive industry in Myanmar?
This is my private opinion , in the feature, we would like to invest in Myanmar,
at first, only Assembly process will advance , components parts is supplied from
other ASEAN.
3. What is your suggestion to Myanmar's government on behalf Automotive investor?・Reduction of import parts duty・Incentive (investment , export , corporation tax )・Infrastructure ( highway, electonic, gas etc )4. Any comments
Myanmar