Automotive Diagnosis Data Aggregation, Management and ...
98
Automotive Diagnosis Data Aggregation, Management and Evaluation in Cloud based Environment Master Thesis Submitted in Fulfilment of the Requirements for the Academic Degree M.Sc. Dept. of Computer Science Chair of Computer Engineering Submitted by: Farshad Zamani Student ID: 416056 Date: 18.02.2018 Supervising tutor: Prof. Dr. W. Hardt Dr. Ariane Heller
Transcript of Automotive Diagnosis Data Aggregation, Management and ...

Automotive Diagnosis Data Aggregation, Management and Evaluation in Cloud based
Environment
Master Thesis
Submitted in Fulfilment of the
Requirements for the Academic Degree
M.Sc.
Dept. of Computer Science
Chair of Computer Engineering
Submitted by: Farshad Zamani Student ID: 416056 Date: 18.02.2018 Supervising tutor: Prof. Dr. W. Hardt Dr. Ariane Heller

1
Abstract
Automotive diagnosis data are useful for the automotive OEMs and third parties in order to analyze the vehicle performance and driving behavior. This data can be access and read in real time situation using the On-Board Diagnosis system which is located inside the vehicle and is accessible by its socket. However, as the diagnosis data are in real time and not being stored, analyzing them is not easy.
Therefore, in this project, a program on Raspberry Pi will be developed which is going to read diagnosis data and store them in a cloud database. The cloud database will handle the data storage and keep the data for further analysis and evaluations. The database will be accessible everywhere as it is using cloud technology. On the other hand, in order to provide easy and meaningful access to the data, a web application is developed in order to visualize the data by means of Graphs, Texts, and maps.
Keywords: On-Board-Diagnosis, Vehicle-Data, Diagnosis, Cloud-Base, Data-Visualization

2
Table of Content
Abstract ....................................................................................................................... 1
Table of Content .......................................................................................................... 2
List of Figures .............................................................................................................. 4
List of Tables ............................................................................................................... 6
List of Abbreviations .................................................................................................... 7
1 Introduction .......................................................................................................... 8
1.1 Problem Statement ..................................................................................... 10
1.2 Motivation .................................................................................................... 11
1.3 Thesis Structure .......................................................................................... 12
1.4 Summary ..................................................................................................... 13
2 State of the Art ................................................................................................... 14
2.1 Background ................................................................................................. 14
2.2 On-Board Diagnosis .................................................................................... 16
2.2.1 MODE .................................................................................................. 19
2.2.2 Parameter ID ........................................................................................ 19
2.2.3 Message Example ............................................................................... 20
2.3 Related work ............................................................................................... 21
2.3.1 Implementation of wireless OBD II System ......................................... 21
2.3.2 Bluetooth OBD Reader ........................................................................ 22
2.3.3 Remote Diagnostic System ................................................................. 24
2.4 Summary ..................................................................................................... 25
3 Concept .............................................................................................................. 27
3.1 Data Aggregation ........................................................................................ 28
3.1.1 Data aggregation device ...................................................................... 29
3.1.2 Communication to Cloud ..................................................................... 34
3.2 Data Management ...................................................................................... 36

3
3.2.1 Cloud Platform ..................................................................................... 36
3.2.2 Cloud Communication ......................................................................... 38
3.3 Data Visualization ....................................................................................... 42
3.4 Summary ..................................................................................................... 44
4 Implementation ................................................................................................... 46
4.1 Data Aggregation ........................................................................................ 47
4.1.1 Raspberry Pi ........................................................................................ 47
4.1.2 ELM 327 Circuit and Cable .................................................................. 48
4.1.3 Python Program ................................................................................... 50
4.2 Data Management ...................................................................................... 53
4.2.1 Google Cloud Platform ........................................................................ 53
4.2.2 MySQL Database ................................................................................ 54
4.2.3 Web Server .......................................................................................... 64
4.3 Data Visualization ....................................................................................... 68
4.4 Summary ..................................................................................................... 79
5 Result ................................................................................................................. 81
6 Summary ............................................................................................................ 88
7 Conclusion ......................................................................................................... 90
Bibliography ............................................................................................................... 92
4
List of Figures Figure 1 Vehicle ECUs and Network[3] ....................................................................... 8
Figure 2 OBD II Port in BMW 116d below Driver Compartment ............................... 10
Figure 3 OBD Pinout Cable View[15] ........................................................................ 17
Figure 4 Bit Position within a data byte[5] ................................................................. 18
Figure 5 Sample output of the Wi-Fi OBD II Reader[16] ........................................... 22
Figure 6 BlueDriver System[17] ................................................................................ 23
Figure 7 Remote OBD Reader Hardware Structure Diagram[18] ............................. 24
Figure 8 Arduino UNO Rev3 [20] .............................................................................. 29
Figure 9 Raspberry Pi 3[21] ...................................................................................... 30
Figure 10 ELM 327 .................................................................................................... 32
Figure 11 ELM 327 Block Diagram[23] ..................................................................... 33
Figure 12 GPS/GLONASS U-Blox 7 ......................................................................... 34
Figure 13 KuWFi LTE Surfstick[24] ........................................................................... 36
Figure 14 Google Cloud SQL Authorization page ..................................................... 40
Figure 15 MySQL Workbench with Cloud MySQL Database Sequence Diagram .... 40
Figure 16 Raspberry Pi communication to Cloud SQL Database ............................. 41
Figure 17 Webpage communication with Cloud SQL instance sequence diagram ... 43
Figure 18 Project implementation plan ...................................................................... 46
Figure 19 BMW Series 1, 2014 F20 Model ............................................................... 47
Figure 20 Logging screenshot of the application ....................................................... 51
Figure 21 Serial Communication using Python ......................................................... 51
Figure 22 HTTP Requests to get command using python request library ................. 52
Figure 23 Google Cloud SQL instance Creation[41] ................................................. 55
Figure 24 Google Cloud SQL instance Authorization[41] .......................................... 56
Figure 25 OBD_USER table information ................................................................... 57
Figure 26 OBD_VEHICLE table information ............................................................. 58
Figure 27 OBD_COMMANDS table information ....................................................... 59

5
Figure 28 OBD_MESSAGE and OBD_MESSAGE_DETAILS Tables information ... 60
Figure 29 VEHICLE_COMMAND_VIEW relation and tables .................................... 61
Figure 30 COMMAND_MESSAGE_VIEW Information ............................................. 62
Figure 31 Database Schema Design ........................................................................ 63
Figure 32 App.yaml configuration for Google App Engine ........................................ 65
Figure 33 Retrieve Vehicle Commands to Raspberry Pi from server ........................ 66
Figure 34 Encryption and Decryption using PyCrypto library .................................... 68
Figure 35 Website flowchart ...................................................................................... 70
Figure 36 Registration page ...................................................................................... 71
Figure 37 Login page ................................................................................................ 71
Figure 38 Homepage ................................................................................................. 72
Figure 39 Vehicle Selection Menu ............................................................................. 73
Figure 40 Data Visualization ..................................................................................... 73
Figure 41 Data filtering section .................................................................................. 74
Figure 42 Google Maps API with marker and data box ............................................. 75
Figure 43 Engine RPM graph .................................................................................... 76
Figure 44 Commands Visualization ........................................................................... 77
Figure 45 Command Edit Section ............................................................................. 77
Figure 46 Vehicle Data Edit/Add form ....................................................................... 78
Figure 47 Commands Declaration for Testing Purpose ............................................ 81
Figure 48 XML Commands Response from Server to Raspberry Pi ......................... 83
Figure 49 Response from Raspberry Pi to server ..................................................... 84
Figure 50 Engine RPM Graph ................................................................................... 85
Figure 51 Speed Graph ............................................................................................. 85
Figure 52 Engine Coolant Temperature .................................................................... 86
Figure 53 Engine Load .............................................................................................. 86
Figure 54 not supported command ........................................................................... 87

6
List of Tables Table 1 onboard diagnostics specifications applicable to the OSI layers[14] ............ 17
Table 2 OBD Modes according to ISO 15765-4[5] .................................................... 19
Table 3 Examples of Standard PID[5] ....................................................................... 20
Table 4 Raspberry Pies Comparisons[21] ................................................................. 31
Table 5 Cloud Services[26] ....................................................................................... 37

7
List of Abbreviations ECU Electronic Control Unit
OEM Original Equipment Manufacturer
CARB California Air Resources Board
OBD On-Board Diagnosis
AUTOSAR Automotive Open System Architecture
VIN Vehicle identification number
SAE Society of Automotive Engineers
CAN Control Area Network
MOST Media Oriented System Transport
LIN Local Interconnect Network
DTC Diagnostic Trouble Codes
USB Universal Serial Bus
IaaS Infrastructure as a Service
PaaS Platform as a Service
SaaS Software as a Service
DBMS Database Management System
IDE Integrated Development Environment
IP Internet Protocol
IPv4 Internet Protocol Version 4
IC Integrated Circuit
HTML Hypertext Markup Language
CSS Cascading Style Sheet

8
1 Introduction Many years ago, when the vehicle was having an only small number of Electronic Control Unit (ECU) with limited network capability, it was easy to understand and maintain the vehicle. However, during the last 20 years, vehicle networks become more complicated as the number of ECUs have increased and its results to the complication of vehicle network [1].
Prior to 1950s, most of vehicle troubleshooting and maintenance were done by hands and it was manual as there were not much communication channels between different parts of the vehicle and most of the systems were in the physical format [2]. However, starting from mid of the 1960s there was a dramatic increment in the number of ECU and complexity of vehicle network, resulting in the high demands for the diagnosis data. Diagnosis data were demanded many reasons [2].From one point, it was demanded in order to check the vehicle performance especially into the failures which can result into the environment damages, and also in order to find out the faulty part of the vehicle.
Due to the high demand of accessing to the vehicle diagnosis data, from 1969 and automotive Original Equipment Manufacturer (OEM) started to use diagnostic tools and techniques in order to access to automotive data and the first computerized diagnosis tool has been released by Volkswagen with fuel injected models [2]. Afterwards different automotive OEM such as general motors introduced Assembly Line Diagnostic Link (ALDL) in 1980 which was the beginning of standardizing the diagnosis measurement tools and specification[2].
The following Figure 1 illustrates how complex and is the internal networking of a Mercedes Benz E class which has been produced in 2002, every single box represents an ECU within a vehicle which is connected to each other using wires.
Figure 1 Vehicle ECUs and Network[3]

9
However, as the demands for the vehicle diagnosis data has increased, automotive OEM and organizations had difficulties to access all the necessary data available within the automotive domain. The main reason for this difficulty was each of the automotive manufacturers were using different methods for accessing this data with different specification.
It was very important for the government road organization to access this information in order to check the vehicle status specifically for the related emission system which failure of the system could result in damage of the environment and increment in the air pollutions [2].
In 1988 California Air Resource Board (CARB) has introduced the On-Board Diagnosis (OBD) into the market which specifies a standard system to comply with the diagnosis information into the external tools. The information which was available in this system was limited to emission control systems. This was the first version of OBD which introduce into the market and named OBD I. However, this system was not completely used as it was limited only to the data of emission controls [4].
The second version of the OBD system has introduced in 1996 by Society of Automotive Engineers in California released the second version of OBD and named it OBD II. Within this version, the complete diagnosis information of the car has been covered together with the standard and specification of how the data can be retrieved [4].
In 1996 Society of Automotive Engineers (SAE) released a standard name J1979 which clearly explained the specification of the data and how they should be retrieved to any third-party scan tool in order to read the information of the vehicle and have a clear understanding of automotive diagnosis data [5].
SAE has completely explained how the diagnosis system of the vehicle should work and specify the behavior of this system in addition to the information about how to access to the diagnosis data [5]. SAE has release J1979 as a standard by 1996, and United State government made a compulsory for all of the vehicles produced or being sold in the United States to be equipped with this system.
Moreover, by introducing the AUTOSAR and integration of this architecture into the automotive system design and implementation, the diagnosis and maintenance got more complex [6]. Based on the AUTOSAR architecture, the design and development consist of three layers: Application layer, Run Time environment, and Basic software [7]. This complexity of the systems leads to more demand for the diagnosis system.
10
The OBD II specify that accessing into the OBD system should be convenient and the communication socket should be located in driver compartment for easy accessibility.[5] On the other hand, the OBD system should be connected to vehicle network in order to retrieve the data from automotive [5].
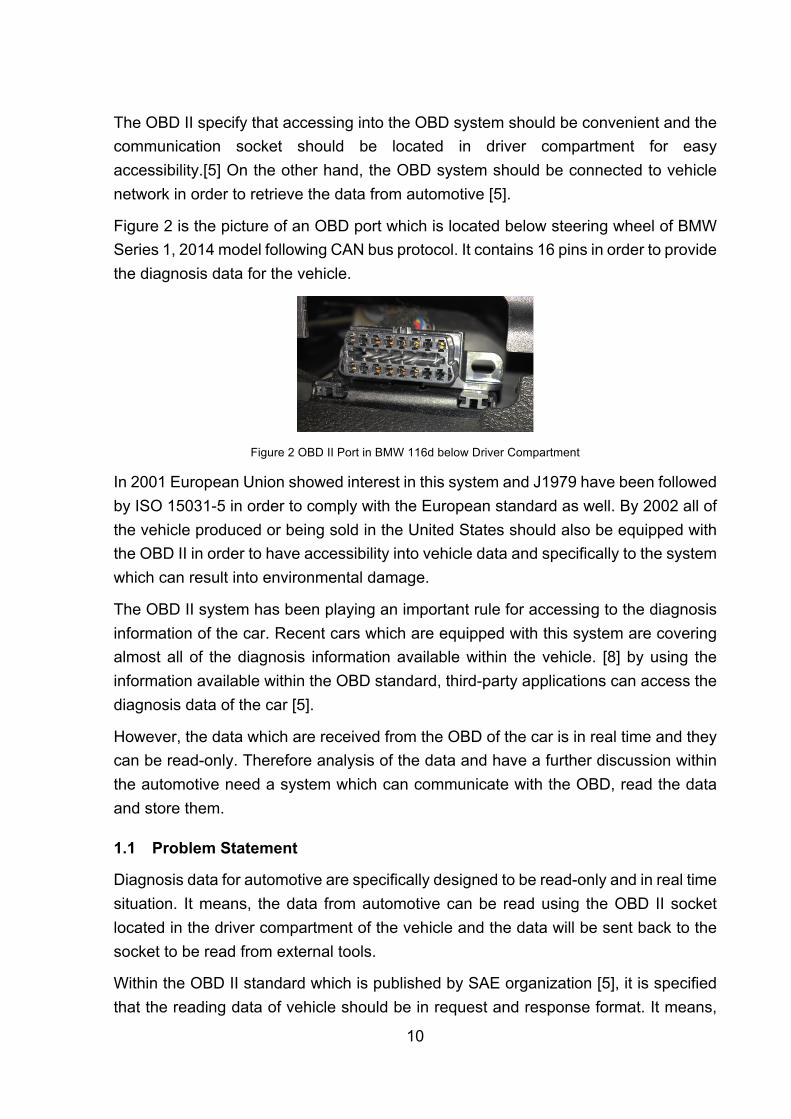
Figure 2 is the picture of an OBD port which is located below steering wheel of BMW Series 1, 2014 model following CAN bus protocol. It contains 16 pins in order to provide the diagnosis data for the vehicle.
Figure 2 OBD II Port in BMW 116d below Driver Compartment
In 2001 European Union showed interest in this system and J1979 have been followed by ISO 15031-5 in order to comply with the European standard as well. By 2002 all of the vehicle produced or being sold in the United States should also be equipped with the OBD II in order to have accessibility into vehicle data and specifically to the system which can result into environmental damage.
The OBD II system has been playing an important rule for accessing to the diagnosis information of the car. Recent cars which are equipped with this system are covering almost all of the diagnosis information available within the vehicle. [8] by using the information available within the OBD standard, third-party applications can access the diagnosis data of the car [5].
However, the data which are received from the OBD of the car is in real time and they can be read-only. Therefore analysis of the data and have a further discussion within the automotive need a system which can communicate with the OBD, read the data and store them.
1.1 Problem Statement
Diagnosis data for automotive are specifically designed to be read-only and in real time situation. It means, the data from automotive can be read using the OBD II socket located in the driver compartment of the vehicle and the data will be sent back to the socket to be read from external tools.
Within the OBD II standard which is published by SAE organization [5], it is specified that the reading data of vehicle should be in request and response format. It means,

11
external tools should be connected to the vehicle OBD II port and send a request into this port, the port then will reply the message with the value of requested data. [5] If the data, which is being received from OBD II port does not store it will be lost.
Therefore, the automotive market demands tools which can store the data of diagnosis information in order to have further analysis of the vehicle performance and driving behavior of the car.
Moreover, the data within the vehicle which are received from OBD socket are in a hexadecimal format and for many of them, there is some calculation needed in order to have the actual value of the data. The conversion methods and calculations are well defined in J1979 standard and continued in ISO 15031-5 format which is accessible by the public. [5] However, as the messaging form is in the request and response based on the specification, new commands should be able to be added to this system without modification of the system.
On the other hand, as the data are meaningless and not well human readable, therefore the data should be visualized in terms of graphs and text for the user so the analysis and evaluation of the vehicle performance can be easily manageable.
Therefore, it is necessary to have a complete system which can interact with OBD II port of the vehicle, to receive the needed data from the vehicle, communicate with a cloud storage and visualize the data for the user anytime and anywhere.
1.2 Motivation
As it has been already explained, the current OBD II system is not capable of saving the data of vehicle for further analysis and studies. Therefore, it is necessary to implement another system which is capable of interacting with the OBD II port within the vehicle, receive the data from this port and store them for future usage.
The first step is to develop a system which can be connected to the OBD II port in order to execute the request commands by writing them into the OBD port of the vehicle. On the other hand, this system should be connected to a cloud-based database in order to receive the commands which are supposed to be writing in OBD port and also send back the responses into the database for storage purpose.
As the second step, there should be a data storage within the cloud in a database format, which can be up always and able to handle all the data which are supposed to be used in this system such as command and responses from the vehicle. In this situation, the system which is running within the vehicle can communicate with this system.

12
The last step is to show all of this data to the user based on their request. Therefore, as the data which are received from the vehicle are not readable by humans and are in hexadecimal format, the data should be converted into the actual values and be visualized to the user using the graphs. In fact, within the vehicle most of the data on the vehicle diagnosis tool is in number format, therefore they can be visualizing for the user in terms of graphs and other visualization controls.
However, the system which is going to be implemented the vehicle can take the advantage of vehicle USB power and, get connected to the OBD II port of the vehicle using specific cables. This system should be plug and play and also capable of receiving all the information about the commands, execute them and send back the result to the cloud.
On the other hand, the cloud database will store all of the data which are received from a vehicle system and store them separately for further analysis. However, the database should be in tables and views format so data management and configuration would be possible.
For the data visualization, it is important to use a website which is accessible by computers, tablets, and mobile phones and in any location which internet connection is provided. Therefore, users will be able to see the vehicle performance based on the data and time or edit the commands which are supposed to be executed within the vehicle.
1.3 Thesis Structure
This thesis consists of 6 chapters which explain in details the project which is going to be developed in addition to the challenges it might have. The second chapter which is state of the art will explain the background of the project, the related works have been done so far and project related to the diagnosis of the vehicle. The third chapter which is the concept will discuss the data aggregation and how the communication with vehicle works, data management which is about data storage and how data will be stored in the database and lastly about the visualization of the data which are received from the vehicle. The fourth chapter is implementation part which includes the technical specification on how data will receive from the car and necessary tasks which should be performed for data aggregation, then about the communication to the cloud and data storage implementation and implementation of the website for the data visualization will be discussed. Chapter five will be about the outlook and summary which includes the data evaluation in cloud environment and visualization of the data. The report will be finished by having the chapter six as the conclusion which concludes the project.
13
1.4 Summary
Within this chapter, an introduction to diagnosis system has been explained. Implementation of diagnosis system has started in 1969 by Volkswagen due to the increment of computer units and complex networking. The implementation continued till 1996 which SAE released the first version OBD II standard which clearly specifies all of the specifications of OBD and implemented the law which forced all of the vehicles produced or being sold in the United States to be equipped with OBD port and later on followed by European Union.
However, OBD system is responsible to retrieve data only to external tools. Therefore, in order to be able for analysis and studies on this data, it is necessary to firstly retrieve this diagnosis data and store them in a database in order to have the possibility of accessing the data in future. On the other hand, raw data are not useful for the user and it is necessary to visualize this data within graphs and text in order to be able to do necessary analysis and studies on data.

14
2 State of the Art In fact, due to the high interest into the OBD II port and what it is capable of doing, there were number of projects which have been implemented in order to store all of the vehicle network data and visualize them to the user in purpose of either analysis the driving behavior of the car or checking the performance of the vehicle.
Before the OBD introduce into the market and became compulsory to the automotive OEM to follow this protocol, each of the automotive manufacturer was using their own way of access to the diagnosis data. This procedure made it difficult for organizations and third-party applications to access the diagnosis data [2]. As these data are important for troubleshooting the vehicle or checking the vehicle emission system, there were a variety of the tools for each vehicle with different specification. The variety in this system made it difficult for the automotive companies to develop tools for accessing and reading the diagnosis data of vehicle [2].
In this chapter, the background of OBD system and how the functionality and specification OBD is will be explained in addition the previous related works which have been developed in the field of OBD device will be described.
2.1 Background
The OBD is widely being used by the different organization in all over the world as many automotive OEM is practicing this tool. By the specification which has been introduced from SAE, all of the automotive OEM got a clear understanding of how the system should work in order to be compliance with the rules and regulations and external tools can access to the automotive diagnostic data [5].
However, OBD system is not completely supported in all of the cars. The vehicles which are being produced or sold in European Union or the United States have supported the OBD system but other nations might not. In fact, OBD system should communicate through the vehicle network in order to send the messages through the car and receive the response from the vehicle network.
Different automotive OEMs are using different protocols for communication with OBD system as they are having a different specification in their vehicle network architecture as well [9]. Therefore, as the OBD system should be equipped with vehicles, the specification of OBD system is designated in a way which can communicate towards following protocols [9]:
- SAE J19850 PWM - SAE J1850 VPW

15
- ISO 9141-2 - ISO 14230 KWP200 - ISO 15765 CAN
However, the latest protocol which is widely being used by vehicle manufacturer is ISO 15765 CAN is started to be used in 2008 and nowadays most of the automotive OEMs are using this protocol [9].
In fact, there are many functions running simultaneously within a vehicle, all of the functionalities within vehicle depends on their data. Data can be a single 0 or 1, but it can be a wide range of data which is being received to the function or be send to another function.
However, due to the complexity of data which are being transmitted among vehicle ECUs, the network buses and protocol of messaging within the vehicle is very challenging [10]. Therefore, there are many protocols and communication channels which are implemented and being used within the vehicle.
There are many vehicle networks available on the market which automotive OEMs using them for their purpose based on their needs [11]. The important network which is used by the automotive OEM some of them are mostly used such as:[11]
- Control Area Network (CAN) – For vehicle component communication - Multimedia Oriented System Transport (MOST) – Infotainment
communication - Local Interconnect Network – Vehicle component communication
However, there are many other networks available within automotive network buses, but the above mentioned are playing an important rule. Recent vehicles are equipped with CAN bus as it can provide the fast communication speed for the vehicle ECUs up to 1 Mbit/s [11].
In order to be compliances with rules and regulations related to government and organizations, communication buses within the vehicle should have a connector to the diagnosis system of the vehicle in order to provide the diagnosis information for the OBD port in order to provide easy maintainability and troubleshooting of the car.
In order to manage the proper communication to the OBD port of the car, the ECUs on the communication channel of the car is listening to the OBD port and when a message received from an OBD port to the diagnosis channel, the corresponding ECU will receive the message, process it and post the reply into the OBD port again for the external tools and applications to read the message.

16
2.2 On-Board Diagnosis
Many organization can take advantages of the OBD tools. They are able to diagnose the vehicle performance using this port without touching the vehicle network or going into the details of ECUs which are running within the vehicle domain. The users of OBD II ports are[12]:
- Technicians who work in automotive: Detecting the faults of vehicle - State Agencies: Inspection of vehicle - Vehicle Owner: To be aware of potential vehicle errors - Vehicle and Engine Manufacturer: To implement and install this system to
be compliance with rules and regulations - Application developer: To access to diagnosis data for further analysis and
usage
The On-Board Diagnosis of the vehicle has been introduced and specify by SAE organization and within the J1979 standard [5]. Within this standard, it has specified how the OBD system should work and how the communication is possible through this system. The key point which is specified within this standard are as follow [13]:
- How is the messaging format for both request and response? - What is timing requirement when sending a request message from external
tools to the vehicle and receiving the response from the vehicle - Messaging behavior in case of not availability of the data - Diagnostic services in order to comply with the OBD regulations based on
the request and response
As it has been defined within the OBD standard, firstly the OBD port should support the communication bus control within the vehicle. As the recent vehicles are equipped with the CAN communication bus among the ECUs, most of the modern vehicles are using the ISO 15765 CAN protocol which fully supports the can network [13].
However, the standard for other communication protocol is same, just the automotive manufacture should implement the OBD system in their vehicle to be compatible with OBD standard.
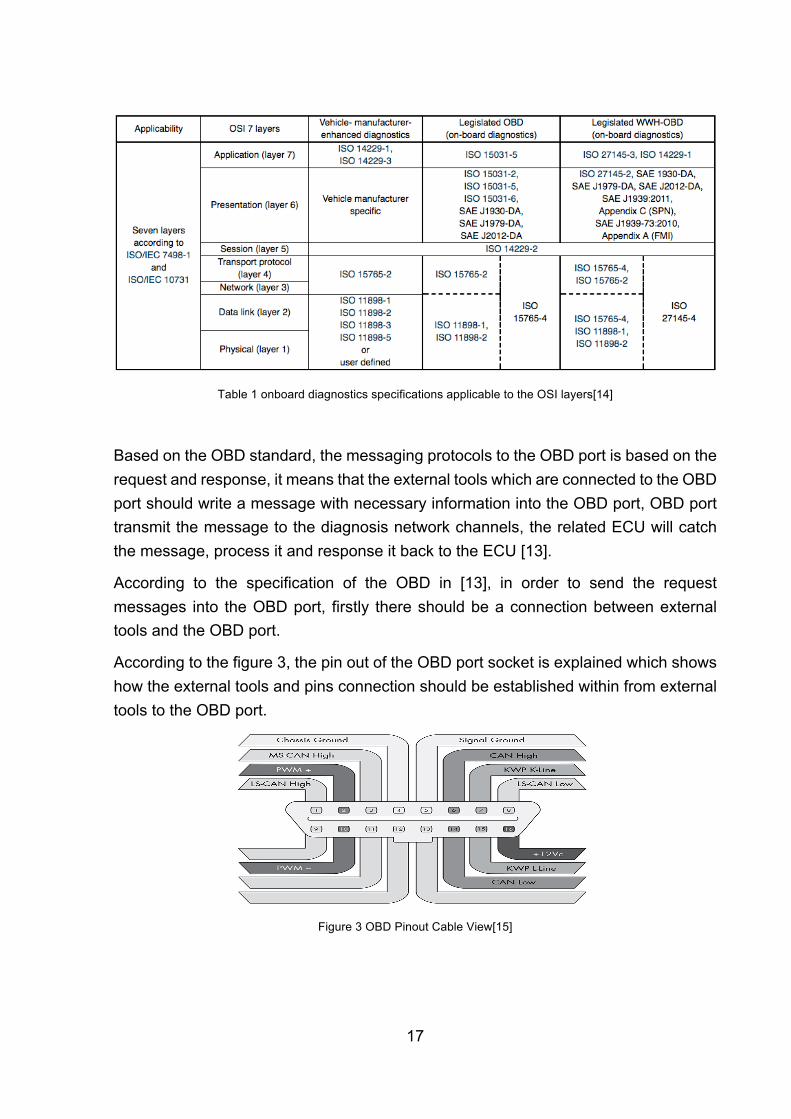
The OBD specification is compliance to the Open Systems Interconnection (OSI) reference model which structure the communication system into seven layers. Within the following table 1, the specification of the OSL model within the OBD standard and the standard which every layer has been specified and followed is explained:[14]
17
Table 1 onboard diagnostics specifications applicable to the OSI layers[14]
Based on the OBD standard, the messaging protocols to the OBD port is based on the request and response, it means that the external tools which are connected to the OBD port should write a message with necessary information into the OBD port, OBD port transmit the message to the diagnosis network channels, the related ECU will catch the message, process it and response it back to the ECU [13].
According to the specification of the OBD in [13], in order to send the request messages into the OBD port, firstly there should be a connection between external tools and the OBD port.
According to the figure 3, the pin out of the OBD port socket is explained which shows how the external tools and pins connection should be established within from external tools to the OBD port.
Figure 3 OBD Pinout Cable View[15]

18
Figure 3 is showing how the pin out of the OBD port look like and what is the purpose of each pin. Each of the pins is specifically designated for the connection to a vehicle network channel or domain based on the specification [15]. As you can see still there are pins number 9, 11, 12 and 13 are assigned. They are manufacture optional pins to be used by manufacture needs based on their own needs and they are provided as an optional feature [15].
In order to retrieve the data from the vehicle using external tools, there should be a connection into the pins of the vehicle for the communication purpose. When the connection is established between vehicle and external tools, external tools can start sending the data using serial communication to the OBD port and by sending the request message in bytes and hexadecimal format [15].
The messaging format and messaging request and response to OBD socket of the vehicle are defined based on the OBD standard in [13]. Each message which is being sent to the vehicle contains two parts: Mode and Parameter ID (PID). The first byte of the message should be the MODE and second part should be the PID.
In order to send a request message to the OBD port, the external tools should follow the exact procedure defined within the OBD standard and start the message with the MODE they want to access the data for and the Parameter ID which represent the variable within the vehicle that they are interested to access to [5]. Each request message is two bytes of the data. The first byte stands for the mode of the data that is intended to be read, and the second byte is for the PID which the variable value is intended to be retrieved [5].
Figure 4 is about to explain how the two bytes of the message is going to be transmitted through the OBD port, as the LSB contains the parameter ID and MSB is about the mode of the data which external tools is intended to access to [5].
Figure 4 Bit Position within a data byte[5]
When the message is being sent to the OBD port, the message will be written to the diagnosis network. ECUs within vehicle have the diagnosis interfaces for the communication only for the diagnosis purpose, therefore, the related ECU detects the request based on the parameter id and based on the mode it returns the value to the vehicle OBD [5].

19
However, the request message should be supported by the vehicle ECUs, if the vehicle does not support the requested message, it sends the not supported data information to the OBD port [5]. 2.2.1 MODE
Diagnostic data within the vehicle are divided into different modes as they are refereeing to a different section of the vehicle. In table 2 different message request mode is explained and clearly described what is the intention of each mode based on the ISO 15765-4 [5].
Mode Description
$01 Request Current Powertrain Diagnostic Data
$02 Request powertrain freeze frame data
$03 Request emission-related diagnostic trouble codes
$04 Clear/reset emission-related diagnostic information
$05 Request oxygen sensor monitoring test results
$06 Request on-board monitoring test results for specific monitored systems
$07 Request emission-related diagnostic trouble codes detected during current or last completed driving cycle
$08 Request control of onboard system, test or component
$09 Request vehicle information
$0A Request emission-related diagnostic trouble codes with permanent status after a Clear/reset emission-related diagnostic information service
Table 2 OBD Modes according to ISO 15765-4[5]
2.2.2 Parameter ID
Parameter ID (PID) is the specific ID required to be specified in the message which is being sent to the OBD port in order to identify the variable that is required by the user. There are two types of Parameter IDs: Standard PID and Non-Standard PIDs. Standard PID has been specified within the OBD standard, however, it is not mandatory for the manufacturer to follow exactly the same IDs for their variable they can change based on their needs, also standard parameter IDs are accessible by public and they can be found within the OBD standard. Nonstandard PIDs are the IDs which are specified by the vehicle manufacturer and not accessible by public and
20
accessing the information of them required direct contact to the automotive manufacturer [5].
Within this project, only the standard parameter ID is going to be used which are specified by the OBD standard in [5] in order to send the request to the vehicle and receive the data from OBD port.
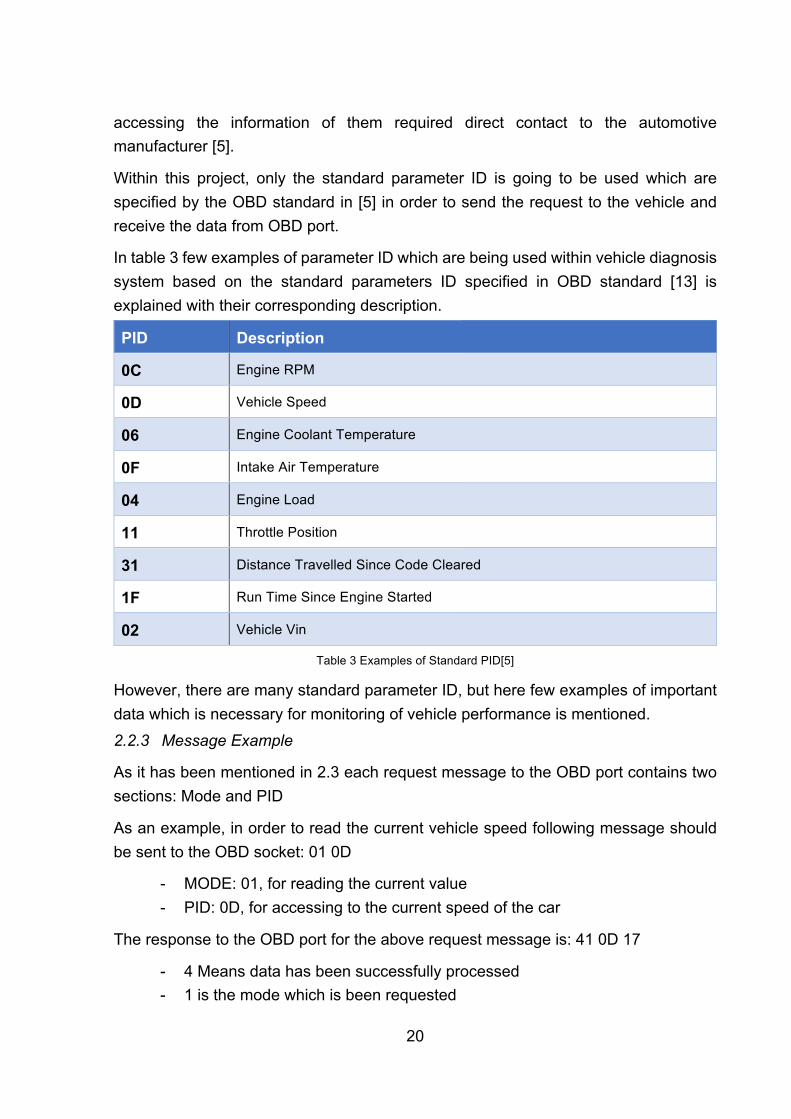
In table 3 few examples of parameter ID which are being used within vehicle diagnosis system based on the standard parameters ID specified in OBD standard [13] is explained with their corresponding description.
PID Description
0C Engine RPM
0D Vehicle Speed
06 Engine Coolant Temperature
0F Intake Air Temperature
04 Engine Load
11 Throttle Position
31 Distance Travelled Since Code Cleared
1F Run Time Since Engine Started
02 Vehicle Vin
Table 3 Examples of Standard PID[5]
However, there are many standard parameter ID, but here few examples of important data which is necessary for monitoring of vehicle performance is mentioned. 2.2.3 Message Example
As it has been mentioned in 2.3 each request message to the OBD port contains two sections: Mode and PID
As an example, in order to read the current vehicle speed following message should be sent to the OBD socket: 01 0D
- MODE: 01, for reading the current value - PID: 0D, for accessing to the current speed of the car
The response to the OBD port for the above request message is: 41 0D 17
- 4 Means data has been successfully processed - 1 is the mode which is been requested

21
- 0D is the PID which the value is requested for - 17 is the current speed of the vehicle in Hexadecimal format and after
conversion is: 23 Km/h
All of the other data within the vehicle can be access using the same procedure, for example in order to read the vehicle registration number, the following message should be sent: 09 02 where 09 is for accessing the vehicle data and 02 is for the registration number of the car. Once this message is sent to the vehicle, the response from the OBD port will be returned.
2.3 Related work
Due to great functionality that OBD port and standard provide for automotive OEMs and also other individuals to access the diagnosis data of the vehicle, many projects and systems have been developed in order to access the diagnosis data of the vehicles and provide information for the user.
In fact, most of the vehicles in the world provide the OBD port within the vehicle in order to provide the diagnosis data for the users. Based on the OBD standard in order to retrieve the vehicle data, you only need to send the specified request message to the OBD port, and OBD system will process the message, receive the response from respective ECU and send it back to OBD port.
Due to this clear and user-friendly functionality, many systems have been developed in order to retrieve this data for external tools. However, here are the most complex projects which have been developed so far in order to provide the possibility of analysis the diagnosis data for external users.
Within this section, three of the latest projects which have been published so far is going to be explained in details. 2.3.1 Implementation of wireless OBD II System
The aim of this project was to implement a system which measures the speed, mass air flow, fuel consumption, distance of the vehicle and manage the data into an external computer [16]. Within this system, the vehicle data are being transmitted to a microcontroller unit using the ELM 372 cable which is specially designated to be connected to the OBD port and also provide RJ 45, on the other hand, to be connected to the microcontroller unit.[16]
Within this experiment, the predefined request messages for speed, distance, airflow will be written to the OBD port using the ELM 372 cable. On the other side, there is a Wi-Fi module installed on the microcontroller which transmits the received messages

22
to another computer within the Wi-Fi range. The computer will receive the data and show the data to the user within the graphs for further analysis.[16]
However, in this system the vehicle, the microcontroller should be within a range of Wi-Fi in order to establish the connection on all. Also, as the OBD message protocol is based on request and response, the request messages are predefined and modification of the messages request required modification of the code and this system is limited to few request messages only [16].
Figure 5 is a sample output which shows the comparison of Speed and Fuel consumption of vehicle-based on the data which received from the vehicle.
Figure 5 Sample output of the Wi-Fi OBD II Reader[16]
This system provides great analyzing advantages for limited variables of data within the vehicle. However, also the vehicle and computer should be within the Wi-Fi range in order to establish the connection among each other and to be able to transmit the data to the computer from the vehicle. [16] 2.3.2 Bluetooth OBD Reader
OBD system which is equipped with Bluetooth system on their board is very popular in the industries. This system is using predefined codes on their board and it is connected to the OBD port of the vehicle. When the car is on, it establishes a connection with another mobile device which is running a specific application.
This system which is developed by a company name LEMUR vehicle Monitors sell the devices which connect to OBD port, then the user needs to install the application and
23
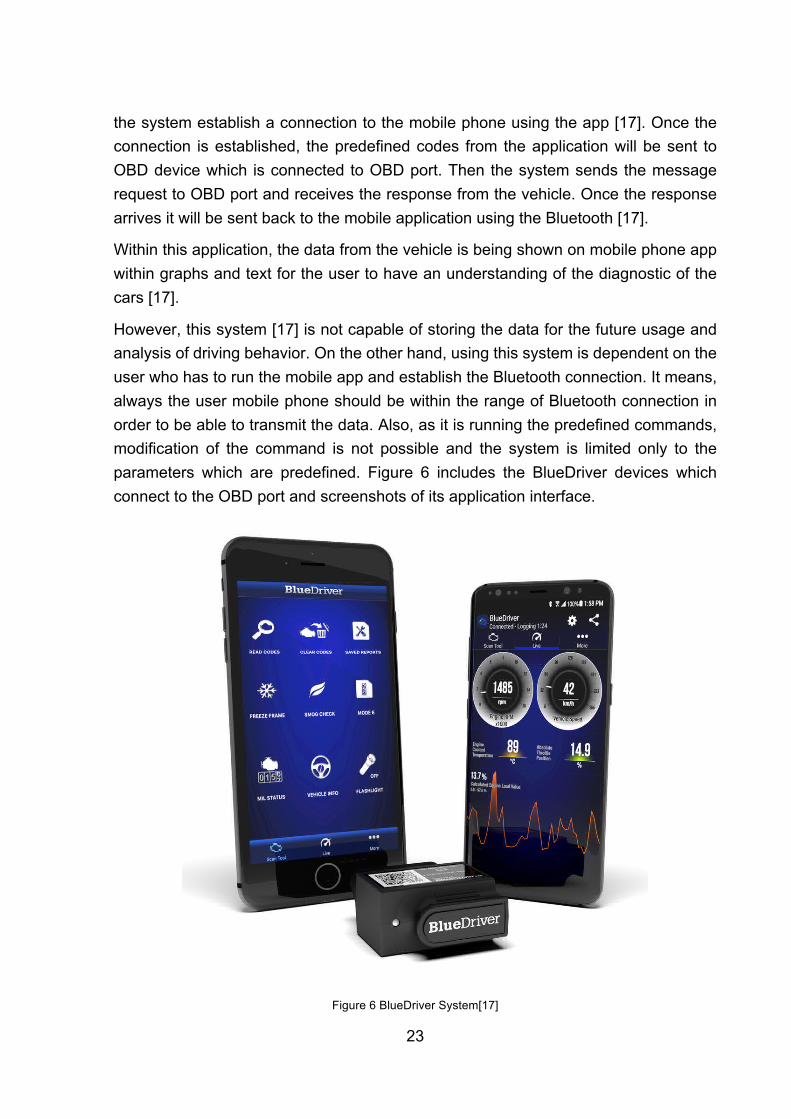
the system establish a connection to the mobile phone using the app [17]. Once the connection is established, the predefined codes from the application will be sent to OBD device which is connected to OBD port. Then the system sends the message request to OBD port and receives the response from the vehicle. Once the response arrives it will be sent back to the mobile application using the Bluetooth [17].
Within this application, the data from the vehicle is being shown on mobile phone app within graphs and text for the user to have an understanding of the diagnostic of the cars [17].
However, this system [17] is not capable of storing the data for the future usage and analysis of driving behavior. On the other hand, using this system is dependent on the user who has to run the mobile app and establish the Bluetooth connection. It means, always the user mobile phone should be within the range of Bluetooth connection in order to be able to transmit the data. Also, as it is running the predefined commands, modification of the command is not possible and the system is limited only to the parameters which are predefined. Figure 6 includes the BlueDriver devices which connect to the OBD port and screenshots of its application interface.
Figure 6 BlueDriver System[17]

24
2.3.3 Remote Diagnostic System
Another project which has done similar implementation on the on-board diagnosis of the vehicle is the Remote Diagnostic system which tries to transform the diagnosis data of the vehicle using GPRS data transmission method. [18]
In this system, there is a car terminal which is connected to the vehicle OBD port, it transmits the predefined message request to OBD port of the vehicle and receives the response from the user [18].Once the responses from the vehicle are received it sends the response to a cloud database using GPRS module and UDP communication mode. On the other hand, this system is using Baidu map API in order to get the GPS coordinate of the vehicle and send this together with diagnosis data of the car [18]. Finally, at the last step, the data will be visualized within a website for the user.
Figure 7 illustrates how the whole system in this project works together and their communication among each other.
Figure 7 Remote OBD Reader Hardware Structure Diagram[18]
This system is limited to the predefined commands which are embedded into car terminal point. On the other hand, as this system using the GPRS module, it is transmitting a limited amount of the data to the server and within this experiment, it is limited to fault errors of the vehicle only and modification of message request is not possible. On the other hand, this system is limited to only maximum 50 vehicles which are having car terminal at the same time[18].

25
The above-mentioned system is limited to the message requested as all of them are using the predefined commands which are hardcoded into the system and users are not able to add or modify the commands based on their need. On the other hand, by using Bluetooth or Wi-Fi modules there are many limitations and restriction for the connection purpose of the vehicle.
In order to provide the independence of the user and having the advantage of analyzing the data in future, it is necessary to have a cloud database which is accessible everywhere. The system which is connected to the vehicle should be able to communicate with the cloud storage and one the other hand should be well designed in order to provide easy modification of message requests which are supposed to be transmitted to the vehicle.
2.4 Summary
Within this chapter, the background of OBD port, how the OBD port is working with messages format and types has been explained. Each message request to OBD port contains two section which the first part is the MODE that represents the format of the data which tools is intended to access and second part is the parameter ID which represents the variable within vehicle network that is supposed to be accessed within the vehicle.
However, as the easy and user-friendliness of the OBD part in addition to clear specification released by SAE, several companies have worked and delivered OBD reader devices into the market in order to provide the advantage of data reading for the users within text and graphs for troubleshooting and analysis of the diagnosis data.
There were many projects developed for the OBD system of the vehicle in order to provide the diagnosis data for the external tools for the further understanding of vehicle. Within this chapter three of them have been introduced which mostly were doing a similar job by receiving the data from the vehicle and sending the data through various channels such as Wi-Fi, Bluetooth, and GPRS to an external application.
However, the major problem with related work into this project is they are sending predefined hardcoded messages to OBD system, and messages cannot be altered, deleted or added into the system.
On the other hand, another disadvantage of the previous works is they are dependent to other user systems such as mobile phone for Bluetooth connection between OBD system and data visualization application or Wi-Fi router for the data transmission to server which limits the independence of the system and forces the mobile phone or W-Fi router to be within the range of vehicle. Also, when using the GPRS it is limited to

26
the data which are being sent and with the project mentioned above it is limited only to the failure of the vehicle which does not use full for the studies and analysis of data.
Within this project, a different strategy will be used in order to overcome the disadvantages of the above-mentioned problem. Firstly, the OBD reader device will use the power from the vehicle power sources such as USB port, secondly it will communicate with cloud database in order to transmit the data and finally diagnosis data will be visualized in a website based on graphs and texts for studies and analysis, on the other hand, the messages which are supposed to be sent to vehicle could be managed using the website, in order to provide maximum adaptability for the user needs.
27
3 Concept Vehicle diagnosis is very useful for automotive OEMs, companies, and individual in order to have a better understanding of vehicle performance for troubleshooting, maintenance, and analysis of data. In order to provide this information for the external applications, it is necessary to extract this data from the vehicle.
However, extraction of data individually is not enough for the user to be able to analyze the data. Firstly, the data which are received from the vehicle such as speed or engine rpm is in a raw format which is basically hexadecimal values. On the other hand, for many of the data which are received from the vehicle, it is necessary to provide the conversions using the formulas specified in OBD standard [14]. That means the data should be converted into human-readable language.
In order to receive the data from the vehicle, an external application should be developed and connected to vehicle OBD port in order to receive the data from the vehicle. When data are received from vehicle necessary conversion and changes should be applied to the data according to the specification in [5].
When the data is received from the car, the system should be independent of the user. That means the system should work standalone without the assistance of user equipment. For this purpose, the system should work as a single application which is capable of handling message request and response to OBD port.
When the data are being received from the vehicle they should be stored somewhere in order to provide the possibility of future studies on data, therefore a cloud storage is recommended in order to store all of the data which are received from the vehicle.
A system which is connected to OBD port of the vehicle should establish a connection to the cloud storage in order to send and receive data in a real-time situation with fast responses.
However, even by storing the data into the cloud storage, still, the data are meaningless for the users as they are only texts. In order to have an understanding of the vehicle performance. For this purpose, a website is the best application to be used as it can be accessed from anywhere and by a computer, tablet or mobile phone where internet connection is provided.
However, within the OBD standard, it is mentioned that there are Standard ID and Nonstandard ID which are vehicle manufacture specification. As there is a variety of the message request that can be sent to the vehicle, the system should provide a user-friendly situation for the user to add/edit or delete the messages which are supposed
28
to be sent to the vehicle. It is recommended to adopt this functionality to the website with high user-friendly practices.
Therefore, this project can be divided into three sections as follow:
- Data Aggregation: which focus on how the data can be retrieved from vehicle - Data Management: For the data storage of vehicle diagnosis information - Data Visualization: Focus on the visualization of the data for the user
By development of a complex system with above functionality, a complete OBD data management system can be achieved which can provide easy functionality for the user to read the vehicle diagnosis data and also add/edit or remove the message requests which are supposed to be sent to the vehicle.
3.1 Data Aggregation
The first step for this project is to develop a system which can interact with the OBD port of the vehicle. Interaction with this port means to be able to send the message request to the OBD port and read the response from this port.
There are many connection circuits available on the market which are compatible with OBD port in figure 3 and the other side is either RJ45 or USB or even establish a Bluetooth connection with external tools. However, it is necessary to define the system which is going to send and receive the data to OBD port.
There are many options available for this purpose. Firstly, the requirement of this system is as follow:
- It should be able to communicate with OBD port using the specific cable - Send and Receive the data byte to/from OBD port - Capable of supporting programming languages for the implementation of
system logic - Capable of handling different add-on module for communication with cloud
storage - Power supply for the device coming from the vehicle USB port, therefore the
system should have very low power consumption
As the system with above requirement considers a complex system, the device which is going to handle this requirement should be carefully selected to fulfill the requirement.
There are plenty of choices to be selected as the device for this project which they will be explained in details. So far two choices for the device selection have been

29
discovered which are capable of doing the tasks which are required for this project. The first one is Arduino and second one is Raspberry Pi. 3.1.1 Data aggregation device
Arduino is a microcontroller which is very easy to use and is a combination of hardware and software [19]. This microcontroller is widely used for so many projects in industry, science centers, students, and programmers. The following figure 8 illustrates how does an ARDUINO board looks like and its pins.
Figure 8 Arduino UNO Rev3 [20]
The Arduino microcontroller is a very cheap unit which can provide the functionality for us. As the advantage of Arduino following point can be mentioned:[19]
- Inexpensive - Cross Platform - Simple, Clear Programming Environment - Open source and extensible software - Etc.
However, it fulfills our requirement compatible with powering up with the USB port, providing the programming language for implement implementation of application logic. But, there are few other disadvantages which can cause a problem for future development as follow:
- In order to provide the connection to the OBD port, RJ45 and USB part are not directly supported and modification into Arduino board is needed

30
- Communication with cloud storage is not supported and any type of connection module should be added to the board
- On the other hand, any module which is being added to Arduino board should be handled separately in the programming interfaces which can become challenging as well
Raspberry Pi is a small size computer which very well designed with cheap price in order to provide the maximum functionality similar to the normal computer on the market [21]. It has been initiated based on UK non-profit company name Raspberry Pi.
In fact, raspberry pi can have an operating system on itself which can run as a single computer. It can provide exact functionality same as a computer but with less performance speed.
Based on Figure 9 all the inputs and outputs are shown in the picture as this Raspberry Pi has 4 USB port on top, LAN socket, HDMI, Power source and etc.
Figure 9 Raspberry Pi 3[21]
So far about four models of Raspberry Pi has been released to the market with different specification. However, by every release of the Raspberry Pi, it got more complex and more similar to the normal computer, however with a very cheap price in comparison to normal computers.
However, an overview of comparison of models of Raspberry Pies available in the market is clearly explained in the table below. As you can notice, after every release of raspberry pi, there are many changes in terms of performance and input and outputs.

31
Due to the availability and performance of these models, they can be the best choice for this project as well.
The following table 4 is discussing different models of the Raspberry Pi which are available in the market and it explains their differences in details.
Model B+ Model 2 Model 3 Zero
Processor Broadcom BCM2835 SoC featuring ARM1176 32-bit dual-core CPU
Broadcom BCM2836Soc featuring ARMv7 32-bit quad-core CPU
Broadcom BCM2837 SoC featuring ARMv8 64-bit quad-core CPU
Broadcom BCM2835 SoC featuring ARM1176 32-bit dual-core CPU
GPU VideoCore IV
Clock 700MHz 900MHz 1.2GHz 1GHz
Memory 512 MB 1 GB 1 GB 512 MB
USB Ports 4 4 4 1 (Micro-USB)
Ethernet Yes Yes Yes No
Wi-Fi No No Yes No
Bluetooth No No Yes No
GPIO Pins 40 40 40 40 (unpop.)
Storage MicroSD card MicroSD card MicroSD card MicroSD card
Table 4 Raspberry Pies Comparisons[21]
Based on table 4, the raspberry Pies are coming with a processor which are based on 32/64 bit cores, also they take advantages of Clock, Memory, USB Ports, Wi-Fi, Bluetooth and storage which can be a really great advantage in this exercise in compare to Arduino.
However, there should be selected among all of these models, in fact, Raspberry Pi Model 3 is one of the latest models of the Raspberry Pi which provides the 4 USB port which can be really useful for the connection purpose to the OBD Port of the vehicle, Wi-Fi can be useful for the programming of the Pi, and also compare to other models it is coming with 1 GB of Memory and 1.2 GHz of Clock. However, the Zero also can be used in this project, but as it only provides 1 Micro-USB there might be some limitation for attaching more USB port into the Raspberry Pi.
On the other hand, Raspberry Pi is a standalone computer which operates fully as a normal computer with a Raspbian operating system which is based on Debian and specifically designed to be used in Raspberry Pi [22]. And for programming and

32
configuration purpose, Raspberry Pi can handle everything within its OS and external computers are not needed. Therefore, as it supports Debian based operating system, it will support most of the programming languages for our projects such as Python, C/C++ and etc. [22].
Next step of this project which is playing important rule is to provide communication between the Raspberry Pi and OBD port of the vehicle in order to send the message request and receive the response from the car.
In fact, there are much available connection cable and circuit on the market which can provide the communication channel from OBD port to external application. On the other hand, the communication channel should be adaptable with the communication protocol within the vehicles.
Figure 10 is the ELM 327 interface which can be connected to OBD port of the vehicle and provide a serial communication to an external computer with its USB socket at the end.
Figure 10 ELM 327
There are many interfacing tools which are compatible with OBD port, but among all of them, the most reliable one which has been developed and released in the market is ELM 327 interface tool develop and released by company name ELM Electronics [23]. This company has implemented the circuit which can receive the message request based on OBD standard, interpret them and transmit them to the diagnosis communication protocol of vehicle [23].
Based on the specification of the ELM 327 circuit and cable, it is capable of support for the following OBD protocols [23]:
- ISO 15765-4 - SAE J1939 - ISO 9141-2
33
- ISO 14230-4 - SAE J1850 - PWM & VPW
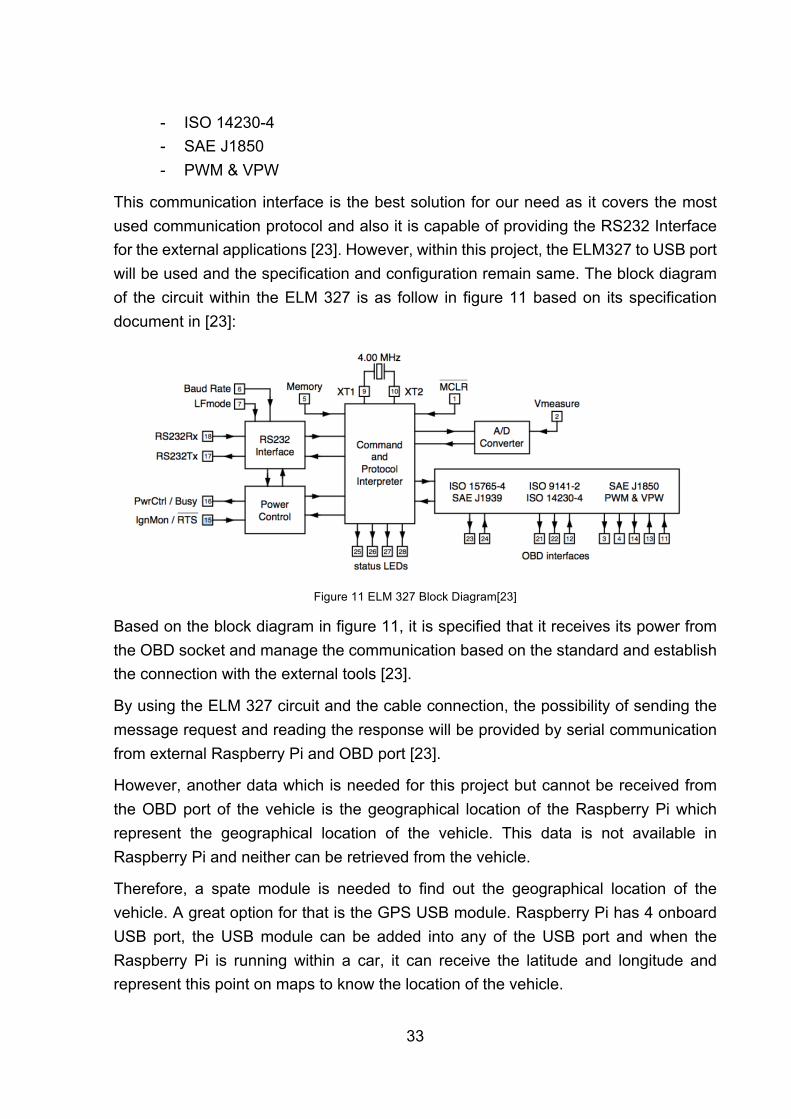
This communication interface is the best solution for our need as it covers the most used communication protocol and also it is capable of providing the RS232 Interface for the external applications [23]. However, within this project, the ELM327 to USB port will be used and the specification and configuration remain same. The block diagram of the circuit within the ELM 327 is as follow in figure 11 based on its specification document in [23]:
Figure 11 ELM 327 Block Diagram[23]
Based on the block diagram in figure 11, it is specified that it receives its power from the OBD socket and manage the communication based on the standard and establish the connection with the external tools [23].
By using the ELM 327 circuit and the cable connection, the possibility of sending the message request and reading the response will be provided by serial communication from external Raspberry Pi and OBD port [23].
However, another data which is needed for this project but cannot be received from the OBD port of the vehicle is the geographical location of the Raspberry Pi which represent the geographical location of the vehicle. This data is not available in Raspberry Pi and neither can be retrieved from the vehicle.
Therefore, a spate module is needed to find out the geographical location of the vehicle. A great option for that is the GPS USB module. Raspberry Pi has 4 onboard USB port, the USB module can be added into any of the USB port and when the Raspberry Pi is running within a car, it can receive the latitude and longitude and represent this point on maps to know the location of the vehicle.

34
For this purpose, there are several USB ports available in the market, however, the one which is chosen for this project is GPS/GLONASS U-Blox 7 which also provides serial communication and can continue sly provide the information about the location of the vehicle.
The following figure 12 is the picture of GPS/GLONASS U-Blox 7 USB Dongle which can receive the geographic location of itself.
Figure 12 GPS/GLONASS U-Blox 7
3.1.2 Communication to Cloud
Within the vehicle, the project is not limited only to the data collected from the vehicle, but also to transmit this data to a cloud storage. However, as Raspberry Pi is being used, it is equipped with an internal storage. But, the internal storage is not enough for our purpose. One of the main goals of this project is to transmit the diagnosis data received from vehicle to a cloud storage to have the following advantages:
- Access to data from everywhere - Lifetime availability of the data - Secure storage of the data - Visualize the data other tools which can interact with the data storage
In order to meet the above-specified requirement, it is necessary to use the advantage of cloud storage which can store diagnosis data of the vehicle in needed format.
However, in order to establish a connection with outside sources such as cloud storage, it is necessary that the Raspberry Pi which is running within the vehicle to communicate with the cloud storage.
In order to provide the communication to a cloud storage, firstly there should be established a connection to the internet. For this purpose, there are two options available:
1. Communication using Bluetooth

35
2. Communication using Wi-Fi 3. Communication using GSM and sim card Internet
As the Raspberry Pi 3 is going to be used within this project, it has an onboard Bluetooth capability which can provide the connection to the mobile phone [21]. By making the mobile phone a hotspot, the Raspberry Pi will be able to establish the connection to the internet in order to communicate with cloud storage.
However, by using this communication protocol, the Raspberry Pi will be dependent to the user and always, the user mobile phone should be within the range of the Bluetooth and also it consumes the mobile phone power a lot.
However, if the communication is using the user mobile phone, the Bluetooth connection of the user will be only with the Raspberry Pi and it stops the user to use the Bluetooth for other purposes such as communication for the infotainment purpose or using the Bluetooth for the calls and etc. The Bluetooth communication of mobile phone and infotainment system of the vehicle is very important for the user and it is not feasible to request this connection from the user.
As one of the aims of this project is to develop a system which is independent of users and can work as an independent and single application, the Bluetooth communication to cloud is not suitable for this project.
Another option for communication through the internet is to use the Wi-Fi module which is available on the Raspberry Pi 3 as well. For this purpose, there should be a Wi-Fi spot which Raspberry Pi can establish a connection with. Wi-Fi also should be connected to the internet as well.
However, still the Wi-Fi module is not usable for this purpose as it makes the Raspberry Pi dependent to another system and always the Raspberry Pi and basically, vehicle should be within the range of Wi-Fi connection, which is not feasible for this project.
It is very important within this project, to use the system while the vehicle is moving and transformation of the data should be possible within the movement of the vehicle.
The last option which is available for the connection of the Raspberry Pi to the internet is using the GSM Module. As the Raspberry Pi 3 is equipped with the 4 USB port [21], a sim card reader which is capable of providing the internet connection can be plugged into the USB port in order to provide the internet connection for the Raspberry Pi 3.
For this experiment, a 4G wireless Modem can be used which can be connected to the Raspberry Pi or any other USB port and provide the internet connection for the Raspberry Pi. However, the wireless modem should have a local sim card which can provide an internet connection like 2G, 3G or 4G.
36
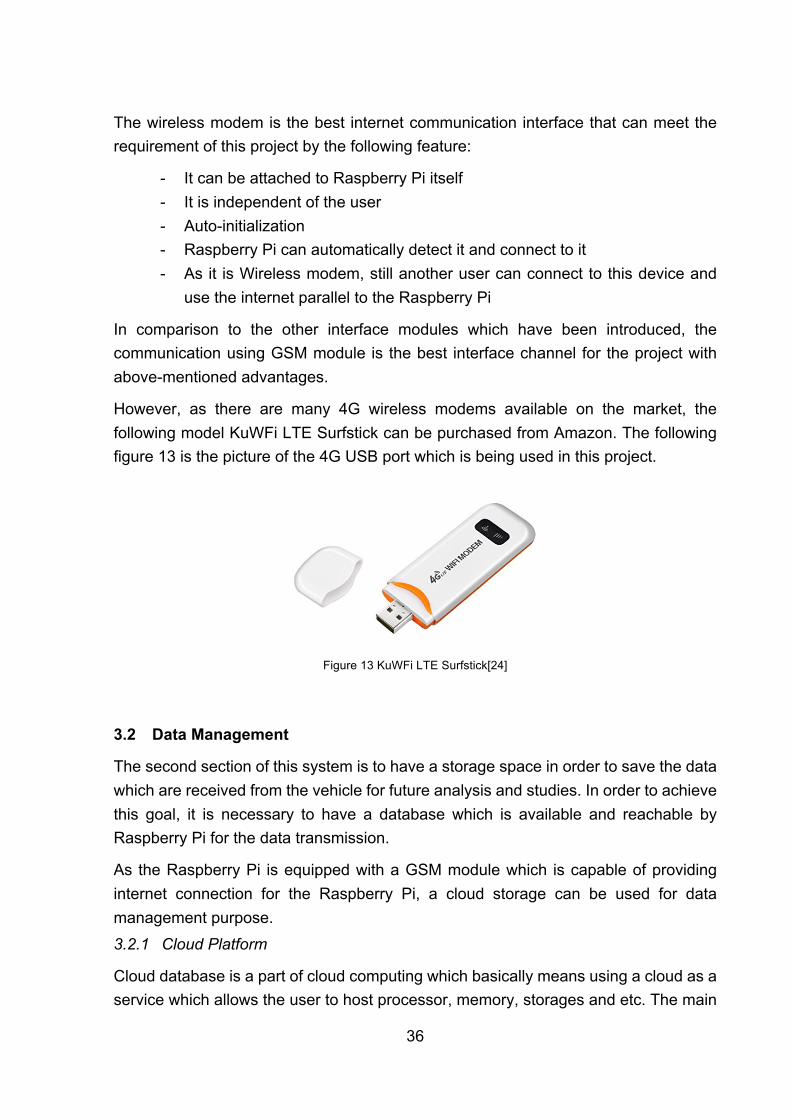
The wireless modem is the best internet communication interface that can meet the requirement of this project by the following feature:
- It can be attached to Raspberry Pi itself - It is independent of the user - Auto-initialization - Raspberry Pi can automatically detect it and connect to it - As it is Wireless modem, still another user can connect to this device and
use the internet parallel to the Raspberry Pi
In comparison to the other interface modules which have been introduced, the communication using GSM module is the best interface channel for the project with above-mentioned advantages.
However, as there are many 4G wireless modems available on the market, the following model KuWFi LTE Surfstick can be purchased from Amazon. The following figure 13 is the picture of the 4G USB port which is being used in this project.
Figure 13 KuWFi LTE Surfstick[24]
3.2 Data Management
The second section of this system is to have a storage space in order to save the data which are received from the vehicle for future analysis and studies. In order to achieve this goal, it is necessary to have a database which is available and reachable by Raspberry Pi for the data transmission.
As the Raspberry Pi is equipped with a GSM module which is capable of providing internet connection for the Raspberry Pi, a cloud storage can be used for data management purpose. 3.2.1 Cloud Platform
Cloud database is a part of cloud computing which basically means using a cloud as a service which allows the user to host processor, memory, storages and etc. The main

37
advantage of cloud computing is that scalability and availability of the resources which you have from anywhere in the globe [25].
There are several companies which provide the infrastructure for the user to use the virtual resources provided for them. Different types of cloud services available which they are explained in Table are as follow [26]:
Service Full Name Purpose
IaaS Infrastructure as a Service
Virtualize computing system with capability of networking, data storage, memory, and monitoring availability
PaaS Platform as a Service
It provides a complete platform for operating system, network, and storage
DBaaS Database as a Service
It is preconfigured deployment for the database with PaaS environment using standardized deployment process
SaaS Software as a Service
It is for the software deployment purposes to be accessible via internet instead of local instances
Table 5 Cloud Services[26]
However, it depends to the purpose of the project which service can be used, within this project the cloud service which is needed to use either should be in IaaS service or PaaS which provide storage capacity for us.
There are many companies which provide the cloud platform for data storage. Most of them are providing similar features such as Database instances, Database monitoring, security, backup and etc. Among all of the cloud storage formats which are available in the market, Google is providing great tools and functionalities for this purpose.
Cloud database is being configured within the services of the cloud platforms. There are many different cloud platforms available in the market which among them two successful reliable services are Google and Amazon.
However, the cloud database should be within a service which can provide the following features in order to meet the requirement for the project which are:
- Ensuring Backup and Recovery - Implementing High Availability

38
- Monitoring and consistency check - Accessibility - Security
In fact, Google Cloud platform can provide all the features as needed for this project. Within the Google Cloud Platform, there is Google Cloud SQL which can handle the project database needs for us [27]. It is based on the IaaS service, which provides the networking, monitoring, and storage, on the other hand, it supports MySQL and PostgreSQL databases which perfectly match the project requirement with following features [27]:
- Automatically encryption of data - Requires explicit authorization of clients, application and etc. - Perform automatic backup of data - Easy data restoration - High rate of uptime - Hosts MySQL databases in US, Europe or Asia
With the above-mentioned feature, it can be easily identifying that Google Cloud is a perfect solution for the data storage purpose of this project, as it is based on cloud, the data are distributed globally, and however, in order to ensure the fast fetch of data, the advantage of hosting the database in Europe can be taken by using this service. 3.2.2 Cloud Communication
Moreover, the data management section is not only limited to the cloud database, but also about the communication to the cloud. Establishing a connection to the database on the cloud is not practically possible within the Google cloud [27]. However, google cloud platform introduce several ways in order to provide the connectivity to the Google cloud such as Google Compute Engine, Google App Engine apps which can communicate directly with Cloud SQL database instance and also proxies for external applications.
Beside the Google Cloud SQL database which is provided for the user, there is another service name: Google App Engine which is a service based on the Pay as a Service (PaaS) which can directly communicate with SQL database instance within the Google Cloud Platform and also host the web server in order to communicate with outside world. [28]
Google Cloud APP engine will host the web server which can be developed in Python, Java or GO language in a runtime environment [29].Google App Engine is a website hosting tool that can handle multiple sources of files and also, it provides a default host URL for the sources in order to access the files which are uploaded into it [29].

39
However, all of the requests to the website URL should be defined using the within a file name app.yaml, this file will be read by the App engine and all of the requests will be processed based on the configuration in app engine [29]. Within the app.yaml the environment variable, libraries and request handler should be defined. When a request received the app engine host, it sends the request to the file which is specified in app.yaml and the file will process the link and return the implemented response [29].
As it has been mentioned earlier, Google App Engine can directly communicate with the Google Cloud SQL based on the project and instance name defined when creating the SQL instance database [29].
Therefore, a web server within a supported programming language in google app engine such as Python, Java or GO should be implemented and uploaded in Google Cloud App Engine in order to work as a bridge between the external tools and the database [29].
When a request is sent to the Google App Engine host, it will be processed by the web server, it will connect to SQL database instance, get the query from the database and return the data into the application which requested this [29].
Moreover, each of the external application needs to be authorized in order to communicate with the Cloud database. The cloud database which is going to store the diagnosis data are within MySQL database. In order to design the database with tables and views, there are needs for a database management system (DBMS). The suitable DBMS for designing the database is MySQL Workbench. However, for the communication with cloud database, there is authorization needed [28].
The authorization for the communication MySQL workbench is done in Google Platform website, and user needs to provide the ipv4 address of the computer which is running the MySQL Workbench. Once the authorization is a success, MySQL Workbench will be able to communicate to Google Cloud SQL. However, Google Cloud SQL database instance has static IP address, therefore MySQL workbench can use the IP address of MySQL database instance on Cloud for establishing the connection after the authorization is successful.
Figure 14 shows the authorization section in Google Cloud SQL Configuration which user can add their ipv4 address.

40
Figure 14 Google Cloud SQL Authorization page
Figure 15 is designed to explain the communication of MySQL workbench with the cloud SQL database.
Figure 15 MySQL Workbench with Cloud MySQL Database Sequence Diagram
On the other hand, the app engine can be used for hosting the website which can visualize the diagnosis data for this project and it can directly send the request and

41
receive the responses from the web server that is implemented and deployed on the App Engine [29].
In figure 16 the communication protocols between Raspberry Pi and Cloud SQL database is illustrated. Firstly, Raspberry Pi will send the vehicle registration number which is unique to the web server which is running on Google App Engine, as the App Engine is authorized to directly communicate with Google Cloud SQL database, it gets a query of all the commands which are supposed to be executed in vehicle and return the result to the Raspberry Pi.
Figure 16 Raspberry Pi communication to Cloud SQL Database

42
3.3 Data Visualization
The final step of this project is to visualize the data which are stored in a cloud database. In fact, the data which are stored in cloud database is received from the vehicle, and they are meaningless for humans. Providing the option for studies and analysis of this data is the key point of this project.
Therefore, in order to provide the option for the user to be able to study and analyze this data, the data should be shown to the user. As the data are within the Google Cloud database and there is a web server running Google App Engine, the best option is to develop a website which can interact with the web server in order to receive this data.
In fact, Google Cloud platform provides a very user-friendly website in order to configure all the instances of the cloud application such Database instances and App Engine services. Using the Google Cloud Platform also provides the security and backup planning of the data which can avoid any data loss for us.
Google App Engine is a platform as a service (PaaS) which the user is able to host the platform to run the services [27], and the web server can be deployed into this service which can host the web server for the project and provide a trusted communication channel to the cloud database.
Google App Engine is where the possibility of hosting the application within the real-time environment is possible. Also, the Google App Engine provides the host URL for accessing the files it is hosting [29].
The website can be developed using the HTML, CSS and JavaScript language and by sending the queries to the web server in order to receive the data. By using the web development tools, it will be possible to clearly visualize the data within graphs and texts in order to visualize the data for the user.
However, the website should not be limited only to the visualization of the data. But also, the configuration of the commands and vehicle. In fact, this system should be capable of handling multiple cars. Each car can be identified using the registration of the vehicle, within the website the user should be able to register the vehicle that is intended to receive the data from.
Beside the vehicle registration, another feature which the website can add to this project is the possibility of managing the message request which is supposed to be sent to OBD port of the car.
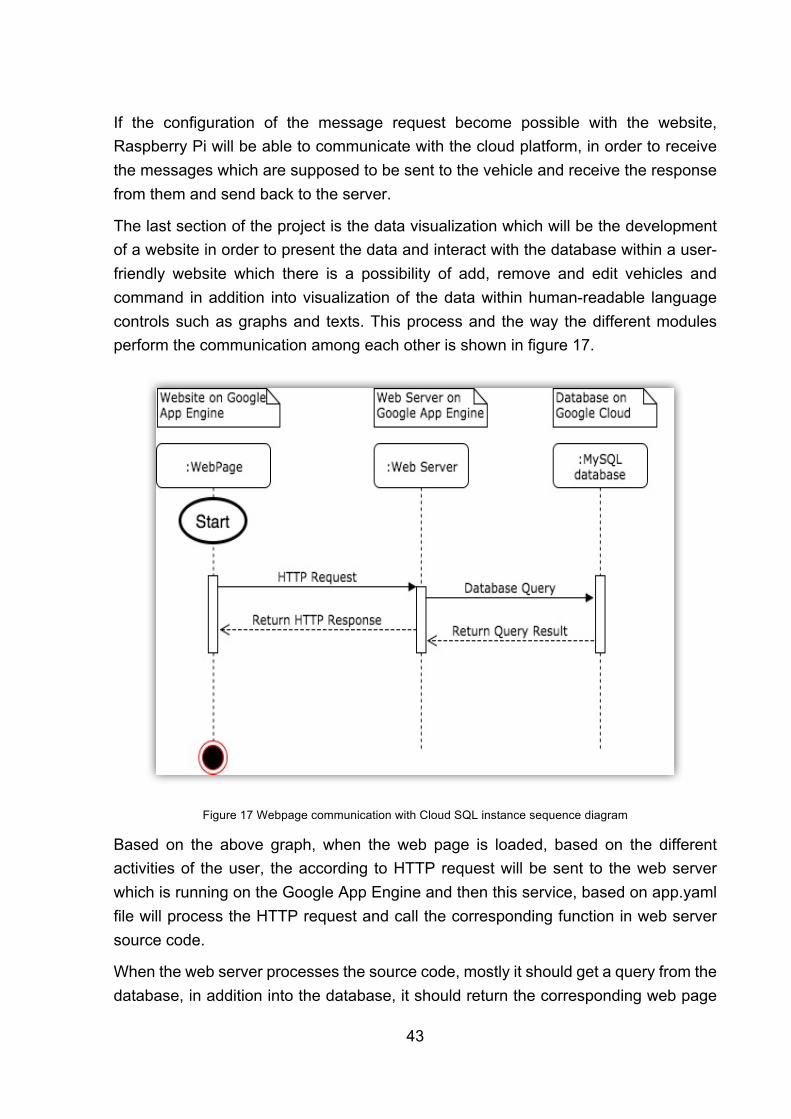
43
If the configuration of the message request become possible with the website, Raspberry Pi will be able to communicate with the cloud platform, in order to receive the messages which are supposed to be sent to the vehicle and receive the response from them and send back to the server.
The last section of the project is the data visualization which will be the development of a website in order to present the data and interact with the database within a user-friendly website which there is a possibility of add, remove and edit vehicles and command in addition into visualization of the data within human-readable language controls such as graphs and texts. This process and the way the different modules perform the communication among each other is shown in figure 17.
Figure 17 Webpage communication with Cloud SQL instance sequence diagram
Based on the above graph, when the web page is loaded, based on the different activities of the user, the according to HTTP request will be sent to the web server which is running on the Google App Engine and then this service, based on app.yaml file will process the HTTP request and call the corresponding function in web server source code.
When the web server processes the source code, mostly it should get a query from the database, in addition into the database, it should return the corresponding web page

44
in addition to the data which hare are received from cloud SQL instance. In this way, the user can modify the message requests from the user interface in the website and the Raspberry Pi will receive the modified messages.
3.4 Summary
Within the concept chapter, the project definition has been explained in details. In order to accomplish the objectives, the project has been divided into three sections as follow:
- Data Aggregation - Data Management - Data Visualization
Data aggregation is the first section which describes how to receive the data from the vehicle, within this scenario a Raspberry Pi which is connected to vehicle USB port for power supply is used. In order to provide the connectivity to the vehicle OBD port, ELM 327 Circuit and cable are used which is compatible with OBD port of vehicle from one side and USB port from another side. ELM 327 provides the serial communication from Raspberry Pi to vehicle OBD port in order to send and receive messages. On the other hand, the data which are supposed to be sent to the vehicle should be received from a cloud database, and data which are received from the vehicle should be sent back to a cloud database, therefore a communication to the internet should provide. For this reason, 4G Wireless USB dongle is being used in order to connect to internet using a local sim card and provide the internet connection for the Raspberry Pi.
The next step of the project is design and implementation of the Cloud storage, which for this purpose Google Cloud Platform is chosen as it provides great advantages for data storage and communication of data storage with outside application. Google Cloud provide SQL instances based on MySQL schema or PostgreSQL. For this project as there are needs for tables, views and other database functionality MySQL database are going to be used which is fully supported by Google Cloud Platform.
However, communication with the Google Cloud SQL instance requires specific configuration for the authorization and communication activity. For design and implementation of the database using specific IDE such as MySQL Workbench on a local machine, it is required to authorize the computer based on its IPV4 address in google cloud authorization form, then IDE will be able to connect to database instance using its static IP address provided by Google Cloud.
Another communication channel which should be established to Google Cloud Database instance is for the Raspberry Pi. IPv4 address of the Raspberry Pi is dynamic and cannot be authorized in google cloud as it keeps on changing. For this reason,

45
another service from Google Cloud Platform should be used which is known as Google App Engine. This service can host the web development files in a runtime environment which is always available. Therefore, a web server can be implemented and deploy into Google App engine which is responsible to handle HTTP Request. The Raspberry Pi can send the HTTP request to the URL provided by Google App Engine. The web server is going to be deployed in Google App Engine which is inside the Google Cloud Platform and it can be authorized to have communication with Cloud SQL. The web server will work as a bridge between Raspberry Pi and Database instance. When Raspberry Pi send an HTTP request to a web server, it is able to get implemented queryies from MySQL database and return the result to Raspberry Pi.
On the other hand, the last section of this project is to implement a website with the capability of modifying the message request in the database, modification of vehicle data and visualize the data for further analysis and studies by means graphs and text. As previously mentioned Google App Engine can host the website files such as HTML, CSS or JavaScript files, the web server then can return the files into the browser based on the request that is received from the browser by user’s action. The app engine can host these files in addition to a web server that is running.
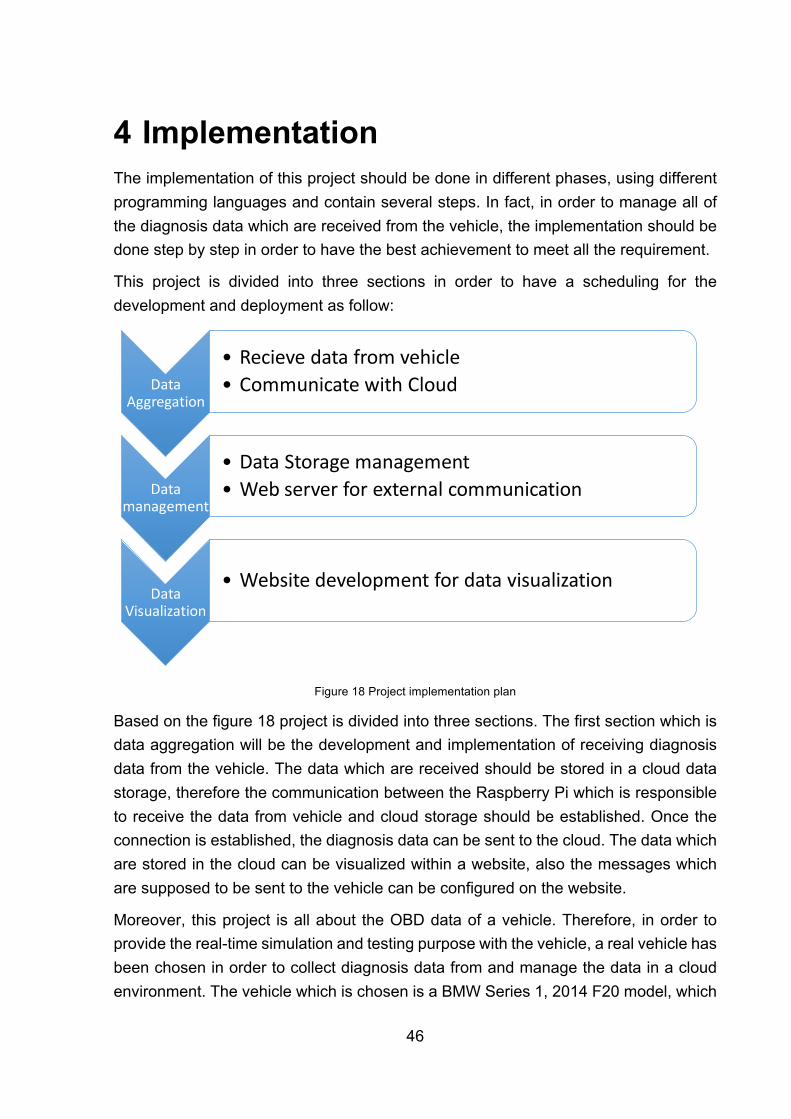
46
4 Implementation The implementation of this project should be done in different phases, using different programming languages and contain several steps. In fact, in order to manage all of the diagnosis data which are received from the vehicle, the implementation should be done step by step in order to have the best achievement to meet all the requirement.
This project is divided into three sections in order to have a scheduling for the development and deployment as follow:
Figure 18 Project implementation plan
Based on the figure 18 project is divided into three sections. The first section which is data aggregation will be the development and implementation of receiving diagnosis data from the vehicle. The data which are received should be stored in a cloud data storage, therefore the communication between the Raspberry Pi which is responsible to receive the data from vehicle and cloud storage should be established. Once the connection is established, the diagnosis data can be sent to the cloud. The data which are stored in the cloud can be visualized within a website, also the messages which are supposed to be sent to the vehicle can be configured on the website.
Moreover, this project is all about the OBD data of a vehicle. Therefore, in order to provide the real-time simulation and testing purpose with the vehicle, a real vehicle has been chosen in order to collect diagnosis data from and manage the data in a cloud environment. The vehicle which is chosen is a BMW Series 1, 2014 F20 model, which
DataAggregation
• Recievedatafromvehicle• CommunicatewithCloud
Datamanagement
• DataStoragemanagement• Webserverforexternalcommunication
DataVisualization
• Websitedevelopmentfordatavisualization

47
is equipped with OBD port that is based on the can protocol and following ISO 15765-4 CAN standard. Figure 19 is the picture of the vehicle which will be used in this project.
Figure 19 BMW Series 1, 2014 F20 Model
Within this chapter, the implementation of each section will be discussed in details, in order to provide a clear vision about the implementation of the project and how each section is working.
4.1 Data Aggregation
4.1.1 Raspberry Pi
The main device which is holding most of the responsibilities of this project is the Raspberry Pi that is in the vehicle and connected to the OBD port. However, in order to the startup of the Raspberry Pi, the power supply should be provided for the Raspberry Pi. Raspberry Pi can be a startup with a power supply of 5-V with 2 A which can be received from the USB port of the vehicle [30].
The great advantage of the Raspberry Pi is, once it connects to the power start, it automatically starts up. Therefore, the application which is supposed to run the script for data collection from the vehicle can be started automatically.
The script which is supposed to be executed in order to receive the data from the vehicle and communicate with the cloud can be automatically started at the boot of the Raspberry Pi using launcher and Crontab [31]. The launcher is executable command lunch tool in order to start a script. Crontab is a background process which executes the launcher at a specific time [31].

48
When the Crontab and launcher are configured, when the Raspberry Pi is connected to the power supply of the vehicle, and Raspberry Pi is booted, the Crontab will automatically locate the Launcher and start it, then the launcher executes the script and data collection and communication with cloud will be set up.
However, as it has been discussed previously, it is important to have communication channels with the internet, therefore it is necessary to add necessary modules to the Raspberry Pi to the internet. For this purpose, as it has been discussed in 3.1.7 GSM modules which are a wireless 4g Internet provider. However, there should be a sim card which has the capability of providing the internet, and O2 operator sim card with 4 GB of the internet is inserted into this wireless stick in order to provide the internet. On the other hand, when the Raspberry Pi once connect to this Wi-Fi device, it will automatically connect to this USB wireless module upon the availability and it ensures always an established connection.
4.1.2 ELM 327 Circuit and Cable
Almost all of the automotive vehicle is equipped with the OBD port which is responsible to provide diagnostic information for analysis the vehicle performance and diagnosis purposes [23].
The OBD port and diagnosis communication or useless if they are supposed to be used directly with an external tool. Therefore, ELM 327 can act as a bridge between the external tools and OBD port in order to interpret and transmit the data to each other [23].
Communication to OBD port using ELM 327 is done using serial communication from external tools and the ELM 327 cable. In order to send and receive data to through the serial port, sending the Attention (AT) commands are necessary. Therefore, firstly the initialization of the ELM 327 should be performed by sending the AT commands through the serial communication from PC to ELM 327 [23].
However, there is the possibility of sending the wrong AT commands to the ELM 327 cable, which using this circuit, when it receives a wrong AT command it returns a “?” as a wrong or unknown AT command [23].
When initializing the ELM 327, firstly, it should be confirmed that ELM 327 cable is attached to OBD port of the vehicle. The power supply of the ELM 327 circuit is received from OBD port of the vehicle as it has a specific pin to provide the power for the interpreter. ELM 327 is required to ham 5V of power in order to start up [23].

49
In order to be able to communicate with OBD port of the vehicle, firstly it is necessary to initialize the ELM 327, which is done using the AT Commands. The ELM 327 should be connected to OBD port of the vehicle from one side to have enough power source, and from the other side connected to external tools to be able to communicate and initialize.
In order to initialize the ELM 327, firstly the serial communication should be established by using the right port of the computer (or Raspberry Pi) in this project and set the baud rate which is normally 9600.
However, before start sending messages or receiving the data from the vehicle, it is necessary to completely initialize the ELM 327 circuit in order to be able to communicate with the vehicle. As it has been explained earlier, there are different vehicle protocols which automotive manufacture implement in their automotive. Therefore, ELM 327 need to detect the protocol of the vehicle as well. A great advantage of the ELM 327 circuit is that it has protocol auto detect mode which can automatically detect the vehicle protocol as well.
However, the following messages should be sent to the ELM 327 using the serial communication for the initialization of the cable and circuit based on ELM 327 specification [23].
In order to initialize the communication and detecting the circuit and resetting this following command should be sent [23]:
>ATZ
The response from above command should be “OK”, and if it returns anything rather than “OK”, that means the external tools failed to connect to ELM 327.
By default, every message which is sent to ELM 327 will be echo back to the sender as well which is unnecessary action and can be turned off by following command [23]
>ATE0
This message same as “ATZ” should return “OK” as a successfully processed message.
In order to ask the ELM 327 to automatically detect the protocol of the vehicle, the following message should be sent to ELM 327 [23]:
>ATSP0
This will reset the protocol of ELM 327 protocol and start detecting the protocol. The response from the above message should be “OK” as well.

50
The next step is to make sure ELM 327 is able to communicate with the vehicle as well. Therefore, the following message can be sent as a message request to OBD port [23]:
>01 00
It is simple message request to the OBD port and if the communication between ELM 327 and vehicle is not established it returns “UNABLE TO CONNECT TO CAR”, and any message rather than this means the connection is successfully established. 4.1.3 Python Program
The implementation of the script which is going be executed in Raspberry Pi will be done in Python 2.7 language. In fact, there are many programming languages available such as C, C++ or even Java which can be used in this project. But, the Python language is chosen as it is object oriented, easy to understand with many libraries available for programming [32].
Python language can be used for writing script of codes to be executed independently, or as a procedural programming which runs the functions along each other, or even using the object-oriented for classes and object instantiation [32]. On the other hand, there are many tested open source library which can be simply added to the project and using them. On the other hand, python script can be executed directly after they are edited by using the python compiler which does the interpretation automatically and executes the scripts [32].
As it has been mentioned, there are many open source libraries which can be used within this project, to the following libraries will be used most:
- logging: implementation of functions and feature for the flexible environment of logging
- serial: which provide the interfaces for communication with ELM 327 cable - lxml: which provide the functions for converting the string to XML and vice
versa format for data transmission from Raspberry Pi and Google Cloud - requests: provide the functionalities in order to communicate with cloud web
server using HTTP requests and receive the responses - threading: for handling the threads
Logging is playing an important rule within the whole development of the application, which enables to the ability to follow up the application functionality and log necessary debug, and functionality information within the application [33].
The following figure 20 shows a sample of the log information that has been received from the codes.

51
Figure 20 Logging screenshot of the application
Serial communication is another important phase of the script which is supposed to be executed, the serial communication should establish the connection between Raspberry Pi and OBD port of the vehicle using ELM 327 IC. The library which can be used for encapsulation of the serial communication through Raspberry Pi port is named PySerial and use in python language by using “import serial” which is a great library for communication through the serial port of device [34].
The following figure 21, illustrate how easy to use the serial library available in python and can provide the accessibility to ELM 327 IC, in order to be able to communicate with the ELM 327 for initialization or sending or receiving the messages following code sample can be used:
Figure 21 Serial Communication using Python
The above code snippet shows how the python script can communicate with the serial port. ‘/dev/USB0’ is the port name which ELM 372 cable is connected in Raspberry Pi,
import Serial Connection = serial.Serial('/dev/USB0',9600,timeout = 0.4) Connection.write('01 0c \r') RespondValue = Connection.readlines()

52
9600 is the baud rate of the connection and 0.4 is in the seconds format and indicate for how long the script should wait until it receives the bytes, if this value is passed timeout exception will be raised[35]. By using this library, the initialization, sending message request and receiving the responses can be managed in the codes.
Lxml is another open source library which is being used in the script in order to use XML as the schema of the data transmission formats. When the Raspberry Pi is started, it sends the request to the web server using HTTP request, in order to receive the message requests which are supposed to be executed in the vehicle. The data which are received from the web server are in XML format, therefore, it should be parsed in order to extract the messages from XML data.
On the other hand, after sending each message to the vehicle, the responses are received from the car, the responses should be stored in an XML object in order to send to the web server. Conversion and managing of the string objects into XML object will be done using the lxml library [36].
Requests library is a great open source interface in order to interact with the web server. As it has been explained earlier, the web server will be deployed on google app engine which provides a URL in order to access the web server. Using the web server URL, it will be easy to communicate with the web server by sending HTTP requests and receive the response from them. Requests library can bring the functionalities in order to communicate with the web server and communicate with the cloud[37]. For example, the script will send a request to cloud web server by HTTP GET request in addition to the Vehicle VIN number, web server will receive the request, extract the VIN number from the cloud, connect to SQL database instance, get a query from all of the commands which are supposed to be send to vehicle, create an XML object from it by using lxml library and return the XML data back to the Raspberry Pi.
The following code snipped in figure 22 illustrates how the Requests library can help sending and receiving the HTTP requests and responses.
Figure 22 HTTP Requests to get command using python request library
The above code snippet is used for sending a GET request to the URL provided by Google App Engine with vehicle VIN value and the response is received in text format.
The other value which should be received from a different module on Raspberry Pi is the geographical location of the vehicle. For this purpose, GPS/GLONASS U-Blox 7 is
import requests r = requests.get('https://obdstorage.appspot.com/Command?VIN='+ VIN) ResponseValue = r.text

53
used, which can receive all of the geographical locations of the vehicle and flow in the data continuously through the serial port by being connected to the USB port of the Raspberry Pi[38]. However, the GPS module will follow all of the data continuously, therefore, it is necessary to separate this process of listening to GPS information from the main application using Threading.
Threading library provides the higher level of threads separate from the lower thread of the application which is running the code [39]. By using the threading, there will be a separate thread which is continuously receiving the satellite information of the GPS dongle, and by using the GPS library of python, the information which is received from the GPS USB module will be extracted into different fields. When it is needed to read the latitude and longitude of the location, the variable can be accessed from the thread and saved into data objects [38].
4.2 Data Management
Next phase of the project is the data management. The data which are received from vehicle known as diagnosis data, supposed to be stored in a cloud database in order to be accessible everywhere and from any external tools. 4.2.1 Google Cloud Platform
Google cloud platform is basically following the same infrastructure as the google search engine which can deliver the search result among millions of data to the user in less than a second [27].
Google cloud platform is based on pay per user, and open registration it gives away free 300 Euro credit to be used for the testing and trial period of one year which can be enough and useful for the whole project implementation [27].
On the other hand, Google Cloud platform provides two options which are very useful within this project:
- MySQL database instance - Google App Engine
MySQL database instance within Google cloud platform is the best option available for the development of the database in order to store the diagnosis data which are received from the vehicle by providing the full database options such as Tables, Views and etc.
However, in order to provide the connection between the Google database instance and external applications such as the Raspberry Pi, there should be a web server which can run within a runtime environment and is available always. The web server

54
should be able to receive the data from Raspberry Pi, process them and save them into the database instance.
Google App Engine is where it provides a runtime environment which is capable of handling the application in Python, Go or PHP [29]. However, as it is recommended in [29] the python is the most mature one with lots of resources for better understanding of the tool. However, any web server which is programmed within the above-mentioned programming languages can be deployed to Google App Engine which hosts the web server. On the other hand, Google App engine is able to provide the connection to the cloud database instances [29]. 4.2.2 MySQL Database
The database is playing an important role in this project. Therefore, its type, design, and implementation should wisely be chosen in order to avoid any problem in future as after the storing the data in the database, migration to another database might have many obstacles. Therefore, it is necessary to have a solid and complex database which is capable of fulfilling our requirement.
MySQL is a relational database server which is similar to other competing product that makes it easier for the understanding and working with [40]. However, MySQL is having advantages in comparison to other databases as well which as the main feature of this database following point can be highlighted [40]:
Flexibility: In fact, MySQL database is a very flexible and being supported by most of the operating system[40]. Which means it does not matter what operating system is being used, most probably MySQL database will be supported for that operating system[40]. Some of the operating system which can be highlighted that support MySQL database is: Linux, Mac OS, Microsoft Windows, IBM AIX, HP-UX, DEC OSF and etc. [40].
Power: Since the beginning of the development of this database, the main focus of developers was the performance of this database in addition to the reduction of the cost [40]. Therefore, MySQL could be up to date in terms of performance by providing a powerful database for the users [40].
Full-Text Indexing and Searching: In MySQL version 3.23.23 a new feature has been added which was full-text indexing and searching, which could highly increase the power of this database in terms of performance by mining data from text-based columns with a type of VARCHAR, TINYTEXT, MEDIUM TEXT and LONGTEXT [40].
Query Caching: Query caching is one of the greatest features of MySQL database which allows the database to store the SELECT statement into its cache memory

55
together with the result of the statement [40]. When a subsequent query is executed, it compares it with the statement which is stored in the cache and if they are same, it loads the statement from the cache memory which makes the process faster and cheaper[40].
Security: In fact, MySQL database itself provides several configuration and procedure to make sure your data are safe and they are configurable based on the user demands [40].
Due to the great flexibility that MySQL is providing, it is not needed to worry about the support of this database on the local machine or cloud environment as the google cloud also officially support this database [28].
However, it is very important, to install this database in order to design and implement the database on the local machine before the deployment into the Google cloud server. In order to create the database on the Google cloud, the first step is to create a Google Cloud SQL service on the Google cloud platform, firstly it is necessary to create Cloud SQL instance using the platform [28].
The following figure 23 is a snapshot in figure 23 of the Google Cloud Platform which illustrates the Google Cloud MySQL instance creation. The first step is to provide instance ID and Root Password for the administration purposes[41].
Figure 23 Google Cloud SQL instance Creation[41]

56
When the instance is created, from the Google cloud platform itself, a static IP will be assigned to this instance which can be used for the communication purpose it by an external application. However, within the Google cloud SQL configuration, external applications should be authorized first by their IPv4 Address. The following picture illustrates how the authorization takes place within the Google Cloud SQL configuration[41].
Figure 24 shows the configuration section of the Google SQL environment to authorize an external application IPv4.
Figure 24 Google Cloud SQL instance Authorization[41]
In order to design and implement the MySQL database, it is necessary to have an IDE which we can implement the database within. For this purpose, GUI Tool which name is MySQL Workbench will be used. MySQL Workbench is a visualized tool that specifically designated for MySQL Database that can handle data modeling and database design needs[42].

57
However, the MySQL Workbench GUI should be executed using a local machine. But by authorizing the IPv4 address of the local machine into the cloud SQL instance configuration, the MySQL Workbench which is running on the local machine can communicate to the Cloud MySQL database instance which is running on the cloud and we can start modeling and designing of the database.
The database design is an important section of this project as all of the diagnosis data of the vehicle is going to be store within this data storage center. On the other hand, there will be a website application which is going to represent this data and allow the user to configure the vehicle or commands assigned to that vehicle. Therefore, the implementation of the database should cover all the scenarios.
The database design contains 5 tables which are responsible to holds all of the data. There is a direct and indirect connection between the tables within this database. However, the start point of the database is the USER table which contains user information, this table is mostly being used by Web application which user can do the registration and then register vehicle and assign the commands.
USER table: Therefore, firstly it is necessary to have a table which contains the information for the user including the username and password. Within this database the name of the table user is OBD_USER. Each user will be assigned to have a specific Primary Key which will be used in other tables as the foreign key in order to keep track of persons who are registering the vehicles and commands. Within the following figure 25, all of the data which are being stored in OBD_USER table is shown.
Figure 25 OBD_USER table information

58
Vehicle Table: The next table is the vehicle table OBD_VEHICLE. This table contains the information about the vehicle itself, such as vehicle VIN which is the unique registration number of the vehicle, registered by which is being used as the foreign key and map to the primary key of OBD_USER table. Besides that information, the vehicle manufacturer, model, year of the vehicle is being stored as well. However, this table is not only being used in the web application but also in the Raspberry Pi. When the Raspberry Pi starts up, it read the vehicle VIN from the OBD port, and send it to the web server to get all of the commands assigned to this vehicle. Therefore, the vehicle VIN should be matched with the one which is registered in this system. Also, the Raspberry Pi will execute the commands within an interval of seconds. For this purpose, there is a specific column named VHL_INTERVAL_SEC which is in integer format and the interval which the execution of commands should be repeated will be defined. Figure 26 will show all of the data which are being used within this table.
Figure 26 OBD_VEHICLE table information
Command Table: The next table which is holding the information for both Raspberry Pi and the web application is the Command table with the name OBD_COMMANDS. This table contains the message request commands which are supposed to be sent to vehicle OBD port from the raspberry pi. So, when the Raspberry Pi is started, it sends the vehicle VIN from the car to the web server and it reads the commands assigned to that vehicle from the Command table and send it back to the Raspberry Pi. The commands also have the response unit which is the unit of calculation when assigned to that particular commands. Also, in order to provide the connection between the command table and vehicle table and assigned the commands to the vehicle, there is a column named CMD_VEHICLE_ID which is the foreign key in this table based on the primary key in vehicle table.

59
Within figure 27, the information which is being held in this table is represented in addition to the columns and their type.
Figure 27 OBD_COMMANDS table information
Messages Table: In order to store the information which is received from the vehicle two tables are being used: OBD_MESSAGE and OBD_MESSAGE_DETAIL. OBD_MESSAGE is being used as the parent table for the messages, each cycle of message execution in Raspberry Pi is known as one Message which contains MSG_ID as the primary key, MSG_CREATION_DATETIME which is a date time that the message cycle has been executed, MSG_RECIEVED_DATETIME which is the date time actually the server received the data, MSG_LATITUDE and MSG_LONGITUDE which are float number and represent the geographic location of the vehicle when the messages are executed. Within OBD_MESSAGE_DETAIL, the actual response from each of the commands on the vehicle will be stored, it means the data which are read from the vehicle after sending the message requests to OBD will be stored in this table. Therefore, this table contains the COMMAND_ID as the foreign key which is mapped to the primary key of OBD_COMMAND table and its response, in addition to the MESSAGE_ID which is foreign key and mapped to the primary key of the OBD_MESSAGE table.
Figure 28 illustrates the relation and the information about this two table and how they are connected to each other. Each row in the OBD_MESSAGE table can have a connection to multiple OBD_MESSAGE_DETAIL rows. In OBD_MESSAGE the time that message is created in Raspberry Pi and also the location that the data are received from the vehicle will be stored. The response to each of the commands that have been specified in the OBD_COMMAND table is stored in an OBD_MESSAGE_DETAIL table which can have the mapping by using the primary key of the OBD_COMMAND table as the foreign key in the OBD_MESSAGE_DETAIL table.

60
Figure 28 OBD_MESSAGE and OBD_MESSAGE_DETAILS Tables information
However, the database design is not limited only to table. In fact, the data can be read from the table, but this is not a good practice, however, when reading the data for example for the commands which are supposed to be executed by Raspberry Pi, it is necessary to get a query from OBD_VEHICLE and OBD_COMMAND table, in order to avoid having two queries on two different tables by mapping the primary key and foreign keys which make the queries complicated, VIEW can be used. VIEWS are used for viewing the data only by combining different tables together based on their primary key and foreign key relations.
VEHICLE_COMMAND_VIEW: This view is being implemented in order to have read access to two tables: OBD_VEHICLE and OBD_COMMAND. As it has been explained earlier, the user needs to first register the vehicle in OBD_VEHICLE and then assigned commands by writing them in OBD_COMMAND. Therefore, the OBD_COMMAND hold the information of the primary key of the OBD_VEHICLE table and assign them to OBD_COMMAND table. This view, do the mapping automatically when it has been

61
implemented and show all of the commands in addition to the vehicle they are assigned to. Therefore, when the Raspberry Pi send a request to receive the vehicle command, the web server will get a query from this view and send the result back from this view. It will help to accelerate the process of receiving the data from the database by using the view as it always presents the data which is needed by the user and as it has the read-only accessibility it will be safe to use this in order to read the data only.
Each of the commands which are stored in the OBD_COMMANDS table can be assigned only to one vehicle in OBD_VEHICLE, figure 29 illustrated how this two table is a link to each other and their relations in order to have the view from them.
Figure 29 VEHICLE_COMMAND_VIEW relation and tables
COMMAND_MESSAGE_VIEW: This view contains several tables and the structure is more complex than the VEHICLE_COMMAND_VIEW. Basically, this view is intended to show the messages which are received from the Raspberry Pi that collect the data from the vehicle. This view is combining four tables together which are: OBD_MESSAGE, OBD_MESSAGE_DETAILS, OBD_COMMAND, and OBD_VEHICLE. It combines all of the commands and their associated vehicles, then adds them to their respective values which are received from the car. All of the combination procedure is done based on the Primary keys and foreign keys in a table.
Therefore, it is necessary to well designed to table in advance in order to take the advantages of using the views. The figure 30, illustrates how the connection between tables is working in order to provide this view.

62
Figure 30 COMMAND_MESSAGE_VIEW Information
However, all of the above tables and views should work alongside each other in order to manage the diagnosis data in a useful manner.
Figure 31 illustrates the whole database design and their respective connections. It includes the tables, views and their relations to each other including their primary key (shown with a KEY sign in yellow color) and foreign key (shown with yellow rhombus).

63
Figure 31 Database Schema Design
All the design and implementation of the above-mentioned database schema is done using the MySQL Workbench GUI tool which communicates to the Cloud MySQL database within the Google Cloud platform. However, the Google Cloud MySQL database instance should authorize the IPv4 Address of the local machine which is
64
running the MySQL workbench. Therefore, every time the IPv4 address should be authorized after every change happens to this address.
Due to changes of the IPv4 address after every reconnection to the internet, the database is designed and tested on the local machine and after testing the desired results and functionality, it has been deployed to Cloud SQL database instance in order to avoid multiple times of authorization. 4.2.3 Web Server
As it has been mentioned earlier, in order to communicate with the Cloud SQL database within the Google Platform it is necessary to authorize the access of the external application by their IPv4 address. As this database will be used by multiple Raspberry Pi or the web application, there is no static IPv4 address to be authorized within the Google Cloud SQL, therefore an alternative solution should be used.
Google Cloud Platform offers another service named Google Cloud App Engine[29], which can host the web application within the runtime environment. On the other hand, as this service is within the Google Cloud platform itself, this service can be authorized to have direct access to the Google Cloud SQL database instances [29].
Google Cloud app engine can host the web applications developed in Python, Java, PHP and Go in addition to website development files such as HTML, CSS, and JavaScript [43].
Among the above programming languages, the Python is being chosen to develop the web server application for this project. The responsibility of this web server is to receive the HTTP request from an external application, process the request and return the response. Therefore, Python by having several open source libraries such as Flask is the best choice for this purpose [44]. Using this library python script can handle every request which is received by the host and processes them.
On the other hand, as the web server is running on the Google App Engine and needs to communicate with the MySQL database which is located in Google Cloud SQL service, the MySQLDB library can be used in order to perform the necessary SQL queries on the database as well.
However, the libraries which should be used within this Python web server is not only limited to the flask and MySQLDB but also:
- OS: in order to read the variable data from operating system - Time: for the time management functionalities within the app - Date time: for the conversion purpose in different systems

65
The great support of the Google Cloud app engine will help in order to initialize and use this library without installation as they are predefined within the system.
However, there is configuration needed for the Google Cloud App engine in order to process the HTTP request and assign them to the relevant function within the web server file.
In order to configure the whole web server, there should be a file named app.yaml to be located in the web server folder. This file should contain the information about the runtime environment, versions of the app, threading, static files locations, libraries and environment variables[29].
Figure 32 is a sample file of the app.yaml which has been used for this project is as follows:
Figure 32 App.yaml configuration for Google App Engine
When a folder which contains the files to be run within the Google App Engine is deployed, the service will provide a URL by default in order to access the files on the server. Therefore, it will be easy to send HTTP request to the server and receive the response. When the request is being sent to the Google App Engine URL, it processes
runtime: python27 api_version: 1 threadsafe: yes handlers: - url: / script: main.app - url: /HomePage script: main.app - url: /static/css static_dir: static/css mime_type: "text/css" libraries: - name: MySQLdb version: "latest" - name: lxml version: "latest" - name: flask version: "latest" # [START env_variables] env_variables: CLOUDSQL_CONNECTION_NAME: XXXXX CLOUDSQL_USER: XXX CLOUDSQL_PASSWORD: XXXX # [END env_variables]

66
the request by assigning it to the file based on the configuration in app.yaml, then the request will be sent to the file which is configured based on the app.yaml, the function will be called which either get the query from database using the MySQLDB library or simply load a static file such as HTML file.
Flask library within the python can handle the HTTP request and it has specific folder instruction in order to access the static files such as HTML, CSS or JavaScript. Therefore, this library is implemented to meet all the requirement needed for this project.
For example, the Raspberry Pi, will send the HTTP GET request to this server with the vehicle VIN, then the server will process the request by assigning it to the function within the main.py which is the web server, the web server will send a select query to the Cloud SQL database, receive the result convert them to the XML and return the XML file into the Raspberry Pi. When the raspberry pi receives the XML as the return value of its GET request, it reads all of the messages which it is supposed to send to OBD port, it sends them one by one and receive the response, it creates the XML data object based on the request messages and responses, then it sends a POST request to the server including the XML data, the server receives the XML data and process them, store them into the database.
The following figure 33 represents how the Python and Flask library can handle the above example GET request for receiving the vehicle VIN and return the XML Commands to the Raspberry Pi.
Figure 33 Retrieve Vehicle Commands to Raspberry Pi from server
In fact, the Flask library is being used in order to handle the web request and responses. The great advantage of the web request and response is the easy transferring of the data among different application. However, data which are being received and send to and from the web server should have a specific schema in order to be readable by external application and follow the same format.
#This route is return all the commands associated with the vehicle VIN which is sent with the GET request @app.route('/GetCommandsOBD',methods = ['GET']) def GetCommands(): if request.method == 'GET': CAR_VIN = request.args.get('VIN') value = RetrieveCommands(CAR_VIN) xmlstr = ET.tostring(value, pretty_print=True) return Response(xmlstr, content_type='text/xml; charset=utf-8')

67
In order to have a unique and specific data schema which is readable and easy to understand, and also the different application is able to process this data, XML data format have been chosen. Using the XML data schema, complex and complicated database situation can be managed.
Therefore, all of the data transfer protocols which are occurring within the web server is based on the XML format which is readable by the python script in Raspberry Pi or JavaScript in a web application.
However, there are some sensitive data which should be stored in the vehicle using Encryption and be read using decryption method. Google Cloud platform is storing the data on their server using their own encryption method. However, in order provide extra security and safety into the data, it is necessary to store some of the data as well.
In fact, the web server which is running the python source code in a real-time can support several libraries in order to handle the encryption and decryption. However, this encryption should be supported by Google App Engine as well, as it will be the system which is going to run the web server in the runtime environment. Based on the Google App Engine [45] it supports the PyCrypto library which is a powerful library for the encryption and decryption purpose of data[45].
PyCrypto stands for Python Cryptography Toolkit which is the collection of functions and libraries in order to provide the encryption algorithms and hashing functions [46]. In fact, this library provides all the necessary functionalities for the developer for the encryption and decryption purpose[46].
The figure 34, illustrate how the encryption and decryption are taking place within this project and within the web server which is running in the runtime environment of Google App Engine. 1
1 Secret_Key variable is being used as the key of encryption, the value in figure is a dummy value and is not being used in real version of the webserver. A secure secret key is being used.

68
Figure 34 Encryption and Decryption using PyCrypto library
The web server which has been explained should be deployed into the Google App Engine, in order to do the automatic deployment, firstly it is necessary to install Google-Cloud-SDK which install the necessary software on the local machine. Then it needed to move to the directory which is holding the codes and app.yaml file, and simply type the following command:
>gcloud app deploy
This command will deploy all the folders into the Google App Engine, and start the application as the new version of the application which is running in Google App Engine environment. Then by default, it provides a URL for the service in order to provide the accessibility to the files of this runtime environment.
4.3 Data Visualization
This project consists of three sections: data aggregation, data management, and data visualization. The last part of this project mainly focusses on the data visualization which is the development of a website in order to visualize the data.
However, this website is not only responsible to visualize the data, but also to let the user manage the configuration of vehicles and command. As it has been mentioned in Data aggregation section, when the Raspberry Pi in vehicle starts up, it read the vehicle VIN and send it via a GET request to the web server which is located in Google App Engine. Then the server gets a query from the database for the commands which are assigned to the vehicle with that VIN value. Therefore, within the website, there should be the ability for the user to do the registration of themselves, registration of the vehicle and assign the commands to the vehicle.
The website can be developed using the HTML, CSS, and JavaScript which are the essential development languages in order to develop a website. These three languages are designed to provide interactive web pages for the user in order to show the data.
HTML which stands for Hypertext Markup Language is programming language which is used for converting the ordinary text into the active text in order to display information
def EncryptString(InputText): msg_text = InputText.rjust(32) secret_key = 'SECRET KEY' # The key to encrypt based on cipher = AES.new(secret_key,AES.MODE_ECB) # Encryption object encoded = base64.b64encode(cipher.encrypt(msg_text)) #64 Byte based encoding return encoded def DecryptString(InputEncryptedString): secret_key = 'SECRET KEY' cipher = AES.new(secret_key,AES.MODE_ECB) decoded = cipher.decrypt(base64.b64decode(InputEncryptedString))#Decoding return decoded.strip()
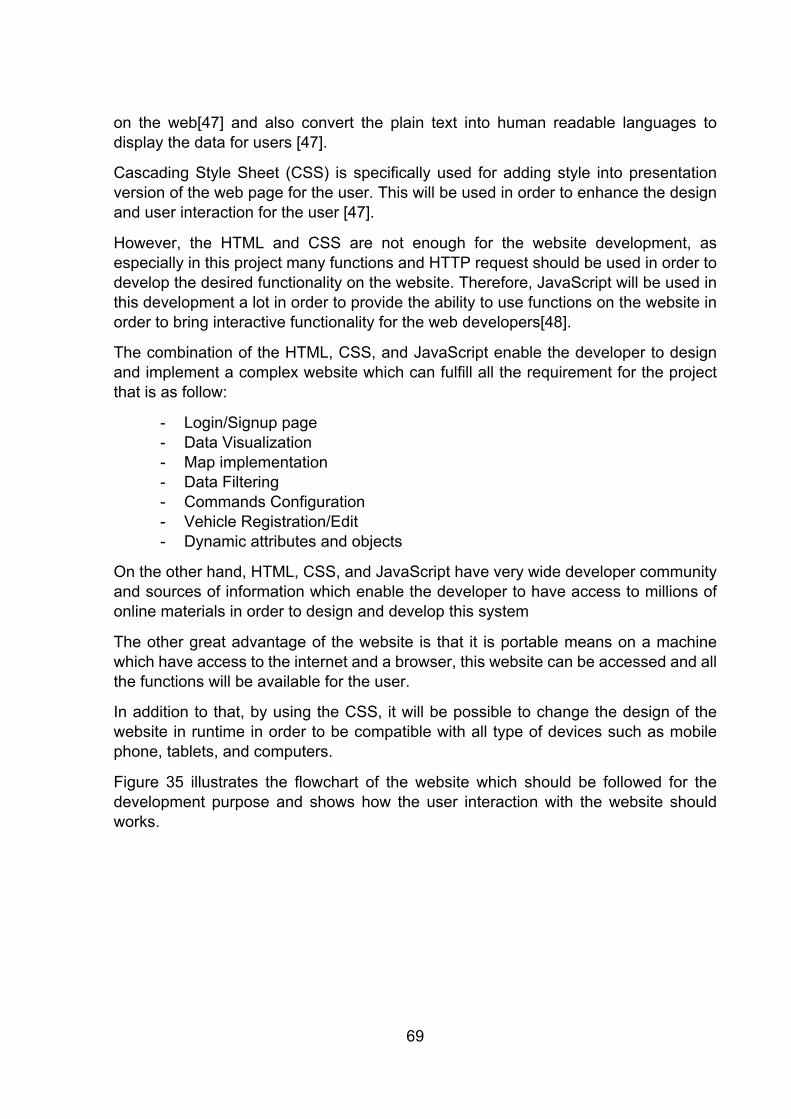
69
on the web[47] and also convert the plain text into human readable languages to display the data for users [47].
Cascading Style Sheet (CSS) is specifically used for adding style into presentation version of the web page for the user. This will be used in order to enhance the design and user interaction for the user [47].
However, the HTML and CSS are not enough for the website development, as especially in this project many functions and HTTP request should be used in order to develop the desired functionality on the website. Therefore, JavaScript will be used in this development a lot in order to provide the ability to use functions on the website in order to bring interactive functionality for the web developers[48].
The combination of the HTML, CSS, and JavaScript enable the developer to design and implement a complex website which can fulfill all the requirement for the project that is as follow:
- Login/Signup page - Data Visualization - Map implementation - Data Filtering - Commands Configuration - Vehicle Registration/Edit - Dynamic attributes and objects
On the other hand, HTML, CSS, and JavaScript have very wide developer community and sources of information which enable the developer to have access to millions of online materials in order to design and develop this system
The other great advantage of the website is that it is portable means on a machine which have access to the internet and a browser, this website can be accessed and all the functions will be available for the user.
In addition to that, by using the CSS, it will be possible to change the design of the website in runtime in order to be compatible with all type of devices such as mobile phone, tablets, and computers.
Figure 35 illustrates the flowchart of the website which should be followed for the development purpose and shows how the user interaction with the website should works.
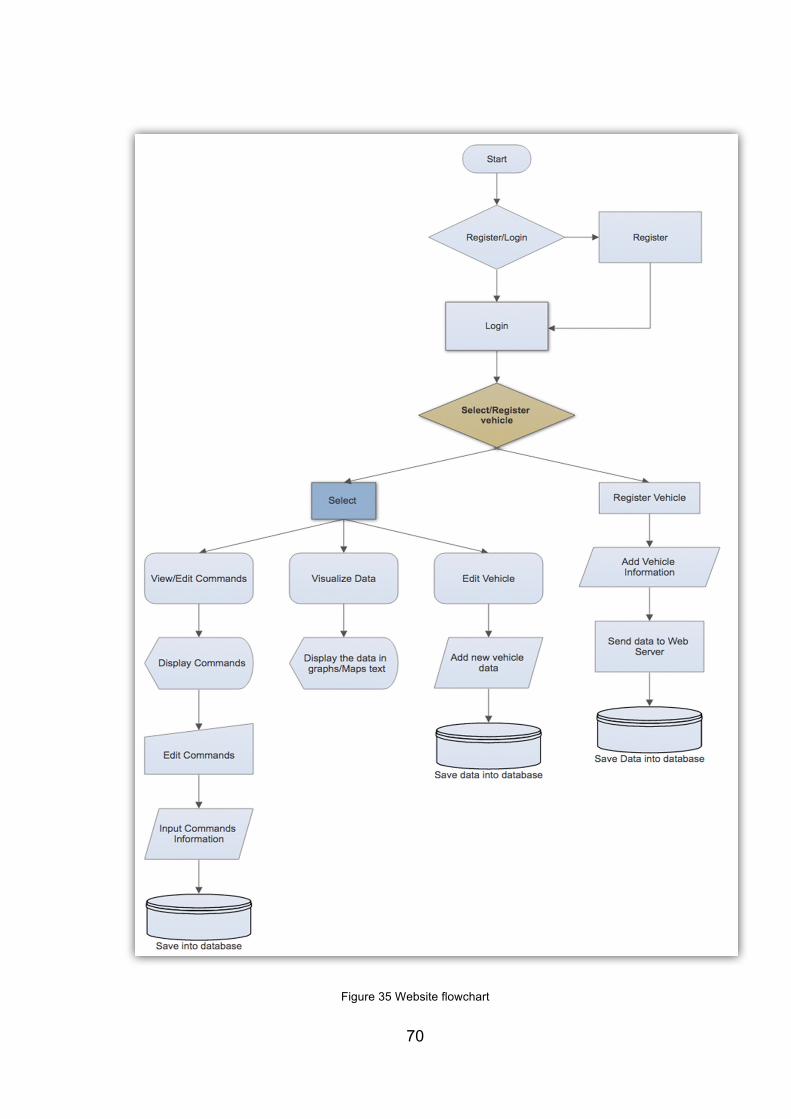
70
Figure 35 Website flowchart

71
The first page which appears to the user is the log/registration page which the user can do the registration or login. In order to do the registration, it is necessary to provide an email address which is not registered in the system yet with a password. Or if the user is already registered then the login is possible. The password which user provides will be stored in the database using the encryption methods which is implemented on the web server.
The figures 36 and 37 illustrates the login and registration page which user can do the registration or login into the system.
Figure 36 Registration page
Figure 37 Login page

72
When the user press signup or login page, then the JavaScript function will be called upon the triggers of the event which are assigned to the buttons of the page. Then the function will send an Ajax request to the web server which is within the same domain. The web server will receive the request from the web, if it is the registration, it checks whether the email address exists or not, if it does not exist, then it will save the data into the database. If it is the login, it checks for the match of the Email address and password which is provided for the user and if it is accurate it shows the Homepage for the user.
The homepage of this website is the main page which the data will be visualized to the user with all the cars the user registered. In fact, within the main page, the user is able to register the vehicle and provide the information for each vehicle. Also, the user will be able to see all of the vehicles which have been registered to that user account.
Figure 38 shows how the Homepage looks like. At the left sidebar, all of the registered vehicle under that user will be shown, each vehicle is shown with the name and the VIN value that user provided.
Figure 38 Homepage
Each vehicle which is registered in the system under that username will be shown on the left side, the user can navigate to three different section for each vehicle as Show data, Commands or edit vehicle.
figure 39 shows three options which are available for each vehicle on the Homepage.

73
Figure 39 Vehicle Selection Menu
By pressing the Show Data menu item, all of the Diagnosis data which are received for the selected vehicle will be shown to the user. This data includes a graphical Google Map with markers that data are received which have the date time under each of the marker and the graphs of the data that are received from the vehicle.
The figure 40 shows how the data visualization shown on this website.
Figure 40 Data Visualization

74
Within the visualization of the data, on top of the page, there is an option available for the user to filter the data based on date and time. In fact, the user can select the data to receive for a specific portion of the time.
In order to update the data, the user can change the From and To date and time section in Filter data section of the page and press update. Once the update button is pressed, the JQuery function which is assigned to this event will be triggered from the JavaScript codes of the website, it sends the date and times parameters to the web server, the web server then returns the data which are within the specified date and time provided by the user.
Figure 41 is showing exactly how is the Filter Section of the website is placed in the Data Visualization section of the web page.
Figure 41 Data filtering section
As it has been discussed earlier, in this project the geographical location of the Raspberry Pi which is located in the vehicle is being sent to the database as well. It means each set of messages which is being received from the vehicle is having the geographical location of the vehicle as well. Each of this geographical point is shown with a marker in a map.
The map is the library provided by Google that has been integrated into to this page [49]. The Google Map API is a limited API provided by the Google to simply integrate the map functions and features into the website[49]. The limitation of this tools is about 2500 request per day which is much more than enough for this project[49].
The data which are received from the vehicle for the geographical location of the car includes longitude and altitude which are two necessary values in order to obtain the geographical location [49]. By defining these two values and adding those as the key point to the Maps implemented in a web page, the Google Map API automatically make a marker at a specific point.
Underneath of each point in this map is a Date Time which represents the time that data are being received. On the other hand, there is a JavaScript function on ‘MouseOver’ event of each point. When the user hovers the mouse on top of any of this marker, all of the data which are received from the vehicle will be shown in a box on top of the marker.
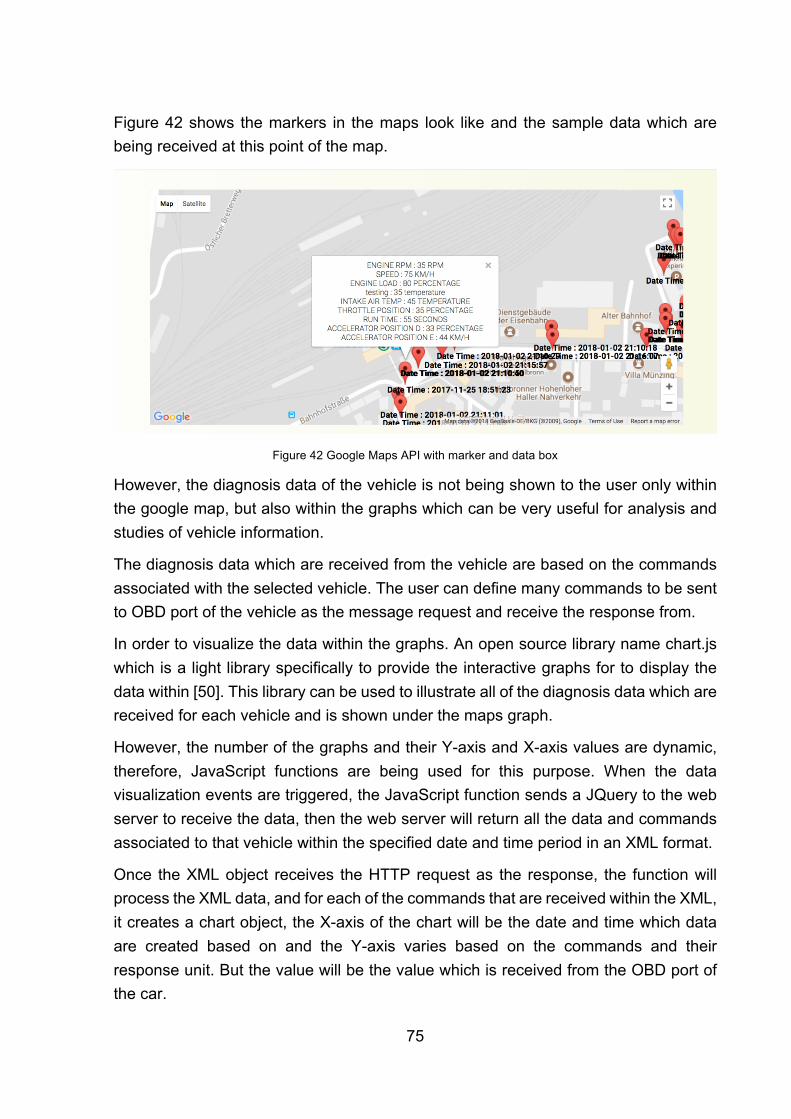
75
Figure 42 shows the markers in the maps look like and the sample data which are being received at this point of the map.
Figure 42 Google Maps API with marker and data box
However, the diagnosis data of the vehicle is not being shown to the user only within the google map, but also within the graphs which can be very useful for analysis and studies of vehicle information.
The diagnosis data which are received from the vehicle are based on the commands associated with the selected vehicle. The user can define many commands to be sent to OBD port of the vehicle as the message request and receive the response from.
In order to visualize the data within the graphs. An open source library name chart.js which is a light library specifically to provide the interactive graphs for to display the data within [50]. This library can be used to illustrate all of the diagnosis data which are received for each vehicle and is shown under the maps graph.
However, the number of the graphs and their Y-axis and X-axis values are dynamic, therefore, JavaScript functions are being used for this purpose. When the data visualization events are triggered, the JavaScript function sends a JQuery to the web server to receive the data, then the web server will return all the data and commands associated to that vehicle within the specified date and time period in an XML format.
Once the XML object receives the HTTP request as the response, the function will process the XML data, and for each of the commands that are received within the XML, it creates a chart object, the X-axis of the chart will be the date and time which data are created based on and the Y-axis varies based on the commands and their response unit. But the value will be the value which is received from the OBD port of the car.

76
The following figure 43 is an example of the charts which is created and shown in the data visualization section. This graph is for the Engine RPM of the vehicle and it shows how the X-axis and Y-axis in this graph look like with the value of them.
Figure 43 Engine RPM graph
The next phase of the website development is to provide the option for the user to see all of the commands which are supposed to be sent to the vehicle as the message request. Also, as the Raspberry Pi is going to receive all these commands from the database, process the commands and return the results, the user should be able to add or edit these commands from the website as well.
Therefore, in order to maximize the usability of the website, there is commands section for the user for this purpose. Within the commands section, the list of all the commands which are assigned to the vehicle will be shown, each of the commands has a description and a response unit.
The description of the commands will be used only for the explanation and understanding purpose. But based on the OBD standard, each of the data which are going through the vehicle has a different method of the calculation, the calculation method can be realized based on the response unit. The user can select the response unit of the command the Raspberry Pi will receive this command and do the calculation based on that command.
In figure 44 the page which visualizes all the commands within the vehicle with the functionality of editing them or add a new command into the system is shown.

77
Figure 44 Commands Visualization
Each vehicle in this system has its own commands section and all of these commands will be shown in this page. If the user press on EDIT button on a row of Commands table, another page will be shown with the data of the rows which the user pressed on. On the other hand, from the EDIT section, user can simply delete the command, however deletion a command does not mean the command being deleted, but there is a column in a database name ACTIVE, when a command is being deleted, the value of that command become ‘N’ which means the command is deactivated, it won’t be shown to the user neither will be executed in OBD port. The reason for this is that this command is associated with previous diagnosis data and deletion of the command should accompany with deletion of diagnosis data which result in data loss and should be avoided.
Figure 45 illustrates the commands edit section of the webpage which user can edit the command or delete it.
Figure 45 Command Edit Section

78
However, besides editing the command, the user also is able to add a new command, when adding the new command the same page will be loaded to the user with minor changes such as it does not have any idea or delete button. However, in both pages when the user clicks on the save button, it triggers the JQuery function to send the data to the web server via POST HTTP request, when the web server receives this command, it process it, if it is an update, it will update the data in the database and if it is creation of new command, it will insert a new command into the database.
The next feature which this website provides for the user that an essential function is to enable the user to add or edit the vehicle list. In fact, the Raspberry Pi data from the cloud is received based on the VIN value of the vehicle. Therefore, this VIN value should exist in the database and also there should be commands associated with this vehicle.
For this purpose, a specific section is designed for the vehicle to add/edit or delete the vehicle. It contains three parts:
- Vehicle Manufacturer: Which is basically the name of the manufacture of the vehicle
- Vehicle VIN: which is important value and should be unique - Interval: Which indicates how often the execution of the commands on this
vehicle should be performed in seconds format.
This following figure 46 represents the vehicle edit form which is same as minor changes in comparison to adding form.
Figure 46 Vehicle Data Edit/Add form

79
4.4 Summary
Within this chapter, the implementation of the solution in order to fulfill the requirement of this project has been explained. In fact, the main reason of this project was to develop a system which can manage the diagnosis data of the vehicle in order to provide a user-friendly environment for the user to read the diagnosis data anytime and from any place.
The implementation started with data aggregation section which basically was the development of a program on a Raspberry Pi which is able to communicate with OBD port of the vehicle and the cloud database. For the communication with the OBD port, ELM 327 Circuit and USB interface have been used which is able to establish a serial connection to the OBD port. For the communication with the OBD port through a serial port, a program in Python language has been developed which establish a connection with the OBD port of the vehicle using serial communication. On the other hand, in order to obtain the geographical location of the car, GPS/GLONASS USB port has been used which received the geographical location of the car. However, the data which are supposed to be received from OBD port of the vehicle are defined in a cloud database. In order to receive these data from the cloud database, GSM USB port has been used which is equipped with a sim card that has internet access, thus the Raspberry Pi can communicate to the cloud using the HTTP Request.
The next step for this project is design and development of a storage center in order to manage the diagnosis data which are received from vehicle in a cloud database that is accessible by everyone and from everywhere. For this purpose, Google Cloud Platform has been chosen which offers the Cloud Database SQL instance with the support of MySQL database and also Google App Engine with the runtime environment. The design and implementation of the MySQL database have been explained in details in this chapter.
In order to communicate with the Cloud MySQL database, the external application IPv4 should be authorized in the configuration. MySQL Workbench GUI tool has been chosen for the design and implementation of the database. However, for the communication purpose of the Raspberry Pi, as it has dynamic IPv4 address, a web server which is running in Google App Engine Runtime environment is developed. This web server has been developed using Python language which is supported by Google App Engine environment. In order to handle the HTTP Request and Response in this web server environment, Python Flask Library is used. The Google App Engine runtime environment can be authorized to have direct access to the Cloud Database

80
SQL always. Therefore this environment has been chosen for the communication with the cloud database and the Raspberry Pi.
The last step of this project was to visualize the data for the user. For this purpose, as it is needed to have access to this system everywhere and anytime, a web application is the best choice. The web application can also be deployed into the Google App Engine environment as it is specifically designed for the application to be run in a runtime environment with the highest uptime availability. The front-end application has been developed using HTML, CSS, and JavaScript which brought the interactivity to the website and for the back end, the same web server which has been developed to communicate with Raspberry Pi is used.
The purpose of this web application is to enable the user to have access to the diagnosis data of the vehicle in addition to the geographical location of the vehicle in a period of time that is chosen. On the other hand, the user is able to modify the commands which are supposed to be executed in OBD port of the vehicle. Vehicle registration and edit are possible using the website as well.

81
5 Result The evaluation of this system has been performed by conducting experiences in the real-world environment. As it has been explained earlier, for this project real vehicle have been used in order to receive the diagnosis data from the vehicle and manage them in a cloud environment.
Actually, the diagnosis data which are received from the vehicle are based on the commands have been specified to the vehicle which is registered in the cloud system. Therefore, firstly the user need to register the vehicle and declare its VIN value in the system. Once the registration is done, the commands should be assigned to this vehicle. The registration of BMW Series 1 which is used in this experiment is done using the website with an interval of 30 seconds which stands for the commands execution cycle.
The following figure 47 shows the commands which are assigned to this vehicle, the following commands will be sent to vehicle OBD port in order to receive the diagnosis data of the car.
Figure 47 Commands Declaration for Testing Purpose
Each of these commands should be sent to the OBD port of the vehicle in every 30 seconds and the result should be sent back to the Cloud Database. Here there is a command with the description “testing” and the command as “not valid command”, this command is specifically added in order to check the behavior if the system is sending a message request which is not supported by the OBD port of the vehicle.
After all of the configurations is performed within the web application, it is time to start up the vehicle and connect the Raspberry Pi to the OBD port. The Raspberry Pi should
82
have a connection to the internet which by using the 4G wireless USB, the connection will be established, and ELM 327 should be connected in order to establish the connection with the vehicle OBD port and the GPS/GLONASS USB in order to receive the vehicle geographical location.
When the Raspberry Pi is started, it sends an HTTP GET request to the web server located by following the link: https://obdstorage-184422.appspot.com which is provided by the Google App Engine environment.
The request which is being sent to the cloud server is as follow:
https://obdstorage-184422.appspot.com//GetCommandsOBD?VIN=<VehicleVin> 2
As it has been explained earlier in Web Server section, the data transfer schema which is used in this project is based on XML format. The advantage of this schema is that it is capable of handling different scenarios. The web server is implemented to create a specific tag for each of the COMMAND specify in the command table of the database which is linked into the vehicle table.
The web server then loops through each of the commands in the database, create the XML node for each of the tags with the following information:
- COMMAND_ID: which indicate the primary key of the command in the database
- COMMAND: this is the command which is supposed to be sent to the OBD port of the vehicle
- Response: which is the response unit of the calculation for this system
When the commands node creation is finished, the whole XML object will be returned as the HTTP Response using the Python Flask library to the Raspberry Pi which sent the GET Request.
The following figure 48 illustrates the XML response has been received by the above mentioned GET Request that Raspberry Pi sent to the server. The commands which are here are created based on the user of the command specified and assigned to the vehicle that is registered.
2 Due to the privacy and data protection the real vehicle VIN is not given here.

83
Figure 48 XML Commands Response from Server to Raspberry Pi
When an XML data schema is returned from the server into the Raspberry Pi, the system starts to loop through each of the commands in the XML data and send them into the Raspberry Pi, each of the commands have a CMD_COMMAND_ID tag. When the response is received from the vehicle, a new node will be created with CMD_COMMAND_ID tag and the response of the vehicle.
On the other hand, the above XML data has a tag named “INTERVAL”, this tag declares what is the interval of the execution of the above commands. In this scenario, all of the commands in this XML will be executed every 30 seconds.

84
Figure 49 is a sample of XML data object which is created by the Raspberry Pi. This XML data object includes the ID of the command that was sent to the vehicle and the response which are received from the vehicle.
Figure 49 Response from Raspberry Pi to server
The above XML shows the data object which is created by the Raspberry Pi and ready to be sent to the cloud web server. For each of the commands that have been received from the server, there will be a responding node in the XML which include COMMAND_ID which is the primary key of the particular command in the database and the response from the OBD port. However, there is DATETIME node, which shows the date-time that the data are received from the OBD port, Latitude and Longitude are

85
received from the GPS USB module and represent the Geographical location of the vehicle.
On the other hand, when the above command executed several times within the vehicle, different values will be received for one command. Therefore, it will be very helpful and useful for the users to have graphs based on this data. As it has been explained in implementation section, Chart.js library has been used in this website in order to able the development process to achieve the dynamic creations of the graphs based on the commands.
The following graphs in figures 50, 51, 52, 53 represent the each of the above-mentioned commands within 07.02.2018 16:00 – 07.02.2018 20:00 time period.
Figure 50 Engine RPM Graph
Figure 51 Speed Graph

86
Figure 52 Engine Coolant Temperature
Figure 53 Engine Load
The following figure 54 illustrates the graphs for the command which has invalid command data. As it has been mentioned earlier, there was a command with the name Testing which was not valid and vehicle was not supported, that command has been used just in order to see the behavior of the whole system in case the command is not supported by the vehicle. As it is shown in the next figure when the data are not received for a command, the graph will be created but no data will be shown which means the graph is empty and the value in the database is ‘NO DATA’.

87
Figure 54 not supported command
The result of the test scenarios which have been applied to the system evaluated that the system is working as expected and it has met the requirement. The Raspberry Pi has been developed to execute the python program which connects to the internet using the 4G Wireless USB module, receive the commands from the cloud, establish the connection with OBD port of a vehicle, apply the commands to OBD port and sends the result to the cloud web server.
The database and web server are working directly together, in order to transmit the data to the external applications such as Raspberry Pi and Web applications. Also, the cloud MySQL database is working as expected by having the high availability rate and uptime with fast query solutions.
On the other hand, the web application is visualizing the data, in addition, to provide the functionality for the user to configure the vehicle, configure the commands and see the data anytime and anywhere.
88
6 Summary Vehicle diagnosis data have taken the attention of vehicle OEMs and automotive-related companies from the beginning of inventions in this industry. In fact, diagnosis data were always important for the automotive companies, in order to check the vehicle performance and behavior of it [2].
However, there were problems in accessing the data as each of the vehicle manufacture companies was using their own procedure of accessing to the diagnosis data of vehicle until the standard has been released into the market for the diagnosis of the vehicle and governments forced to companies to follow this standard [4].
Based on the standard which has been released, the access to the OBD port of the vehicle has been cleared for all the automotive associations. Based on the OBD II standard [4], in order to read the diagnosis data from the vehicle, message request and response protocol should be followed. It means the user should send a message request to the OBD port using the compatible communication channels and serial bus communication and read the response from the OBD port.
As access to the diagnosis data is in real time situation, it is necessary to store the data in a cloud database in order to have access to this data in future for studies and analysis.
The system which has been developed in this project have different aims. Firstly, the aim was to read the diagnosis data and store them into a cloud database to be accessible by everywhere and by any person. However, as it is already mentioned, the protocol of accessing to the diagnosis data is based on request message and response.
The request messages are stored in cloud database as a command. When the Raspberry Pi is started, it sends the vehicle VIN value to the cloud web server which is connected to MySQL database. Therefore, the Raspberry Pi is equipped with a 4G USB wireless module in order to have access to the internet all the times.
The web server reads the commands associated with the VIN value, and return all of the commands which are supposed to be sent to the vehicle OBD port as message request. Raspberry Pi send this command one by one to the OBD port and create an XML data object based on the commands and their corresponding OBD port respond over a cyclic period of time. On the other hand, the Raspberry Pi is equipped with a GPS USB module which can read the geographical location of the vehicle, that the altitude and longitude will be added to the XML.

89
When the XML object is created by Raspberry Pi, it sends all the XML data to the cloud web server, and then the web server read and process the XML data which are received and store them in a MySQL database instance. The data are being stored in different tables with different columns and attributed in order to have the maximum flexibility and accessibility to the data.
The communication with the MySQL database and external application such as Raspberry Pi is done via a web server which is running on Google App Engine that is authorized to communicate with the cloud MySQL database and has runtime environment to host the web applications.
In order to show these data that are stored in the database, a website has been developed which have many capabilities. The main feature of the website is that it can visualize the diagnosis data which are stored in the database by using the graphs. On the other hand, as there is a geographical location save in the database that represents the location of the vehicle, Google Map API and library is used to show the geographical location of the vehicle in addition to the data.
The website is not limited to the visualization of the data, but also provides the features that user will be able to register vehicles and assign commands that they want to be sent to the OBD port of the vehicle. The commands and the vehicle configuration can be done using this website as well.
The website is placed in Google App Engine in addition to the web server that is running in Google App Engine environment. By default, Google App Engine provides a URL for accessing and sending the HTTP request to it as well. The web server is running a Python Flask program as the back end in order to handle the HTTP request and also have direct communication with the cloud database.

90
7 Conclusion The diagnosis of the vehicle system can help the automotive OEMs, companies, and developers to monitor the vehicle performance and driving behavior of the car. In fact, diagnosis data provides valuable information for the maintenance and analysis of the car without accessing directly to the vehicle network and ECUs in the vehicle.
The system which has been purposed and developed in this project helps users to have access to the diagnosis data of the vehicle, anywhere and anytime. This system is a dynamic system which automatically retrieves the diagnosis data from the vehicle using the established connection to the OBD port of the vehicle and sends the data to a cloud database.
By using this system, the cloud database is perfectly handling the data storage which includes the vehicle data based on the demand of the users. As the system is including an interactive web application on cloud, the user can configure the type of the data which he/she intended to retrieve from the vehicle as well.
The intended data automatically read from the cloud database by the Raspberry Pi which is connected to the vehicle OBD port and it automatically requests for the value that the user intended to have the vehicle.
The data which are retrieved from the vehicle will be stored in the cloud database and user will be able to check the data using the graphs which are being dynamically created in the web application. On the other hand, as the data includes the geographical location of the vehicle as well, it shows the location of the vehicle within a map in the web application.
However, this system is not limited to one vehicle as well. Users are allowed to register as many vehicles as they would like to receive the data from. The vehicle which is registered in the system can have their own commands for the data retrieval. This process brings up independently approach to retrieving the diagnosis data for each vehicle separately.
In fact, this system can provide a great solution for data analysis of vehicle and performance of the system. Using the web application and graphs, the vehicle reaction and behavior in a different situation can be analyzed and checked.
On the other hand, this system is very useful for doing the test scenarios on the vehicle. As the system is fully dynamic, any other value parameter from the vehicle can be obtained using the Parameter ID. Therefore, when some modification or update occurs on an ECU or network of the car, all the relative diagnosis data can be configured to
91
be retrieved from the vehicle during the testing. It means the vehicle can be tested on roads, and in real time situation, the diagnosis data will be retrieved from the vehicle and they can be visualized for many users simultaneously.
As a conclusion, this system can be very useful for the users who are intended to know in details of vehicle performance in a different situation and as it is using the cloud database, the diagnosis data of the vehicle will be stored in a cloud environment for further analysis and evaluation of the vehicle.

92
Bibliography
[1] C. Sommer and F. Dressler, Vehicular networking. Cambridge, United Kingdom: Cambridge University Press, 2015.
[2] “Automotive Diagnostic Systems: History of OBD,” 06-Aug-2011. [Online]. Available: https://automotiveiq.wordpress.com/2011/06/08/automotive-diagnostic-systems-history-of-obd/. [Accessed: 29-Jan-2018].
[3] Vehicle Tracking Experts, “In-car electronics diagram.” [Online]. Available: https://www.vehicletrackingexperts.co.uk/telematics-merc-750/. [Accessed: 18-Jan-2018].
[4] California Air Resources Board, “On-Board Diagnostic II (OBD II) Systems - Fact Sheet,” Oct-2015. [Online]. Available: https://www.arb.ca.gov/msprog/obdprog/obdfaq.htm. [Accessed: 17-Jan-2018].
[5] “Surface vehicle standard: E/E diagnostic test modes.” [Online]. Available: https://law.resource.org/pub/us/cfr/ibr/005/sae.j1979.2002.pdf. [Accessed: 11-Sep-2017].
[6] N. Englisch, F. Hänchen, F. Ullmann, M. Alejandro, and Hardt, Application-Driven Evaluation of AUTOSAR Basic Software on Modern ECUs. 2015.
[7] O. Khan, N. Englisch, and G. für I. e. V. (GI) Hardt, Rapid Prototyping in AUTOSAR Based Systems. 2017.
[8] B. McLaughlin, The BeagleBone Black primer. Open WorldCat, 2016. [9] Ó. Alvear, C. T. Calafate, J.-C. Cano, and P. Manzoni, “VEWE: A Vehicle ECU
Wireless Emulation Tool Supporting OBD-II Communication and Geopositioning,” in Ad-hoc, Mobile, and Wireless Networks, 2014, pp. 432–445.
[10] R. Sharma, “In-Vehicular Communication Networking Protocol,” presented at the ASEE NCS, India, 2015.
[11] D. Paret and R. Riesco, Multiplexed networks for embedded systems: CAN, LIN, Flexray, Safe-by-Wire. Chichester: Wiley, 2007.
[12] J. Singh Gill, “On-Board Diagnostics (OBD-II) Port,” Clemson University, 26-Aug-2014.
[13] SAE, “E/E Diagnostic Test Modes.” [Online]. Available: http://standards.sae.org/j1979_201009/. [Accessed: 19-Jan-2018].
[14] “ISO 15765-2:2011(en), Road vehicles — Diagnostic communication over Controller Area Network (DoCAN) — Part 2: Transport protocol and network layer services.” [Online]. Available: https://www.iso.org/obp/ui/#iso:std:iso:15765:-2:ed-2:v1:en:tab:1. [Accessed: 25-Jan-2018].
[15] C. Smith, The car hacker’s handbook: a guide for the penetration tester. San Francisco: No Starch Press, 2016.

93
[16] R. Malekian, N. R. Moloisane, L. Nair, B. T. Maharaj, and U. A. K. Chude-Okonkwo, “Design and Implementation of a Wireless OBD II Fleet Management System,” IEEE Sens. J., vol. 17, no. 4, pp. 1154–1164, Feb. 2017.
[17] BlueDrive, “Bluetooth OBD Reader,” 2014. [Online]. Available: https://www.bluedriver.com/. [Accessed: 25-Jan-2018].
[18] T. Jia, W. Luo, H. Jia, H. Zhu, and X. Li, “Research on remote diagnosis system based on baidumap API and OBD II diagnosis technology,” 2016, pp. 1–3.
[19] Arduino, “What is Arduino?” [Online]. Available: https://www.arduino.cc/en/guide/introduction. [Accessed: 26-Jan-2018].
[20] Arduino, “ARDUINO UNO REV3.” [Online]. Available: https://store.arduino.cc/arduino-uno-rev3. [Accessed: 26-Jan-2018].
[21] M. Poole, TotalBoox, and TBX, Raspberry Pi for Secret Agents - Third Edition. Packt Publishing, 2016.
[22] T. Cox, Raspberry Pi for Python programmers cookbook: over 60 recipes that harness the power of the Raspberry Pi together with Python programming and create enthralling and captivating projects. 2016.
[23] ELM Electronics, “ELM 327 OBD to RS232 Interpreter.” ELM Electronic, 2016. [24] Amazon, “KuWFi LTE Surfstick.” [Online]. Available:
https://www.amazon.de/gp/product/B06XHYMYKJ/ref=od_aui_detailpages00?ie=UTF8&psc=1. [Accessed: 26-Jan-2018].
[25] J. Bond, The enterprise cloud: best practices for transforming legacy IT, First edition. Sebastopol, CA: O’Reilly Media, 2015.
[26] Dba transformations. New York, NY: Springer Science+Business Media, LLC, 2017.
[27] S. P. T. Krishnan, Building your next big thing with Google cloud platform: a guide for developers and enterprise architects. Berkeley, Calif.: Apress, 2015.
[28] S. P. T. Krishnan and J. L. U. Gonzalez, “Google Cloud SQL,” in Building Your Next Big Thing with Google Cloud Platform: A Guide for Developers and Enterprise Architects, S. P. T. Krishnan and J. L. U. Gonzalez, Eds. Berkeley, CA: Apress, 2015, pp. 159–183.
[29] M. S. Hijazee, Mastering Google App Engine: build robust and highly scalable web applications with Google App Engine. 2015.
[30] J. Creasey, Raspberry Pi essentials: get up and running with the Raspberry Pi to develop captivating projects. 2015.
[31] S. Kildal, “Autostart Python Script,” RASPBERRY PI: LAUNCH PYTHON SCRIPT ON STARTUP, 28-Apr-2014. [Online]. Available: http://www.instructables.com/id/Raspberry-Pi-Launch-Python-script-on-startup/. [Accessed: 15-Dec-2017].
[32] M. Venkitachalam, Python playground: geeky projects for the curious programmer. San Francisco: No Starch Press, 2016.

94
[33] Python Software Foundation, “Python Event Logging,” Logging facility for Python. [Online]. Available: https://docs.python.org/2/library/logging.html. [Accessed: 30-Jan-2018].
[34] C. Liechti, “PySerial Library,” PySerial, 2017. [Online]. Available: http://pyserial.readthedocs.io/en/latest/pyserial.html. [Accessed: 30-Jan-2018].
[35] C. Liechti, “PySerial API,” pySerial API. [Online]. Available: http://pyserial.readthedocs.io/en/latest/pyserial_api.html. [Accessed: 30-Jan-2018].
[36] S. Richter, “lxml library,” lxml - XML and HTML with Python, 11-Apr-2017. [Online]. Available: http://lxml.de/. [Accessed: 30-Jan-2018].
[37] PythonForBeginners, “Requests Library,” Using the Requests Library in Python, 02-Nov-2013. [Online]. Available: http://docs.python-requests.org/en/master/. [Accessed: 30-Jan-2018].
[38] “Using GPS and threading in Python,” Getting GPSd to work with Python and Threading, 05-Sep-2012. [Online]. Available: http://www.danmandle.com/blog/getting-gpsd-to-work-with-python/. [Accessed: 17-Dec-2017].
[39] Python Software Foundation, “Threading Library,” Higher-level threading interface, 2017. [Online]. Available: https://docs.python.org/2/library/threading.html. [Accessed: 30-Jan-2018].
[40] W. J. Gilmore, Ed., “Introducing MySQL,” in Beginning PHP and MySQL: From Novice to Professional, Berkeley, CA: Apress, 2008, pp. 621–633.
[41] “Creating Instances | Cloud SQL for MySQL,” Google Cloud Platform. [Online]. Available: https://cloud.google.com/sql/docs/mysql/create-instance. [Accessed: 03-Feb-2018].
[42] S. Cabral and K. Murphy, “MySQL® Administrator’s Bible,” in MySQL administrator’s bible, Indianapolis, IN: Wiley Pub, 2009, pp. 66–70.
[43] “Choosing an App Engine Environment | App Engine Documentation,” Google Cloud Platform. [Online]. Available: https://cloud.google.com/appengine/docs/the-appengine-environments. [Accessed: 03-Feb-2018].
[44] “Getting Started with Flask on App Engine Standard Environment | App Engine standard environment for Python,” Google Cloud Platform. [Online]. Available: https://cloud.google.com/appengine/docs/standard/python/getting-started/python-standard-env. [Accessed: 03-Feb-2018].
[45] “Using third-party libraries | App Engine standard environment for Python,” Google Cloud Platform. [Online]. Available: https://cloud.google.com/appengine/docs/standard/python/tools/using-libraries-python-27. [Accessed: 06-Feb-2018].
[46] R. Rehim, Effective Python penetration testing pen test your system like a pro and overcome vulnerabilities by leveraging Python scripts, libraries, and tools. Birmingham: Packt Publishing, 2016.

95
[47] D. Schultz and C. Cook, “Beginning HTML with CSS and XHTML,” in Beginning HTML with CSS and XHTML: modern guide and reference, Berkeley, CA: Apress, 2007, pp. 2–25.
[48] C. Minnick and E. Holland, JavaScript® for kids for dummies®. Hoboken, New Jersey: John Wiley & Sons, Inc, 2015.
[49] “Adding a Google Map with a Marker to Your Website | Google Maps JavaScript API,” Google Developers. [Online]. Available: https://developers.google.com/maps/documentation/javascript/adding-a-google-map. [Accessed: 06-Feb-2018].
[50] A. KURNIAWAN, LEARNING AWS IOT: effectively manage connected devices on the aws cloud using services such as... aws greengrass, aws button, and so on. S.l.: PACKT PUBLISHING LIMITED, 2018.


1