Automobiles & Parts PIAGGIO S.p.A. - CFA Institute Presentation 2011.pdf · Risk matrix Impact d...
98
PIAGGIO S.p.A. Politecnico Student Research Global Investment Research Challenge 2011 Automobiles & Parts
Transcript of Automobiles & Parts PIAGGIO S.p.A. - CFA Institute Presentation 2011.pdf · Risk matrix Impact d...
PIAGGIO S.p.A.Politecnico Student Research
Global Investment Research Challenge 2011
Automobiles & Parts

Company Overview
Why investin Piaggio
Financial Analysis
Valuation RiskAnalysis
Data and Charts

• Wide brand portfolio• Wide brand portfolio• Premiumisation strategy
Company Overview
Young
• Largest European producer of 2w and LCVs by revenues
Company Overview
Financial Analysis
Valuation RiskAnalysis
Data and Charts
Why investin Piaggio

Company Overview
Production FacilitiesDistribution NetworkJoint Venture
• Internationalization strategy
Company Overview
Financial Analysis
Valuation RiskAnalysis
Data and Charts
Why investin Piaggio

Company Overview• Latest results
Company Overview
Financial Analysis
Valuation RiskAnalysis
Data and Charts
Europe India Vietnam
335,0002Ws
220,000LCVs 60,000
2Ws
360,0002Ws 197,000
LCVs 48,0002Ws
-7.5% +11.7% +25%
Unit Sold Vs Management Guidelines:
European Revenues (€’000)Revenues Breakdown
Source: Company Data, Politecnico EstimatesSource: Company Data
Actual Guidelines Delta
Revenues €1,485M €1,500M -1%1
Ebitda Margin 13.3% 13.3% 0%
EPS €0.115 €0.118 -2.5%
From Revenues to Earnings:
Why investin Piaggio

Company Overview• Latest results
Company Overview
Financial Analysis
Valuation RiskAnalysis
Data and Charts
• Efficiency Improvements
• Financial Savings
• Higher Materials Costs
• One-off Fiscal Items
From Revenues to Earnings:
Why investin Piaggio

Company Overview• Our Rating
Company Overview
Financial Analysis
Valuation RiskAnalysis
Data and Charts
BUY
HOLD
Price (03/31/11): €2.4112 M Target Price: €2.8Upside: 16.2%Rating: BUY
Why investin Piaggio
Indian sales report 2010 financial results

Company Overview
Why investin Piaggio
Financial Analysis
Valuation RiskAnalysis
Data and Charts

1. Launch of new products in India
2. Expansion in South-Eastern Asia
3. Consolidation in Europe
Why invest in Piaggio
Company Overview
Financial Analysis
Valuation RiskAnalysis
Data and Charts
Why investin Piaggio

Market volumes : 1M u (2010)Market growth: 8% (2011E)
Piaggio volumes: 220,000 u (2010)Piaggio growth: 13.5% (2011E)
Why invest in Piaggio: New products in India
3w
4w
Launch of Vespa: 2012EPiaggio volumes: 75,000 u (2013E)
Company Overview
Financial Analysis
Valuation RiskAnalysis
Data and Charts
25%
24%23%
18%
10%
Why investin Piaggio

Why invest in Piaggio: Expansion in Asia
Vietnam
Malaysia Indonesia
Thailand Taiwan
Potential Market: 3M vehiclesPotential Market:
11M vehicles
Company Overview
Financial Analysis
Valuation RiskAnalysis
Data and Charts
Why investin Piaggio

Why invest in Piaggio: Consolidation in Europe
EuropeanEBITDA Margin
+155bpsby 2013
• Improvement of global sourcing position
• Production plants rationalisation
• Synergies in the distribution network
Company Overview
Financial Analysis
Valuation RiskAnalysis
Data and Charts
Eco Friendly Solutions:
Piaggio Market Share: 20%
Piaggio Volumes: 335,000 units (2010)
Why investin Piaggio

Company Overview
Financial Analysis
Valuation RiskAnalysis
Data and Charts
Why investin Piaggio

€1485M €1615M €1745M €1850M7.6% Revenue CAGR 10-13Balance Sheet
Income Statement
Cash Flow Statement
+ 160bps EBITDA margin
€0.11 €0.14 €0.18 €0.22
8.8% OCF CAGR 10-13
14.8% From EMs11.9% EBITDA CAGR 10-13
Lower D&A and Financial Charges CAGR
24.3% EPS CAGR 10-13
~ €65M
~ €140M
OCF Capex ∆NWC ∆NFP Div. &Buy Back3.3% From DMs
Financial Analysis
2010 2013
Higher than Revenue CAGR
Source: Politecnico Estimates
2010 E 2011 E 2012 E 2013 E
€197M €218M €249M €276M
€153M €155M €181M €197M
2010 2011 E 2012 E 2013 E
NFP €350M €342M €318M €288M
Debt €528M €500M €470M €440M
Cash&other €155M €148M €147M €147M
Equity €443M €467M €499M €537M
Ability to meet short and long term obligations
~ €15M
~ €310M
~€530MDeleveraging while Improving ROE
Company Overview
Why investin Piaggio
Financial Analysis
Valuation RiskAnalysis
Data and Charts

Company Overview
Why investin Piaggio
Financial Analysis
Valuation RiskAnalysis
Data and Charts

• Sum-of-the-part approach
Two-Stage model Three-Stage model Analytical Period + Perpetuity Analytical Period + Convergence Stage + Perpetuity
Valuation: Discounted Cash Flow
Source: Politecnico Estimates
Company Overview
Why investin Piaggio
Financial Analysis
Valuation RiskAnalysis
Data and Charts

€963M
2.5%
9.75%
30%
€33M
7.63%
Sales 2010
Sales CAGR 10-15
EBITDA margin 2010
Tax Rate
FCFF 2010
WACC
Valuation: Discounted Cash Flow
€389M
12.9%
19.5%
42%
€13M
9.31%
€133M
13.5%
20.5%
7.5%
€10M
10.72%
Source: Politecnico Estimates
€963M
2.5%
9.75%
30%
€33M
7.63%
€133M
13.5%
20.5%
7.5%
€10M
10.72%
€2.90
€0.95
€1.30
€0.65
TP DCF EU + US India Vietnam
Company Overview
Why investin Piaggio
Financial Analysis
Valuation RiskAnalysis
Data and Charts

Median Hero Mahindra Bajaj Tata
2011 E 9.35 x 10.60 x 8.10 x 11.12 x 5.46 x
• Piaggio’s Indian and Vietnamese businesses are comparable to its Indian peers
• Using the median EV/EBITDA multiple
EV Piaggio Asia
€ 1,114M
DCF EV
€ 970.5M13% discount
Valuation: Multiple Analysis
InitiationCoverage
Why Investin Piaggio
Financial Analysis
Valuation RiskAnalysis
CompanyOverview
0%
5%
10%
15%
20%
25%
30%
35%
Piaggio-Asia Hero Honda Mahindra & Mahindra
Bajaj Auto Tata Motors
Sales growth rate (2009-11E)
Company Overview
Why investin Piaggio
Financial Analysis
Valuation RiskAnalysis
Data and Charts
Piaggio-Asia Hero HondaMahindra & MahindraBajaj Auto Tata Motors
Average EBITDA% (2010E-11E)

0%
33%
67%
100%Geographical exposure to EMs
Valuation: Multiple Analysis
As regards the whole Piaggio Group (EV/EBITDA multiple):
0%
10%
20%
30%
Sales growth rate (2009-2011)
0%
10%
20%
30%
Average EBITDA % (2010-11)EMs multiple
- for the Asian Business:
DMs multiple
- for the non-Asian Business:
9.3x 4.4x
Target Price: € 2.620%
33%
67%
100%
Business exposure to 2w market to LCVs market
Company Overview
Why investin Piaggio
Financial Analysis
Valuation RiskAnalysis
Data and Charts
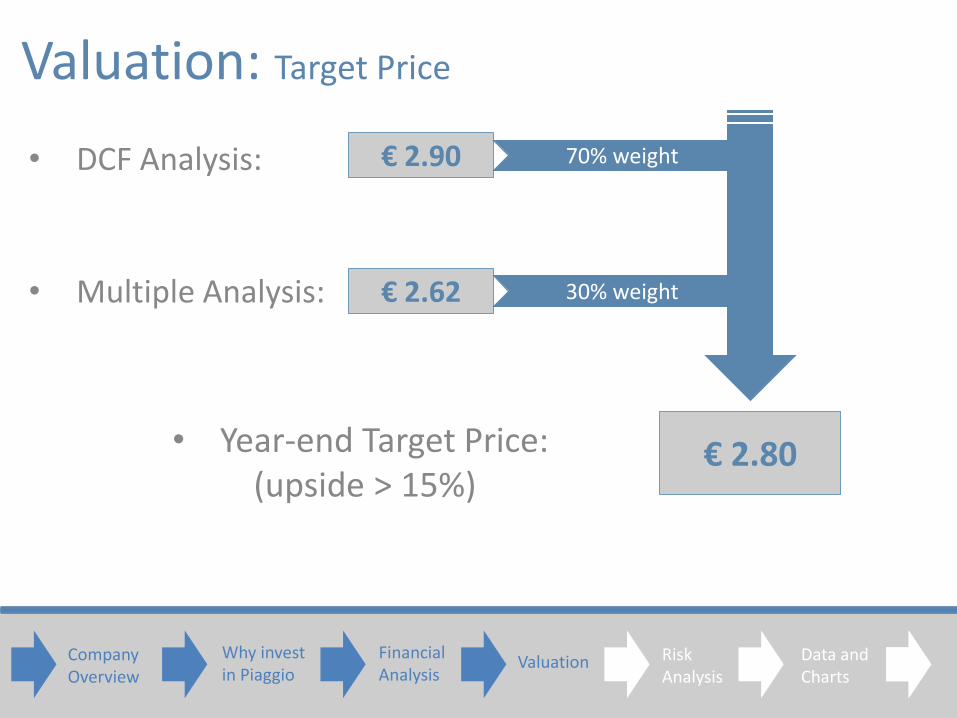
• DCF Analysis:
• Multiple Analysis:
• Year-end Target Price:(upside > 15%)
€ 2.62
€ 2.90
€ 2.80
70% weight
30% weight
Valuation: Target Price
Company Overview
Why investin Piaggio
Financial Analysis
Valuation RiskAnalysis
Data and Charts
Company Overview
Why investin Piaggio
Financial Analysis
Valuation RiskAnalysis
Data and Charts

Pro
bab
lePo
ssib
le
•Instable Vietnam •Labour market
•Supply Chain risk
•Tighter regulations
•Credit risk
•Increase in interest rates
Un
likel
y
•Strikes •Intellectual Property
•Liquidity risk•De-premiumisation
Rar
e
•Machinary failure •Vehicles defects
Marginal Minor Intermediate Major
Risk analysis: Risk matrix
Impact
Like
liho
od
Source: Politecnico Estimates
• Unsuccessfulproduct launches
• Stronger competition
• Exchange rate risk
• Increase in energy,raw materials andcomponents costs
• GDP growth rates
Risk analysis: Risks from Asia
• Stronger competition
• Exchange rate risk
• Unsuccessfulproduct launches
Company Overview
Why investin Piaggio
Financial Analysis
Valuation RiskAnalysis
Data and Charts

• Exchange rate risk
• Stronger competition
• Unsuccessfulproduct launches
• Exchange rate risk
• Stronger competition
• Unsuccessfulproduct launches
Source: Politecnico Estimates
Risk analysis: Risk matrixRisk analysis: Risks from Asia
Source: Pacific Exchange Rate Service
Company Overview
Why investin Piaggio
Financial Analysis
Valuation RiskAnalysis
Data and Charts

Pro
bab
lePo
ssib
le
•Instable Vietnam •Labour market
•Supply Chain risk
•Tighter regulations
•Credit risk
•Increase in interest rates
Un
likel
y
•Strikes •Intellectual Property
•Liquidity risk•De-premiumisation
Rar
e
•Machinary failure •Vehicles defects
Marginal Minor Intermediate Major
Risk analysis: Risk matrix
Impact
Like
liho
od
Source: Politecnico Estimates
• Unsuccessfulproduct launches
• Stronger competition
• Exchange rate risk
• GDP growth rates
Risk analysis: Global risks
• GDP growth rates
• Increase in energy, raw materials andcomponents costs• Increase in energy,
raw materials andcomponents costs
Company Overview
Why investin Piaggio
Financial Analysis
Valuation RiskAnalysis
Data and Charts

• Increase in energy, raw materials andcomponents costs
• GDP growth rates
• Increase in energy, raw materials andcomponent costs
• GDP growth rates
-4
-2
0
2
4
6
8
1999 2000 2001 2002 2003 2004 2005 2006 2007 2008 2009 2010 2011 2012
Real GDP growth rates
World Major advanced economies (G7) ASEAN-5
Source: International Monetary Fund, World Economic Outlook Database
Risk analysis: Risk matrixRisk analysis: Global risks
Source: Company data
Company Overview
Why investin Piaggio
Financial Analysis
Valuation RiskAnalysis
Data and Charts

• Price Confidence Interval: (€ 2.70 ; € 2.90)
Risk analysis: Montecarlo Simulation
Source: Politecnico Estimates
Company Overview
Why investin Piaggio
Financial Analysis
Valuation RiskAnalysis
Data and Charts
P = 80%
€2
.80
€2
.82
€2
.85
€2
.87
€2
.90
€2
.92
€2
.95
€2
.97
€2
.77
€2
.75
€2
.72
€2
.70
€2
.67
€2
.65
€2
.62

0
50
100
150
200
250
300
350
400
Nu
mb
ers
of
iter
atio
ns
Price of ASEAN operations Price of European operations Price of Indian operations
• 74% of volatility comes from Asia
Risk analysis: Montecarlo Simulation
Source: Politecnico Estimates
Company Overview
Why investin Piaggio
Financial Analysis
Valuation RiskAnalysis
Data and Charts

QuestionsCompany Overview
Why investin Piaggio
Financial Analysis
Valuation RiskAnalysis
Data and Charts
Questions

PIAGGIO S.p.A.Politecnico Student Research
ICFAS Investment Research Challenge 2011
Automobiles & Parts

• Hedging Policy• Costs Breakdown• Corr. Oil , Rub, All.• Sensitivity on Oil Price• Sensitivity India• Sensitivity ASEAN• Sensitivity Europe• Political risk – India 1• Political risk – India 2• Japan’s earthquake• Interest Rates Risk• MS: Assumptions• MS: Impact• MS: Results• Sensitivity on steel
• India• Vietnam• Indonesia• Malaysia• Thailand• Summary• GDP growth rates
• On The Stock Market• 2010 Results• OWC• Stock Options Plan• Tax Rate• Sales’ Seasonality• Spare Parts• Aprilia and Moto Guzzi
• Main Competitors• EU Scenario• India Scenario• US Scenario• Vietnam Scenario
• CG Snapshot• Board of Directors• CG and CSR Valuation
• EMs and DMs Multiples• Piaggio Peers• Historical P/E• P/E Future Evolution
• Assumpt. Macro Scenario• Assumpt. Cost Inflation• Terminal Value• WACC
• Debt Structure• Altman Z-Score
• Balance Sheet• Income Statement• Cash Flow Statement India• Cash Flow Statement EU• Cash Flow Statement ASEAN• Ratios• ROE
Data and Charts
Data and ElaborationsFinancial Statements:
Strategy:
Company: Competitive Scenario:
• Strategic Levers• Premiumisation• Brand Diversification• Launch of Vespa• New Urban Vehicles
Macro Scenario:
Market:• From 3w to 4w• Electric and Hybrid• Indian 4w• Margins in 2w•Motorcycle IndustryOutlook
Debt:
Acquisitions:
• Piaggio as a Prey• Potential Buyers• Piaggio’s Acquisitions
DCF Model:
Multiples:
Risks:
CG and CSR:
Company Overview
Why investin Piaggio
Financial Analysis
Valuation RiskAnalysis
Data and Charts
Data and ChartsData and Charts
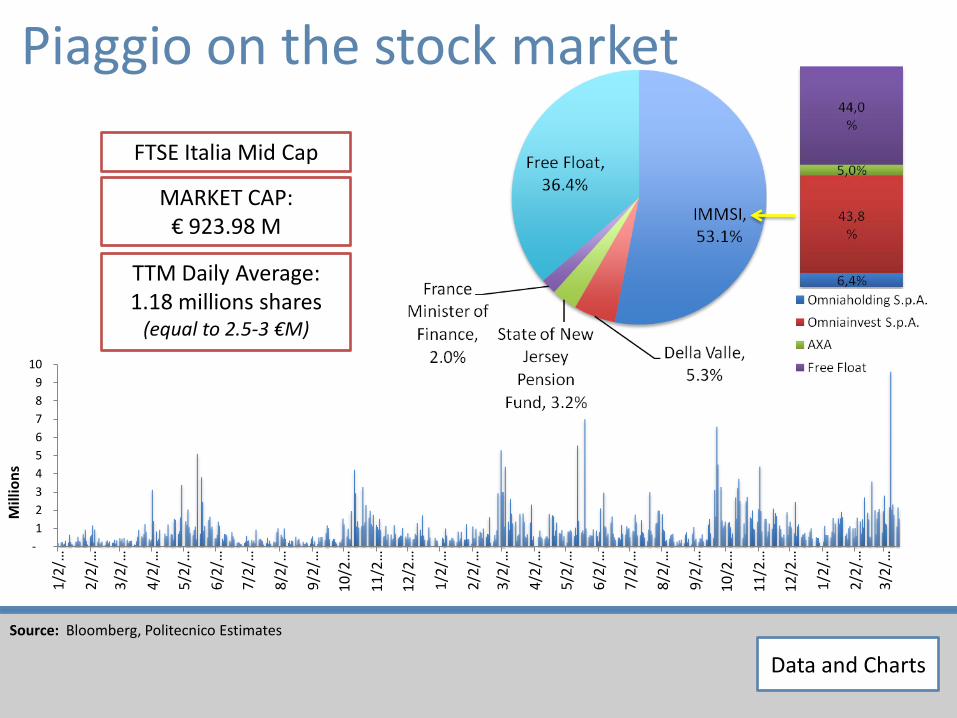
Piaggio on the stock market
-
1
2
3
4
5
6
7
8
9
10
1/2
/…
2/2
/…
3/2
/…
4/2
/…
5/2
/…
6/2
/…
7/2
/…
8/2
/…
9/2
/…
10
/2…
11
/2…
12
/2…
1/2
/…
2/2
/…
3/2
/…
4/2
/…
5/2
/…
6/2
/…
7/2
/…
8/2
/…
9/2
/…
10
/2…
11
/2…
12
/2…
1/2
/…
2/2
/…
3/2
/…
Mill
ion
s
Source: Bloomberg, Politecnico Estimates
TTM Daily Average: 1.18 millions shares
(equal to 2.5-3 €M)
MARKET CAP:€ 923.98 M
FTSE Italia Mid Cap

2010 ResultsSlightly below consensus, but positive underlying trends.
• Volumes:
• Ebit Margin:
• Interests:
• Tax Rate:
• EPS:
335k Actual Vs355k Expected
220k Actual Vs195k Expected
60k Actual Vs48k Expected
7.5%. In line with consensus (+50bps from 2009)
48.9%. Higher than consensun (+12.9% from 2009)
€27.3M. In line with consensus (- €3M from 2009)
€0.115. In line with consensus (substantially in line with 2009)
European 2Ws: Indian LCVs: ASEAN 2Ws:
Data and Charts

XXX
Operating Working Capital:
Source: Bloomberg, Politecnico Estimates
€ (700)
€ (500)
€ (300)
€ (100)
€ 100
€ 300
€ 500
€ 700
2008 2009 2010 2011 E 2012 E 2013 E
Payables
Receivables
Inventories
€ (10)
€ -
€ 10
€ 20
€ 30
2008 2009 2010 2011 E 2012 E 2013 E
NWC
Mill
ion
sM
illio
ns
Data and Charts

Data and Charts
Piaggio’s Stock Option Plan
Stock Option Plan approved on 07 May 2007 and updated on 25 January 2010
The Board of Directors is responsible of the Stock Option Plan
Max 10,000,000 of granted Stock Options equal to 2.52% of the share capital
The Stock Options are European style options
Grant Date/Commencement Date
0 5
Expiration Date
3
Vesting Date
EXERCISE PERIOD
Grant Date (GD) BeneficiariesStock Options
Number
Expected
Liabiliy
Stock market
price at GDStrike Price
31 July 20083 Directors and
16 Executives 2,435,000 €1,600,000 €1.391 €1.216
03 October 2008 1 Executive 300,000 €186,600 €1.512 €1.570
15 January 2009 1 Director 390,000 €220,000 €1.1569 €1.2218
11 May 2009 2 Executives 250,000 €125,000 €1.2238 €1.2237
18 December
2009
3 Directors and
29 Executives4,720,000 €3,000,000 €1.8818 €1.826
04 January 2010 1 Executive 500,000 €350,000 €2.004 €1.892
Data and Charts

Source: Politecnico Estimates
Tax Rates
Piaggio’s tax rates by region:
Piaggio’s aggregate tax rate:
Country Tax rate
Italy 27.5%
Europe ~30%
US 35%
India 43%
Vietnam 7.5%
ASEAN ~25%
44%
Piaggio’s taxes not based on taxable income:
IRAP
Indian Dividend Distribution Tax
Data and Charts

Data and Charts
Seasonality in Piaggio’s sales
Seasonal fixed-term contracts.
Peaks’ impact on OWC is:
0
100
200
300
400
500
600
700
0
100
200
300
400
500
600
700
FQ1
20
06
FQ2
20
06
FQ3
20
06
FQ4
20
06
FQ1
20
07
FQ2
20
07
FQ3
20
07
FQ4
20
07
FQ1
20
08
FQ2
20
08
FQ3
20
08
FQ4
20
08
FQ1
20
09
FQ2
20
09
FQ3
20
09
FQ4
20
09
FQ1
20
10
FQ2
20
10
FQ3
20
10
FQ4
20
10
REVENUES from 2006 to 2010
Peak in the European
springtime.
Payables BEFORE the peak
Receivables AFTER the peak
Inventories BEFORE the peak
Data and Charts

Data and Charts
Spare parts segment
Higher marginality
PIAGGIO’S Business Units
2Ws
Scooters
Motorcycles
Spare Parts
LCVs
Spare Parts
10% of Total Revenues in 2010
Strategic for LCVs in India
New logistics center in Pontendera (Italy)
Data and Charts

Data and Charts
Aprilia and Moto Guzzi
Source: Acem
Substitution trend in Europe (‘000 units)
Two significant brands for Piaggio linked to:
increasing importance of motorbikes in the European market: a trend that has begun since the early ‘90
need to enrich and complete Piaggio’s brand diversification
Piaggio’s large investments in 2010 for them
synergies with Piaggio distribution network
Data and Charts

Piaggio Strategic Levers
Internationalization Premiumization• Design
• Environment• Safety
• Innovation• Robustness
• New markets• New products• New plants
Cost Efficiency• Improvement of global sourcing position
• Production Plants Rationalization• Sinergies in Distribution Network
Outsourcing and SCM• Production of engines
• Centralized logistic center for the spareparts business
Data and Charts

Data and Charts
Premiumisation strategy
Piaggio’s prices are higher than itscompetitors:
customersrecognize higher
quality and uniquesolutions.
Revenues COGs R&D
Premiumisation’s impact
Data and Charts

Data and Charts
Brand diversification
Wide BrandPortfolio
Wide Range ofCustomers
Data and Charts

Distribution network already present…
…but for LCVs distribution
Larger organizational structure (Piaggio India has its own CEO)
Piaggio’s R&D department improved Vespa to better target the Indian’s customers
Vespa gained a successful commercial presence in India:
..in 1960, Rahul Bajaj obtained the license to produce the Vespa in India, till 1970 when the Indian government
revoked the license. Now Piaggio has better fundamentals to compete in Indiain respect to the ‘80s and ‘90s.
XXX
Launch of Vespa: India vs Vietnam
Source: Indian news, Politecnico Estimates
Data and Charts

Scooter MP3:
- launched in October 2007- 72,000 units sold so far- hybrid models since 2009
Car prototype NT3:
- November 2010 (Milan Motor Show)- launch expected in 2012-13- three-seat city car
XXX
New types of vehicles: urban mobility
Source: News, Politecnico Estimates
Data and Charts

Piaggio as a Prey
WHAT DOES A PREDATOR GET?
•Business: 2W and LCV in Europe. 2W, 3W and 4W in India. 2W in ASEAN.
•Market Share: 20% in 2W Europe40% in 3W, 4% in 4W India Niche player in 2W ASEAN
•Revenues: €1,485M in 2010 (~$2,065M)
•Leverage: 1.2x
AT WHAT PRICE?
• Market Cap: ~€895M (~ $1,245M)
• Ownership: Immsi S.p.a. (53% share)
~€470M
~€220M • Premium to pay for the deal (+25%)
Best Case: €600M Worst Case: €1,130M
• Market Value of the Control Stake
~€420M • Pubblic Offer to Minority Shareholders(compulsory in the Italian order in case ofacquisition of the control stake)
~€20M • Fees
Data and Charts

Potential BuyersINDIAN CONGLOMERATE COMPANIES:
Automotive Business: Commercial Vehicles and Personal Vehicles. Market Share: 1% in Indian 3W LCVs and 31% in 4W.Revenues: Rs184,520 M (~$4,095M)Market Cap: $7,740MLeverage: 0.14x
Automotive Business: Commercial Vehicles and Personal Vehicles.Market Share: 57% in indian 4W LCVs.Revenues: Rs918,934 M (~$20,390M)Market Cap: $14,803MLeverage: 1.0x
Recent acquisitions: Ssangyong Motors (Korean Premium SUV manufacturer )
Recent acquisitions: Jaguar and Land Rover (2008)
BENEFITS FROM ACQUIRING PIAGGIO:
• Entry in Western Markets• Consolidation in Indian Market
• Premium Brands + Technology Transfer• Entry in 2W
Data and Charts

Data and Charts
Leader in motorbikes
Large brand portfolio
Piaggio’s acquisitionsPiaggio’s past acquisitions:
In the future Piaggio will not make acquisitions:
according to its strategy;
there are not potential takeover targets. For example:
Company Positive Negative
Ducati• High margin (18%)
• Strong distribution network• Insignificant share in
emerging markets
Scooters India• High annual capacity
• Highly cost effective product• It hasn’t a strong brand
position in 3W as Ape
Data and Charts

Data and Charts
Piaggio’s main competitorsEUROPEAN COMPETITORS INDIAN COMPETITORS
2W 2W
LCVs LCVs
Auto Auto
DRIVER PIAGGIO MAHINDRA BAJAJ TATA GM NISSAN
PRODUCT DESIGN QUALITY
PRODUCTION PROCESS QUALITY
PRICE
DISTRIBUTION NETWORK
DRIVER PIAGGIO HONDA YAMAHA BMW KYMCO SUZUKI
BRAND
DESIGN
ENGINE INNOVATION
QUALITY
PRICE
Data and Charts

Data and Charts
Competitive scenarios: EUSegment Total market
sales (2010)Piaggio’s Market
share (2010)
Motorcycles total 1,548,000 20%
Scooters 970,000 27%
Motorbikes 578,000 7%
LCVs 1,500,000 0.92%
Data and Charts

Data and Charts
Competitive scenarios: India
Data and Charts

Data and Charts
Competitive scenarios: the US
€82 €79
€95
€61
€22
$103 $109
$140
$85
$29
20
70
120
2006 2007 2008 2009 2010
Mill
ion
s
US net sales Euro (€) USD ($)
March 8°, 2011, Piaggio US changed its CEO: Paolo Timoni > Miguel Martinez
Market with very peculiarrequirements and customer needs.
Data and Charts
Strong impact of the economiccrisis. 60% reduction in volumes
Scooter segment: 5% of total in 2010, down from 12% in 2007
Piaggio’s market share in scooter market: 30% (6,700 vehicles)

700
800
900
1000
1100
1200
1300
1400
1500
2006 2007 2008 2009 2010 2011 2012
GDP per capita (US $)
India
Vietnam
Data and Charts
Competitive scenarios: Vietnam
90% of total vehicles in Vietnam are scooters(motorbike segment: absent)
0
5
10
15
20
25
2006 2007 2008 2009 2010 2011 2012
CPI Inflation (%)
India
Vietnam
Vietnamese market accounts2,800,000 vehicles sold in 2010
Source: IMF Source: IMF
Data and Charts
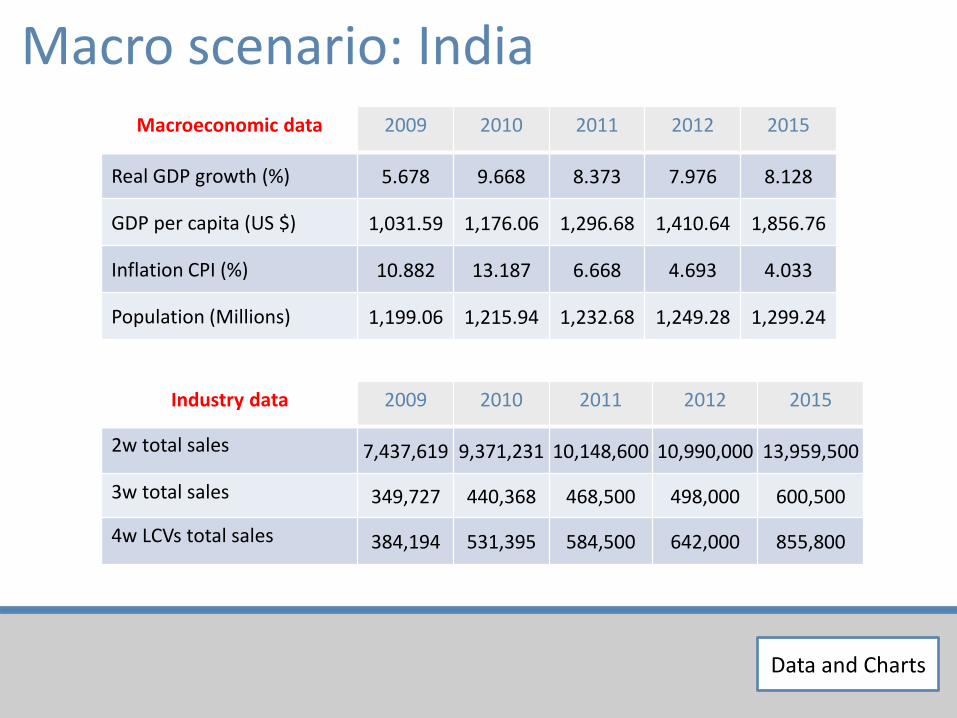
Macroeconomic data 2009 2010 2011 2012 2015
Real GDP growth (%) 5.678 9.668 8.373 7.976 8.128
GDP per capita (US $) 1,031.59 1,176.06 1,296.68 1,410.64 1,856.76
Inflation CPI (%) 10.882 13.187 6.668 4.693 4.033
Population (Millions) 1,199.06 1,215.94 1,232.68 1,249.28 1,299.24
Industry data 2009 2010 2011 2012 2015
2w total sales 7,437,619 9,371,231 10,148,600 10,990,000 13,959,500
3w total sales 349,727 440,368 468,500 498,000 600,500
4w LCVs total sales 384,194 531,395 584,500 642,000 855,800
Macro scenario: India
Data and Charts
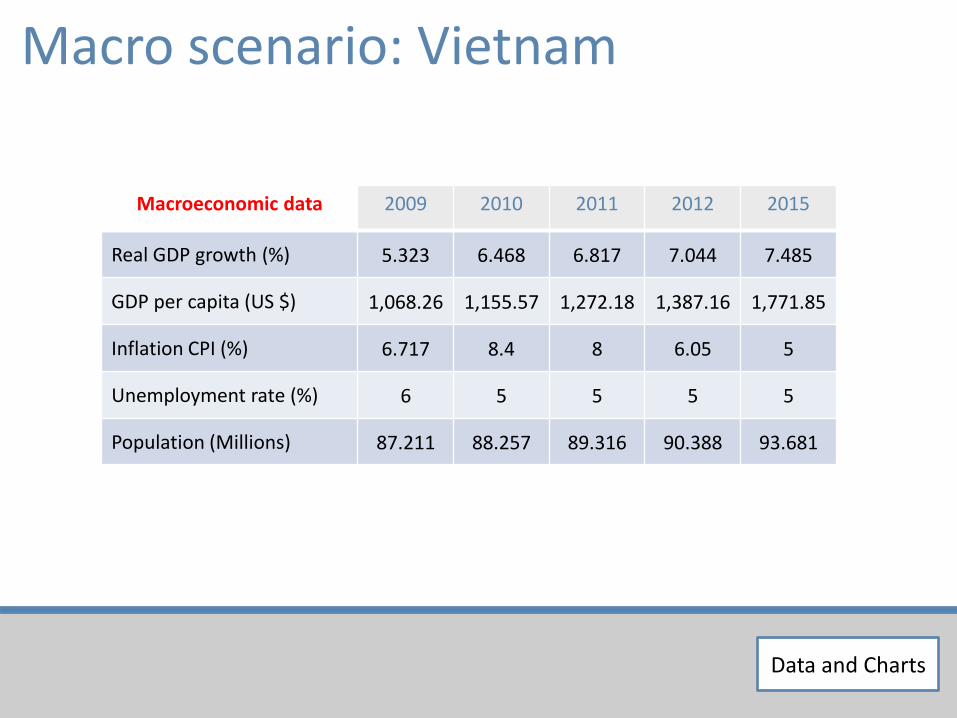
Macroeconomic data 2009 2010 2011 2012 2015
Real GDP growth (%) 5.323 6.468 6.817 7.044 7.485
GDP per capita (US $) 1,068.26 1,155.57 1,272.18 1,387.16 1,771.85
Inflation CPI (%) 6.717 8.4 8 6.05 5
Unemployment rate (%) 6 5 5 5 5
Population (Millions) 87.211 88.257 89.316 90.388 93.681
Macro scenario: Vietnam
Data and Charts

Macroeconomic data 2009 2010 2011 2012 2015
Real GDP growth (%) 4.546 6 6.2 6.5 7
GDP per capita (US $) 2,329.45 2,963.28 3,270.01 3,532.00 4,440.58
Inflation CPI (%) 4.814 5.066 5.5 5.357 3.714
Unemployment rate (%) 8 7.5 7 6.5 7
Population (Millions) 231.547 234.557 237.606 240.695 250.205
Macro scenario: Indonesia
Data and Charts

Macroeconomic data 2009 2010 2011 2012 2015
Real GDP growth (%) -1.714 6.716 5.3 5.2 5
GDP per capita (US $) 6,950.47 7,754.99 8,238.51 8,748.81 10,455.22
Inflation CPI (%) 0.6 2.2 2.1 2.3 2.5
Unemployment rate (%) 3.7 3.5 3.2 3.1 3
Population (Millions) 27.761 28.233 28.713 29.201 30.716
Macro scenario: Malaysia
Data and Charts

Macroeconomic data 2009 2010 2011 2012 2015
Real GDP growth (%) -2.248 7.522 4.001 4.25 5
GDP per capita (US $) 3,940.97 4,620.71 4,888.46 5,161.49 6,268.62
Inflation CPI (%) -0.846 3.047 2.755 2.53 1.954
Unemployment rate (%) 1.39 1.39 1.39 1.39 1.39
Population (Millions) 66.983 67.653 68.33 69.013 71.104
Macro scenario: Thailand
Data and Charts

0.00
2,000.00
4,000.00
6,000.00
8,000.00
10,000.00
India Indonesia Malaysia Thailand Vietnam
GDP per capita (US $)
2009
2010
2011
2012
2015
-2
0
2
4
6
8
10
12
14
India Indonesia Malaysia Thailand Vietnam
Inflation, CPI (%)
2009
2010
2011
2012
2015
1,215.94
234.557
28.233
67.653 88.257
Population (Millions, 2010)
India
Indonesia
Malaysia
Thailand
Vietnam
Population CAGR 2010-15
India 1.33%
Indonesia 1.30%
Malaysia 1.70%
Thailand 1.00%
Vietnam 1.20%
Macro scenario: Summary
Data and Charts

Shift from 3 to 4 wheel LCVs
Market segment
2003-2010CAGR
2010 Volumes
Piaggio’s market
share (2010)
3W 6.46% 500,000 40%
4W 10.74% 350,000 4%
Piaggio’s Productlaunches (4W)
Quargo Ape Truck
Data and Charts

Electric and hybrid markets
MP3 Hybrid Electric Porter Bifuel Porter
Max speed 62 miles/h 34 miles/h 80 miles/h
GHGs reduction 60% 100% 20%
Range (electric) 12 miles 66 miles -
Full-charge time 3 hours 8 hours -
Cost 11,000 $ 30,000 $ 16,500 $
India Europe USA
Presence ofPiaggio’s Eco line
No Yes Yes
Competitors TVS, HeroElectric
Yamaha (2011E),Honda (2011E)
KTM (2011E), EVTAmerica, ZEV, etc.
5,000 electric Porter sold in 10 years, leader in the
niche “Green” Market
MP3 Hybrid
Porter
Data and Charts

XXXWe do not believe margins will suffer in the next years
Source: Company’s financial statements, Politecnico Estimates
Indian market of 4w LCV’s: growing 10% YoY Price competition is not a rational strategy
Piaggio’s strategic positioning: quality leadership vs. cost leadership Piaggio’s products have a higher fuel efficiency in respect to competitors’ products
GM and Nissan start from scratch, while Piaggio is operating in India since 1999with 560 dealers across the country
Indian 4w market
Data and Charts

Europe and U.S. Low margins, but on the way to
increase, due to:- plant rationalization (elimination
of the factories in Spain)- the market will slowly recover
Vietnam and ASEAN: Higher margins, slightly decreasing
(conservative forecasting)- lower cost of labor;- advanced know-how in respect to
emerging markets’ based companies
XXX
20.0%
20.5%
21.0%
21.5%
22.0%
22.5%
23.0%
2011 E 2012 E 2013 E 2014 E 2015 E
ASEAN EBITDA %
10.0%
10.5%
11.0%
11.5%
12.0%
2011 E 2012 E 2013 E 2014 E 2015 E
EU and US EBITDA %
Margins in the 2w market
Source: Bloomberg, Politecnico Estimates
Data and Charts

Data and Charts
Motorcycle industry: world outlookCountry 2010 2009 Growth
Italy 294,000 389,000 -24.42%France 210,000 226,000 -7.08%Spain 106,000 106,500 -0.47%
Germany 89,000 113,000 -21.24%UK 29,000 31,868 -9.00%
USA 27,000 30,337 -11.00%Brasil 375,000 277,778 35.00%India 2,600,000 2,460,377 5.67%
Indonesia 6,700,000 5,321,684 25.90%Vietnam 2,700,000 2,263,202 19.30%
Thailandia 1,500,000 1,247,920 20.20%Malesia 428,000 407,619 5.00%
Philippine 402,000 328,969 22.20%
Country 2010 2009 Growth
India 11,300,000 9,300,000 21.51%China 16,000,000 17,391,304 -8.00%
Indonesia 7,600,000 5,801,527 31.00%Vietnam 2,750,000 2,305,113 19.30%
Thailandia 1,850,000 1,537,822 20.30%Philippine 768,000 619,355 24.00%Malesia 451,000 429,524 5.00%Taiwan 541,000 477,915 13.20%
USA 496,000 520,000 -4.62%Brasil 1,800,000 1,563,858 15.10%Italy 393,000 504,116 -22.04%
France 343,000 370,565 -7.44%Spain 167,000 174,278 -4.18%
Germany 181,000 213,000 -15.02%UK 96,000 111,630 -14.00%
Motorcycles Scooters
Country 2010 2009 Growth
Italy 99,000 115,116 -14.00%France 133,000 144,565 -8.00%Spain 61,000 67,778 -10.00%
Germany 92,000 100,000 -8.00%UK 67,000 79,762 -16.00%
USA 412,000 489,000 -15.75%Brasil 1,400,000 1,262,399 10.90%India 8,700,000 6,839,623 27.20%
Indonesia 648,000 514,286 26.00%Vietnam - - -
Thailandia 366,000 290,476 26.00%Malesia 73,000 60,331 21.00%
Philippine 22,000 20,952 5.00%
Data and Charts

Source: Company Data, Politecnico Estimates
Data and Charts
Balance Sheet2008 2009 2010 2011 E 2012 E 2013 E
FIXED ASSETS 899,186 892,251 909,909 917,080 920,218 923,412
Intangible assets 648,234 641,254 652,622 655,611 656,929 658,271
Tangible assets 250,354 250,415 256,759 260,887 262,707 264,559
Financial assets 598 582 528 582 582 582
NET WORKING CAPITAL (3,726) 17,212 30,553 52,103 72,844 92,798
Current trade receivables 90,278 103,164 90,421 103,292 116,800 129,597
Other current receivables 21,380 24,198 23,300 25,823 27,893 29,622
Other non-current receivables 12,587 12,914 12,655 13,718 14,818 15,737
Inventories 257,961 252,496 240,066 264,685 289,385 309,182
Trade payables (362,224) (345,987) (352,627) (377,660) (402,699) (425,820)
Short term Tax receivables 27,772 23,979 44,200 40,200 39,400 37,000
Long term Tax receivables 8,166 4,990 967 4,708 4,708 4,708
Deferred tax assets 36,227 46,462 46,294 42,994 42,994 42,994
Short term Tax payables (19,065) (18,952) (19,290) (19,102) (19,102) (19,102)
Long term Tax payables (166) - (3,361) - - -
Other short term payables (70,677) (79,567) (69,503) (75,855) (87,164) (92,569)
Other long term payables (5,965) (6,485) (5,961) (6,294) (6,799) (7,220)
PROVISIONS (137,531) (133,685) (131,100) (124,680) (123,807) (122,733)
NET CAPITAL EMPLOYED 757,929 775,778 785,970 808,645 816,645 824,808
NET FINANCIAL POSITION 359,708 351,976 349,938 341,645 317,957 287,535
Short term debt 140,691 113,178 156,800 140,000 110,000 90,000
Long term debt 264,789 443,164 371,048 360,000 360,000 350,000
Other liquid assets 5,787 4,127 23,051 10,000 5,000 5,000
Cash 39,985 200,239 154,859 148,355 147,043 147,465
TOTAL SHAREHOLDER’S EQUITY 398,221 423,802 442,890 467,000 498,688 537,273
SOURCES OF FUNDS 757,929 775,778 785,970 808,645 816,645 824,808
Data and Charts

Source: Company data, Politecnico Estimates
2008 2009 2010 2011 E 2012 E 2013 ENet Sales 1,570,060 1,486,882 1,485,304 1,613,932 1,743,286 1,851,390
Reported Growth -7.2% -5.3% -0.1% 8.7% 8.0% 6.2%
Business Units
Two Wheeler Vehicles 1,180,666 1,065,417 988,015 1,063,383 1,154,554 1,224,789
Reported Growth -8.8% -9.8% -7.3% 7.6% 8.6% 6.1%
Commercial Vehicles 389,394 421,465 497,289 550,549 588,732 626,600
Reported Growth 2.4% 8.2% 18.0% 10.7% 6.9% 6.4%
Geographical Area
Europe and America 1,280,932 1,116,191 963,253 1,008,187 1,038,362 1,060,882
Reported Growth -8.6% -12.9% -13.7% 4.7% 3.0% 2.2%
India 243,972 286,753 388,890 448,934 527,477 590,348
Reported Growth 2.5% 17.5% 35.6% 15.4% 17.5% 11.9%
ASEAN 45,156 83,938 133,161 156,810 177,447 188,000
Reported Growth -13.2% 85.9% 58.6% 17.8% 13.2% 5.9%
Other operating income 133,474 135,938 121,128 130,728 134,233 140,706
Cost for materials (936,603) (871,653) (881,075) (963,517) (1,040,742) (1,107,131)
Cost for services (292,920) (272,065) (258,358) (279,210) (294,615) (307,331)
Employee costs (250,967) (242,916) (240,115) (251,773) (256,263) (262,897)
Other operating costs (33,993) (35,387) (29,821) (32,279) (36,609) (38,879)
EBITDA 189,051 200,799 197,063 217,881 249,290 275,857 EBITDA margin 12.04% 13.50% 13.27% 13.50% 14.30% 14.90%
D&A 94,540 96,378 86,006 94,560 101,459 103,261
% Capex 91.85% 102.76% 89.50% 93.00% 97.00% 97.00%
EBIT 94,511 104,421 111,057 123,321 147,831 172,596 EBIT margin 6.02% 7.02% 7.48% 7.64% 8.48% 9.32%
Financial charges (41,288) (33,275) (33,905) (32,725) (32,548) (31,570)
% Tot Financial Liabilities 10.18% 5.98% 6.42% 6.55% 6.93% 7.18%
Other Financials 6,410 2,947 6,625 3,000 3,000 3,000
Earnings before tax 59,633 74,093 83,777 93,596 118,283 144,026 Taxation for the period 16,302 26,674 40,983 41,182 50,862 61,931
Actual tax rate (%) 27.34% 36.00% 48.92% 44.00% 43.00% 43.00%
Consolidated net income 43,331 47,419 42,794 52,413 67,421 82,095 Profit margin 2.76% 3.19% 2.88% 3.25% 3.87% 4.43%
Minority Shareholders 330 1,388 30 262 337 410
Earnings per share (€) 0.11 0.116 0.115 0.14 0.18 0.22 Avg. number of Ordinary Shares 396,041 396,041 371,793 371,793 371,793 371,793
Dividend per share (€) 0.06 0.07 0.07 0.08 0.10 0.12 Earnings paid as dividends 22,120 25,795 26,000 28,303 35,733 43,510
Payout Ratio 51% 56% 61% 54% 53% 53%
Income Statement
Data and Charts

Source: Politecnico Estimates
Data and Charts
Cash Flow Statement IndiaINDIA 2011 E 2012 E 2013 E 2014 E 2015 E
LCV volumes (units) 243,756 258,381 271,817 285,408 299,393
LCV ARPU (€) 1,842 1,910 1,977 2,036 2,097
2w volumes (units) 50,000 75,000 95,000 110,000
2w ARPU (€) 680 707 735 765
Sales from India 448,934 527,477 590,348 650,970 712,000
% tot sales 27.82% 30.26% 31.89% 33.38% 34.71%
% growth 15.44% 17.50% 11.92% 10.27% 9.38%
EBITDA from India 87,542 102,331 114,528 124,986 134,568
EBITDA margin India 19.50% 19.40% 19.40% 19.20% 18.90%
D&A India 22,877 24,580 25,017 25,206 25,309
% Capex India 90.00% 94.00% 94.00% 94.00% 94.00%
EBIT from India 64,665 77,750 89,511 99,780 109,259
EBIT margin India 14.40% 14.74% 15.16% 15.33% 15.35%
Tax Rate India 42.00% 42.00% 42.00% 42.00% 42.00%
Op. Tax India 27,159 32,655 37,594 41,908 45,889
Adj. Op. Tax India 34,713 40,725 47,069 52,582 57,556
Adj. Tax Rate India 53.68% 52.38% 52.58% 52.70% 52.68%
D&A India 22,877 24,580 25,017 25,206 25,309
Change in NWC India (4,363) (2,262) (2,265) (1,005) (84)
Cash Flow From Indian Operations 48,466 59,343 65,194 71,399 76,928
Capex India 25,419 26,149 26,614 26,815 26,924
% Capex 25.00% 25.00% 25.00% 25.00% 25.00%
FCFF India 23,046 33,194 38,580 44,585 50,004
% growth 44.03% 16.23% 15.56% 12.15%
Data and Charts

Source: Politecnico Estimates
Data and Charts
Cash Flow Statement Europe and USEUROPE and US 2011 E 2012 E 2013 E 2014 E 2015 E
2W volumes (units) 352,275 362,843 370,100 373,801 377,539
2W ARPU (€) 2,573 2,599 2,625 2,651 2,678
LCV volumes (units) 13,165 12,560 11,982 11,431 10,905
LCV ARPU (€) 7,718 7,584 7,452 7,323 7,195
Sales from Europe and US 1,008,187 1,038,362 1,060,882 1,074,822 1,089,504
% tot sales 62.47% 59.56% 57.30% 55.11% 53.11%
% growth 4.66% 2.99% 2.17% 1.31% 1.37%
EBITDA from Europe and US 98,802 110,066 119,880 121,455 123,114
EBITDA margin Europe and US 9.80% 10.60% 11.30% 11.30% 11.30%
D&A Europe and US 61,007 63,386 64,512 64,999 65,264
% Capex Europe and US 100.00% 101.00% 101.00% 101.00% 101.00%
EBIT from Europe and US 37,796 46,680 55,368 56,456 57,850
EBIT margin Europe and US 3.75% 4.50% 5.22% 5.25% 5.31%
Tax Rate Europe and US 30.00% 30.00% 30.00% 30.00% 30.00%
Op. Tax Europe and US 11,339 14,004 16,610 16,937 17,355
Adj. Op. Tax Europe and US 15,754 18,849 22,471 22,976 23,532
Adj. Tax Rate Europe and US 41.68% 40.38% 40.58% 40.70% 40.68%
D&A Europe and US 61,007 63,386 64,512 64,999 65,264
Change in NWC Europe and US (3,265) (869) (811) (231) (20)
Cash Flow From EU Operations 79,783 90,348 96,597 98,248 99,562
Capex Europe 61,007 62,758 63,873 64,356 64,618
% Capex 60.00% 60.00% 60.00% 60.00% 60.00%
FCFF Europe 18,777 27,590 32,725 33,892 34,943
% growth 17.54% 12.71% 5.53% 1.42%
Data and Charts
Source: Politecnico Estimates
Data and Charts
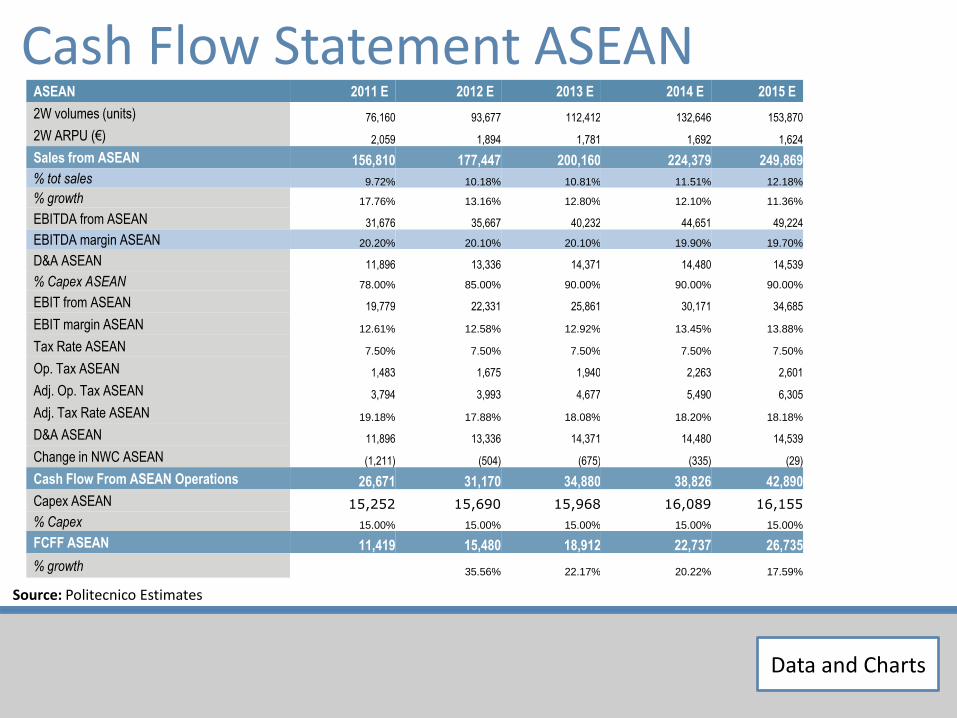
Cash Flow Statement ASEANASEAN 2011 E 2012 E 2013 E 2014 E 2015 E
2W volumes (units) 76,160 93,677 112,412 132,646 153,870
2W ARPU (€) 2,059 1,894 1,781 1,692 1,624
Sales from ASEAN 156,810 177,447 200,160 224,379 249,869
% tot sales 9.72% 10.18% 10.81% 11.51% 12.18%
% growth 17.76% 13.16% 12.80% 12.10% 11.36%
EBITDA from ASEAN 31,676 35,667 40,232 44,651 49,224
EBITDA margin ASEAN 20.20% 20.10% 20.10% 19.90% 19.70%
D&A ASEAN 11,896 13,336 14,371 14,480 14,539
% Capex ASEAN 78.00% 85.00% 90.00% 90.00% 90.00%
EBIT from ASEAN 19,779 22,331 25,861 30,171 34,685
EBIT margin ASEAN 12.61% 12.58% 12.92% 13.45% 13.88%
Tax Rate ASEAN 7.50% 7.50% 7.50% 7.50% 7.50%
Op. Tax ASEAN 1,483 1,675 1,940 2,263 2,601
Adj. Op. Tax ASEAN 3,794 3,993 4,677 5,490 6,305
Adj. Tax Rate ASEAN 19.18% 17.88% 18.08% 18.20% 18.18%
D&A ASEAN 11,896 13,336 14,371 14,480 14,539
Change in NWC ASEAN (1,211) (504) (675) (335) (29)
Cash Flow From ASEAN Operations 26,671 31,170 34,880 38,826 42,890
Capex ASEAN 15,252 15,690 15,968 16,089 16,155
% Capex 15.00% 15.00% 15.00% 15.00% 15.00%
FCFF ASEAN 11,419 15,480 18,912 22,737 26,735
% growth 35.56% 22.17% 20.22% 17.59%
Data and Charts
Source: Company data, Politecnico Estimates
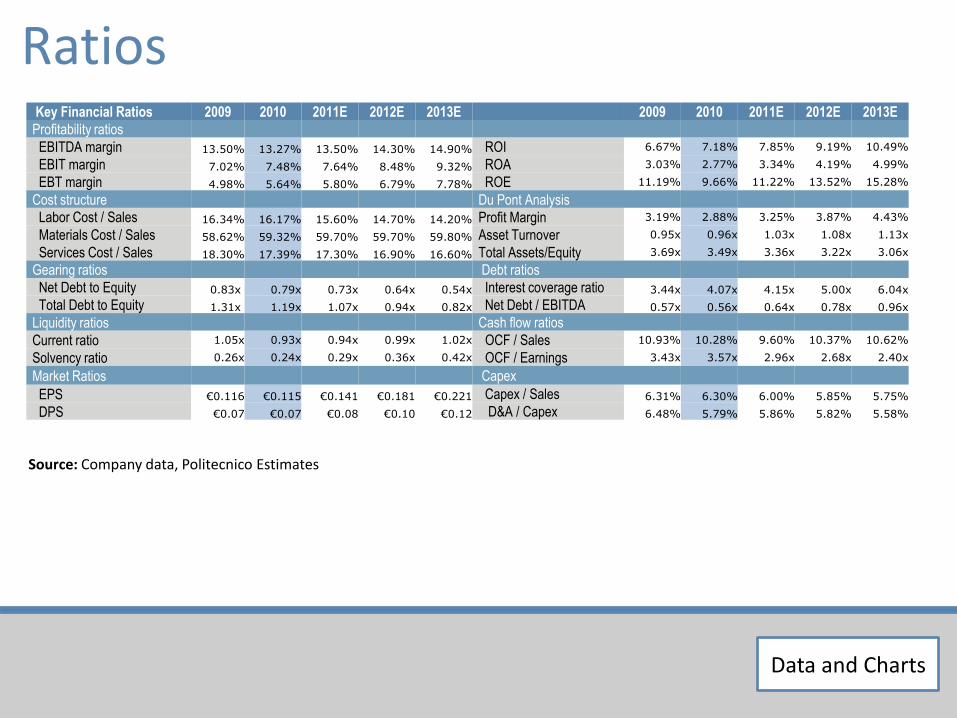
RatiosKey Financial Ratios 2009 2010 2011E 2012E 2013E 2009 2010 2011E 2012E 2013E
Profitability ratios
EBITDA margin 13.50% 13.27% 13.50% 14.30% 14.90% ROI 6.67% 7.18% 7.85% 9.19% 10.49%
EBIT margin 7.02% 7.48% 7.64% 8.48% 9.32% ROA 3.03% 2.77% 3.34% 4.19% 4.99%
EBT margin 4.98% 5.64% 5.80% 6.79% 7.78% ROE 11.19% 9.66% 11.22% 13.52% 15.28%
Cost structure Du Pont Analysis
Labor Cost / Sales 16.34% 16.17% 15.60% 14.70% 14.20% Profit Margin 3.19% 2.88% 3.25% 3.87% 4.43%
Materials Cost / Sales 58.62% 59.32% 59.70% 59.70% 59.80% Asset Turnover 0.95x 0.96x 1.03x 1.08x 1.13x
Services Cost / Sales 18.30% 17.39% 17.30% 16.90% 16.60% Total Assets/Equity 3.69x 3.49x 3.36x 3.22x 3.06x
Gearing ratios Debt ratios
Net Debt to Equity 0.83x 0.79x 0.73x 0.64x 0.54x Interest coverage ratio 3.44x 4.07x 4.15x 5.00x 6.04x
Total Debt to Equity 1.31x 1.19x 1.07x 0.94x 0.82x Net Debt / EBITDA 0.57x 0.56x 0.64x 0.78x 0.96x
Liquidity ratios Cash flow ratios
Current ratio 1.05x 0.93x 0.94x 0.99x 1.02x OCF / Sales 10.93% 10.28% 9.60% 10.37% 10.62%
Solvency ratio 0.26x 0.24x 0.29x 0.36x 0.42x OCF / Earnings 3.43x 3.57x 2.96x 2.68x 2.40x
Market Ratios Capex
EPS €0.116 €0.115 €0.141 €0.181 €0.221 Capex / Sales 6.31% 6.30% 6.00% 5.85% 5.75%
DPS €0.07 €0.07 €0.08 €0.10 €0.12 D&A / Capex 6.48% 5.79% 5.86% 5.82% 5.58%
Data and Charts

Source: Starmine Smart Income Statements, Politecnico Estimates
ROE Piaggio and its competitors
Expectations and Du Pont analysis
Yamaha Suzuki Honda Piaggio Harley Mahindra Tata Bajaj Hero
2010 (2.0%) 3.6% 6.4% 9.7% 12% 31.9% 35.6% N.A. 61.4%
2011E 2.4% 5.4% 12.1% 11.2% 22.9% 28.2% 57.2% 66.8% 48.8%
ROE Earnings / EBT EBT / EBIT EBIT / Sales Sales / Assets Assets/ Equity
2010 9.66% 0.51 0.75 0.075 0.96 3.49
2011E 11.22% 0.56 0.76 0.076 1.03 3.36
2012E 13.52% 0.57 0.80 0.085 1.08 3.22
2013E 15.28% 0.57 0.83 0.093 1.13 3.06
Source: Politecnico Estimates
TaxBurden
Interest Burden
EbitMargin
AssetTurnover
Leverage(Proxy)
Data and Charts

Debt Structure
Maturity
Data and Charts

Altman Z-Score
Time series of Piaggio’s Z-Score Competitors’ Z-score (2010)
Source: Bloomberg
Automotive players Indian PlayersExpectation
Data and Charts

Assumptions on Macro Scenario
Raising interest rates Raising Cost of DebtRaising commodities’prices Raising Cost of Materials
Global recovery stronger in EMs than in DMs Increasing revenues from EMs
∆=5.5%∆=4.5%
Source: Politecnico Estimates, www.economywatch.com Source: Bank or America Estimates , Politecnico Estimates
Data and Charts
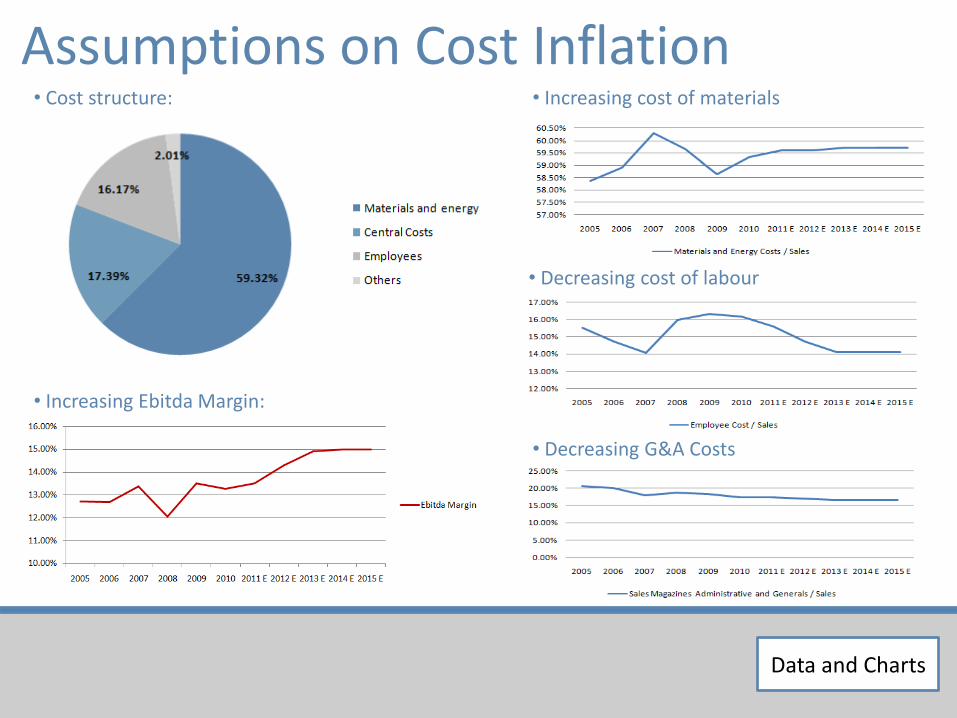
Assumptions on Cost Inflation
• Decreasing cost of labour
• Increasing cost of materials
• Decreasing G&A Costs
• Cost structure:
• Increasing Ebitda Margin:
Data and Charts

Terminal Value
Two-Stage model Three-Stage model Analytical Period + Perpetuity
Ability of the company to generate cash flow
• Convergence Stage: Exponential Decay of FCFF Growth Rates
• Perpetuity: Long Term FCFF Growth Rate = 0.5%
• Sum-of-the-Parts Approach:
High Medium Low
Strongly developing 3-5% 2-3% 0-1%
Moderately developing 1.5 - 2.5% 1-2% 0%
Stable 0-1% 0% 0%
Decadent 0% 0% 0%
Industry
Source: Guatri (1998)
Analytical Period + Convergence Stage + Perpetuity
+
Source: Politecnico Estimates
Data and Charts
XXX
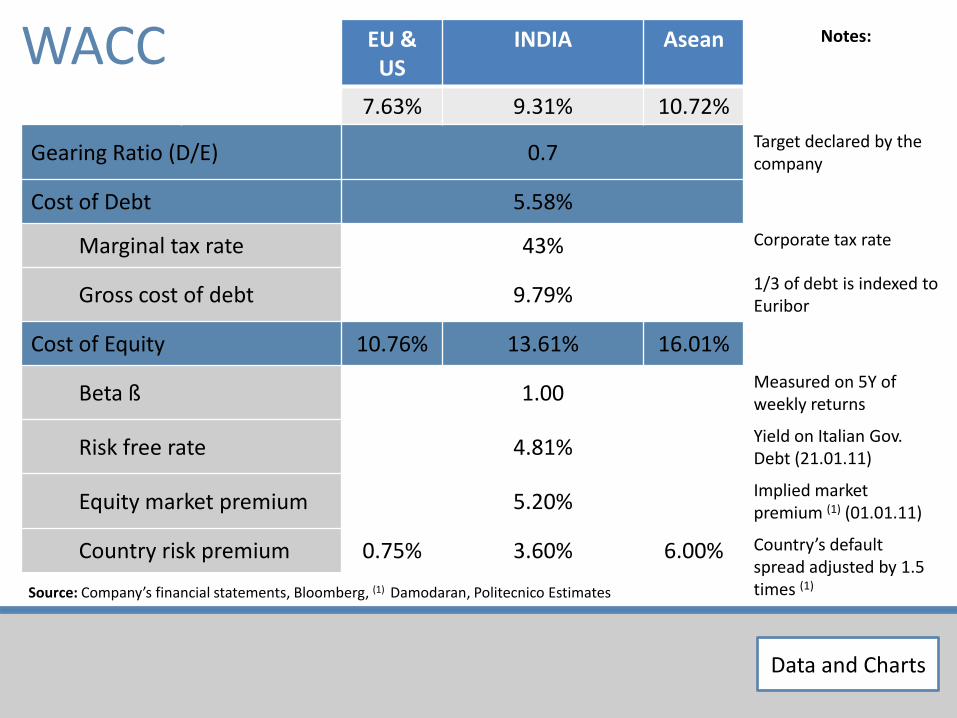
Source: Company’s financial statements, Bloomberg, (1) Damodaran, Politecnico Estimates
• NWC Historical evolution
EU & US
INDIA Asean Notes:
7.63% 9.31% 10.72%
Gearing Ratio (D/E) 0.7Target declared by the company
Cost of Debt 5.58%
Marginal tax rate 43% Corporate tax rate
Gross cost of debt 9.79%1/3 of debt is indexed to Euribor
Cost of Equity 10.76% 13.61% 16.01%
Beta ß 1.00Measured on 5Y of weekly returns
Risk free rate 4.81%Yield on Italian Gov. Debt (21.01.11)
Equity market premium 5.20%Implied market premium (1) (01.01.11)
Country risk premium 0.75% 3.60% 6.00% Country’s default spread adjusted by 1.5 times (1)
WACC
Data and Charts
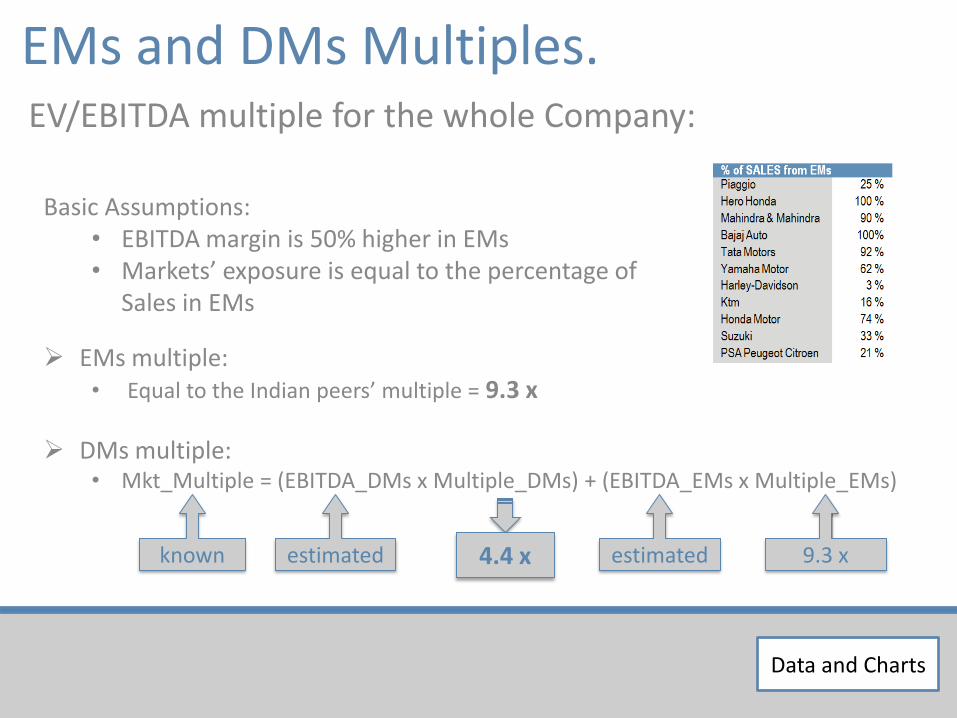
Basic Assumptions:• EBITDA margin is 50% higher in EMs• Markets’ exposure is equal to the percentage of
Sales in EMs
EV/EBITDA multiple for the whole Company:
EMs multiple:• Equal to the Indian peers’ multiple = 9.3 x
DMs multiple:• Mkt_Multiple = (EBITDA_DMs x Multiple_DMs) + (EBITDA_EMs x Multiple_EMs)
known estimated estimated 9.3 x4.4 x
EMs and DMs Multiples.
Data and Charts

Data and Charts
Piaggio's currentmarket multiple
MedianHero
HondaMahindra & Mahindra
BajajAuto
Tata Motors
Yamaha Motor
Harley-Davidson
KtmAG
Honda Motor
SuzukiPeugeot Citroen
EV/EBITDA 2011E median = 9.3 2011E median = 7.2
2011E 5.75 8.31 10.6 8.1 11.1 5.5 5.5 13.2 9.4 8.5 3.5 5.8
2012E 5.10 6.51 9.5 N/A 10.3 4.7 4.8 10.7 N/A 7.8 3.1 5.3
Price/Earnings 2011E median = 12.9 2011E median = 16.1
2011E 16.7 13.04 12.8 13.1 14.8 8.0 13.0 19.2 35.3 11.6 18.7 5.9
2011E (1) 13.92 12.8 13.1 14.8 - 13.0 19.2 35.3 - - -
2012E 13.3 10.89 11.5 11.4 12.9 6.6 10.2 15.3 24.5 10.2 15.8 4.3
Price/Book Value2011E 1.93 2.65 4.9 2.9 7.1 2.9 1.5 3.9 2.4 1.3 1.1 0.5
2011E (1) 3.39 4.9 2.9 7.1 - 1.5 3.9 2.4 - - -
2012E 1.81 2.10 4.0 N/A 5.1 2.1 1.3 4.3 2.1 1.1 1.0 0.4
Piaggio MedianHero
HondaMahindra & Mahindra
BajajAuto
Tata Motors
Yamaha Motor
Harley-Davidson
KtmAG
Honda Motor
SuzukiPeugeot Citroen
Sales’ CAGR 2008-11E 4.1% -1% 14% 17% 21% 20% -3% -6% -4% -3% -3% 1%
EBITDA margin (2) 13.5% 12% 15% 18% 20% 13% 8% 23% 12% 11% 9% 9%
EBITDA growth (3) 10.0% 11% 9.5% 12.1% 16.7% 26.4% 18.6% 32.2% 8.2% 7.7% 9.7% 3.5%
EBIT margin (2) 8.0% 8% 14% 15% 20% 10% 5% 17% 5% 6% 4% 3%
Profit margin (2) 3.2% 6% 12.1% 8.9% 15.0% 6.5% 2.5% 8.8% 2.1% 5.5% 1.9% 1.9%
EPS growth (3)
15.2 % 21% 9.7% 13.0% 21.8% 32.9% 20.4% 119.4%-
11.5% 11.5% 25.7% 24.4%
Leverage (D/E) 0.4 0.3 0.0 0.2 0.0 0.4 0.2 0.5 0.3 0.5 0.0 3.5
(1) no automotive peers(2) 2010-11E Average(3) 2011E
Piaggio and its peers (CY 2011E):Global playersIndian based players
Source: Bloomberg, Politecnico Estimates (03.25.2011)
Data and Charts

25.8
8.5
7.1
19.2
16.7
19.2
0.0
5.0
10.0
15.0
20.0
25.0
30.0 forward P/E ratio
Historical P/E:
Average: 15.7
Source: Bloomberg, Politecnico Estimates (03.25.2011)
Data and Charts

0.18
0.15
0.11 0.12 0.12
0.14
0.18
0.22
0.25
0.27
0.03
0.06 0.06 0.07 0.07
0.08
0.10
0.12 0.13
0.14
2006 2007 2008 2009 2010 2011 E 2012 E 2013 E 2014 E 2015 E
Earnings per share (figures in €)
Dividend per share (figures in €)
XXX
Source: Bloomberg, Politecnico Estimates (03.25.2011)
(1) FTM P/E ratio
EPS P/E (1)
2010 € 0.12 20.1
2011 E € 0.14 16.7
2012 E € 0.18 13.3
2013 E € 0.22 11.0
2014 E € 0.25 9.8
2015 E € 0.27 9.3
P/E future evolution:CAGR EPS
PEG ratio
2010-13E 24.5% 0.68
2010-15E 18.3% 0.91
2006-10 -14.4%
Data and Charts
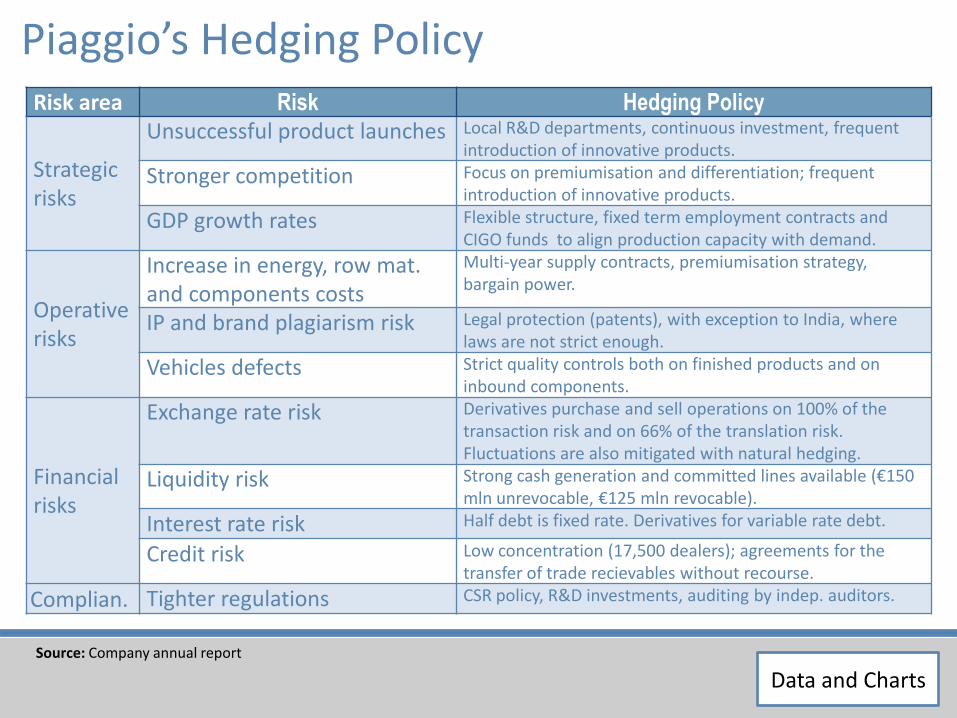
Piaggio’s Hedging PolicyRisk area Risk Hedging Policy
Strategicrisks
Unsuccessful product launches Local R&D departments, continuous investment, frequentintroduction of innovative products.
Stronger competition Focus on premiumisation and differentiation; frequentintroduction of innovative products.
GDP growth rates Flexible structure, fixed term employment contracts and CIGO funds to align production capacity with demand.
Operative risks
Increase in energy, row mat. and components costs
Multi-year supply contracts, premiumisation strategy, bargain power.
IP and brand plagiarism risk Legal protection (patents), with exception to India, wherelaws are not strict enough.
Vehicles defects Strict quality controls both on finished products and on inbound components.
Financial risks
Exchange rate risk Derivatives purchase and sell operations on 100% of the transaction risk and on 66% of the translation risk. Fluctuations are also mitigated with natural hedging.
Liquidity risk Strong cash generation and committed lines available (€150mln unrevocable, €125 mln revocable).
Interest rate risk Half debt is fixed rate. Derivatives for variable rate debt.
Credit risk Low concentration (17,500 dealers); agreements for the transfer of trade recievables without recourse.
Complian. Tighter regulations CSR policy, R&D investments, auditing by indep. auditors.
Data and ChartsSource: Company annual report

42.5%
32.4%
12.0%
6.7%6.4%
Rubber
Steel
Crude oil
Aluminium
Others
Data and Charts
Costs breakdown
59.3%
17.4%
16.2%
2.0%
Materials and energy
Central costs
Employees
Others
Data and Charts
Source: Company data, Politecnico estimates

0.020.040.060.080.0
100.0120.0140.0160.0180.0
Sep
-06
Jan
-07
May
-07
Sep
-07
Jan
-08
May
-08
Sep
-08
Jan
-09
May
-09
Sep
-09
Jan
-10
May
-10
Sep
-10
Jan
-11
USD/bbl USD/tonCrude oil Aluminium
4000
3500
3000
2500
2000
1500
Data and Charts
Oil price impact on Rubber and Alluminium
0.020.040.060.080.0
100.0120.0140.0160.0180.0
Sep
-06
Jan
-07
May
-07
Sep
-07
Jan
-08
May
-08
Sep
-08
Jan
-09
May
-09
Sep
-09
Jan
-10
May
-10
Sep
-10
Jan
-11
USD/bbl USD/kgCrude oil Rubber
Crude oil and Rubber priceRUBBER ALLUM.
Actual price 5,5 USD/kg 2.600 USD/ton
Correlationindex withoil price
91% (strong) 83% (strong)
Rationale More than 75% of synteticrubber raw materials are derived on petroleum.
Alluminiumproduction is energy intensive
Price increseestimation
+0.5 $/kg foreach +10 $/bbloil increase
+300 $/ton for each +10 $/bbl oil increase
Source: World Bank Community price data
Crude oil and Aluminium price
Data and Charts

Sensitivity on Oil PriceRESULTS: KEY DRIVERS TO PROTECT EPS:
EPS
2011 E 2012 E
CR
UD
EO
IL P
RIC
E ($
/BB
L)
70.0 €0.186 €0.192
80.0 €0.171 €0.181
90.0 €0.156 €0.163
100.0
(base case)€0.141 €0.141
110.0 €0.141 €0.136
120.0 €0.135 €0.129
130.0 €0.130 €0.119
140.0 €0.125 €0.109
Oil Oil , Rubber, Alluminium
Data and Charts
Bargaining power: Improving Global Sourcing
Pricing power:Premiumization
SUPPLIERS CUSTOMERS
Source: Politecnico estimates

Sensitivity on Indian Business
16.9% 17.4% 17.9% 18.4% 18.9% 19.4% 19.9% 20.4% 20.9%
4.4% €2.52 €2.55 €2.58 €2.61 €2.65 €2.68 €2.72 €2.75 €2.79
4.8% €2.54 €2.57 €2.61 €2.64 €2.68 €2.71 €2.75 €2.78 €2.82
5.2% €2.57 €2.60 €2.64 €2.67 €2.71 €2.74 €2.78 €2.82 €2.85
5.6% €2.59 €2.63 €2.66 €2.70 €2.74 €2.77 €2.81 €2.85 €2.89
6.0% €2.62 €2.66 €2.69 €2.73 €2.77 €2.80 €2.84 €2.88 €2.92
6.4% €2.65 €2.68 €2.72 €2.76 €2.80 €2.84 €2.88 €2.92 €2.96
6.8% €2.68 €2.71 €2.75 €2.79 €2.83 €2.87 €2.91 €2.95 €2.99
7.2% €2.70 €2.74 €2.78 €2.82 €2.86 €2.90 €2.94 €2.99 €3.03
7.6% €2.73 €2.77 €2.81 €2.85 €2.89 €2.94 €2.98 €3.02 €3.06
8.0% €2.76 €2.80 €2.85 €2.89 €2.93 €2.97 €3.01 €3.06 €3.10
8.4% €2.79 €2.84 €2.88 €2.92 €2.96 €3.01 €3.05 €3.10 €3.14
Indian 2015 Ebitda Margin
Indian LCV Volume CAGR 10-15
According to our DCF, Indian business is worth €1.3
Data and Charts
Data and Charts
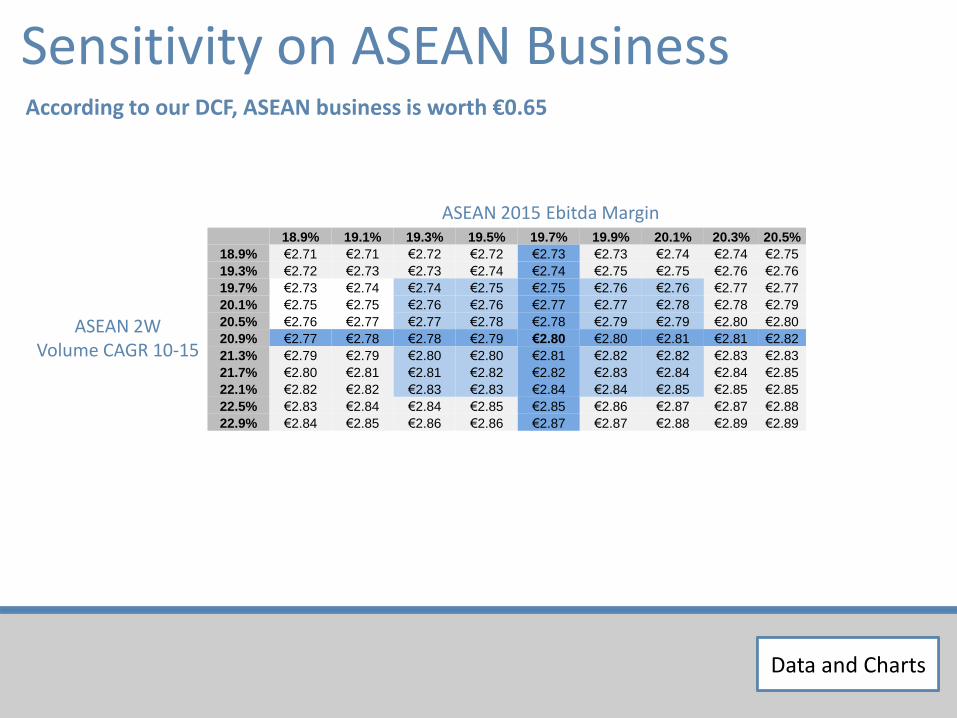
Sensitivity on ASEAN BusinessAccording to our DCF, ASEAN business is worth €0.65
18.9% 19.1% 19.3% 19.5% 19.7% 19.9% 20.1% 20.3% 20.5%
18.9% €2.71 €2.71 €2.72 €2.72 €2.73 €2.73 €2.74 €2.74 €2.75
19.3% €2.72 €2.73 €2.73 €2.74 €2.74 €2.75 €2.75 €2.76 €2.76
19.7% €2.73 €2.74 €2.74 €2.75 €2.75 €2.76 €2.76 €2.77 €2.77
20.1% €2.75 €2.75 €2.76 €2.76 €2.77 €2.77 €2.78 €2.78 €2.79
20.5% €2.76 €2.77 €2.77 €2.78 €2.78 €2.79 €2.79 €2.80 €2.80
20.9% €2.77 €2.78 €2.78 €2.79 €2.80 €2.80 €2.81 €2.81 €2.82
21.3% €2.79 €2.79 €2.80 €2.80 €2.81 €2.82 €2.82 €2.83 €2.83
21.7% €2.80 €2.81 €2.81 €2.82 €2.82 €2.83 €2.84 €2.84 €2.85
22.1% €2.82 €2.82 €2.83 €2.83 €2.84 €2.84 €2.85 €2.85 €2.85
22.5% €2.83 €2.84 €2.84 €2.85 €2.85 €2.86 €2.87 €2.87 €2.88
22.9% €2.84 €2.85 €2.86 €2.86 €2.87 €2.87 €2.88 €2.89 €2.89
ASEAN 2015 Ebitda Margin
ASEAN 2W Volume CAGR 10-15
Data and Charts

Data and Charts
Sensitivity on European BusinessAccording to our DCF, European business is worth €0.95
10.5% 10.7% 10.9% 11.1% 11.3% 11.5% 11.7% 11.9% 12.1%
0.4% €2.63 €2.65 €2.67 €2.69 €2.71 €2.73 €2.74 €2.76 €2.78
0.8% €2.65 €2.67 €2.69 €2.71 €2.72 €2.74 €2.76 €2.78 €2.80
1.2% €2.67 €2.68 €2.70 €2.72 €2.74 €2.76 €2.78 €2.80 €2.82
1.6% €2.68 €2.70 €2.72 €2.74 €2.76 €2.78 €2.80 €2.82 €2.84
2.0% €2.70 €2.72 €2.74 €2.76 €2.78 €2.80 €2.82 €2.84 €2.86
2.4% €2.72 €2.74 €2.76 €2.78 €2.80 €2.82 €2.84 €2.86 €2.88
2.8% €2.73 €2.75 €2.78 €2.80 €2.82 €2.84 €2.86 €2.88 €2.90
3.2% €2.75 €2.77 €2.79 €2.82 €2.84 €2.86 €2.88 €2.90 €2.93
3.6% €2.77 €2.79 €2.81 €2.84 €2.86 €2.88 €2.90 €2.92 €2.95
4.0% €2.79 €2.81 €2.83 €2.86 €2.88 €2.90 €2.92 €2.95 €2.97
4.4% €2.81 €2.83 €2.85 €2.88 €2.90 €2.92 €2.95 €2.97 €2.99
European 2015 Ebitda Margin
European 2W Volume CAGR 10-15
Data and Charts
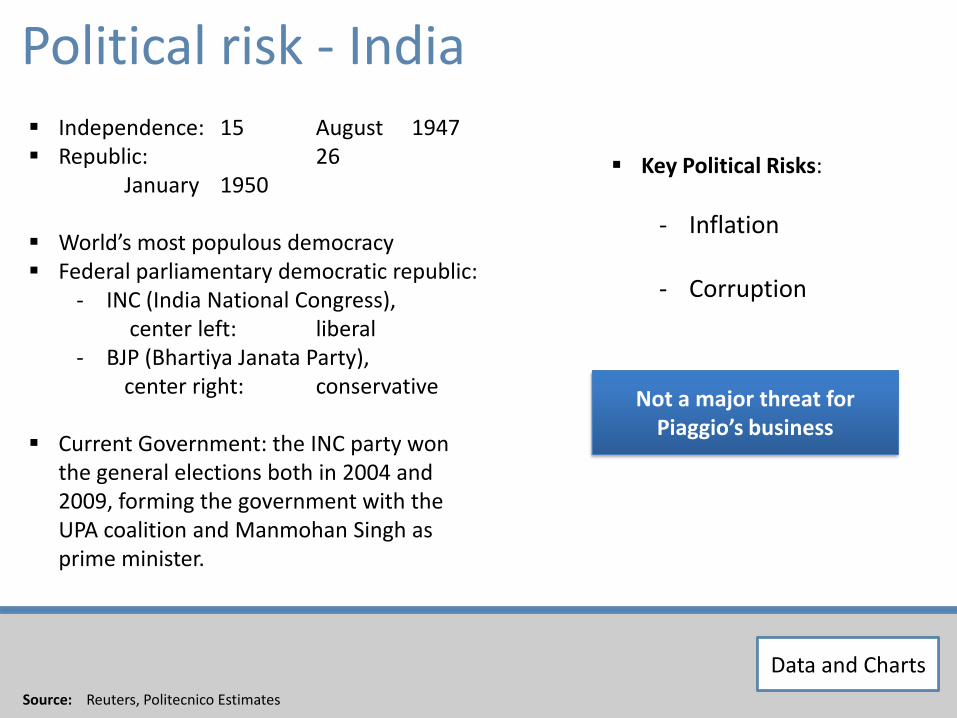
Independence: 15 August 1947 Republic: 26
January 1950
World’s most populous democracy Federal parliamentary democratic republic:
- INC (India National Congress),center left: liberal
- BJP (Bhartiya Janata Party), center right: conservative
Current Government: the INC party won the general elections both in 2004 and 2009, forming the government with the UPA coalition and Manmohan Singh as prime minister.
XXX
Not a major threat for Piaggio’s business
Data and Charts
Political risk - India
Source: Reuters, Politecnico Estimates
Key Political Risks:
- Inflation
- Corruption
Data and Charts

Euromoney Country Risk Score (March 2011):
XXXData and Charts
Political risk - India
Source: Reuters, Politecnico Estimates
Data and Charts

80
85
90
95
100
105
110 Piaggio
S&P500
NIKKEI 225Earthquake
4Q 2010 data release
Middle East turmoil
Data and Charts
The Japan’s earthquake:
: Peak of S&P500 02.18.2011
Bottom of Nikkei 03.15.2011
10 days later03.25.2011
Piaggio 2.31 2.41 ( + 4.3%) 2.51 ( + 8.7%)
S&P500 1,343.01 1,281.87 ( - 4.6%) 1,316.11 ( - 2.0%)
Nikkei225 10,857.53 8,605.15 ( - 20.7%) 9,536.13 ( - 12.2%)
Source: Bloomberg, Politecnico Estimates
Data and Charts

XXXData and Charts
Source: krugman.blogs.nytimes.com
How rising interest rates affect share prices:
“If fears of default were driving rates, a rise in
interest rates should be associated with a fall in stock prices. If, on the other hand, rates rise
because people think the US will emerge from the
liquidity trap sooner, stocks and rates should move in the same direction. And here’s what it looks like: It’s all about economic
optimism.”
Data and Charts

Data and Charts
Montecarlo SimulationASSUMPTIONS:
Risk Business Unit Drawn Variable Distribution Std. Dev. Comment
GDP growth rate India LCV YoY volumes growth (%) Inverted Lognormal 1% Unexpected Indian slowdown
India 2W “ Inverted Lognormal 5% “
Europe 2W “ Lognormal 1% Unexpected European recovery
Europe LCV “ Normal 0.5% Structural decline
ASEAN 2W “ Inverted Lognormal 2% Unexpected ASEAN slowdown
Success of new models India LCV Volumes (units) Normal 6000 units
India 2W “ Normal 4000 units
ASEAN 2W “ Normal 5000 units
Stronger Competition India EBITDA Margin (%) Inverted Lognormal 1%
Europe “ Inverted Lognormal 0.5%
ASEAN “ Inverted Lognormal 1%
Exchange Rate Volatility India EBIT (€) Normal 3.5% EBIT 3.5% is the avg yearly INR std dev
ASEAN “ Normal 4.5% EBIT 4.5% is the avg yearly VND std dev
Legend:
Upside risk Lognormal
Downside risk Inverted Lognormal
Data and Charts
Data and Charts
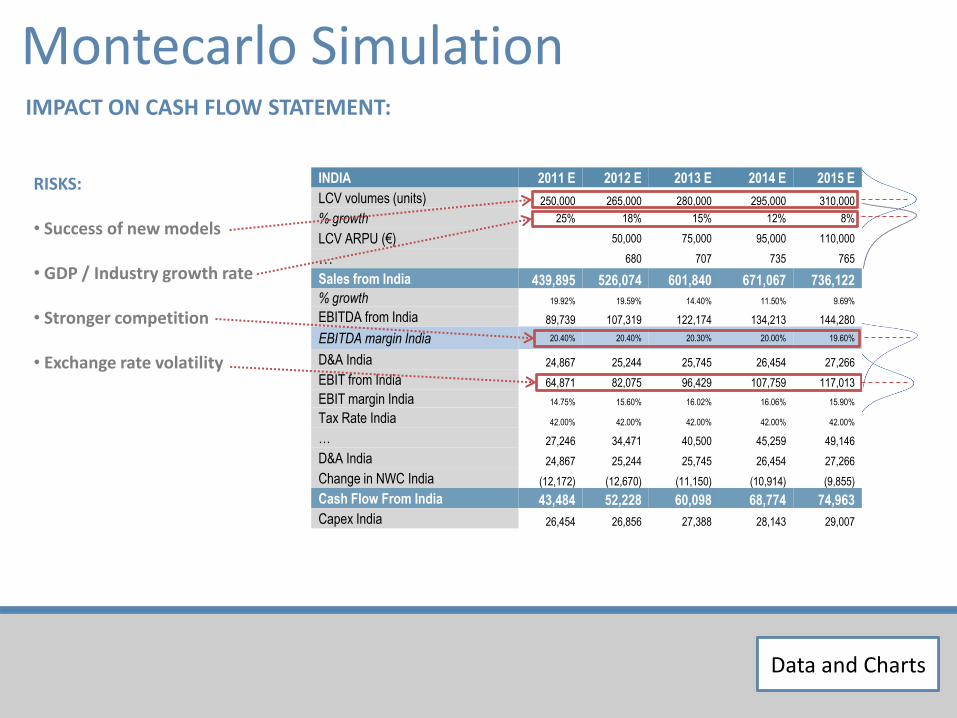
Montecarlo SimulationIMPACT ON CASH FLOW STATEMENT:
INDIA 2011 E 2012 E 2013 E 2014 E 2015 E
LCV volumes (units) 250,000 265,000 280,000 295,000 310,000
% growth 25% 18% 15% 12% 8%
LCV ARPU (€) 50,000 75,000 95,000 110,000
… 680 707 735 765
Sales from India 439,895 526,074 601,840 671,067 736,122
% growth 19.92% 19.59% 14.40% 11.50% 9.69%
EBITDA from India 89,739 107,319 122,174 134,213 144,280
EBITDA margin India 20.40% 20.40% 20.30% 20.00% 19.60%
D&A India 24,867 25,244 25,745 26,454 27,266
EBIT from India 64,871 82,075 96,429 107,759 117,013
EBIT margin India 14.75% 15.60% 16.02% 16.06% 15.90%
Tax Rate India 42.00% 42.00% 42.00% 42.00% 42.00%
… 27,246 34,471 40,500 45,259 49,146
D&A India 24,867 25,244 25,745 26,454 27,266
Change in NWC India (12,172) (12,670) (11,150) (10,914) (9,855)
Cash Flow From India 43,484 52,228 60,098 68,774 74,963
Capex India 26,454 26,856 27,388 28,143 29,007
RISKS:
• Success of new models
• GDP / Industry growth rate
• Stronger competition
• Exchange rate volatility
Data and Charts

Data and Charts
Montecarlo SimulationRESULTS:
• Target price volatility:
• Geographical breakdown:
ASEAN EUROPE + US INDIA
Piaggio India Europe ASEAN
TP DCF €2.90 €1.30 €0.95 €0.65
Std. Dev. €0.055 €0.029 €0.019 €0.025
CV 1.9% 2.26% 2% 3.67%
Data and Charts

Data and Charts
Comply Does not comply
Independence of the board of directors:
4 of 11 members are independent.
Internal Control Committee: Composed
of independent directors, convenes at least
5 times per year.
Appointment Proposals Committee: The
majority of members are non executives,
and there is a transparent procedure for
the presentation of candidate lists.
Financial disclosure and transparency:
Piaggio follows COSO Reporting guidelines.
Internal Control Supervisor: Tight relationship
between the Company and Immsi Audit S.c.ar.l. CEO undermines auditors’ autonomy.
Independence of Chairman: Chairman and
CEO are not separate.
Board of Directors members’ maximum
offices in other companies: Board has not
established a limit to the number of offices
directors can cover in other companies.
Remuneration Committee: The attendance of
the CEO by invitation creates a conflict of
interest.
Source: Politecnico Estimates
Corporate Governance Snapshot
Data and Charts

Data and Charts
Name Position In office from
Indep. % attendance
Otheroffices
Roberto Colaninno ChairmanCEO
04/16/2009 100 7
Matteo Colaninno DeputyChairman
04/16/2009 100 3
Michele Colaninno Director 04/16/2009 100 9
Livio Corghi Director 04/16/2009 100 5
Franco Debenedetti Director 04/16/2009 X 91 5
Daniele Discepolo Director 04/16/2009 X 100 9
Andrea Paroli Director 22/09/2010 - -
Giorgio Magnoni Director 04/16/2009 73 1
Luca Crespi Director 04/16/2009 X 91 5
Riccardo Varaldo Director 04/16/2009 X 82 2
Vito Varvaro Director 04/16/2009 90 2
Source: Piaggio’s 2009 CG Report
Composition of the Board of Directors
Data and Charts

Data and Charts
CG and CSR Valuation
Piaggio’s CG and CSR are under control, with improvement margins
Data and Charts
Data and Charts
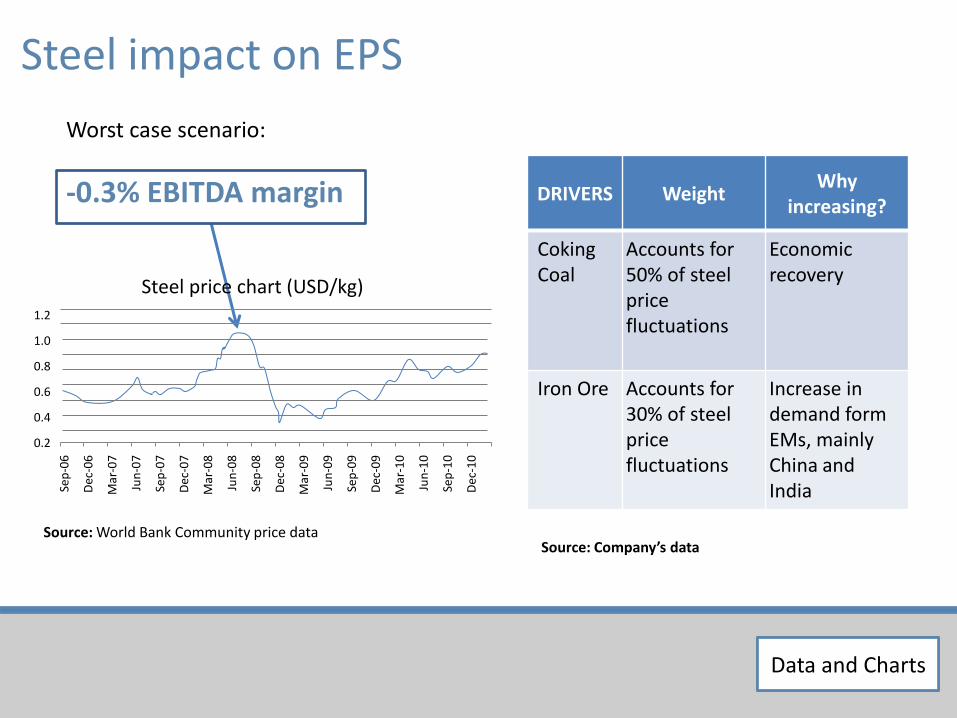
Steel impact on EPSSe
p-0
6
Dec
-06
Mar
-07
Jun
-07
Sep
-07
Dec
-07
Mar
-08
Jun
-08
Sep
-08
Dec
-08
Mar
-09
Jun
-09
Sep
-09
Dec
-09
Mar
-10
Jun
-10
Sep
-10
Dec
-10
1.2
1.0
0.8
0.6
0.4
0.2
Steel price chart (USD/kg)
Source: World Bank Community price data
Data and Charts
DRIVERS WeightWhy
increasing?
Coking Coal
Accounts for 50% of steel price fluctuations
Economic recovery
Iron Ore Accounts for 30% of steel price fluctuations
Increase in demand form EMs, mainly China and India
Source: Company’s data
Worst case scenario:
-0.3% EBITDA margin

Data and ChartsData and Charts
India and Vietnam nominal GDP growth rates
0.00%
5.00%
10.00%
15.00%
20.00%
25.00%
2009 2010 2011 2012 2015
India Nominal GDP growth (%) Vietnam Nominal GDP growth (%)
Source: IMF, World Economic Outlook Database
India Vietnam
EMs nominal GDP growth rates(2011-2015)
12.29% CAGR
14.00% CAGR
Piaggio’s top line growthrate (‘11-’15)
12.86% CAGR*
13.41% CAGR*
(ASEAN)
*Source: Politecnico estimates
GDP growth rates in EMs