
1 Explicit Memory Schemes for Evolutionary Algorithms in ...

Automatic vs. Explicit Memory Management:Settling the Performance Debate
Matthew Hertz and Emery D. BergerDept. of Computer ScienceUniversity of Massachusetts
Amherst, MA 01003
{hertz,emery}@cs.umass.edu
ABSTRACTWhile garbage collection’s software engineering benefits are indis-putable, its performance impact remains controversial. Garbagecollection proponents argue that its benefits outweigh its costs, butit is widely believed that garbage collection imposes an unaccept-ably high runtime and space performance penalty. This paper aimsto settle this debate. We present the first empirical comparison ofthe performance costs of automatic versus explicit memory man-agement in a garbage-collected language. Using a tracing and sim-ulation based oracular memory manager, we execute unaltered Javaprograms as if they used explicit memory management. We exam-ine the runtime, space consumption and virtual memory footprintof Java benchmarks across a range of general-purpose allocatorsand both copying and non-copying garbage collectors. We showthat, at large heap sizes and under no memory pressure, the runtimeperformance of some garbage collection algorithms is competitivewith the Lea memory allocator and occasionally outperforms it byup to 4%. However, our results confirm that garbage collection re-quires six times the physical memory to achieve this performanceand suffers order-of-magnitude performance penalties when pagingoccurs.
1. IntroductionAutomatic memory management, or garbage collection, providessignificant software engineering benefits over explicit memory man-agement. Garbage collection frees the programmer from the bur-den of memory management and improves modularity, while pre-venting accidental memory overwrites (“dangling pointers”) andsecurity violations [36, 45]. However, garbage collectors must per-form more work than explicit memory managers, which rely onthe programmer to indicate when to deallocate individual objects.Garbage collectors, on the other hand, must periodically identifyobjects reachable by pointer traversal, and reclaim those that areunreachable (the garbage).
Previous researchers have measured the runtime performanceand space impact of conservative, non-moving garbage collection1
in C and C++ programs [17, 48]. For these programs, comparing
1In particular, the Boehm-Demers-Weiser collector [13].
Permission to make digital or hard copies of all or part of this work forpersonal or classroom use is granted without fee provided that copies arenot made or distributed for profit or commercial advantage and that copiesbear this notice and the full citation on the first page. To copy otherwise, torepublish, to post on servers or to redistribute to lists, requires prior specificpermission and/or a fee.Submitted to OOPSLA 2004, Vancouver, BC, Canada.Copyright 2004 ACM 1-11111-111-1/11/1111 ..$5.00
the performance of explicit memory management to that of a suit-able garbage collector is a simple matter of linking with the garbagecollection library.
Unfortunately, measuring the performance trade-off of garbagecollection in languages designed for garbage collection is not sostraightforward. One cannot simply replace garbage collection withan explicit memory manager. Since programs written in these lan-guages never explicitly deallocate objects, the result would be arapid exhaustion of available memory. While one can measure thecosts of garbage collection itself [18, 25, 29, 42], because garbagecollection alters application behavior both by visiting and reorga-nizing memory, it is impossible to subtract out its effects [9]. Ex-trapolating the results of previous studies is inadequate because gar-bage collected languages typically permit the use of precise, copy-ing garbage collectors. These collectors, especially generationalvariants, consistently outperform conservative non-relocating gar-bage collectors [9, 12]. The result is that while the software engi-neering benefits of garbage collection are indisputable, in the ab-sence of empirical data, its performance impact remains a matterof religious debate.
In this paper, we aim to settle this debate. We conduct whatwe believe to be the first direct comparison of garbage collectionto explicit memory management in a garbage-collected language.Our key insight is the following. We use exact object reachabilitytraces [27, 28] as an oracle to indicate when objects should be deal-located. By implementing this oracle inside a detailed architecturalsimulator, we can execute and precisely measure unaltered Javaapplications as if they were written using explicit memory man-agement.
We use this oracular memory management framework to mea-sure the impact of garbage collection versus explicit memory man-agement on runtime performance, cache-level and page-level local-ity. We perform these measurements across a wide range of bench-marks, five garbage collectors (including copying and non-copyingcollectors), and two explicit memory managers (the Kingsley andLea (GNU libc) allocators [34, 46]). Our framework allows us touse the actual C implementations of these explicit memory man-agers.
We find that at large heap sizes, the Appel-style generational col-lector [5] consistently provides runtime performance that is com-petitive with explicit memory management, performing on aver-age just 4% slower and occasionally outperforming it by up to 4%.However, this runtime performance requires over six times as muchphysical memory as a program using explicit memory manage-ment. We also find that explicit memory management has substan-tially better page-level locality, generally requiring half or fewerpages to run with the same number of page faults.

We believe these results will have a significant impact both onthe acceptance of garbage collection and on the direction of futurememory management research. While we show that little opportu-nity remains to improve throughput when memory is plentiful, ourresults demonstrate a substantial performance gap both in terms ofspace consumption and page-level locality.
The remainder of this paper is organized as follows. We dis-cuss related work in Section 2. We present our oracular memorymanagement framework in detail in Section 3. In Section 4, wediscuss our experimental methodology and we report performanceand space results across different garbage collectors, and explicitmemory managers in Section 5. We discuss planned future workin Section 6 and conclude in Section 7 with a discussion of theimplications of these results.
2. Related WorkIn this section, we first illustrate the conventional wisdom on thistopic, and then discuss the key areas of related work: direct mea-surement of garbage collection and of explicit memory manage-ment, comparisons of conservative garbage collection to explicitmemory management in C and C++, and compile-time garbage col-lection.
2.1 Conventional wisdom
The view that explicit memory management provides superior per-formance to garbage collection is widespread. The reasons thatauthors generally cite for this advantage are cache locality and run-time overhead (including unpredictable pause times), rather thanspace overhead or page-level locality. Linus Torvalds pungentlyasserts that garbage collection has especially deleterious effects oncache locality: “there just aren’t all that many worse ways to [ex-pletive deleted] up your cache behaviour than by using lots of al-locations and lazy GC to manage your memory”, adding that “GCsucks donkey brains through a straw from a performance stand-point” [41]. Dan Sugalski, the architect of the Perl 6 interpreter,states that garbage collection will be beaten “by a manual trackingsystem’s best case performance”, although he believes that GC is“normally more cache friendly” [39]. The Wikipedia entry “Com-parison of Java to C Plus Plus” argues that a disadvantage of Java isthat “automatic garbage collection and mandatory virtual membersmake Java performance unsuitable for some applications” [44]. Inhis book Inside the Java Virtual Machine, Venners states that “apotential disadvantage of a garbage-collected heap is that it adds anoverhead that can affect program performance”, and that “[garbagecollection] will likely require more CPU time than would have beenrequired if the program explicitly freed unnecessary memory” [43].We show here that the conventional wisdom expressed above islargely inaccurate.
2.2 Garbage collection measurements
Researchers have long appreciated that garbage collection can ac-count for a significant fraction of program execution, and there areseveral studies that attempt to measure its cost. Ungar [42] andSteele [25] observed garbage collection overheads in LISP account-ing for around 30% of application runtime. Using trace-driven sim-ulations of six SML/NJ benchmarks, Tarditi et al. concluded thatgenerational garbage collection accounts for 19% to 46% of appli-cation runtime [18].
Recent research has focused on using garbage collection to im-prove application performance. Wilson, Lam and Moher exploitthe relocation phase of garbage collection to reorder data to im-prove page-level locality [47]. Chilimbi and Larus use on-line ref-erence behavior to guide the reorganization of objects for improvedcache-level locality [15], and Adl-Tabatabai et al. use a combina-
tion of a hardware performance monitoring unit, static analysis,and garbage collection to inject prefetches into program code [2].A comparison of explicit memory management with such strategiesis beyond the scope of this paper, but our results suggest that theseapproaches will lead garbage collection to consistently outperformexplicit memory management.
2.3 Explicit memory management measurements
Many researchers have examined the cost of explicit memory man-agers, starting with Knuth’s simulation-based study [32]. Korn andVo compare a number of different explicit memory management al-gorithms and find that buddy allocation was consistently the fastestand most space-efficient [33]. Zorn examines the impact of dif-ferent memory managers and a conservative garbage collector onruntime performance, memory consumption, and reference local-ity [48]; we discuss this work in Section 2.4. Johnstone and Wil-son measure the space consumed by several conventional explicitmemory managers and find that they yielded nearly zero fragmen-tation, or wasted memory beyond that induced by object headersand alignment restrictions [31]. They also conclude that the Leaallocator is the best overall allocator in terms of the combinationof speed and memory usage. Berger et al. measure the runtimeand space consumption of a range of benchmarks when using theLea and Kingsley allocators as well as their counterparts writtenin the Heap Layers framework [7], and subsequently measure thetime spent in memory operations for a range of benchmarks [8].They find that programs using general purpose memory managerscan spend up to 13% of program runtime in memory operations. Aswe show here, this apparently lower cost does not necessarily trans-late to improved runtime performance when compared to copyinggarbage collection.
2.4 Comparisons with conservative garbage collection
Previous comparisons of garbage collection to explicit memory man-agement have understandably taken place in the context of conser-vative, non-relocating garbage collectors and C and C++. In histhesis, Detlefs compared the performance of garbage collection toexplicit memory management for three C++ programs [17, p.47].He found that garbage collection generally resulted in poorer per-formance (from 2% to 28% overhead), but also that the garbage-collected version of cfront performed 10% faster than a versionmodified to use general-purpose memory allocation exclusively.However, the garbage collected version still ran 16% slower thanthe original version of cfront using its custom memory allocators.
Zorn performed a direct empirical comparison of the cost of con-servative garbage collection to explicit memory management inthe context of C programs [48]. He found that the runtime per-formance of code using conservative garbage collection (specifi-cally, the Boehm-Demers-Weiser collector [13]) was occasionallyfaster than explicit memory allocation. Moreover, the memory con-sumed by the BDW collector was almost always higher than thatconsumed by explicit memory managers, ranging from 21% lessto 228% more. While these prior studies examine conservativegarbage collectors running within C and C++ programs, our re-search focuses on the performance of code written from the outsetto use garbage collection. We are thus able to examine the impactof precise copying garbage collectors, which typically have higherthroughput than non-relocating garbage collectors [9].
2.5 Compile-time garbage collection
The goal of compile-time garbage collection is to avoid garbagecollection altogether. The idea is to employ static analyses to de-termine when it is safe to deallocate objects, and to insert explicitdeallocation calls at the appropriate point in the program. This line

����
������ ��
�������
��� �����������������
� ����������
no cost below here
execute program here
Figure 1: An overview of our oracular memory managementframework. Using exact object reachability tracing and de-tailed architectural simulation allows us to quantify the perfor-mance of unaltered Java programs with automatic and explicitmemory management.
of research dates back to Barth’s description how a compiler couldeliminate certain GC activities [6]. In addition to allowing us toevaluate the performance impact of garbage collection versus ex-plicit memory management, our work represents a limit study forcompile-time garbage collection. The oracular memory managerprecisely simulates the impact of a perfect compile-time garbagecollector, and so establishes the opportunity for performance im-provement and space reduction available to compile-time garbagecollection.
3. Oracular Memory ManagementFigure 1 presents an overview of our oracular memory manage-ment framework. The framework consists of three parts: a lightly-modified Java virtual machine, exact object reachability traces, anda detailed architectural simulator.
3.1 The VM
For the Java virtual machine, we use the Jikes RVM, version 2.0.3,configured to target AIX and produce PowerPC code [3, 4]. Jikesis a widely-used research platform (formerly known as Jalapeno)that is written almost entirely in Java. A key advantage of Jikesis that it allows us to use a number of garbage collection algo-rithms, including those built using the University of MassachusettsGarbage Collection Toolkit (GCTk). These include classical algo-rithms such as semispace and an Appel-style generational collec-tor [5], as well as recent garbage collectors such as Beltway [11]and Mark-Copy [35]. We also use the mark-sweep collector dis-tributed with Jikes.
To provide predictable runs, we use the “ Fast” configuration ofJikes. This configuration optimizes as much of the system as pos-sible and compiles it into a prebuilt virtual machine. In addition, ituses the optimizing compiler on all code at runtime. While Java vir-tual machines normally use an adaptive system that only optimizes“ hot” methods, previous work has shown that this skews resultsfor short running programs [19]. To ensure reproducibility, we usedeterministic thread switching, which switches threads based uponthe number of methods executed.
3.2 The Oracle
To decide when to free objects without performing garbage collec-tion, we need an oracle to inform us when these objects becomeunreachable. The oracle in this case is the exact object reachabilitythat the Merlin algorithm provides [27, 28]. Merlin efficiently andprecisely computes object reachability information by timestamp-ing objects with the last time that they were known to be reachable.Our extended version of DSS generates traces that we subsequentlyuse to compute exact object lifetimes with an offline implementa-
allocation
time
live dead
reachable
��������������
����
����������������������
unreachable
Figure 2: The lifetime of an object, showing when an explicitmemory manager or an automatic memory manager might re-claim it. The oracular memory manager frees the object justbefore it becomes unreachable, which is the last possible timean explicit memory manager could free it.
tion of the Merlin algorithm. For each object allocated, we com-pute exactly when (in allocation time) is last reachable. We runeach benchmark twice, first to generate the trace we post-processand use as our oracle, and then to simulate explicit memory man-agement.
Immediately before allocating a new object, the oracular mem-ory manager frees any object that has just become unreachable, asFigure 2 shows. This policy is theoretically a worst-case approxi-mation of explicit memory management, because the last possiblemoment that a program using explicit memory management candeallocate an object is just before it becomes unreachable. In prac-tice, however, it is an excellent approximation. Programs often visiteach object in a linked data structure before deallocating it. Shahamet al. measure the average impact of inserting null assignments inJava code, simulating nearly-perfect placement of “ explicit deallo-cations” [37]. Their study includes five of the SPECjvm98 bench-marks we examine here. They report an average difference in spaceconsumption of just 15% over deallocating objects when they be-come unreachable, showing that the policy of freeing objects whenthey become unreachable is close to the best achievable by a pro-grammer.
3.3 The Simulator
Executing the oracle inside a Java virtual machine would distortprogram runtimes and space consumption. Object lifetime tracesare quite large (several gigabytes), and the cost of processing thesetraces would dominate execution time. Therefore, we need a methodof obtaining the information that the oracle provides at zero cost.
We accomplish this by executing the program on top of a simula-tor and placing the oracle code and processing inside the simulator.We use the Dynamic SimpleScalar detailed architectural simula-tor [30]. Dynamic SimpleScalar, or DSS, is an extension of theSimpleScalar superscalar architectural simulator [14] that permitsthe use of dynamically-generated code, a requirement for simulat-ing the Jikes RVM. DSS executes the application and measures var-ious performance characteristics including cycle count and cachemiss rate. We branch into the simulator in order to execute theoracle with no measured cost, as we describe below.
3.4 Key Modifications
In order to create the oracular memory manager, we needed tomake a number of significant changes to the Jikes RVM and Dy-namic SimpleScalar. These modifications allow us to compute ob-ject reachability information, detect memory allocation operations,and insert explicit deallocation calls without distorting the simu-lated execution of the program.

Modifications to the Jikes RVM
We first need a number of modifications to compute object lifetimesusing the Merlin algorithm offline. This algorithm requires that wecapture all object allocations and intra-heap pointer updates as wellas the current program roots at each object allocation. A key diffi-culty is determining when allocations occur and where objects areallocated. This determination cannot be done through simple trickssuch as waiting for an allocation function to be executed, becausethe optimizing compiler inlines the allocation fast-path to improvesystem performance. Instead, we rely on minimal modification tothe Jikes compiler.
The Jikes RVM has intermediate representations that differenti-ate between method calls within the VM and calls to the host op-erating system. While Jikes uses these parallel IR representationsto minimize modifications needed to support OS calling conven-tions, we build upon this by adding a third set of nodes to representcalls to malloc. Our extension insures the compiler treats callsto malloc like any other function call, while also allowing us toemit a new, illegal opcode instead of the usual branch instruction.Because our new opcode is illegal, it cannot otherwise occur in anyprogram. This provides us with a unique method to identify whennew objects are allocated.
Replacing normal opcodes with illegal ones is at the heart ofour approach for non-intrusively generating the needed heap traces.As with calls to malloc, we modify the Jikes RVM to replaceintra-heap reference stores with other illegal instructions. Thesechanges enable detecting object allocations and intra-heap pointerupdates without inserting any trace-specific code. While this doesrequire modifications to Java code within Jikes, their only effectis the substitution of our illegal opcodes for the normal PowerPCcodes. Since we always use the simulator, our modified operationsare included both for runs using the garbage collector and for thoseusing the general-purpose allocators.
Modifications to DSS
The changes to Jikes described above required corresponding changesto DSS. These modifications generate the heap trace and insertfree calls. When using illegal opcodes, detecting the heap pointerupdates and object allocations is simple. We added code to the sim-ulator to emit the size and address of newly allocated objects uponreturning from a branch to malloc and to record the source andtarget of a pointer store instruction. Root references are also neededto accurately compute reachability information. We added to DSScode duplicating the Jikes RVM’s register, stack and static scan-ning code, but working within the simulated memory structures.The simulator scans and emits root references into the heap tracewithout affecting the running Java program. In sum, these modifi-cations allow us to generate the program heap trace without havingany apparent effect on the benchmark.
The final change needed to Dynamic SimpleScalar is to insertcalls to free when prompted by the oracle. We implement thisby one last manipulation to our new opcode calling malloc. Be-fore branching to the allocation function, we check if any objectsmust be freed. When jumping to malloc, our code caches thebranch instruction return address. After allocating the new objectwith malloc, the simulator jumps to this return address for exe-cution. By waiting for the simulator to execute this instruction, theaddress of the newly allocated object is discovered. When an ob-ject must be reclaimed before an allocation, we save the jump targetand replace it with the address of free. The simulator also stashesthe current function parameter and substitutes the previously savedaddress of the object to free. Finally, our branch is changed sothat, once finished, execution returns to the malloc call instruc-
�����������
��������
����
������ ��
�������
� ����������
������������ ���� ����������
�����������
����������
��� �����
no cost below here
execute program here
Figure 3: A detailed diagram of the oracular memory manage-ment framework. We first execute the Java program to mea-sure it and to collect traces, which we process with the Merlinanalysis to obtain exact object reachability information (“deathrecords”). We then execute the program again, this time replac-ing allocation by calls to malloc and invoking free on objectswhen they become unreachable.
Garbage collectorsAppel variable-sized nursery using two generations [5]Beltway generalized copying GC framework [11]Mark-Copy space-efficient copying using two generations [35]Mark-Sweep non-relocating, non-copying single-generationSemiSpace two-space single-generation
Explicit memory managersKingsley segregated fits [46]Lea approximate best-fit with coalescing [34]
Table 1: Garbage collectors and explicit memory managers ex-amined in this paper. All of the garbage collectors are copyingcollectors except Mark-Sweep.
tion. When the branch is again reached, the simulator checks ifmore frees are needed. While frees are needed, the register andreturn values are again hijacked and the needed objects released.Once there are no objects to be reclaimed, the original register andbranch target values are restored and allocation continues as nor-mal.
4. Experimental MethodologyWe compare the performance of 7 benchmarks across a varietyof garbage collectors and allocators. Table 2 presents our bench-marks, which are primarily drawn from the SPECjvm98 benchmarksuite [16]. We exclude two SPECjvm98 benchmarks, both of whichare ray-tracing applications that cannot run in our framework dueto limitations in the DSS floating point implementation. Ipsixql isa persistent XML database system from the University of Coloradobenchmark suite.
Table 1 lists the garbage collectors and explicit memory man-agers we analyze in this study. When using oracular memory man-agement, we used the Kingsley [46] and Lea [34] allocators as theexplicit memory managers.
The Kingsley allocator is a segregated fits allocator: all alloca-tion requests are rounded up to the nearest size class. This roundingcan lead to severe internal fragmentation (wasted space inside allo-cated objects), because in the worst case, it allocates twice as muchmemory as requested. Once an object is allocated for a given size,it can never be reused for another size: the allocator performs no

Benchmark statisticsBenchmark Total Bytes Alloc Max. Bytes Live Alloc/Live URL201 compress 174,617,204 8,793,452 19.86 http://www.specbench.org/osg/jvm98202 jess 432,237,544 5,442,552 79.42 ibid209 db 151,308,296 10,677,544 14.17 ibid213 javac 521,763,424 11,802,216 44.21 ibid222 mpegaudio 102,667,248 4,382,192 23.43 ibid228 jack 480,765,676 5,327,612 90.24 ibid
ipsixql 128,955,804 4,485,088 28.75 http://systems.cs.colorado.edu/colorado bench
Table 2: Memory usage statistics for our benchmark suite.
splitting (breaking large objects into smaller ones) or coalescing(combining adjacent free objects). This algorithm is well known tobe among the fastest memory allocators although it is among theworst in terms of fragmentation [31].
We modified the Kinglsey allocator to make it suitable for use inthe context of Java. In its original form, the Kingsley allocator usespower of two size classes. This choice results in catastrophic inter-nal fragmentation for Java applications. We modified the allocatorto include exact size classes for every multiple of four bytes up to64 bytes, and then use powers of two for larger objects.
The Lea allocator is an approximate best-fit allocator that pro-vides both high speed and low memory consumption. It forms thebasis of the memory allocator included in the GNU C library [23].The current version (2.7.2) is a hybrid allocator with different be-havior based on object size. Small objects (less than 64 bytes) areallocated using exact-size quicklists (one linked list of freed objectsfor each multiple of 8 bytes). Requests for a medium-sized object(less than 128K) and certain other events trigger the Lea allocatorto coalesce all of the objects in these quicklists in the hope thatthis reclaimed space can be reused for the medium-sized object.For medium-sized objects, the Lea allocator performs immediatecoalescing and spliting and approximates best-fit. Large objectsare allocated and freed using mmap. The Lea allocator is the bestoverall allocator (in terms of the combination of speed and memoryusage) of which we are aware [31].
We compare the performance of explicit memory managementto a number of copying garbage collectors: SemiSpace [20], anAppel-style generational collector [5], Beltway [11], and Mark-Copy [35]. We use the versions of these collectors as implementedin the GCTk memory management framework2. We also use onenon-copying collector, the Mark-Sweep collector included with theJikes distribution. Space does not permit a full description of eachof these garbage collectors, but Table 1 sums up their key charac-teristics.
5. Experimental ResultsWe run each benchmark and garbage collector combination withheaps ranging from the smallest heap size needed by the collectorto a heap six times larger. We base our memory configuration on thePowerPC G5 processor [1], and assume a 2 GHz clock. We use a4K page size, as in Linux and Windows. When accounting for thecost of page faults, we assume an aggressive 5 millisecond pagefault service time. Table 3 presents the architectural parameters weuse in this study.
2GCTk has been superseded by the MMTk (formerly JMTk)toolkit [10], but at the time of this writing, it was not possible touse MMTk in our framework.
Memory hierarchyL1, I-cache 32K, 2-way associative, 3 cycle latencyL1, D-cache 64K, direct-mapped, 3 cycle latencyL2 (unified) 512K, 8-way associative, 11 cycle latency
All caches have 128 byte linesMain memory
RAM 200 cycles (100ns)
Table 3: The architectural parameters used in this paper, basedon the PowerPC G5 microprocessor.
5.1 Runtime
Figure 5(a) shows the relative performance of the best garbage col-lection strategy to explicit memory management. Assuming nomemory pressure, garbage collection adds only 3% to the totalexecution time on average and improves the performance of jessby 4%. However, this figure assumes that one could select thefastest memory allocator and best collector configuration. Soman etal. present a dynamic selection mechanism for application-specificgarbage collection that might be useful here [38].
At the largest heap sizes, garbage collection performance variesdramatically between collectors. Mark-Sweep is slightly faster thenthe Lea allocator on javac and performs as well as the Kingsley al-locator on db. Mark-Sweep is also the fastest garbage collectoron mpegaudio, which performs relatively little allocation. Appelruns jess faster then any other memory manager. Beltway is thefastest garbage collector for ipsixql and compress, while Mark-Copy is fastest on jack. While at the largest heap sizes the Appeland Mark-Copy collectors run ipsixql 5% faster than the Lea allo-cator, at all other heap sizes, all garbage collectors increase runtimeby at least 9% over both explicit memory managers. When memorypressure is low and space is plentiful, explicit memory managementrarely shows a clear improvement over garbage collection.
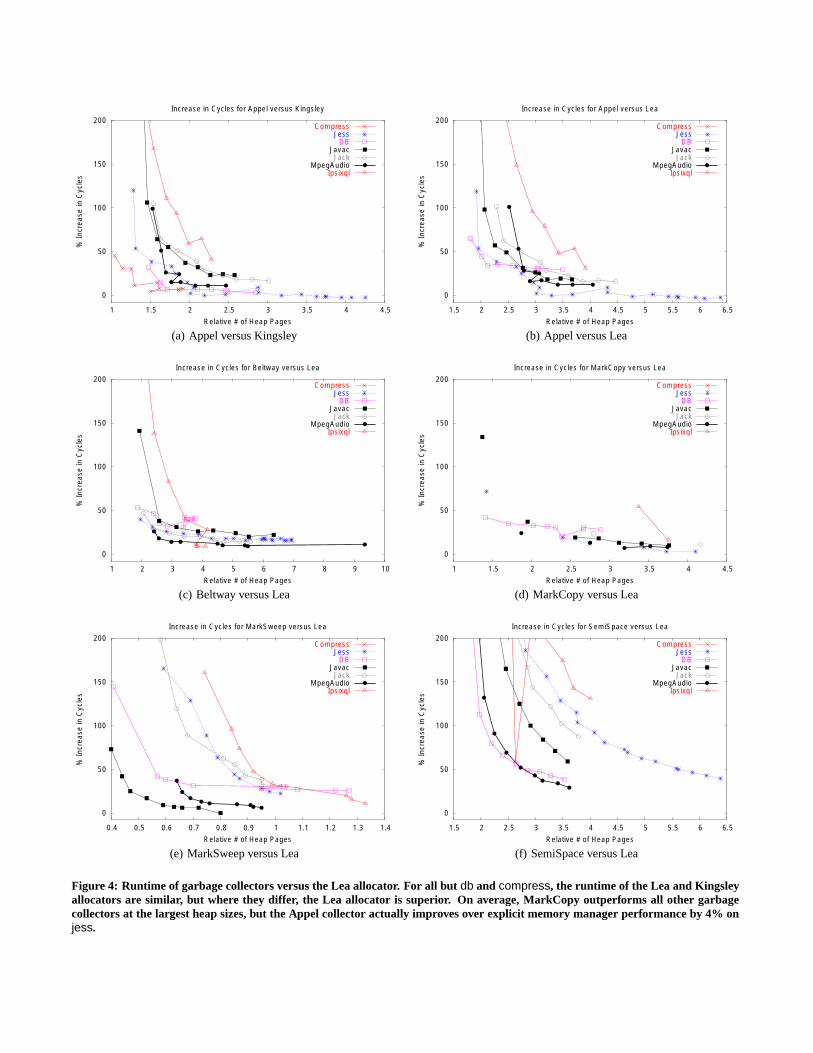
Figure 4 presents our runtime results across all garbage collec-tors and benchmarks. Each graph within this figure compares aparticular garbage collector and explicit memory manager. Pointsin the graph represent the number of heap pages (the x-axis) andruntime (y-axis) for the garbage collection algorithm relative tothe explicit memory manager. These graphs compactly summarizethese results and present the time-space tradeoff involved in usinggarbage collection.
Figure 4 focuses on the Lea allocator3. As these graphs show,even at the largest heap sizes, the Lea allocator is faster on aver-age then each GC algorithm. Figure 5(c) compares each collector’saverage performance versus the two memory allocators when con-
3compress triggers degenerate allocation behavior in the Lea allocator sowe do not include it within these averages.
0
50
100
150
200
1 1.5 2 2.5 3 3.5 4 4.5
% In
crea
se in
Cyc
les
Relative # of Heap Pages
Increase in Cycles for Appel versus Kingsley
CompressJess
DBJavac
JackMpegAudio
Ipsixql
(a) Appel versus Kingsley
0
50
100
150
200
1.5 2 2.5 3 3.5 4 4.5 5 5.5 6 6.5
% In
crea
se in
Cyc
les
Relative # of Heap Pages
Increase in Cycles for Appel versus Lea
CompressJess
DBJavac
JackMpegAudio
Ipsixql
(b) Appel versus Lea
0
50
100
150
200
1 2 3 4 5 6 7 8 9 10
% In
crea
se in
Cyc
les
Relative # of Heap Pages
Increase in Cycles for Beltway versus Lea
CompressJess
DBJavac
JackMpegAudio
Ipsixql
(c) Beltway versus Lea
0
50
100
150
200
1 1.5 2 2.5 3 3.5 4 4.5
% In
crea
se in
Cyc
les
Relative # of Heap Pages
Increase in Cycles for MarkCopy versus Lea
CompressJess
DBJavac
JackMpegAudio
Ipsixql
(d) MarkCopy versus Lea
0
50
100
150
200
0.4 0.5 0.6 0.7 0.8 0.9 1 1.1 1.2 1.3 1.4
% In
crea
se in
Cyc
les
Relative # of Heap Pages
Increase in Cycles for MarkSweep versus Lea
CompressJess
DBJavac
JackMpegAudio
Ipsixql
(e) MarkSweep versus Lea
0
50
100
150
200
1.5 2 2.5 3 3.5 4 4.5 5 5.5 6 6.5
% In
crea
se in
Cyc
les
Relative # of Heap Pages
Increase in Cycles for SemiSpace versus Lea
CompressJess
DBJavac
JackMpegAudio
Ipsixql
(f) SemiSpace versus Lea
Figure 4: Runtime of garbage collectors versus the Lea allocator. For all but db and compress, the runtime of the Lea and Kingsleyallocators are similar, but where they differ, the Lea allocator is superior. On average, MarkCopy outperforms all other garbagecollectors at the largest heap sizes, but the Appel collector actually improves over explicit memory manager performance by 4% onjess.

(a) Runtime performance of the best garbage collection versusthe best explicit memory management.
(b) Memory consumption of the smallest heap for garbage col-lection versus the least space needed for explicit memory man-agement.
(c) Average best runtime by garbage collector. (d) Average relative heap size for the best runtime at each bench-mark.
Figure 5: A summary of runtime and memory consumption results.
sidering only the collector’s best run on each benchmarks. At thelargest heap sizes, MarkCopy requires an average of 3% longer andAppel 4% longer than the Lea allocator to run our benchmarks.When we only consider heap sizes three times the collector’s min-imum required size, the results are quite different. MarkCopy nowimposes an average runtime overhead of 9% over the Lea alloca-tor, while Mark-Sweep and Appel add an average 10% and 17%runtime overhead, repectively. These results, however, are heavilyinfl uenced by db. This benchmark is very sensitive to cache per-formance and is the one benchmark where the Lea allocator showsbetter L1 D-cache locality then all the garbage collectors. Exclud-ing db, MarkCopy is 1% faster than the Lea allocator at the largestheap size only 5% slower than the Lea allocator at the smaller heapsizes. Relative to the Kingsley explicit memory manager, the Appelcollector runs only 2% slower and MarkCopy only 1% slower whenheap space is most plentiful. SemiSpace’s performance does helpexplain the concerns over garbage collection’s runtime. Even at thelargest heap size SemiSpace’s runtime is within 10% of that neededfor explicit memory manager for only compress and mpegaudio.On average, SemiSpace is over 20% slower than both allocatorswith the largest heaps heap six and imposes an over 60% runtimeoverhead with heaps three times the minimum size it needs. How-ever, SemiSpace is rarely, if ever, used in a production system and
its results should not be considered within any debate.
5.2 Memory consumption
While garbage collection execution time can compare favorably tothat of the explicit memory managers, memory consumption is aless favorable comparison. Figure 5(b) shows the smallest garbagecollected heap requires far less space then that of an explicit mem-ory managers. While copying collection consumes more memory,this space is often not significantly greater. This does not considerthe runtime increase required for garbage collection to maintainthese smallest heaps. Figure 5(d) shows the average memory con-sumption with the heap using the best runtime for each collector.
Mark-Sweep is the only garbage collector that performs wellwhile using less memory then either explicit memory manager.As Figure 5(d) shows, Mark-Sweep needs 4% less space then theKingsley allocator and, when limited to the smaller heap sizes, only5% more space then the Lea allocator. The Lea allocator allocatesin 8-byte increments. Because Java allocates a large number ofvery small objects, this results in substantial internal fragmenta-tion. More importantly, Mark-Sweep does not add the object head-ers that both explicit memory managers prefix to every allocation.
Every other garbage collector, when running at its fastest heapsize, needs at least three times as much memory as even the space-inefficient Kingsley allocator. Because our method of freeing ob-

-90
-80
-70
-60
-50
-40
-30
-20
-10
0
10
20
10 20 30 40 50 60 70 80 90
% C
hang
e in
Mis
s R
ate
Heap Size (in MB)
Change in DL1 Miss Rate for Javac
Appel vs. LeaAppel vs. KingsleyBeltway vs. LeaBeltway vs. KingsleySemiSpace vs. LeaSemiSpace vs. KingsleyMarkCopy vs. LeaMarkCopy vs. KingsleyMarkSweep vs. LeaMarkSweep vs. Kingsley
Figure 6: javac L1 D-cache miss rates.
-90
-80
-70
-60
-50
-40
-30
-20
-10
0
0 10 20 30 40 50 60 70 80
% C
hang
e in
Mis
s R
ate
Heap Size (in MB)
Change in DL1 Miss Rate for Jess
Appel vs. LeaAppel vs. Kingsley
Beltway vs. LeaBeltway vs. KingsleySemiSpace vs. Lea
SemiSpace vs. KingsleyMarkCopy vs. Lea
MarkCopy vs. KingsleyMarkSweep vs. Lea
MarkSweep vs. Kingsley
Figure 7: jess L1 D-cache miss rates.
jects also marks the earliest time a garbage collector can reclaiman object, some increase in memory consumption may not be sur-prising. However, the extent of this increase shows an area wheregarbage collection clearly needs improvement.
5.3 Cache performance
Figure 6 shows every run of javac using a copying collector had atleast a 30% lower miss rate to the L1 D-cache then the Kingsleyand Lea allocators. This improvement is highly correlated withcopying collections, which place linked objects close to each otherand generally reduce the space between live objects. Collectorscopying larger portions of the heap, like Appel and SemiSpace,have the lowest miss rates, while Mark-Sweep has the highest rate.For all but Mark-Sweep, locality is best when garbage collection ismost frequent, that is, at the smallest heap sizes.
Runs of jess show garbage collection improving the L1 D-cacherate even further. Figure 7 shows every run using garbage collec-tion improving the cache locality. This figure also shows how theimprovement to cache locality is tightly correlated to the fractionof the heap that can be moved with each collections. Only for runsof db does the Lea allocator consistently show a lower L1 D-cachemiss rate. Runs of this benchmark have very little opportunity to
0
200
400
600
800
1000
1200
1400
1600
5 10 15 20 25 30
% C
hang
e in
Mis
s R
ate
Heap Size (in MB)
Change in L2 Miss Rate for MpegAudio
Appel vs. LeaAppel vs. Kingsley
Beltway vs. LeaBeltway vs. KingsleySemiSpace vs. Lea
SemiSpace vs. KingsleyMarkCopy vs. Lea
MarkCopy vs. KingsleyMarkSweep vs. Lea
MarkSweep vs. Kingsley
Figure 8: mpegaudio L2 cache miss rates.
collect garbage and thereby relocate objects. Beltway, SemiSpaceand MarkSweep do improve the miss rate for the Kingsley allocatorwith db.
While garbage collection improves L1 cache locality, it hurts L2cache locality. Figure 8 compares L2 cache locality for runs ofmpegaudio, which is representative. Because the collector mustexamine a region far larger than the simulated L2 cache (512K),garbage collection increases the L2 miss rate. When garbage col-lections occur frequently, the L2 cache miss rate increases dramat-ically. Evidence for this is seen in the over 1500% increase for thesmallest heap size of MarkCopy. As heap sizes increase, the L2miss rates drop.
5.4 Page-level locality
We present the results of our page-level locality experiments in theform of miss curves. Assuming that the virtual memory managerobserves an LRU discipline, these graphs show the number of pagefaults occurring for every possible number of pages allocated to theprocess.
Figure 9 compares the miss curves for both explicit memorymanager versus an optimal garbage collector for each benchmark.The optimal garbage collector is one, given the benchmark andnumber of available memory pages, that selects the algorithm andheap size minimizing the number of page faults. Note that this heapsize is often pessimal with respect to runtime. The x-intercept forthese graphs corresponds to the smallest value for the maximumvirtual memory footprint for each process. Every graph in Figure 9shows the Lea and Kingsley allocators having smaller footprintsthen even this optimal garbage collector. Only in Figure 9(e) andFigure 9(f) are there garbage collectors with a footprint close tothat of the explicit memory managers. These graphs also show thatgarbage collection has worse page locality for almost every exper-iment we performed. Only towards the left edge of the graphs ofdb (Figure 9(b)) and javac (Figure 9(c)) are there instances wheregarbage collection limits the number of page faults.
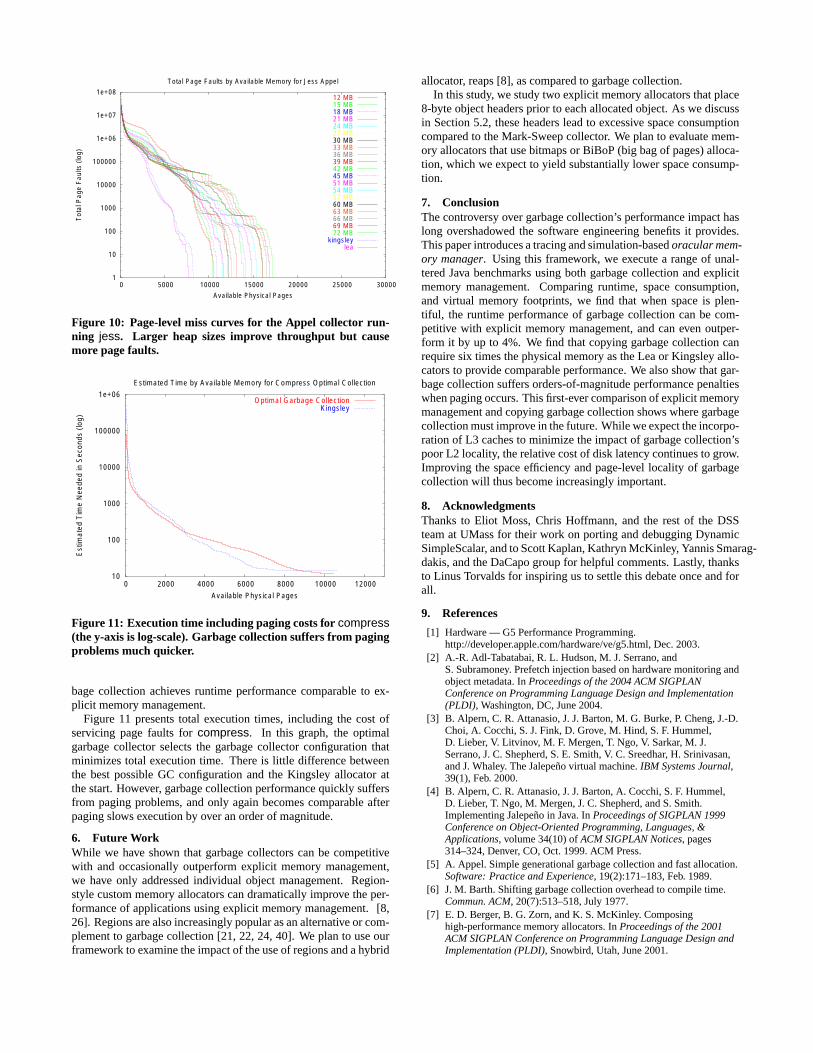
This analysis assumes that such an optimal garbage collectorexists. Figure 10 shows the miss curves for the Appel collectorrunning at a variety of heap sizes. As can be seen in this graph,the smallest footprint and number of page faults can often be seenin the smallest heap sizes. However, virtual memory footprint in-creases as heap sizes grow. Unfortunately, it is only at the largestheap sizes, and hence largest virtual memory footprints, that gar-

1
10
100
1000
10000
100000
1e+06
1e+07
1e+08
0 2000 4000 6000 8000 10000 12000
Tot
al P
age
Fau
lts (
log)
Available Physical Pages
Total Page Faults by Available Memory for Jess Optimal Collection
Optimal Garbage CollectionKingsley
Lea
(a) Jess
1
10
100
1000
10000
100000
1e+06
1e+07
1e+08
1e+09
0 2000 4000 6000 8000 10000 12000
Tot
al P
age
Fau
lts (
log)
Available Physical Pages
Total Page Faults by Available Memory for DB Optimal Collection
Optimal Garbage CollectionKingsley
Lea
(b) DB
1
10
100
1000
10000
100000
1e+06
1e+07
1e+08
1e+09
0 2000 4000 6000 8000 10000 12000
Tot
al P
age
Fau
lts (
log)
Available Physical Pages
Total Page Faults by Available Memory for Javac Optimal Collection
Optimal Garbage CollectionKingsley
Lea
(c) Javac
1
10
100
1000
10000
100000
1e+06
1e+07
1e+08
0 2000 4000 6000 8000 10000 12000
Tot
al P
age
Fau
lts (
log)
Available Physical Pages
Total Page Faults by Available Memory for Jack Optimal Collection
Optimal Garbage CollectionKingsley
Lea
(d) Jack
1
10
100
1000
10000
100000
1e+06
1e+07
1e+08
0 2000 4000 6000 8000 10000 12000
Tot
al P
age
Fau
lts (
log)
Available Physical Pages
Total Page Faults by Available Memory for MpegAudio Optimal Collection
Optimal Garbage CollectionKingsley
Lea
(e) Mpegaudio
1
10
100
1000
10000
100000
1e+06
1e+07
0 2000 4000 6000 8000 10000 12000
Tot
al P
age
Fau
lts (
log)
Available Physical Pages
Total Page Faults by Available Memory for Ipsixql Optimal Collection
Optimal Garbage CollectionKingsley
Lea
(f) Ipsixql
Figure 9: Page-level miss curves for six of the benchmarks (note that the y-axis is log-scale). Even if we select the optimal garbagecollector and heap size, both explicit memory managers yield smaller footprints and fewer page faults at almost all reasonablephysical memory sizes. Note that these “optimal” points are for the smallest heap sizes and so yield nearly pessimal throughput.
1
10
100
1000
10000
100000
1e+06
1e+07
1e+08
0 5000 10000 15000 20000 25000 30000
Tot
al P
age
Fau
lts (
log)
Available Physical Pages
Total Page Faults by Available Memory for Jess Appel
12 MB15 MB18 MB21 MB24 MB27 MB30 MB33 MB36 MB39 MB42 MB45 MB51 MB54 MB57 MB60 MB63 MB66 MB69 MB72 MB
kingsleylea
Figure 10: Page-level miss curves for the Appel collector run-ning jess. Larger heap sizes improve throughput but causemore page faults.
10
100
1000
10000
100000
1e+06
0 2000 4000 6000 8000 10000 12000
Est
imat
ed T
ime
Nee
ded
in S
econ
ds (
log)
Available Physical Pages
Estimated Time by Available Memory for Compress Optimal Collection
Optimal Garbage CollectionKingsley
Figure 11: Execution time including paging costs for compress(the y-axis is log-scale). Garbage collection suffers from pagingproblems much quicker.
bage collection achieves runtime performance comparable to ex-plicit memory management.
Figure 11 presents total execution times, including the cost ofservicing page faults for compress. In this graph, the optimalgarbage collector selects the garbage collector configuration thatminimizes total execution time. There is little difference betweenthe best possible GC configuration and the Kingsley allocator atthe start. However, garbage collection performance quickly suffersfrom paging problems, and only again becomes comparable afterpaging slows execution by over an order of magnitude.
6. Future WorkWhile we have shown that garbage collectors can be competitivewith and occasionally outperform explicit memory management,we have only addressed individual object management. Region-style custom memory allocators can dramatically improve the per-formance of applications using explicit memory management. [8,26]. Regions are also increasingly popular as an alternative or com-plement to garbage collection [21, 22, 24, 40]. We plan to use ourframework to examine the impact of the use of regions and a hybrid
allocator, reaps [8], as compared to garbage collection.In this study, we study two explicit memory allocators that place
8-byte object headers prior to each allocated object. As we discussin Section 5.2, these headers lead to excessive space consumptioncompared to the Mark-Sweep collector. We plan to evaluate mem-ory allocators that use bitmaps or BiBoP (big bag of pages) alloca-tion, which we expect to yield substantially lower space consump-tion.
7. ConclusionThe controversy over garbage collection’s performance impact haslong overshadowed the software engineering benefits it provides.This paper introduces a tracing and simulation-based oracular mem-ory manager. Using this framework, we execute a range of unal-tered Java benchmarks using both garbage collection and explicitmemory management. Comparing runtime, space consumption,and virtual memory footprints, we find that when space is plen-tiful, the runtime performance of garbage collection can be com-petitive with explicit memory management, and can even outper-form it by up to 4%. We find that copying garbage collection canrequire six times the physical memory as the Lea or Kingsley allo-cators to provide comparable performance. We also show that gar-bage collection suffers orders-of-magnitude performance penaltieswhen paging occurs. This first-ever comparison of explicit memorymanagement and copying garbage collection shows where garbagecollection must improve in the future. While we expect the incorpo-ration of L3 caches to minimize the impact of garbage collection’spoor L2 locality, the relative cost of disk latency continues to grow.Improving the space efficiency and page-level locality of garbagecollection will thus become increasingly important.
8. AcknowledgmentsThanks to Eliot Moss, Chris Hoffmann, and the rest of the DSSteam at UMass for their work on porting and debugging DynamicSimpleScalar, and to Scott Kaplan, Kathryn McKinley, Yannis Smarag-dakis, and the DaCapo group for helpful comments. Lastly, thanksto Linus Torvalds for inspiring us to settle this debate once and forall.
9. References
[1] Hardware — G5 Performance Programming.http://developer.apple.com/hardware/ve/g5.html, Dec. 2003.
[2] A.-R. Adl-Tabatabai, R. L. Hudson, M. J. Serrano, andS. Subramoney. Prefetch injection based on hardware monitoring andobject metadata. In Proceedings of the 2004 ACM SIGPLANConference on Programming Language Design and Implementation(PLDI), Washington, DC, June 2004.
[3] B. Alpern, C. R. Attanasio, J. J. Barton, M. G. Burke, P. Cheng, J.-D.Choi, A. Cocchi, S. J. Fink, D. Grove, M. Hind, S. F. Hummel,D. Lieber, V. Litvinov, M. F. Mergen, T. Ngo, V. Sarkar, M. J.Serrano, J. C. Shepherd, S. E. Smith, V. C. Sreedhar, H. Srinivasan,and J. Whaley. The Jalepeno virtual machine. IBM Systems Journal,39(1), Feb. 2000.
[4] B. Alpern, C. R. Attanasio, J. J. Barton, A. Cocchi, S. F. Hummel,D. Lieber, T. Ngo, M. Mergen, J. C. Shepherd, and S. Smith.Implementing Jalepeno in Java. In Proceedings of SIGPLAN 1999Conference on Object-Oriented Programming, Languages, &Applications, volume 34(10) of ACM SIGPLAN Notices, pages314–324, Denver, CO, Oct. 1999. ACM Press.
[5] A. Appel. Simple generational garbage collection and fast allocation.Software: Practice and Experience, 19(2):171–183, Feb. 1989.
[6] J. M. Barth. Shifting garbage collection overhead to compile time.Commun. ACM, 20(7):513–518, July 1977.
[7] E. D. Berger, B. G. Zorn, and K. S. McKinley. Composinghigh-performance memory allocators. In Proceedings of the 2001ACM SIGPLAN Conference on Programming Language Design andImplementation (PLDI), Snowbird, Utah, June 2001.

[8] E. D. Berger, B. G. Zorn, and K. S. McKinley. Reconsidering custommemory allocation. In Proceedings of the Conference onObject-Oriented Programming: Systems, Languages, andApplications (OOPSLA) 2002, Seattle, Washington, Nov. 2002.
[9] S. M. Blackburn, P. Cheng, and K. S. McKinley. Myths and reality:The performance impact of garbage collection. In SIGMETRICS -Performance 2004, Joint International Conference on Measurementand Modeling of Computer Systems, June 2004.
[10] S. M. Blackburn, P. Cheng, and K. S. McKinley. Oil and Water?High Performance Garbage Collection in Java with MMTk. In ICSE2004, 26th International Conference on Software Engineering, pageto appear, May 2004.
[11] S. M. Blackburn, R. Jones, K. S. McKinley, and J. E. B. Moss.Beltway: getting around garbage collection gridlock. In Proceedingsof the 2002 ACM SIGPLAN Conference on Programming LanguageDesign and Implementation (PLDI), pages 153–164. ACM, 2002.
[12] S. M. Blackburn and K. S. McKinley. Ulterior reference counting:Fast garbage collection without a long wait. In OOPSLA 2003 ACMConference on Object-Oriented Programming, Systems, Languagesand Applications, Oct. 2003.
[13] H.-J. Boehm and M. Weiser. Garbage collection in an uncooperativeenvironment. Software: Practice and Experience, 18(9):807–820,Sept. 1988.
[14] D. Burger, T. M. Austin, and S. Bennett. Evaluating futuremicroprocessors: The SimpleScalar tool set. Computer SciencesTechnical Report CS-TR-1996-1308, University ofWisconsin-Madison, Madison, WI, 1996.
[15] T. M. Chilimbi and J. R. Larus. Using generational garbagecollection to implement cache-conscious data placement. InProceedings of the first international symposium on Memorymanagement, pages 37–48. ACM Press, 1998.
[16] S. P. E. Corporation. Specjvm98 documentation, Mar. 1999.[17] D. L. Detlefs. Concurrent garbage collection for C++. In P. Lee,
editor, Topics in Advanced Language Implementation. MIT Press,1991.
[18] A. Diwan, D. Tarditi, and E. Moss. Memory system performance ofprograms with intensive heap allocation. ACM Trans. Comput. Syst.,13(3):244–273, Aug. 1995.
[19] L. Eeckhout, A. Georges, and K. D. Bosschere. How Java programsinteract with virtual machines at the microarchitectural level. InProceedings of the ACM SIGPLAN 2003 Conference onObject-Oriented Programming Systems, Languages andApplications, volume 38(11), pages 169–186, Oct. 2003.
[20] R. R. Fenichel and J. C. Yochelson. A LISP garbage-collector forvirtual-memory computer systems. Commun. ACM, 12(11):611–612,Nov. 1969.
[21] D. Gay and A. Aiken. Memory management with explicit regions. InProceedings of the 1998 ACM SIGPLAN Conference onProgramming Language Design and Implementation (PLDI), pages313 – 323, Montreal, Canada, June 1998.
[22] D. Gay and A. Aiken. Language support for regions. In Proceedingsof the 2001 ACM SIGPLAN Conference on Programming LanguageDesign and Implementation (PLDI), pages 70 – 80, Snowbird, Utah,June 2001.
[23] W. Gloger. Dynamic memory allocator implementations in linuxsystem libraries.http://www.dent.med.uni-muenchen.de/ wmglo/malloc-slides.html.
[24] D. Grossman, G. Morrisett, T. Jim, M. Hicks, Y. Wang, andJ. Cheney. Region-based memory management in cyclone. InProceedings of the 2002 ACM SIGPLAN Conference onProgramming Language Design and Implementation (PLDI), pages282–293, Berlin, Germany, June 2002.
[25] J. Guy L Steele. Multiprocessing compactifying garbage collection.Communications of the ACM, 18(9):495–508, 1975.
[26] D. R. Hanson. Fast allocation and deallocation of memory based onobject lifetimes. In Software Practice & Experience, volume 20(1),pages 5–12. Wiley, Jan. 1990.
[27] M. Hertz, S. M. Blackburn, J. E. B. Moss, K. S. McKinley, andD. Stefanovic. Error-free garbage collection traces: How to cheat andnot get caught. In Proceedings of the International Conference onMeasurement and Modeling of Computer Systems (SIGMETRICS
2002), pages 140–151, Marina Del Ray, CA, June 2002.[28] M. Hertz, N. Immerman, and J. E. B. Moss. Framework for analyzing
garbage collection. In Foundations of Information Technology in theEra of Network and Mobile Computing: IFIP 17th World ComputerCongress - TC1 Stream (TCS 2002), pages 230–241, Montreal,Canada, Aug. 2002. Kluwer.
[29] M. W. Hicks, J. T. Moore, and S. M. Nettles. The measured cost ofcopying garbage collection mechanisms. In Proceedings of the ACMSIGPLAN Conference on Functional Programming, pages 292–305.ACM, June 1997.
[30] X. Huang, J. E. B. Moss, K. S. Mckinley, S. Blackburn, andD. Burger. Dynamic SimpleScalar: Simulating Java virtual machines.Technical Report TR-03-03, University of Texas at Austin, Feb.2003.
[31] M. S. Johnstone and P. R. Wilson. The memory fragmentationproblem: Solved? In International Symposium on MemoryManagement, Vancouver, B.C., Canada, 1998.
[32] D. E. Knuth. The Art of Computer Programming. Volume 1:Fundamental Algorithms. Addison Wesley, Reading, MA, 1975. 2ndedition, 2nd printing.
[33] D. G. Korn and K.-P. Vo. In search of a better malloc. In USENIXConference Proceedings, Summer 1985, pages 489–506, Portland,OR, 1985.
[34] D. Lea. A memory allocator.http://g.oswego.edu/dl/html/malloc.html, 1998.
[35] N. Sachindran and J. E. B. Moss. Mark-Copy: Fast copying GC withless space overhead. In Proceedings of the ACM SIGPLAN 2003Conference on Object-Oriented Programming Systems, Languagesand Applications, Anaheim, CA, Oct. 2003.
[36] P. Savola. Lbnl traceroute heap corruption vulnerability.http://www.securityfocus.com/bid/1739.
[37] R. Shaham, E. . Kolodner, and M. Sagiv. Estimating the impact ofheap liveness information on space consumption in Java. InProceedings of the third international symposium on Memorymanagement, pages 64–75. ACM, 2002.
[38] S. Soman, C. Krintz, and D. F. Bacon. Dynamic Selection ofApplication-Specific Garbage Collectors. Technical Report 2004-09,Univ. of California, Santa Barbara, Jan. 2004.http://www.cs.ucsb.edu/ckrintz/abstracts/annotgc.html.
[39] D. Sugalski. Squawks of the parrot: What the heck is: Garbagecollection. http://www.sidhe.org/ dan/blog/archives/000200.html,June 2003.
[40] M. Tofte and J.-P. Talpin. Region-based memory management.Information and Computation, 132(2):109–176, 1997.
[41] L. Torvalds. Re: Faster compilation speed.http://gcc.gnu.org/ml/gcc/2002-08/msg00544.html, 2002.
[42] D. Ungar. Generation scavenging: A non-disruptive highperformance storage reclamation algorithm. In Proceedings of theACM SIGSOFT/SIGPLAN Software Engineering Symposium onPractical Software Development Environments, pages 157–167,Pittsburgh, Pennsylvania, Apr. 1984. ACM SIGPLAN Notices 19, 5(May 1984).
[43] B. Venners. Inside the Java Virtual Machine. McGraw-Hill OsborneMedia, Jan. 2000.
[44] Wikipedia. Comparison of Java to C Plus Plus.http://en.wikipedia.org/wiki/Comparison of Java to Cplusplus,2004.
[45] P. R. Wilson. Uniprocessor garbage collection techniques. InY. Bekkers and J. Cohen, editors, International Workshop on MemoryManagement, number 637 in Lecture Notes in Computer Science, St.Malo, France, Sept. 1992. Springer-Verlag.
[46] P. R. Wilson, M. S. Johnstone, M. Neely, and D. Boles. Dynamicstorage allocation: A survey and critical review. Lecture Notes inComputer Science, 986, 1995.
[47] P. R. Wilson, M. S. Lam, and T. G. Moher. Effective “ static-graph”reorganization to improve locality in garbage-collected systems. InProceedings of the 1991 ACM SIGPLAN Conference onProgramming Language Design and Implementation, volume 26(6),June 1991.
[48] B. G. Zorn. The measured cost of conservative garbage collection.Software Practice and Experience, 23(7):733–756, 1993.


![SUCCINCT CONSIDERATIONS ABOUT MEMORY Ferchmin 2015 Table of Content 1] Different types of memory. The two main forms of memory: Declarative (explicit)](https://static.fdocuments.us/doc/165x107/56649d885503460f94a6d1a1/succinct-considerations-about-memory-ferchmin-2015-table-of-content-1-different.jpg)