Automatic Stress Detection in Working Environments from ... · PDF fileEnvironments from...
8
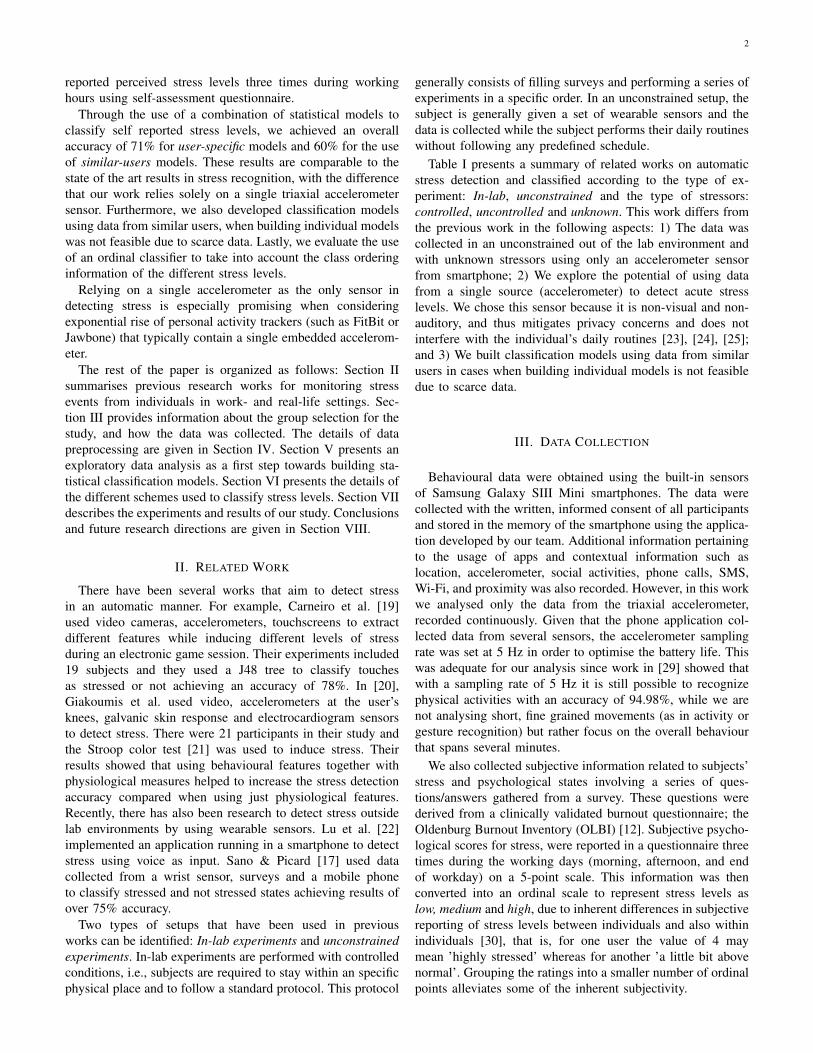
1 Automatic Stress Detection in Working Environments from Smartphones’ Accelerometer Data: A First Step Enrique Garcia-Ceja, Venet Osmani and Oscar Mayora Abstract—Increase in workload across many organisations and consequent increase in occupational stress is negatively affecting the health of the workforce. Measuring stress and other human psychological dynamics is difficult due to subjective nature of self- reporting and variability between and within individuals. With the advent of smartphones it is now possible to monitor diverse aspects of human behaviour, including objectively measured behaviour related to psychological state and consequently stress. We have used data from the smartphone’s built-in accelerometer to detect behaviour that correlates with subjects stress levels. Accelerometer sensor was chosen because it raises fewer privacy concerns (in comparison to location, video or audio recording, for example) and because its low power consumption makes it suitable to be embedded in smaller wearable devices, such as fitness trackers. 30 subjects from two different organizations were provided with smartphones. The study lasted for 8 weeks and was conducted in real working environments, with no constraints whatsoever placed upon smartphone usage. The subjects reported their perceived stress levels three times during their working hours. Using combination of statistical models to classify self reported stress levels, we achieved a maximum overall accuracy of 71% for user-specific models and an accuracy of 60% for the use of similar-users models, relying solely on data from a single accelerometer. Index Terms—automatic stress detection, health monitoring, accelerometer, smartphones, ambient intelligence, health and well-being. I. I NTRODUCTION T HE competitive nature of the world economy and the use of advanced information and communication tech- nologies has changed the nature of workplace environments, ensuring increased connectivity and consequently reachability of workers even outside working hours. This has resulted in an increase of workload [1], which has become a common issue in many organisations, where employees experience psy- chological problems related to occupational stress. According to the Fourth European Working Conditions Survey (EWCS), work-related stress was reported by 22% of workers from 27 Member states of the European Union [2]. Furthermore, higher E. Garcia-Ceja is a PhD student at Tecnol´ ogico de Monterrey, Monterrey, M´ exico. e-mail: [email protected] V. Osmani and O. Mayora are with CREATE-NET International Research Centre, Trento, Italy. e-mail: [email protected] [email protected] Author’s copy of the paper published in IEEE Journal of Biomedical and Health Informatics Enrique Garica-Ceja, Venet Osmani, Oscar Mayora ”Automatic Stress Detection in Working Environments from Smartphones Accelerometer Data: A First Step” IEEE Journal of Biomedical and Health Informatics, DOI:10.1109/JBHI.2015.2446195, 2015 prevalence of stress has been reported in North America, where 55% of population has reported increased workload having a significant impact on physical and mental health as described in APA Survey [3]. Occupational stress has been proven to contribute to disease activation. Several research studies have found that stress at work is associated with cardiovascular diseases [4], mus- culoskeletal diseases [5], immunological problems [6], and problems with mental health such as anxiety and depression disorders [7]. In regard to organizational well-being, a decline of physical and mental health of workers has been reported in Paoli et al.[8], leading to a decrease in the performance, decrease in overall productivity of organization and increased cost in terms of absenteeism. Experiencing work-related stress is common in working environments and low levels of stress can even result in productivity increase [9]. However, stress responses of employees are triggered when work-related pres- sure (such as quantity of work to be accomplished in a short period of time, pressure to work overtime, low social support, job insecurity and lesser breaks or holidays) challenge the human ability to cope with them. Considering detrimental effects of prolonged exposure to stress both for employees and organizations, there is a clear need for a system that can continuously monitor behaviour of workers and correlate various behaviour aspects with perceived stress levels. Several research works have used different sensing technologies, such as sound analysis [10], image processing from cameras [11] and physiological sensors [12] to detect stress. Considering privacy concerns when using cameras and microphones, physiological measures have become an increasingly popular approach for measuring stress- related signs from sensor data (typically GSR and heart-rate sensors), such as work in [13]. However, there are several concerns about using physiological sensors, principally due to their obtrusive nature, lack of comfort and ability to be worn continuously [14], consequently impacting natural behaviour of the subjects. With these points in mind, and based on our previous studies [15], [16], smartphones have a distinct advantage in that they are already familiar and widely adopted devices, thus minimis- ing ”observer effect” and do not pose additional discomfort on the monitored subjects [17], [18]. Using smartphones to monitor behaviour of subjects, we report the results of our study in detecting stress levels in real working environments. We recruited 30 subjects from two different organizations that participated in our 8 week study, where each participant arXiv:1510.04221v1 [cs.HC] 14 Oct 2015
Transcript of Automatic Stress Detection in Working Environments from ... · PDF fileEnvironments from...
1
Automatic Stress Detection in WorkingEnvironments from Smartphones’ Accelerometer
Data: A First StepEnrique Garcia-Ceja, Venet Osmani and Oscar Mayora
Abstract—Increase in workload across many organisations andconsequent increase in occupational stress is negatively affectingthe health of the workforce. Measuring stress and other humanpsychological dynamics is difficult due to subjective nature of self-reporting and variability between and within individuals. Withthe advent of smartphones it is now possible to monitor diverseaspects of human behaviour, including objectively measuredbehaviour related to psychological state and consequently stress.We have used data from the smartphone’s built-in accelerometerto detect behaviour that correlates with subjects stress levels.Accelerometer sensor was chosen because it raises fewer privacyconcerns (in comparison to location, video or audio recording,for example) and because its low power consumption makes itsuitable to be embedded in smaller wearable devices, such asfitness trackers. 30 subjects from two different organizations wereprovided with smartphones. The study lasted for 8 weeks andwas conducted in real working environments, with no constraintswhatsoever placed upon smartphone usage. The subjects reportedtheir perceived stress levels three times during their workinghours. Using combination of statistical models to classify selfreported stress levels, we achieved a maximum overall accuracyof 71% for user-specific models and an accuracy of 60% for theuse of similar-users models, relying solely on data from a singleaccelerometer.
Index Terms—automatic stress detection, health monitoring,accelerometer, smartphones, ambient intelligence, health andwell-being.
I. INTRODUCTION
THE competitive nature of the world economy and theuse of advanced information and communication tech-
nologies has changed the nature of workplace environments,ensuring increased connectivity and consequently reachabilityof workers even outside working hours. This has resulted inan increase of workload [1], which has become a commonissue in many organisations, where employees experience psy-chological problems related to occupational stress. Accordingto the Fourth European Working Conditions Survey (EWCS),work-related stress was reported by 22% of workers from 27Member states of the European Union [2]. Furthermore, higher
E. Garcia-Ceja is a PhD student at Tecnologico de Monterrey, Monterrey,Mexico. e-mail: [email protected]
V. Osmani and O. Mayora are with CREATE-NET InternationalResearch Centre, Trento, Italy. e-mail: [email protected]@create-net.org
Author’s copy of the paper published in IEEE Journal of Biomedical andHealth Informatics
Enrique Garica-Ceja, Venet Osmani, Oscar Mayora ”Automatic StressDetection in Working Environments from Smartphones Accelerometer Data:A First Step” IEEE Journal of Biomedical and Health Informatics,DOI:10.1109/JBHI.2015.2446195, 2015
prevalence of stress has been reported in North America,where 55% of population has reported increased workloadhaving a significant impact on physical and mental health asdescribed in APA Survey [3].
Occupational stress has been proven to contribute to diseaseactivation. Several research studies have found that stress atwork is associated with cardiovascular diseases [4], mus-culoskeletal diseases [5], immunological problems [6], andproblems with mental health such as anxiety and depressiondisorders [7]. In regard to organizational well-being, a declineof physical and mental health of workers has been reportedin Paoli et al.[8], leading to a decrease in the performance,decrease in overall productivity of organization and increasedcost in terms of absenteeism. Experiencing work-related stressis common in working environments and low levels of stresscan even result in productivity increase [9]. However, stressresponses of employees are triggered when work-related pres-sure (such as quantity of work to be accomplished in a shortperiod of time, pressure to work overtime, low social support,job insecurity and lesser breaks or holidays) challenge thehuman ability to cope with them.
Considering detrimental effects of prolonged exposure tostress both for employees and organizations, there is a clearneed for a system that can continuously monitor behaviourof workers and correlate various behaviour aspects withperceived stress levels. Several research works have useddifferent sensing technologies, such as sound analysis [10],image processing from cameras [11] and physiological sensors[12] to detect stress. Considering privacy concerns whenusing cameras and microphones, physiological measures havebecome an increasingly popular approach for measuring stress-related signs from sensor data (typically GSR and heart-ratesensors), such as work in [13]. However, there are severalconcerns about using physiological sensors, principally due totheir obtrusive nature, lack of comfort and ability to be worncontinuously [14], consequently impacting natural behaviourof the subjects.
With these points in mind, and based on our previous studies[15], [16], smartphones have a distinct advantage in that theyare already familiar and widely adopted devices, thus minimis-ing ”observer effect” and do not pose additional discomforton the monitored subjects [17], [18]. Using smartphones tomonitor behaviour of subjects, we report the results of ourstudy in detecting stress levels in real working environments.We recruited 30 subjects from two different organizationsthat participated in our 8 week study, where each participant
arX
iv:1
510.
0422
1v1
[cs
.HC
] 1
4 O
ct 2
015
2
reported perceived stress levels three times during workinghours using self-assessment questionnaire.
Through the use of a combination of statistical models toclassify self reported stress levels, we achieved an overallaccuracy of 71% for user-specific models and 60% for the useof similar-users models. These results are comparable to thestate of the art results in stress recognition, with the differencethat our work relies solely on a single triaxial accelerometersensor. Furthermore, we also developed classification modelsusing data from similar users, when building individual modelswas not feasible due to scarce data. Lastly, we evaluate the useof an ordinal classifier to take into account the class orderinginformation of the different stress levels.
Relying on a single accelerometer as the only sensor indetecting stress is especially promising when consideringexponential rise of personal activity trackers (such as FitBit orJawbone) that typically contain a single embedded accelerom-eter.
The rest of the paper is organized as follows: Section IIsummarises previous research works for monitoring stressevents from individuals in work- and real-life settings. Sec-tion III provides information about the group selection for thestudy, and how the data was collected. The details of datapreprocessing are given in Section IV. Section V presents anexploratory data analysis as a first step towards building sta-tistical classification models. Section VI presents the details ofthe different schemes used to classify stress levels. Section VIIdescribes the experiments and results of our study. Conclusionsand future research directions are given in Section VIII.
II. RELATED WORK
There have been several works that aim to detect stressin an automatic manner. For example, Carneiro et al. [19]used video cameras, accelerometers, touchscreens to extractdifferent features while inducing different levels of stressduring an electronic game session. Their experiments included19 subjects and they used a J48 tree to classify touchesas stressed or not achieving an accuracy of 78%. In [20],Giakoumis et al. used video, accelerometers at the user’sknees, galvanic skin response and electrocardiogram sensorsto detect stress. There were 21 participants in their study andthe Stroop color test [21] was used to induce stress. Theirresults showed that using behavioural features together withphysiological measures helped to increase the stress detectionaccuracy compared when using just physiological features.Recently, there has also been research to detect stress outsidelab environments by using wearable sensors. Lu et al. [22]implemented an application running in a smartphone to detectstress using voice as input. Sano & Picard [17] used datacollected from a wrist sensor, surveys and a mobile phoneto classify stressed and not stressed states achieving results ofover 75% accuracy.
Two types of setups that have been used in previousworks can be identified: In-lab experiments and unconstrainedexperiments. In-lab experiments are performed with controlledconditions, i.e., subjects are required to stay within an specificphysical place and to follow a standard protocol. This protocol
generally consists of filling surveys and performing a series ofexperiments in a specific order. In an unconstrained setup, thesubject is generally given a set of wearable sensors and thedata is collected while the subject performs their daily routineswithout following any predefined schedule.
Table I presents a summary of related works on automaticstress detection and classified according to the type of ex-periment: In-lab, unconstrained and the type of stressors:controlled, uncontrolled and unknown. This work differs fromthe previous work in the following aspects: 1) The data wascollected in an unconstrained out of the lab environment andwith unknown stressors using only an accelerometer sensorfrom smartphone; 2) We explore the potential of using datafrom a single source (accelerometer) to detect acute stresslevels. We chose this sensor because it is non-visual and non-auditory, and thus mitigates privacy concerns and does notinterfere with the individual’s daily routines [23], [24], [25];and 3) We built classification models using data from similarusers in cases when building individual models is not feasibledue to scarce data.
III. DATA COLLECTION
Behavioural data were obtained using the built-in sensorsof Samsung Galaxy SIII Mini smartphones. The data werecollected with the written, informed consent of all participantsand stored in the memory of the smartphone using the applica-tion developed by our team. Additional information pertainingto the usage of apps and contextual information such aslocation, accelerometer, social activities, phone calls, SMS,Wi-Fi, and proximity was also recorded. However, in this workwe analysed only the data from the triaxial accelerometer,recorded continuously. Given that the phone application col-lected data from several sensors, the accelerometer samplingrate was set at 5 Hz in order to optimise the battery life. Thiswas adequate for our analysis since work in [29] showed thatwith a sampling rate of 5 Hz it is still possible to recognizephysical activities with an accuracy of 94.98%, while we arenot analysing short, fine grained movements (as in activity orgesture recognition) but rather focus on the overall behaviourthat spans several minutes.
We also collected subjective information related to subjects’stress and psychological states involving a series of ques-tions/answers gathered from a survey. These questions werederived from a clinically validated burnout questionnaire; theOldenburg Burnout Inventory (OLBI) [12]. Subjective psycho-logical scores for stress, were reported in a questionnaire threetimes during the working days (morning, afternoon, and endof workday) on a 5-point scale. This information was thenconverted into an ordinal scale to represent stress levels aslow, medium and high, due to inherent differences in subjectivereporting of stress levels between individuals and also withinindividuals [30], that is, for one user the value of 4 maymean ’highly stressed’ whereas for another ’a little bit abovenormal’. Grouping the ratings into a smaller number of ordinalpoints alleviates some of the inherent subjectivity.
3
TABLE ICLASSIFICATION OF DIFFERENT RELATED WORKS. TYPE COLUMN
INDICATES IF THE EXPERIMENT WAS PERFORMED IN-LAB OR IN ANUNCONSTRAINED ENVIRONMENT AND THE TYPE OF STRESSORS USED:
CONTROLLED, UNCONTROLLED, UNKNOWN.
Work Type Data sources Details
Carneiro etal. [19]
In-lab,controlled
video cameras,accelerometers,
pressure-sensitive
touchscreens
19 subjects. 78%accuracy in
classifying touchesas stressed or notusing a J48 tree.
Giakoumiset al. [20]
In-lab,controlled
video,accelerometers at
users’ knees,Galvanic skinresponse, elec-trocardiogram
21 subjects. Avg.accuracy of 100%for their dataset 1
and 96.6% fordataset 2 when
using all sensors.
Sun et al.[26]
In-lab,controlled
electrocardio-gram, galvanicskin response,accelerometer
20 subjects. Overallaccuracy 92.4% for
10-fold crossvalidation and80.9% between
subjectsclassification.
Bauer &Lukowicz
[18]
uncon-strained,uncon-trolled
gps, wi-fi,bluetooth, call
logs, sms
7 subjects.Detected a change
of behaviour duringstress periods of
approx. 86% of theparticipants.
Lu et al.[22]
In-lab,uncon-
strained,uncon-trolled
audio
14 subjects.accuracy of 81%
and 76% for indoorand outdoor
environments withmodel adaptation.
Muaremiet al. [27]
uncon-strained,unknown
heart rate, audio,acceleration, gps,
calls, contacts,etc.
35 subjects. 61%accuracy for user
specific models and53% for a general
model.
Sano &Picard [17]
uncon-strained,unknown
accelerometer,skin
conductance,calls, sms,
location, screen
18 subjects.Accuracies over
75%
Bogo-molov etal. [28]
uncon-strained,unknown
call logs, sms,bluetooth
117 subjects. Anoverall recognition
accuracy of 72.39%with Random forest
model.
A. Participants
Sensor data was collected from 30 healthy subjects andanalysed with self-reported stress data for a period of 8weeks, excluding weekends. Due to user compliance issues,the average number of data collection days per user was 29±6.Furthermore, some surveys during the day were occasionallyskipped by the users. The participants used the phone frommorning until the end of the work day, without any restrictionswhatsoever placed upon the use of the phone in a specific man-ner. In order to get insights in the working style and gain moreknowledge from employees in their working environments,we chose to recruit participants from two different companieslocated in province of Trentino, Italy. The study involved 18(60%) males and 12 (40%) females aged 37.46±7.26 years.Participants were informed that the goal of the study was tomonitor behaviour activities relevant to stress. All participants
consented to participate in the study and to have their datarecorded. They were also informed that all the collected datawas anonymous and will be used for research purposes only.
IV. PRE-PROCESSING
Feature extractionFrom the raw accelerometer data a total of 34 features
from time and frequency domain were extracted. The featureextraction was performed on non-overlapping fixed lengthwindows of 128 samples (25.6 seconds.). The 34 featureswere: Mean x axis, Mean y axis, Mean z axis, StdDev x axis,StdDev y axis, StdDev z axis, Variance x axis, Variance y axis,Variance z axis, Variance 3 axes, Mean 3 axes, Max 3 axes,Min 3 axes, Standard Deviation 3 axes, Absolute Value 3 axes,Median 3 axes, Range 3 axes, Variance Sum [31], MagnitudeEq.(1), Signal Magnitude Area Eq.(2), Root Mean SquaredEq.(3), Curve Length Eq.(4), Non Linear Energy [32], En-tropy: differential entropy from time domain magnitude Eq.(5)[33], Energy: which is the sum of the squared discrete FFTcomponent magnitudes of the signal. Eq.(6) [34], Mean En-ergy, StdDev Energy, DFT (Discrete Fourier Transform), PeakMagnitude which is the maximum value of the magnitude.Eq.(7), Peak Magnitude Frequency which is the frequencythat corresponds to the maximum magnitude. Eq.(8), PeakPower which is analogous to peak magnitude but on the powerspectrum, Peak Power Frequency this is analogous to peakmagnitude frequency, Magnitude Entropy Eq.(9) and PowerShannon Entropy same as Magnitude Entropy but over thepower spectrum.
Magnitude =1
n
n∑i=1
√x2i + y2i + z2i (1)
SMA =1
T
∫ T
o
x(t)|dt+∫ T
o
y(t)|dt+∫ T
o
z(t)|dt (2)
RMS =
√1
n(x21 + x22 + · · ·+ x2n) (3)
curvelength =
N∑i=2
|xi−1 − xi| (4)
h(X) =
∫Xf(x) log f(x)dx (5)
energy =
(n/2)∑i=1
x[i]2 (6)
pm = maxi=1..(n/2)
xi (7)
pmf = argmaxi=1..(n/2)
xi (8)
H(X) = −N−1∑i=0
pilog2pi (9)
Self-reported Stress
4
The stress scale in the survey has the scale 1 to 5, where1 means least stressed and 5 means most stressed. For thepurpose of our analysis we grouped those values into threegroups: low stress for values of 1 and 2; medium stress for avalue of 3; and high stress for values of 4 and 5.
For our analysis, we considered observations from the sec-ond and third surveys only because there is no accelerometerdata before the first survey (beginning of the day). To charac-terize each survey, we took the features from the previous2 hours for each survey and computed summary statisticswhich will be used as the final features: mean, maximum andminimum value of each of the 34 features giving a total of102 features. Table II shows the total number of observationsfor each of the stress levels.
TABLE IITOTAL NUMBER OF OBSERVATIONS FOR THE SECOND AND THIRD
SURVEYS
Stress level: Low Medium High
# observations 667 521 329 Total: 1,517
V. EXPLORATORY DATA ANALYSIS
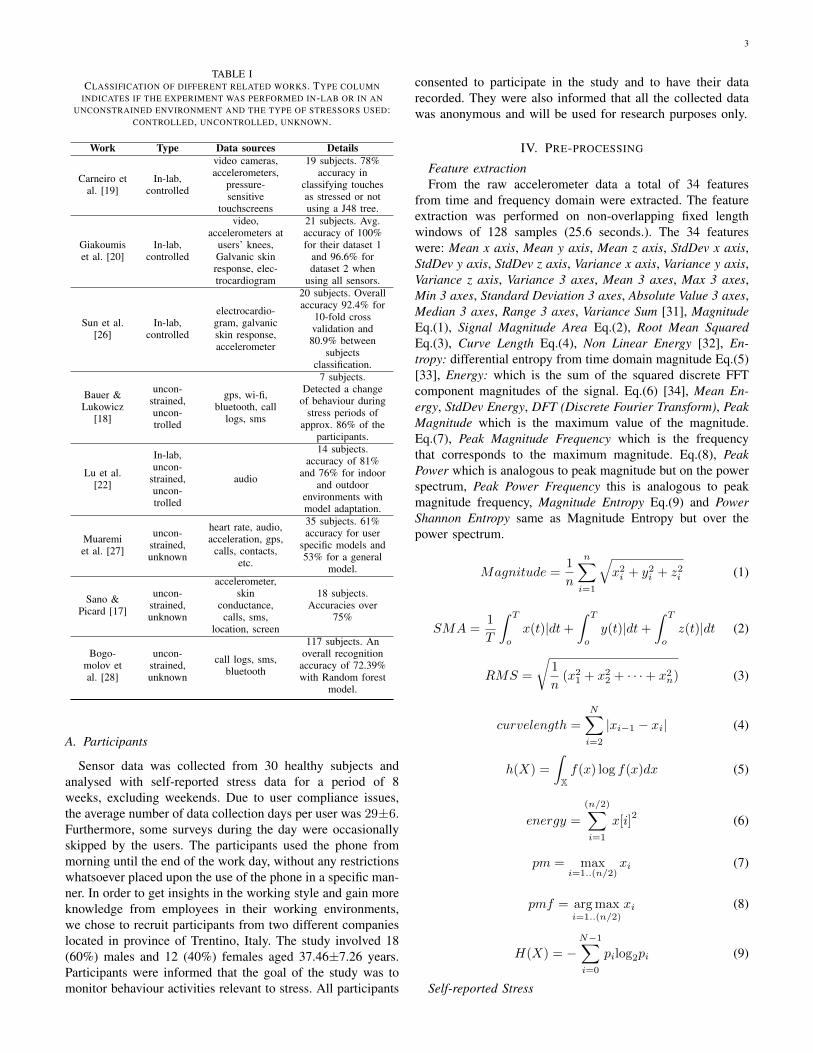
In this section we present a general overview of the data.Figure 1 shows the average of the self reported stress levelscores by weekday over all users using data from the 3 surveys.It can be seen that the maximum stress level is reported onTuesday and then begins to decrease towards its minimum onFriday. The resulting standard error bars overlap with eachother suggesting that the differences between days are notsignificant, confirmed with an analysis of variance test.
●
●
●●
●
2.48
2.52
2.56
Monday Tuesday Wednesday Thursday Fridayday of week
aver
age
stre
ss le
vel
Average stress levels by day
Fig. 1. Average stress levels by weekday with standard error bars of themean.
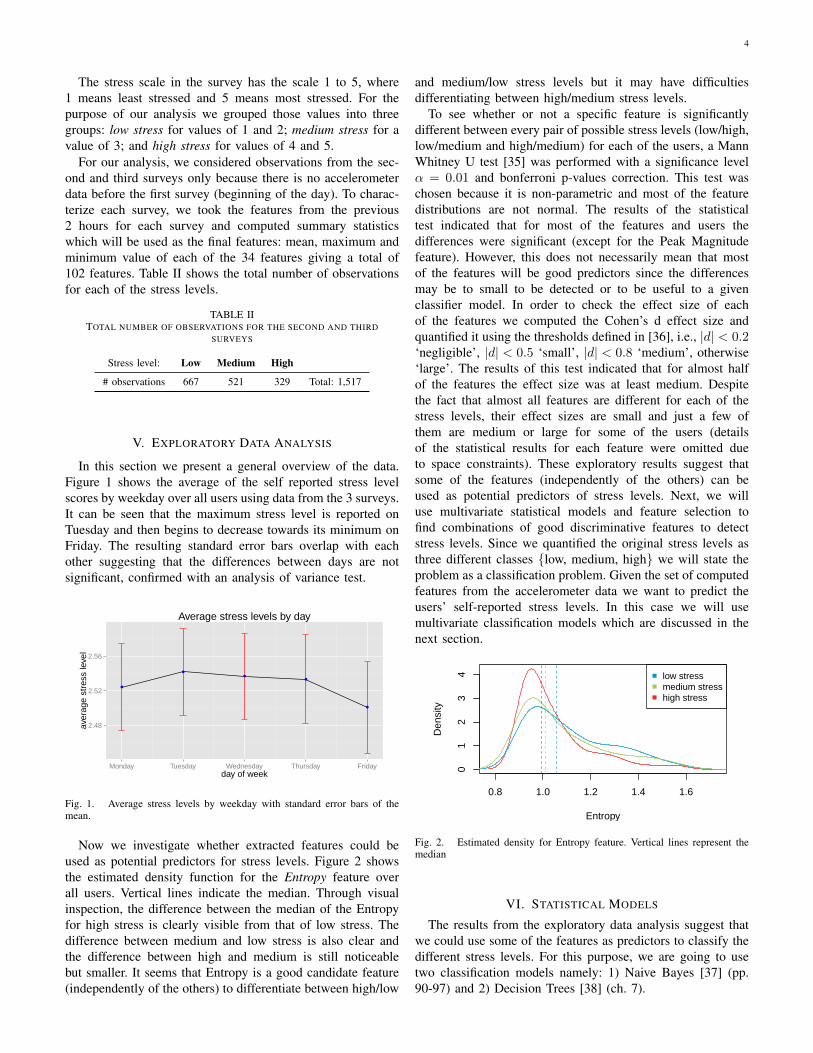
Now we investigate whether extracted features could beused as potential predictors for stress levels. Figure 2 showsthe estimated density function for the Entropy feature overall users. Vertical lines indicate the median. Through visualinspection, the difference between the median of the Entropyfor high stress is clearly visible from that of low stress. Thedifference between medium and low stress is also clear andthe difference between high and medium is still noticeablebut smaller. It seems that Entropy is a good candidate feature(independently of the others) to differentiate between high/low
and medium/low stress levels but it may have difficultiesdifferentiating between high/medium stress levels.
To see whether or not a specific feature is significantlydifferent between every pair of possible stress levels (low/high,low/medium and high/medium) for each of the users, a MannWhitney U test [35] was performed with a significance levelα = 0.01 and bonferroni p-values correction. This test waschosen because it is non-parametric and most of the featuredistributions are not normal. The results of the statisticaltest indicated that for most of the features and users thedifferences were significant (except for the Peak Magnitudefeature). However, this does not necessarily mean that mostof the features will be good predictors since the differencesmay be to small to be detected or to be useful to a givenclassifier model. In order to check the effect size of eachof the features we computed the Cohen’s d effect size andquantified it using the thresholds defined in [36], i.e., |d| < 0.2‘negligible’, |d| < 0.5 ‘small’, |d| < 0.8 ‘medium’, otherwise‘large’. The results of this test indicated that for almost halfof the features the effect size was at least medium. Despitethe fact that almost all features are different for each of thestress levels, their effect sizes are small and just a few ofthem are medium or large for some of the users (detailsof the statistical results for each feature were omitted dueto space constraints). These exploratory results suggest thatsome of the features (independently of the others) can beused as potential predictors of stress levels. Next, we willuse multivariate statistical models and feature selection tofind combinations of good discriminative features to detectstress levels. Since we quantified the original stress levels asthree different classes {low, medium, high} we will state theproblem as a classification problem. Given the set of computedfeatures from the accelerometer data we want to predict theusers’ self-reported stress levels. In this case we will usemultivariate classification models which are discussed in thenext section.
0.8 1.0 1.2 1.4 1.6
01
23
4
Entropy
Den
sity
low stressmedium stresshigh stress
Fig. 2. Estimated density for Entropy feature. Vertical lines represent themedian
VI. STATISTICAL MODELS
The results from the exploratory data analysis suggest thatwe could use some of the features as predictors to classify thedifferent stress levels. For this purpose, we are going to usetwo classification models namely: 1) Naive Bayes [37] (pp.90-97) and 2) Decision Trees [38] (ch. 7).
5
As we discussed earlier, some of the features may increasethe performance of the classifiers while others may have theopposite effect. To find good combinations of features to buildthe models we used a feature selection method called ForwardFeature Selection [39] (pp. 207) which consists of addingpredictors one by one to the model and at each step the variablethat increases performance criteria the most is retained. In thiscase we used accuracy as the performance criteria.
A. Model Schemes
In recent related works it has been common to build user-specific and general models to classify stress levels [27], [22].For the user-specific case, individual models are trained andevaluated for each of the users using their own data. Thegeneral model consists of building the model with data fromall the users. This can be done by aggregating all the datafrom all the users or for each specific user i build a modelwith the data from all other users j, j 6= i and test the modelwith the data from user i. The latter approach is sometimesreferred to as leave one person out. In Lu et al. [22] they alsoused an hybrid approach called model adaptation which startswith a general model and gets adapted to each individual asmore data is available.
Following this methodology, we used the user-specific andthe general model approach. For the general model we usedthe leave one person out scheme. We also built similar-usersmodels which differ from the general model in that insteadof building one model for a user i using observations fromall other users j,j 6= i, the model for user i is built usingobservations from just a subset of similar users. The rationalebehind this scheme is that for any two users, their behaviouralpatterns across stress levels may be different. For example,a user may tend to be more active when he is stressed butanother one may tend to be more sedentary when stressed.
Building a single model that includes users with differentbehaviour patterns is not desirable since this will introducenoise. Rather, we may want to build a model for a specificuser with data just from similar users. In this case, even ifthere is not yet enough data to build an user-specific model asystem could build a model from similar users and start givingfeedback until there is sufficient data to build an individualmodel.
Similar-users Model: Here, the idea is to build a model topredict stress levels for the test user ut using data from the setof users S, where S is the set of users with similar behaviourto ut. The behaviour of each user will be represented by asingle vector bi of size =
(|C|2
)|F | where |C| is the number of
classes and |F | is the number of features. In this case(|C|
2
)= 3
which corresponds to every possible combination of stresslevels: low-medium, low-high, medium-high. For each featurewe want to know how does the median value changes betweenthe different pairs of stress levels. For example, for one userthe difference between median(f1low)−median(f1high
) maybe positive but for other user it may be negative wheremedian(f1low) is the median of a specific feature when thestress level is low (and the same applies for all other levels).The behaviour vector bi is constructed by computing for each
feature, the difference of the medians between every pair ofstress levels.
To find S we used k-means clustering to group the be-haviour vectors bi, i 6= t into k groups G1..k and letS be the group who’s centroid has the minimum distanceto the behaviour vector of the test user bt, i.e., S =argminG1..k
dist(bt, centroid(Gi)). Since ut is the test user,bt is computed using only a random subset Ot,p of the totalobservations of user t where p indicates what percentage of thetotal observations was taken. The subset Ot,p of observationsthat was used to construct bt to find the similar users isdiscarded when evaluating the model to avoid over-fitting.
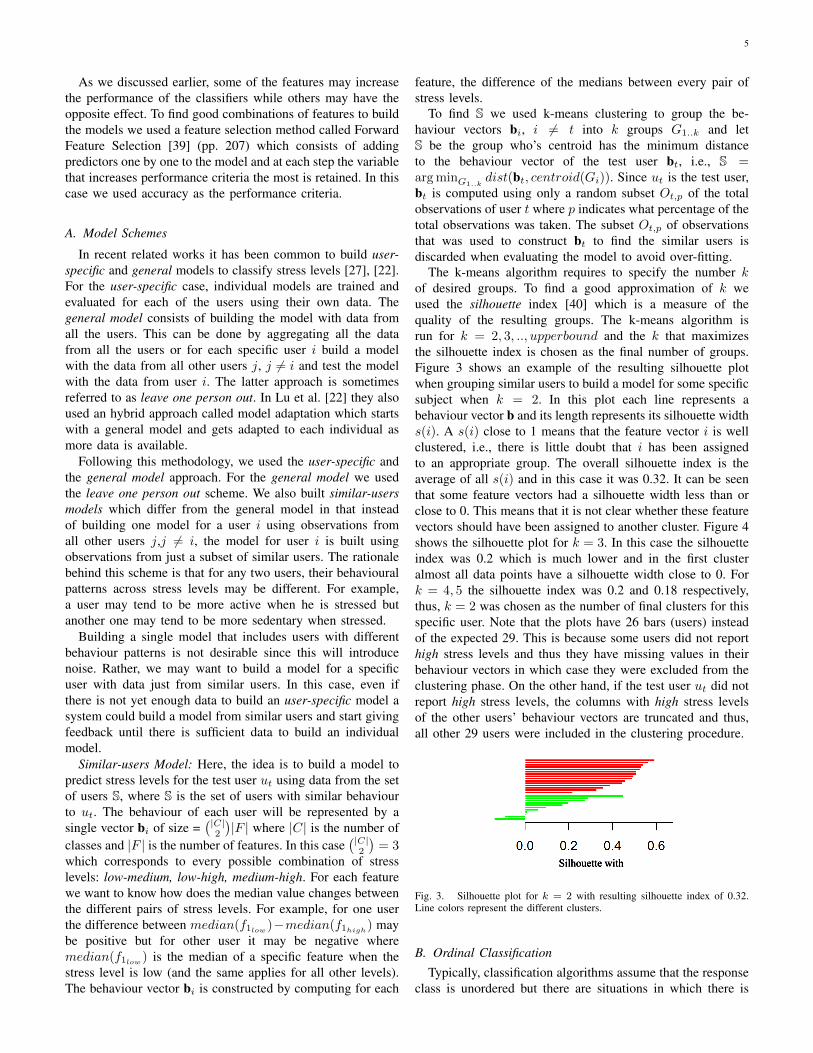
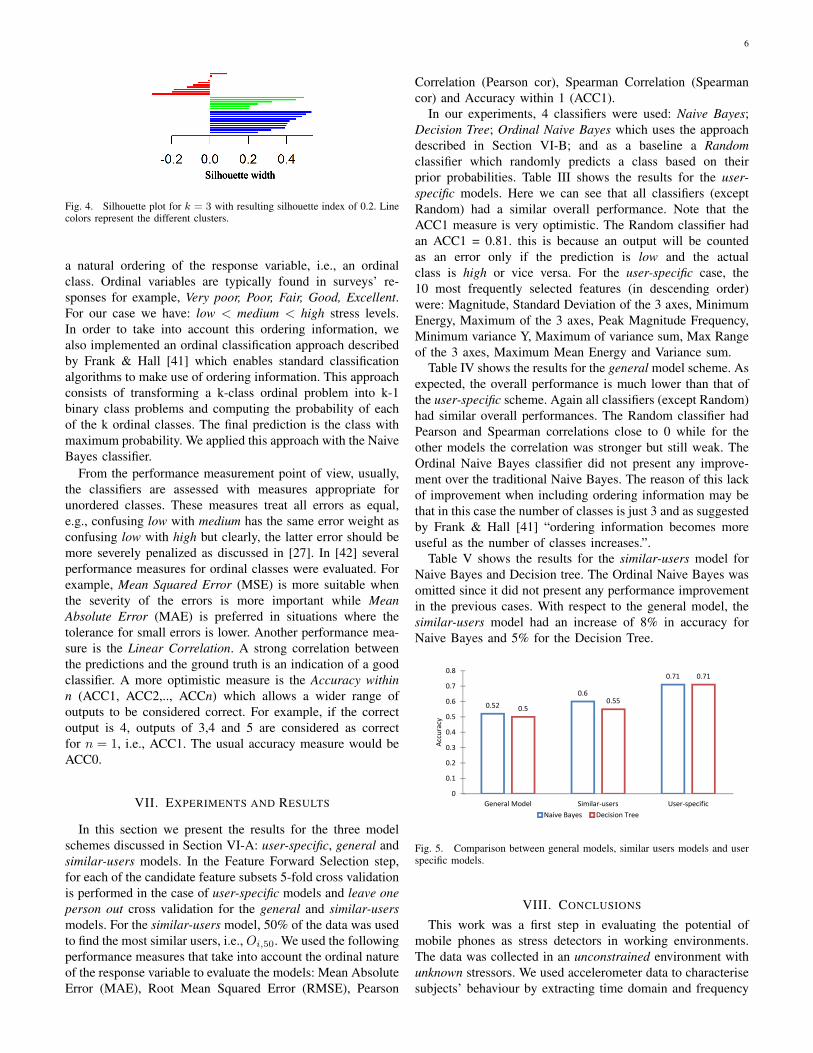
The k-means algorithm requires to specify the number kof desired groups. To find a good approximation of k weused the silhouette index [40] which is a measure of thequality of the resulting groups. The k-means algorithm isrun for k = 2, 3, .., upperbound and the k that maximizesthe silhouette index is chosen as the final number of groups.Figure 3 shows an example of the resulting silhouette plotwhen grouping similar users to build a model for some specificsubject when k = 2. In this plot each line represents abehaviour vector b and its length represents its silhouette widths(i). A s(i) close to 1 means that the feature vector i is wellclustered, i.e., there is little doubt that i has been assignedto an appropriate group. The overall silhouette index is theaverage of all s(i) and in this case it was 0.32. It can be seenthat some feature vectors had a silhouette width less than orclose to 0. This means that it is not clear whether these featurevectors should have been assigned to another cluster. Figure 4shows the silhouette plot for k = 3. In this case the silhouetteindex was 0.2 which is much lower and in the first clusteralmost all data points have a silhouette width close to 0. Fork = 4, 5 the silhouette index was 0.2 and 0.18 respectively,thus, k = 2 was chosen as the number of final clusters for thisspecific user. Note that the plots have 26 bars (users) insteadof the expected 29. This is because some users did not reporthigh stress levels and thus they have missing values in theirbehaviour vectors in which case they were excluded from theclustering phase. On the other hand, if the test user ut did notreport high stress levels, the columns with high stress levelsof the other users’ behaviour vectors are truncated and thus,all other 29 users were included in the clustering procedure.
Silhouette with
Fig. 3. Silhouette plot for k = 2 with resulting silhouette index of 0.32.Line colors represent the different clusters.
B. Ordinal ClassificationTypically, classification algorithms assume that the response
class is unordered but there are situations in which there is
6
Silhouette width
Fig. 4. Silhouette plot for k = 3 with resulting silhouette index of 0.2. Linecolors represent the different clusters.
a natural ordering of the response variable, i.e., an ordinalclass. Ordinal variables are typically found in surveys’ re-sponses for example, Very poor, Poor, Fair, Good, Excellent.For our case we have: low < medium < high stress levels.In order to take into account this ordering information, wealso implemented an ordinal classification approach describedby Frank & Hall [41] which enables standard classificationalgorithms to make use of ordering information. This approachconsists of transforming a k-class ordinal problem into k-1binary class problems and computing the probability of eachof the k ordinal classes. The final prediction is the class withmaximum probability. We applied this approach with the NaiveBayes classifier.
From the performance measurement point of view, usually,the classifiers are assessed with measures appropriate forunordered classes. These measures treat all errors as equal,e.g., confusing low with medium has the same error weight asconfusing low with high but clearly, the latter error should bemore severely penalized as discussed in [27]. In [42] severalperformance measures for ordinal classes were evaluated. Forexample, Mean Squared Error (MSE) is more suitable whenthe severity of the errors is more important while MeanAbsolute Error (MAE) is preferred in situations where thetolerance for small errors is lower. Another performance mea-sure is the Linear Correlation. A strong correlation betweenthe predictions and the ground truth is an indication of a goodclassifier. A more optimistic measure is the Accuracy withinn (ACC1, ACC2,.., ACCn) which allows a wider range ofoutputs to be considered correct. For example, if the correctoutput is 4, outputs of 3,4 and 5 are considered as correctfor n = 1, i.e., ACC1. The usual accuracy measure would beACC0.
VII. EXPERIMENTS AND RESULTS
In this section we present the results for the three modelschemes discussed in Section VI-A: user-specific, general andsimilar-users models. In the Feature Forward Selection step,for each of the candidate feature subsets 5-fold cross validationis performed in the case of user-specific models and leave oneperson out cross validation for the general and similar-usersmodels. For the similar-users model, 50% of the data was usedto find the most similar users, i.e., Oi,50. We used the followingperformance measures that take into account the ordinal natureof the response variable to evaluate the models: Mean AbsoluteError (MAE), Root Mean Squared Error (RMSE), Pearson
Correlation (Pearson cor), Spearman Correlation (Spearmancor) and Accuracy within 1 (ACC1).
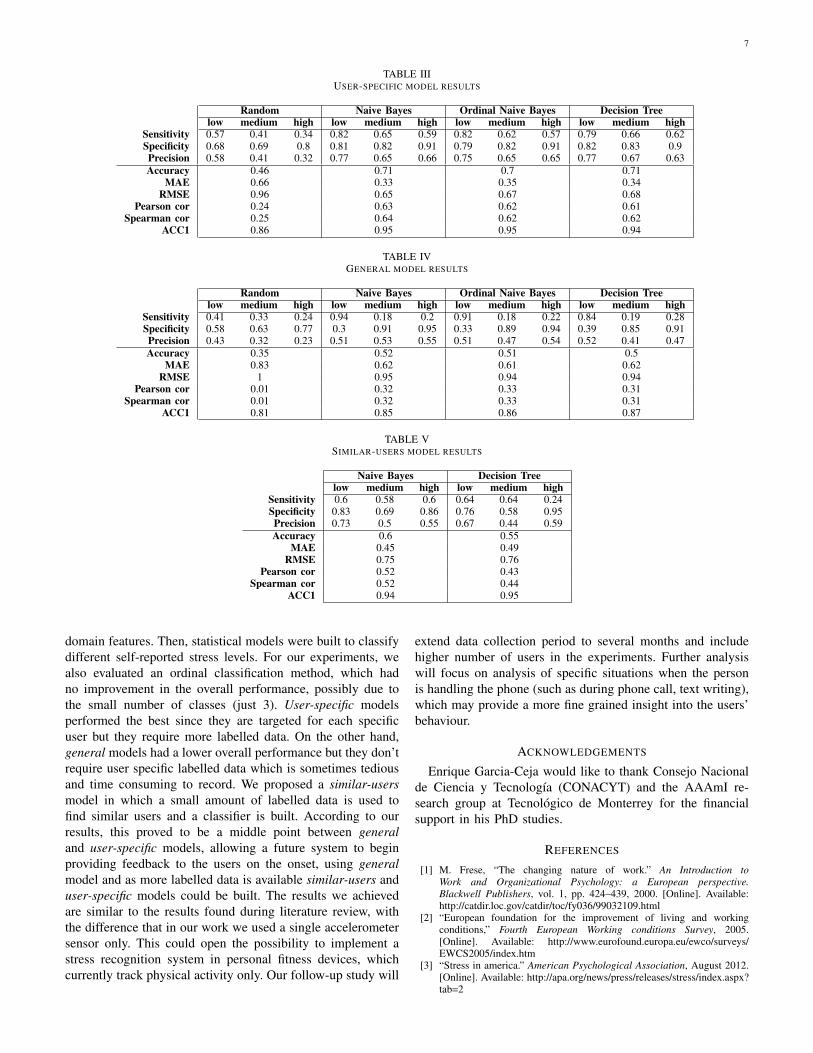
In our experiments, 4 classifiers were used: Naive Bayes;Decision Tree; Ordinal Naive Bayes which uses the approachdescribed in Section VI-B; and as a baseline a Randomclassifier which randomly predicts a class based on theirprior probabilities. Table III shows the results for the user-specific models. Here we can see that all classifiers (exceptRandom) had a similar overall performance. Note that theACC1 measure is very optimistic. The Random classifier hadan ACC1 = 0.81. this is because an output will be countedas an error only if the prediction is low and the actualclass is high or vice versa. For the user-specific case, the10 most frequently selected features (in descending order)were: Magnitude, Standard Deviation of the 3 axes, MinimumEnergy, Maximum of the 3 axes, Peak Magnitude Frequency,Minimum variance Y, Maximum of variance sum, Max Rangeof the 3 axes, Maximum Mean Energy and Variance sum.
Table IV shows the results for the general model scheme. Asexpected, the overall performance is much lower than that ofthe user-specific scheme. Again all classifiers (except Random)had similar overall performances. The Random classifier hadPearson and Spearman correlations close to 0 while for theother models the correlation was stronger but still weak. TheOrdinal Naive Bayes classifier did not present any improve-ment over the traditional Naive Bayes. The reason of this lackof improvement when including ordering information may bethat in this case the number of classes is just 3 and as suggestedby Frank & Hall [41] “ordering information becomes moreuseful as the number of classes increases.”.
Table V shows the results for the similar-users model forNaive Bayes and Decision tree. The Ordinal Naive Bayes wasomitted since it did not present any performance improvementin the previous cases. With respect to the general model, thesimilar-users model had an increase of 8% in accuracy forNaive Bayes and 5% for the Decision Tree.
0.52
0.6
0.71
0.50.55
0.71
0
0.1
0.2
0.3
0.4
0.5
0.6
0.7
0.8
General Model Similar-users User-specific
Acc
ura
cy
Naive Bayes Decision Tree
Fig. 5. Comparison between general models, similar users models and userspecific models.
VIII. CONCLUSIONS
This work was a first step in evaluating the potential ofmobile phones as stress detectors in working environments.The data was collected in an unconstrained environment withunknown stressors. We used accelerometer data to characterisesubjects’ behaviour by extracting time domain and frequency
7
TABLE IIIUSER-SPECIFIC MODEL RESULTS
Random Naive Bayes Ordinal Naive Bayes Decision Treelow medium high low medium high low medium high low medium high
Sensitivity 0.57 0.41 0.34 0.82 0.65 0.59 0.82 0.62 0.57 0.79 0.66 0.62Specificity 0.68 0.69 0.8 0.81 0.82 0.91 0.79 0.82 0.91 0.82 0.83 0.9Precision 0.58 0.41 0.32 0.77 0.65 0.66 0.75 0.65 0.65 0.77 0.67 0.63Accuracy 0.46 0.71 0.7 0.71
MAE 0.66 0.33 0.35 0.34RMSE 0.96 0.65 0.67 0.68
Pearson cor 0.24 0.63 0.62 0.61Spearman cor 0.25 0.64 0.62 0.62
ACC1 0.86 0.95 0.95 0.94
TABLE IVGENERAL MODEL RESULTS
Random Naive Bayes Ordinal Naive Bayes Decision Treelow medium high low medium high low medium high low medium high
Sensitivity 0.41 0.33 0.24 0.94 0.18 0.2 0.91 0.18 0.22 0.84 0.19 0.28Specificity 0.58 0.63 0.77 0.3 0.91 0.95 0.33 0.89 0.94 0.39 0.85 0.91Precision 0.43 0.32 0.23 0.51 0.53 0.55 0.51 0.47 0.54 0.52 0.41 0.47Accuracy 0.35 0.52 0.51 0.5
MAE 0.83 0.62 0.61 0.62RMSE 1 0.95 0.94 0.94
Pearson cor 0.01 0.32 0.33 0.31Spearman cor 0.01 0.32 0.33 0.31
ACC1 0.81 0.85 0.86 0.87
TABLE VSIMILAR-USERS MODEL RESULTS
Naive Bayes Decision Treelow medium high low medium high
Sensitivity 0.6 0.58 0.6 0.64 0.64 0.24Specificity 0.83 0.69 0.86 0.76 0.58 0.95Precision 0.73 0.5 0.55 0.67 0.44 0.59Accuracy 0.6 0.55
MAE 0.45 0.49RMSE 0.75 0.76
Pearson cor 0.52 0.43Spearman cor 0.52 0.44
ACC1 0.94 0.95
domain features. Then, statistical models were built to classifydifferent self-reported stress levels. For our experiments, wealso evaluated an ordinal classification method, which hadno improvement in the overall performance, possibly due tothe small number of classes (just 3). User-specific modelsperformed the best since they are targeted for each specificuser but they require more labelled data. On the other hand,general models had a lower overall performance but they don’trequire user specific labelled data which is sometimes tediousand time consuming to record. We proposed a similar-usersmodel in which a small amount of labelled data is used tofind similar users and a classifier is built. According to ourresults, this proved to be a middle point between generaland user-specific models, allowing a future system to beginproviding feedback to the users on the onset, using generalmodel and as more labelled data is available similar-users anduser-specific models could be built. The results we achievedare similar to the results found during literature review, withthe difference that in our work we used a single accelerometersensor only. This could open the possibility to implement astress recognition system in personal fitness devices, whichcurrently track physical activity only. Our follow-up study will
extend data collection period to several months and includehigher number of users in the experiments. Further analysiswill focus on analysis of specific situations when the personis handling the phone (such as during phone call, text writing),which may provide a more fine grained insight into the users’behaviour.
ACKNOWLEDGEMENTS
Enrique Garcia-Ceja would like to thank Consejo Nacionalde Ciencia y Tecnologıa (CONACYT) and the AAAmI re-search group at Tecnologico de Monterrey for the financialsupport in his PhD studies.
REFERENCES
[1] M. Frese, “The changing nature of work.” An Introduction toWork and Organizational Psychology: a European perspective.Blackwell Publishers, vol. 1, pp. 424–439, 2000. [Online]. Available:http://catdir.loc.gov/catdir/toc/fy036/99032109.html
[2] “European foundation for the improvement of living and workingconditions,” Fourth European Working conditions Survey, 2005.[Online]. Available: http://www.eurofound.europa.eu/ewco/surveys/EWCS2005/index.htm
[3] “Stress in america.” American Psychological Association, August 2012.[Online]. Available: http://apa.org/news/press/releases/stress/index.aspx?tab=2
8
[4] P. Schnall, K. Belkic, P. Landsbergis, and D. Baker, “The workplaceand cardiovascular disease,” Occupational Medicine: State of the art -reviews, no. 15, pp. 24–46, jan 2000.
[5] P. M. Bongers, C. R. de Winter, M. A. Kompier, and V. H. Hildebrandt,“Psychosocial factors at work and musculoskeletal disease,” Scandina-vian Journal of Work: Enivronment and Health, no. 19, pp. 297–312,1993.
[6] N. Kawakami, T. Tanigawa, A. S., A. Nakata, S. Sakurai, K. Yokoyama,and Y. Morita, “Effects of job strain on helper-inducer (d4+cd29+)and suppressor-inducer (cd4+cd45ra+) tcells in japanese blue-collarworkers,” Psychotherapy and Psychosomatics, no. 66, pp. 192–198,1997.
[7] P. A. Thoits, “Self, identity, stress, and mental health.” Handbookof the sociology of mental health. Springer Netherlands, pp. 357–377, 2013. [Online]. Available: http://link.springer.com/chapter/10.1007/978-94-007-4276-5 18#page-1
[8] A. Paoli, P. Parent-Thirion, “Working conditions in the accedingand candidate countries.” European Foundation for the Improvementof Living and Working Conditions, Office for Official Publicationsof the European Communities., no. 6, 2003. [Online]. Available:www.eurofound.europa.eu/publications/htmlfiles/ef0306.htm
[9] D. Hillier, F. Fewell, W. Cann, and V. Shephard, “Wellness at work:Enhancing the quality of our working lives,” International Review ofPsychiatry, vol. 17, no. 5, pp. 419–431, 2005.
[10] L. He, M. Lech, M. Maddage, and N. Allen, “Stress detection usingspeech spectrograms and sigma-pi neuron units,” in Natural Computa-tion, 2009. ICNC’09. Fifth International Conference on, vol. 2, Tianjin,China, 2009, pp. 260–264.
[11] M. F. Valstar, B. Jiang, M. Mehu, M. Pantic, and K. Scherer, “Thefirst facial expression recognition and analysis challenge,” in AutomaticFace & Gesture Recognition and Workshops (FG 2011), 2011 IEEEInternational Conference on. IEEE, 2011, pp. 921–926.
[12] E. Demerouti and A. B. Bakker, “The oldenburg burnout inventory:A good alternative to measure burnout and engagement,” Handbook ofstress and burnout in health care. Hauppauge, NY: Nova Science, 2008.
[13] R. Kocielnik, M. Pechenizkiy, and S. Natalia, “Stress analytics ineducation.” in EDM, 2012. [Online]. Available: http://rkocielnik.com/publications/education edm2012.pdf
[14] C. M. Ikehara CS, “Assessing cognitive load with physiological sensors.”Proceedings of the 38th Hawaii International Conference on SystemSciences, 2005.
[15] A. Grunerbl, A. Muaremi, V. Osmani, G. Bahle, S. Ohler, G. Troster,O. Mayora, C. Haring, and P. Lukowicz, “Smartphone-based recognitionof states and state changes in bipolar disorder patients,” Biomedical andHealth Informatics, IEEE Journal of, vol. 19, no. 1, pp. 140–148, Jan2015.
[16] A. Gruenerbl, V. Osmani, G. Bahle, J. C. Carrasco, S. Oehler,O. Mayora, C. Haring, and P. Lukowicz, “Using smart phonemobility traces for the diagnosis of depressive and manic episodesin bipolar patients,” in Proceedings of the 5th Augmented HumanInternational Conference on - AH ’14. New York, New York,USA: ACM Press, Mar. 2014, pp. 1–8. [Online]. Available:http://dl.acm.org/citation.cfm?id=2582051.2582089
[17] A. Sano and R. Picard, “Stress recognition using wearable sensorsand mobile phones,” in Affective Computing and Intelligent Interaction(ACII), 2013 Humaine Association Conference on, Sep. 2013, pp. 671–676.
[18] G. Bauer and P. Lukowicz, “Can smartphones detect stress-relatedchanges in the behaviour of individuals?” in Pervasive Computingand Communications Workshops (PERCOM Workshops), 2012 IEEEInternational Conference on, Mar. 2012, pp. 423–426.
[19] D. Carneiro, J. C. Castillo, P. Novais, A. Fernandez-Caballero, andJ. Neves, “Multimodal behavioral analysis for non-invasive stressdetection,” Expert Systems with Applications, vol. 39, no. 18, pp.13 376–13 389, 2012. [Online]. Available: http://www.sciencedirect.com/science/article/pii/S0957417412007816
[20] D. Giakoumis, A. Drosou, P. Cipresso, D. Tzovaras, G. Hassapis,A. Gaggioli, and G. Riva, “Using activity-related behavioural featurestowards more effective automatic stress detection.” Plos One, vol. 7,no. 9, p. e43571, 2012.
[21] A. R. Jensen and W. D. R. Jr., “The stroop color-word test: A review,”Acta Psychologica, vol. 25, no. 0, pp. 36–93, 1966. [Online]. Available:http://www.sciencedirect.com/science/article/pii/0001691866900047
[22] H. Lu, D. Frauendorfer, M. Rabbi, M. S. Mast, G. T. Chittaranjan, A. T.Campbell, D. Gatica-Perez, and T. Choudhury, “StressSense: Detectingstress in unconstrained acoustic environments using smartphones,” inProceedings of the 2012 ACM Conference on Ubiquitous Computing,
ser. UbiComp ’12. New York, NY, USA: ACM, 2012, pp. 351–360.[Online]. Available: http://doi.acm.org/10.1145/2370216.2370270
[23] A. Matic, V. Osmani, A. Maxhuni, and O. Mayora, “Multi-modal mobilesensing of social interactions,” in Pervasive computing technologiesfor healthcare (PervasiveHealth), 2012 6th international conference on.IEEE, 2012, pp. 105–114.
[24] A. Matic, V. Osmani, and O. Mayora, “Trade-offs in monitoring socialinteractions,” Communications Magazine, IEEE, vol. 51, no. 7, pp. 114–121, Jul. 2013.
[25] A. Matic, V. Osmani, and O. Mayora-Ibarra, “Analysis of social in-teractions through mobile phones,” Mobile Networks and Applications,vol. 17, no. 6, pp. 808–819, 2012.
[26] F.-T. Sun, C. Kuo, H.-T. Cheng, S. Buthpitiya, P. Collins, andM. Griss, “Activity-aware mental stress detection using physiologicalsensors,” in Mobile Computing, Applications, and Services, ser. LectureNotes of the Institute for Computer Sciences, Social Informatics andTelecommunications Engineering, M. Gris and G. Yang, Eds. SpringerBerlin Heidelberg, 2012, vol. 76, pp. 211–230. [Online]. Available:http://dx.doi.org/10.1007/978-3-642-29336-8 12
[27] A. Muaremi, B. Arnrich, and G. Troster, “Towards measuring stresswith smartphones and wearable devices during workday and sleep,”BioNanoScience, vol. 3, no. 2, pp. 172–183, 2013. [Online]. Available:http://dx.doi.org/10.1007/s12668-013-0089-2
[28] A. Bogomolov, B. Lepri, M. Ferron, F. Pianesi, and A. Pentland, “Per-vasive stress recognition for sustainable living,” in Pervasive Computingand Communications Workshops (PERCOM Workshops), 2014 IEEEInternational Conference on, Mar. 2014, pp. 345–350.
[29] S. Zhang, P. Murray, R. Zillmer, R. G. Eston, M. Catt, and A. V.Rowlands, “Activity classification using the genea: optimum samplingfrequency and number of axes.” Medicine and science in sports andexercise, vol. 44, no. 11, pp. 2228–2234, 2012.
[30] Q. Xu, T. L. Nwe, and C. Guan, “Cluster-based analysis for personalizedstress evaluation using physiological signals,” Biomedical and HealthInformatics, IEEE Journal of, vol. 19, no. 1, pp. 275–281, Jan 2015.
[31] “funf open sensing framework. https://code.google.com/p/funf-open-sensing-framework/source/browse/src/edu/mit/media/funf/probe/builtin/activityprobe.java?r=55f67cf53180dbba8ed4eddef422737f3abe030e.”accessed January 07 2015.
[32] S. Mukhopadhyay and G. Ray, “A new interpretation of nonlinear energyoperator and its efficacy in spike detection,” Biomedical Engineering,IEEE Transactions on, vol. 45, no. 2, pp. 180–187, 1998.
[33] T. M. Cover and J. A. Thomas, Elements of information theory. JohnWiley & Sons, 2012.
[34] L. Bao and S. Intille, “Activity recognition from user-annotatedacceleration data,” in Pervasive Computing, ser. Lecture Notes inComputer Science, A. Ferscha and F. Mattern, Eds. SpringerBerlin Heidelberg, 2004, vol. 3001, pp. 1–17. [Online]. Available:http://dx.doi.org/10.1007/978-3-540-24646-6 1
[35] D. J. Sheskin, Handbook of Parametric and Nonparametric StatisticalProcedures: Third Edition. CRC Press, 2003.
[36] J. Cohen, “A power primer.” Psychological bulletin, vol. 112, no. 1, pp.155–159, 1992.
[37] I. Witten, E. Frank, and M. Hall, Data Mining: Practical MachineLearning Tools and Techniques, 3rd ed., ser. The Morgan KaufmannSeries in Data Management Systems. Elsevier Science, 2011. [Online].Available: http://books.google.com.mx/books?id=5FIEAwyn9aoC
[38] B. D. Ripley, Pattern Recognition and Neural Networks. CambridgeUniversity Press, 1996. [Online]. Available: http://books.google.it/books?id=2SzT2p8vP1oC
[39] G. James, D. Witten, T. Hastie, and R. Tibshirani, An Introductionto Statistical Learning: with Applications in R, ser. SpringerTexts in Statistics. Springer New York, 2014. [Online]. Available:http://books.google.it/books?id=at1bmAEACAAJ
[40] P. J. Rousseeuw, “Silhouettes: a graphical aid to the interpretation andvalidation of cluster analysis,” Journal of computational and appliedmathematics, vol. 20, pp. 53–65, 1987.
[41] E. Frank and M. Hall, “A simple approach to ordinal classification,”in Machine Learning: ECML 2001, ser. Lecture Notes in ComputerScience, L. De Raedt and P. Flach, Eds. Springer Berlin Heidelberg,2001, vol. 2167, pp. 145–156. [Online]. Available: http://dx.doi.org/10.1007/3-540-44795-4 13
[42] L. Gaudette and N. Japkowicz, “Evaluation methods for ordinalclassification,” in Advances in Artificial Intelligence, ser. Lecture Notesin Computer Science, Y. Gao and N. Japkowicz, Eds. SpringerBerlin Heidelberg, 2009, vol. 5549, pp. 207–210. [Online]. Available:http://dx.doi.org/10.1007/978-3-642-01818-3 25