AUTOMATIC IMAGE PROCESSING ENGINE ORIENTED …aircconline.com/sipij/V9N2/9218sipij01.pdf ·...
14
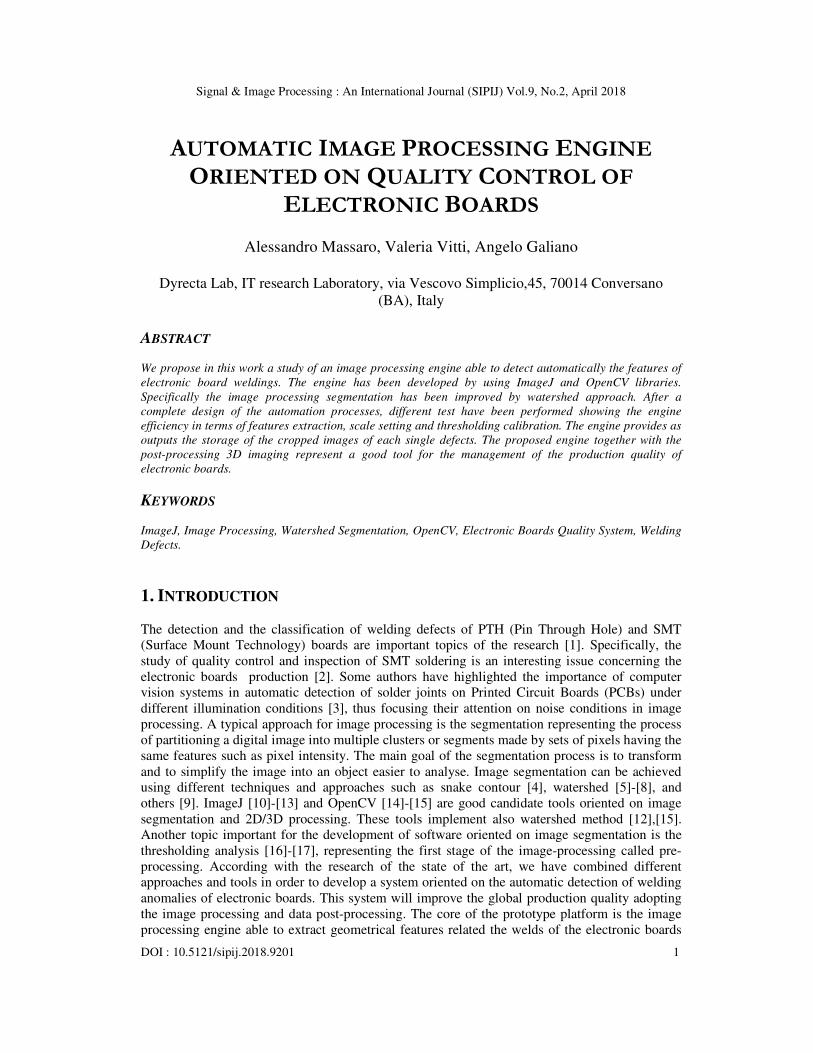
Signal & Image Processing : An International Journal (SIPIJ) Vol.9, No.2, April 2018 DOI : 10.5121/sipij.2018.9201 1 AUTOMATIC IMAGE PROCESSING ENGINE ORIENTED ON QUALITY CONTROL OF ELECTRONIC BOARDS Alessandro Massaro, Valeria Vitti, Angelo Galiano Dyrecta Lab, IT research Laboratory, via Vescovo Simplicio,45, 70014 Conversano (BA), Italy ABSTRACT We propose in this work a study of an image processing engine able to detect automatically the features of electronic board weldings. The engine has been developed by using ImageJ and OpenCV libraries. Specifically the image processing segmentation has been improved by watershed approach. After a complete design of the automation processes, different test have been performed showing the engine efficiency in terms of features extraction, scale setting and thresholding calibration. The engine provides as outputs the storage of the cropped images of each single defects. The proposed engine together with the post-processing 3D imaging represent a good tool for the management of the production quality of electronic boards. KEYWORDS ImageJ, Image Processing, Watershed Segmentation, OpenCV, Electronic Boards Quality System, Welding Defects. 1. INTRODUCTION The detection and the classification of welding defects of PTH (Pin Through Hole) and SMT (Surface Mount Technology) boards are important topics of the research [1]. Specifically, the study of quality control and inspection of SMT soldering is an interesting issue concerning the electronic boards production [2]. Some authors have highlighted the importance of computer vision systems in automatic detection of solder joints on Printed Circuit Boards (PCBs) under different illumination conditions [3], thus focusing their attention on noise conditions in image processing. A typical approach for image processing is the segmentation representing the process of partitioning a digital image into multiple clusters or segments made by sets of pixels having the same features such as pixel intensity. The main goal of the segmentation process is to transform and to simplify the image into an object easier to analyse. Image segmentation can be achieved using different techniques and approaches such as snake contour [4], watershed [5]-[8], and others [9]. ImageJ [10]-[13] and OpenCV [14]-[15] are good candidate tools oriented on image segmentation and 2D/3D processing. These tools implement also watershed method [12],[15]. Another topic important for the development of software oriented on image segmentation is the thresholding analysis [16]-[17], representing the first stage of the image-processing called pre- processing. According with the research of the state of the art, we have combined different approaches and tools in order to develop a system oriented on the automatic detection of welding anomalies of electronic boards. This system will improve the global production quality adopting the image processing and data post-processing. The core of the prototype platform is the image processing engine able to extract geometrical features related the welds of the electronic boards
Transcript of AUTOMATIC IMAGE PROCESSING ENGINE ORIENTED …aircconline.com/sipij/V9N2/9218sipij01.pdf ·...
Signal & Image Processing : An International Journal (SIPIJ) Vol.9, No.2, April 2018
DOI : 10.5121/sipij.2018.9201 1
AUTOMATIC IMAGE PROCESSING ENGINE
ORIENTED ON QUALITY CONTROL OF
ELECTRONIC BOARDS
Alessandro Massaro, Valeria Vitti, Angelo Galiano
Dyrecta Lab, IT research Laboratory, via Vescovo Simplicio,45, 70014 Conversano
(BA), Italy
ABSTRACT
We propose in this work a study of an image processing engine able to detect automatically the features of
electronic board weldings. The engine has been developed by using ImageJ and OpenCV libraries.
Specifically the image processing segmentation has been improved by watershed approach. After a
complete design of the automation processes, different test have been performed showing the engine
efficiency in terms of features extraction, scale setting and thresholding calibration. The engine provides as
outputs the storage of the cropped images of each single defects. The proposed engine together with the
post-processing 3D imaging represent a good tool for the management of the production quality of
electronic boards.
KEYWORDS
ImageJ, Image Processing, Watershed Segmentation, OpenCV, Electronic Boards Quality System, Welding
Defects.
1. INTRODUCTION
The detection and the classification of welding defects of PTH (Pin Through Hole) and SMT
(Surface Mount Technology) boards are important topics of the research [1]. Specifically, the
study of quality control and inspection of SMT soldering is an interesting issue concerning the
electronic boards production [2]. Some authors have highlighted the importance of computer
vision systems in automatic detection of solder joints on Printed Circuit Boards (PCBs) under
different illumination conditions [3], thus focusing their attention on noise conditions in image
processing. A typical approach for image processing is the segmentation representing the process
of partitioning a digital image into multiple clusters or segments made by sets of pixels having the
same features such as pixel intensity. The main goal of the segmentation process is to transform
and to simplify the image into an object easier to analyse. Image segmentation can be achieved
using different techniques and approaches such as snake contour [4], watershed [5]-[8], and
others [9]. ImageJ [10]-[13] and OpenCV [14]-[15] are good candidate tools oriented on image
segmentation and 2D/3D processing. These tools implement also watershed method [12],[15].
Another topic important for the development of software oriented on image segmentation is the
thresholding analysis [16]-[17], representing the first stage of the image-processing called pre-
processing. According with the research of the state of the art, we have combined different
approaches and tools in order to develop a system oriented on the automatic detection of welding
anomalies of electronic boards. This system will improve the global production quality adopting
the image processing and data post-processing. The core of the prototype platform is the image
processing engine able to extract geometrical features related the welds of the electronic boards
Signal & Image Processing : An International Journal (SIPIJ) Vol.9, No.2, April 2018
2
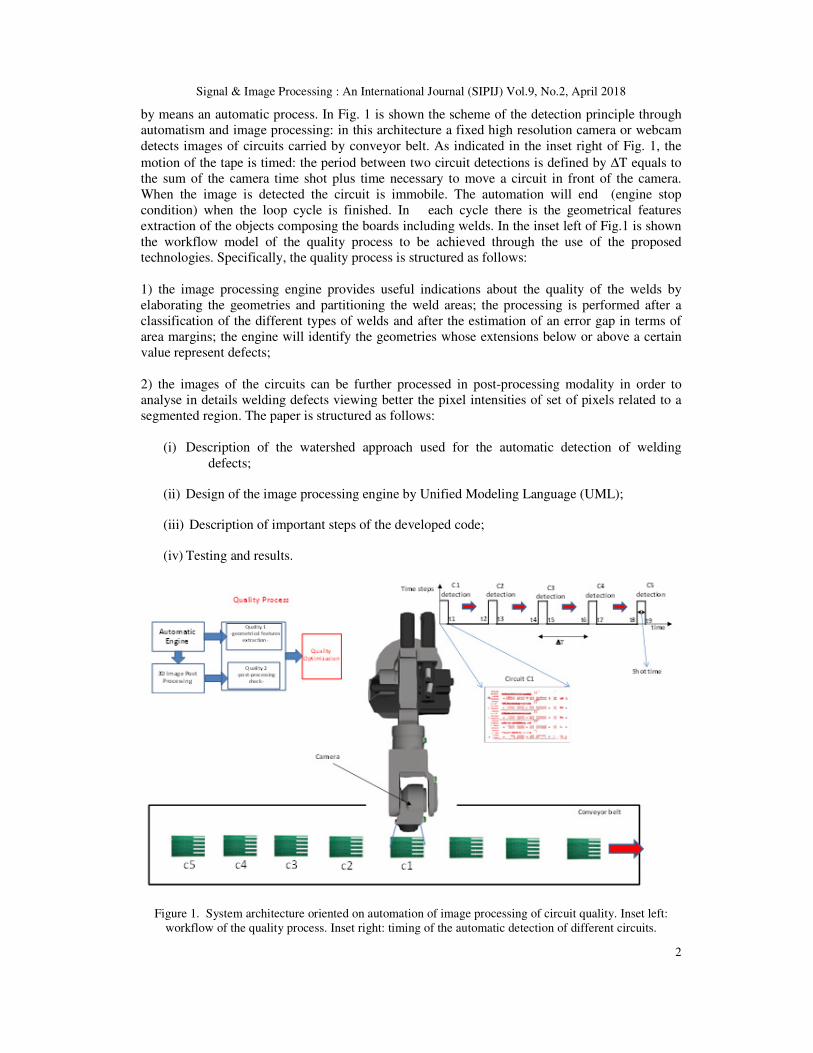
by means an automatic process. In Fig. 1 is shown the scheme of the detection principle through
automatism and image processing: in this architecture a fixed high resolution camera or webcam
detects images of circuits carried by conveyor belt. As indicated in the inset right of Fig. 1, the
motion of the tape is timed: the period between two circuit detections is defined by ∆T equals to
the sum of the camera time shot plus time necessary to move a circuit in front of the camera.
When the image is detected the circuit is immobile. The automation will end (engine stop
condition) when the loop cycle is finished. In each cycle there is the geometrical features
extraction of the objects composing the boards including welds. In the inset left of Fig.1 is shown
the workflow model of the quality process to be achieved through the use of the proposed
technologies. Specifically, the quality process is structured as follows:
1) the image processing engine provides useful indications about the quality of the welds by
elaborating the geometries and partitioning the weld areas; the processing is performed after a
classification of the different types of welds and after the estimation of an error gap in terms of
area margins; the engine will identify the geometries whose extensions below or above a certain
value represent defects;
2) the images of the circuits can be further processed in post-processing modality in order to
analyse in details welding defects viewing better the pixel intensities of set of pixels related to a
segmented region. The paper is structured as follows:
(i) Description of the watershed approach used for the automatic detection of welding
defects;
(ii) Design of the image processing engine by Unified Modeling Language (UML);
(iii) Description of important steps of the developed code;
(iv) Testing and results.
Figure 1. System architecture oriented on automation of image processing of circuit quality. Inset left:
workflow of the quality process. Inset right: timing of the automatic detection of different circuits.
Signal & Image Processing : An International Journal (SIPIJ) Vol.9, No.2, April 2018
3
2. IMAGE SEGMENTATION: WATERSHED APPROACH AND DEFECT
CLASSIFICATION The watershed method is a transformation defined on a grayscale image using mathematical
morphology. The mathematical morphology operators are suitable for image segmentation. We
describe briefly in this section the basic notions of the implemented mathematical operator. Let
u(x,y), being (x,y) ∈ℜ2, describing an image I. The morphological gradient of I is defined by
[18]:
( ) ( )Du A B u D u Dδ = − = ⊕ − � (1)
where A and B indicate the elementary dilation and erosion of u, respectively, by structuring an
element D. The operator used in the calculus is the morphological Laplacian defined as:
( ) 2 ( )Du u D u u D∆ = ⊕ − + � (2)
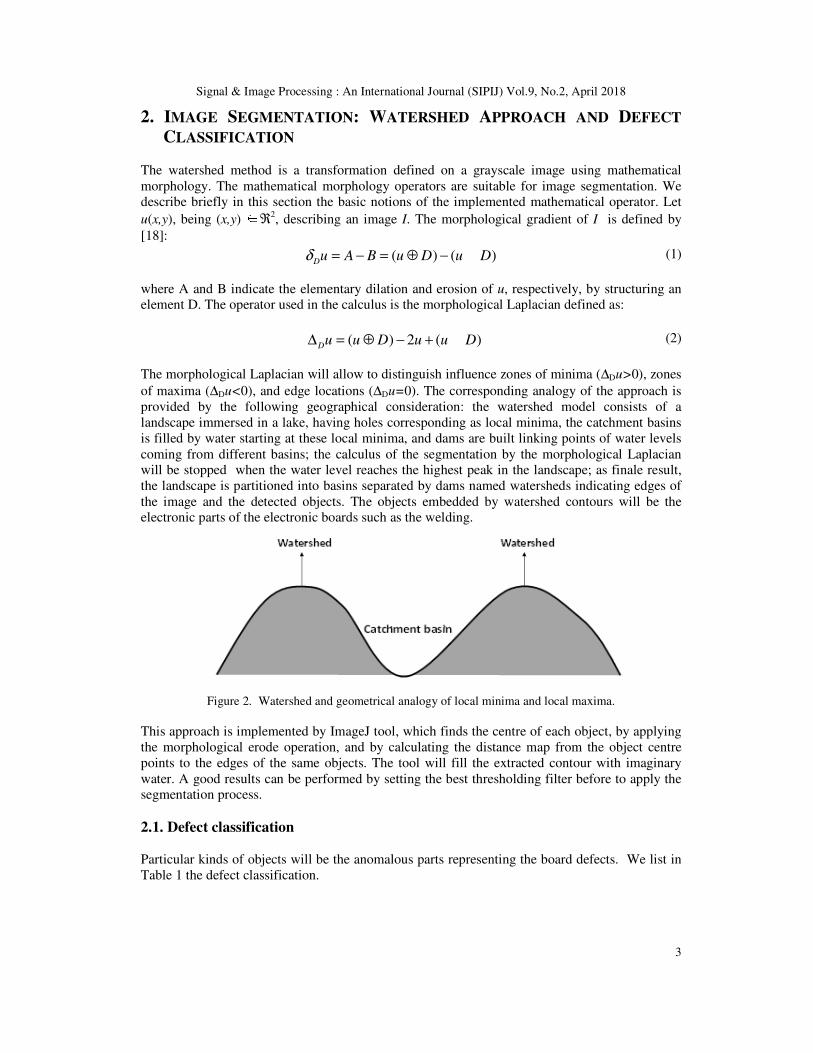
The morphological Laplacian will allow to distinguish influence zones of minima (∆Du>0), zones
of maxima (∆Du<0), and edge locations (∆Du=0). The corresponding analogy of the approach is
provided by the following geographical consideration: the watershed model consists of a
landscape immersed in a lake, having holes corresponding as local minima, the catchment basins
is filled by water starting at these local minima, and dams are built linking points of water levels
coming from different basins; the calculus of the segmentation by the morphological Laplacian
will be stopped when the water level reaches the highest peak in the landscape; as finale result,
the landscape is partitioned into basins separated by dams named watersheds indicating edges of
the image and the detected objects. The objects embedded by watershed contours will be the
electronic parts of the electronic boards such as the welding.
Figure 2. Watershed and geometrical analogy of local minima and local maxima.
This approach is implemented by ImageJ tool, which finds the centre of each object, by applying
the morphological erode operation, and by calculating the distance map from the object centre
points to the edges of the same objects. The tool will fill the extracted contour with imaginary
water. A good results can be performed by setting the best thresholding filter before to apply the
segmentation process.
2.1. Defect classification Particular kinds of objects will be the anomalous parts representing the board defects. We list in
Table 1 the defect classification.

Signal & Image Processing : An International Journal (SIPIJ) Vol.9, No.2, April 2018
4
Table 1. Main defect classification.
Defect Type
Irregular welding geometries
Big/small welds
Non solder
Irregular patterns
Agglomerates (coupled welds)
No welds made (detection by welds counting)
Dirty welds
Excess/less deposited welding materials
Component missing
Component shift
Component lift
Component Damage
3. DESIGN OF THE IMAGE PROCESSING ENGINE SYSTEM
In this section we discuss the design of the image processing engine. The tool UMLet 14.2 [19]
has been used for the design layouts of the prototype system. The design of the use cases diagram
in Fig. 3 (a) highlights the main functionalities of the following main actors:
• Actor: user who must monitor the quality process of circuit welding;
• Image Processing “Engine” actor (actor according to UML2 standard): actor programmed
for quality checking of welds.
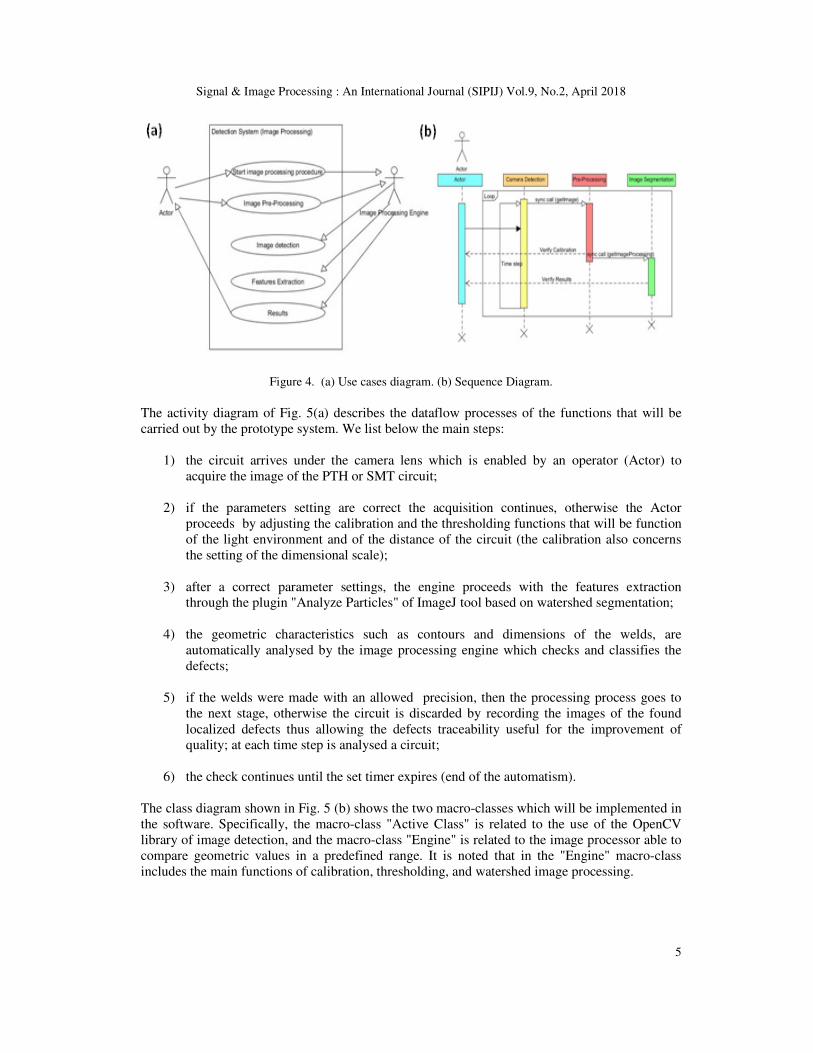
• The sequence diagram of Fig. 4 (b) explains the timing of the engine data flow: in the
loop of the image processing engine are distinguished the actor activity which starts the
image detection, from the engine actor activities of calibration and verification of the
results. The time chart follows the steps already reported in the activity diagram of Fig. 5
(a), where the phases of the engine are divided in:
• Acquisition of the camera image;
• Pre-processing (thresholding calibration and setting of the scale);
• Segmentation of the image with features extraction.
It is noted that for a better detection and processing it is important to:
1. fix the webcam camera so that it is stable;
2. fix the distance between the webcam and the acquisition point;
3. fix the lighting conditions;
4. Set scale according with welding dimensions (useful for passing values from pixels2 to
mm2).
Signal & Image Processing : An International Journal (SIPIJ) Vol.9, No.2, April 2018
5
Figure 4. (a) Use cases diagram. (b) Sequence Diagram.
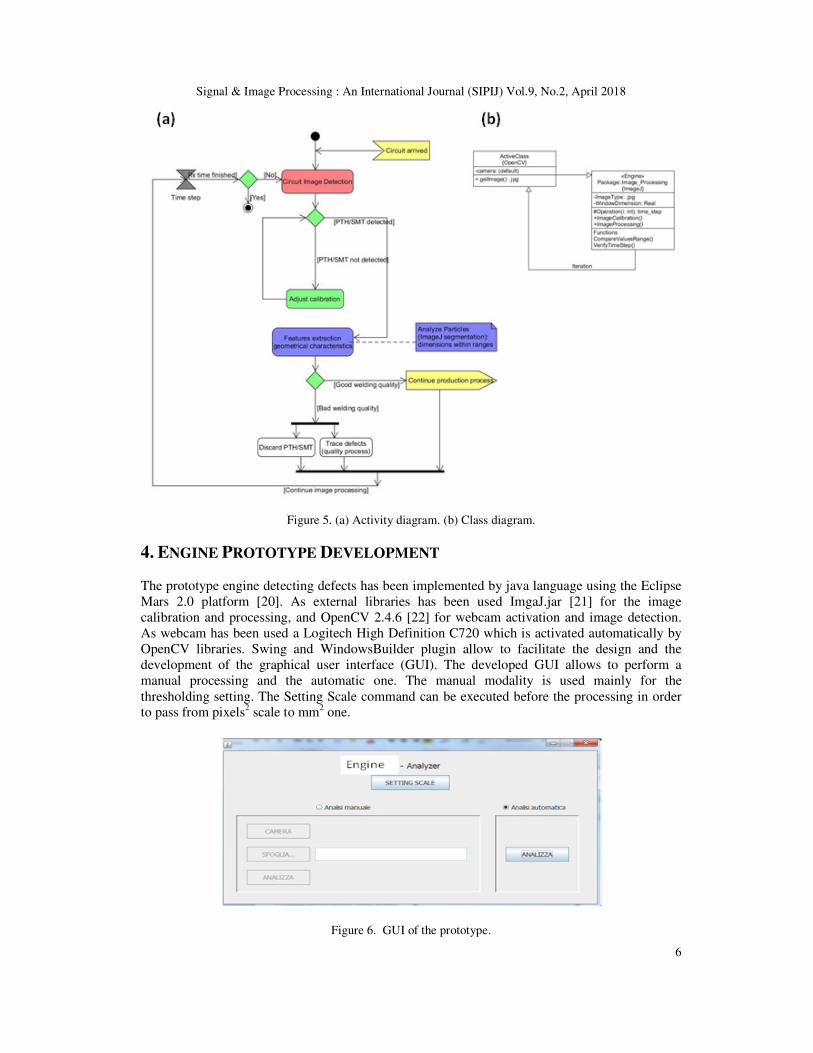
The activity diagram of Fig. 5(a) describes the dataflow processes of the functions that will be
carried out by the prototype system. We list below the main steps:
1) the circuit arrives under the camera lens which is enabled by an operator (Actor) to
acquire the image of the PTH or SMT circuit;
2) if the parameters setting are correct the acquisition continues, otherwise the Actor
proceeds by adjusting the calibration and the thresholding functions that will be function
of the light environment and of the distance of the circuit (the calibration also concerns
the setting of the dimensional scale);
3) after a correct parameter settings, the engine proceeds with the features extraction
through the plugin "Analyze Particles" of ImageJ tool based on watershed segmentation;
4) the geometric characteristics such as contours and dimensions of the welds, are
automatically analysed by the image processing engine which checks and classifies the
defects;
5) if the welds were made with an allowed precision, then the processing process goes to
the next stage, otherwise the circuit is discarded by recording the images of the found
localized defects thus allowing the defects traceability useful for the improvement of
quality; at each time step is analysed a circuit;
6) the check continues until the set timer expires (end of the automatism).
The class diagram shown in Fig. 5 (b) shows the two macro-classes which will be implemented in
the software. Specifically, the macro-class "Active Class" is related to the use of the OpenCV
library of image detection, and the macro-class "Engine" is related to the image processor able to
compare geometric values in a predefined range. It is noted that in the "Engine" macro-class
includes the main functions of calibration, thresholding, and watershed image processing.
Signal & Image Processing : An International Journal (SIPIJ) Vol.9, No.2, April 2018
6
Figure 5. (a) Activity diagram. (b) Class diagram.
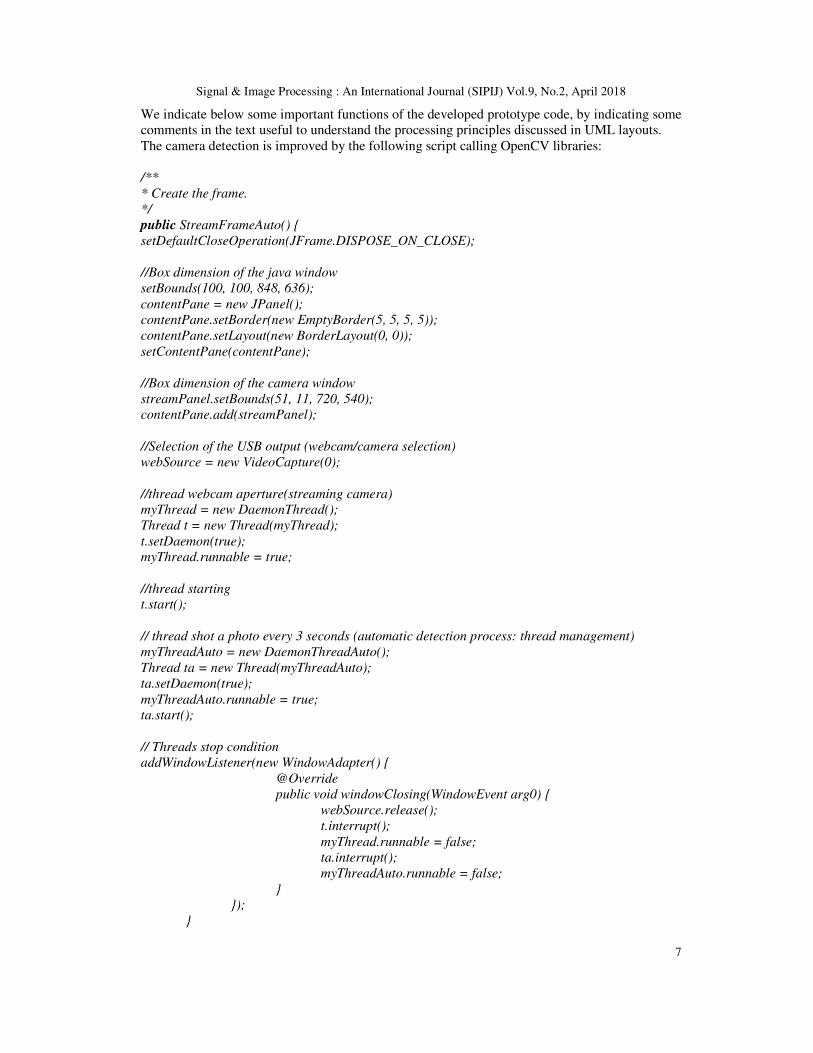
4. ENGINE PROTOTYPE DEVELOPMENT
The prototype engine detecting defects has been implemented by java language using the Eclipse
Mars 2.0 platform [20]. As external libraries has been used ImgaJ.jar [21] for the image
calibration and processing, and OpenCV 2.4.6 [22] for webcam activation and image detection.
As webcam has been used a Logitech High Definition C720 which is activated automatically by
OpenCV libraries. Swing and WindowsBuilder plugin allow to facilitate the design and the
development of the graphical user interface (GUI). The developed GUI allows to perform a
manual processing and the automatic one. The manual modality is used mainly for the
thresholding setting. The Setting Scale command can be executed before the processing in order
to pass from pixels2 scale to mm2 one.
Figure 6. GUI of the prototype.
Signal & Image Processing : An International Journal (SIPIJ) Vol.9, No.2, April 2018
7
We indicate below some important functions of the developed prototype code, by indicating some
comments in the text useful to understand the processing principles discussed in UML layouts.
The camera detection is improved by the following script calling OpenCV libraries:
/**
* Create the frame.
*/
public StreamFrameAuto() {
setDefaultCloseOperation(JFrame.DISPOSE_ON_CLOSE);
//Box dimension of the java window
setBounds(100, 100, 848, 636);
contentPane = new JPanel();
contentPane.setBorder(new EmptyBorder(5, 5, 5, 5));
contentPane.setLayout(new BorderLayout(0, 0));
setContentPane(contentPane);
//Box dimension of the camera window
streamPanel.setBounds(51, 11, 720, 540);
contentPane.add(streamPanel);
//Selection of the USB output (webcam/camera selection)
webSource = new VideoCapture(0);
//thread webcam aperture(streaming camera)
myThread = new DaemonThread();
Thread t = new Thread(myThread);
t.setDaemon(true);
myThread.runnable = true;
//thread starting
t.start();
// thread shot a photo every 3 seconds (automatic detection process: thread management)
myThreadAuto = new DaemonThreadAuto();
Thread ta = new Thread(myThreadAuto);
ta.setDaemon(true);
myThreadAuto.runnable = true;
ta.start();
// Threads stop condition
addWindowListener(new WindowAdapter() {
@Override
public void windowClosing(WindowEvent arg0) {
webSource.release();
t.interrupt();
myThread.runnable = false;
ta.interrupt();
myThreadAuto.runnable = false;
}
});
}
Signal & Image Processing : An International Journal (SIPIJ) Vol.9, No.2, April 2018
8
The command which calls the ImageJ function “Analyze Particles” (watershed segmentation) is
the following:
public void analyze(String path, String pathImage, String pathDetails){
ArrayList<ImagePlus> arrayImgDetail = new ArrayList<ImagePlus>();
ImagePlus image = new ImagePlus();
image = IJ.openImage(pathImage.replace("\\", "\\\\"));
ImagePlus imageDup = new Duplicator().run(image);
IJ.run(image, "Make Binary", "");
// Thresholding default (black and white)
IJ.run(image, "Threshold...", "");
RoiManager rm = new RoiManager(true);
ParticleAnalyzer.setRoiManager(rm);
IJ.run(image, "Analyze Particles...", " show=Ellipses display include");
ImagePlus imageDup2 = new Duplicator().run(image);
imageDup2.setTitle("Analyze Particles");
imageDup2.show();
//ROI coordinates are used for cropping of images surroundings defects
Roi[] rois = new Roi[rm.getCount()];
We observe that automatic particle analysis requires a “binary”, black and white, image, thus the
threshold range to set allow to select objects (welds) of interest apart from the background. In the
software prototype all pixels in the image whose values lie under the threshold are converted to
black and all pixels with values above the threshold are converted to white.
The following script enable, after a check of the presence region of interest (ROI) coordinates, the
cropping process of defect images.
// Check of ROI details and insertion of ROI coordinates in the array “rois” able to store all the
defects coordinates
Roi[] rois = new Roi[rm.getCount()];
if(rm == null || rm.getCount() == 0)
IJ.error("no details");
else
rois = rm.getRoisAsArray();
imageDup.setTitle("immagine di dettaglio duplicata");
imageDup.show();
//storage of defect images(if the array contains at least one data)
int j = 0;
if (rois.length != 0) {
for (int i = 0; i < rois.length; i++) {
imageDup.setRoi(rois[i]);
The logic condition able to select and to classify the welding defects is implemented by the
following script:
for (int i = 0; i < rois.length; i++) {
imageDup.setRoi(rois[i]);
if(imageDup.getStatistics().area<=X1 ||
(imageDup.getStatistics().area>=X2
&& imageDup.getStatistics().area<=X3)||
(imageDup.getStatistics().area>=X4
&& imageDup.getStatistics().area<=X5)||
imageDup.getStatistics().area>=X6){
Signal & Image Processing : An International Journal (SIPIJ) Vol.9, No.2, April 2018
9
arrayImgDetail.add(new Duplicator().run(imageDup));
// the images, defined by ROI coordinates, will be stored inside a defined directory
IJ.saveAs(arrayImgDetail.get(j), "jpg",
pathDetails.replace("\\", "\\\\") + "\\imageDett" + (i + 1) + ".jpg");
j++;
}
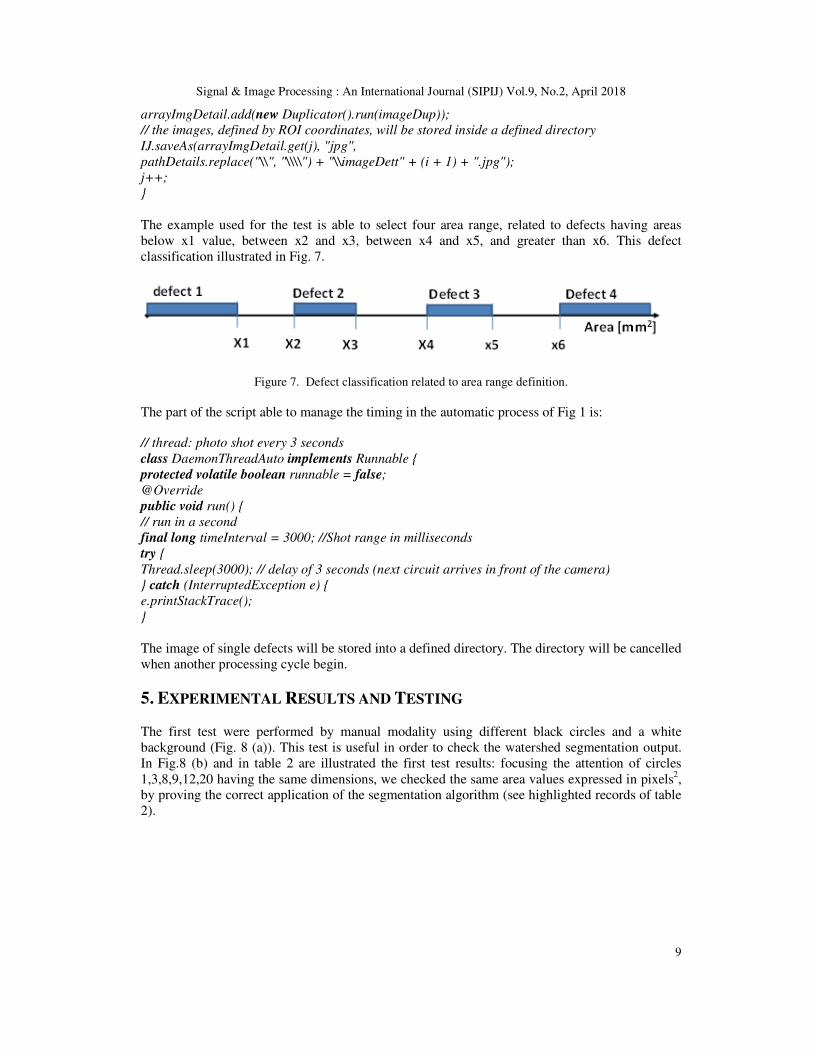
The example used for the test is able to select four area range, related to defects having areas
below x1 value, between x2 and x3, between x4 and x5, and greater than x6. This defect
classification illustrated in Fig. 7.
Figure 7. Defect classification related to area range definition.
The part of the script able to manage the timing in the automatic process of Fig 1 is:
// thread: photo shot every 3 seconds
class DaemonThreadAuto implements Runnable {
protected volatile boolean runnable = false;
@Override
public void run() {
// run in a second
final long timeInterval = 3000; //Shot range in milliseconds
try {
Thread.sleep(3000); // delay of 3 seconds (next circuit arrives in front of the camera)
} catch (InterruptedException e) {
e.printStackTrace();
}
The image of single defects will be stored into a defined directory. The directory will be cancelled
when another processing cycle begin.
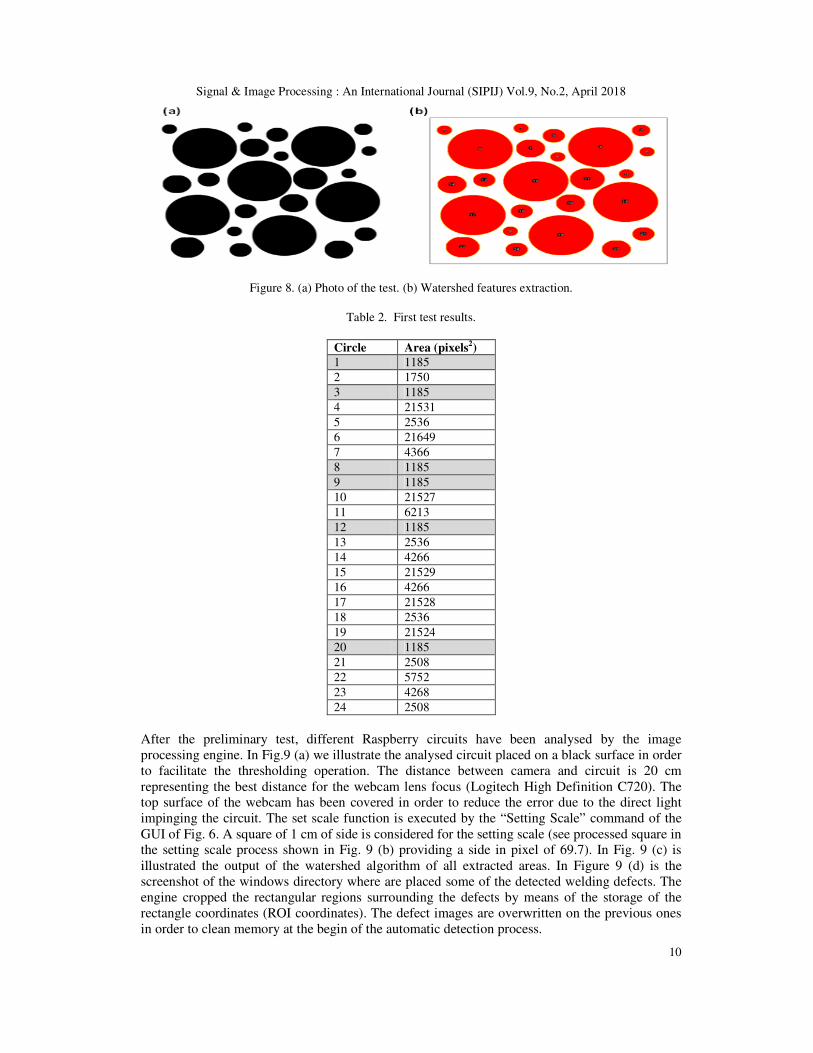
5. EXPERIMENTAL RESULTS AND TESTING The first test were performed by manual modality using different black circles and a white
background (Fig. 8 (a)). This test is useful in order to check the watershed segmentation output.
In Fig.8 (b) and in table 2 are illustrated the first test results: focusing the attention of circles
1,3,8,9,12,20 having the same dimensions, we checked the same area values expressed in pixels2,
by proving the correct application of the segmentation algorithm (see highlighted records of table
2).
Signal & Image Processing : An International Journal (SIPIJ) Vol.9, No.2, April 2018
10
Figure 8. (a) Photo of the test. (b) Watershed features extraction.
Table 2. First test results.
Circle Area (pixels2)
1 1185
2 1750
3 1185
4 21531
5 2536
6 21649
7 4366
8 1185
9 1185
10 21527
11 6213
12 1185
13 2536
14 4266
15 21529
16 4266
17 21528
18 2536
19 21524
20 1185
21 2508
22 5752
23 4268
24 2508
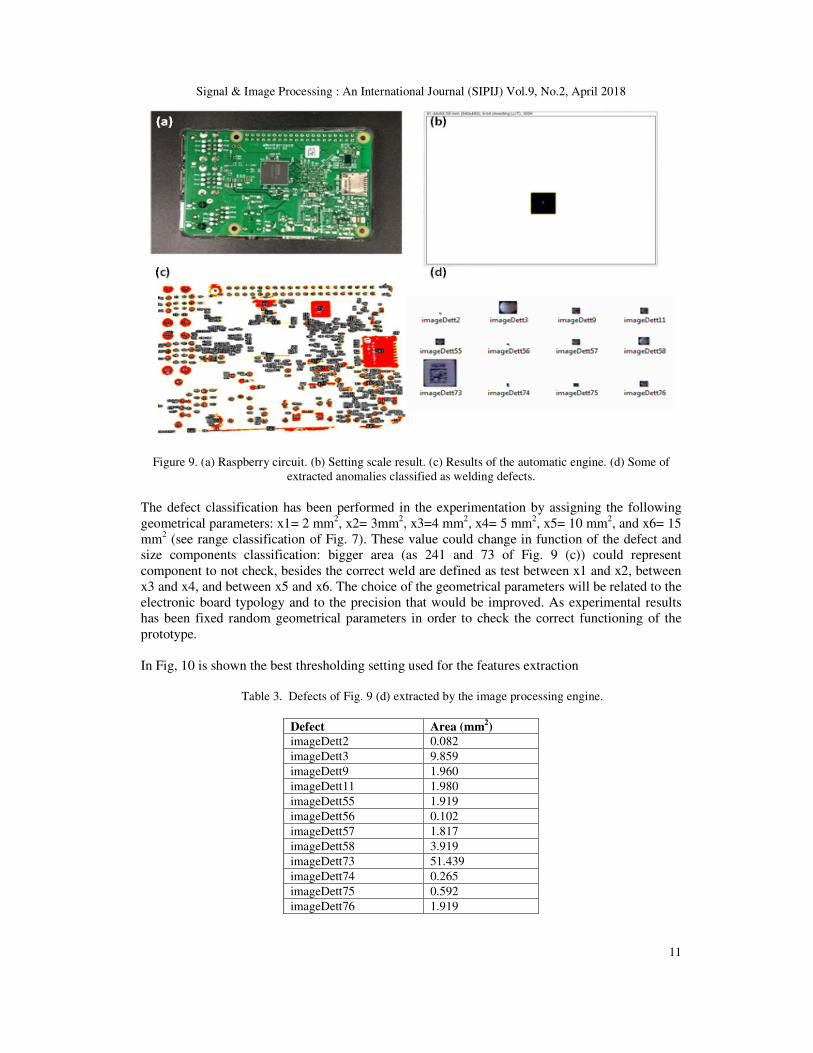
After the preliminary test, different Raspberry circuits have been analysed by the image
processing engine. In Fig.9 (a) we illustrate the analysed circuit placed on a black surface in order
to facilitate the thresholding operation. The distance between camera and circuit is 20 cm
representing the best distance for the webcam lens focus (Logitech High Definition C720). The
top surface of the webcam has been covered in order to reduce the error due to the direct light
impinging the circuit. The set scale function is executed by the “Setting Scale” command of the
GUI of Fig. 6. A square of 1 cm of side is considered for the setting scale (see processed square in
the setting scale process shown in Fig. 9 (b) providing a side in pixel of 69.7). In Fig. 9 (c) is
illustrated the output of the watershed algorithm of all extracted areas. In Figure 9 (d) is the
screenshot of the windows directory where are placed some of the detected welding defects. The
engine cropped the rectangular regions surrounding the defects by means of the storage of the
rectangle coordinates (ROI coordinates). The defect images are overwritten on the previous ones
in order to clean memory at the begin of the automatic detection process.
Signal & Image Processing : An International Journal (SIPIJ) Vol.9, No.2, April 2018
11
Figure 9. (a) Raspberry circuit. (b) Setting scale result. (c) Results of the automatic engine. (d) Some of
extracted anomalies classified as welding defects.
The defect classification has been performed in the experimentation by assigning the following
geometrical parameters: x1= 2 mm2, x2= 3mm
2, x3=4 mm
2, x4= 5 mm
2, x5= 10 mm
2, and x6= 15
mm2 (see range classification of Fig. 7). These value could change in function of the defect and
size components classification: bigger area (as 241 and 73 of Fig. 9 (c)) could represent
component to not check, besides the correct weld are defined as test between x1 and x2, between
x3 and x4, and between x5 and x6. The choice of the geometrical parameters will be related to the
electronic board typology and to the precision that would be improved. As experimental results
has been fixed random geometrical parameters in order to check the correct functioning of the
prototype.
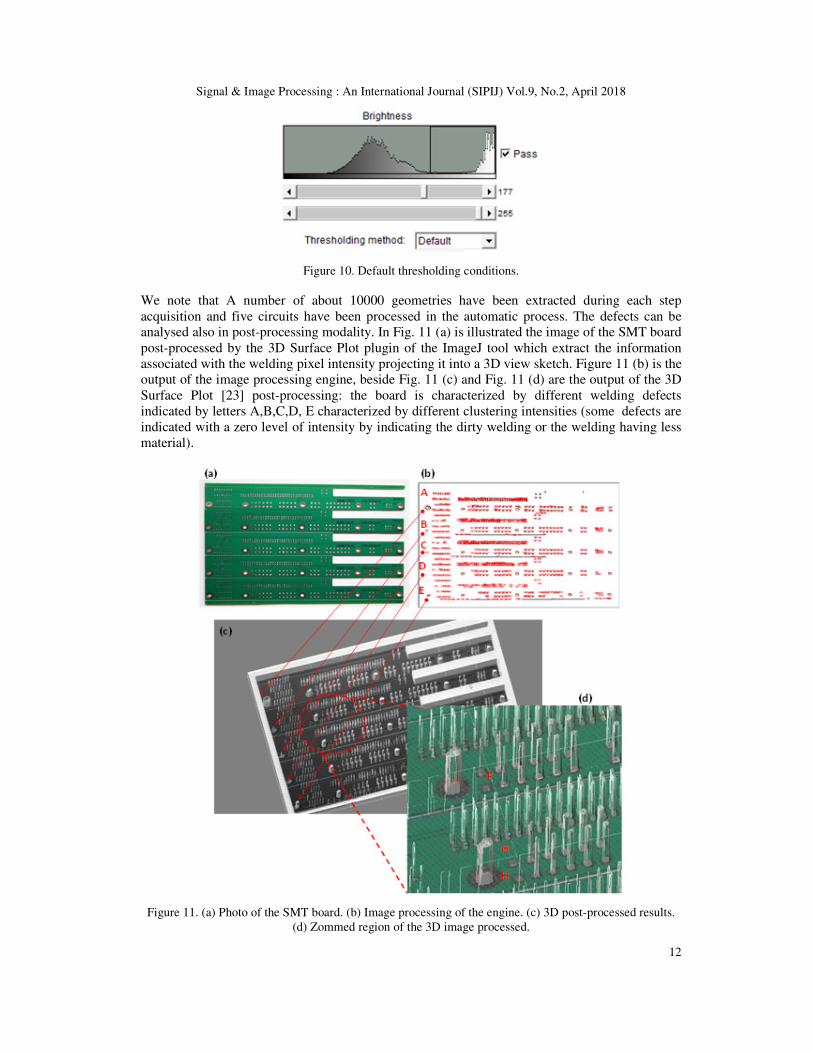
In Fig, 10 is shown the best thresholding setting used for the features extraction
Table 3. Defects of Fig. 9 (d) extracted by the image processing engine.
Defect Area (mm2)
imageDett2 0.082
imageDett3 9.859
imageDett9 1.960
imageDett11 1.980
imageDett55 1.919
imageDett56 0.102
imageDett57 1.817
imageDett58 3.919
imageDett73 51.439
imageDett74 0.265
imageDett75 0.592
imageDett76 1.919
Signal & Image Processing : An International Journal (SIPIJ) Vol.9, No.2, April 2018
12
Figure 10. Default thresholding conditions.
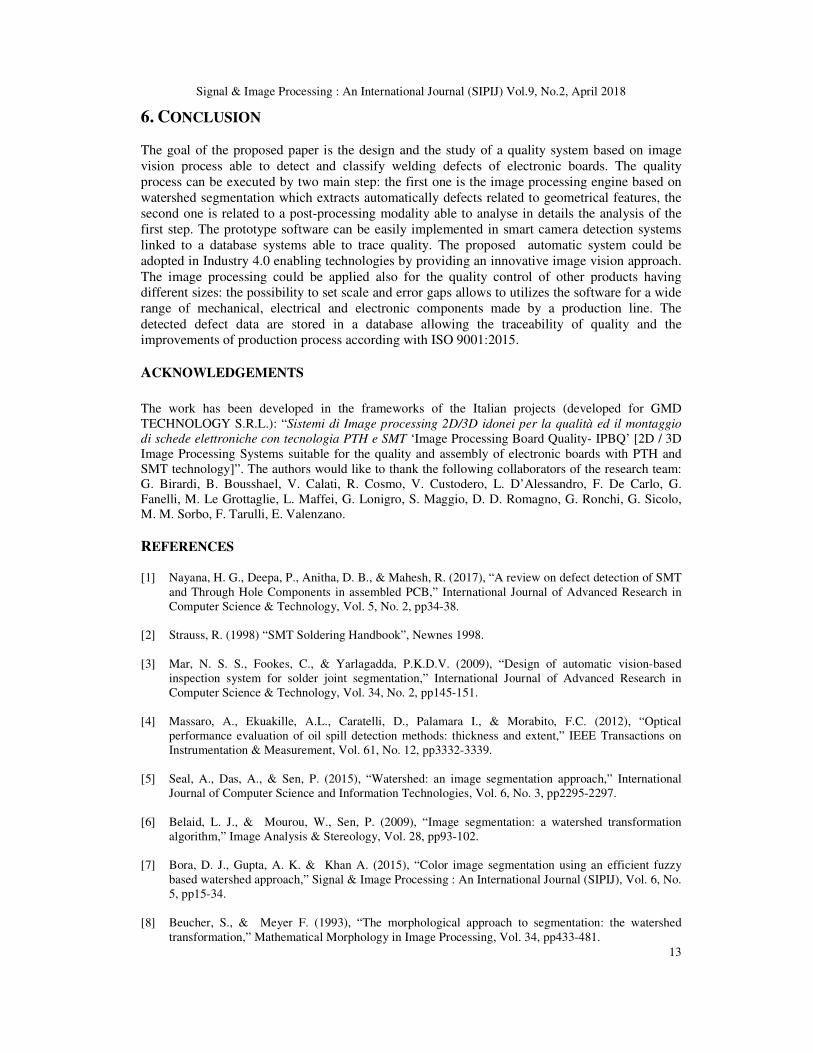
We note that A number of about 10000 geometries have been extracted during each step
acquisition and five circuits have been processed in the automatic process. The defects can be
analysed also in post-processing modality. In Fig. 11 (a) is illustrated the image of the SMT board
post-processed by the 3D Surface Plot plugin of the ImageJ tool which extract the information
associated with the welding pixel intensity projecting it into a 3D view sketch. Figure 11 (b) is the
output of the image processing engine, beside Fig. 11 (c) and Fig. 11 (d) are the output of the 3D
Surface Plot [23] post-processing: the board is characterized by different welding defects
indicated by letters A,B,C,D, E characterized by different clustering intensities (some defects are
indicated with a zero level of intensity by indicating the dirty welding or the welding having less
material).
Figure 11. (a) Photo of the SMT board. (b) Image processing of the engine. (c) 3D post-processed results.
(d) Zommed region of the 3D image processed.
Signal & Image Processing : An International Journal (SIPIJ) Vol.9, No.2, April 2018
13
6. CONCLUSION The goal of the proposed paper is the design and the study of a quality system based on image
vision process able to detect and classify welding defects of electronic boards. The quality
process can be executed by two main step: the first one is the image processing engine based on
watershed segmentation which extracts automatically defects related to geometrical features, the
second one is related to a post-processing modality able to analyse in details the analysis of the
first step. The prototype software can be easily implemented in smart camera detection systems
linked to a database systems able to trace quality. The proposed automatic system could be
adopted in Industry 4.0 enabling technologies by providing an innovative image vision approach.
The image processing could be applied also for the quality control of other products having
different sizes: the possibility to set scale and error gaps allows to utilizes the software for a wide
range of mechanical, electrical and electronic components made by a production line. The
detected defect data are stored in a database allowing the traceability of quality and the
improvements of production process according with ISO 9001:2015.
ACKNOWLEDGEMENTS
The work has been developed in the frameworks of the Italian projects (developed for GMD
TECHNOLOGY S.R.L.): “Sistemi di Image processing 2D/3D idonei per la qualità ed il montaggio
di schede elettroniche con tecnologia PTH e SMT ‘Image Processing Board Quality- IPBQ’ [2D / 3D
Image Processing Systems suitable for the quality and assembly of electronic boards with PTH and
SMT technology]”. The authors would like to thank the following collaborators of the research team:
G. Birardi, B. Bousshael, V. Calati, R. Cosmo, V. Custodero, L. D’Alessandro, F. De Carlo, G.
Fanelli, M. Le Grottaglie, L. Maffei, G. Lonigro, S. Maggio, D. D. Romagno, G. Ronchi, G. Sicolo,
M. M. Sorbo, F. Tarulli, E. Valenzano.
REFERENCES [1] Nayana, H. G., Deepa, P., Anitha, D. B., & Mahesh, R. (2017), “A review on defect detection of SMT
and Through Hole Components in assembled PCB,” International Journal of Advanced Research in
Computer Science & Technology, Vol. 5, No. 2, pp34-38.
[2] Strauss, R. (1998) “SMT Soldering Handbook”, Newnes 1998.
[3] Mar, N. S. S., Fookes, C., & Yarlagadda, P.K.D.V. (2009), “Design of automatic vision-based
inspection system for solder joint segmentation,” International Journal of Advanced Research in
Computer Science & Technology, Vol. 34, No. 2, pp145-151.
[4] Massaro, A., Ekuakille, A.L., Caratelli, D., Palamara I., & Morabito, F.C. (2012), “Optical
performance evaluation of oil spill detection methods: thickness and extent,” IEEE Transactions on
Instrumentation & Measurement, Vol. 61, No. 12, pp3332-3339.
[5] Seal, A., Das, A., & Sen, P. (2015), “Watershed: an image segmentation approach,” International
Journal of Computer Science and Information Technologies, Vol. 6, No. 3, pp2295-2297.
[6] Belaid, L. J., & Mourou, W., Sen, P. (2009), “Image segmentation: a watershed transformation
algorithm,” Image Analysis & Stereology, Vol. 28, pp93-102.
[7] Bora, D. J., Gupta, A. K. & Khan A. (2015), “Color image segmentation using an efficient fuzzy
based watershed approach,” Signal & Image Processing : An International Journal (SIPIJ), Vol. 6, No.
5, pp15-34.
[8] Beucher, S., & Meyer F. (1993), “The morphological approach to segmentation: the watershed
transformation,” Mathematical Morphology in Image Processing, Vol. 34, pp433-481.
Signal & Image Processing : An International Journal (SIPIJ) Vol.9, No.2, April 2018
14
[9] Dilpreet, K., & Ydwinder K. (2014), “Various image segmentation techniques: a review,”
International Journal of Computer Science and Mobile Computing, Vol. 3, No. 5, pp809-814.
[10] Abràmoff, M. D., Magalhães, P., J., & Ram S. J. (2004), “Image Processing with ImageJ,”
Biophotonics International,, Vol. 11, No. 7, pp36-42.
[11] Haeri, M. & Haeri, M. (2015), “ImageJ plugin for analysis of porous scaffolds used in tissue
engineering,” Journal of Open Research Software, Vol. 3: e1, pp.1-4.
[12] Rishi, Rana, N. (2015) “Particle size and shape analysis using ImageJ with customized tools for
segmentation of particles,” International Journal of Engineering Research & Technology (IJERT),
Vol. 4, No. 11, pp.247- 250.
[13] Cicala, G., Massaro, A., Velardi L., Senesi, G. S. & Valentini, A. (2014) “Self-assembled pillar-like
structures in nanodiamond layers by pulsed spray technique”, ACS Applied Materials & Interfaces,
Vol. 6, No. 23, pp21101-21109.
[14] Nidhi (2015) “Image processing and object detection”, International Journal of Applied Research,
Vol. 1, No. 9, pp396-399.
[15] Puri, N., Kaushik, S. (2011), “Analysis of the variants of watershed algorithm as a segmentation
technique in image processing,” Proceeding of 5th IEEE International Conference on Advanced
Computing & Communication Technologies, pp441-445.
[16] Moumena Al-Bayati & Ali El-Zaart (2013) “Automatic thresholding techniques for optical images”,
Signal & Image Processing : An International Journal (SIPIJ), Vol.4, No.3, pp1-15.
[17] Chatterjee, R. K., & Kar, A. (2017) “Optimal global threshold estimation using statistical change-
point detection”, Signal & Image Processing : An International Journal (SIPIJ), Vol.8, No.4, pp15-
24.
[18] Beucher, S., Rivest, J. F., & Soille, P. (1993) “Morphological gradients”, Journal of Electronic
Imaging, Vol.2, pp326-336.
[19] “UMLet 14.2 Free UML Tool for Fast UML Diagrams” 2018. [Online]. Available:
http://www.umlet.com/
[20] “Eclipse Mars Release” 2018. [Online]. Available: https://www.eclipse.org/mars/
[21] “imagej-1.46.jar” 2018. [Online]. Available:
http://www.java2s.com/Code/Jar/i/Downloadimagej146jar.htm
[22] “OpenCV” 2018. [Online]. Available: https://opencv.org/
[23] “Interactive 3D Surface Plot” 2018. [Online]. Available: https://imagej.nih.gov/ij/plugins/surface-
plot-3d.html
Corresponding Author
Alessandro Massaro: Research & Development Chief of Dyrecta Lab s.r.l.