Automatic Detection of Pain Intensityjeffcohn/biblio/ICMI2012.pdf · Automatic Detection of Pain...
6
Automatic Detection of Pain Intensity Zakia Hammal Carnegie Mellon University Robotics Institute, 5000 Forbes Ave Pittsburgh, PA 15213, USA [email protected] Jeffrey F. Cohn 1,2 (1) Carnegie Mellon University, (2) University of Pittsburgh 210 S. Bouquet Street Pittsburgh, PA 15213, USA [email protected] ABSTRACT Previous efforts suggest that occurrence of pain can be detected from the face. Can intensity of pain be detected as well? The Prkachin and Solomon Pain Intensity (PSPI) metric was used to classify four levels of pain intensity (none, trace, weak, and strong) in 25 participants with previous shoulder injury (McMaster-UNBC Pain Archive). Participants were recorded while they completed a series of movements of their affected and unaffected shoulders. From the video recordings, canonical normalized appearance of the face (CAPP) was extracted using active appearance modeling. To control for variation in face size, all CAPP were rescaled to 96x96 pixels. CAPP then was passed through a set of Log-Normal filters consisting of 7 frequencies and 15 orientations to extract 9216 features. To detect pain level, 4 support vector machines (SVMs) were separately trained for the automatic measurement of pain intensity on a frame-by-frame level using both 5-folds cross-validation and leave-one-subject- out cross-validation. F1 for each level of pain intensity ranged from 91% to 96% and from 40% to 67% for 5-folds and leave- one-subject-out cross-validation, respectively. Intra-class correlation, which assesses the consistency of continuous pain intensity between manual and automatic PSPI was 0.85 and 0.55 for 5-folds and leave-one-subject-out cross-validation, respectively, which suggests moderate to high consistency. These findings show that pain intensity can be reliably measured from facial expression in participants with orthopedic injury. Categories and Subject Descriptors J [Computer Applications]: J.3 [Life and Medical Sciences]; I.5.4 [Pattern Recognition Applications]; H.1.2 [User/Machine systems]: [Human information processing, Human Factors]. General Terms Algorithms, Measurement, Performance, Design, Experimentation, Human Factors. Keywords Facial Expressions, Pain, Intensity, Active Appearance Models (AAMs), Log-Normal filters, Support Vector Machines (SVMs). 1. INTRODUCTION Pain assessment and management are important across a wide range of disorders and treatment interventions. The assessment of pain is accomplished primarily through subjective reports of patients, caregivers, or medical staff. While convenient and useful, subjective reports have several limitations. These include inconsistent metrics, reactivity to suggestion, efforts at impression management or deception, and differences among clinicians’ and sufferers’ conceptualizations of pain. Further, self-report cannot be used with children or patients with certain neurological impairments, dementia, or those in transient states of consciousness or requiring breathing assistance [1]. Biomedical research has found that pain can be detected reliably from facial expression [26], [6]. Recent efforts in affective computing suggest that automatic detection of pain from facial expression is a feasible goal. Several groups have automatically distinguished pain from absence of pain [14], [1], [16], [10]. For clinical or experimental utility, pain intensity need be measured as well. Automatic measurement of pain from the face is challenging for at least two reasons. One is the lack of training and testing data of spontaneous, un-posed and unscripted, behavioral observations in individuals that have clinically relevant pain. The other is the difficulty of face and facial features analysis and segmentation in real world settings, such as medical clinics. The recent distribution of the UNBC-McMaster Pain Archive addresses the need for well-annotated facial expression recordings during acute pain induction in a clinical setting. Using the UNBC or other data sources, several approaches have been proposed to detect occurrence of pain: [23], [14], [1], [16], [10]. Notably, [11] proposed the more demanding task of detecting ordinal pain intensity. In the current contribution, we extend the state of the art in pain recognition by automatically detecting four levels of pain intensity consistent with the Prkachin and Solomon Pain Intensity (PSPI) metric in participants with orthopedic injuries. The PSPI [27] is a well-validated approach to manual measurement of pain that is based on the Facial Action Coding System (FACS) [9]. Pain is measured on an ordinal scale. Previous work has found that active appearance models (AAMs) are a powerful means of analyzing spontaneous pain expression. [1][16]. These approaches use gray-scale features, however, that may be less robust to the head pose variation that is common in pain. [17]. [3] found that biologically inspired features (e.g., Gabor magnitudes) are more robust to the registration error introduced by head rotation. [14] used biologically inspired features to discriminate real from feigned pain. Permission to make digital or hard copies of all or part of this work for personal or classroom use is granted without fee provided that copies are not made or distributed for profit or commercial advantage and that copies bear this notice and the full citation on the first page. To copy otherwise, or republish, to post on servers or to redistribute to lists, requires prior specific permission and/or a fee. ICMI ’12, October 22–26, 2012, Santa Monica, California, USA. Copyright 2012 ACM 978-1-4503-1467-1/12/10...$15.00..
Transcript of Automatic Detection of Pain Intensityjeffcohn/biblio/ICMI2012.pdf · Automatic Detection of Pain...
Automatic Detection of Pain Intensity Zakia Hammal
Carnegie Mellon University Robotics Institute, 5000 Forbes Ave
Pittsburgh, PA 15213, USA
Jeffrey F. Cohn1,2
(1) Carnegie Mellon University, (2) University of Pittsburgh
210 S. Bouquet Street Pittsburgh, PA 15213, USA
ABSTRACT Previous efforts suggest that occurrence of pain can be detected from the face. Can intensity of pain be detected as well? The Prkachin and Solomon Pain Intensity (PSPI) metric was used to classify four levels of pain intensity (none, trace, weak, and strong) in 25 participants with previous shoulder injury (McMaster-UNBC Pain Archive). Participants were recorded while they completed a series of movements of their affected and unaffected shoulders. From the video recordings, canonical normalized appearance of the face (CAPP) was extracted using active appearance modeling. To control for variation in face size, all CAPP were rescaled to 96x96 pixels. CAPP then was passed through a set of Log-Normal filters consisting of 7 frequencies and 15 orientations to extract 9216 features. To detect pain level, 4 support vector machines (SVMs) were separately trained for the automatic measurement of pain intensity on a frame-by-frame level using both 5-folds cross-validation and leave-one-subject-out cross-validation. F1 for each level of pain intensity ranged from 91% to 96% and from 40% to 67% for 5-folds and leave-one-subject-out cross-validation, respectively. Intra-class correlation, which assesses the consistency of continuous pain intensity between manual and automatic PSPI was 0.85 and 0.55 for 5-folds and leave-one-subject-out cross-validation, respectively, which suggests moderate to high consistency. These findings show that pain intensity can be reliably measured from facial expression in participants with orthopedic injury.
Categories and Subject Descriptors J [Computer Applications]: J.3 [Life and Medical Sciences]; I.5.4 [Pattern Recognition Applications]; H.1.2 [User/Machine systems]: [Human information processing, Human Factors].
General Terms Algorithms, Measurement, Performance, Design, Experimentation, Human Factors.
Keywords Facial Expressions, Pain, Intensity, Active Appearance Models (AAMs), Log-Normal filters, Support Vector Machines (SVMs).
1. INTRODUCTION Pain assessment and management are important across a wide range of disorders and treatment interventions. The assessment of pain is accomplished primarily through subjective reports of patients, caregivers, or medical staff. While convenient and useful, subjective reports have several limitations. These include inconsistent metrics, reactivity to suggestion, efforts at impression management or deception, and differences among clinicians’ and sufferers’ conceptualizations of pain. Further, self-report cannot be used with children or patients with certain neurological impairments, dementia, or those in transient states of consciousness or requiring breathing assistance [1]. Biomedical research has found that pain can be detected reliably from facial expression [26], [6]. Recent efforts in affective computing suggest that automatic detection of pain from facial expression is a feasible goal. Several groups have automatically distinguished pain from absence of pain [14], [1], [16], [10]. For clinical or experimental utility, pain intensity need be measured as well.
Automatic measurement of pain from the face is challenging for at least two reasons. One is the lack of training and testing data of spontaneous, un-posed and unscripted, behavioral observations in individuals that have clinically relevant pain. The other is the difficulty of face and facial features analysis and segmentation in real world settings, such as medical clinics. The recent distribution of the UNBC-McMaster Pain Archive addresses the need for well-annotated facial expression recordings during acute pain induction in a clinical setting. Using the UNBC or other data sources, several approaches have been proposed to detect occurrence of pain: [23], [14], [1], [16], [10]. Notably, [11] proposed the more demanding task of detecting ordinal pain intensity.
In the current contribution, we extend the state of the art in pain recognition by automatically detecting four levels of pain intensity consistent with the Prkachin and Solomon Pain Intensity (PSPI) metric in participants with orthopedic injuries. The PSPI [27] is a well-validated approach to manual measurement of pain that is based on the Facial Action Coding System (FACS) [9]. Pain is measured on an ordinal scale.
Previous work has found that active appearance models (AAMs) are a powerful means of analyzing spontaneous pain expression. [1][16]. These approaches use gray-scale features, however, that may be less robust to the head pose variation that is common in pain. [17]. [3] found that biologically inspired features (e.g., Gabor magnitudes) are more robust to the registration error introduced by head rotation. [14] used biologically inspired features to discriminate real from feigned pain.
Permission to make digital or hard copies of all or part of this work for personal or classroom use is granted without fee provided that copies are not made or distributed for profit or commercial advantage and that copies bear this notice and the full citation on the first page. To copy otherwise, or republish, to post on servers or to redistribute to lists, requires prior specific permission and/or a fee. ICMI ’12, October 22–26, 2012, Santa Monica, California, USA. Copyright 2012 ACM 978-1-4503-1467-1/12/10...$15.00..
In the current paper we couple AAMs with biologically inspired features to assess pain intensity in participants with significant orthopedic injury. Using video from the recently released UNBC-McMaster Should Pain Archive [18], AAMs are used to track and register rigid and non-rigid face motion [16] in each video frame. Based on this information, the canonical appearance of the face (CAPP) is extracted for each frame, rescaled to 96x96 pixels, and passed through a set of Log-Normal filters of 7 frequencies and 15 orientations [12]. The extracted spatial face representation is then aligned as a vector of 9216 features used by four SVMs trained separately for the automatic measurement of four levels of pain intensity.
The paper is organized as follows: Section 2 describes the pain intensity metric developed by Prkachin and Solomon [27]; Section 3 describes the UNBC-McMaster Shoulder Pain Expression Archive [16] used in the current paper; Section 4 describes the different steps of the proposed automatic model for pain intensity measurement; and Section 5 presents the obtained performances.
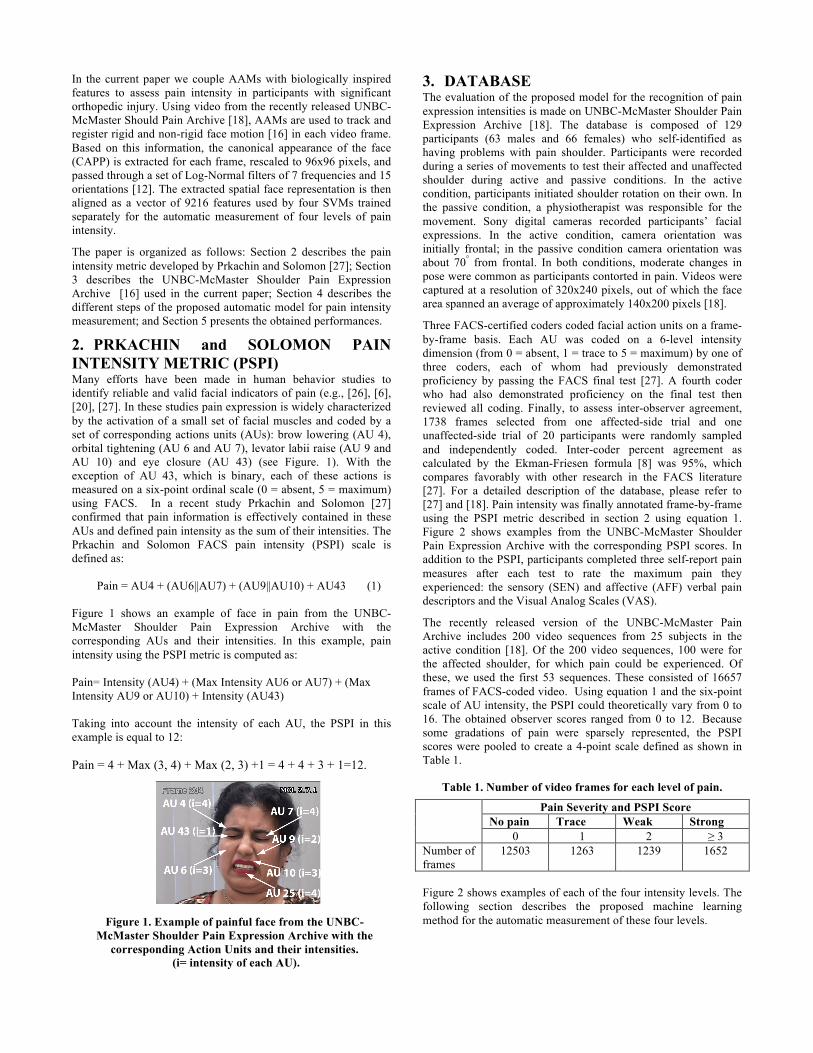
2. PRKACHIN and SOLOMON PAIN INTENSITY METRIC (PSPI) Many efforts have been made in human behavior studies to identify reliable and valid facial indicators of pain (e.g., [26], [6], [20], [27]. In these studies pain expression is widely characterized by the activation of a small set of facial muscles and coded by a set of corresponding actions units (AUs): brow lowering (AU 4), orbital tightening (AU 6 and AU 7), levator labii raise (AU 9 and AU 10) and eye closure (AU 43) (see Figure. 1). With the exception of AU 43, which is binary, each of these actions is measured on a six-point ordinal scale (0 = absent, 5 = maximum) using FACS. In a recent study Prkachin and Solomon [27] confirmed that pain information is effectively contained in these AUs and defined pain intensity as the sum of their intensities. The Prkachin and Solomon FACS pain intensity (PSPI) scale is defined as:
Pain = AU4 + (AU6||AU7) + (AU9||AU10) + AU43 (1) Figure 1 shows an example of face in pain from the UNBC-McMaster Shoulder Pain Expression Archive with the corresponding AUs and their intensities. In this example, pain intensity using the PSPI metric is computed as: Pain= Intensity (AU4) + (Max Intensity AU6 or AU7) + (Max Intensity AU9 or AU10) + Intensity (AU43) Taking into account the intensity of each AU, the PSPI in this example is equal to 12: Pain = 4 + Max (3, 4) + Max (2, 3) +1 = 4 + 4 + 3 + 1=12.
3. DATABASE The evaluation of the proposed model for the recognition of pain expression intensities is made on UNBC-McMaster Shoulder Pain Expression Archive [18]. The database is composed of 129 participants (63 males and 66 females) who self-identified as having problems with pain shoulder. Participants were recorded during a series of movements to test their affected and unaffected shoulder during active and passive conditions. In the active condition, participants initiated shoulder rotation on their own. In the passive condition, a physiotherapist was responsible for the movement. Sony digital cameras recorded participants’ facial expressions. In the active condition, camera orientation was initially frontal; in the passive condition camera orientation was about 70° from frontal. In both conditions, moderate changes in pose were common as participants contorted in pain. Videos were captured at a resolution of 320x240 pixels, out of which the face area spanned an average of approximately 140x200 pixels [18].
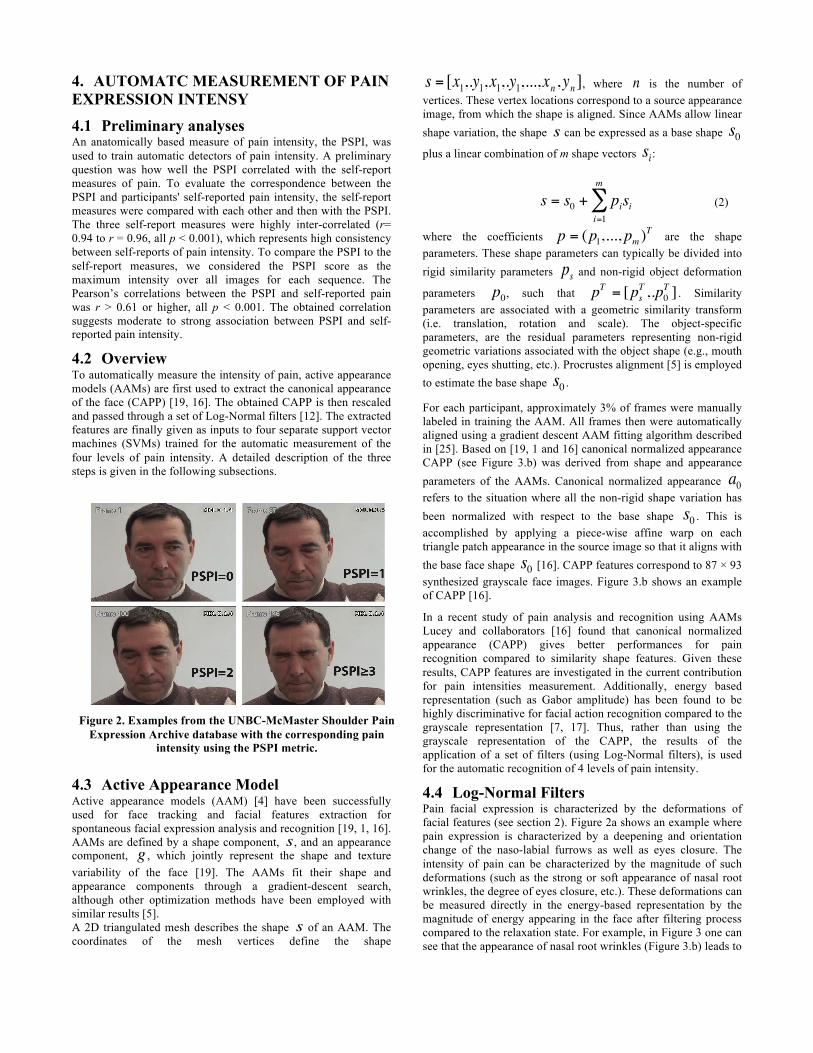
Three FACS-certified coders coded facial action units on a frame-by-frame basis. Each AU was coded on a 6-level intensity dimension (from 0 = absent, 1 = trace to 5 = maximum) by one of three coders, each of whom had previously demonstrated proficiency by passing the FACS final test [27]. A fourth coder who had also demonstrated proficiency on the final test then reviewed all coding. Finally, to assess inter-observer agreement, 1738 frames selected from one affected-side trial and one unaffected-side trial of 20 participants were randomly sampled and independently coded. Inter-coder percent agreement as calculated by the Ekman-Friesen formula [8] was 95%, which compares favorably with other research in the FACS literature [27]. For a detailed description of the database, please refer to [27] and [18]. Pain intensity was finally annotated frame-by-frame using the PSPI metric described in section 2 using equation 1. Figure 2 shows examples from the UNBC-McMaster Shoulder Pain Expression Archive with the corresponding PSPI scores. In addition to the PSPI, participants completed three self-report pain measures after each test to rate the maximum pain they experienced: the sensory (SEN) and affective (AFF) verbal pain descriptors and the Visual Analog Scales (VAS).
The recently released version of the UNBC-McMaster Pain Archive includes 200 video sequences from 25 subjects in the active condition [18]. Of the 200 video sequences, 100 were for the affected shoulder, for which pain could be experienced. Of these, we used the first 53 sequences. These consisted of 16657 frames of FACS-coded video. Using equation 1 and the six-point scale of AU intensity, the PSPI could theoretically vary from 0 to 16. The obtained observer scores ranged from 0 to 12. Because some gradations of pain were sparsely represented, the PSPI scores were pooled to create a 4-point scale defined as shown in Table 1.
Table 1. Number of video frames for each level of pain.
Pain Severity and PSPI Score No pain Trace Weak Strong
0 1 2 ≥ 3 Number of frames
12503 1263 1239 1652
Figure 2 shows examples of each of the four intensity levels. The following section describes the proposed machine learning method for the automatic measurement of these four levels.
Figure 1. Example of painful face from the UNBC-McMaster Shoulder Pain Expression Archive with the
corresponding Action Units and their intensities. (i= intensity of each AU).
4. AUTOMATC MEASUREMENT OF PAIN EXPRESSION INTENSY 4.1 Preliminary analyses An anatomically based measure of pain intensity, the PSPI, was used to train automatic detectors of pain intensity. A preliminary question was how well the PSPI correlated with the self-report measures of pain. To evaluate the correspondence between the PSPI and participants' self-reported pain intensity, the self-report measures were compared with each other and then with the PSPI. The three self-report measures were highly inter-correlated (r= 0.94 to r = 0.96, all p < 0.001), which represents high consistency between self-reports of pain intensity. To compare the PSPI to the self-report measures, we considered the PSPI score as the maximum intensity over all images for each sequence. The Pearson’s correlations between the PSPI and self-reported pain was r > 0.61 or higher, all p < 0.001. The obtained correlation suggests moderate to strong association between PSPI and self-reported pain intensity.
4.2 Overview To automatically measure the intensity of pain, active appearance models (AAMs) are first used to extract the canonical appearance of the face (CAPP) [19, 16]. The obtained CAPP is then rescaled and passed through a set of Log-Normal filters [12]. The extracted features are finally given as inputs to four separate support vector machines (SVMs) trained for the automatic measurement of the four levels of pain intensity. A detailed description of the three steps is given in the following subsections.
4.3 Active Appearance Model Active appearance models (AAM) [4] have been successfully used for face tracking and facial features extraction for spontaneous facial expression analysis and recognition [19, 1, 16]. AAMs are defined by a shape component,
€
s, and an appearance component,
€
g , which jointly represent the shape and texture variability of the face [19]. The AAMs fit their shape and appearance components through a gradient-descent search, although other optimization methods have been employed with similar results [5]. A 2D triangulated mesh describes the shape
€
s of an AAM. The coordinates of the mesh vertices define the shape
€
s = [x1,.y1,x1,.y1,...,xn ,yn ], where
€
n is the number of vertices. These vertex locations correspond to a source appearance image, from which the shape is aligned. Since AAMs allow linear shape variation, the shape
€
s can be expressed as a base shape
€
s0
plus a linear combination of m shape vectors
€
si:
€
s = s0 + pisii=1
m
∑ (2)
where the coefficients
€
p = (p1,..., pm )T are the shape
parameters. These shape parameters can typically be divided into rigid similarity parameters
€
ps and non-rigid object deformation
parameters
€
p0, such that
€
pT = [psT ,.p0
T ] . Similarity parameters are associated with a geometric similarity transform (i.e. translation, rotation and scale). The object-specific parameters, are the residual parameters representing non-rigid geometric variations associated with the object shape (e.g., mouth opening, eyes shutting, etc.). Procrustes alignment [5] is employed to estimate the base shape
€
s0 .
For each participant, approximately 3% of frames were manually labeled in training the AAM. All frames then were automatically aligned using a gradient descent AAM fitting algorithm described in [25]. Based on [19, 1 and 16] canonical normalized appearance CAPP (see Figure 3.b) was derived from shape and appearance parameters of the AAMs. Canonical normalized appearance
€
a0 refers to the situation where all the non-rigid shape variation has been normalized with respect to the base shape
€
s0 . This is accomplished by applying a piece-wise affine warp on each triangle patch appearance in the source image so that it aligns with the base face shape
€
s0 [16]. CAPP features correspond to 87 × 93 synthesized grayscale face images. Figure 3.b shows an example of CAPP [16].
In a recent study of pain analysis and recognition using AAMs Lucey and collaborators [16] found that canonical normalized appearance (CAPP) gives better performances for pain recognition compared to similarity shape features. Given these results, CAPP features are investigated in the current contribution for pain intensities measurement. Additionally, energy based representation (such as Gabor amplitude) has been found to be highly discriminative for facial action recognition compared to the grayscale representation [7, 17]. Thus, rather than using the grayscale representation of the CAPP, the results of the application of a set of filters (using Log-Normal filters), is used for the automatic recognition of 4 levels of pain intensity.
4.4 Log-Normal Filters Pain facial expression is characterized by the deformations of facial features (see section 2). Figure 2a shows an example where pain expression is characterized by a deepening and orientation change of the naso-labial furrows as well as eyes closure. The intensity of pain can be characterized by the magnitude of such deformations (such as the strong or soft appearance of nasal root wrinkles, the degree of eyes closure, etc.). These deformations can be measured directly in the energy-based representation by the magnitude of energy appearing in the face after filtering process compared to the relaxation state. For example, in Figure 3 one can see that the appearance of nasal root wrinkles (Figure 3.b) leads to
Figure 2. Examples from the UNBC-McMaster Shoulder Pain Expression Archive database with the corresponding pain
intensity using the PSPI metric. .

high-energy magnitude after filtering process (see the whitest areas in Figure 3.c). Thus, instead of using the grayscale representation of CAPP [16], we investigated the results of an additional filtering of the CAPP. To do so, a set of biologically based Log-Normal filters [12, 24] is applied to the extracted CAPP. Log-Normal filters were originally proposed by [24] for measuring frequencies and orientations in texture images for 3D shape detection. Log-Normal filters are a good model of the complex cells found in the visual cortex V1. Notably they share specific characteristics such as: they are symmetrical on a log-frequency scale; they are well defined even at very low frequency; and they sample completely the Fourier space (interested reader can find a more detailed description of the Log-Normal filters in [24], and their application for facial feature extractions in [12]).
Compared with the more commonly used Gabor filters, the Log-Normal filters are chosen because they may better sample the power spectrum and are easily tuned and separable in frequencies and orientations [12]. These attributes make them well suited for detecting features (such as the naso-labial furrows in the case of pain) at different scales and orientations [12]. The Log-Normal filters are defined as follow:
€
Gi, j ( f ,θ )2
= Gi( f ).Gj (θ )2
= A. 1f.exp −
12ln( f / f i)σ r
%
& '
(
) *
2%
& ' '
(
) * * .exp −
12θ −θ j
σθ
%
& '
(
) *
2%
& ' '
(
) * * (3)
Where
€
Gi, j is the transfer function of the filter at the ith frequency and the jth orientation,
€
Gi( f ) and
€
Gj (θ) , represents the frequency
and the orientation components of the filter, respectively;
€
fi is the central frequency,
€
θ j , the central orientation
€
(θ j = (180 /15).( j −1)),
€
σ f , the frequency bandwidth
€
(σ f = ln( f i+1 / f i)) ,
€
σθ , the orientation bandwidth and
€
A , a normalization factor. The factor
€
1/ f in equation1 accounts for the decrease of energy in function of the frequency, which in average
follows
€
1/ f α power law. This factor ensures that the sampling of the spectral information of the face takes into account the specific distribution of energy of the studied face at different scales. This property ensures that the facial information is optimally sampled over the different frequency bands [12].
To compute the magnitude of the response of the Log-Normal filters, the power spectrum of the normalized CAPP is multiplied by a bank of Log-Normal filters (15 orientations and 7 central frequencies, see [24, 12] for details on the filter bank design). The inverse Fourier transform (IFFT) is then computed to recover the spatial representation of the filtered CAPP. Figure 3.c shows an example of the magnitude response after the Log-Normal filtering in the case of strong pain (PSPI >3).
4.5 Support Vector Machine Based Classification To examine the possible description of pain intensities based on the Log-Normal filter responses, support vector machines (SVMs) [2] are used. Among other possible classifiers, SVMs are selected because they can cope with large representation spaces, are simple to train, and generalize well. SVMs are well-suited to the high dimensional representation of Log-Normal filter responses), which depend only on the number of training examples [22]. However, the training time complexity for an SVM is O(m3), where m is the number of training examples [2, 1]. A compromise between the best use of the training data and the training time is necessary for an efficient use of SVM. Previous work has shown the concurrent validity of SVMs for the recognition of spontaneous AU intensity (e.g. [22], [21]). In the current contribution, an SVM is built for each pain intensity level. Each SVM is trained on the corresponding images (see section 3) using a linear basis function. Four linear basis function SVMs are thus employed to recognize separately the four levels of pain intensity defined in section 3. Each SVM based intensity detector is trained using positive examples, which consist of the frames that the PSPI metric labeled as equal to that particular intensity. The negative examples correspond to all the other frames that the PSPI metric labeled with another intensity (see Table 1). The SVMs are trained on the (96x96=9216) pixel responses after the Log-Normal filtering process (see Figure 3.c). This process allows taking into account magnitude energy response as well as the distribution of this energy over the face (i.e. the spatial position). The generalization of the proposed SVM based models, for the recognition of pain intensity levels, to new data is evaluated by using the standard 5-folds cross-validation process and the leave-one-subject out validation process, in which all images of the test participant were excluded from training. Section 5 describes the obtained performances. In 5-folds cross-validation, train and test sets are independent with respect to frames (i.e. no frame included in training is used in testing). In leave-one-out cross-validation, train and test are independent with respect to participants. Thus, leave-one-out cross-validation affords a more rigorous test.
5. PERFORMANCES 5.1 Classification Results In this section, the performance of the proposed SVM classifiers for the four intensity levels is evaluated. Recall, precision and F1 are used to quantify the performance of each classifier in comparison with ground truth, the PSPI. The 5-folds cross- validation in which all video frames of the training set are removed from the testing set is used first for the evaluation. The
Figure 3. (a) Input frame, (b) Canonical Normalized Appearance CAPP, (c) Log-Normal filtering.
(orientation). .

obtained performance of each SVM is reported in Table 2. The best results are obtained for no pain (PSPI=0) and strong pain (PSPI>=3). These results may be explained by the strong difference between these two intensity levels relative to intermediate ones (see Figure 2). The obtained performances are encouraging given the task difficulty.
Table 2. Performances of Pain Intensity measurement compared to the PSPI manual detection (ground truth).
CR = Classification Rate (%), PR = Precision (%), F1 = F1 measure (%).
5-folds cross validation
Leave one subject out validation
Intensity CR PR F1 CR PR F1
0 97 95 96 61 65 57
1 96 97 92 72 37 67
2 96 97 91 79 35 40
>=3 98 98 95 80 70 60
Five-folds cross-validation is not participant-independent. Frames from the same participant may appear in both the training and testing sets. To control for this limitation, we next performed a leave-one participant out cross-validation in which participants (i.e. all the corresponding images) of the training are removed from the testing. This validation allows exploring how the proposed method for pain intensity measurement generalizes to a new set of participants who were not part of the training set. The leave-one-subject-out validation, consists in building 25 classifiers for each one of the four levels of pain intensity and iterating the process. In the leave one subject out validation, the number of training frames from all the video sequences is prohibitively large to train a SVM, as the training time complexity for SVM is O(m3), where m is the number of training examples [2, 1]. In order to make the learning process practical, while making the best use of the training data, each video sequence is down-sampled by taking 1 of every frames [21]. The training is thus performed on only 15% of video images excluding one participant. The SVM testing is made on the left- out participant. Based only on 15% of the training data, the obtained F1 for each level of pain intensity (from 0 to 3) was 0.57, 0.67, 0.40, and 0.60, respectively.
5.2 Intra Class Correlation Coefficient The Previous results are for category-level agreement. Here we compare consistency of the 4-level automatic measurement with the 12-level PSPI. To do so, the reliability between the proposed method and the PSPI is quantified by the intra-class correlation coefficient (ICC) [28]. Values range within a restricted interval [-1,1]. An ICC of 1 would indicate perfect consistency. The ICC is typically used to calculate the reliability of judgments. Following Mahoor [21], ICC is used to measure concurrent validity between automatic and manual coding of intensity. The ICC values between the automated measurements and the manually labeled pain intensity levels using the PSPI were 0.85 and 0.55 for 5-folds and leave-one-subject-out validation, respectively. The obtained ICC between ground truth PSPI and each of the estimated PSPIs suggest moderate to high consistency between manual and automatic measurement of pain intensity.
6. CONCLUSION AND PERSPECTIVES We used a combination of AAM, Log-Normal filters, and SVMs to measure four levels of pain intensity in the McMaster-UNBC Pain Archive. Using both 5-folds cross-validation and leave-one-subject-out cross-validation, the results suggest that automatic pain intensity measurement in a clinical setting is a feasible task. Intra-class correlation results were within the acceptable range for behavioral measurement. Replication in shoulder-pain populations and applications to other types of pain would be next steps for future research.
The current work opens several additional directions for future investigations. One is to compare additional types of features (e.g., Gabor) and classifiers. Two is to evaluate whether pain intensity might be detected better by first detecting AU intensity and then calculating PSPI from the result. In our work, classifiers were trained to directly detect PSPI scores without first detecting individual AU intensities. Detection of AU intensity is in the early stages of research [21]. To our knowledge, no one has yet compared direct versus indirect measurement of the intensity of pain or other constructs. Three, following previous work, we measured pain at the frame-by-frame level. However, pain expression is not static, but results from the progressive deformation of facial features over time. A next investigation would be to include dynamics when measuring pain intensity. And four, previous work in both pain and AU detection primarily regards head pose variation as a source of registration error. However, head pose is itself a potentially informative signal. In particular, head pose changes may themselves be a good indicator of pain [18] and pain intensity. We are currently in the process of exploring the dynamic characteristics of head orientation such as (but not limited to) the speed, velocity, and acceleration of pain indicators. We believe explicit attention to dynamics is an exciting direction for further research.
7. REFERENCES [1] Ashraf, A., B., Lucey, S., Cohn, J. F., Chen, T,., Prkachin,
K. M. and Solomon, P. E. (2009). The painful face: Pain expression recognition using active appearance models," Image and Vision Computing, vol. 27, pp. 1788–1796, 2009.
[2] Burges, Christopher J. C.; A Tutorial on Support Vector Machines for Pattern Recognition, Data Mining and Knowledge Discovery 2:121–167, 1998
[3] Chew, S. W., Lucey, P., Lucey, S., Saragih, J., Cohn, J. F., and Sridharan, S. In the pursuit of effective affective computing: The relationship between features and registration," IEEE Transactions on Systems, Man, and Cybernetics - Part B, In press.
[4] Cootes, T., Cooper, D., Taylor, C., and Graham, G. 1995. Active shape models - their training and application. Computer Vision and Image Understanding, 61(1):38–59, Jan. 1995.
[5] Cootes, T., Edwards, G. and Taylor, C. 2001. Active Appearance Models, IEEE Transactions on Pattern Analysis and Machine Intelligence, vol. 23, no. 6, pp. 681–685, 2001.
[6] Craig, K. D., Prkachin, K. M., and Grunau, R. V. E. 2001. The facial expression of pain. In D. C. Turk and R. M., editors, Handbook of pain assessment. Guilford, New York, 2nd edition, 2001.
[7] Donato, G., Bartlett, M., Hager, J, Ekman, P., and Sejnowski, T. 1999. Classifying facial actions,” IEEE Transactions on Pattern Analysis and Machine Intelligence, vol. 21, no. 10, pp. 974–989, 1999.
[8] Ekman P, Friesen WV. (1978). Manual for the Facial Action Coding System. Palo Alto, CA: Consulting Psychologists Press; 1978.
[9] Ekman, P., Friesen, W. V. and Hager, J. C. 2002. Facial action coding system: Research Nexus, Network Research Information, Salt Lake City, UT, 2002.
[10] Hammal, Z., and Kunz, M., (2012). Pain Monitoring: A Dynamic and Context-sensitive System (2012). Pattern Recognition. Volume 45, Issue 4, April 2012, Pages 1265-1280.
[11] Hammal, Z., Context based Recognition of Pain Expression Intensities. The 5th Workshop on Emotion in Human-Computer Interaction - Real World Challenges -held at the 23rd BCS HCI Group conference. Cambridge University, Cambridge, UK, September 2009. (Fraunhofer VERLAG, 2010).
[12] Hammal, Z., and Massot, C., (2011). Gabor-like Image Filtering for Transient Feature Detection and Global Energy Estimation Applied to Multi-Expression Classification. Pages 135-153. In "Communications in Computer and Information Science" (CCIS 229) (eds. P. Richard and J. Braz, Springer, CCIS 229, 2011).
[13] Kunz, M., Scharmann, S., Hemmeter, U., Schepelmann, K., & Lautenbacher, S. 2007. The facial expression of pain in patients with dementia. Pain. December 15;133(1-3):221-8, (2007).
[14] Littlewort, G.C., Bartlett, M.S. & Kang, M.S. 2007. Faces of Pain: Automated Measurement of Spontaneous Facial Expressions of Genuine and Posed Pain. Proc. ICMI, Nagoya, Aichi, Japan, November 12–15, 2007.
[15] Lehr, V.T., Zeskind, P.S., Ofenstein, J.P., Cepeda, E., Warrier, I. Aranda, J.V. 2007. Neonatal facial coding system scores and spectral characteristics of infant crying during newborn circumcision. Clin J Pain. Jun; 23(5):417-24, 2007.
[16] Lucey, P., Cohn, J. F., Howlett, J., Member, S. L., & Sridharan, S. (2011). Recognizing emotion with head pose variation: Identifying pain segments in video. Systems, Man, and Cybernetics – Part B, 41(3), 664-674.
[17] Lucey, P,, Lucey, S., and Cohn, J. F. (2010). Registration invariant representations for expression detection," International Conference on Digital Image Computing:
Techniques and Applications (DICTA), December 1-3, 2010 2010.
[18] Lucey, P., Cohn, J. F., Prkachin, K. M., Solomon, P., & Matthews, I. (2012). Painful data: The UNBC-McMaster shoulder pain expression archive database," Image, Vision, and Computing Journal, vol. 30, pp. 197-205, 2012.
[19] Lucey, S., Ashraf, A., and Cohn, J. (2007). Investigating spontaneous facial action recognition through aam representations of the face, in Face Recognition Book, K. Kurihara, Ed. Pro Literatur Verlag, 2007.
[20] Lints-Martindale, A.C., Hadjistavropoulos, T., Barber, B., Gibso, S.J. 2007. A psychophysical investigation of the facial action coding system as an index of pain variability among older adults with and without Alzheimer's disease. Pain Nov-Dec;8(8):678-89, 2007.
[21] Mahoor, M. H., Cadavid, S., Messinger, D. S. and Cohn, J. F. (2009). A Framework for Automated Measurement of the Intensity of Non-Posed Facial Action Units. 2nd IEEE Workshop on CVPR for Human communicative Behavior analysis (CVPR4HB), Miami Beach, June 25, 2009.
[22] Marian Stewart Bartlett, M.S., Littlewort, G., Frank, M., Lainscsek, C., Fasel, I., Movellan, J., (2006). Fully Automatic Facial Action Recognition in Spontaneous Behavior. Proceedings of the 7th International Conference on Automatic Face and Gesture Recognition (FGR’06)
[23] Maruf Monwar, Md. and Siamak R. 2006. Pain Recognition Using Artificial Neural Network. Proc. of IEEE International Symposium on Signal Processing and Information Technology 2006.
[24] Massot C., Herault J., 2008. Model of Frequency Analysis in the Visual Cortex and the Shape from Texture Problem, International Journal of Computer Vision, 76(2), 2008.
[25] Matthews, I. and Baker, S. 2004. Active appearance models revisited, International Journal of Computer Vision, vol. 60, no. 2, pp. 135–164, 2004.
[26] Prkachin, K., 1992. The consistency of facial expressions of pain: a com- parison across modalities,” Pain, vol. 51, pp. 297–306, 1992.
[27] Prkachin, K. M. & Solomon, P. E. 2008. The structure, reliability and validity of pain expression: Evidence from patients with shoulder pain. Pain, 139, 267-274, 2008.
[28] Shrout, P., and J. Fleiss, J. (1979). Intraclass correlations: uses in assessing rater reliability. Psychological Bulletin, 86(2):420–428, 1979.


![Pain Recognition Using Spatiotemporal Oriented Energy of Facial … · 2020. 7. 2. · energy of facial muscles is the one developed by Hammal et al. [10]. This system uses a combination](https://static.fdocuments.us/doc/165x107/613b9e21f8f21c0c82691907/pain-recognition-using-spatiotemporal-oriented-energy-of-facial-2020-7-2-energy.jpg)