Automatic defect detection on road pavement using ... · automatic detection and classification of...
5
AUTOMATIC DETECTION AND CLASSIFICATION OF DEFECT ON ROAD PAVEMENT USING ANISOTROPY MEASURE Tien Sy NGUYEN(1)(2), Manuel AVILA(1), BEGOT Stephane(1) (1) Institute PRISME University Orleans, IUT Chateauroux, France (2) Vectra Company,Buzanais, France web: www.vectra.fr email: [email protected] ABSTRACT Existing systems for automated pavement defect detection can only identify cracking type defects. In this paper, we in- troduce a method which can detect not only cracks as small as 1mm in width, but also two other defect types: joint and bridged. Road images are captured by our acquisition sys- tem. Firstly, a pre-processing step is applied on images to remove lane-marking. Then an anisotropy measure is calcu- lated to detect road defects. Finally, a backpropagation neu- ral network is used to classify the images into four classes: defect-free, crack, joint and bridged. Experimental results were performed on real road images which were labelled by human operators. Comparisons with other methods are also given. 1. INTRODUCTION To manage road network, road authorities need accurate and up-to-date information about road defects. In France, thou- sands of kilometers of roads need to be inspected each year. In the past, road inspection process was done manually on road by human inspectors; this method is slow and unsafe for the inspectors and road users [1]. In the last few years, several automated pavement inspecting systems which use advanced machine vision technology have been developed. Some such devices are CSIRO’s RoadCrack vehicle [2] and Roadware’s ARAN system [3]. Unfortunately, all existing systems are only able to detect crack defects. We developed AMAC R [4] (Figure 1(a)) - a multifunction device for road analysis. One of its functions is to capture road surface im- ages for defect inspection. Actually, the inspection process is done offline by human operators via viewing captured im- ages. This manual inspection is not only time-consuming, costly but also subjective. For this reason, methods for auto- matic defect detection surface images are required. Defect detection on pavement surface is a difficult prob- lem due to the noisy pavement surfaces [5]. There are differ- ent types of texture that can be encountered on road pave- ments. Furthermore, by traffic effects, pavement texture varies on different zones of the image. Authors in [1] also showed that many road pavements have “strong texture”. It means that, crack is thinner than aggregate size and distance inter-aggregates. As a result, it is difficult to distinguish a crack with an unusual aggregate distribution. Because of the above reasons, methods for detecting defects on texture surface which use regularities of background texture as fre- quency or orientation cannot be applied on road pavement surface. All existing methods for detecting defect on pavement surface were based on characteristics of crack. They con- sider that crack pixels are darker than their surrounding. Au- thors in [6, 7, 8, 9, 10] used a fixed threshold, while Cheng et al [11] employed a fuzzy threshold technique to detect dark pixels (crack). Oliveira et al [12] and Huang [13] proposed another approach, they divide image into grid cells and each cell is classified as crack or crack-free cell using mean and variance of grayscale values. Subirats et al [1] supposed that, by applying a 2D CWT (Continuous Wavelet Transform), the differences between crack pixels and background pix- els could be raised up. In their approach, crack pixels were identified by thresholding on coefficient maps of 2D CWT through different scales. But in case of “strong texture”, the CWT not only raises up crack pixels but also raise noise. From our experience in pavement image analyzing and by deduction from above researches, we found that crack has three characteristics: • Darker than its surrounding (because of crack form, many light rays cannot be reflected from crack to cam- era (Figure 1(b)), • Continuous (crack can be thinner than aggregates but it is always longer than them), • Dominant orientation (on all length of crack or on each segment). Crack detection approaches, which use only the first fea- ture, have limitations on difficult texture type of pavement. Cell-dividing methods are only able to detect big crack. When crack is small ( 1 or 2 pixels in width), cell-dividing methods cannot distinguish crack-cell and normal - cell by only considering mean and variance of the cell. Threshold method has drawbacks on dark textures and on low contrast cracks [6]. In this paper, we introduce a crack detection method us- ing an anisotropy measure. This measure takes into account all of threes above crack features. Our experimental results show that the method gives a good crack detection on several pavement types. Crack which is as small as one millimeter in width can be detected. Furthermore, two other types of de- fect (joint and bridged) which have similar features as crack can be detected by our method. In the next sessions, after a brief description of our acqui- sition system, we describe our defect detection and classifi- cation method. Experimental results are presented in com- parison with other methods and with the results of operator detection. Finally, conclusions are given. 17th European Signal Processing Conference (EUSIPCO 2009) Glasgow, Scotland, August 24-28, 2009 © EURASIP, 2009 617
Transcript of Automatic defect detection on road pavement using ... · automatic detection and classification of...

AUTOMATIC DETECTION AND CLASSIFICATION OF DEFECT ON ROADPAVEMENT USING ANISOTROPY MEASURE
Tien Sy NGUYEN(1)(2), Manuel AVILA(1), BEGOT Stephane(1)
(1) Institute PRISMEUniversity Orleans, IUT Chateauroux, France
(2) Vectra Company,Buzanais, Franceweb: www.vectra.fr
email: [email protected]
ABSTRACT
Existing systems for automated pavement defect detectioncan only identify cracking type defects. In this paper, we in-troduce a method which can detect not only cracks as smallas 1mm in width, but also two other defect types: joint andbridged. Road images are captured by our acquisition sys-tem. Firstly, a pre-processing step is applied on images toremove lane-marking. Then an anisotropy measure is calcu-lated to detect road defects. Finally, a backpropagation neu-ral network is used to classify the images into four classes:defect-free, crack, joint and bridged. Experimental resultswere performed on real road images which were labelled byhuman operators. Comparisons with other methods are alsogiven.
1. INTRODUCTION
To manage road network, road authorities need accurate andup-to-date information about road defects. In France, thou-sands of kilometers of roads need to be inspected each year.In the past, road inspection process was done manually onroad by human inspectors; this method is slow and unsafefor the inspectors and road users [1]. In the last few years,several automated pavement inspecting systems which useadvanced machine vision technology have been developed.Some such devices are CSIRO’s RoadCrack vehicle [2] andRoadware’s ARAN system [3]. Unfortunately, all existingsystems are only able to detect crack defects. We developedAMAC R©[4] (Figure 1(a)) - a multifunction device for roadanalysis. One of its functions is to capture road surface im-ages for defect inspection. Actually, the inspection processis done offline by human operators via viewing captured im-ages. This manual inspection is not only time-consuming,costly but also subjective. For this reason, methods for auto-matic defect detection surface images are required.
Defect detection on pavement surface is a difficult prob-lem due to the noisy pavement surfaces [5]. There are differ-ent types of texture that can be encountered on road pave-ments. Furthermore, by traffic effects, pavement texturevaries on different zones of the image. Authors in [1] alsoshowed that many road pavements have “strong texture”. Itmeans that, crack is thinner than aggregate size and distanceinter-aggregates. As a result, it is difficult to distinguish acrack with an unusual aggregate distribution. Because ofthe above reasons, methods for detecting defects on texturesurface which use regularities of background texture as fre-quency or orientation cannot be applied on road pavementsurface.
All existing methods for detecting defect on pavementsurface were based on characteristics of crack. They con-sider that crack pixels are darker than their surrounding. Au-thors in [6, 7, 8, 9, 10] used a fixed threshold, while Cheng etal [11] employed a fuzzy threshold technique to detect darkpixels (crack). Oliveira et al [12] and Huang [13] proposedanother approach, they divide image into grid cells and eachcell is classified as crack or crack-free cell using mean andvariance of grayscale values. Subirats et al [1] supposed that,by applying a 2D CWT (Continuous Wavelet Transform),the differences between crack pixels and background pix-els could be raised up. In their approach, crack pixels wereidentified by thresholding on coefficient maps of 2D CWTthrough different scales. But in case of “strong texture”, theCWT not only raises up crack pixels but also raise noise.
From our experience in pavement image analyzing andby deduction from above researches, we found that crack hasthree characteristics:
• Darker than its surrounding (because of crack form,many light rays cannot be reflected from crack to cam-era (Figure 1(b)),
• Continuous (crack can be thinner than aggregates but itis always longer than them),
• Dominant orientation (on all length of crack or on eachsegment).
Crack detection approaches, which use only the first fea-ture, have limitations on difficult texture type of pavement.Cell-dividing methods are only able to detect big crack.When crack is small ( 1 or 2 pixels in width), cell-dividingmethods cannot distinguish crack-cell and normal - cell byonly considering mean and variance of the cell. Thresholdmethod has drawbacks on dark textures and on low contrastcracks [6].
In this paper, we introduce a crack detection method us-ing an anisotropy measure. This measure takes into accountall of threes above crack features. Our experimental resultsshow that the method gives a good crack detection on severalpavement types. Crack which is as small as one millimeter inwidth can be detected. Furthermore, two other types of de-fect (joint and bridged) which have similar features as crackcan be detected by our method.
In the next sessions, after a brief description of our acqui-sition system, we describe our defect detection and classifi-cation method. Experimental results are presented in com-parison with other methods and with the results of operatordetection. Finally, conclusions are given.
17th European Signal Processing Conference (EUSIPCO 2009) Glasgow, Scotland, August 24-28, 2009
© EURASIP, 2009 617
(a) (b) (c)
Figure 1: Crack analysis: 3D profile (a), illumination modelon a crack (b), dominant orientation (c)
2. IMAGE ACQUISITION SYSTEM
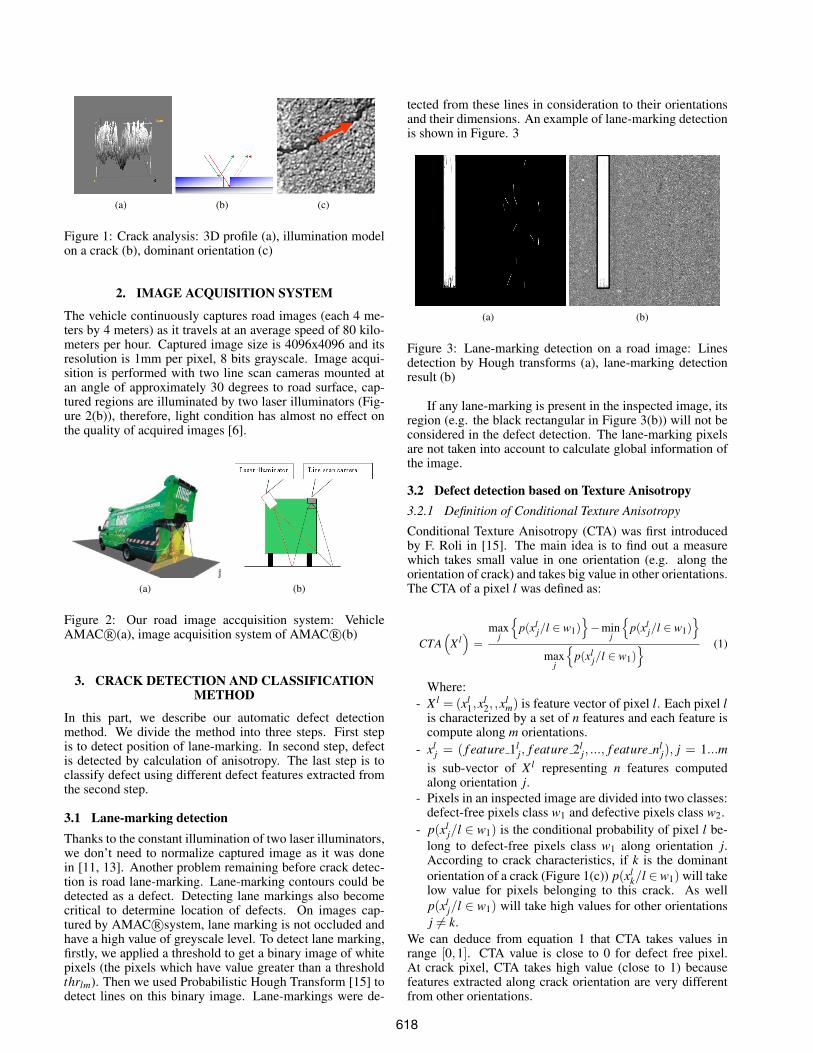
The vehicle continuously captures road images (each 4 me-ters by 4 meters) as it travels at an average speed of 80 kilo-meters per hour. Captured image size is 4096x4096 and itsresolution is 1mm per pixel, 8 bits grayscale. Image acqui-sition is performed with two line scan cameras mounted atan angle of approximately 30 degrees to road surface, cap-tured regions are illuminated by two laser illuminators (Fig-ure 2(b)), therefore, light condition has almost no effect onthe quality of acquired images [6].
(a) (b)
Figure 2: Our road image accquisition system: VehicleAMAC R©(a), image acquisition system of AMAC R©(b)
3. CRACK DETECTION AND CLASSIFICATIONMETHOD
In this part, we describe our automatic defect detectionmethod. We divide the method into three steps. First stepis to detect position of lane-marking. In second step, defectis detected by calculation of anisotropy. The last step is toclassify defect using different defect features extracted fromthe second step.
3.1 Lane-marking detectionThanks to the constant illumination of two laser illuminators,we don’t need to normalize captured image as it was donein [11, 13]. Another problem remaining before crack detec-tion is road lane-marking. Lane-marking contours could bedetected as a defect. Detecting lane markings also becomecritical to determine location of defects. On images cap-tured by AMAC R©system, lane marking is not occluded andhave a high value of greyscale level. To detect lane marking,firstly, we applied a threshold to get a binary image of whitepixels (the pixels which have value greater than a thresholdthrlm). Then we used Probabilistic Hough Transform [15] todetect lines on this binary image. Lane-markings were de-
tected from these lines in consideration to their orientationsand their dimensions. An example of lane-marking detectionis shown in Figure. 3
(a) (b)
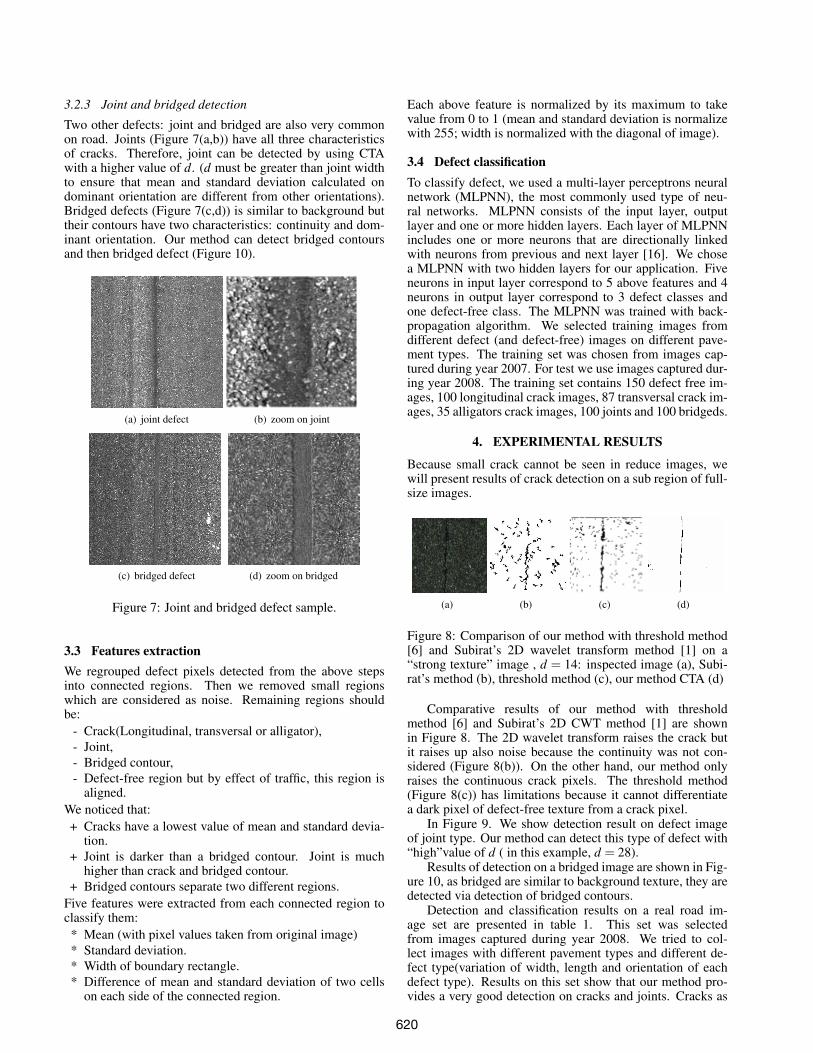
Figure 3: Lane-marking detection on a road image: Linesdetection by Hough transforms (a), lane-marking detectionresult (b)
If any lane-marking is present in the inspected image, itsregion (e.g. the black rectangular in Figure 3(b)) will not beconsidered in the defect detection. The lane-marking pixelsare not taken into account to calculate global information ofthe image.
3.2 Defect detection based on Texture Anisotropy3.2.1 Definition of Conditional Texture Anisotropy
Conditional Texture Anisotropy (CTA) was first introducedby F. Roli in [15]. The main idea is to find out a measurewhich takes small value in one orientation (e.g. along theorientation of crack) and takes big value in other orientations.The CTA of a pixel l was defined as:
CTA(
X l)
=max
j
{p(xl
j/l ∈ w1)}−min
j
{p(xl
j/l ∈ w1)}
maxj
{p(xl
j/l ∈ w1)} (1)
Where:- X l = (xl
1,xl2, ,x
lm) is feature vector of pixel l. Each pixel l
is characterized by a set of n features and each feature iscompute along m orientations.
- xlj = ( f eature 1l
j, f eature 2lj, ..., f eature nl
j), j = 1...mis sub-vector of X l representing n features computedalong orientation j.
- Pixels in an inspected image are divided into two classes:defect-free pixels class w1 and defective pixels class w2.
- p(xlj/l ∈ w1) is the conditional probability of pixel l be-
long to defect-free pixels class w1 along orientation j.According to crack characteristics, if k is the dominantorientation of a crack (Figure 1(c)) p(xl
k/l ∈w1) will takelow value for pixels belonging to this crack. As wellp(xl
j/l ∈ w1) will take high values for other orientationsj 6= k.
We can deduce from equation 1 that CTA takes values inrange [0,1]. CTA value is close to 0 for defect free pixel.At crack pixel, CTA takes high value (close to 1) becausefeatures extracted along crack orientation are very differentfrom other orientations.
618

3.2.2 Crack detection by CTA
According to crack characteristics on road surface images,we chose mean and standard deviation as two features forcalculating CTA. The calculation method is presented as fol-lows:
- 2∗d +1 is the length of a line, along which we calculateeach feature (Figure 4(a)).
- Four orientations 0◦, 45◦, 90◦ and 135◦ were considered(because of the rapidity in finding neighbor pixels with-out doing any interpolation).
- Two features were used: mean mlj and standard deviation
σ lj of 2∗d +1 pixels along considered orientation j.
Feature vector of pixel l along orientation j is :
xlj = (ml
j,σlj) (2)
To evaluate the pre-assumed probability of a pixel l to be“a defect-free pixel in one orientation j” we calculated:
p(xlj/l ∈ w1) =
D−∆ j
D(3)
with D =√
m2 +σ2 and ∆ j =√
(m−mlj)2 +(σ −σ l
j)2
m and σ are calculated on the whole image (except lane-marking pixels). Equation (3) can be compared with a nor-malized distance which is close to 1 for defect-free pixel.Mean and standard deviation along each defect-free orienta-tion are “near” global values. In case of crack pixel, distance∆k along the dominant orientation k of defect increases andp(xl
k/l ∈ w1) decreases towards zero.CTA is then calculated as in equation (1) by using
p(xlj/l ∈ w1) defined in equation (3). It is worth noting
that p(xlj/l ∈ w1) is a pre-assumed probability value used
for calculating CTA. We don’t detect defects by using thispre-assumed probability but by calculating CTA. The infor-mation which plays the most important role for defect detec-tion is the distribution of mean and standard deviation valuesalong different orientations.
Figure 4 illustrates a calculation of CTA on two pix-els: crack pixel l1 and defect-free pixel l2. With pixel l1,values of (ml
j,σlj) along 4 orientations are: (99.12,47.55),
(93.7,34.50), (37.9, 14.39) and (104.77,39.45). (m,σ) of im-age is (123.58, 48.13). CTA of l1 is 0.64. With pixel l2,values of (ml
j,σlj) along 4 orientations are: (111.97, 36.01),
(108.95, 25.84), (110.52, 33.46), (116.05, 29.60). CTA of l2is 0,08.
Figure 5 shows us the evolution of CTA on l1 and l2(Figure 4.b) by different lengths d. The inspected road isa bituminous concrete, whose aggregate maximum size is12 mm. In order to CTA can distinguish crack pixels fromnoise pixels, d needs to be chosen to ensure that 2∗d +1 >>aggregate size. There are several pavement types but theirmaximum aggregate size are always much smaller than cracklength. So d is chosen in manner that 2∗d +1 is greater thanmaximum aggregate size of all pavement types. As a result,the method is stable to variations of pavement types. As wecan see in figure 5, all d length from 8 pixels to 38 pixelscan be used to make a big difference of CTA value on crackpixels and on defect-free pixels.
When CTA image (image which represent computedCTA values) is computed, CTA of crack pixels are much
(a) zoom (b) original image
(c) distribution of mean and standard deviation calculated on l1 and l2
Figure 4: Example of CTA on two pixels: crack pixel l1 andcrack-free pixel l2 with d = 14.
Figure 5: CTA evolution on pixel l1 and l2 by varying d.
greater than defect-free pixels (Figure 6 (b)). Thus, crackpixels (Figure 6 (c)) are easily detected by a threshold fromCTA image.
(a) (b) (c)
Figure 6: Crack detection example: Original images (a),CTA image result (CTA values were converted scale from[0,1] to [0,255] grey level ) (b,). Crack detection result (c)
619
3.2.3 Joint and bridged detection
Two other defects: joint and bridged are also very commonon road. Joints (Figure 7(a,b)) have all three characteristicsof cracks. Therefore, joint can be detected by using CTAwith a higher value of d. (d must be greater than joint widthto ensure that mean and standard deviation calculated ondominant orientation are different from other orientations).Bridged defects (Figure 7(c,d)) is similar to background buttheir contours have two characteristics: continuity and dom-inant orientation. Our method can detect bridged contoursand then bridged defect (Figure 10).
(a) joint defect (b) zoom on joint
(c) bridged defect (d) zoom on bridged
Figure 7: Joint and bridged defect sample.
3.3 Features extractionWe regrouped defect pixels detected from the above stepsinto connected regions. Then we removed small regionswhich are considered as noise. Remaining regions shouldbe:
- Crack(Longitudinal, transversal or alligator),- Joint,- Bridged contour,- Defect-free region but by effect of traffic, this region is
aligned.We noticed that:+ Cracks have a lowest value of mean and standard devia-
tion.+ Joint is darker than a bridged contour. Joint is much
higher than crack and bridged contour.+ Bridged contours separate two different regions.
Five features were extracted from each connected region toclassify them:* Mean (with pixel values taken from original image)* Standard deviation.* Width of boundary rectangle.* Difference of mean and standard deviation of two cells
on each side of the connected region.
Each above feature is normalized by its maximum to takevalue from 0 to 1 (mean and standard deviation is normalizewith 255; width is normalized with the diagonal of image).
3.4 Defect classificationTo classify defect, we used a multi-layer perceptrons neuralnetwork (MLPNN), the most commonly used type of neu-ral networks. MLPNN consists of the input layer, outputlayer and one or more hidden layers. Each layer of MLPNNincludes one or more neurons that are directionally linkedwith neurons from previous and next layer [16]. We chosea MLPNN with two hidden layers for our application. Fiveneurons in input layer correspond to 5 above features and 4neurons in output layer correspond to 3 defect classes andone defect-free class. The MLPNN was trained with back-propagation algorithm. We selected training images fromdifferent defect (and defect-free) images on different pave-ment types. The training set was chosen from images cap-tured during year 2007. For test we use images captured dur-ing year 2008. The training set contains 150 defect free im-ages, 100 longitudinal crack images, 87 transversal crack im-ages, 35 alligators crack images, 100 joints and 100 bridgeds.
4. EXPERIMENTAL RESULTS
Because small crack cannot be seen in reduce images, wewill present results of crack detection on a sub region of full-size images.
(a) (b) (c) (d)
Figure 8: Comparison of our method with threshold method[6] and Subirat’s 2D wavelet transform method [1] on a“strong texture” image , d = 14: inspected image (a), Subi-rat’s method (b), threshold method (c), our method CTA (d)
Comparative results of our method with thresholdmethod [6] and Subirat’s 2D CWT method [1] are shownin Figure 8. The 2D wavelet transform raises the crack butit raises up also noise because the continuity was not con-sidered (Figure 8(b)). On the other hand, our method onlyraises the continuous crack pixels. The threshold method(Figure 8(c)) has limitations because it cannot differentiatea dark pixel of defect-free texture from a crack pixel.
In Figure 9. We show detection result on defect imageof joint type. Our method can detect this type of defect with“high”value of d ( in this example, d = 28).
Results of detection on a bridged image are shown in Fig-ure 10, as bridged are similar to background texture, they aredetected via detection of bridged contours.
Detection and classification results on a real road im-age set are presented in table 1. This set was selectedfrom images captured during year 2008. We tried to col-lect images with different pavement types and different de-fect type(variation of width, length and orientation of eachdefect type). Results on this set show that our method pro-vides a very good detection on cracks and joints. Cracks as
620

(a) (b) (c) (d)
Figure 9: Result on an image with joint defect, d = 28: in-spected image (a), zoom (b), CTA image (c), defect detection(d)
(a) (b) (c) (d)
Figure 10: Result on an image with bridged defect, d = 14:inspected image (a), zoom (b), CTA image (c), defect detec-tion (d)
small as 2 mm (1 mm = 1 pixel) can be detected, even the”well” continuous cracks as small as 1 mm can be detected.The seven undetected cracks are composed of a set of verysmall and discontinuous segments. Results on bridgeds arenot as good as results on cracks and joints. As some bridgedsare too similar to background, its contours cannot be detectedor our method cannot distinguish these bridgeds with otheraligned regions on road surface. Aligned regions are also thereason for 6% wrong detection on defect-free images.
Image type Number Errors Percentageof of
images good detection (%)Defect-free 200 8 96
Crack 271 7 97.4Joint 235 0 100
Bridged 203 18 91.13
Table 1: Detection and classification result on a real roadimage set
5. CONCLUSION
In this paper, we introduced a method for defect detectionon road surface images. Our method can detect three defecttypes: cracks, joints and bridged. The method use a measureof Conditional Texture Anisotropy (CTA) to detect defects onimages and then use a multi-layer perceptron neural networkto classify detected defect into three defect types: cracks,joint and bridged. The classification of defect can also cor-rect the wrong detection of a defect-free image by classifyingit to defect-free class. Unlike other methods that only consid-ered one characteristic of crack, our method use CTA whichtakes into account all three characteristics of crack. The com-parison results of our method with other methods show theefficiency of our method and justify our choice.
To improve the performance of the neural network inclassification of defect to data outside of training set (new
type of road pavement). We plant to implement a retrain-able neural network [17] which can adapt the trained neuralnetwork to the current data.
REFERENCES
[1] P. Subirats, J. Dumoulin, V. Legeay and D. Barba, “Au-tomation of Pavement Surface Crack Detection using theContinuous Wavelet Transform” in Proc. IEEE Interna-tional Conference on Image Processing ICIP, 2006, pp.3037-3040.
[2] CSIRO, RoadCrack Specifications.[3] Roadware Group Inc, Wisecrax data sheet.[4] Vectra’s AMAC R©specifications.[5] H. Lee, “Application of machine vision techniques for
the evaluation of highway pavements in unstructuredenvironments ” in Proc. Fifth International Conferenceon Advanced Robotics ’Robots in Unstructured Environ-ments’, 1991, pp 1425-1428 vol.2
[6] N. T. Sy, M. AVILA, S. Begot and J. C. Bardet, “De-tection of defects in road surface by a vision system,” inProc. 14th IEEE Mediterranean Electrotechnical Con-ference MELECON, 2008, pp. 847-851.
[7] S. Nallamothu and K. Wang, “Experimenting withrecognition accelerator for pavement distress identifica-tion,” in Transport Research Record, 1996. pp. 130-135.
[8] V. K. Kalikiri, N.W. Garrick, and L.E.K. Achenie, “Im-age processing methods for automated distress evalua-tion,” in Transportation research record 1994. 1435: p.45-51.
[9] K. M. Chua and L. Xu, “Simple procedure for identify-ing pavement distresses from video images ” in Journalof transportation engineering, 1994. 120: p. 412-431.
[10] D. Jean et al, “Dtection de fissures de surface dechausses par technique d’imagerie dans le visible” inJournes des Sciences de l’Ingnieur, 2003.
[11] H. D. Cheng et al, “Novel approach to pavement crack-ing detection based on fuzzy set theory” in Journal ofComputing In civil Enginering, 1999. 13(4): p. 270-280.
[12] H. Oliveira and P. Lobato Correia, “Identifying and re-trieving distress images from road pavement surveys ”in Proc. 15th IEEE International Conference on ImageProcessing ICIP , 2008, 57-60.
[13] H. Yaxiong, X. Bugao,“Automatic inspection of pave-ment cracking distress ” in Journal of Electronic Imag-ing, 2006, 15(1): 013017-1 013017-6.
[14] J.R. Bergen and H. Shvaytser, “A probabilistic algo-rithm for computing Hough Transforms” in Journal OfAlgorithms, 12(4):639-656, 1991
[15] F. Roli, “Measure of texture anisotropy for crack detec-tion on textured surfaces” in Electronics Letters, 1996,32, 1274-127
[16] Intel OpenCv Reference[17] A. D. Doulamis et al, “On-Line Retrainable Neural Net-
works: Improving the Performance of Neural Networksin Image Analysis Problems” in IEEE Trans. on NeuralNetworks, vol. 11, No. 1, january 2000.
621


![Automatic Audio Defect Detection · 3 Defect types and detection methods 11 1 1.5 2 2.5 3 3.5-0.4-0.2 0 0.2 0.4 position in file [sec] waveform detected defect Figure 3.2:Example](https://static.fdocuments.us/doc/165x107/603d87a91bb7437a722f9596/automatic-audio-defect-3-defect-types-and-detection-methods-11-1-15-2-25-3-35-04-02.jpg)


