Automatic Classification of Anterio-Posterior and Lateral Views of … · 2016-04-23 · template...
7
International Research Journal of Engineering and Technology (IRJET) e-ISSN: 2395 -0056 Volume: 02 Issue: 09 | Dec-2015 www.irjet.net p-ISSN: 2395-0072 © 2015, IRJET ISO 9001:2008 Certified Journal Page 968 Automatic Classification of Anterio-Posterior and Lateral Views of Leg X-rays G.N. Balaji 1 , T.S. Subashini 2 , A. Manikandarajan 3 1 Research Scholar, Department of Computer Science and Engineering, Annamalai University 2 Associate Professor, Department of Computer Science and Engineering, Annamalai University 3 Lecturer, Department of orthopaedics, Annamalai University -------------------------------------------------------- *** ------------------------------------------------------- Abstract: Automating the X-ray view identification is the first step in automating the detection and diagnosis of fractures in bones. In this paper, an attempt has been made to classify the anterio-posterior (AP) and lateral (LAT) views of leg X-rays. Two methods namely model based and template based is proposed to classify the AP and LAT views. In the model based method the X-rays are preprocessed, and then the histogram and statistical features are extracted. The support vector machine and probabilistic neural network were employed to classify the views. In the template based method the speed up robust features (SURF) is used for classification. SURF is effective in collecting more class-specific information and robust in dealing with partial occlusion and viewpoint changes. To authenticate the generalizability and robustness, the proposed methods are tested on a dataset of 50 X-ray images, and among the two, SURF achieves a higher classification rate of 91.8%. Keywords: Anterio-Posterior (AP), Lateral (LAT), Speed Up Robust Features (SURF), Support Vector Machine (SVM), Probabilistic Neural Network (PNN). 1. Introduction Radiographic positioning is highly standardized, so as to help the physician and radiologists to correctly interpret and to make diagnosis. Hence, it plays a pivotal role in viewing the particular portions or areas to be examined. Radiographic positions viz. lateral view, oblique view, anterior-posterior view, posterior-anterior view etc., which are all so classified based on the way the X-ray images are radiographed with respect to the object and the film. When the X-rays have passed through the object from front to back of the patients, it is referred as anterio-posterior (AP) view. If it is taken from back to front of the patient it is said to be posterio-anterior (PA) view. When it is passed through the object from the side of the patients, it is said to be lateral view. In oblique view, X- rays is passed through the object based on the angle. Hence, it is quite inevitable that there needs to be suitable computational algorithms for the detection of the orientation of the X-ray images. In this work, an attempt has been made to classify AP view and LAT view of leg X- rays, which will aid the radiologist or orthopedicians to get accurate and faster results. A sample image of AP view and LAT views taken in this work is shown in Fig. 1. In this work, two methods are proposed for automatic classification of leg X-rays, model based and template based. In model based approach the statistical features and histogram feature are extracted and the support vector machine and probabilistic neural networks are used for classification purpose. In the template based approach SURF is used for classification purpose. Fig. 1 a) Sample anterio-posterior view b) Sample lateral view
Transcript of Automatic Classification of Anterio-Posterior and Lateral Views of … · 2016-04-23 · template...

International Research Journal of Engineering and Technology (IRJET) e-ISSN: 2395 -0056
Volume: 02 Issue: 09 | Dec-2015 www.irjet.net p-ISSN: 2395-0072
© 2015, IRJET ISO 9001:2008 Certified Journal Page 968
Automatic Classification of Anterio-Posterior and Lateral Views of Leg X-rays
G.N. Balaji1, T.S. Subashini2, A. Manikandarajan3
1Research Scholar, Department of Computer Science and Engineering, Annamalai University 2Associate Professor, Department of Computer Science and Engineering, Annamalai University
3Lecturer, Department of orthopaedics, Annamalai University
-------------------------------------------------------- *** -------------------------------------------------------
Abstract: Automating the X-ray view identification is the
first step in automating the detection and diagnosis of
fractures in bones. In this paper, an attempt has been made
to classify the anterio-posterior (AP) and lateral (LAT) views
of leg X-rays. Two methods namely model based and
template based is proposed to classify the AP and LAT views.
In the model based method the X-rays are preprocessed,
and then the histogram and statistical features are
extracted. The support vector machine and probabilistic
neural network were employed to classify the views. In the
template based method the speed up robust features (SURF)
is used for classification. SURF is effective in collecting more
class-specific information and robust in dealing with partial
occlusion and viewpoint changes. To authenticate the
generalizability and robustness, the proposed methods are
tested on a dataset of 50 X-ray images, and among the two,
SURF achieves a higher classification rate of 91.8%.
Keywords: Anterio-Posterior (AP), Lateral (LAT), Speed Up
Robust Features (SURF), Support Vector Machine (SVM),
Probabilistic Neural Network (PNN).
1. Introduction
Radiographic positioning is highly standardized, so as to help the physician and radiologists to correctly interpret and to make diagnosis. Hence, it plays a pivotal
role in viewing the particular portions or areas to be examined. Radiographic positions viz. lateral view, oblique view, anterior-posterior view, posterior-anterior view etc., which are all so classified based on the way the X-ray images are radiographed with respect to the object and the film. When the X-rays have passed through the object from front to back of the patients, it is referred as anterio-posterior (AP) view. If it is taken from back to front of the patient it is said to be posterio-anterior (PA) view. When it is passed through the object from the side of the patients, it is said to be lateral view. In oblique view, X-rays is passed through the object based on the angle. Hence, it is quite inevitable that there needs to be suitable computational algorithms for the detection of the orientation of the X-ray images. In this work, an attempt has been made to classify AP view and LAT view of leg X-rays, which will aid the radiologist or orthopedicians to get accurate and faster results. A sample image of AP view and LAT views taken in this work is shown in Fig. 1. In this work, two methods are proposed for automatic classification of leg X-rays, model based and template based. In model based approach the statistical features and histogram feature are extracted and the support vector machine and probabilistic neural networks are used for classification purpose. In the template based approach SURF is used for classification purpose.
Fig. 1 a) Sample anterio-posterior view b) Sample lateral view

International Research Journal of Engineering and Technology (IRJET) e-ISSN: 2395 -0056
Volume: 02 Issue: 09 | Dec-2015 www.irjet.net p-ISSN: 2395-0072
© 2015, IRJET ISO 9001:2008 Certified Journal Page 969
This paper is organized as follows Section 1 gives an outlay
of the general introduction and the need of the proposed
work. Review of the existing literature is presented in
Section 2. Section 3 elaborates the Proposed Methodology,
while the Performance Measures and Experimental results
are described in Section 4 which is followed by the
conclusion in Section 5.
2. Previous work
Few research efforts are reported in the literature
for identifying the X-ray image views [1-5] however, they
are not fully automated systems. The authors in [6]
proposed a method to determine the image view based on
the similarity of the image to reference images, but used
four distance measures and K-nearest-neighbor classifier.
The classification of views in medical images will aid the
radiologist in diagnosing diseases [7]. The work in [2]
proposes a method to identify the frontal/lateral view
using a template matching technique, the similarity
measures were based on the cross correlation coefficient.
The speedup robust features are used for the classification
of cardiac views in echocardiogram in [8]. Random forests
with local binary patterns are used to classify the X-ray
images in [9]. A segmentation algorithm based on the
kernelized weighted C-means clustering and automatic
segmentation correctness coefficients is proposed in [10].
Fuzzy‑based Medical X‑ray Image Classification is
proposed in [11]. A novel shape texture feature extraction
technique to classify medical X- ray images is proposed in
[12].
3. Methodology
The block diagram of the proposed system is
shown in Fig. 2. When the leg X- ray image is given as an
input to the proposed method, the image is preprocessed
with median filter to remove the noise.
3,1 Median Filter
The best known order statistic filter is the median
filter which replaces the value of the pixel by the median of
the gray levels in the neighborhood of that pixel [13]. The
median filter is a non-linear digital filtering technique,
often used to remove noise and is particularly effective in
the presence of impulse noise, also called ‘salt and pepper’
noise. In this paper 3×3 median filter is used and it
illustrated in Table 1.
Fig. 2 Block diagram of the proposed system
Table 1. 3 × 3 Median filter
(x-1,y-1) (x,y-1) (x+1,y-1)
(x-1,y) (x,y) (x+1,y)
(x-1,y+1) (x,y+1) (x+1,y+1)
Where (x,y) is the center pixel which is replaced with the
median value.
3.2 Model based classification
Fig. 3 shows the block diagram of model based
classification method. Two different texture features
namely 32 bin gray scale histogram and statistical features
such as entropy, kurtosis, skewness, mean and standard
deviation are extracted from the region of interest. The
histogram gives an idea about the contrast of the image
and distribution of the gray values. For gray level
Preprocessing
Model based
classification
Template
based
classification
AP or LAT
View
AP or LAT
View
Input: Leg X- ray image

International Research Journal of Engineering and Technology (IRJET) e-ISSN: 2395 -0056
Volume: 02 Issue: 09 | Dec-2015 www.irjet.net p-ISSN: 2395-0072
© 2015, IRJET ISO 9001:2008 Certified Journal Page 970
histograms, the tonal distribution is from 0 to 255 while 0
represents black and 255 represents white. The statistical
texture characteristics provide information about the
properties of the level of the intensity distribution in the
image like the smoothness, contrast, uniformity, flatness,
and brightness. In this work statistical features mean,
standard deviation, entropy, skewness and kurtosis are
extracted. Mean returns the average value of the extracted
region of interest. The standard deviation gives the
information regarding how the data is dispersed from the
mean. Entropy is a statistical measure of randomness that
can be used to characterize the texture of the input image.
Kurtosis gives an idea about the shape of the probability
distribution. Skewness is a measure which tells how the
data are symmetrically arranged about its mean.
Fig. 3 Block diagram of model based classification method
The usages of these features in correctly
classifying the two different X- ray views were tested with
PNN and SVM classifiers. PNNs can be used for solving
classification problems. In this setting, a training set
consisting of known input variables and corresponding
outputs, is used to estimate a probability density function
(PDF). Each output in the training set belongs to some
class. When evaluated on data outside the training set, the
PNN then classifies the input variables using the estimated
PDF. A class is assigned, corresponding to that with the
highest probability of occurrence. Support vector machine
is a supervised machine learning algorithm that uses
kernel function to map linearly inseparable data to linearly
separable data by mapping given data in higher dimension.
A hyperplane is constructed in such a way that the margin
between the two classes is maximum. The data vectors
lying near the hyperplane are called support vectors which
are alone then used in classification rather than
considering all data points unlike clustering algorithms.
3,3 Template based classification
SURF [14] is becoming one of the most popular
feature detector and descriptor in computer vision field. It
is able to generate scale-invariant and rotation-invariant
interest points with descriptors. Evaluations show its
superior performance in terms of repeatability,
distinctiveness, and robustness. SURF is selected as the
interest point detector and descriptor for the following
reasons: 1) X- ray image could be taken under the
conditions of i) Within-view variation, ii) Between-view
variation and iii) Structure localization. Interest points
with descriptors generated by SURF are invariant to
variation and location changes. 2) Computational cost of
SURF is small, which enable fast interest point localization
and matching. The block diagram of template based
classification system is shown in Fig. 3.
The SURF detector is based on the Hessian matrix for its
good performance in computational cost and accuracy. For
a point (x,y) in an image I, The Hessian matrix H(σ) with is
defined as
Modern feature extractors select prominent
features by first searching for pixels which demonstrate
rapid changes in intensity values in both the horizontal
and vertical directions. Such pixels yield high Harris corner
detection scores and are referred to as keypoints.
Keypoints are searched over a subspace of {x,y,𝜎}
£ R3. The variable σ represents the Gaussian scale space at
which the keypoint exists. In SURF, a descriptor vector of
length 64 is constructed using a histogram of gradient
orientations in the local neighborhood around each
keypoint. The proposed method extracts salient features
and descriptors from images using SURF. This extractor is
AP
View
Preprocessed
image
Histogram and
statistical
feature
Extraction
Classification
using PNN and
SVM LAT
View
International Research Journal of Engineering and Technology (IRJET) e-ISSN: 2395 -0056
Volume: 02 Issue: 09 | Dec-2015 www.irjet.net p-ISSN: 2395-0072
© 2015, IRJET ISO 9001:2008 Certified Journal Page 971
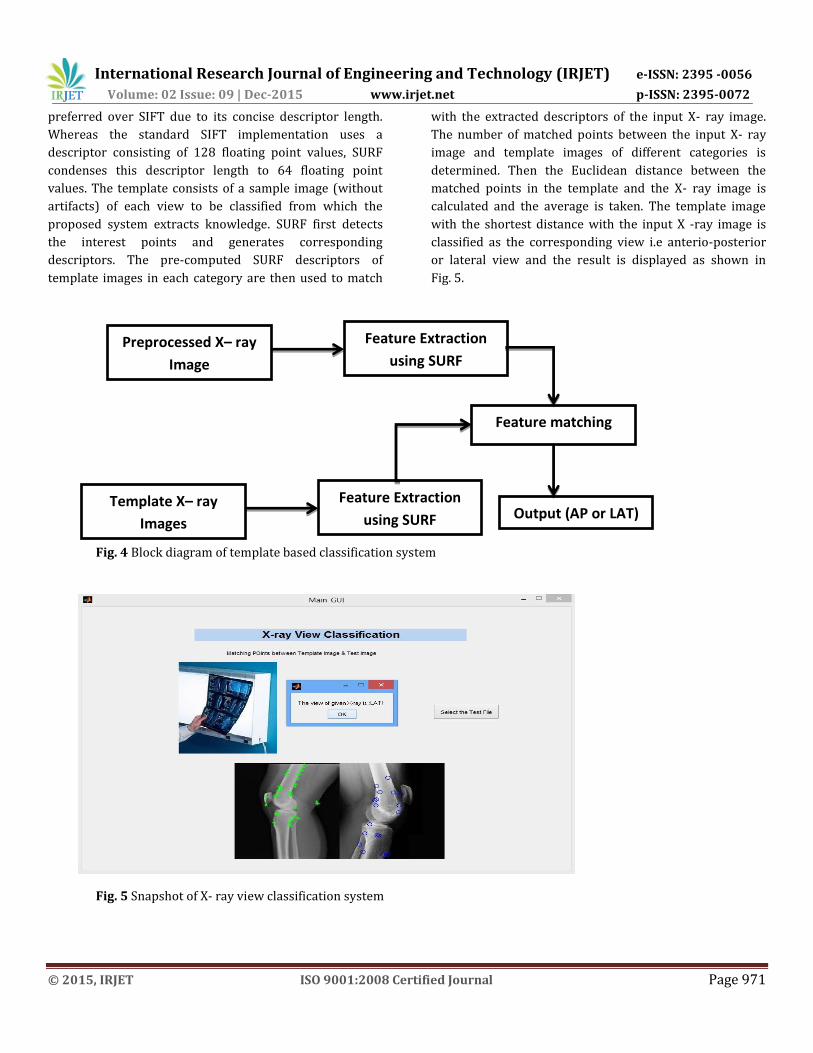
preferred over SIFT due to its concise descriptor length.
Whereas the standard SIFT implementation uses a
descriptor consisting of 128 floating point values, SURF
condenses this descriptor length to 64 floating point
values. The template consists of a sample image (without
artifacts) of each view to be classified from which the
proposed system extracts knowledge. SURF first detects
the interest points and generates corresponding
descriptors. The pre-computed SURF descriptors of
template images in each category are then used to match
with the extracted descriptors of the input X- ray image.
The number of matched points between the input X- ray
image and template images of different categories is
determined. Then the Euclidean distance between the
matched points in the template and the X- ray image is
calculated and the average is taken. The template image
with the shortest distance with the input X -ray image is
classified as the corresponding view i.e anterio-posterior
or lateral view and the result is displayed as shown in
Fig. 5.
Fig. 4 Block diagram of template based classification system
Fig. 5 Snapshot of X- ray view classification system
Preprocessed X– ray
Image
Feature Extraction
using SURF
Feature matching
Template X– ray
Images
Feature Extraction
using SURF Output (AP or LAT)

International Research Journal of Engineering and Technology (IRJET) e-ISSN: 2395 -0056
Volume: 02 Issue: 09 | Dec-2015 www.irjet.net p-ISSN: 2395-0072
© 2015, IRJET ISO 9001:2008 Certified Journal Page 972
4.Results and Discussion
A set of 100 X- ray images were collected which
consist of 50 anterio- posterior views and 50 lateral views.
The resolution of the images is 1024 × 768 pixels. The first
step in the proposed method is preprocessing, which
removes the noise in the image and smoothens the image
using median filter. The variation of histogram due to the
presence of noise is also reduced during the preprocessing.
Fig. 6 shows the preprocessed images.
Fig. 7 Gray level histogram of each views
Fig. 6 Sample preprocessed images
In model based classification method, the
histogram features are extracted since the histogram
pattern varies according to the structural variation which
will make the classification easier. The gray level
histogram using 32 bins of the sample is shown in Fig. 7
and it can be seen that the histogram pattern of each view
varies.
Among the 50 X- ray images of a particular view, 30 images
were taken for training purpose and 20 were taken for
testing purpose, i.e., 60 images for training and 40 images
for testing totally.
Table 2a) Classification accuracy of PNN classifier with
histogram features
Test Image AP
view LAT view
Accuracy (%)
AP view (20) 16 4 80
LAT view (20) 17 3 85
Overall accuracy 82.5 Table 2b) Classification accuracy of SVM classifier with
histogram features
Test Image AP
view LAT view
Accuracy (%)
AP view (20) 17 3 85
LAT view (20) 17 3 85
Overall accuracy 85

International Research Journal of Engineering and Technology (IRJET) e-ISSN: 2395 -0056
Volume: 02 Issue: 09 | Dec-2015 www.irjet.net p-ISSN: 2395-0072
© 2015, IRJET ISO 9001:2008 Certified Journal Page 973
When the histogram features are used for classification the
SVM classifier gives a better accuracy of 85%. The
confusion matrix of histogram features with PNN and SVM
classifiers are tabulated in table 2 a) and b). The SVM
classifier performs well in classifying the views comparing
to the PNN classifier, when using the statistical features
the accuracy is improved to 87.5%. The confusion matrix
of statistical features with the PNN and SVM classifiers are
shown in Table 3 a) and b) respectively. Fig. 8 shows the
performance of classifiers with histogram and statistical
features with PNN and SVM classifiers.
Table 3a) Classification accuracy of PNN classifier with
statistical features
Test Image AP
view LAT view
Accuracy (%)
AP view (20) 15 5 75
LAT view (20) 16 4 80
Overall accuracy 77.5
Table 3b) Classification accuracy of SVM classifier with
statistical features
Test Image AP
view LAT view
Accuracy (%)
AP view (20) 17 3 85
LAT view (20) 18 2 90
Overall accuracy 87.5
Fig. 8. Performance comparison of PNN and SVM using
histogram and statistical features
To further improve the accuracy, an attempt has
been made to classify the views using template based
method. In each view one image is chosen randomly and
used as a template. The efficiency of the proposed method
is tested with the remaining 98 images. The Template
based classification method gives an overall accuracy of
91.8% in classifying X- ray views. The confusion matrix of
the X- ray view classification system is shown in Table 4.
Table 4 Classification accuracy of template based method
using SURF
Test Image AP
view LAT view
Accuracy (%)
AP view (49) 43 6 87.7
LAT view (49) 45 4 93.8
Overall accuracy 91.8
4. Conclusion
In this work, classification of anterio-posterior
and lateral views in leg X-rays is automated using model
based method and template based methods. In the model
based method the histogram features and statistical
features are extracted and classified using the classifiers
PNN and SVM. The SVM classifier performs well in
classifying the X- ray views when statistical feature is
given as input. When the SURF features is used for
classification, the accuracy of the proposed method
increased to 91.8% which is highest among the
classification methods employed. The results indicate that,
in future bone fracture detection can be automated and
content based X-ray retrieval systems could also be
implemented.
References
[1] J. M. Boone, S. Seshagiri, and R. M. Steiner, “Recognition
of chest radiograph orientation for picture archiving and
communication systems display using neural networks,” J.
Dig. Imag., vol. 5, no. 3, pp. 190–193, 1992.
[2] H. Arimura, S. Katsuragawa, Q. Li, T. Isguda, and K. Doi,
“Development of a computerized method for identifying
the posteroanterior and lateral views of chest radiographs
by use of a template matching technique,” Med. Phys., vol.
29, no. 7, pp. 308–315, 2002.

International Research Journal of Engineering and Technology (IRJET) e-ISSN: 2395 -0056
Volume: 02 Issue: 09 | Dec-2015 www.irjet.net p-ISSN: 2395-0072
© 2015, IRJET ISO 9001:2008 Certified Journal Page 974
[3] E. F. Kao, C. Lee, T. S. Jaw, J. S. Hsu and G. C. Liu,
“Projection profile analysis for identifying different views
of chest radiographs,” Acad. Radiol., vol. 13, pp. 518–525,
2006.
[4] E. Pieka and H. K. Huang, “Orientation correction for
chest images,” J. Dig. Imag., vol. 5, no. 3, pp. 185–189, 1992.
[5] E. F. Kao, W.C. Lin, J. S. Hsu, M.C. Chou, T. S. Jaw, G. C.
Liu, “A computerized method for automated identification
of erect posteroanterior and supine anteroposterior chest
radiographs,” Phys Med Biol., vol. 56, no. 24, pp.7737-
7753, 2011.
[6] T. M. Lehmann, O. Guild, D. Keysers, H. Schubert, M.
Kohnen, and B. B. Wein, “Determining the view of chest
radiographs,” J. Dig. Imag., vol. 16, no. 3, pp. 281--291,
2003.
[7] Balaji, G. N., T. S. Subashini, and N. Chidambaram.
"Automatic Classification of Cardiac Views in
Echocardiogram Using Histogram and Statistical Features."
Procedia Computer Science 46 (2015): 1569-1576.
[8] Balaji, G. N., T. S. Subashini, and N. Chidambaram.
"Cardiac View Classification Using Speed Up Robust
Features." Indian Journal of Science and Technology 8.S7
(2015): 1-5.
[9] Kim, Seong-Hoon, et al. "X-ray image classification
using random forests with local binary patterns." Machine
Learning and Cybernetics (ICMLC), 2010 International
Conference on. Vol. 6. IEEE, 2010.
[10] M. Bugdol, J. Czajkowska, and E. Pietka, “A novel
model-based approach to left ventricle segmentation,” in
Computing in Cardiology (CinC). Krakow, Poland: IEEE,
2012, pp. 561-564.
[11] Ghofrani, Fatemeh, et al. "Fuzzy-Based Medical X-ray
Image Classification." Journal of medical signals and
sensors 2.2 (2012): 73.
[12] Mohammadi, Seyyed Mohammad, Mohammad Sadegh
Helfroush, and Kamran Kazemi. "Novel shape-texture
feature extraction for medical X-ray image classification."
Int J Innov Comput Inf Control 8 (2012): 659-76.
[13] P. Perona and J. Malik, "Scale-space and edge
detection using anisotropic diffusion", IEEE Trans. Pattern
Anal. Mach. Intell., vol. 12, no. 5, pp.629–639, May 1990.