Automatic alignment of myocardial perfusion PET and 64-slice coronary CT angiography on hybrid...
10
ORIGINAL ARTICLE Automatic alignment of myocardial perfusion PET and 64-slice coronary CT angiography on hybrid PET/CT Ryo Nakazato, MD, PhD, a Damini Dey, PhD, b,c Erick Alexa ´nderson, MD, d,e Aloha Meave, MD, d,e Moise ´s Jime ´nez, MD, d,e Edgar Romero, MD, d Rodrigo Ja ´come, MD, d Marco Pen ˜a, MD, d Daniel S. Berman, MD, a,c and Piotr J. Slomka, PhD a,c Background. Hybrid PET/CT allows for acquisition of cardiac PET and coronary CT angiography (CCTA) in one session. However, PET and CCTA are acquired with differing breathing protocols and require software registration. We aimed to validate automatic cor- rection for breathing misalignment between PET and CCTA acquired on hybrid scanner. Methods. Single-session hybrid PET/CT studies of rest/stress 13 N-ammonia PET and CCTA in 32 consecutive patients were considered. Automated registration of PET left ven- tricular (LV) surfaces with CCTA volumes was evaluated by comparing with expert manual alignment by two observers. Results. The average initial misalignments between the position of LV on PET and CCTA were 27.2 ± 11.8, 13.3 ± 11.5, and 14.3 ± 9.1 mm in x, y, and z axes on rest, and 26.3 ± 10.2, 11.1 ± 9.5, and 11.7 ± 7.1 mm in x, y, and z axes on stress, respectively. The automated PET- CCTA co-registration had 95% agreement as judged visually. Compared with expert manual alignment, the translation errors of the algorithm were 5.3 ± 2.8 mm (rest) and 6.0 ± 3.5 mm (stress). 3D visualization of combined coronary vessel anatomy and hypoperfusion from PET could be made without further manual adjustments. Conclusion. Software co-registration of CCTA and PET myocardial perfusion imaging on hybrid PET/CT scanners is necessary, but can be performed automatically, facilitating inte- grated 3D display on PET/CT. (J Nucl Cardiol 2012;19:482–91.) Key Words: PET-CCTA Æ fusion Æ misalignment Æ coronary artery disease Æ PET/CT imaging INTRODUCTION Both myocardial perfusion imaging (MPI) and coronary CT angiography (CCTA) are widely used for assessment of patients with suspected or known coro- nary artery disease (CAD). In current clinical practice, a physician subjectively performs the integration of ana- tomic and physiologic information from angiography and MPI. The two image sets are viewed independently, and integration of the information is performed men- tally. Some proportion of patients requires both examinations because of inconclusive results obtained by the first test. 1,2 In such cases, the combined imaging results are often challenging to interpret, because of the presence of artifacts or equivocal findings in at least one modality. In addition, the location of a stenosis with respect to the left ventricular (LV) epicardial surface can only be judged with considerable approximation in some cases. The existence of more than one stenosed artery From the Departments of Imaging and Medicine, and Cedars-Sinai Heart Institute, a Department of Biomedical Sciences and Biomedical Imaging Research Institute, b Cedars-Sinai Medical Center, Los Angeles, CA; David Geffen School of Medicine, c University of California Los Angeles, Los Angeles, CA; Unidad PET/CT Ciclo- tro ´n, Facultad de Medicina, d Universidad Nacional Auto ´noma de Me ´xico, Mexico, DF, Mexico; and Instituto Nacional de Cardiologı ´a Ignacio Cha ´vez, e Mexico, DF, Mexico. Received for publication Aug 25, 2011; final revision accepted Feb 2, 2012 Reprint requests: Piotr J. Slomka, PhD, Artificial Intelligence in Medicine Program, Cedars-Sinai Medical Center, 8700 Beverly Boulevard, Taper Building Suite A047, Los Angeles, CA 90048; [email protected]. 1071-3581/$34.00 Copyright Ó 2012 American Society of Nuclear Cardiology. doi:10.1007/s12350-012-9528-7 482
-
Upload
piotr-j-slomka-phd -
Category
Documents
-
view
214 -
download
2
Transcript of Automatic alignment of myocardial perfusion PET and 64-slice coronary CT angiography on hybrid...
ORIGINAL ARTICLE
Automatic alignment of myocardial perfusionPET and 64-slice coronary CT angiographyon hybrid PET/CT
Ryo Nakazato, MD, PhD,a Damini Dey, PhD,b,c Erick Alexanderson, MD,d,e
Aloha Meave, MD,d,e Moises Jimenez, MD,d,e Edgar Romero, MD,d
Rodrigo Jacome, MD,d Marco Pena, MD,d Daniel S. Berman, MD,a,c and
Piotr J. Slomka, PhDa,c
Background. Hybrid PET/CT allows for acquisition of cardiac PET and coronary CTangiography (CCTA) in one session. However, PET and CCTA are acquired with differingbreathing protocols and require software registration. We aimed to validate automatic cor-rection for breathing misalignment between PET and CCTA acquired on hybrid scanner.
Methods. Single-session hybrid PET/CT studies of rest/stress 13N-ammonia PET andCCTA in 32 consecutive patients were considered. Automated registration of PET left ven-tricular (LV) surfaces with CCTA volumes was evaluated by comparing with expert manualalignment by two observers.
Results. The average initial misalignments between the position of LV on PET and CCTAwere 27.2 ± 11.8, 13.3 ± 11.5, and 14.3 ± 9.1 mm in x, y, and z axes on rest, and 26.3 ± 10.2,11.1 ± 9.5, and 11.7 ± 7.1 mm in x, y, and z axes on stress, respectively. The automated PET-CCTA co-registration had 95% agreement as judged visually. Compared with expert manualalignment, the translation errors of the algorithm were 5.3 ± 2.8 mm (rest) and 6.0 ± 3.5 mm(stress). 3D visualization of combined coronary vessel anatomy and hypoperfusion from PETcould be made without further manual adjustments.
Conclusion. Software co-registration of CCTA and PET myocardial perfusion imaging onhybrid PET/CT scanners is necessary, but can be performed automatically, facilitating inte-grated 3D display on PET/CT. (J Nucl Cardiol 2012;19:482–91.)
Key Words: PET-CCTA Æ fusion Æ misalignment Æ coronary artery disease Æ PET/CTimaging
INTRODUCTION
Both myocardial perfusion imaging (MPI) and
coronary CT angiography (CCTA) are widely used for
assessment of patients with suspected or known coro-
nary artery disease (CAD). In current clinical practice, a
physician subjectively performs the integration of ana-
tomic and physiologic information from angiography
and MPI. The two image sets are viewed independently,
and integration of the information is performed men-
tally. Some proportion of patients requires both
examinations because of inconclusive results obtained
by the first test.1,2 In such cases, the combined imaging
results are often challenging to interpret, because of the
presence of artifacts or equivocal findings in at least one
modality. In addition, the location of a stenosis with
respect to the left ventricular (LV) epicardial surface can
only be judged with considerable approximation in some
cases. The existence of more than one stenosed artery
From the Departments of Imaging and Medicine, and Cedars-Sinai
Heart Institute,a Department of Biomedical Sciences and Biomedical
Imaging Research Institute,b Cedars-Sinai Medical Center, Los
Angeles, CA; David Geffen School of Medicine,c University of
California Los Angeles, Los Angeles, CA; Unidad PET/CT Ciclo-
tron, Facultad de Medicina,d Universidad Nacional Autonoma de
Mexico, Mexico, DF, Mexico; and Instituto Nacional de Cardiologıa
Ignacio Chavez,e Mexico, DF, Mexico.
Received for publication Aug 25, 2011; final revision accepted Feb 2,
2012
Reprint requests: Piotr J. Slomka, PhD, Artificial Intelligence in
Medicine Program, Cedars-Sinai Medical Center, 8700 Beverly
Boulevard, Taper Building Suite A047, Los Angeles, CA 90048;
1071-3581/$34.00
Copyright � 2012 American Society of Nuclear Cardiology.
doi:10.1007/s12350-012-9528-7
482

exacerbates this problem, especially if the degree of
stenosis is unclear since such stenosis may or may not
cause perfusion abnormalities.
It has been suggested that visual analysis of fused
MPI and CCTA images can synergistically improve the
diagnostic value of sequential combined imaging and
reduce the rate of equivocal studies.3,4 Manual tools for
the purpose of combined visual analysis have been
developed.5 However, the manual interactive alignment
of the images from the two modalities introduces
subjective errors, takes a substantial amount of time,
and limits the practical clinical use of such tools.
Previously, automated software tools for registering
standalone single photon emission computed tomogra-
phy (SPECT)-MPI and CCTA6,7 and SPECT to
magnetic resonance imaging8 have been described.
Hybrid positron emission tomography (PET)/CT
potentially allows for an integrated multimodality car-
diac evaluation of MPI and CCTA in one scanning
session. However, even with the hybrid scanner, the PET
and CCTA are not truly simultaneous and are acquired
with differing breathing protocols, resulting in significant
misalignments of the images from the two modalities.
Subsequently, cardiac PET and CCTA images cannot be
accurately fused by hardware registration alone.
The aim of this study was to evaluate the amount of
initial misalignment that occurs between cardiac PET and
CCTA studies obtained in one session on a hybrid scanner
and to determine whether the previously developed
software for standalone SPECT-CCTA cardiac applica-
tions6 could be applied as an automated correction tool for
breathing misalignment between CCTA and cardiac PET.
METHODS
Patient Population
The study population consisted of 32 consecutive patients
(21 men, age 62 ± 9 years) with suspected CAD referred for
combined clinical evaluation of myocardial ischemia and
coronary anatomy in the same setting (Table 1). Seventeen
patients had chest pain and nine patients had dyspnea. Patients
with known hypersensitivity to the substances used during the
study (i.e., b-blockers, iodinated contrast agent, etc.), patients
with renal failure (serum creatinine level [ 1.2 mg/dL), and
patients with contraindications for adenosine administration
were all excluded. The study was approved by the Institutional
Review Board.
Integrated PET/CT Imaging
All the patients were studied on a whole-body 64-slice
PET/CT scanner (Biograph-64 TruePoint PET/CT; Siemens
Medical, Erlangen, Germany). The patients were studied after
an overnight fast, and all refrained from caffeine-containing
beverages or theophylline-containing medications for 24 hours
before the study.13N-Ammonia PET scan acquisition,
reconstruction. All image data were acquired in list
mode. Myocardial perfusion was assessed at rest and during
vasodilator stress with adenosine using 13N-ammonia as a
tracer. Two CT-based transmission scans (120 kVp; 20-
30 mA; pitch = 1.35) were obtained before the rest perfusion
studies and after the stress perfusion studies, for soft tissue
photon attenuation. Myocardial perfusion was first assessed
during rest using 20 mCi of 13N-ammonia. Rest imaging was
extended for 10 minutes and started few seconds before the13N-ammonia injection. The 13N-ammonia was administered
as a single peripheral IV bolus (3-5 seconds), followed by a
10-mL saline flush. Thirty minutes later, a stress scan was
performed, beginning with the infusion of adenosine over a
6-minute period (0.14 mg/kg/minute). A second dose of
20 mCi of 13N-ammonia was injected at the third minute of
the adenosine infusion, with 10 minutes stress acquisition
having been started a few seconds before the radiotracer
injection. Patients were instructed to breathe normally during
the CT transmission and PET acquisition. The estimated mean
effective radiation dose from 13N-ammonia PET was 1.5 mSv
for both rest and stress.9 Static images were generated from the
list mode data using standard reconstruction (2D Attenuation
Weighted Ordered Subsets Expectation Maximization) with
three iterations and 14 subsets and 3D post-filtering with 5-mm
Gaussian kernel. Transverse data were reformatted to
168 9 168 9 47 matrix with 2 mm pixel size. Static stress
and rest perfusion images were reconstructed from the list
mode data with a delay of 2 minutes to allow for the clearance
of the radioactivity from the blood pool.
CCTA scan acquisition, reconstruction andinterpretation. CCTA (64-slice) was performed immedi-
ately after completion of the rest-stress 13N-ammonia PET
protocol, without changing patient position on the imaging table.
Before CT imaging, patients with a heart rate [70 bpm were
given metoprolol (up to 100 mg oral or 20 mg intravenous in
5 mg increments) to attain a heart rate\70 bpm. A short-acting
Table 1. Patient characteristics
Value
Male (%) 21 (66)
Age, years 62 ± 9
Chest pain (%) 17 (53)
Dyspnea (%) 9 (28)
Abnormal rest ECG (%) 5 (16)
Pre-operation (%) 1 (3)
Myocardial infarction (%) 7 (22)
Weight, kg 76 ± 14
Body mass index, kg/m2 27.2 ± 3.4
Data are mean ± SD, or number followed by percentage inparentheses (n = 32)ECG, electrocardiogram
Journal of Nuclear Cardiology Nakazato et al 483
Volume 19, Number 3;482–91 Hybrid PET/CT fusion imaging
nitrate (5 mg of isosorbide dinitrate) was given to all patients
2-3 minutes before the scan. For CCTA, after a timing bolus,
ECG gated helical scanning was performed using ECG-based
dose modulation whenever possible, and administration of 60-
80 mL of Iopamiron 370 (370 mg iodine/mL, rate 5 mL/second,
Schering Bayer, Germany) during a single breath-hold
(*10 seconds). Scan parameters included heart rate-dependent
pitch (range: 0.18-0.2), 330-ms gantry rotation time, 120 kVp
tube voltage and tube-current time product 550-945 mAs. The
estimated mean effective radiation dose ranged from 12-
15 mSv. Retrospectively, gated reconstruction of contrast-
enhanced data were performed at end-systole and in diastole
with the use of the following parameters: 0.6 mm slice thickness,
0.3-mm slice increment, 250-mm field of view, 512 9 512
matrix, and a ‘‘medium smooth’’ kernel. The cardiac phase with
the best image quality was used for further analysis. All CCTA
images were analyzed by an experienced cardiologist blinded to
the MPI scan result. Luminal-diameter stenosis severity was
assessed as recommended stenosis grading.10 Percent obstruc-
tion of coronary artery lumen was based on a comparison of the
luminal diameter of the segment exhibiting obstruction to the
luminal diameter of the most normal-appearing site immediately
proximal to the stenotic lesion. Obstructive stenosis was defined
as C50% luminal stenosis by visual assessment.
Myocardial perfusion quantification. The
quantitative perfusion variable employed was total perfusion
deficit (TPD), which reflects a combination of both the extent
and the severity of the defect in one parameter, as previously
described.11 Stress, rest, and reversible (difference between
stress and rest) myocardial perfusion defects on PET/CT were
assessed by quantification of the TPD.12,13 MPI analysis was
performed individually for each vessel with the ‘‘group’’
function in QPET, in which 17 segments are assigned to a
vascular territory on the basis of the perfusion-defect pattern.11
The portion of the TPD corresponding to a given territory was
used for the automated quantification in each vessel, with a
threshold of 2% as previously established.11,14 We have used
the 13N-ammonia normal limits database, which is derived
from gender-combined very low likelihood patients with
normal perfusion images, for perfusion quantification.15
Automated co-registration. We have adopted
the previously developed software for standalone SPECT to
CCTA registration.6 In brief, to provide a robust registration
approach, we registered pre-segmented MPI volumes using the
LV segmentation algorithm of quantitative gated PET16 and the
additional segmentation of the blood-pool region, derived from
the MPI LV definition. For both CCTA and MPI, transverse
image orientation was used during the registration process. The
MPI-CCTA registration algorithm was implemented as previ-
ously described.6 Phase adjustment as previously described7
was not performed in the current study. Automated co-
registration was performed without any manual intervention.
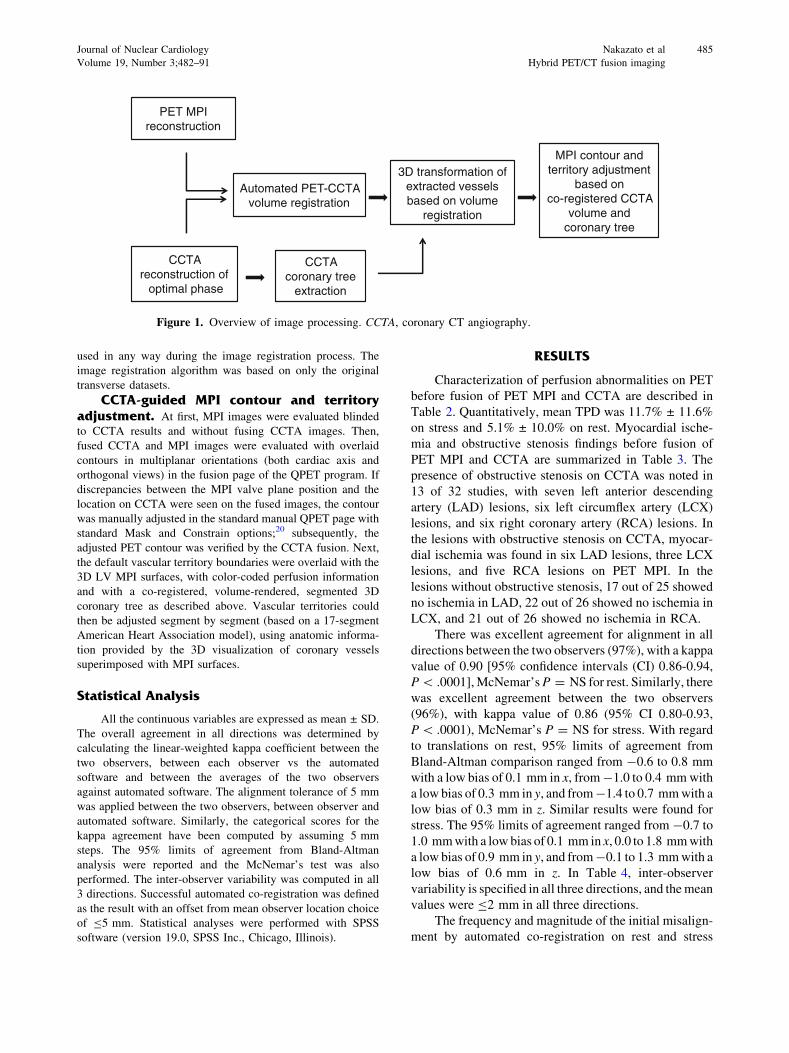
An overview of image processing is presented in Figure 1.
Manual co-registration. For validation purposes,
separate expert manual alignment was performed blinded to the
automated co-registration results. Two expert observers inde-
pendently verified the alignment of CCTA images with emission
PET data, using the fusion capability of the quantitative
perfusion QPET software developed at our institution.14 Data
were reviewed in all the planes using a multiplanar (sagital,
coronal, and transverse) display of PET, CT, and fused PET/CT
data. The manual alignment parameters [three translations (x, y,
and z)] were recorded by expert observers for the comparison
with the automated co-registration. X axis reflects left-to-right
direction, y axis reflects front-to-back direction, while z axis
reflects bottom-to-top (feet to head) direction. Experts were able
to adjust the window and level settings on the CT display and
adjust alpha-blending between PET and CT image components
before adjusting the position. Roving window display (an
interactive superimposition of a portion of the PET image on the
CT image) was also used in all the cases to judge the
misalignment.17 The observers performed a visual alignment
in three dimensions (x, y, and z), adjusting x, y, and z shifts to
measure quantitatively the misalignment between PET and
CCTA data. The manual alignment process took about
2-3 minutes for each case. To resolve the differences between
the two observers for the misalignment correction, average x, y,
and z misalignments were computed by averaging the two
observers’ results for each case.
Comparison of manual and automaticregistration. The automated co-registration algorithm was
applied and compared to the average visual alignment for the
64 datasets (32 of stress and 32 of rest). The alignment error
was defined based on the comparison of automated
co-registration with averaged manual registration by the two
observers as the difference between the results of manual and
automated alignment. The initial misalignment between PET
and CCTA before any corrections were applied (amount of
motion correction) was defined as the difference between
alignment parameters before and after automated co-registra-
tion as well as before and after manual registration.
Vessel extraction and 3D visualization. For
the 3D visualization of coronary vessels superimposed with
MPI surfaces, we used the output obtained from CCTA
analysis using the Syngo Circulation software (Siemens,
Erlangen, Germany) on a LEONARDO workstation (Siemens,
Forchheim, Germany). The coronary tree was segmented
automatically with a region-growing algorithm. To complete
the coronary artery tree, missing vessel segments were marked
manually and then added to the dataset by the algorithm.18 The
file containing the 3D binary mask was transferred to the
standalone workstation with QPET software. Within QPET,
volume rendering was performed in OpenGL with 2D/3D
textures and pre-assigned color tables with varying red-green-
blue intensities and opacities to maximize the contrast opacity,
provide realistic display (blood/tissue: pink/red; calcium:
white), and minimize the influence of neighboring tissue such
as fat.19 Other details have been previously described.6 A 3D
bounding box was used to speed up the volume rendering of
coronary arteries. The bounding box was directly computed
from the coronary mask. The rendering was integrated with the
standard 3D MPI epicardial surfaces. Raw perfusion informa-
tion of quantitative blackout maps could be displayed on the
epicardial surface. Stress and rest images had the same CCTA
image superimposed. These segmented coronary trees derived
from CCTA were used only for display purposes and were not
484 Nakazato et al Journal of Nuclear Cardiology
Hybrid PET/CT fusion imaging May/June 2012
used in any way during the image registration process. The
image registration algorithm was based on only the original
transverse datasets.
CCTA-guided MPI contour and territoryadjustment. At first, MPI images were evaluated blinded
to CCTA results and without fusing CCTA images. Then,
fused CCTA and MPI images were evaluated with overlaid
contours in multiplanar orientations (both cardiac axis and
orthogonal views) in the fusion page of the QPET program. If
discrepancies between the MPI valve plane position and the
location on CCTA were seen on the fused images, the contour
was manually adjusted in the standard manual QPET page with
standard Mask and Constrain options;20 subsequently, the
adjusted PET contour was verified by the CCTA fusion. Next,
the default vascular territory boundaries were overlaid with the
3D LV MPI surfaces, with color-coded perfusion information
and with a co-registered, volume-rendered, segmented 3D
coronary tree as described above. Vascular territories could
then be adjusted segment by segment (based on a 17-segment
American Heart Association model), using anatomic informa-
tion provided by the 3D visualization of coronary vessels
superimposed with MPI surfaces.
Statistical Analysis
All the continuous variables are expressed as mean ± SD.
The overall agreement in all directions was determined by
calculating the linear-weighted kappa coefficient between the
two observers, between each observer vs the automated
software and between the averages of the two observers
against automated software. The alignment tolerance of 5 mm
was applied between the two observers, between observer and
automated software. Similarly, the categorical scores for the
kappa agreement have been computed by assuming 5 mm
steps. The 95% limits of agreement from Bland-Altman
analysis were reported and the McNemar’s test was also
performed. The inter-observer variability was computed in all
3 directions. Successful automated co-registration was defined
as the result with an offset from mean observer location choice
of B5 mm. Statistical analyses were performed with SPSS
software (version 19.0, SPSS Inc., Chicago, Illinois).
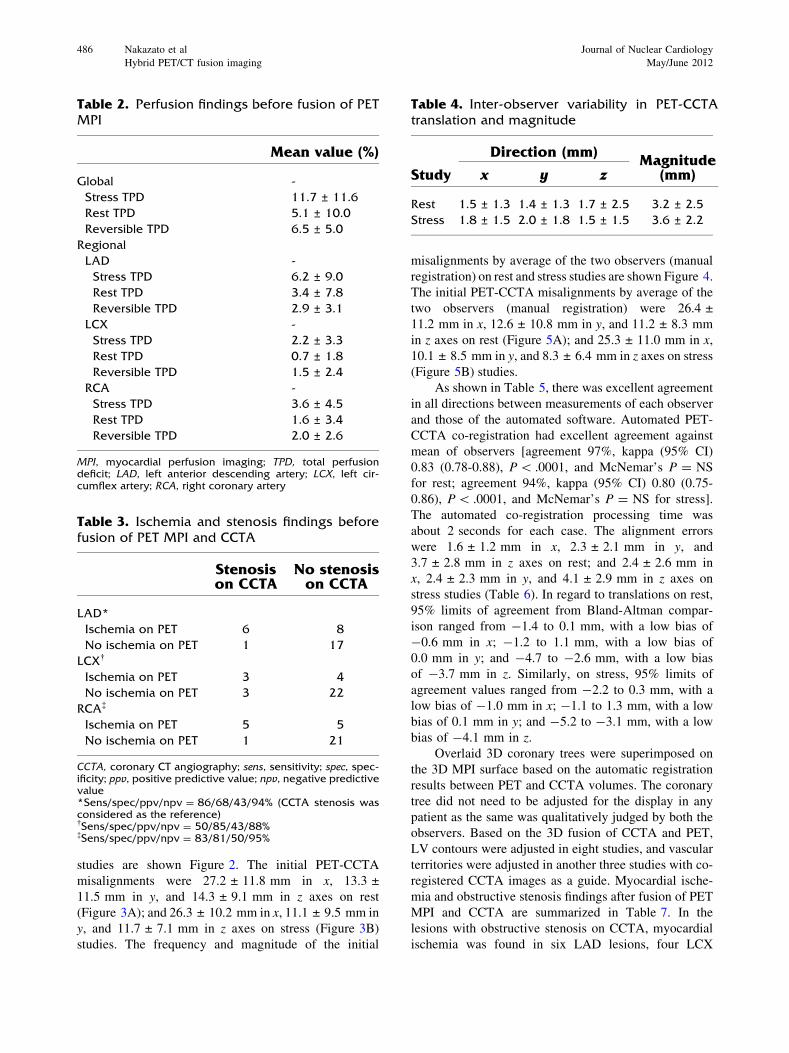
RESULTS
Characterization of perfusion abnormalities on PET
before fusion of PET MPI and CCTA are described in
Table 2. Quantitatively, mean TPD was 11.7% ± 11.6%
on stress and 5.1% ± 10.0% on rest. Myocardial ische-
mia and obstructive stenosis findings before fusion of
PET MPI and CCTA are summarized in Table 3. The
presence of obstructive stenosis on CCTA was noted in
13 of 32 studies, with seven left anterior descending
artery (LAD) lesions, six left circumflex artery (LCX)
lesions, and six right coronary artery (RCA) lesions. In
the lesions with obstructive stenosis on CCTA, myocar-
dial ischemia was found in six LAD lesions, three LCX
lesions, and five RCA lesions on PET MPI. In the
lesions without obstructive stenosis, 17 out of 25 showed
no ischemia in LAD, 22 out of 26 showed no ischemia in
LCX, and 21 out of 26 showed no ischemia in RCA.
There was excellent agreement for alignment in all
directions between the two observers (97%), with a kappa
value of 0.90 [95% confidence intervals (CI) 0.86-0.94,
P \ .0001], McNemar’s P = NS for rest. Similarly, there
was excellent agreement between the two observers
(96%), with kappa value of 0.86 (95% CI 0.80-0.93,
P \ .0001), McNemar’s P = NS for stress. With regard
to translations on rest, 95% limits of agreement from
Bland-Altman comparison ranged from -0.6 to 0.8 mm
with a low bias of 0.1 mm in x, from -1.0 to 0.4 mm with
a low bias of 0.3 mm in y, and from -1.4 to 0.7 mm with a
low bias of 0.3 mm in z. Similar results were found for
stress. The 95% limits of agreement ranged from -0.7 to
1.0 mm with a low bias of 0.1 mm in x, 0.0 to 1.8 mm with
a low bias of 0.9 mm in y, and from -0.1 to 1.3 mm with a
low bias of 0.6 mm in z. In Table 4, inter-observer
variability is specified in all three directions, and the mean
values were B2 mm in all three directions.
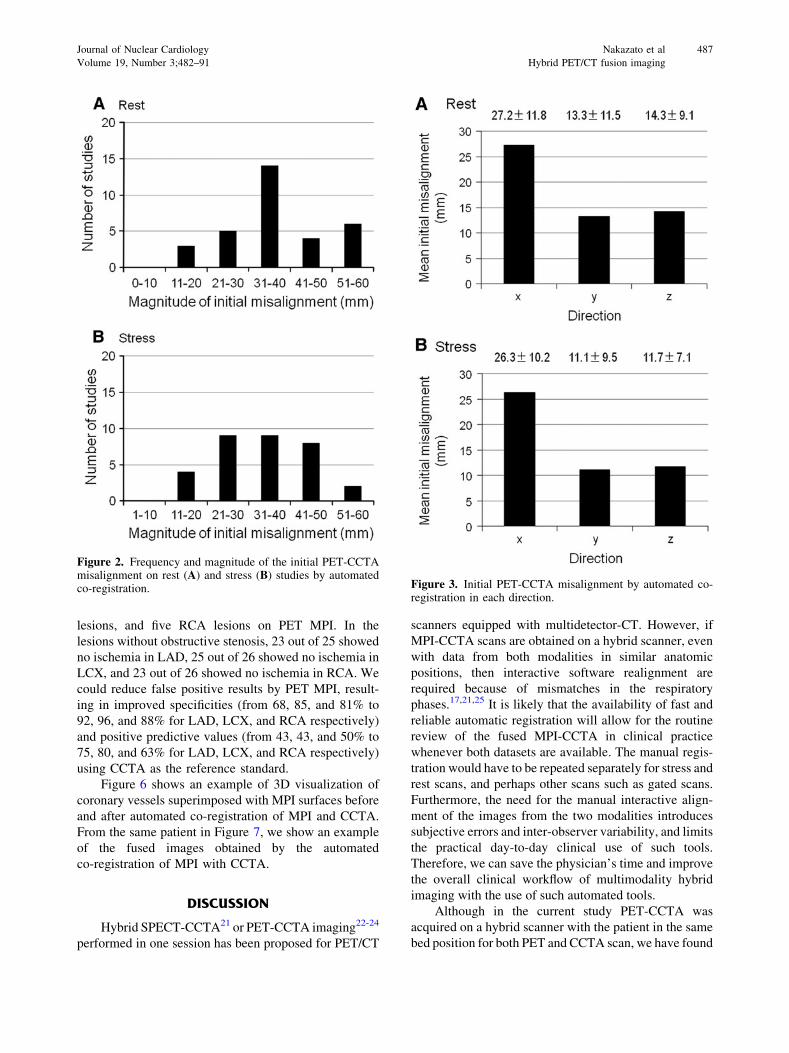
The frequency and magnitude of the initial misalign-
ment by automated co-registration on rest and stress
CCTA reconstruction of optimal phase
CCTA coronary tree
extraction
PET MPI reconstruction
Automated PET-CCTA volume registration
3D transformation of extracted vessels based on volume
registration
MPI contour and territory adjustment
based on co-registered CCTA
volume and coronary tree
Figure 1. Overview of image processing. CCTA, coronary CT angiography.
Journal of Nuclear Cardiology Nakazato et al 485
Volume 19, Number 3;482–91 Hybrid PET/CT fusion imaging
studies are shown Figure 2. The initial PET-CCTA
misalignments were 27.2 ± 11.8 mm in x, 13.3 ±
11.5 mm in y, and 14.3 ± 9.1 mm in z axes on rest
(Figure 3A); and 26.3 ± 10.2 mm in x, 11.1 ± 9.5 mm in
y, and 11.7 ± 7.1 mm in z axes on stress (Figure 3B)
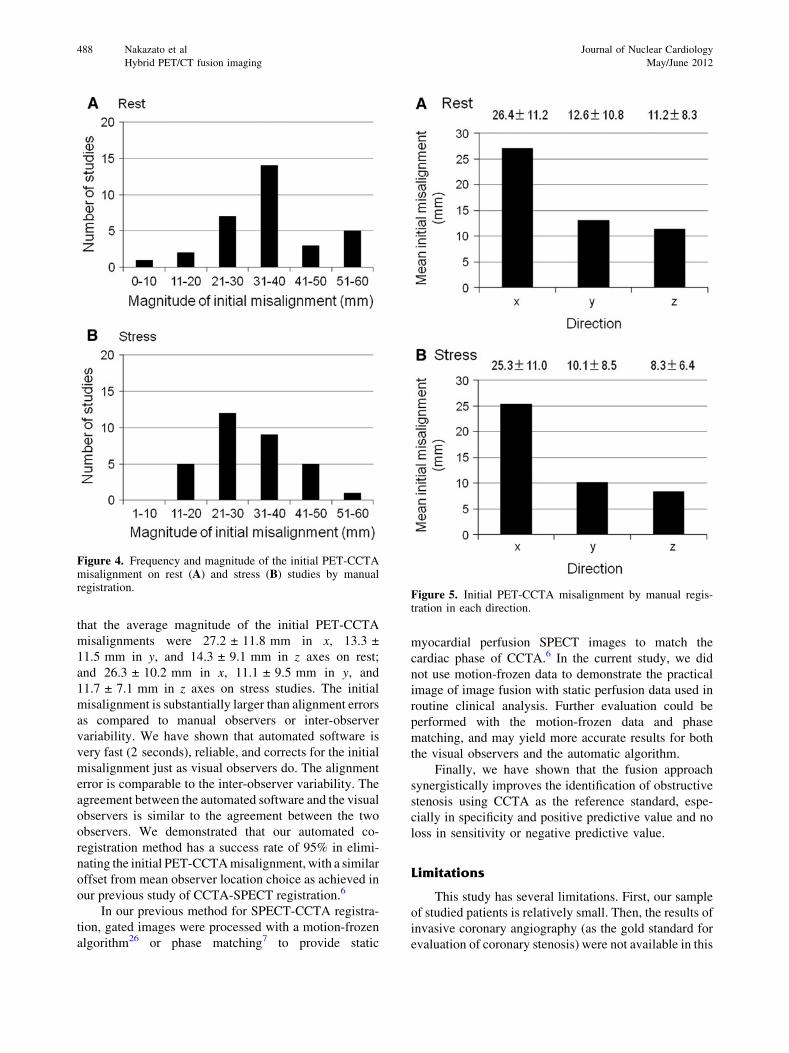
studies. The frequency and magnitude of the initial
misalignments by average of the two observers (manual
registration) on rest and stress studies are shown Figure 4.
The initial PET-CCTA misalignments by average of the
two observers (manual registration) were 26.4 ±
11.2 mm in x, 12.6 ± 10.8 mm in y, and 11.2 ± 8.3 mm
in z axes on rest (Figure 5A); and 25.3 ± 11.0 mm in x,
10.1 ± 8.5 mm in y, and 8.3 ± 6.4 mm in z axes on stress
(Figure 5B) studies.
As shown in Table 5, there was excellent agreement
in all directions between measurements of each observer
and those of the automated software. Automated PET-
CCTA co-registration had excellent agreement against
mean of observers [agreement 97%, kappa (95% CI)
0.83 (0.78-0.88), P \ .0001, and McNemar’s P = NS
for rest; agreement 94%, kappa (95% CI) 0.80 (0.75-
0.86), P \ .0001, and McNemar’s P = NS for stress].
The automated co-registration processing time was
about 2 seconds for each case. The alignment errors
were 1.6 ± 1.2 mm in x, 2.3 ± 2.1 mm in y, and
3.7 ± 2.8 mm in z axes on rest; and 2.4 ± 2.6 mm in
x, 2.4 ± 2.3 mm in y, and 4.1 ± 2.9 mm in z axes on
stress studies (Table 6). In regard to translations on rest,
95% limits of agreement from Bland-Altman compar-
ison ranged from -1.4 to 0.1 mm, with a low bias of
-0.6 mm in x; -1.2 to 1.1 mm, with a low bias of
0.0 mm in y; and -4.7 to -2.6 mm, with a low bias
of -3.7 mm in z. Similarly, on stress, 95% limits of
agreement values ranged from -2.2 to 0.3 mm, with a
low bias of -1.0 mm in x; -1.1 to 1.3 mm, with a low
bias of 0.1 mm in y; and -5.2 to -3.1 mm, with a low
bias of -4.1 mm in z.
Overlaid 3D coronary trees were superimposed on
the 3D MPI surface based on the automatic registration
results between PET and CCTA volumes. The coronary
tree did not need to be adjusted for the display in any
patient as the same was qualitatively judged by both the
observers. Based on the 3D fusion of CCTA and PET,
LV contours were adjusted in eight studies, and vascular
territories were adjusted in another three studies with co-
registered CCTA images as a guide. Myocardial ische-
mia and obstructive stenosis findings after fusion of PET
MPI and CCTA are summarized in Table 7. In the
lesions with obstructive stenosis on CCTA, myocardial
ischemia was found in six LAD lesions, four LCX
Table 2. Perfusion findings before fusion of PETMPI
Mean value (%)
Global -
Stress TPD 11.7 ± 11.6
Rest TPD 5.1 ± 10.0
Reversible TPD 6.5 ± 5.0
Regional
LAD -
Stress TPD 6.2 ± 9.0
Rest TPD 3.4 ± 7.8
Reversible TPD 2.9 ± 3.1
LCX -
Stress TPD 2.2 ± 3.3
Rest TPD 0.7 ± 1.8
Reversible TPD 1.5 ± 2.4
RCA -
Stress TPD 3.6 ± 4.5
Rest TPD 1.6 ± 3.4
Reversible TPD 2.0 ± 2.6
MPI, myocardial perfusion imaging; TPD, total perfusiondeficit; LAD, left anterior descending artery; LCX, left cir-cumflex artery; RCA, right coronary artery
Table 3. Ischemia and stenosis findings beforefusion of PET MPI and CCTA
Stenosison CCTA
No stenosison CCTA
LAD*
Ischemia on PET 6 8
No ischemia on PET 1 17
LCX�
Ischemia on PET 3 4
No ischemia on PET 3 22
RCA�
Ischemia on PET 5 5
No ischemia on PET 1 21
CCTA, coronary CT angiography; sens, sensitivity; spec, spec-ificity; ppv, positive predictive value; npv, negative predictivevalue*Sens/spec/ppv/npv = 86/68/43/94% (CCTA stenosis wasconsidered as the reference)�Sens/spec/ppv/npv = 50/85/43/88%�Sens/spec/ppv/npv = 83/81/50/95%
Table 4. Inter-observer variability in PET-CCTAtranslation and magnitude
Direction (mm)Magnitude
(mm)Study x y z
Rest 1.5 ± 1.3 1.4 ± 1.3 1.7 ± 2.5 3.2 ± 2.5
Stress 1.8 ± 1.5 2.0 ± 1.8 1.5 ± 1.5 3.6 ± 2.2
486 Nakazato et al Journal of Nuclear Cardiology
Hybrid PET/CT fusion imaging May/June 2012
lesions, and five RCA lesions on PET MPI. In the
lesions without obstructive stenosis, 23 out of 25 showed
no ischemia in LAD, 25 out of 26 showed no ischemia in
LCX, and 23 out of 26 showed no ischemia in RCA. We
could reduce false positive results by PET MPI, result-
ing in improved specificities (from 68, 85, and 81% to
92, 96, and 88% for LAD, LCX, and RCA respectively)
and positive predictive values (from 43, 43, and 50% to
75, 80, and 63% for LAD, LCX, and RCA respectively)
using CCTA as the reference standard.
Figure 6 shows an example of 3D visualization of
coronary vessels superimposed with MPI surfaces before
and after automated co-registration of MPI and CCTA.
From the same patient in Figure 7, we show an example
of the fused images obtained by the automated
co-registration of MPI with CCTA.
DISCUSSION
Hybrid SPECT-CCTA21 or PET-CCTA imaging22-24
performed in one session has been proposed for PET/CT
scanners equipped with multidetector-CT. However, if
MPI-CCTA scans are obtained on a hybrid scanner, even
with data from both modalities in similar anatomic
positions, then interactive software realignment are
required because of mismatches in the respiratory
phases.17,21,25 It is likely that the availability of fast and
reliable automatic registration will allow for the routine
review of the fused MPI-CCTA in clinical practice
whenever both datasets are available. The manual regis-
tration would have to be repeated separately for stress and
rest scans, and perhaps other scans such as gated scans.
Furthermore, the need for the manual interactive align-
ment of the images from the two modalities introduces
subjective errors and inter-observer variability, and limits
the practical day-to-day clinical use of such tools.
Therefore, we can save the physician’s time and improve
the overall clinical workflow of multimodality hybrid
imaging with the use of such automated tools.
Although in the current study PET-CCTA was
acquired on a hybrid scanner with the patient in the same
bed position for both PET and CCTA scan, we have found
Figure 2. Frequency and magnitude of the initial PET-CCTAmisalignment on rest (A) and stress (B) studies by automatedco-registration. Figure 3. Initial PET-CCTA misalignment by automated co-
registration in each direction.
Journal of Nuclear Cardiology Nakazato et al 487
Volume 19, Number 3;482–91 Hybrid PET/CT fusion imaging
that the average magnitude of the initial PET-CCTA
misalignments were 27.2 ± 11.8 mm in x, 13.3 ±
11.5 mm in y, and 14.3 ± 9.1 mm in z axes on rest;
and 26.3 ± 10.2 mm in x, 11.1 ± 9.5 mm in y, and
11.7 ± 7.1 mm in z axes on stress studies. The initial
misalignment is substantially larger than alignment errors
as compared to manual observers or inter-observer
variability. We have shown that automated software is
very fast (2 seconds), reliable, and corrects for the initial
misalignment just as visual observers do. The alignment
error is comparable to the inter-observer variability. The
agreement between the automated software and the visual
observers is similar to the agreement between the two
observers. We demonstrated that our automated co-
registration method has a success rate of 95% in elimi-
nating the initial PET-CCTA misalignment, with a similar
offset from mean observer location choice as achieved in
our previous study of CCTA-SPECT registration.6
In our previous method for SPECT-CCTA registra-
tion, gated images were processed with a motion-frozen
algorithm26 or phase matching7 to provide static
myocardial perfusion SPECT images to match the
cardiac phase of CCTA.6 In the current study, we did
not use motion-frozen data to demonstrate the practical
image of image fusion with static perfusion data used in
routine clinical analysis. Further evaluation could be
performed with the motion-frozen data and phase
matching, and may yield more accurate results for both
the visual observers and the automatic algorithm.
Finally, we have shown that the fusion approach
synergistically improves the identification of obstructive
stenosis using CCTA as the reference standard, espe-
cially in specificity and positive predictive value and no
loss in sensitivity or negative predictive value.
Limitations
This study has several limitations. First, our sample
of studied patients is relatively small. Then, the results of
invasive coronary angiography (as the gold standard for
evaluation of coronary stenosis) were not available in this
Figure 4. Frequency and magnitude of the initial PET-CCTAmisalignment on rest (A) and stress (B) studies by manualregistration.
Figure 5. Initial PET-CCTA misalignment by manual regis-tration in each direction.
488 Nakazato et al Journal of Nuclear Cardiology
Hybrid PET/CT fusion imaging May/June 2012

study since only a small proportion of the patients
underwent this procedure. Nevertheless, this study
focused on the validation of the automated alignment
between the two modalities. Although we performed fully
automated image registration, the contour definitions
and vascular territory were manually guided by the
co-registered CCTA anatomy; however, it is feasible that
this adjustment can be automated in the future if automatic
segmentation of CCTA scan is performed. In our appli-
cation, the success of registration depends on successful
MPS contour determination. If the contours are incor-
rectly determined, causing the LV shape to be grossly
distorted, then the automatic registration could fail.
Further, it is a currently clinically uncommon occurrence
for patients to have both PET and CCTA studies; however,
such protocols have been proposed for certain patient
groups.27,28 Our estimated mean effective radiation dose
was similar with helical CT protocol in those previous
reports. The hybrid approach used in this study was
associated with a higher radiation exposure than alterna-
tive approaches using either PET or CCTA alone.29 Note
that the 13N-ammonia scan dose is very low for both rest
and stress scans (1.5 mSv for each),9 which is much lower
than radiation dose from the SPECT scan. Therefore,
dosimetry from the combined study 13N-ammonia PET is
comparable to approaches commonly used to investigate
CAD (i.e., one-day technetium 99m SPECT and CCTA or
invasive coronary angiography). This exposure will be
greatly reduced, providing the ability of more extensive
ECG dose modulation and prospective gating with step-
and-shoot protocols, which is expected to greatly reduce
radiation doses from CCTA by more than 50%. Further-
more, by potentially reducing the number of unnecessary
coronary revascularization procedures, the hybrid
approach will ultimately result in a lower overall radiation
burden in patients. In addition, hybrid imaging may allow
stress-only PET, further reducing radiation dose.28,30
Finally, the motion-frozen data was not used, and the
phase on CCTA was not matched to MPI. This may be
revisited in the future when ‘‘motion-frozen’’ images are
used routinely for perfusion assessment.
CONCLUSION
Software co-registration of CCTA and PET
obtained on hybrid PET/CT scanners is still necessary
Table 5. Agreement in all directions between each observer vs. automated software
Agreement (%) kappa (95% CI) P value McNemar’s P value
Observer 1 vs. automated
Rest 95 0.82 (0.77-0.87) \.0001 NS
Stress 94 0.77 (0.71-0.83) \.0001 NS
Observer 2 vs. automated
Rest 95 0.83 (0.78-0.88) \.0001 NS
Stress 93 0.77 (0.71-0.83) \.0001 NS
Table 6. Offset from mean observer location choice in PET-CCTA translation and magnitude
Direction (mm)
Magnitude (mm)Study x y z
Rest 1.6 ± 1.2 2.3 ± 2.1 3.7 ± 2.8 5.3 ± 2.8
Stress 2.4 ± 2.6 2.4 ± 2.3 4.1 ± 2.9 6.0 ± 3.5
Table 7. Ischemia and stenosis findings afterfusion of PET MPI and CCTA
Stenosison CCTA
No stenosison CCTA
LAD*
Ischemia on PET 6 2
No ischemia on PET 1 23
LCX�
Ischemia on PET 4 1
No ischemia on PET 2 25
RCA�
Ischemia on PET 5 3
No ischemia on PET 1 23
*Sens/spec/ppv/npv = 86/92/75/96% (CCTA stenosis wasconsidered as the reference)�Sens/spec/ppv/npv = 67/96/80/93%�Sens/spec/ppv/npv = 83/88/63/96%
Journal of Nuclear Cardiology Nakazato et al 489
Volume 19, Number 3;482–91 Hybrid PET/CT fusion imaging

due to different breathing protocols with the two
modalities, but it can be performed rapidly and auto-
matically, allowing for a rapid, integrated 3D display
and CCTA-guided contour and territory adjustment on
PET.
Acknowledgments
This work was supported in part by a grant to Dr Bermanfrom the Diane and Gilford Glazer Foundation. We would liketo thank Mark Hyun from Cedars-Sinai Medical Center for histechnical help. We would like to thank Arpine Oganyan forediting and proof-reading the text. Drs Daniel Berman andPiotr Slomka receive royalties from the software employed inthe study. All others disclose no current conflict of interest.
References
1. Berman D, Hachamovitch R, Shaw L, Friedman J, Hayes S,
Thomson L, et al. Roles of nuclear cardiology, cardiac computed
tomography, and cardiac magnetic resonance: assessment of
patients with suspected coronary artery disease. J Nucl Med
2006;47:74-82.
2. Taylor AJ, Cerqueira M, Hodgson JM, Mark D, Min J, O’Gara P,
et al. ACCF/SCCT/ACR/AHA/ASE/ASNC/NASCI/SCAI/SCMR
2010 appropriate use criteria for cardiac computed tomography: A
report of the American College of Cardiology Foundation
Appropriate Use Criteria Task Force, the Society of Cardiovas-
cular Computed Tomography, the American College of
Radiology, the American Heart Association, the American Society
of Echocardiography, the American Society of Nuclear Cardiol-
ogy, the North American Society for Cardiovascular Imaging, the
Society for Cardiovascular Angiography and Interventions, and
the Society for Cardiovascular Magnetic Resonance. J Am Coll
Cardiol 2010;56:1864-94.
3. Gaemperli O, Schepis T, Valenta I, Husmann L, Scheffel H,
Duerst V, et al. Cardiac image fusion from stand-alone SPECT and
CT: clinical experience. J Nucl Med 2007;48:696-703.
4. Santana CA, Garcia EV, Faber TL, Sirineni GK, Esteves FP,
Sanyal R, et al. Diagnostic performance of fusion of myocardial
perfusion imaging (MPI) and computed tomography coronary
angiography. J Nucl Cardiol 2009;16:201-11.
5. Gaemperli O, Schepis T, Kalff V, Namdar M, Valenta I, Stefani L,
et al. Validation of a new cardiac image fusion software for three-
dimensional integration of myocardial perfusion SPECT and
stand-alone 64-slice CT angiography. Eur J Nucl Med Mol
Imaging 2007;34:1097-106.
6. Slomka P, Cheng V, Dey D, Woo J, Ramesh A, Van Kriekinge S,
et al. Quantitative analysis of myocardial perfusion SPECT ana-
tomically guided by coregistered 64-slice coronary CT
angiography. J Nucl Med 2009;50:1621-30.
7. Woo J, Slomka PJ, Dey D, Cheng VY, Hong BW, Ramesh A,
et al. Geometric feature-based multimodal image registration of
contrast-enhanced cardiac CT with gated myocardial perfusion
SPECT. Med Phys 2009;36:5467-79.
8. Aladl UE, Hurwitz GA, Dey D, Levin D, Drangova M, Slomka PJ.
Automated image registration of gated cardiac single-photon
emission computed tomography and magnetic resonance imaging.
J Magn Reson Imaging 2004;19:283-90.
9. Johansson L, Mattsson S, Nosslin B, Leide-Svegborn S. Effective
dose from radiopharmaceuticals. Eur J Nucl Med 1992;19:933-8.
10. Raff G, Abidov A, Achenbach S, Berman D, Boxt L, Budoff M,
et al. SCCT guidelines for the interpretation and reporting of
coronary computed tomographic angiography. J Cardiovasc
Comput Tomogr 2009;3:122-36.
11. Slomka PJ, Nishina H, Berman DS, Akincioglu C, Abidov A,
Friedman JD, et al. Automated quantification of myocardial per-
fusion SPECT using simplified normal limits. J Nucl Cardiol
2005;12:66-77.
Figure 6. 3D visualization of coronary vessels superimposedwith MPI surfaces, before and after CT misalignmentcorrection.
Figure 7. Automated volume alignment of CCTA and MPI insame patient with Figure 6. Rows from top to bottom show inMultiplanar orientations original CCTA images (A), originalMPI images (B), fused unregistered MPI and CCTA images(C), and same images after automated volume registration (D).Subsequently, 3D transformation parameters obtained fromvolume registration can be used to align associated coronarytrees with MPI surfaces.
490 Nakazato et al Journal of Nuclear Cardiology
Hybrid PET/CT fusion imaging May/June 2012
12. Berman D, Kang X, Hayes S, Friedman J, Cohen I, Abidov A,
et al. Adenosine myocardial perfusion single-photon emission
computed tomography in women compared with men. Impact of
diabetes mellitus on incremental prognostic value and effect on
patient management. J Am Coll Cardiol 2003;41:1125-33.
13. Shaw LJ, Berman DS, Maron DJ, Mancini GB, Hayes SW,
Hartigan PM, et al. Optimal medical therapy with or without
percutaneous coronary intervention to reduce ischemic burden:
Results from the Clinical Outcomes Utilizing Revascularization
and Aggressive Drug Evaluation (COURAGE) trial nuclear sub-
study. Circulation 2008;117:1283-91.
14. Nakazato R, Berman D, Dey D, Le Meunier L, Hayes S, Fermin J,
et al. Automated quantitative Rb-82 3D PET/CT myocardial per-
fusion imaging: Normal limits and correlation with invasive
coronary angiography. J Nucl Cardiol 2011 Dec 28 [Epub ahead of
print].
15. Slomka PJ, Alexanderson E, Jacome R, Jimenez M, Romero E,
Meave A, et al. Comparison of clinical tools for measurements of
regional stress and rest myocardial blood flow assessed with 13N-
ammonia PET/CT. J Nucl Med 2012;53:171-81.
16. Slomka P, Germano G, Kavanagh P, Javadi M, Berman D, Bengel
F. Evaluation of a new automatic algorithm for quantification of
ECG-gated 82Rb cardiac PET. J Nucl Med 2009;50:1167.
17. Slomka PJ. Software approach to merging molecular with ana-
tomic information. J Nucl Med 2004;45:36S-45S.
18. Busch S, Johnson TR, Nikolaou K, von Ziegler F, Knez A, Reiser
MF, et al. Visual and automatic grading of coronary artery ste-
noses with 64-slice CT angiography in reference to invasive
angiography. Eur Radiol 2007;17:1445-51.
19. Levin D, Aladl U, Germano G, Slomka P. Techniques for efficient,
real-time, 3D visualization of multi-modality cardiac data using
consumer graphics hardware. Comput Med Imaging Graph
2005;29:463-75.
20. Germano G, Kavanagh PB, Slomka PJ, Van Kriekinge SD, Pollard
G, Berman DS. Quantitation in gated perfusion SPECT imaging:
The Cedars-Sinai approach. J Nucl Cardiol 2007;14:433-54.
21. Rispler S, Keidar Z, Ghersin E, Roguin A, Soil A, Dragu R, et al.
Integrated single-photon emission computed tomography and
computed tomography coronary angiography for the assessment of
hemodynamically significant coronary artery lesions. J Am Coll
Cardiol 2007;49:1059-67.
22. Di Carli MF, Dorbala S, Hachamovitch R. Integrated cardiac PET-
CT for the diagnosis and management of CAD. J Nucl Cardiol
2006;13:139-44.
23. Namdar M, Hany TF, Koepfli P, Siegrist PT, Burger C, Wyss CA,
et al. Integrated PET/CT for the assessment of coronary artery
disease: A feasibility study. J Nucl Med 2005;46:930-5.
24. Javadi M, Mahesh M, McBride G, Voicu C, Epley W, Merrill J,
et al. Lowering radiation dose for integrated assessment of coro-
nary morphology and physiology: First experience with step-and-
shoot CT angiography in a rubidium 82 PET-CT protocol. J Nucl
Cardiol 2008;15:783-90.
25. Slomka PJ, Baum RP. Multimodality image registration with
software: State-of-the-art. Eur J Nucl Med Mol Imaging 2009;36:
S44-55.
26. Slomka P, Nishina H, Berman D, Kang X, Akincioglu C, Fried-
man J, et al. ‘‘Motion-frozen’’ display and quantification of
myocardial perfusion. J Nucl Med 2004;45:1128-34.
27. Di Carli MF, Dorbala S, Curillova Z, Kwong RJ, Goldhaber SZ,
Rybicki FJ, et al. Relationship between CT coronary angiography
and stress perfusion imaging in patients with suspected ischemic
heart disease assessed by integrated PET-CT imaging. J Nucl
Cardiol 2007;14:799-809.
28. Kajander S, Joutsiniemi E, Saraste M, Pietila M, Ukkonen H,
Saraste A, et al. Cardiac positron emission tomography/computed
tomography imaging accurately detects anatomically and func-
tionally significant coronary artery disease. Circulation 2010;122:
603-13.
29. Einstein AJ, Moser KW, Thompson RC, Cerqueira MD, Henzlova
MJ. Radiation dose to patients from cardiac diagnostic imaging.
Circulation 2007;116:1290-305.
30. Husmann L, Herzog BA, Gaemperli O, Tatsugami F, Burkhard N,
Valenta I, et al. Diagnostic accuracy of computed tomography
coronary angiography and evaluation of stress-only single-photon
emission computed tomography/computed tomography hybrid
imaging: Comparison of prospective electrocardiogram-triggering
vs. retrospective gating. Eur Heart J 2009;30:600-7.
Journal of Nuclear Cardiology Nakazato et al 491
Volume 19, Number 3;482–91 Hybrid PET/CT fusion imaging