Automated video-based facial expression analysis of
15
Journal of Neuroscience Methods 168 (2008) 224–238 Automated video-based facial expression analysis of neuropsychiatric disorders Peng Wang a , Frederick Barrett b , Elizabeth Martin b , Marina Milonova c , Raquel E. Gur d,e,f , Ruben C. Gur b,e , Christian Kohler f , Ragini Verma a,∗ a Section of Biomedical Image Analysis, Department of Radiology, University of Pennsylvania, 3600 Market, Suite 380, Philadelphia, PA 19104, USA b Brain Behavior Center, Department of Psychiatry, University of Pennsylvania Medical Center, Hospital of the University of Pennsylvania, 3400 Spruce Street, 10th Floor Gates Building Philadelphia, PA 19104, USA c School of Arts and Sciences, University of Pennsylvania Medical Center, Hospital of the University of Pennsylvania, 3400 Spruce Street, 10th Floor Gates Building Philadelphia, PA 19104, USA d Department of Psychiatry, University of Pennsylvania Medical Center, Hospital of the University of Pennsylvania, 3400 Spruce Street, 10th Floor Gates Building Philadelphia, PA 19104, USA e Department of Neurology & Radiology, University of Pennsylvania Medical Center, Hospital of the University of Pennsylvania, 3400 Spruce Street, 10th Floor Gates Building Philadelphia, PA 19104, USA f Neuropsychiatry Section, University of Pennsylvania Medical Center, Hospital of the University of Pennsylvania, 3400 Spruce Street, 10th Floor Gates Building Philadelphia, PA 19104, USA Received 16 July 2007; received in revised form 20 September 2007; accepted 20 September 2007 Abstract Deficits in emotional expression are prominent in several neuropsychiatric disorders, including schizophrenia. Available clinical facial expression evaluations provide subjective and qualitative measurements, which are based on static 2D images that do not capture the temporal dynamics and subtleties of expression changes. Therefore, there is a need for automated, objective and quantitative measurements of facial expressions captured using videos. This paper presents a computational framework that creates probabilistic expression profiles for video data and can potentially help to automatically quantify emotional expression differences between patients with neuropsychiatric disorders and healthy controls. Our method automatically detects and tracks facial landmarks in videos, and then extracts geometric features to characterize facial expression changes. To analyze temporal facial expression changes, we employ probabilistic classifiers that analyze facial expressions in individual frames, and then propagate the probabilities throughout the video to capture the temporal characteristics of facial expressions. The applications of our method to healthy controls and case studies of patients with schizophrenia and Asperger’s syndrome demonstrate the capability of the video-based expression analysis method in capturing subtleties of facial expression. Such results can pave the way for a video-based method for quantitative analysis of facial expressions in clinical research of disorders that cause affective deficits. © 2007 Elsevier B.V. All rights reserved. Keywords: Facial expression; Video analysis; Schizophrenia; Affective deficits; Pattern classification 1. Introduction Facial expressions have been used in clinical research to study deficits in emotional expression and social cognition in neu- ropsychiatric disorders (Morrison et al., 1988; Berenbaum and ∗ Corresponding author. Tel.: +1 215 662 7471; fax: +1 215 614 0266. E-mail addresses: [email protected] (P. Wang), [email protected] (F. Barrett), [email protected] (R.E. Gur), [email protected] (R.C. Gur), [email protected] (C. Kohler), [email protected] (R. Verma). Oltmann, 1992; Kring et al., 1994; Mandal et al., 1998). Specif- ically, patients with schizophrenia often demonstrate two types of impairments in facial expressions: “flat affect” and “inappro- priate affect“(Gur et al., 2006). However, most of the current clinical methods, such as the scale for assessment of negative symptoms (SANS (Andreasen, 1984)), are based on subjective ratings and therefore provide qualitative measurements. They also require extensive human expertise and interpretation. This underlines the need for automated, objective and quantitative measurements of facial expression. We previously reported a method for quantifying facial expressions based on static images 0165-0270/$ – see front matter © 2007 Elsevier B.V. All rights reserved. doi:10.1016/j.jneumeth.2007.09.030
Transcript of Automated video-based facial expression analysis of

A
esutaaphaf©
K
1
dr
f((
0d
Journal of Neuroscience Methods 168 (2008) 224–238
Automated video-based facial expression analysisof neuropsychiatric disorders
Peng Wang a, Frederick Barrett b, Elizabeth Martin b, Marina Milonova c,Raquel E. Gur d,e,f, Ruben C. Gur b,e, Christian Kohler f, Ragini Verma a,∗
a Section of Biomedical Image Analysis, Department of Radiology, University of Pennsylvania, 3600 Market, Suite 380, Philadelphia, PA 19104, USAb Brain Behavior Center, Department of Psychiatry, University of Pennsylvania Medical Center, Hospital of the University of Pennsylvania,
3400 Spruce Street, 10th Floor Gates Building Philadelphia, PA 19104, USAc School of Arts and Sciences, University of Pennsylvania Medical Center, Hospital of the University of Pennsylvania,
3400 Spruce Street, 10th Floor Gates Building Philadelphia, PA 19104, USAd Department of Psychiatry, University of Pennsylvania Medical Center, Hospital of the University of Pennsylvania,
3400 Spruce Street, 10th Floor Gates Building Philadelphia, PA 19104, USAe Department of Neurology & Radiology, University of Pennsylvania Medical Center, Hospital of the University of Pennsylvania,
3400 Spruce Street, 10th Floor Gates Building Philadelphia, PA 19104, USAf Neuropsychiatry Section, University of Pennsylvania Medical Center, Hospital of the University of Pennsylvania,
3400 Spruce Street, 10th Floor Gates Building Philadelphia, PA 19104, USA
Received 16 July 2007; received in revised form 20 September 2007; accepted 20 September 2007
bstract
Deficits in emotional expression are prominent in several neuropsychiatric disorders, including schizophrenia. Available clinical facial expressionvaluations provide subjective and qualitative measurements, which are based on static 2D images that do not capture the temporal dynamics andubtleties of expression changes. Therefore, there is a need for automated, objective and quantitative measurements of facial expressions capturedsing videos. This paper presents a computational framework that creates probabilistic expression profiles for video data and can potentially helpo automatically quantify emotional expression differences between patients with neuropsychiatric disorders and healthy controls. Our methodutomatically detects and tracks facial landmarks in videos, and then extracts geometric features to characterize facial expression changes. Tonalyze temporal facial expression changes, we employ probabilistic classifiers that analyze facial expressions in individual frames, and thenropagate the probabilities throughout the video to capture the temporal characteristics of facial expressions. The applications of our method to
ealthy controls and case studies of patients with schizophrenia and Asperger’s syndrome demonstrate the capability of the video-based expressionnalysis method in capturing subtleties of facial expression. Such results can pave the way for a video-based method for quantitative analysis ofacial expressions in clinical research of disorders that cause affective deficits.2007 Elsevier B.V. All rights reserved.
; Patte
Oi
eywords: Facial expression; Video analysis; Schizophrenia; Affective deficits
. Introduction
Facial expressions have been used in clinical research to studyeficits in emotional expression and social cognition in neu-opsychiatric disorders (Morrison et al., 1988; Berenbaum and
∗ Corresponding author. Tel.: +1 215 662 7471; fax: +1 215 614 0266.E-mail addresses: [email protected] (P. Wang),
[email protected] (F. Barrett), [email protected]. Gur), [email protected] (R.C. Gur), [email protected]. Kohler), [email protected] (R. Verma).
opcsraumm
165-0270/$ – see front matter © 2007 Elsevier B.V. All rights reserved.oi:10.1016/j.jneumeth.2007.09.030
rn classification
ltmann, 1992; Kring et al., 1994; Mandal et al., 1998). Specif-cally, patients with schizophrenia often demonstrate two typesf impairments in facial expressions: “flat affect” and “inappro-riate affect“(Gur et al., 2006). However, most of the currentlinical methods, such as the scale for assessment of negativeymptoms (SANS (Andreasen, 1984)), are based on subjectiveatings and therefore provide qualitative measurements. They
lso require extensive human expertise and interpretation. Thisnderlines the need for automated, objective and quantitativeeasurements of facial expression. We previously reported aethod for quantifying facial expressions based on static images
scienc
(rer2tatotlIvuo
acAvaFretio2tcti
ufbpBoitespcwaftotn
pwpS
2
2
uaebnadeuits(foseamm
2
pfmidetairtsAbRbbtm
2
iC
P. Wang et al. / Journal of Neuro
Verma et al., 2005; Alvino et al., 2007). However, tempo-al information plays an important role in understanding facialxpressions because emotion processing is naturally a tempo-al procedure. Therefore, facial expression analysis from staticD images lacks the temporal component, which is essentialo capture subtle changes in expression. Although video-basedcquisition has been employed in the examination of facial emo-ion expression (Kring and Sloan, 2007), currently there is nobjective and automated way of facial expression analysis forhe study of neuropsychiatric disorders, particularly due to thearge volume of data that makes human analysis prohibitive.n this paper, we present a computational framework that usesideos to automatically analyze facial expressions and can besed to characterize impairments in such neuropsychiatric dis-rders.
The merits of automated facial expression analysis (AFEA)re two-fold: using it can avoid intensive human efforts, andan provide unified quantitative results. There are already manyFEA methods being presented in both clinical and computerision communities (Gaebel and Wolwer, 1992; Hellewell etl., 1994; Schneider et al., 1990; Pantic and Rothkrantz, 2000;asel and Luettin, 2003; Tian et al., 2005). Most of the cur-ent AFEA methods focus on the recognition of posed facialxpressions with application to human computer interactionasks, and only a few of them have been applied to clinical stud-es (Verma et al., 2005; Alvino et al., 2007). In previous workn expression quantification (Verma et al., 2005; Alvino et al.,007), the expression changes were modeled using elastic shaperansformations between the face of a neutral template and theorresponding emotionally expressive face. Again, as most ofhe current AFEA methods, this approach is based on static 2Dmages without any temporal component.
In this paper, we present a computational framework thatses videos for the analysis of facial expression changes. Thisramework explores the dynamic information that is not capturedy static images during emotion processing, and provides com-utationally robust results with potential clinical applicability.roadly, our computational framework includes the detectionf faces in videos, which are then tracked through the video,ncorporating shape changes. Based on tracking results, fea-ures are extracted from faces to create probabilistic facialxpression classifiers. The probabilistic outputs of facial expres-ion classifiers are propagated throughout the video, to createrobabilistic profiles of facial expressions. Probabilistic profilesontain dynamic information of facial expressions, based onhich quantitative measures are extracted for analysis. As an
pplication of this framework, such quantitative measurementsor facial expressions could be correlated with clinical ratingso study the facial expression deficits in neuropsychiatric dis-rders. To our knowledge, the presented framework is the firsto apply video-based automated facial expression analysis ineuropsychiatric research.
The rest of the paper is organized as follows: In Section 2,
revious related work is reviewed. Our computational frame-ork is presented in Section 3. The experimental results arerovided in Section 4. We discuss the results and conclude inection 5.timt
e Methods 168 (2008) 224–238 225
. Related work
.1. Clinical facial expression analysis
In clinical research, facial expressions are usually studiedsing 2D images that are described in two ways: either ascombination of muscular movements or as universal global
xpressions. The Facial Action Coding System (FACS) haseen developed to describe facial expressions using a combi-ation of action units (AU) (Ekman and Friesen, 1978). Eachction unit corresponds to a specific muscular activity that pro-uces momentary changes in facial appearance. The global facialxpression handles the expressions as a whole without breakingp into AUs. The most commonly studied universal expressionsnclude happiness, sadness, anger and fear, which are referredo as universal emotions. While most of the work has been ontatic 2D images, the Facial Expression Coding System (FACES)Kring and Sloan, 2007) has been designed to analyze videos ofacial expressions, in terms of the duration, content and valencef universal expressions. However, these methods need inten-ive human intervention to rate the images and videos of facialxpressions. Such rating methods are prone to subjective errors,nd have difficulties in providing unified quantitative measure-ents. There is need for automated, objective and quantitativeeasurements of facial expressions.
.2. Automated facial expression analysis
Automated facial expression analysis (AFEA) allows com-uters to automatically provide quantitative measurements ofacial expressions. Several factors have contributed towardsaking AFEA challenging. First, facial expressions vary across
ndividuals due to the differences of the facial appearance,egree of facial plasticity, morphology and frequency of facialxpressions (Tian et al., 2005). Second, it is difficult to quan-ify the intensity of facial expressions, especially when theyre subtle. In FACS, a set of rules are used to score AUntensities (Ekman and Friesen, 1978). However, such crite-ia are subjective to the rater; therefore, it is difficult to extendhe measurements to computer-based facial expression analy-is, although there have been methods to automatically detectUs (Pantic and Rothkrantz, 2000). Many AFEA methods haveeen developed recently to address such problems (Pantic andothkrantz, 2000; Fasel and Luettin, 2003). These methods cane categorized as image-based, video-based and 3D surface-ased, according to the data used. Below we summarize someypical image-based and video-based facial expression analysis
ethods.
.2.1. Image-based methodsImage-based methods extract features from individual
mages, and create classifiers to recognize facial expressions.ommonly used are geometric features, texture features, and
heir combinations. Geometric features represent the spatialnformation of facial expressions, such as positions of eyes and
outh, the distance between two eyebrows. The geometric fea-ures used by Tian et al. (2001) are grouped into permanent

2 scienc
aewt((eeepnaeGss((itfteaN2c
2
r(heae1bmatrsco(ttsfBou2voa
sfd
trefta2vdi2d
aaaiwvfii
3
ets
3i
vlaebegalmfftett
26 P. Wang et al. / Journal of Neuro
nd transient. The permanent features include positions of lips,yes, brows, cheeks and furrows that have become permanentith age. The transient features include facial lines and furrows
hat are not present at rest but appear with facial expressionsTian et al., 2001). The texture features include image intensityBartlett et al., 1999), image difference (Fasel and Luettin, 2000),dge (Tian et al., 2001; Lien et al., 1998), and wavelets (Lyonst al., 1999; Littlewort et al., 2006). To recognize subtle facialxpressions, both features computed by using principal com-onents and image difference usually require precise alignment,ot readily feasible in real world applications. The edge featuresre often used to describe furrows and lines caused by facialxpressions, but are difficult to detect for subtle expressions.abor wavelets calculated from facial appearance describe both
patial and frequency information for image analysis, and havehown capability in face recognition and facial feature trackingWiskott et al., 1997), as well as facial expression recognitionLyons et al., 1999; Littlewort et al., 2006). Furthermore, exper-ments (Bartlett et al., 1999; Zhang et al., 1998) demonstratehat the fusion of appearance features (Gabor wavelets or PCAeatures) and geometric features can provide better accuracyhan using either of them alone. To recognize facial expressions,xtracted features are input to facial expression classifiers, suchs the Nearest Neighbor classifier (Fasel and Luettin, 2000),eural Networks (Tian et al., 2001), SVM (Littlewort et al.,006), Bayesian Networks (Cohen et al., 2003a), and AdaBoostlassifier (Littlewort et al., 2006; Wang et al., 2004).
.2.2. Video-based methodsIt is claimed that temporal information can improve the accu-
acy of facial expression recognition over using static imagesCohen et al., 2003b). However, only few video-based methodsave been developed to use the temporal information of facialxpressions (Littlewort et al., 2006; Cohen et al., 2003b; Yacoobnd Davis, 1996; Yeasin et al., 2004; Lien et al., 2000; Changt al., 2004). In the work of Yacoob et al. (Yacoob and Davis,996), each facial expression is divided into three segments: theeginning, the apex and the ending. Rules are defined to deter-ine the temporal model of facial expressions. Such rules are
d hoc, and cannot be generalized to complex environments. Inhe work of Cohen et al. (2003b), facial expressions are rep-esented in terms of magnitudes of predefined facial motions,o called Motion-Units (MU). A Tree-Augmented-Naive Bayeslassifier is first used to recognize facial expressions at the levelf static images, and then a multi-level Hidden Markov ModelHMM) structure is applied to recognize facial expressions athe level of video sequences. Yeasin et al. (2004) also present awo-stage approach to recognize facial expression and its inten-ity in video using optical flow. Another example of using HMMor facial expression analysis can be found in Lien et al. (2000).esides HMM, the sampling-based probabilistic tracking meth-ds, known as “particle filtering” or “Condensation”, are alsosed to track facial expression in video sequence (Chang et al.,
004, 2005). Manifold subspace features have been applied forideo-based facial expression analysis. However, in their meth-ds, a separate manifold is built for each subject, and the subjectsppear in both training and testing sequences. It is unclear that(aef
e Methods 168 (2008) 224–238
uch specifically learned manifolds can be generalized to dif-erent subjects, since it is observed that their manifolds showifferent structures (Chang et al., 2004).
An important facet in video-based methods is how to main-ain accurate tracking throughout the video sequence. A wideange of deformable models, such as muscle-based models (Ohtat al., 1998), a 3D wireframe model (Cohen et al., 2003b), aacial mesh model (Essa and Pentland, 1995, 1997), a poten-ial net model (Kimura and Yachida, 1997), ASM (Lanitis etl., 1997), and a geometry-based shape model (Verma et al.,005; Davatzikos, 2001), are used to track facial features inideo. Although it has been demonstrated that a sophisticatedeformable model can improve facial tracking accuracy, therebymproving facial expression analysis accuracy (Wen and Huang,003), there are no comprehensive experiments showing whicheformable model is superior to the others.
In summary, video-based methods can capture subtle changesnd temporal trends of facial expression, which cannot bechieved by static image-based methods. Due to the largemount of data in videos, a fully automated method for analysiss required. In the following sections, we first present a frame-ork that is able to quantify the facial expression changes inideo, and then describe normative data on healthy people, andnally apply the method in two illustrative patients to examine
ts potential for research in neuropsychiatric disorders.
. Methods
This section presents our computational framework for facialxpression analysis using video data. We provide an overview ofhe framework in Section 3.1, with further details in subsequentubsections.
.1. A framework of quantitative facial expression analysisn video
Our framework for automated facial expression analysis ofideo data comprises the following components: (1) detectingandmarks that define the facial shape, and tracking landmarksnd hence the facial changes due to expressions; (2) featurextraction based on these landmarks; (3) creation of classifiersased on extracted features, and probabilistic classification atach frame of the video sequence; and (4) probabilistic propa-ation of facial expressions throughout the video. We first applyface detector and a landmark detector to automatically locate
andmarks in videos. Based on these detected landmarks, theethod further extracts geometric features to characterize the
ace shape changes caused by facial expressions. Geometriceatures are normalized, which are demonstrated to be robusto skin color and illumination variations, and are input to facialxpression classifiers for analysis. Therefore, the third part ofhe method is the creation of probabilistic classifiers usinghe extracted features. Offline-trained support vector machines
SVMs) (a type of non-linear pattern classification technique)re employed to obtain the likelihood probability of each facialxpression. Since the probabilistic classifiers only describe theacial expressions at individual frames, our framework further
P. Wang et al. / Journal of Neuroscience Methods 168 (2008) 224–238 227
tion a
pvrtTtTsma
3
irfmse1mdwfit(itrfc
3
froaaAnccHscf
1offo
3
iAtfiimaptcabiP
maeoTucollect about 100 face images with manually annotated land-marks, to obtained AAM models. Our implementation of AAMis modified from Stegmann et al. (2003). For given images withunknown faces, our method automatically detects the landmarks
Fig. 1. Landmark detec
ropagates the measurements at individual frames throughoutideos using a sequential Bayesian inference scheme, to obtain aepresentation of facial expression changes in the whole video inhe form of a temporal probabilistic profile of facial expressions.he computational framework is general, and applicable to all
ypes of participants, for video-based facial expression analysis.he method is applied to a group of healthy people and repre-entative patients with neuropsychiatric disorders, and measure-ents extracted from probabilistic profile of facial expressions
re expected to distinguish between patients and controls.
.2. Landmark detection and tracking in video
In this section, we present our landmark detection and track-ng method. In the work of Alvino et al. (2007), the faceegion is manually outlined to obtain the deformation betweenaces with expression and neutral faces for analysis. However,anual labeling is time-consuming, and subjective to the per-
on who labels the face. Especially in our study, the video ofach participant may contain different facial expressions, up to0,000–20,000 frames. Thus, it is a formidable task to manuallyark all the face shapes in the videos. An automated system is
esirable to perform the landmark points detection and trackingith minimum human intervention. To automate the process, werst detect the face and facial landmarks in the starting frame of
he video using a face detector and an Active Appearance ModelAAM) (Cootes et al., 2001), and then track the landmark pointsn all the remaining frames. In the meantime, the face detec-or is running through the video to monitor the tracking, ande-initializes the tracker when participants’ faces are out of therontal view or occluded when the facial expression analysisannot be performed. The whole scheme is illustrated in Fig. 1.
.2.1. Face detectionIn our method, the face is automatically detected in the first
rame of the video. Many face detection methods have beenecently developed (Yang et al., 2002). Among current meth-ds, the AdaBoost-based methods achieve excellent detectionccuracy as well as real-time speed (Viola and Jones, 2004; Lind Zhang, 2004; Wang and Ji, 2007). Here we have applieddaBoost algorithm with Haar features, to detect frontal andear-frontal faces (Viola and Jones, 2004). In this method,ritical Haar features are sequentially selected from an over-omplete feature set, which may contain more than 45,000
aar wavelet features. Threshold classifiers are learned from theelected features, and are combined by AdaBoost. With a cas-ade structure (Viola and Jones, 2004), AdaBoost-based frontalace detection methods can achieve real-time speed (i.e., above
nd tracking in videos.
5 frames per second) with accuracy comparable to other meth-ds. Note that our face detector aims at detecting only frontalaces, since our facial expression analysis is only applied torontal faces. Fig. 2 shows face detection result in the first framef a video.
.2.2. Landmark detection and trackingInside each detected face, our method further identifies
mportant landmarks to characterize facial expression changes.ctive appearance model (AAM) (Cootes et al., 2001) locates
hese landmark points. AAM is a statistical method to modelace appearance as well as face shape. In AAM, the face shapes represented by a set of landmarks, and the face texture is themage intensity or color of the whole face region. AAM face
odel combines the principal components from face texturend shape to formalize a vector, and then apply an additionalrincipal component analysis (PCA) to further reduce the fea-ure dimensionality. AAM models can be learned offline fromollected annotated training samples. To locate landmarks ingiven image with unknown faces, an efficient method has
een developed in Cootes et al. (2001) to identify landmarksn images by minimizing the error between original face and itsCA reconstruction.
In our method, we define the face shape using 58 land-arks, as shown in Fig. 3(a). Among those landmarks, 5 points
re defined on each eye brow, 8 points are defined on eachye, 11 points are defined on the nose, 8 points are definedn the mouth, and 13 points are defined on the face outline.he face texture in our AAM is defined as the RGB color val-es of the face, which are transformed on the mean shape. We
Fig. 2. Face detection at the first frame.

228 P. Wang et al. / Journal of Neuroscience Methods 168 (2008) 224–238
Fig. 3. Definition of landmarks and their detection: (a) 58 landmarks defined on face; (b) the landmarks detected at the first frame.
cking
ul
vafmuts
3d
msd
sliftfofafst
Fr
Fig. 4. Landmark tra
sing the trained AAM model. Fig. 3(b) shows the detectedandmarks at the first frame of video.
AAM is also used to track the landmark points in the rest of theideo. At each frame, the face shape is initialized with the shapet the previous frame, and then AAM is applied to update theace shape at the current frame. Compared to independent land-ark detection at individual frames, the AAM tracking speeds
p the searching procedure by limiting the searching only aroundhe previous location, given the assumption that the face movesmoothly. Fig. 4 shows the tracked landmarks in the video.
.2.3. Combination of face detection and landmarketection
Although participants are instructed to restrict their headovement during data capture, the faces of participants could
till be out of the frontal view sometimes. Such cases will failuring face tracking as well as in the facial expression analy-
3
a
ig. 5. Landmark tracking combined with face detection: (a) tracking when face is de-initialized when the face is back to frontal view.
results in the video.
is. To address such a problem, face detection is combined withandmark tracking such that landmarks detected can be mon-tored. The frontal face detector will lose detection when theaces are out of the frontal view or are occluded. Then the AAMracking will be stopped. The face detector will keep searchingrames until the face is back to its frontal view, or the occlusion isver. Then the AAM tracker is re-initialized inside the detectedace region. In our experiments, only about 1.4% of frames inll participants have shown non-frontal faces. The faces out ofrontal view will be excluded from the subsequent facial expres-ion analysis. Fig. 5 shows how face detection can find the facehat is out of view and re-initialize the face tracking.
.3. Facial expression feature extraction
Geometric features are extracted from landmarks to char-cterize facial expression changes. The first type of geometric
etected; (b) AAM tracking is stopped when face is out of view; (c) tracking is
P. Wang et al. / Journal of Neuroscience Methods 168 (2008) 224–238 229
F egion
fmgffnsmi
sefeignfata
3
ttcsdItcptaamiSi
i
wμ
if
oupbiseamttTbcteab“edf
3p
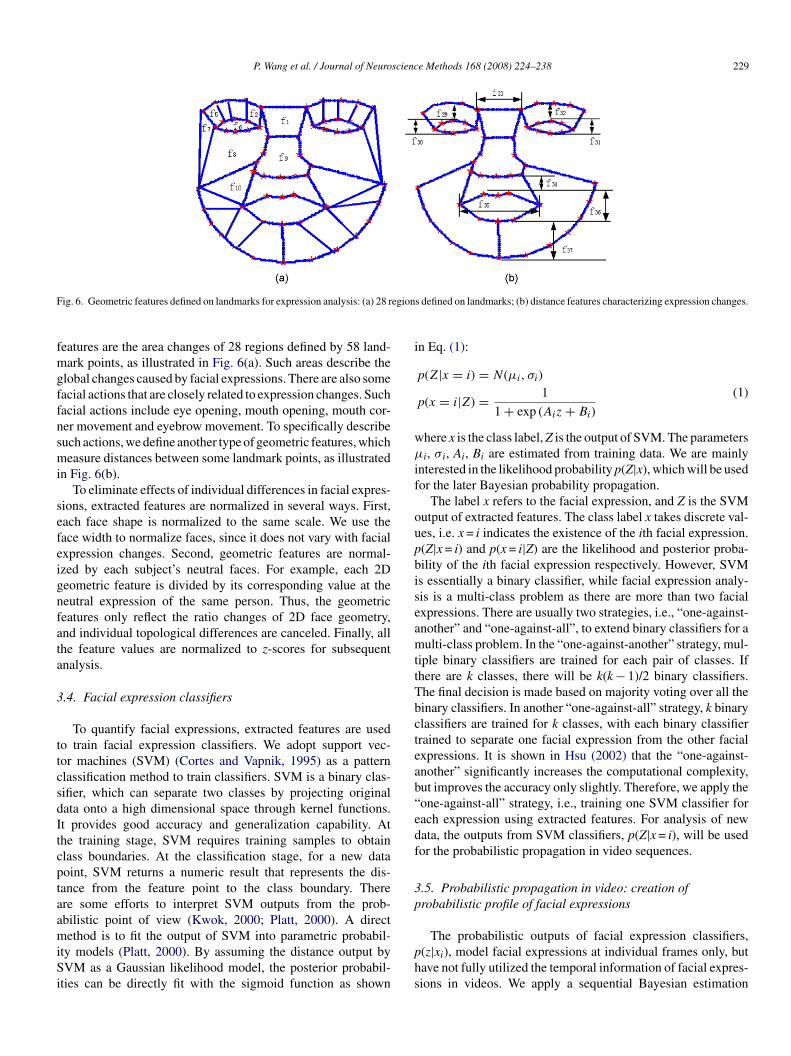
ig. 6. Geometric features defined on landmarks for expression analysis: (a) 28 r
eatures are the area changes of 28 regions defined by 58 land-ark points, as illustrated in Fig. 6(a). Such areas describe the
lobal changes caused by facial expressions. There are also someacial actions that are closely related to expression changes. Suchacial actions include eye opening, mouth opening, mouth cor-er movement and eyebrow movement. To specifically describeuch actions, we define another type of geometric features, whicheasure distances between some landmark points, as illustrated
n Fig. 6(b).To eliminate effects of individual differences in facial expres-
ions, extracted features are normalized in several ways. First,ach face shape is normalized to the same scale. We use theace width to normalize faces, since it does not vary with facialxpression changes. Second, geometric features are normal-zed by each subject’s neutral faces. For example, each 2Deometric feature is divided by its corresponding value at theeutral expression of the same person. Thus, the geometriceatures only reflect the ratio changes of 2D face geometry,nd individual topological differences are canceled. Finally, allhe feature values are normalized to z-scores for subsequentnalysis.
.4. Facial expression classifiers
To quantify facial expressions, extracted features are usedo train facial expression classifiers. We adopt support vec-or machines (SVM) (Cortes and Vapnik, 1995) as a patternlassification method to train classifiers. SVM is a binary clas-ifier, which can separate two classes by projecting originalata onto a high dimensional space through kernel functions.t provides good accuracy and generalization capability. Athe training stage, SVM requires training samples to obtainlass boundaries. At the classification stage, for a new dataoint, SVM returns a numeric result that represents the dis-ance from the feature point to the class boundary. Therere some efforts to interpret SVM outputs from the prob-bilistic point of view (Kwok, 2000; Platt, 2000). A direct
ethod is to fit the output of SVM into parametric probabil-ty models (Platt, 2000). By assuming the distance output byVM as a Gaussian likelihood model, the posterior probabil-
ties can be directly fit with the sigmoid function as shown
phs
s defined on landmarks; (b) distance features characterizing expression changes.
n Eq. (1):
p(Z|x = i) = N(μi, σi)
p(x = i|Z) = 1
1 + exp (Aiz + Bi)
(1)
here x is the class label, Z is the output of SVM. The parametersi, σi, Ai, Bi are estimated from training data. We are mainly
nterested in the likelihood probability p(Z|x), which will be usedor the later Bayesian probability propagation.
The label x refers to the facial expression, and Z is the SVMutput of extracted features. The class label x takes discrete val-es, i.e. x = i indicates the existence of the ith facial expression.(Z|x = i) and p(x = i|Z) are the likelihood and posterior proba-ility of the ith facial expression respectively. However, SVMs essentially a binary classifier, while facial expression analy-is is a multi-class problem as there are more than two facialxpressions. There are usually two strategies, i.e., “one-against-nother” and “one-against-all”, to extend binary classifiers for aulti-class problem. In the “one-against-another” strategy, mul-
iple binary classifiers are trained for each pair of classes. Ifhere are k classes, there will be k(k − 1)/2 binary classifiers.he final decision is made based on majority voting over all theinary classifiers. In another “one-against-all” strategy, k binarylassifiers are trained for k classes, with each binary classifierrained to separate one facial expression from the other facialxpressions. It is shown in Hsu (2002) that the “one-against-nother” significantly increases the computational complexity,ut improves the accuracy only slightly. Therefore, we apply theone-against-all” strategy, i.e., training one SVM classifier forach expression using extracted features. For analysis of newata, the outputs from SVM classifiers, p(Z|x = i), will be usedor the probabilistic propagation in video sequences.
.5. Probabilistic propagation in video: creation ofrobabilistic profile of facial expressions
The probabilistic outputs of facial expression classifiers,(z|xi), model facial expressions at individual frames only, butave not fully utilized the temporal information of facial expres-ions in videos. We apply a sequential Bayesian estimation

230 P. Wang et al. / Journal of Neuroscienc
sseudmpIa1“bimpaatWtp
P
w
tst
viSpsPemftwfip
3p
miffiie(
m
itplaaai
esisaal
i
Tper
aewpittstfbDbf
Fig. 7. A graphical model for facial expression inference in video.
cheme to propagate the posterior probabilities of facial expres-ions throughout the whole video. The sequential Bayesianstimation and its Monte Carlo derivations have been widelysed in visual tracking (Yeasin et al., 2004), as they can han-le sequential inference problems effectively and elegantly. Ourethod applies the sequential Bayesian estimation to infer the
osterior probability P(xt|Z1:t) of facial expressions in video.n P(xt|Z1:t), xt refers to the facial expression at the tth frame,nd Z1:t represents the history of features extracted from frame
to frame t. To infer P(xt|Z1:t) from individual frames, adynamic model” is needed to describe the temporal relationshipetween facial expressions is needed. Such a dynamic models denoted as P(xt|x1:t−1). Usually, there are two assumptions
ade in the sequential Bayesian estimation for purpose of sim-licity: P(xt|x1:t−1) = P(xt|xt−1) and P(Zt|x1:t) = P(Zt|xt). Suchssumptions are called Markov properties, and have been widelydopted in the sequential inference. A graphical model that illus-rates our sequential Bayesian estimation is shown in Fig. 7.
ith the assumptions of Markov property, posterior probabili-ies can be estimated from a measurement model P(Zt|xt) and aropagated prior P(xt−1|Z1:t−1), based on Bayes rule, as Eq. (2):
(xt|Z1:t) = 1
CP(Zt|xt)P(xt|Z1:t−1)
∝ P(Zt|xt)∑
xt−1
P(xt|xt−1)P(xt−1|Z1:t−1) (2)
here C =∑
xt
P(Zt|xt)P(xt|Z1:t−1) is a normalization constant
hat ensures that the summation of probability equals to 1. Ashown in Eq. (2), the posterior probability P(xt|Z1:t) is sequen-ially estimated from the previous probability P(xt−1|Z1:t−1).
For the facial expression analysis of any participant usingideo, the likelihood measurement P(Zt|xt) is obtained bynputting features extracted from individual frames to the trainedVMs, which are described in Section 3.4. Then the posteriorrobability P(xt|Z1:t) is propagated throughout the video usingequential Bayesian inference, i.e., Eq. (2). The probabilities(xt|Z1:t) therefore describe the temporal characteristics of facialxpressions in videos, and provide the quantitative measure-ents that our method will use for subsequent analysis. These
rame-wise probabilities help create a probabilistic profile for
he expression, which can be visualized as a graph (see Fig. 10)ith each curve corresponding to the response to the classi-er from a particular expression. The five curves together formrobabilistic profiles of facial expressions in videos.4
f
e Methods 168 (2008) 224–238
.6. Information extracted from probabilistic profiles:otential relevance to neuropsychiatric disorders
The probabilistic facial expression profiles provide rich infor-ation about the subtle and dynamic facial expression changes
n video. Our method extracts several types of measurementsrom probabilistic profiles for facial expression analysis. Therst measurement is the average of posterior probabilities of
ntended emotions, as a measurement of appropriate facialxpressions. For the video segment of the ith intended emotione.g., one of happiness, sadness, anger, and fear), the averaged
easurement is denoted as Pi = 1ni
Ni∑
t=1
P(xt = i|Z1:t), where ni
s the length of corresponding video for the ith intended emo-ion. The measurement Pi quantifies the correlation betweenarticipants’ facial expressions and their intended emotions. Aarger Pi refers to a greater expression of the intended emotionnd a lower value corresponds to the amount of inappropriateffect. Therefore, by comparing the measurements of individu-ls from different groups, we can quantify the facial expressionmpairments.
Another measurement derived from a probabilistic facialxpression profile is the probability of the neutral facial expres-ions in videos. For each video segment that contains onentended emotion, the posterior probability of the neutral expres-ion indicates the lack of facial expression, and hence functionss a measure of flat affect, and can be correlated with flatffect ratings. Also, to eliminate the impact of different videoengths, we average the probability of neutral expression for each
ntended emotion, denoted as Ni = 1ni
Ni∑
t=1
P(xt = Neutral|Z1:t).
hus, the probabilistic profile and the measures of flat and inap-ropriate affect computed from the probabilistic profile of facialxpressions, quantify the two major deficits associated with neu-opsychiatric disorders.
Except for the average probabilities, two other measurementsre the occurrence frequency of the appropriate and neutralxpressions. Assuming that during a video, the number of frameshere the maximal poster probability corresponds to the appro-riate (when the expression picked by the probabilistic classifiers same as the intended) and neutral (when the classifier identifieshe expression as neutral) expressions are la and ln respectively,he occurrence frequency of appropriate and neutral expres-ions are defined as fa = la/ni, and fn = ln/ni. Based on definitions,he two measurements describe appropriateness and flatness ofacial expressions. These four measures indicate that the proba-ilistic profile has rich information for facial expression analysis.eveloping more measurements from probabilistic profiles toetter describe dynamics of facial expressions remains part ofuture research.
. Results
In this section, we present results obtained by applying ourramework to a few datasets that underline the generalization
P. Wang et al. / Journal of Neuroscience Methods 168 (2008) 224–238 231
tabas
cmsdwwfpap
4
(nsmtofwa4oegea2iS
futeefitoltUws
aif(odoitIsc
IgUst9chdig
4
4
awaaPennsylvania and permission has been obtained from subjectsfor the publication of pictures. All the participants are chosenin pairs matched for age, ethnicity, and gender. Each partici-pant undergoes two conditions: posed and evoked. In the posed
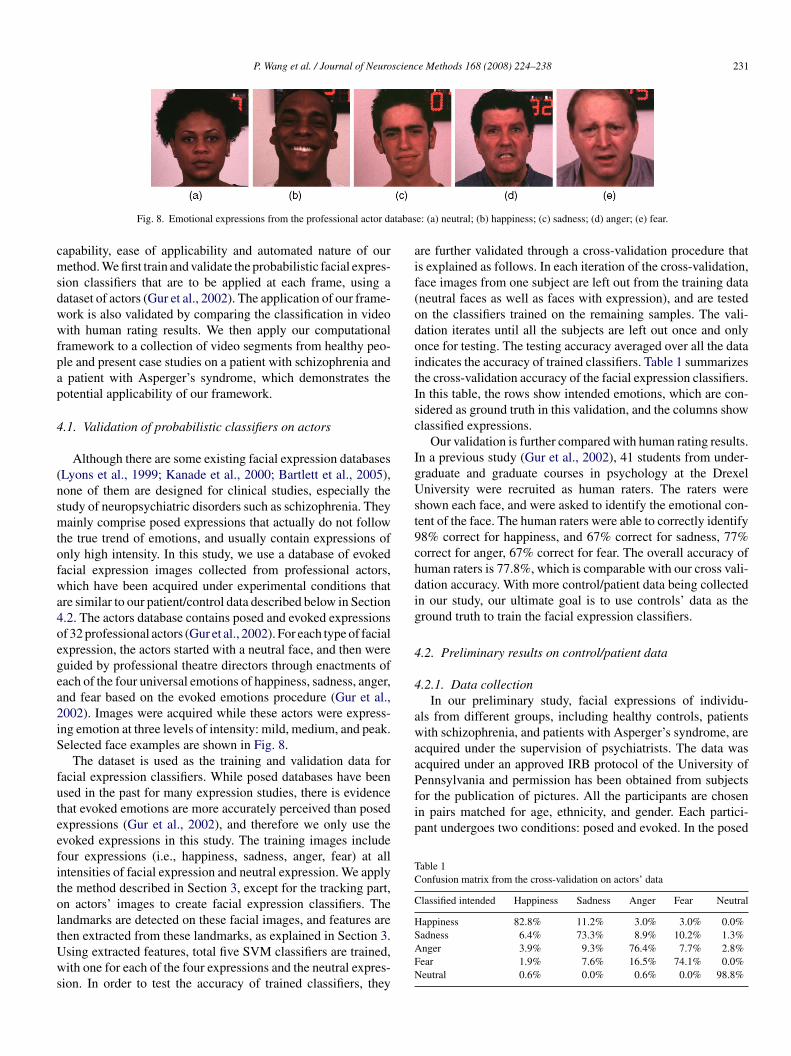
Table 1Confusion matrix from the cross-validation on actors’ data
Classified intended Happiness Sadness Anger Fear Neutral
Happiness 82.8% 11.2% 3.0% 3.0% 0.0%
Fig. 8. Emotional expressions from the professional actor da
apability, ease of applicability and automated nature of ourethod. We first train and validate the probabilistic facial expres-
ion classifiers that are to be applied at each frame, using aataset of actors (Gur et al., 2002). The application of our frame-ork is also validated by comparing the classification in videoith human rating results. We then apply our computational
ramework to a collection of video segments from healthy peo-le and present case studies on a patient with schizophrenia andpatient with Asperger’s syndrome, which demonstrates the
otential applicability of our framework.
.1. Validation of probabilistic classifiers on actors
Although there are some existing facial expression databasesLyons et al., 1999; Kanade et al., 2000; Bartlett et al., 2005),one of them are designed for clinical studies, especially thetudy of neuropsychiatric disorders such as schizophrenia. Theyainly comprise posed expressions that actually do not follow
he true trend of emotions, and usually contain expressions ofnly high intensity. In this study, we use a database of evokedacial expression images collected from professional actors,hich have been acquired under experimental conditions that
re similar to our patient/control data described below in Section.2. The actors database contains posed and evoked expressionsf 32 professional actors (Gur et al., 2002). For each type of facialxpression, the actors started with a neutral face, and then wereuided by professional theatre directors through enactments ofach of the four universal emotions of happiness, sadness, anger,nd fear based on the evoked emotions procedure (Gur et al.,002). Images were acquired while these actors were express-ng emotion at three levels of intensity: mild, medium, and peak.elected face examples are shown in Fig. 8.
The dataset is used as the training and validation data foracial expression classifiers. While posed databases have beensed in the past for many expression studies, there is evidencehat evoked emotions are more accurately perceived than posedxpressions (Gur et al., 2002), and therefore we only use thevoked expressions in this study. The training images includeour expressions (i.e., happiness, sadness, anger, fear) at allntensities of facial expression and neutral expression. We applyhe method described in Section 3, except for the tracking part,n actors’ images to create facial expression classifiers. Theandmarks are detected on these facial images, and features are
hen extracted from these landmarks, as explained in Section 3.sing extracted features, total five SVM classifiers are trained,ith one for each of the four expressions and the neutral expres-ion. In order to test the accuracy of trained classifiers, they
SAFN
e: (a) neutral; (b) happiness; (c) sadness; (d) anger; (e) fear.
re further validated through a cross-validation procedure thats explained as follows. In each iteration of the cross-validation,ace images from one subject are left out from the training dataneutral faces as well as faces with expression), and are testedn the classifiers trained on the remaining samples. The vali-ation iterates until all the subjects are left out once and onlynce for testing. The testing accuracy averaged over all the datandicates the accuracy of trained classifiers. Table 1 summarizeshe cross-validation accuracy of the facial expression classifiers.n this table, the rows show intended emotions, which are con-idered as ground truth in this validation, and the columns showlassified expressions.
Our validation is further compared with human rating results.n a previous study (Gur et al., 2002), 41 students from under-raduate and graduate courses in psychology at the Drexelniversity were recruited as human raters. The raters were
hown each face, and were asked to identify the emotional con-ent of the face. The human raters were able to correctly identify8% correct for happiness, and 67% correct for sadness, 77%orrect for anger, 67% correct for fear. The overall accuracy ofuman raters is 77.8%, which is comparable with our cross vali-ation accuracy. With more control/patient data being collectedn our study, our ultimate goal is to use controls’ data as theround truth to train the facial expression classifiers.
.2. Preliminary results on control/patient data
.2.1. Data collectionIn our preliminary study, facial expressions of individu-
ls from different groups, including healthy controls, patientsith schizophrenia, and patients with Asperger’s syndrome, are
cquired under the supervision of psychiatrists. The data wascquired under an approved IRB protocol of the University of
adness 6.4% 73.3% 8.9% 10.2% 1.3%nger 3.9% 9.3% 76.4% 7.7% 2.8%ear 1.9% 7.6% 16.5% 74.1% 0.0%eutral 0.6% 0.0% 0.6% 0.0% 98.8%

232 P. Wang et al. / Journal of Neuroscienc
sppgteag(iteTbeasocesVieaTufpfo
4f
vtpte
iaioshtw
4bfhgfsfsescyeeid
aafett1cnafcarrs
Since there are possible inconsistency between human ratingsand the intended emotion of participants, there are two typesof percentages, shown in Table 2, to interpret the FACES rat-ing results. Type I percentage refers to, among all the videos
Table 2Confusion matrix of FACES ratings vs. intended emotions of controls
FACES intended Happiness Sadness Anger Fear Percentage I
Happiness 41 2 4 3 82.0%
Fig. 9. The data capturing system.
ession, participants are asked to express the emotions of hap-iness, anger, fear, sadness and disgust, at mild, medium, andeak levels. In the evoked session, participants are individuallyuided through vignettes, which are provided by participantshemselves, and describe a situation in their life pertaining toach emotion. In order to elicit evoked expressions, the vignettesre recounted back to the participants by a psychiatrist, whouides them through all the three levels of expression intensitymild, medium and peak) for each emotion. The videos and 2Dmages are acquired during the course of the expression usinghe setup illustrated in Fig. 9. There are six grayscale stereo cam-ra, one color camera and a video camera (Verma et al., 2005).he color camera captures the 2D images, work on which haseen described in Alvino et al. (2007). The six grayscale cam-ras and the color camera are calibrated to produce images thatre used for 3D reconstruction of the faces. Our work using 3Durface data to analyze facial expressions is beyond the scopef this paper. Since evoked emotions are more accurately per-eived than posed expressions, we only use the videos of evokedxpressions for facial expression analysis, by applying the pre-ented framework. We also exclude disgust from the analysis.ideo recordings of facial emotional expression are segmented
nto 5 clips, 1 for each of the five emotions expressed. Eachmotional segment begins from the mild intensity expressed,nd ends at the extreme intensity, as identified during interview.he patient/control database is currently small and hence wese a few of the datasets to demonstrate the applicability of ourramework. In future, as the dataset grows, we will be able toerform a group-based analysis, using the probabilistic profilesor the expressions obtained from our framework, via measuresf flat and inappropriate affect computed from these.
.2.2. Application of the video-based expression analysisramework
The method described in Section 3 is applied to severalideo clips, each of which contains one type of facial emo-
ional expression of a participant, to obtain the probabilisticrofile for facial expression. First, landmarks are detected andracked in the video, and then facial expression features arextracted from tracked landmarks. The extracted features areSAFP
e Methods 168 (2008) 224–238
nput to facial expression classifiers that have been trained usingctors’ data, to obtain posterior probabilities of facial expressionn videos. In order to validate our framework, we first compareur method with the human ratings using the Facial Expres-ion Coding System (FACES) (Kring and Sloan, 2007) on aealthy control group. To further demonstrate its applicabilityo patients, we examine the method on healthy controls, a patientith schizophrenia, and a patient with Asperger’s syndrome.
.2.2.1. Validation on FACES. In order to validate the video-ased framework, we compare our results with human ratingsrom Facial Expression Coding System (FACES) performed byuman raters, on facial expressions from the healthy controlroup. In FACES, facial expressions in video segments are codedor frequency, duration, valance (positive or negative), and inten-ity (low, medium, high, very high). Two trained raters coded therequency of facial expressions in each video segment. Expres-ions were coded if a neutral expression changed to an emotionalxpression and changed back to a neutral expression (1 expres-ion coded) or to a different emotional expression (2 expressionsoded). Facial changes independent of emotion expression (e.g.awning, licking lips, talking, head nodding, head tilt, divertedye gaze) were not counted as an emotion expression. For everyxpression, the emotion (happiness, sadness, anger, and fear),ntensity (3-point scale of mild, moderate, and extreme), anduration (in seconds) were coded.
For each intended emotion, i.e., one of happiness, sadness,nger and fear, we have used 9 videos of healthy controls. Forrater to perform human FACES ratings, a video clip acquired
rom each participant is divided into separate segments, withach segment only corresponding to one type of intended emo-ion. All the segments are randomized such that raters were blindo the participants’ intended emotion. With capturing speed at5 frames per second, the length of segmented videos in theontrol group varies between 646 and 1431 frames for happi-ess, between 815 and 2620 frames for sadness, between 680nd 3252 frames for anger and between 1042 and 2578 framesor fear. The two raters are consistent with each other at mostases, even they may have small disagreements in the beginningnd ending time of each segmented expression. FACES ratingesults from both raters are summarized in Table 2. In the table,ows show intended emotions of video segments, and columnshow their FACES ratings.
adness 22 30 2 1 54.5%nger 24 5 21 3 39.6%ear 9 18 3 25 45.5%ercentage II 42.7% 54.6% 70.0% 78.1%

scienc
cett
Ftatr
P. Wang et al. / Journal of Neuro
aptured in an intended emotion session, the percentage ofxpressions that are rated as the corresponding intended emo-ion. For example, among all video segments captured as part ofhe session for intended happiness, there are 82.0% expressions
atap
ig. 10. Probabilistic profiles of facial expressions in video for (a) a healthy control;op to bottom, graphs in each column show the probabilities obtained from an individuxis is the frame number, and the vertical axis represents the posterior probability ofypes of expressions: happy (green), sad (blue), anger (red), fear (yellow) and neutraleader is referred to the web version of the article.)
e Methods 168 (2008) 224–238 233
re rated as happiness by raters based on the FACES rule, andhe remaining are rated as other expressions. The type II percent-ge illustrates, among all the expressions rated from FACES, theercentage of expressions that are actually from the correspond-
(b) a patient with schizophrenia; (c) a patient with Aspergers’ syndrome. Fromal’s intended happy, sad, anger, and fear emotions. In each figure, the horizontalfacial expression. Profiles of different colors in the graphs represent different(brown). (For interpretation of the references to color in this figure legend, the

234 P. Wang et al. / Journal of Neuroscience Methods 168 (2008) 224–238
F (c) fee
isaasIneLed
wmvaftiTisTsoec
abb
4mtpton
bexpressions and neutral faces in each intended emotion of thethree participants. In this figure, each color represents one of thefour emotions: happiness (green), sadness (blue), anger (red),fear (yellow), and the neutral expression (brown). The horizontal
Table 3Confusion matrix of classified expressions vs. FACES ratings of controls
Classified FACES Happiness Sadness Anger Fear Accuracy I
Happiness 30 4 7 0 73.2%
ig. 11. Emotional expressions of a healthy control: (a) happiness; (b) anger;xpression. The original probability scales between 0 and 1.
ng intended emotion sessions. For example, among all the videoegments rated as anger by FACES, 70.0% are from the intendednger sessions. The type I percentage is low for sadness, anger,nd fear, demonstrating that videos may contain other expres-ions during one session of single intended emotion. The typeI percentages show that the expression of happiness and sad-ess can appear in other emotion sessions, while anger and fearxpressions appear more in the corresponding emotion sessions.ow percentages of both types demonstrate the uncertainty inxpression and perception of emotions, and also highlight theifficulties of automatic analysis of evoked and subtle emotions.
We further compare our results from probabilistic profilesith human ratings from FACES, and show that our automaticethod presents a reasonable accuracy. In this experiment, we
alidate only on those expressions in which the FACES ratingsre consistent with intended emotions, to reduce the uncertaintyactor in human emotion ratings. After generating probabilis-ic profiles, the mean posterior probabilities of each emotionn videos, i.e., Pi, are used for facial expression recognition.he expression corresponding to the largest Pi is considered the
ntended emotion in the video. Table 3 summarizes the compari-on results between FACES rating and our classification results.he rows show expressions rated from FACES, and the columns
how automatically classified expressions based on the principlef maximal posterior probability. The recognition, except for thexpression of sadness, provides reasonable results. Since all thelassification results are based on the classifiers trained usingSAFA
ar. The length of the bar is proportional to the probability associate with each
ctors’ data, as we currently do not have enough controls foroth training and validation, we expect that the accuracy woulde increased when we have enough controls for training.
.2.2.2. Case studies on individuals from different groups. Theeasurements extracted from probabilistic profiles can be used
o examine different groups, such as healthy controls, andatients with deficits in facial expressions. Here we demonstratehe scalability of our method by applying it on three individuals,ne from each group: healthy controls, patients with schizophre-ia, and patients with Asperger’s syndrome.
Fig. 10 shows the visualization of facial expressions proba-ilistic profiles as graphs of posterior probabilities of four facial
adness 4 12 10 4 40.0%nger 0 5 16 0 76.2%ear 0 5 0 20 80.0%ccuracy II 88.2% 46.2% 48.5% 83.3%

P. Wang et al. / Journal of Neuroscience Methods 168 (2008) 224–238 235
F (b) anger; (c) fear. The length of the bar is proportional to the probability associatew
ataSwwcodso
fiaewtwrniainasf
Table 4Average probability of intended emotion in videos of three participants
Group Happiness Sadness Anger Fear Average
Healthy 0.3889 0.2193 0.3656 0.3789 0.3382SA
fmiP
aetmeasurements will be used to correlate with clinical measure-ments of inappropriate and flat affect when we have collectedenough samples for the group study. Tables 4 and 5 show two
Table 5Average probability of neutral expression in videos of three participants
ig. 12. Emotional expressions of a patient with schizophrenia: (a) happiness;ith each expression.
xis represents the frame index, and the vertical axis representshe posterior probabilities P(xt|Z1:t) for one of four emotionsnd neutral expression, which is denoted as xt, at the tth frames.ome frames from the videos corresponding to these profilesith the corresponding probabilities are shown in Figs. 11–13,here the probabilities are visualized as bars on the top right
orner, with the bar of the longest length corresponding to theutcome of the frame on the application of the classifiers. Asisplayed in these figures, the posterior probabilities of expres-ions, P(xt|Z1:t), indicate the trends of facial expression changesf individuals in the video.
An inspection of Figs. 10–13 indicates that probabilistic pro-les of facial expressions are able to capture subtle expressionsnd to identify expressions that are different from the intendedmotion, hence determining the inappropriateness of emotion, asell as identify frames that have neutral expression thereby iden-
ifying the flatness of expression. The probability bars associatedith the top right corner reveals that the classifier is able to cor-
ectly determine the type and intensity of emotion. In Fig. 11(c),eutral is picked up instead of fear. The classifier is able todentify the emotion correctly even when the expression devi-ted from the intended (Fig. 12(b), frame 1, sadness is identifiednstead of the intended anger and in Fig. 13(c) in which sad-
ess is identified instead of intended fear). These expressionsre rated to be correct by a human rater. Subtle expres-ions are also well identified (Fig. 13(a), frame 3, Fig. 12(a),rame 3).G
HSA
chizophrenia 0.3706 0.1545 0.2540 0.2286 0.2519sperger’s 0.3275 0.2227 0.3519 0.2780 0.2950
After obtaining the probabilistic profiles of facial expressionor each intended emotion, we compute quantitative measure-ents to characterize facial expressions in video. As described
n Section 3.6, four types of measurements are calculated, i.e.,¯i,Ni, fa, and fn. Specifically, Pi and fa quantifies the appropri-te expression for the ith intended emotion (e.g., one of the fourmotions: happiness, sadness, anger, fear), and Ni and fn quan-ify the neutral expression in the ith intended emotion. These
roup Happiness Sadness Anger Fear Average
ealthy 0.1207 0.3830 0.2117 0.2712 0.2467chizophrenia 0.0845 0.3167 0.1154 0.0732 0.1475sperger’s 0.2262 0.2488 0.2039 0.1499 0.2072
236 P. Wang et al. / Journal of Neuroscience Methods 168 (2008) 224–238
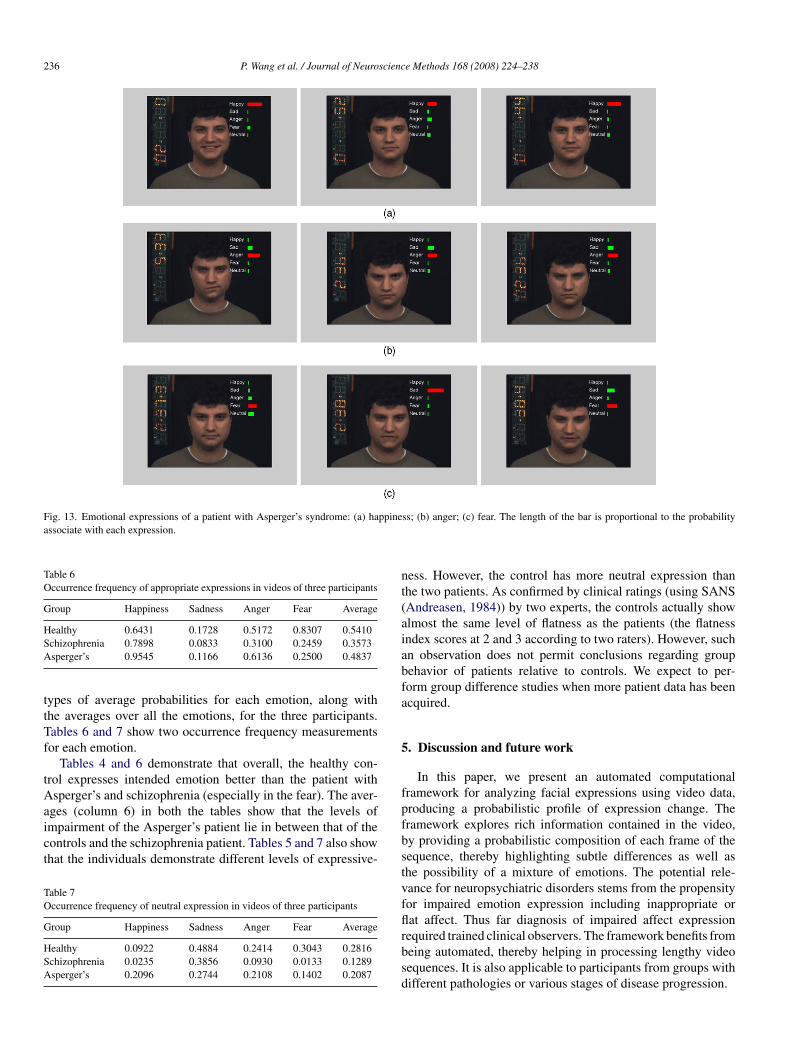
Fig. 13. Emotional expressions of a patient with Asperger’s syndrome: (a) happineassociate with each expression.
Table 6Occurrence frequency of appropriate expressions in videos of three participants
Group Happiness Sadness Anger Fear Average
Healthy 0.6431 0.1728 0.5172 0.8307 0.5410SA
ttTf
tAaict
TO
G
HSA
nt(aiabfa
5
f
chizophrenia 0.7898 0.0833 0.3100 0.2459 0.3573sperger’s 0.9545 0.1166 0.6136 0.2500 0.4837
ypes of average probabilities for each emotion, along withhe averages over all the emotions, for the three participants.ables 6 and 7 show two occurrence frequency measurementsor each emotion.
Tables 4 and 6 demonstrate that overall, the healthy con-rol expresses intended emotion better than the patient withsperger’s and schizophrenia (especially in the fear). The aver-
ges (column 6) in both the tables show that the levels ofmpairment of the Asperger’s patient lie in between that of theontrols and the schizophrenia patient. Tables 5 and 7 also showhat the individuals demonstrate different levels of expressive-
able 7ccurrence frequency of neutral expression in videos of three participants
roup Happiness Sadness Anger Fear Average
ealthy 0.0922 0.4884 0.2414 0.3043 0.2816chizophrenia 0.0235 0.3856 0.0930 0.0133 0.1289sperger’s 0.2096 0.2744 0.2108 0.1402 0.2087
pfbstvfflrbsd
ss; (b) anger; (c) fear. The length of the bar is proportional to the probability
ess. However, the control has more neutral expression thanhe two patients. As confirmed by clinical ratings (using SANSAndreasen, 1984)) by two experts, the controls actually showlmost the same level of flatness as the patients (the flatnessndex scores at 2 and 3 according to two raters). However, suchn observation does not permit conclusions regarding groupehavior of patients relative to controls. We expect to per-orm group difference studies when more patient data has beencquired.
. Discussion and future work
In this paper, we present an automated computationalramework for analyzing facial expressions using video data,roducing a probabilistic profile of expression change. Theramework explores rich information contained in the video,y providing a probabilistic composition of each frame of theequence, thereby highlighting subtle differences as well ashe possibility of a mixture of emotions. The potential rele-ance for neuropsychiatric disorders stems from the propensityor impaired emotion expression including inappropriate orat affect. Thus far diagnosis of impaired affect expression
equired trained clinical observers. The framework benefits fromeing automated, thereby helping in processing lengthy videoequences. It is also applicable to participants from groups withifferent pathologies or various stages of disease progression.
scienc
vtptptteealeittmfpddbwt
rpspas2ttorcssffmtt
micsasghmdkp
A
1M
R
A
A
B
B
B
C
C
C
C
C
C
D
E
E
E
F
F
G
G
G
H
H
P. Wang et al. / Journal of Neuro
The preliminary results demonstrate the capability of ourideo-based expression analysis method in identifying charac-eristics of facial expressions through probabilistic expressionrofiles (Fig. 10). These expression profiles, in conjunction withhe metrics of appropriateness and flatness computed from them,rovide extensive information about the expression and capturehe subtleties of expression change. Patients follow differentrends of facial expression than healthy participants. The facialxpressions of the healthy control are more consistent with thexpected trend of intended emotion, that is the emotion gradu-lly progresses from mild to moderate and finally to the peakevel. Especially for the expressions of anger and fear, the facialxpression trends of the healthy control better characterize thentended emotion than the patients. Another observation is thathe intensity of expression of the healthy control is higher thanhe patients. The differences between the three subjects areainly in the negative emotions of sadness and fear. Especially
or fear, the healthy control is more expressive than the twoatients. Also the measurements averaged over all expressionsemonstrate the difference between individuals, although theifferences in the happy and anger expressions are small. Weelieve that with additional enrollment of subjects, our frame-ork will be able to identify significant group differences using
he presented computational methods.It is also observed that the facial expression recognition
esults of the expression of sadness (as seen in the graph ofrobabilities in Fig. 10) are not as good as other facial expres-ions. Sadness is somehow confused with anger expressionerhaps owing to the following two reasons. First, the sadnd anger expressions share some similar facial movements,uch as eyebrow lower, and lip corner depressor (Kohler et al.,004). Such facial movements may cause confusion betweenwo expressions. Second, the participants (both patients and con-rols) usually show more subtle expressions than actors. Sinceur classifiers are built on actors’ expressions, they may notecognize well the low intensity expression of sadness and con-entrate more on salient facial expressions such as anger. Ourolution to this problem is to retrain the facial expression clas-ifiers using data from healthy controls when additional datarom healthy controls is available. We believe that by trainingacial expression classifiers based on a healthy population, ourethod can better characterize the true trends of intended emo-
ions. We expect that training with healthy controls will also helphe separation between sadness and anger.
The experiments pave the way for establishing a video-basedethod for quantitative analysis of facial expressions in clin-
cal research. The method can be applied to any disorder thatauses affect deficits. The probabilistic profile of facial expres-ions provides a graphical visualization of affect deficits as wells measures to quantify flatness and inappropriateness of expres-ion. In future, we will apply our framework to large populationroup-based studies, to quantify the group differences betweenealthy controls and patients, to correlate with clinical measure-
ents, and to obtain a population profile of temporal changeuring the course of a facial expression. We expect that thenowledge obtained from such an analysis will help in diagnosis,rognosis, and studying treatment effects.
K
K
e Methods 168 (2008) 224–238 237
cknowledgement
We would like to acknowledge support from NIH grantsR01MH73174-01 (for method development) and R01-H060722 (for data acquisition).
eferences
lvino C, Kohler C, Barrett F, Gur RE, Gur RC, Verma R. Computerizedmeasurement of facial expression of emotions in schizophrenia. J NeurosciMethods 2007;163(2):350–61.
ndreasen NC. Scale for the assessment of negative symptoms (SANS). IowaCity: University of Iowa; 1984.
artlett MS, Hager JC, Ekman P, Sejnowski TJ. Measuring facial expressionsby computer image analysis. Psychophysiology 1999;36:253–63.
artlett MS, Littlewort G, Frank MG, Lainscsek C, Fasel I, Movellan J. Recog-nizing facial expression: machine learning and application to spontaneousbehavior. CVPR 2005:568–73.
erenbaum H, Oltmann TF. Emotional experience and expression in schizophre-nia and depression. J Abnormal Psychiatry Res 1992;101(1):37–44.
hang Y, Hu C, Turk M. Probabilistic expression analysis on manifolds. CVPR2004.
hang Y, Vieira M, Turk M, Velho L. Automatic 3D facial expression analysisin videos. In: IEEE International Workshop on Analysis and Modeling ofFaces and Gestures; 2005.
ohen I, Sebe N, Garg A, Chen LS, Huang TS. Facial expression recognitionfrom video sequences: temporal and static modeling. Comput Vis ImageUnderstand 2003a;91(1–2):160–87.
ohen I, Seve N, Cozman GG, Cirelo MC, Huang TS. Learning bayesian net-work classifier for facial expression recognition using both labeled andunlabeled data. CVPR 2003b.
ootes TF, Edwards GJ, Taylor CJ. Active appearance models. IEEE TransPAMI 2001;23(6):681–5.
ortes C, Vapnik V. Support-vector networks. Mach Learn 1995;20(3):273–97.
avatzikos C. Measuring biological shape using geometry-based shape trans-formations. Image Vis Comput 2001;19:63–74.
kman P, Friesen WV. Facial action coding system: a technique for the measure-ment of facial movement. Palo Alto, California: Consulting PsychologistsPress; 1978.
ssa IA, Pentland AP. Facial expression recognition using a dynamic model andmotion energy. ICCV 1995:360–7.
ssa IA, Pentland AP. Coding, analysis, interpretation, and recognition of facialexpressions. IEEE Trans PAMI 1997;19(7):757–63.
asel B, Luettin J. Recognition of asymmetric facial action unit activities andintensities. ICPR 2000:1100–3.
asel B, Luettin J. Automatic facial expression analysis: a survey. Pattern Recog-nit 2003;36(1):259–75.
aebel W, Wolwer WC. Facial expression and emotional face recognitionin schizophrenia and depression. Eur Arch Psychiatry Clin Neurosci1992;242:46–52.
ur R, Sara R, Hagendoorn M, Marom O, Hughett P, Macy L, et al. A methodfor obtaining 3-dimensional facial expressions and its standardization foruse in neurocognitive studies. J Neurosci Methods 2002;115(2):137–43.
ur RE, Kohler CG, Ragland JD, Siegel SJ, Lesko K, Bilker WB, et al. Flataffect in Schizophrenia: relation to emotion processing and neurocognitivemeasures. Schizophrenia Bull 2006;32(2):279–87.
ellewell J, Connell J, Deakin JFW. Affect-judgment and facial recognitionmemory in schizophrenia. Psychopathology 1994;27:255–61.
su C-W, Lin C-J. A comparison of methods for multiclass support vectormachines. IEEE Trans Neural Networks 2002;13(2).
anade T, Cohn JF, Tian Y. Comprehensive database for facial expression anal-ysis. AFRG 2000:46–53.
imura S, Yachida M. Facial expression recognition and its degree estimation.In: IEEE Conference on Computer Vision and Pattern Recognition; 1997. p.295–300.

2 scienc
K
K
K
K
L
L
L
L
L
L
M
M
O
P
P
S
S
T
TV
V
W
W
W
W
Y
Y
Y
38 P. Wang et al. / Journal of Neuro
ohler CG, Turner T, Stolar NM, Bilker WB, Brensinger CM, Gur RE, Gur RC.Differences in facial expressions of four universal emotions. Psychiatry Res2004;128(3):235–44.
ring AM, Sloan DS. The facial expression coding system (FACES): develop-ment, validation, and utility. Psychol Assess 2007;19:210–24.
ring AM, Neale MAJM, Harvey PD. A multichannel, multimethod assess-ment of affective flattening in schizophrenia. Psychiatry Res 1994;54:211–22.
wok JT-Y. The evidence framework applied to support vector machines. IEEETrans Neural Networks 2000;11(5):1162–73.
anitis A, Taylor CJ, Cootes TF. Automatic interpretation and coding of faceimages using flexible models. IEEE Trans PAMI 1997;19(7):743–56.
i SZ, Zhang Z. FloatBoost learning and statistical face detection. IEEE TransPAMI 2004;26(9):1112–23.
ien JJ, Kanade T, Cohn JF, Li C-C. Subtly different facial expression recogni-tion and expression intensity estimation. In: IEEE Conference on ComputerVision and Pattern Recognition; 1998. p. 853–9.
ien JJ, Kanade T, Cohn JF, Li C-C. Detection, tracking, and classification ofaction units in facial expression. Robtics Autonomous Syst 2000;31:131–46.
ittlewort G, Bartlett M, Fasel I, Susskind J, Movellan J. Dynamics offacial expression extracted automatically from video. Image Vis Comput2006;24(6):615–25.
yons MJ, Budynek J, Akamatsu S. Automatic classification of single facialimages. IEEE Trans PAMI 1999;21(12):1357–62.
andal M, Pandey R, Prasad A. Facial expressions of emotions and schizophre-nia: a review. Schizophrenia Bull 1998;24(3):399–412.
orrison RL, Bellack AS, Mueser KT. Deficits in facial-affect recognition andschizophrenia. Schizophrenia Bull 1988;14(1):67–83.
hta H, Saji H, Nakatani H. Recognition of facial expressions using muscle-based feature models. In: IEEE International Conference on PatternRecognition; 1998.
antic M, Rothkrantz LJM. Automatic analysis of facial expressions: the stateof the art. IEEE Trans PAMI 2000;22(12):1424–45.
Z
e Methods 168 (2008) 224–238
latt J. Probabilistic outputs for support vector machines and comparison toregularized likelihood methods. Cambridge, MA: MIT Press; 2000.
chneider FHH, Himer W, Huss D, Mattes R, Adam B. Computer-based analysisof facial action in schizophrenic and depressed patients. Eur Arch PsychiatryClin Neurosci 1990;240(2):67–76.
tegmann MB, Ersbol BK, Larsen R. FAME—a flexible appearance modelingenvironment. IEEE Trans Med Imaging 2003;22(10):1319–31.
ian Y-L, Kanade T, Cohn JF. Recognizing action units for facial expressionanalysis. IEEE Trans PAMI 2001;23(2):97–115.
ian Y-L, Kanade T, Cohn JF. Handbook of face recognition. Springer; 2005.erma R, Davatzikos C, Loughead J, Indersmitten T, Hu R, Kohler C, et al.
Quantification of facial expressions using high dimensional shape transfor-mations. J Neurosci Methods 2005;141:61–73.
iola P, Jones M. Robust real-time object detection. Int J Comput Vis2004;57(2):137–54.
ang P, Ji Q. Learning discriminant features for multi-view face and eye detec-tion. Comput Vis Image Understand 2007;105(2):99–111.
ang Y, Ai H, Wu B, Huang C. Real time facial expression recognition withAdaBoost. ICPR 2004.
en Z, Huang TS. Capturing subtle facial motions in 3D face tracking. In:IEEE International Conference on Computer Vision and Pattern Recogni-tion; 2003. p. 1343–50.
iskott L, Fellous J-M, Kruger N, v.d. Malsburg C. Face recognition by elasticbunch graph matching. IEEE Trans PAMI 1997;19(7):775–9.
acoob Y, Davis LS. Recognizing human facial expressions from long imagesequeces using optical flow. IEEE Trans PAMI 1996;18(6):636–42.
ang M-H, Kriegman DJ, Ahuja N. Detecting faces in images: a survey. IEEETrans PAMI 2002;24(1):34–58.
easin M, Bullot B, Sharma R. From facial expression to level of interest: a
spatio-temporal approach. In: IEEE Conference on Computer Vision andPattern Recognition; 2004.hang Z, Lyons M, Schuster M, Akamatsu S. Comparison between geometry-based and gabor-wavelets-based facial expression recognition using multi-layer perceptron. AFRG 1998:454–9.


![Real Time Face Detection and Facial Expression Recognition ... · computer vision literature for automatic facial expression recognition. See [12, 1] for reviews. Automated systems](https://static.fdocuments.us/doc/165x107/5f0695397e708231d418b577/real-time-face-detection-and-facial-expression-recognition-computer-vision-literature.jpg)

![Automated Facial Expression Recognition Based on FACS ...ivizlab.sfu.ca/arya/Papers/IEEE/Vision and Graphics Papers/Automate… · Hidden Markov Models (HMMs) [16] are used for facial](https://static.fdocuments.us/doc/165x107/5f08310e7e708231d420cb21/automated-facial-expression-recognition-based-on-facs-and-graphics-papersautomate.jpg)