Automated Vehicles
48
T R A F F I C I N J U R Y R E S E A R C H F O U N D AT I O N AUTOMATED VEHICLES: DRIVER KNOWLEDGE, ATTITUDES, & PRACTICES The knowledge source for safe driving
-
Upload
stradablog -
Category
Automotive
-
view
273 -
download
0
Transcript of Automated Vehicles

T R A F F I C I N J U R Y R E S E A R C H F O U N D A T I O N
AUTOMATED VEHICLES: DRIVER KNOWLEDGE, ATTITUDES,& PRACTICES
The knowledge source for safe driving

The Traffic Injury Research Foundation
The mission of the Traffic Injury Research Foundation (TIRF) is to reduce traffic-related deaths and injuries. TIRF is an independent, charitable road safety research institute. Since its inception in 1964, TIRF has become internationally recognized for its accomplishments in identifying the causes of road crashes and developing programs, and policies to address them effectively.
Traffic Injury Research Foundation 171 Nepean Street, Suite 200 Ottawa, Ontario K2P 0B4 Ph: (613) 238-5235 Fax: (613) 238-5292 Email: [email protected] Website: www.tirf.ca
Traffic Injury Research FoundationCopyright © September 2016ISBN: 978-1-926857-76-3
This study was made possible by a charitable contribution from the Toyota Canada Foundation.

Automated Vehicles: Driver Knowledge, Attitudes, & Practices
Robyn D. Robertson, Shawna R. Meister and Ward G.M. Vanlaar


EXECUTIVE SUMMARYHuman drivers have always been an essential requirement in the operation of a motor vehicle. At the same time, research has repeatedly demonstrated that driver error plays a role in more than 90% of road crashes (NHTSA 2008; Blanco et al. 2016). As such, in the past two decades, vehicle manufacturers have designed new and increasingly sophisticated features that provide more assistance to drivers to help mitigate such errors. Such features are an important precursor to the development of automated vehicles and, currently, expectations are high that the advent of semi- or fully- automated vehicles will dramatically reduce road crashes.
Despite their potential benefits, automated vehicles currently possess a number of limitations that technology has not yet been able to overcome. Most notably, semi-automated vehicles are not able to drive in more complex or challenging road conditions or environments, nor are they able to make ethical decisions; instead they must rely on capable drivers to take control. Vehicles are also unable to navigate in poor weather conditions such as rain and snow, are tested at low speeds, and are programmed to obey rules of the road such as traffic signs and speed limits. Most notably, these vehicles are ill-prepared to react to ‘the unexpected’, which may happen on the road every day.
While anticipated crash reductions are perhaps the greatest promise offered by automated vehicles, their realization will ultimately depend on driver knowledge and understanding of the functionality and limitations of semi- and fully-automated vehicles. Today, technology is advancing more quickly than our knowledge of how people will interact with and react to them.
To address this issue, the Traffic Injury Research Foundation (TIRF), with funding from the Toyota Canada Foundation, conducted a national survey in 2016 to examine driver knowledge, attitudes, perceptions, and practices related to emerging automated vehicles. The survey was augmented with four focus groups that involved drivers and non-drivers representing several age groups. The primary focus of the study was on limited, self-driving, semi-automated vehicles (LSDVs) and fully-automated self-driving vehicles (FSDVs), and explored the following issues:
> driver knowledge, attitudes, and perceptions; and,
> driver practices in terms of acceptance and perceived ease of use, trust, and behavioural adaption.
It also investigated ethical and liability issues related to automated vehicles (AVs), and perceptions about manufacturers of these vehicles.
Driver knowledge, attitudes and perceptions
> Almost two-thirds (63%) of respondents strongly agreed that they were familiar with AV technology in general, such as cruise control or lane keeping, but a much smaller proportion (39%) strongly agreed that they were familiar with technology specifically used to develop FSDVs. Males were more likely to report familiarity with FSDVs.
> A majority of respondents (69%) strongly agreed that they enjoyed driving. And drivers that were male, older and that drove longer distances were more likely to report enjoyment.
> Few respondents (22%) reported that they believed it would be relaxing to use SDVs, but almost half (41%) of them noted it would be very stressful. Males were more likely to believe it would be relaxing whereas older persons and females were more likely to find it stressful.
AUTOMATED VEHICLES | DRIVER KNOWLEDGE, ATTITUDES, & PRACTICESi
EXECUTIVE SUMMARY

> Two-thirds of respondents (67%) reported they preferred to use vehicles with standalone safety features which are available today, or vehicles that combine select safety features to work in tandem such as lane monitoring and forward collision warning systems. Conversely, just one-fifth (20%) of respondents reported they would prefer to use a limited self-driving vehicle; just 14% preferred fully self-driving vehicles. Respondents that preferred FSDVs were more likely to be male and were younger.
> Less than one-quarter (23%) of respondents strongly agreed that they would use an LSDV today, and less than one-fifth (17%) strongly agreed that they would use FSDVs. Drivers who drove longer distances were more likely to report they would use an SDV today, and focus group results revealed that trust and confidence in their safety would be essential.
> When unavoidable collisions occur, almost two-thirds (63%) of Canadians strongly agreed that SDVs should be programmed to prioritize the safety of vehicle occupants over other road users. More than half of respondents strongly agreed that the safety of groups of people should be prioritized over individuals, or that pedestrians and cyclists should be prioritized. These latter respondents were more likely to be older.
Driver practices: Acceptance, trust, and behaviour related to SDVs
> Between 30% and 40% of Canadian drivers believed that they currently possess sufficient knowledge of vehicles and driving to operate a LSDV or a FSDV, and that new knowledge or skills for drivers would be unnecessary. This means that some drivers expect to take possession of SDVs without any additional instruction about their new features, including self-driving. Males were more likely to believe that their current level of knowledge was sufficient to use SDVs, and that they would be easy to use.
> One-third of drivers who used public transportation and 15% of persons who cycled or walked reported they would switch to SDVs to commute. These findings have important implications for public transportation and public health.
> Perceived benefits of SDVs included using them for errands, deliveries, shopping, and picking up/dropping off children for various activities. Other benefits were that SDVs would provide greater independence and mobility to persons who were unable to drive. However, perceived drawbacks related to the negative impact of SDVs on family interactions, employment for professional drivers, as well as the environment.
> More respondents strongly agreed that they would trust LSDVs made by a partnership between traditional automakers and technology companies (41%). Smaller proportions (35%) would trust LSDVs built by traditional automakers alone versus technology firms (25%).
> Less than one-third of Canadian drivers strongly agreed that they would feel safe using LSDVs (28%) and less than one-quarter reported they would feel safe using FSDVs (21%).
> Driver confidence in technology to perform safely in high-risk situations was quite low. A majority of Canadians did not agree that LSDVs will perform better than drivers. Just 16% of drivers strongly agreed that SDVs would make them better drivers and only 24% strongly agreed that LSDVs would respond better to pedestrians and cyclists, hazards (26%), and poor driving conditions (29%). Of concern, focus group results suggested that Canadians would most want to rely on automated technology in these high-risk conditions.
AUTOMATED VEHICLES | DRIVER KNOWLEDGE, ATTITUDES, & PRACTICESEXCUTIIVE SUMMARYii

> Of concern, 16% of Canadians strongly agreed that it would be unnecessary to pay attention to the road environment when using the self-driving feature of an LSDV. Drivers that were most likely to be inattentive were younger and drove longer distances. Concerning proportions of drivers reported they would be willing to drive tired or fatigued (24%); engage in a non-driving activity (17%), sleep or nap (10%) or drink and drive (9%).
> One-fifth of drivers (21%) reported they would disengage the self-driving feature to drive faster in poor road and weather conditions; 14% would disengage self-driving features to run a red-light under similar conditions.
Conclusions
Three critical priorities emerged from this study that demand concerted attention in the next five years. First, there is a clear need to educate Canadians about AV technology to overcome common misperceptions about its capabilities and increase understanding of its limitations. Driver assistance systems have dramatically improved to help drivers respond to unpredictable road environments and compensate for human errors. But automated vehicle technology is not ready for deployment beyond enhanced safety and enhanced driver control. In particular, drivers must recognize that continued and sustained attention to the driving task is essential to avoid increases in crash risk. In other words, a driver is still necessary. It is incumbent on manufacturers to be cautious in marketing automated features and demonstrate due diligence to protect the safety of consumers who purchase their products. Government also plays an important role to ensure responsibility in advertising and to raise public awareness about ways that new vehicles are tested and made available to consumers. Transparency regarding how safety standards are set and met is indispensable so drivers can make informed purchasing decisions.
Second, younger male drivers demonstrated greater acceptance of and trust in SDVs as compared to other age categories, and were more willing to rely on these vehicles to drive. This means that there is evidence that early adopters of SDVs may be more representative of drivers who are less safety-conscious and more crash-involved. This issue warrants attention as their initial experiences with SDVs will have profound implications for widespread uptake and use, and targeted education to ensure that early adopters are well-
Comparison of what drivers report currently doing and what they think they will do using LSDVs
Currently do thisWould do this
using LSDVDifference
Continue to watch road 77%
Drive tired or fatigued 5% 24% 19%*
Do a non-driving activity / distracted
4% 17% 13%*
Sleep or nap 10%
Set vehicle to drive over speed limit
8% 9% 1%
Drink and drive 3% 9% 6%**Difference is significant p<0.001
AUTOMATED VEHICLES | DRIVER KNOWLEDGE, ATTITUDES, & PRACTICESiii
EXCUTIIVE SUMMARY

informed about the limitations of technology is paramount. Conversely, older populations of drivers and women were much more reticent and less likely to rely on SDVs until the level of safety offered by these vehicles is more concretely demonstrated in real world conditions.
Finally, there is clear evidence that the ability of drivers to ‘turn off’ technology designed to improve safety will influence the size of crash reductions that are ultimately achieved. At least a proportion of drivers will want to turn off automated features, and thereby potentially turn off safety. As such, policy decisions by government to regulate the use of features, or permit drivers to choose when and in what conditions these features are used will play a critical role in shaping experiences with automated vehicles, and acceptance of SDVs on public roadways.
In closing, the significant influence of driver behaviour on road safety should not be under-estimated or overlooked. Strategies to introduce and expand the presence of limited- and fully-automated vehicles on Canadian roadways must strike a careful balance between incentives and controls to maximize safety.
AUTOMATED VEHICLES | DRIVER KNOWLEDGE, ATTITUDES, & PRACTICESEXCUTIIVE SUMMARYiv

TABLE OF CONTENTSEXCUTIVE SUMMARY i
INTRODUCTION 1
BACKGROUND 5
METHODOLOGY 9
RESULTS 11
Driver knowledge, attitudes, and perceptions 11Driver practices: Acceptance, trust, and behaviour related to SDVs 17
CONCLUSIONS & RECOMMENDATIONS 29
APPENDIX A: METHODOLOGY 33
Limitations 34
REFERENCES 35
AUTOMATED VEHICLES | DRIVER KNOWLEDGE, ATTITUDES, & PRACTICESv
TABLE OF CONTENTS


INTRODUCTIONHuman drivers have always been an essential requirement in the operation of a motor vehicle. At the same time, research has repeatedly demonstrated that driver error plays a role in more than 90% of road crashes (NHTSA 2008; Blanco et al. 2016). As a consequence, in the past two decades, vehicle manufacturers have aimed to design new and increasingly sophisticated features that improve road safety by providing more support and assistance to drivers to help mitigate such errors.
Research demonstrating the effectiveness of these features in terms of crash reductions has often resulted in governments making features mandatory on all new vehicles. For example, driver assistance systems such as electronic stability control have been shown to substantially improve road safety by responding more quickly and more effectively to avoid a collision than drivers (Breuer 2007; Farmer 2010; Rudin-Brown et al. 2008; NHTSA 2010; IIHS 2010).
More recently, rapid advances in vehicle and information technologies have coalesced to facilitate the emergence of combined-function safety features, such as lane-keeping and forward collision warning systems. Such features are an important precursor to the development of automated vehicles and, currently, expectations are high that the advent of limited or fully self-driving automated vehicles will dramatically reduce road crashes, as well as produce a range of other benefits. To illustrate, some experts have suggested that these vehicles may lessen the environmental impact of traditional vehicles through improved coordination with other traffic or through shared use; other experts have noted that these vehicles may provide greater independence for non-driving populations (Kelkel 2015; Kovacs 2016).
Despite their potential benefits, automated vehicles currently possess a number of limitations that technology has not yet been able to overcome. Most notably, semi-automated vehicles are not able to drive in more complex or challenging road conditions or environments, and continue to rely on a capable driver to take control when it is not able to function. For instance, these types of vehicles are unable to navigate in poor weather conditions where rain or snow may interfere with the proper functioning of vehicle sensors or obscure road markings (Kovacs 2016). As a consequence, most automated vehicles are tested in locations that have low rainfall, and warm weather conditions such as Arizona, California, Florida and Nevada (Boudette 2016). Only more recently have test facilities been established in Michigan and Washington, and a key objective has been to improve the ability of vehicles to function in rain and wet weather. Conversely, Ontario, which is known for colder weather and more precipitation in the form of rain and snow, has permitted vehicle testing but manufacturers have, to date, not shown interest in testing here (Artoso 2016).
AUTOMATED VEHICLES | DRIVER KNOWLEDGE, ATTITUDES, & PRACTICES1
INTRODUCTION

Other limitations include that, at present, automated vehicles are generally tested at low speeds, such as 40 km/h (25 mph) for Google’s automated vehicle (Levy 2016; Womack 2015; Miller 2014), and are programmed to adhere to existing speed limits indicated on roadways. In fact, typically these vehicles are programmed to follow all of the rules of the road which include making full stops at amber and red lights, yielding right of way, as well as maintaining safe following distance between vehicles. For this reason, manufacturers have been more willing to acknowledge responsibility for these vehicles in the event of a collision.
In addition, these vehicles are ill-prepared to react to ‘the unexpected’, which may happen on the road every day, and this places users at risk (Boudette 2016; Autocar 2016). According to the Centre for Accident Research and Road Safety in Queensland, Australia, an internationally recognized leader in studies of human interactions with self-driving vehicles:
“…crashes are proceeded by unexpected events, and cars are not smart enough to respond to the unexpected or the unknown….Computers have not managed to beat humans when reacting to the unexpected event yet, so this means that cars still need driver supervision for the coming years...” (CARRS-Q 2016)
Recent announcements that Uber passengers in Pittsburgh, Pennsylvania will be able to hail an unspecified number of autonomous vehicles with human back-up drivers and opt-in to a self-driving car (offered at
no cost) raise important questions regarding public awareness of the limitations of these vehicles (The Associated Press 2016). More specifically, it is unclear if they are aware of the potential risks associated with a decision to ride in an automated vehicle, regardless of the presence of an unknown human driver to take control if needed.
The limitation that poses the greatest barrier at this time is the inability of vehicles to navigate complex road situations that require ethical judgments (TRB 2015). For example, drivers must be assertive in order to enter moving traffic from a full stop, or to merge onto busier roadways. Drivers also rely on signals or
gestures from other drivers to proceed when they are uncertain about the right of way (e.g., to make a left turn in front of oncoming traffic, or at a roundabout) (Gough 2016). The management of other aggressive drivers on the road who fail to signal lane changes, or who ‘cut off’ other drivers is also a frequent situation that requires judgment on the part of drivers. It is these types of situations that self-driving vehicles are currently unable to resolve, and that often result in test drivers taking control of the vehicle.
While anticipated crash reductions are perhaps the greatest promise offered by automated vehicles, the realization of crash reductions will ultimately depend on driver knowledge and understanding of the functionality and limitations of semi- and fully-automated vehicles. Technology is advancing much more quickly than knowledge of how humans will interact with, and react to, vehicles (CARRS-Q 2016; Gough 2016).
Of concern, a 2012 study of driver behaviour and vehicle safety features by the Traffic Injury Research Foundation (TIRF) revealed that less than one-third of Canadian drivers reported they were familiar with many, newer safety features (Robertson et al. 2012). In addition, less than half of respondents agreed that safety features were more effective than drivers in avoiding a collision. Even more worrisome were
AUTOMATED VEHICLES | DRIVER KNOWLEDGE, ATTITUDES, & PRACTICESINTRODUCTION2

results showing that at least a proportion of drivers reported that they would be more likely to engage in risky behaviours such as speeding, drinking and driving, and tailgating due to the presence of these safety features.
Evidence has also emerged in the past few years that demonstrates the propensity of some drivers to en-gage in other behaviours while driving, and misuse technology which has amplifi ed road safety concerns (Cinder1280 2014; Crazyerics 2013; Rudin-Brown et al. 2008). As such, understanding driver knowledge regarding the functionality and limitations of self-driving vehicles, and their expectations related to use of these technologies is paramount to ensure their safe implementation and proper application as they be-come available. This is essential in order to accrue the potential safety benefi ts of automated vehicles and achieve the promised crash reductions.
In response to this issue, TIRF, with funding from the Toyota Canada Foundation, conducted a national survey in 2016 to examine driver knowledge, attitudes, perceptions, and practices related to emerging automated vehicles. The survey was augmented with four focus groups that involved drivers and non-driv-ers representing several age groups. The primary focus of the study was on limited, self-driving, semi-au-tomated vehicles (LSDVs) and fully-automated self-driving vehicles (FSDVs). This study builds upon existing research regarding driver interactions with semi-automated vehicles and fully self-driving vehicles. It shares new data about the experiences of Canadians in relation to vehicles that are currently available with ad-vanced safety features or driver assistance systems, and also automated vehicles. In particular, the study explored the following issues:
> driver knowledge, attitudes, and perceptions; and,
> driver practices:
» the acceptance of vehicle technology in relation to perceived ease of use and perceived usefulness;
» trust in automation; and,
» behavioural adaption by drivers in response to these vehicles.
It also investigated liability and ethical issues related to automated vehicles (AVs), perceptions about manu-facturers of these vehicles, and some analyses about non-drivers who may be potential new users of FSDVs.
This report contains a brief overview of the development of automated vehicle technology and priority issues related to these vehicles. It then explores and summarizes the results of the study according to the two main issues described above. The report concludes with a discussion of the key findings and future considerations.
AUTOMATED VEHICLES | DRIVER KNOWLEDGE, ATTITUDES, & PRACTICES3
INTRODUCTION


BACKGROUNDThe term automated vehicles is frequently used by a broad range of organizations representing government, industry and non-profi ts, as well as across sectors such as engineering, transportation and technology. Similarly, there are varying stages of vehicle automation and the roles and requirements of drivers in each of these stages are different. For this reason, it is important to establish a common defi nition and understanding of this issue so that the results of studies can be clearly interpreted and discussed by different audiences.
In the field of road safety, the stages of vehicle automation have been defined by the National Highway Traffic Safety Administration (NHTSA). In particular, NHTSA (2013) defines automated vehicles as “…those in which at least some aspects of a safety-critical control function (e.g., steering, throttle, or braking) occur without direct driver input.” NHTSA further defines five different levels of automation that classify the extent to which vehicles are equipped with automated functions and able to support driver functions.
> Level 0 includes vehicles that have no automated functions. Drivers have complete control of all primary driving functions, although, the vehicle may operate certain driver-supported mechanisms or perform automated secondary functions.
> Level 1 includes vehicles that have some limited automation. Drivers can choose to have the vehicle control one or more specific driving functions such as cruise control, which allows the vehicle to control and monitor speed.
> Level 2 includes vehicles in which some functions are combined and automated. Drivers can choose to have the vehicle control one or more primary driving functions that can work together to perform some driving tasks. For example, drivers can turn on adaptive cruise control so that the vehicle monitors and maintains speed and safe distances behind other vehicles, and activate lane positioning that permits the vehicle to use sensors to maintain its position within a lane.
> Level 3 includes vehicles that have limited self-driving ability. Drivers can select to have the vehicle control all critical driving functions, including monitoring the road, steering, and accelerating/braking, but only in certain traffic and environmental conditions. These vehicles will monitor roadways and prompt drivers when they need to resume control of the vehicle.
AUTOMATED VEHICLES | DRIVER KNOWLEDGE, ATTITUDES, & PRACTICES5
BACKGROUND

> Level 4 includes vehicles that are capable of driving in all traffic situations and roadway conditions. The vehicle controls all critical monitoring and driving functions at all times, and drivers do not take control of the vehicle at any time.
*Source: NHTSA (2013). Preliminary statement of policy concerning automated vehicles. U.S. Department of Transportation.
Other organizations, such as the Society of Automotive Engineers (SAE) International, have also defined similar levels of automation (SAE International 2014). Consistent among these definitions is the differentiation between vehicles with limited self-driving capability and vehicles that are fully automated and able to drive at all times. Similar to the NHTSA approach, a semi-automated vehicle will be able to drive in most conditions; however, it is necessary that drivers are able to take control of the vehicle in certain situations in which the self-driving system will be unable to manage. Hence, these limited self-driving vehicles still include a steering mechanism and pedal controls for drivers. Conversely, fully automated vehicles are distinct in that drivers do not operate the vehicle at any time and will only input navigation and destination information. As a result, manufacturers that are developing fully automated vehicles, such as Google, are removing traditional driver controls such as the steering wheel, and gas/brake pedal mechanisms (Carlson 2014), although traditional vehicle manufacturers have been more cautious in introducing such features without federal regulation (Kang 2016).
Technological advances in several areas have been combined with complex algorithms to facilitate the development of self-driving vehicles or SDVs (Boudette 2016; Anderson et al. 2016; Kovacs 2016). Generally speaking, vehicles are equipped with on-board computer systems that use sensors to detect and interpret the environment surrounding the vehicle (e.g., to recognize cyclists and other objects), as well as sensitive global positioning systems (GPS) that collect data to determine precisely where the vehicle is located (e.g., the location of the vehicle on a street and in a lane of traffic) (Boudette 2016). This information is analyzed to plan an optimal route to a destination, and algorithms predict vehicle responses to changes in the driving environment during the trip.
At present, existing self-driving vehicle technology is only able to function in areas with warm, dry climates, and road environments that have been mapped in considerable detail using very precise and accurate GPS technology (i.e., differential GPS) that is more sophisticated than traditional GPS technology. However, it is anticipated that, as technology advances, SDVs will be able to function in much more complex, unpredictable and challenging environments. Looking forward, as a growing proportion of vehicles and road infrastructure are equipped with technology systems, SDVs will be able to take advantage of connected-vehicle and connected-infrastructure technology whereby vehicles communicate and coordinate with each other and infrastructure in order to improve traffic flow and reduce collisions.
The potential for road crashes to still occur, despite improvements in self-driving vehicle technology, raises important questions about the ways that vehicles will respond to unavoidable crash events, and who will be protected in these instances. While AV technology is expected to scan the road environment, anticipate hazards, and take corrective action more swiftly and effectively than human drivers, there is considerable debate regarding whether and how vehicle algorithms may respond to ethical and moral dilemmas associated with protecting some road users (e.g., pedestrians) in relation to other types of users (e.g., vehicle occupants) (Gough 2016).
AUTOMATED VEHICLES | DRIVER KNOWLEDGE, ATTITUDES,& PRACTICESBACKGROUND6

This issue has garnered greater attention in light of new research that suggests a larger proportion of collisions may be due to other factors such as poor weather and vehicle malfunctions (22%), in contrast to previous research that has suggested an estimated 93% of collisions are attributable to driver error (CAS AVTF 2014).
Another priority issue that is a focus of discussion relates to liability for collisions and how liability will be assigned to vehicles that are in self-driving mode. For instance, currently driver error is most often the cause of collisions and thus drivers are typically held legally responsible (KPMG Insurance 2015) for the costs of these collisions through auto insurance regimes. However, vehicles in self-driving mode will perform in accordance to algorithms developed by vehicle manufacturers. As such, the question has been raised as to whether manufacturers will accept responsibility for their vehicles in these instances. Various stakeholders, policy makers, and government legislators are just beginning to look into this issue and ways it can be addressed. Moreover, some technology companies and vehicle manufacturers have already provided some indication that they would take responsibility for collisions caused by their SDVs (Elmer 2015). In other
instances, some researchers have recommended no-fault insurance (Ni & Leung n.a.), and some institutions expect that there will be a shift towards shared responsibility between producers and users of self-driving technology (Kovacs 2016; Anderson et al. 2016).
Perhaps the most substantial issue that has emerged as a result of increasingly automated vehicles is that of public acceptance and the potential for misuse. Researchers are just beginning to explore driver knowledge, acceptance, and their behaviours in response to the development of SDVs. Initial studies have suggested that driver
knowledge and familiarity with AV technology generally, and self-driving technology specifically, is quite low despite the emergence of many AV technologies since the 1990s (Robertson et al. 2012; Schoettle & Sivak 2014). Of concern, research shows that on one hand, drivers are somewhat familiar with self-driving technology and it is anticipated by drivers that such vehicles will have many benefits such as reduced stress due to driving, lower insurance rates, and potential opportunities to multi-task while driving. However, at the same time, these studies have shown that drivers generally have low trust in the automation of driving functions, and are concerned about giving up control (Schoettle & Sivak 2014; Nasr & Johnson 2016; Reimer et al. 2016; Ni & Leung n.a.). In this regard, there is a perception among at least some drivers that a human driver is safer, and better able to avoid collisions than automated features. Of greater concern, anecdotal evidence, and pilot tests conducted by Google among others have suggested that some drivers will modify their behaviour in unacceptable or more dangerous ways, and increase their risk of collision when using AV technology by speeding, not paying attention to the driving task, or in other ways circumventing the safety benefits of technology (Robertson et al. 2012; Cinderi1280 2014; TRB 2015).
Much work remains with regard to the identification of safety strategies related to automated vehicles. Key priorities for governments include strategies to permit the testing of the vehicles on public roadways, and also to integrate these new vehicles into existing transportation networks. More importantly, agreement on adequate standards related to the safety effectiveness of these vehicles before they are made available to consumers for purchase is much needed, particularly in light of recent evidence that suggests that drivers may not interact with these vehicles in ways that promote safety benefits, and there is considerable potential for the misuse of automated vehicles in the absence of substantial educational campaigns that underscore the limitations of these technologies.
AUTOMATED VEHICLES | DRIVER KNOWLEDGE, ATTITUDES, & PRACTICES7
BACKGROUND

More positively, some of this work is already underway. In February 2016, NHTSA issued a statement that acknowledged that the vehicle may in fact be conceived as the driver of an automated vehicle (Google 2016; Shepardson & Lienert 2016), and several jurisdictions have moved to permit testing, including Ontario (MTO 2015). Even more recently, the U.S. Department of Transportation (DOT) issued important policy guidelines to provide more oversight of automated vehicles and the ways that manufacturers design and develop them. While these policies were not presented as regulations, the U.S. DOT announced a 15-point safety standard that tackled priority issues including ways that vehicles respond when technology fails, passenger privacy and digital security, communication between vehicles and drivers and other road users, and vehicle actions in a crash scenario. Of equal importance, it was recommended that automated vehicle manufacturers clearly communicate regarding the effectiveness and safety-testing of technology, as well as how vehicle data would be collected and shared. The U.S. DOT further underscored that it would assert its authority to recall unsafe vehicles, and distinguished between Federal and State responsibilities in managing the emergence of automated vehicles. Overall, these U.S. policies provide much-needed guidance to manufacturers of automated vehicles and underscore the need for transparency to protect the safety of consumers. To this and, regulations and standards will be critical to positively influence the development and safe application of automated vehicle technology (Anderson et al. 2016). This work is also garnering attention among local governments, as illustrated by a recent policy statement on automated vehicles issued by the National Association of City Transportation Officials (NACTO) available at: http://nacto.org/2016/06/23/nacto-releases-policy-recommendations-for-automated-vehicles/.
In summary, automated vehicles demonstrate substantial potential to improve safety and reduce collisions while enhancing the driving experience. Most importantly, automated features are designed to overcome human errors which could produce dramatic declines in the prevalence of road crashes. However, there are many limitations and practical issues that must still be addressed across various areas including policy decisions, programming issues, regulations, and infrastructure among others (Anderson et al. 2016).
To date, the primary focus on automated vehicles has been in terms of the technology and its development. However, the other critical component to address, especially in relation to LSDVs, is the need to prepare drivers of these vehicles who must clearly understand the proper use and limitations of this technology to avoid unsafe use. Much more substantial efforts are required to prevent potential increases in collisions by drivers who misperceive the capabilities of current technology, and unintentionally increase their crash risk by failing to maintain awareness on the road.
AUTOMATED VEHICLES | DRIVER KNOWLEDGE, ATTITUDES,& PRACTICESBACKGROUND8

METHODOLOGYAn online survey was developed by TIRF to explore the knowledge, attitudes, and practices of Canadians in relation to LSDVs and FSDVs. Other priority areas that were explored by this survey included acceptance of vehicle technology with regard to perceived ease of use and perceived usefulness, trust in automation, and behavioural adaptation by drivers in response to these vehicles. The questions that were included in this survey were informed by available research that had previously examined this topic. In addition, the survey was also designed to explore ethical and liability issues related to AVs, and perceptions about manufacturers of these vehicles. It consisted of 87 items and required approximately 30 minutes to complete.
Sample. A total of 2,662 Canadians completed the survey in April 2016 which was fielded by Nielson Opinion Quest. The sample was representative of Canada and used a disproportional stratified (by region) random sample. Jurisdictions were grouped in the following five regions: British Columbia, Prairies, Ontario, Quebec, and the Maritimes. Of note, Ontario was over-sampled to gain a stronger picture of respondents from this region in light of a recent initiative in Ontario to permit the testing of automated vehicles.
All respondents possessed a valid driver’s licence and had driven within the past 30 days. The age of respondents ranged from 16 to 93 years of age, with an average age of 53. Slightly less than half (47%) of respondents were male and slightly more than half (53%) were female. Responses were weighted by sex, age, and population to account for variations across Canada.
In addition, a total of 25 people participated in four focus groups that were conducted in Ottawa, Ontario in March and April 2016. Focus groups were included to gather important contextual information to assist with the interpretation of the survey results and to gain insight into some of the different perspectives regarding automated vehicles. Two groups consisted of drivers, a third group comprised older, non-driving adults (65 years and older), and a fourth group included persons affected by physical disabilities. Efforts were made to ensure that the focus groups were representative in terms of age, sex, education, and income. The only focus group in which these characteristics were not consistently present was the focus group involving older, non-driving adults.
For more information about the methodology as well as the limitations of this study, please see Appendix A.
groups were included to gather important contextual information to assist with the interpretation of the
AUTOMATED VEHICLES | DRIVER KNOWLEDGE, ATTITUDES, & PRACTICES9
METHODOLOGY


RESULTSThe results of the analyses of the survey data are presented in accordance to key areas of inquiry that were investigated. In order to provide context to help interpret the results, findings related to driver knowledge, attitudes, and practices in relation to SDVs are presented first. These results are described in terms of limited self-driving vehicles and fully self-driving vehicles. Subsequent sections are organized in relation to driver acceptance of automation as demonstrated by perceptions about the ease of use of automated vehicle technology, as well as perceptions about the usefulness of these technologies. In addition, results regarding the level of trust associated with automated vehicle technology are also summarized. Finally, data that illustrate the ways in which drivers may adapt their driving behaviour in response to automated vehicles is also shared. In each section, survey results are described first to provide an overall perspective of each issue, and then additional contextual detail from the focus groups is shared as appropriate to help clarify the results.
Driver knowledge, attitudes, and perceptionsCanadian drivers were asked a series of questions corresponding to their knowledge, attitudes, and perceptions of AVs and SDVs. Questions regarding knowledge (familiarity) and some questions about perceptions were asked prior to giving respondents definitions of the different levels of AVs in order to establish a baseline upon which to measure results.
Driver knowledge. Almost two-thirds (63%) of respondents strongly agreed that they were familiar with AV technology in general, such as cruise control or lane keeping. However, a much smaller proportion of respondents (39%) strongly agreed that they were familiar with technology specifically used to develop FSDVs. The odds that respondents were familiar with FSDVs was 2.2 times greater if they were male (p<.01). Focus group participants consistently showed similar variability in relation to knowledge and familiarity with SDVs. To illustrate, participants that stated they were familiar with SDVs typically cited parallel parking features or referred to the Google car.
Survey respondents were also asked, prior to definitions of LSDVs and FSDVs being provided, whether they believed that it would be possible in the future to use SDVs to drive when they had too much to drink, or were too tired, and it would be unsafe for them to do so. Nearly half of all respondents (46%) responded ‘yes’ this would be possible; conversely slightly less than one-third (29%) of respondents reported ‘no’, and one-quarter (25%) indicated that they ‘did not know’.
AUTOMATED VEHICLES | DRIVER KNOWLEDGE, ATTITUDES, & PRACTICES11
RESULTS

The odds that Canadians reported that drivers would be able to use SDVs when they were not able to drive were 1.5 times greater if the respondents were male (p<.05), and decreased by 20% for every ten-year increase in age. In other words, drivers that were younger males more often believed it was not necessary for drivers to perform any role when using an SDV.
These data suggested that a large portion of Canadians, particularly younger males, currently anticipate that drivers will not be required to perform driving functions when vehicles are in self-driving mode. Of concern, these driver expectations suggested that they anticipate being able to use SDVs when they are not physically capable of driving because they do not believe they would have to support the driving task if needed.
Responses to this question also varied among driver focus group participants and many of them indicated that they would read, text, or sleep while the car was driving; however, some reported that they would be inclined to remain vigilant and watch the road until they were certain the vehicle operated safely, and then they would likely engage in other non-driving activities. In addition, several participants indicated that they would use an SDV to run errands, such as pick up groceries, or to transport their children to activities.
Respondents were also asked about the timeframe in which they anticipated these SDVs would be available, and the majority (69%) of them believed that this technology would be available within the next ten years (see Figure 1).
Driver attitudes. The attitudes of respondents towards the experience of driving a vehicle were also explored as part of the survey. A majority of respondents (69%) strongly agreed that they enjoyed being a driver and driving vehicles. The odds that respondents enjoyed driving increased by 21% for every ten-year increase in age, and increased by 57% if respondents were male, and by 11% for every 500 km driven (p<.05). In summary, drivers that were male, older and that drove longer distances were more likely to report an enjoyment of driving.
In contrast, only a few participants in the driver focus groups reported that they enjoyed driving or preferred to be in control of the vehicle, and were not likely to use the self-driving feature. Others stated they only enjoyed driving some of the time and did not like driving in higher-risk situations such as rush hour, bad weather, or poor road conditions.
Figure 1: When drivers think SDV technology will be available
AUTOMATED VEHICLES | DRIVER KNOWLEDGE, ATTITUDES, & PRACTICESRESULTS12

Although a majority of survey respondents indicated that they enjoyed driving, only a small proportion (22%) of them reported that they believed it would be relaxing to ride in SDVs, whereas almost half (41%)
of them noted it would be very stressful. The odds of finding SDVs relaxing were 2.7 times greater if the respondents were male (p<.05).
Characteristics of persons who believed that using SDVs would be stressful contrasted to those who thought it would be relaxing. For instance, the odds were 2.1 times greater for females to find SDVs very stressful (p<.001). The odds of these respondents were also 1.4 times greater if they lived in an urban area and the odds of thinking SDVs would be stressful increased by 17% (p<.05) for every ten-year increase in age.
In other words, males more often than females believed that the drive would be relaxing. In contrast, persons who believed that using SDVs would be stressful possessed different characteristics. Females were more likely to report that using
SDVs would be very stressful. Persons who lived in urban areas and who were older were also more likely to find using SDVs stressful. These results suggested that more work is needed to understand what specific features associated with the use of automated vehicles may be a source of stress, or alternatively relaxation for drivers.
Survey respondents were asked to indicate in order of preference what type of automated vehicle they would prefer to drive on a scale that ranged from most preferred to least preferred (see Figure 2). Slightly more than one-third (37%) of Canadians reported a preference to use vehicles with limited automated functions such as standalone safety features that are currently available on the market today. In addition, slightly less than one-third (30%) indicated a preference for combined automation, which are also currently available and involve the combination of newer safety features to work in tandem such as lane monitoring and forward collision warning systems. In contrast, just one-fifth (20%) of respondents reported they would prefer to use a limited self-driving vehicle, and only 14% noted a preference for fully self-driving vehicles. This means that drivers currently preferred the use of vehicles with individual safety features and combined-function safety features over SDVs. The odds that respondents reported that they preferred combined-function vehicles were 1.4 times greater among females and the odds of those who preferred FSDVs were 1.6 times greater among males (p<.05).
Figure 2: Driver preference for vehicles with different levels of automation
SDVs would be very stressful. Persons who lived in urban areas and who were older were also more likely to find
AUTOMATED VEHICLES | DRIVER KNOWLEDGE, ATTITUDES, & PRACTICES13
RESULTS

The intended use of automated vehicles was further explored by asking respondents whether they would use limited and fully self-driving vehicles if they were available today. Most notably, less than one-quarter (23%) of respondents strongly agreed that they would use an LSDV today, and less than one-fifth (17%) strongly agreed that they would use FSDVs (Figure 3).
An examination of driver willingness to use FSDVs revealed that the odds that drivers reported that they would use FSDVs decreased by 20% for every ten-year increase in age (p<.05). The odds that respondents reported that they would use FSDVs were 1.9 times greater if they were male.
Responses from driver focus group participants also revealed differences between those who would use LSDVs versus FSDVs. The majority of those who preferred to use LSDVs stated that they still wanted the option to retain control over the vehicle. Additionally, very few individuals stated that they enjoyed driving and would not give it up. Of note, most participants indicated that they would only drive a vehicle with an override option. Persons who reported preferences for FSDVs typically did not enjoy, or were indifferent to, driving, however it was underscored that trust and confidence in the safety of FSDVs would be essential before using them.
Overall, these findings suggested that, at present, a minority of drivers would be willing to use either limited or fully self-driving vehicles if they were made available for purchase today. As discussed previously, a substantial proportion of Canadians reported that they enjoy the experience of driving, although this enjoyment is often diminished in more complex road environments associated with traffic congestion, inclement weather and poor road conditions. Drivers that reported greater willingness or preferences to use LSDVs or FSDVs were generally younger and drove longer distances. In addition, the importance of the proven safety of LSDVs and FSDVs was an equally common caveat among respondents regardless of whether they had greater preferences for using these vehicles or not.
Driver perceptions. Another issue that was explored by the survey related to attitudes and opinions regarding ethical issues associated with crash events, and the assignment of legal responsibility and liability as a result of a crash. Half of all respondents agreed that a wide range of SDV stakeholders (e.g.,
Figure 3: Percent of drivers who would use LSDVs and FSDVs if available today
AUTOMATED VEHICLES | DRIVER KNOWLEDGE, ATTITUDES, & PRACTICESRESULTS14

manufacturers, the public, insurance industry) should be involved in developing rules and standards to govern the decision-making algorithms for SDVs that shape the way vehicles respond in an unavoidable collision (Figure 4). Among the participants in the driver focus groups, many thought that SDVs should be regulated in these instances but some did not agree that manufacturers should be responsible for developing such algorithms. Conversely, some focus group participants equally expressed distrust for regulators and instead believed that industry should be tasked with developing standards for vehicle responses in a collision.
With regard to the assignment of responsibility and liability in unavoidable collisions, survey respondents were asked to indicate their level of agreement in relation to different parties being held responsible when SDVs were involved in a collision, and the self-driving technology was in control. More than half (59%) of drivers strongly agreed that the software developers of the technology should be held responsible in these instances, and a similar proportion (57%) strongly agreed responsibility belonged to vehicle manufacturers; slightly less than half (46%) believed that the ‘driver’ or user of the vehicle should be held responsible; this percentage was significantly lower than that of software developers and vehicle manufactures (p<.01); However, the difference between software developers and manufacturers was not significant.
The odds that respondents reported that users should be held responsible were 2.1 times greater among females (p<.01), and the odds increased by 16% for every ten-year increase in age. Among participants in the driver focus groups, the general consensus was that vehicles should be deemed responsible if a collision occurred, as opposed to drivers. However, two participants noted that users or drivers should be held partially responsible because they had designated control to the vehicle.
These results indicated that generally speaking, Canadians agreed that responsibility for collisions involving self-driving vehicles should be assigned to the developers of these products. However, the results also revealed that females and older drivers were more prone to think that users should be held responsible, suggesting that these sub-groups of the population may have different expectations about legal responsibilities in relation to SDVs.
When unavoidable collisions occur, almost two-thirds (63%) of surveyed Canadians strongly agreed that SDVs should be programmed to prioritize the safety of vehicle occupants over other road users. However,
Figure 4: Which stakeholders should determine the rules and standards that govern programming of vehicle decision-making in unavoidable collisions
AUTOMATED VEHICLES | DRIVER KNOWLEDGE, ATTITUDES, & PRACTICES15
RESULTS

at the same time, slightly more than half (59%) strongly agreed that the safety of more people should be prioritized over fewer individuals, a slightly smaller proportion (54%) strongly agreed that vulnerable road users such as bystanders should be prioritized (Figure 5). Of importance, the differences between each of these results was significant (<.01). The odds that respondents agreed that SDVs should prioritize vehicle occupants in the event of an unavoidable collision increased by 30% for every ten-year increase in age; and, among those who prioritized the safety of bystanders, the odds increased by 17% for every ten-year increase in age (p<.05). In summary, this means that expectations regarding the safety of different road users who may potentially be injured in an unavoidable collision varied according to the respondents’ personal characteristics.
Similar to the survey, all focus group participants were asked whose safety should be prioritized in a collision involving an SDV and multiple road users. Many of the participants, drivers and non-drivers alike, found the question difficult to answer due in part to the moral implications of making choices about the importance of individual lives over the lives of others. Responses varied greatly but appeared to be partially
influenced by connections to family members. Some participants reasoned that SDVs should prioritize vulnerable road users (VRUs; such as pedestrians and cyclists) because vehicles already provided substantial protection to occupants. A number of participants stated that an important vehicle feature is the protection offered to occupants, and their safety should continue to be prioritized.
One participant noted that SDVs should be able to detect child car seats and prioritize the lives of children. There was strong agreement that SDVs should aim to save the largest number of people. For example, one participant indicated that vehicles should protect occupants when families are present, but not if the driver is the only individual in the vehicle. It is notable that a few participants did not agree that SDVs could be programmed to make ethical decisions, or that vehicles would have sufficient time or data to calculate an ethical response.
Summary. In conclusion, the results regarding driver knowledge, attitudes, and perceptions revealed some concerning issues with respect to automated vehicles. Knowledge of SDVs in general, and of LSDVs
Figure 5: Whose safety should be prioritized by an SDV in the event of an unavoidable collision
AUTOMATED VEHICLES | DRIVER KNOWLEDGE, ATTITUDES, & PRACTICESRESULTS16

and FSDVs specifically, was low, particularly as to how they function and their limitations. The majority of Canadians reported that they were not very familiar with SDVs. Older drivers and female drivers tended be less knowledgeable and less favourable towards SDVs, and perceived them as more stressful, suggesting that these groups may not only be less prepared to use SDVs, but they may also avoid using them. In contrast, males and younger populations reported greater knowledge and favourability towards the technology, but at the same time, these groups also reported greater enjoyment of the driving experience. Additional research is needed to determine more specifically what factors contribute to favourability and to driver enjoyment as these two competing attitudes may interfere with the uptake of SDVs. Insights from the focus groups suggested that a key factor that may limit driver usage of these types of vehicles was the extent of control drivers may have over this technology and whether they will be able to override vehicle programming. Non-drivers indicated that they saw many advantages to FSDVs for themselves; however, they reported that they would more likely use them as part of a rideshare system and expressed doubts as to whether these vehicles would be capable of assisting them in and out of vehicles, which is often performed by a driver as part of transportation services.
Results also indicated that drivers overwhelmingly expected multiple stakeholders to be involved in developing the rules and regulations with respect to SDVs. Drivers expected both software developers and traditional manufacturers to be held responsible in the event of a collision, although among those who thought users should be held responsible, the odds were greater that females and older drivers believed this. As with current vehicles, the majority of Canadians continued to expect SDVs to prioritize the safety of vehicle occupants over other road users; however, the survey also revealed that the safety of other road users was still of concern. Feedback from focus group participants demonstrated the serious moral implications of creating algorithms that must choose how to prioritize lives. At present, this study indicated that much more work is needed before consensus regarding liability and algorithms for vehicle software are negotiated. In this respect, more research is needed to explore driver perceptions and expectations regarding SDV programming as this may have a significant impact on a driver’s choice to use these vehicles.
Driver practices: Acceptance, trust, and behaviour related to SDVs
Survey respondents and focus group participants were asked a variety of questions based on theoretical constructs associated with driver acceptance of technology (perceived ease of use and perceived usefulness), trust in automation, and behavioural adaptation (see Appendix A: Methodology).
Technology acceptance and perceived ease of use. Respondents were asked two sets of questions related to how easy they thought it would be to use LSDVs and FSDVs. Less than one-third (30%) of Canadians strongly agreed that LSDVs would be easy to use. An almost equal proportion of respondents (38%) strongly agreed that they currently had enough knowledge to operate these types of vehicles (see Figure 6). A slightly larger (40%) proportion of drivers strongly agreed that FSDVs would also be easy to use. Similarly, 36% strongly agreed they had enough knowledge to operate these vehicles.
AUTOMATED VEHICLES | DRIVER KNOWLEDGE, ATTITUDES, & PRACTICES17
RESULTS

These data revealed that 30% to 40% of Canadian drivers believed that the knowledge of vehicles and driving that they currently possessed would be sufficient to operate an LSDV or an FSDV, and that new knowledge or skills on the part of drivers would be in necessary. In other words, these drivers did not
expect much of a ‘learning curve’ when they acquired an LSDV or FSDV, and anticipated taking possession of this new vehicle without any instruction other than a driver’s manual, in much the same way as they do with the combined function vehicles that are already available.
Canadians who believed they had sufficient knowledge to operate LSDVs or FSDVs were more likely to be male. Specifically, the odds of thinking that their current knowledge was sufficient to use both types of SDVs were between 1.8 and 2.3 times greater for males than
females (p<.001). The odds were also 1.7 times greater among males to perceive that FSDVs would be easy to use (p<.01). However, older drivers were less likely to perceive that FSDVs were easy to use; as the odds of perceiving that FSDVs were easy to use decreased by 17% for every ten-year increase in age (p<.01).
When asked similar questions, participants in all focus groups had varied perceptions about ease of use. Among drivers, some thought they would need more information, such as a manual, and to possibly take one or two lessons on how to use it, whereas others thought that they would need to know less. In general, many felt that drivers would gradually learn to use new technologies and features over time, much like current practices with new vehicles or other types of technology such as cell phones. To illustrate, some participants reported that “drivers will adapt over time” as they do with other types of technologies or that drivers “may need one or two lessons to use SDVs”.
On the other hand, non-drivers tended to be more concerned about having specific types of knowledge that are more prevalent among drivers such as vehicle maintenance, licencing, and basic operations of vehicles, as well as whether operating systems could be tailored to different languages. Some questioned whether persons with disabilities would be able to use SDVs, particularly people who communicate
Figure 6: Driver perceptions about ease of use of SDVs
females (p<.001). The odds were also 1.7 times greater among males to perceive that FSDVs would be easy
AUTOMATED VEHICLES | DRIVER KNOWLEDGE, ATTITUDES, & PRACTICESRESULTS18

non-verbally and may not be able to interact with the technology. However, at least some non-drivers agreed that the average person would have adequate knowledge to use SDVs.
Technology acceptance and perceived usefulness. Overall, a large majority of survey respondents did not perceive SDVs as useful in terms of improved driving. Most noteworthy was that just 16% of drivers strongly agreed that SDVs would make them better drivers, and 17% strongly agreed that travel time would be reduced. Less than one-quarter (23%) would commute using an SDV if they could program it to return home (see Figure 7). The odds that drivers perceived SDVs as useful for driving decreased by between 19% and 37% for every ten-year increase in respondent age (p<.01). The odds of perceiving that SDVs would reduce travel time and be useful for commuting if the vehicle could be programmed to return home were 2.0 and 1.6 times greater, respectively, if the respondent was male (p<.01). Finally, for every 500 km driven, the odds that respondents perceived SDVs as useful to reduce travel time, to commute, or to make them a better driver increased by 4% and 7%(p<.05)
With regard to results associated with questions about the value of SDVs to commuters, the majority of respondents reported they currently commuted by vehicle (84%). Much smaller proportions of respondents reported commuting by public transportation (8%), by cycling/walking (7%), by car pool (1%), and by taxi (0.1%) (see Table 1). Among persons who commuted by vehicle, 20% indicated they would instead commute using an SDV if these vehicles could return home and park.
Persons who relied on other modes of transportation to commute also reported they would instead use an SDV if it was available. Specifically, 33% of people who used public transportation, 15% of persons who cycled or walked, and 30% of those who car pooled reported they would switch to SDVs to commute if the vehicle could return home and park. These findings have important implications for public transportation availability and investment, and underscore the potential for considerable declines in the usage of these alternative systems (Anderson et al. 2016), which are already under-utilized, in the coming years as SDVs become increasingly
Figure 7: Driver perceptions about how useful they thought SDVs would be in terms of driving
investment, and underscore the potential for considerable declines in the usage of these alternative systems
AUTOMATED VEHICLES | DRIVER KNOWLEDGE, ATTITUDES, & PRACTICES19
RESULTS

available. These findings also alluded to concerning health implications and indicated that fewer people may select modes of transportation that require physical exercise.
Persons who would be inclined to replace their current method of commuting with the use of an SDV reported driving longer distances and currently utilized vehicles to commute. The odds of switching to an SDV to commute increased by 5% for every 500 km driven, and were 1.5 times greater if male (p<.05). In contrast, persons who were older or who commuted by bus were less likely to report making the change to an SDV. For every ten-year increase in age, the odds of respondents reporting that they would switch to SDVs decreased by 79% if they commuted by bus (p<.05).
Participants in all focus groups perceived a number of benefits, but also some drawbacks to SDVs. They anticipated that SDVs could be used for errands, deliveries, shopping, and picking up/dropping off their children for various activities. To illustrate, some participants indicated that they “would use [SDVs] to pick-up and drop-off my kids.” Several cited the advantage of making use of SDVs when they would typically sit idle. An example one participant noted was that an SDV could be summoned and used by another family member instead of being parked at the mall while the driver was shopping. Many participants did not like parking and viewed self-parking technology and the possibility of SDVs navigating parking lots as very desirable.
Other participants reported that SDVs would provide greater independence and mobility to persons that were unable to drive, such as seniors, persons with visual impairments, and other non-drivers. Similarly, participants thought SDVs would be useful to drivers that consumed alcohol and drove impaired, or others that fell asleep at the wheel. Of interest, one participant suggested that it could be a requirement that dangerous drivers whose licence had been suspended or revoked could only use an FSDV.
Despite the perceived benefits, participants were concerned about the impact SDVs might have on the workforce and unemployment, particularly employees who transport persons or goods such as taxi and delivery drivers. Another predominant concern about the availability of SDVs was their potentially negative impact on human interactions. Participants acknowledged that driving provided an opportunity to connect with family members and friends, and that social interaction often occurred in vehicles. To illustrate, one participant proposed that parents would be less likely to regularly attend sporting events or other activities with their children because it would be possible for an SDV to transport children to school, rehearsals, practices and other such occasions. In addition, participants raised environmental concerns associated with SDVs running errands and returning home to park during the day as such programming would increase the amount of driving and thereby increase traffic pollution.
Table 1: Percent of drivers according to primary means of commuting, and percent of commuters who would use SDVs instead to commute
VehiclePublic
transportationBicycle /
walkCar pool Taxi
Primary means of commute
84% 8% 7% 1% 0.1%
Percent of respective commuters who would use SDV instead if it could return home and park itself
20% 33% 15% n/a n/a
AUTOMATED VEHICLES | DRIVER KNOWLEDGE, ATTITUDES, & PRACTICESRESULTS20

One noticeable difference between drivers and non-drivers in terms of usefulness was how they perceived the ownership of SDVs. The majority of non-drivers viewed SDVs as a part of a car-share service that they would call upon when required, instead of owning an SDV. In contrast, most drivers viewed SDVs as a product they would own and more likely share with family members.
Trust in automation. More survey respondents strongly agreed that they would trust LSDVs built by a partnership between traditional automakers and technology companies (41%). Smaller proportions of respondents (35%) would trust LSDVs built by traditional automakers alone versus technology firms (25%). Age, sex, and income had varying effects on trust in various manufacturers. Older drivers were less likely to trust SDVs manufactured by technology firms. For every ten-year increase in age, the odds that drivers trusted SDVs manufactured by technology firms and by a partnership decreased by 20% and 12%, respectively (p<.05). Males were more likely to trust SDVs produced by all three manufacturers; the odds of trust were 1.4 to 1.7 times greater if respondents were male (p<.05). Finally, persons with higher income more often trusted traditional automakers and a partnership; the odds increased by 9% in both categories in association with increases in income (p<.05).
Focus group participants were generally divided about trust of manufacturers based on whether they viewed the technology or the structure of the vehicle as more important in terms of safety. Some participants thought the technology was “core” to SDV safety and therefore were more inclined to trust technology companies; however, others thought that the structure and design of SDVs was more important, particularly in a crash, and instead trusted experienced manufacturers to produce safer vehicles. A few participants thought a partnership would be best. Nonetheless, all seemed to agree that SDVs would be safe for public use by the time they reached the market and automation will simply be another factor in the purchasing decision.
Less than one-third of Canadian drivers strongly agreed that they would feel safe using LSDVs (28%) and less than one-quarter reported they would feel safe using FSDVs (21%). These results mirrored those reported above regarding drivers who strongly agreed that they would use either of these types of vehicles. Drivers who reported that they would feel safe using SDVs were more likely to be male. Specifically, the odds of feeling safe using LSDVs and FSDVs were 1.6 and 2.6 times greater for males than females, respectively (p<.01).
A minority of focus group participants indicated that they would be early adopters of SDV technology whereas the majority consistently reported that they would not immediately trust SDVs and would need to see that they are proven safe and reliable before they would purchase or use them. Although non-drivers had similar safety concerns as drivers, overall, non-drivers were much more positive towards, and trusting of, SDV technology. Several non-drivers cited personal experiences of driver error that put them at risk (e.g., dooring, not paying attention, driving through crosswalks). Instead, non-drivers were concerned about whether SDVs would help accommodate disabilities. For instance, many relied on taxi drivers, bus drivers, or other individuals to assist them in and out of vehicles; something SDVs would not be able provide.
Driver level of trust in operational aspects of SDV technology was also low. Only 21% of drivers strongly agreed that the technology would be safe from cyber-attacks. Similarly, only 31% strongly agreed that warning systems in LSDVs would provide enough notice for drivers to take control of the vehicle. Several participants in all focus groups reported concerns of cyber-attacks that could shut down the vehicle or take over control; however, this was not considered an important concern for most participants. Many of them were worried about whether SDVs would obey user commands, particularly if users gave commands that contradicted programming. To illustrate, one focus group participant queried whether “the car will obey me over the program.”
AUTOMATED VEHICLES | DRIVER KNOWLEDGE, ATTITUDES, & PRACTICES21
RESULTS

Drivers in the focus groups also varied widely in terms of how much notice they thought they would need to take over driving of an LSDV. Expected notice ranged from 30 seconds up to a full day of notice. Drivers also reported that LSDVs should pull over instead of drivers having to take control, noting that “I want the vehicle to pull over”, if it was not able to cope with driving conditions. One group participant suggested that the more appropriate question to ask in instances where drivers would have to take control of driving was “how much time it would it take to call the company and complain”, which provides some insight into driver reluctance to take responsibility for LSDVs on short notice when the technology cannot cope with driving conditions.
Other drivers agreed that LSDVs should tell them how to respond if the vehicle could not drive. There were also some concerns that transferring control back to drivers might cause panic, while some reported concerns associated with degradation of the skills of drivers who would no longer be driving on a regular basis to respond to emergency situations when required.
Driver confidence in technology to perform safely in high-risk or safety-critical situations was also quite low. The majority of Canadians did not agree that LSDVs would perform better than drivers. Less than one-quarter (24%) of drivers strongly agreed that LSDVs would respond better to pedestrians and cyclists than themselves (see Figure 8). A similar proportion of drivers (26%) strongly agreed that LSDVs would be able to respond to hazards better than drivers. In terms of poor driving conditions, less than one-third (29%) of respondents strongly agreed that LSDVs would drive more safely than human drivers. Drivers who drove longer distances were more likely to trust LSDVs to respond in poor driving conditions; the odds that drivers trusted LSDVs would respond better to these conditions increased by 5% for every 500 km driven (p<.05). However, trust in these vehicles to perform better in poor driving conditions decreased by 14% for every ten-year increase in age. Trust in LSDVs to respond to VRUs increased by 57% among drivers who reported residing in urban areas (p<.05). The odds of trusting these vehicles to respond to hazards better than the respondent were 1.4 times greater for males.
Figure 8: Percent who strongly agreed that LSDVs will perform better than the respondent would in certain situations
AUTOMATED VEHICLES | DRIVER KNOWLEDGE, ATTITUDES, & PRACTICESRESULTS22
Participants from all focus groups generally agreed that SDVs would perform better than humans because SDVs would not be distracted and could consistently monitor all the features of the driving environment, as noted by one participant who stated that SDVs “will always be more vigilant.”
However, participants also underscored the importance of the technology being proven effective before they would use an SDV. Most participants were concerned that the software could fail and they wanted an override feature, more precisely some stated that they would “not use [SDVs] unless there is an override feature.”
Interestingly, when asked in what situations drivers were most likely to rely on LSDVs, participants in the driver focus groups reported wanting to use them in dangerous driving situations, such as bad weather, high-density traffic, or night-time driving. This was despite having been informed that LSDVs would likely hand back control to drivers in these situations. Drivers also questioned whether SDV technology would be able to differentiate between different objects, such as pedestrians and cyclists versus other vehicles or fixed objects such as hydro poles and trees. Another issue that was raised was how SDVs would interpret human intentions, such as waving to say “hello or goodbye” versus a pedestrian or another driver holding up their hand to indicate a vehicle should stop or proceed. In contrast, as mentioned previously, non-drivers reported greater trust in the technology and its capabilities, particularly in comparison to human capabilities, than drivers.
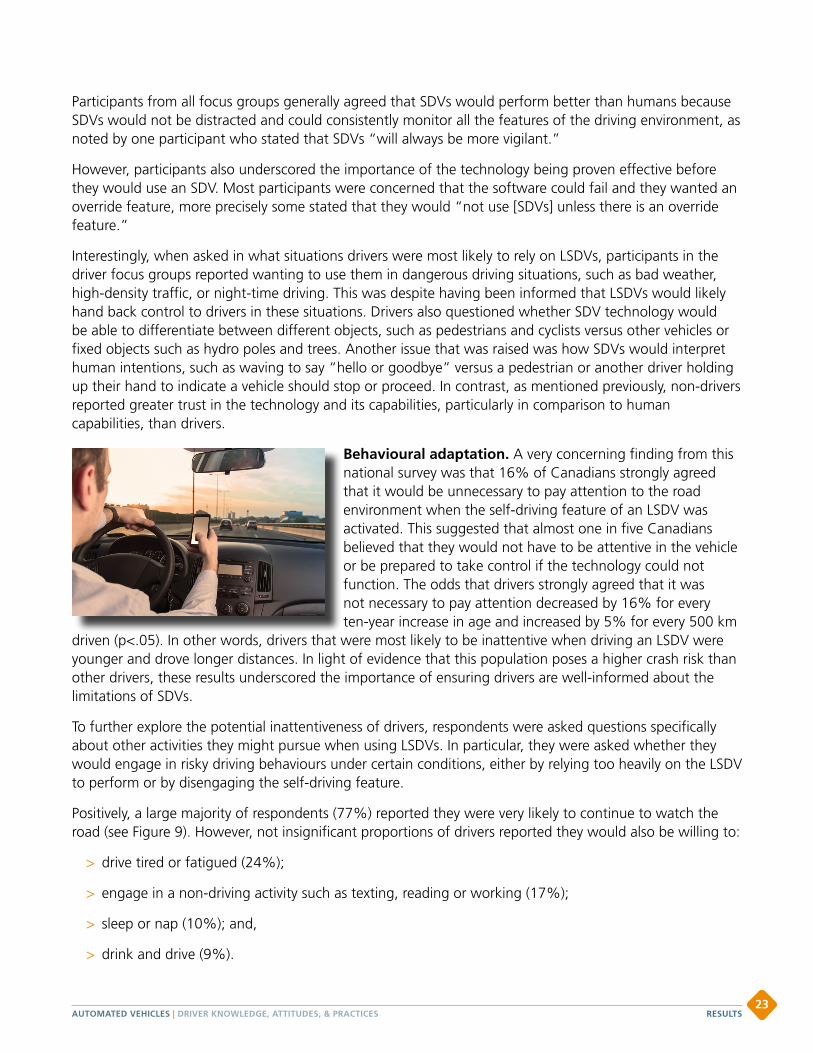
Behavioural adaptation. A very concerning finding from this national survey was that 16% of Canadians strongly agreed that it would be unnecessary to pay attention to the road environment when the self-driving feature of an LSDV was activated. This suggested that almost one in five Canadians believed that they would not have to be attentive in the vehicle or be prepared to take control if the technology could not function. The odds that drivers strongly agreed that it was not necessary to pay attention decreased by 16% for every ten-year increase in age and increased by 5% for every 500 km
driven (p<.05). In other words, drivers that were most likely to be inattentive when driving an LSDV were younger and drove longer distances. In light of evidence that this population poses a higher crash risk than other drivers, these results underscored the importance of ensuring drivers are well-informed about the limitations of SDVs.
To further explore the potential inattentiveness of drivers, respondents were asked questions specifically about other activities they might pursue when using LSDVs. In particular, they were asked whether they would engage in risky driving behaviours under certain conditions, either by relying too heavily on the LSDV to perform or by disengaging the self-driving feature.
Positively, a large majority of respondents (77%) reported they were very likely to continue to watch the road (see Figure 9). However, not insignificant proportions of drivers reported they would also be willing to:
> drive tired or fatigued (24%);
> engage in a non-driving activity such as texting, reading or working (17%);
> sleep or nap (10%); and,
> drink and drive (9%).
AUTOMATED VEHICLES | DRIVER KNOWLEDGE, ATTITUDES, & PRACTICES23
RESULTS

Women and older drivers were most likely to report they would continue to watch the road. To this end, the odds of being a driver who would continue to watch the road increased by 47% for every ten-year increase in age, and were 2.2 greater if female (p<.0001).
In terms of all other behaviours, older drivers were less likely to engage in them and the odds of being likely to engage in them when using LSDVs decreased between 12% and 35% for every ten-year increase in age (p<.01).
Male drivers and drivers who drove longer distances were more likely to report that they would engage in some of these behaviours if using an LSDV. Specifically, the odds of sleeping or napping while using LSDVs were 2.8 times greater among male drivers (p<.01). The odds of sleeping or napping also increased by 8% for every 500 km that was driven by respondents. Male drivers were more likely to report that they would set the LSDV controls to speed; the odds were 1.7 times greater among males (p<.05). Male drivers were also more likely to engage in drinking and driving and this finding is consistent with research related to arrests and collisions for impaired driving (Robertson et al. 2014; Perreault 2013). More precisely, the odds of respondents reporting they would drink and drive when using LSDVs were 2.3 times greater if they were male. Additionally, the odds of drivers who stated that they would drink and drive and use an LSDV increased by 8% for every 500km driven (p<.05).
As a comparison to the above behaviours that survey respondents reported they may do in LSDVs, Canadians were also asked how often they currently engaged in various dangerous driving behaviours. The following proportion of respondents reported that they very often did the following:
> set cruise control to drive well over the speed limit (8%);
> drove while tired or fatigued (5%)
> drove while distracted (4%); and,
> drove while impaired (3%) (see Table 2).
Table 2: Comparison of what drivers report currently doing and what they think they will do using LSDV
Currently do thisWould do this
using LSDVDifference
Continue to watch road 77%
Drive tired or fatigued 5% 24% 19%*
Do a non-driving activity / distracted
4% 17% 13%*
Sleep or nap 10%
Set vehicle to drive over speed limit
8% 9% 1%
Drink and drive 3% 9% 6%**Difference is signifi cant p<0.001
Figure 9: Different driving behaviours survey respondents reported that they were very likely to engage in while using LSDVs
AUTOMATED VEHICLES | DRIVER KNOWLEDGE, ATTITUDES, & PRACTICESRESULTS24

When comparing the above results of what behaviours survey respondents currently do to what activities think they will do in LSDVs, significantly more respondents reported that they would drive tired or fatigued (approximately five times more), drive distracted (approximately four times more), and drive over the speed limit (approximately four times more). These results are disturbing and illustrated that at least some drivers mistakenly believe that these vehicle technologies do not require driver input or attention at all times. This has considerable potential to increase crashes due to driver error and underscores that drivers may negatively modify their behaviour and decrease their safety because they do not understand the limitations of these technologies, or how to use them correctly.
Driver focus group participants were also asked what activities they may do when using an SDV (LSDV or FSDV). Many participants reported that they would do non-driving activities such as sleep, watch movies, or read.
Survey respondents were also asked whether they would disengage the LSDV in order to drive faster or to run a traffic light to make it through an intersection in different driving scenarios. More than one-third of drivers (35%) reported they were likely to disengage the LSDV in order to drive faster in good road and weather conditions. Slightly less than one-third of respondents (31%) reported they would do so when driving on familiar roads and also if they were late for an appointment.
Additionally, one-fifth of drivers (21%) reported they would still disengage the LSDV to drive faster in poor road and weather conditions (see Figure 10). Among respondents who reported they would do this behaviour under these various conditions, the odds of disengaging the LSDV decreased between 14% and 18% for every ten-year increase in age (p<.01). With the exception of driving on familiar roads, the odds that respondents reported that they would do this behaviour increased between 4% and 7% for every 500 km driven (p<.05).
Women and older drivers were most likely to report they would continue to watch the road. To this end, the odds of being a driver who would continue to watch the road increased by 47% for every ten-year increase in age, and were 2.2 greater if female (p<.0001).
In terms of all other behaviours, older drivers were less likely to engage in them and the odds of being likely to engage in them when using LSDVs decreased between 12% and 35% for every ten-year increase in age (p<.01).
Male drivers and drivers who drove longer distances were more likely to report that they would engage in some of these behaviours if using an LSDV. Specifically, the odds of sleeping or napping while using LSDVs were 2.8 times greater among male drivers (p<.01). The odds of sleeping or napping also increased by 8% for every 500 km that was driven by respondents. Male drivers were more likely to report that they would set the LSDV controls to speed; the odds were 1.7 times greater among males (p<.05). Male drivers were also more likely to engage in drinking and driving and this finding is consistent with research related to arrests and collisions for impaired driving (Robertson et al. 2014; Perreault 2013). More precisely, the odds of respondents reporting they would drink and drive when using LSDVs were 2.3 times greater if they were male. Additionally, the odds of drivers who stated that they would drink and drive and use an LSDV increased by 8% for every 500km driven (p<.05).
As a comparison to the above behaviours that survey respondents reported they may do in LSDVs, Canadians were also asked how often they currently engaged in various dangerous driving behaviours. The following proportion of respondents reported that they very often did the following:
> set cruise control to drive well over the speed limit (8%);
> drove while tired or fatigued (5%)
> drove while distracted (4%); and,
> drove while impaired (3%) (see Table 2).
Table 2: Comparison of what drivers report currently doing and what they think they will do using LSDV
Currently do thisWould do this
using LSDVDifference
Continue to watch road 77%
Drive tired or fatigued 5% 24% 19%*
Do a non-driving activity / distracted
4% 17% 13%*
Sleep or nap 10%
Set vehicle to drive over speed limit
8% 9% 1%
Drink and drive 3% 9% 6%**Difference is signifi cant p<0.001
AUTOMATED VEHICLES | DRIVER KNOWLEDGE, ATTITUDES, & PRACTICES25
RESULTS

These results are problematic and suggested that a sizeable portion of drivers will want to control the speed of their vehicle, and would be willing to disengage an LSDV in order to drive faster both when conditions are less risky as well as when conditions are more risky. Research has clearly shown that speed is a key factor in road crashes, and that all types of road users are more likely to be seriously injured or killed at higher speeds (Vanlaar et al. 2008; Vanlaar et al. 2014). In addition, driving at faster speeds means that drivers will have even less time to assess a situation and respond accordingly. This clear desire among at least some drivers to turn off automated features and take over driving in order to engage in risky behaviours that are unsafe not only for drivers, but for other road users they may encounter, is quite concerning.
A somewhat smaller proportion of drivers reported that they would be willing to disengage the LSDV in order to run a red light in similar road scenarios. Still, 13% of respondents reported they would very likely to do so in good road and weather conditions. An equal proportion of drivers (13%) also agreed they would disengage the technology to run a red light when driving in familiar areas, and when late for an appointment. An almost identical proportion of drivers (14%) reported they would still do so when driving in poor road and weather conditions.
Respondents who were very likely to disengage LSDVs to run red lights in most cases drove longer distances, were male, and lived in urban areas. Specifically, under all conditions, the odds that respondents were likely to do this behaviour increased between 5% and 7% for every 500 km driven (p<.05). The odds of running red lights in good conditions, when driving in familiar areas, and under poor road conditions were 1.5 and 1.6 times greater among male drivers (p<.05). With the exception of being late for an appointment, the odds of respondents living in urban areas who would do this behaviour increased between 66% and 102% among the other driving conditions (p<.05). Among respondents who reported they would run red lights if late for an appointment or under poor road conditions, the odds of disengaging the LSDV decreased between 14% and 18% for every ten-year increase in age (p<.05).
Driver focus groups provided insight into potential reasons that drivers may disengage the LSDV when driving. Some participants indicated that if LSDVs did not “do what they want”, if the driver found the driving style of the vehicle “annoying”, or “if the car [was] not driving in my style”, such as not going fast enough, then drivers would disengage the LSDV to drive the vehicle in a way that is more consistent with their style.
Figure 10: Percent of drivers very likely to disengage LSDV in order to drive faster or run a red light under different conditions
AUTOMATED VEHICLES | DRIVER KNOWLEDGE, ATTITUDES, & PRACTICESRESULTS26

Similar to the previous results, these findings indicated that a not insignificant proportion of drivers would turn off LSDV technology in order to increase risky behaviour on the road. While the proportion of drivers who would disengage the self-driving feature to run red lights is smaller than the proportion of drivers who reported speeding, these results were equally concerning. Drivers who run red lights pose a significant risk to other road users, and the willingness of at least some drivers to engage in this behaviour suggests that they do not understand the risks associated with it. Research has shown that red light crashes frequently involve angle collisions which have a greater likelihood of serious injury and death (Vanlaar et al. 2014).
Collectively, these results about speeding and red light running demonstrated that more education is needed to ensure drivers understand the safety that automated features provide, and the potential to reduce crashes with SDVs is realized. But perhaps more convincing strategies will be necessary to ensure that drivers do not ‘turn off’ such technologies and place other drivers at risk.
Finally, the survey also provided drivers with a scenario that involved driving on a well-maintained highway during the day in heavy rain with slightly reduced visibility. It was noted that the speed limit was 90 km/h but that it would be too risky to drive at this speed. In contrast to the previous results, fewer drivers reported they would disengage the self-driving feature to take control of the vehicle and increase their driving risk. In fact, fewer drivers reported that they would negatively adapt their behaviour as the level of automation increased (e.g., limited versus fully automated).
In the first question related to this scenario, it was not specified that the vehicle was an SDV, and approximately one-quarter (24%) reported that they were still very likely to drive the speed limit. The second question was the same but respondents were informed that they were driving a vehicle with adaptive cruise control (ACC) and a definition of this feature was provided. In this situation, 15% reported that they were very likely to set the ACC to drive at or above the speed limit in these driving conditions. In the final question, respondents were informed that they were driving an LSDV, and slightly fewer drivers (13%) reported that they would set the vehicle to drive at or above the speed limit.
Among respondents, the odds that those who reported that they would set LSDVs to drive at or above the speed limit, were 1.8 times greater for males than for females, and the odds increased by 4% for every 500 km driven p<.05). In contrast, the odds of doing this behaviour decreased by 14% for every ten-year increase in age. The difference between adapting one’s behaviour while using vehicles without automation in the first scenario in comparison to using a vehicle equipped with ACC or LSDV technology was significant (p<.001). However, the difference between those who reported they would adapt their behaviour for ACC versus those who would for LSDVs was not significant. This may suggest that drivers may be less willing to rely upon automated technology in general under certain conditions, such as heavy rain, and that drivers may instead prefer to be in control during riskier driving conditions. This is in contrast to several of the focus group participants who stated they would prefer to use SDVs during riskier situations (see above). Further research is required to better understand these differences and discover underlying perceptions.
Summary. In terms of the above results, driver acceptance, trust, and behaviour related to SDVs revealed potential issues that may arise with the implementation and use of this technology. Driver acceptance of SDVs was not high. The majority of Canadians did not perceive SDVs will be easy to use, although more than one-third of the population believed that they would not require any additional instruction or knowledge to operate these vehicles. Many fewer drivers viewed the technology as useful to their daily driving tasks. Focus group participants, however, saw other benefits such as thinking they would be able to use SDVs for errands, greater mobility for those unable to drive, or transporting children; but also some drawbacks, such as potential reduced employment for those who provide transportation services, or
AUTOMATED VEHICLES | DRIVER KNOWLEDGE, ATTITUDES, & PRACTICES27
RESULTS

reduced family interaction if parents opted to have children transported by SDVs. In general, though, the results suggested that the majority of drivers may not use SDVs in part because they do not perceive significant benefits.
Similar to the above, trust in automation related to SDVs was also low. Drivers preferred a partnership between traditional automakers and technology companies as opposed to other options; yet, still less than half of all respondents indicated that they would trust using SDVs made by this partnership. Additionally, the majority of Canadians reported that they would not feel safe using SDVs and that they did not have confidence that SDVs could perform safely in high-risk or safety-critical situations. Drivers with greater trust in the various potential capabilities of automated vehicles were more likely to be males or younger drivers. On the other hand, focus group participants indicated that once the technology is proven reliable, they largely thought SDVs would perform better than humans because the technology would not be susceptible to many of the errors due to poor driving habits often displayed by human drivers. At the same time, many of these participants also expected SDVs to provide substantial warning to drivers in the event of an emergency, and many would prefer to rely on SDVs during dangerous driving situations. Overall, these results suggested that trust will be dependent upon SDVs proving their capabilities but, once drivers trust the technology, they may over-rely on it to perform beyond the capabilities of the technology.
This study also revealed troubling findings that demonstrated some drivers would adapt their behaviour when using LSDVs in ways that would reduce potential safety benefits and/or increase risks. A minority of Canadians reported that they did not think it would be necessary to pay attention to the driving environment when the self-driving technology was engaged on LSDVs. Furthermore, some drivers indicated that they would turn off the self-driving function to perform unsafe behaviours such as speed or run red lights, or that they may set the self-driving function to speed in other situations.
In the majority of these situations, the odds of being male or a younger driver were greater than being female or an older driver. Comments from focus group participants provided a potential explanation for these behaviours in that some participants indicated they would not use SDVs if the vehicles did not drive according to how the user would drive. Although it is encouraging that a only a minority of drivers reported that they would engage in riskier or unsafe driving behaviours using SDVs, this still indicates that part of the population may not use vehicles as intended and this may reduce any potential safety benefits.
It is worth highlighting that across the majority of the results of this study, male drivers and younger drivers were predominately found to be early adopters of SDV technology. However, these drivers are also in one of the highest risk groups in terms of road safety largely due to inexperience and thrill seeking behaviour. This suggests that early adopters from these two populations may have negative consequences for safety as SDVs are initially used.
AUTOMATED VEHICLES | DRIVER KNOWLEDGE, ATTITUDES, & PRACTICESRESULTS28

CONCLUSIONS & RECOMMENDATIONSThe results of this national survey augmented with select focus groups represent the first comprehensive investigation in Canada of driver knowledge, attitudes, and practices regarding the emergence of automated vehicles. Key topics that were explored included driver acceptance of self-driving vehicle technology and perceptions regarding its use, as well as trust in automation. The issue of trust is a critical one that requires attention as it will have profound implications for the widespread use of such vehicles.
This study also examined the frequency of risky driving practices in terms of vehicles with advanced driver assistance features that are currently in dealerships, as well as potential practices that may be observed among drivers as limited and fully self-driving vehicles become available for purchase by consumers.
Collectively, the results of this study can improve understanding of ways that drivers aim to use increasingly automated vehicles. More importantly, it provides insight to help shape educational strategies, government policies, and tactics that permit SDVs to enter the market, and ensures the safety benefits promised by automated vehicle technology will be accrued.
Knowledge. While a majority of Canadians reported they were generally familiar with automated vehicle technology, misperceptions about SDVs were quite prevalent. Overall, the limitations of SDV technology were not well-recognized by drivers, and awareness that these technologies cannot function in complex road environments was low. As evidence of this, sizeable proportions of drivers reported that they will pay less attention to driving and the road environment, and instead devote attention to other non-driving activities as automated features become more sophisticated.
These findings underscored that drivers were not aware of their continued role in the driving equation, or the need to remain vigilant behind the wheel. Such misperceptions have real potential to negatively affect driver behaviour and result in either unintentional misuse, or abuse of technologies that were designed to assist drivers. In light of reports that LSDV technology may be available to consumers in as little as four years (i.e., 2020), much more concerted efforts are needed to ensure that drivers are adequately prepared for this major technological shift in driving.
Attitudes. This research also revealed that the safety of AVs is a top concern and, significantly more Canadians agreed that it would be stressful to ride in an AV as opposed to relaxing. To illustrate, few Canadians reported they would purchase an LSDV or an FSDV if it were available today, and a majority
AUTOMATED VEHICLES | DRIVER KNOWLEDGE, ATTITUDES, & PRACTICES29
CONCLUSIONS & RECOMMENDATIONS

of them have stronger preferences for vehicles that include single-function or combined function safety features or driver assistance systems that they can control. Insights from study focus groups emphasized that drivers will want to see other people drive AVs safely before using one.
More disquieting were results that indicated the public assumes that the availability of these vehicles (either explicitly through regulation or implicitly by failure to prevent their sale) means that AVs have indeed been tested by government and proven safe. In other words, the public is rather uninformed about government regulation of the sale of these vehicles, and mistakenly believes that availability equates to safety. In some respects this is not surprising as a similar misperception that vehicle accessories are safety-tested is equally pervasive.
This study also revealed that almost two-thirds of Canadians believed software developers should be assigned liability in unavoidable collisions, and to a slightly lesser extent vehicle manufacturers should be accountable, with fewer still that reported drivers should continue to be accountable. In addition, there was considerable agreement that SDVs should prioritize the protection of vehicle occupants above all others in crash situations. Safety in a collision is currently a primary factor in purchasing decisions, and drivers will expect no less of SDVs. This raises important ethical issues about the ways that SDVs will respond in crash situations, and how decisions about program algorithms will be made by manufacturers in terms of who will be protected, particularly in collisions involving pedestrians and cyclists, as well as multiple road users. Ultimately, these decisions may influence consumer choices and shape how manufacturers develop and market their safety technology.
Acceptance. Many Canadians did not anticipate much of a learning curve in order to operate an SDV according to this study. In fact, more than one-third of drivers reported that their current level of knowledge about driving and vehicles was sufficient. This implies that drivers plan to purchase a new, automated vehicle and drive it home from the dealership with little or no instruction on how to use one, much in the same way that they purchase vehicles today. This is in stark contrast to the four weeks of training that drivers require before driving a Google car on a public road (Levy 2016). While this is not to suggest that all drivers will require lengthy training, it does illustrate that this technology will fundamentally change how drivers interact with automated vehicles, and that drivers may seriously underestimate how dramatically the driving experience will be altered.
Attitudes regarding benefits and drawbacks associated with AVs were also quite varied, with the latter being more prevalent among Canadians. While advantages were easily recognized, a number of concerns were also raised. Principle among them was the potential negative consequences of SDVs on family interactions and relationships. Time that families spend together in a vehicle to run errands or transport family members, particularly children, was viewed as strengthening family and social bonds, and providing valuable opportunities to both nurture and supervise children. Loss of employment for professional drivers of people and goods, and damaging effects on the environment due to vehicles performing more errands or returning home to park were other primary concerns that emerged. As such, it appears that a wide range of diverse factors quite unrelated to technology will substantially influence decisions by Canadians to purchase and/or use SDVs (Anderson et al. 2016).
Trust. Trust was also an issue and slightly less than half of Canadians reported that they would have greater trust in SDVs built by a partnership between vehicle manufacturers and technology firms. While more than one-third still reported that they would trust SDVs built by traditional vehicle manufacturers, only one-quarter of them indicated they would trust vehicles developed by technology firms. To this end, trust of different manufacturers may vary depending on whether drivers believe that vehicle design and structure is most important in a crash as compared to the ability of the software to avoid the crash altogether.
AUTOMATED VEHICLES | DRIVER KNOWLEDGE, ATTITUDES, & PRACTICESCONCLUSIONS & RECOMMENDATIONS30

Trust in the performance of SDVs as compared to human drivers was exceptionally low, and concerns about safety effectiveness were common as less than one-third of drivers reported they would feel safe using an LSDV; just one in five indicated they would feel safe using an FSDV. Trust was equally low that technology was safe from cyber-attacks, or that LSDVs would provide adequate notice to drivers to prepare them to take over driving. To this end, expectations regarding the amount of notice to drivers to take over driving ranged from as little as a few seconds to as much as several hours. Some individuals suggested that unexpected transfer of control back to the driver would cause panic, and others indicated that drivers should never be expected to take control. In other words, vehicles should provide ample warning if it cannot function and instead safely come to a stop. However, crashes are unexpected events with often no more than a few seconds warning, so lengthy advanced notice would be extremely unlikely.
Driver trust in the technology to perform safely in high-risk or safety critical situations was also doubtful. Many drivers generally did not believe that SDVs would make them better drivers, or that SDVs would be able to respond to hazards, pedestrians or cyclists, or poor road conditions better than human drivers. Yet, in sharp contrast, drivers also reported a strong desire to use self-driving technology in these types of high-risk conditions when it is very likely to fail. These findings are troubling and draw attention to critical knowledge gaps that must be addressed to ensure drivers realize and are receptive to more information about the safe and proper use of SDVs as well as their safety benefits.
This trust in AV technology may ultimately influence uptake and use of these vehicles by consumers. According to Professor Andry Rakotonirainy at the CARRS-Q in Australia where vehicle automation and human interactions have been extensively studied:
“Engineers have developed the technology but human acceptance has been largely ignored. If the human doesn’t accept the technology or doesn’t trust the technology, they won’t buy the technology” (CARRS-Q 2016).
Behaviour. The most pressing concern that emerged from this study was that many drivers believed they would not need to pay attention to the road environment when using SDVs and, that at least some of them would modify or adapt their behaviour in negative ways that would undermine safety objectives. Most notably, larger proportions of drivers indicated that they would engage in risky behaviours such as driving while tired or distracted as compared to the frequency of these behaviours in traditional vehicles. In addition, more drivers reported that they would set their driving speed in excess of the speed limit, or drive while impaired.
More disturbing were results that revealed some drivers would also disengage self-driving features in order to speed or run a red light, even in bad weather and poor road conditions. Drivers expected that self-driving features could be disengaged or turned off as they see fit. In this regard, the option for drivers to turn on and off self-driving features may unintentionally result in drivers turning safety on and off, thereby placing themselves and other road users at risk. As such, decisions to permit drivers to adjust the driving style of automated vehicles and turn off self-driving features may also have substantial implications for the level of safety that is achieved with SDVs.
In conclusion there were three critical priorities that emerged from this study and that require concerted attention in the next five years. First, there is a clear need to educate Canadians about AV technology in order to overcome common misperceptions about the capabilities of the technology, and increase understanding of the limitations associated with it. Driver assistance systems have dramatically improved to help drivers respond to unpredictable road environments and compensate for human error. But automated vehicle technology is not ready for deployment beyond enhanced safety and enhanced driver control. In particular, drivers must recognize that continued and sustained attention to the driving task is essential
AUTOMATED VEHICLES | DRIVER KNOWLEDGE, ATTITUDES, & PRACTICES31
CONCLUSIONS & RECOMMENDATIONS

to avoid increases in crash risk. In other words a driver is still necessary. Therefore, it is incumbent on manufacturers to be cautious in marketing automated features and demonstrate due diligence to protect the safety of consumers who purchase their products. This is paramount in light of the magnitude of misperceptions that currently exist about automated vehicles. Government also plays an important role in this regard to ensure responsibility in advertising and to raise public awareness about how these new vehicles are tested and made available to consumers. Transparency regarding how safety standards are set and met is indispensable so drivers can make informed purchasing decisions.
Second, younger male drivers demonstrated greater acceptance of and trust in SDVs as compared to other age categories, and were more willing to rely on these vehicles to perform the driving task. As such, it is expected that this population of drivers may represent the early adopters of automated vehicles and they must know how to properly utilize this technology. Of concern, this population of drivers equally demonstrated a propensity for risk-taking behaviour, a desire to disregard the driving task, and higher levels of crash involvement. In other words, there is evidence that early adopters of SDVs may be more representative of drivers who are less safety-conscious and more crash-involved. This issue warrants attention as their initial experiences with SDVs will have profound implications for widespread uptake and use, and targeted education to ensure that early adopters are well-informed about the limitations of technology is paramount.
Conversely, older populations of drivers and women were much more reticent and less likely to rely on SDVs until the level of safety offered by these vehicles is more concretely demonstrated in real world conditions. Education is also much needed for these potential users to overcome barriers to use. It is noteworthy that the features offered by automated vehicles may do much to overcome declines in vision, hearing, reaction times and mobility to increase safety among older drivers. This can enable them to retain driving privileges as they age and have substantial health and mobility benefits.
Finally, there is clear evidence that the ability of drivers to ‘turn off’ technology designed to improve safety will influence the size of crash reductions that are ultimately achieved. This study demonstrated that at least a proportion of drivers will want to turn off automated features, and thereby potentially turn off safety. As such, policy decisions by government to either require all drivers to use automated features, or permit them to choose when and in what conditions these features are used, will play a critical role in shaping experiences with automated vehicles, and the extent to which the use of SDVs on public roadways is accepted.
In closing, the significant influence of driver behaviour on road safety should not be under-estimated or overlooked. As such, strategies to introduce and expand the presence of limited- and fully-automated vehicles on Canadian roadways must strike a careful balance between incentives and controls to maximize safety.
AUTOMATED VEHICLES | DRIVER KNOWLEDGE, ATTITUDES, & PRACTICESCONCLUSIONS & RECOMMENDATIONS32

APPENDIX A: METHODOLOGY
TIRF developed and conducted an online survey and focus groups to investigate the extent of driver KAP in response to AV technology and SDVs. The survey was administered by Nielsen Opinion Quest, a market research firm, which used an incentive to recruit participants. Focus group participants were also provided an incentive to participate. A total of 2,662 Canadians completed the survey in April 2016 which was fielded by Nielson Opinion Quest. The sample was representative of Canada and used a disproportional stratified (by region) random sample. Jurisdictions were grouped in the following five regions: British Columbia, Prairies, Ontario, Quebec, and the Maritimes. Of note, Ontario was over-sampled to gain a stronger picture of respondents from this region in light of a recent initiative in Ontario to permit the testing of automated vehicles.
The survey contained 87 items from which a smaller set of focus group questions were derived. The majority of survey questions used Likert-type scale where, for example, one indicated strongly disagree or not very likely and six indicated strongly agree or very likely. Respondents could also choose “don’t know” and one question was open-ended. The survey took approximately 30 minutes to complete and the focus groups took approximately two hours. Results of the survey can be considered accurate within ±1.9% using a confidence interval of 95%. Univariate tables from the survey are found in Appendix B. Logistic regression was used to determine if there were associations between certain driver characteristics, such as age, sex, distance traveled, urban/rural, and collisions among others and responses on the survey related to KAP.
To ensure survey respondents had a clear understanding of the different levels of vehicle technology (refer to NHTSA levels described in main paper), respondents were required to read the definitions after the baseline questions were answered and, for the remainder of the survey, respondents could hover their mouse over a vehicle type and a definition would pop up. Focus group participants were read definitions of LSDVs and FSDVs as well as provided a slip of paper with the definitions printed on them for their reference.
To develop the questions, a thorough review of existing research, literature, white papers, studies, polls, surveys, government documents, among other resources were reviewed and key issue areas identified. Some questions were mirrored on other studies of driver KAP (e.g., Osswald et al. 2012; Schoettle & Sivak 2014; Kelkel 2015; KPMG Insurance 2015) in order to help validate results and analyze for consistency in responses. A variety of questions were also developed to probe the extent of driver knowledge, their attitude towards, and their perceptions (or misperceptions) of AV technology and SDVs.
The remainder of questions were developed around different theoretical constructs with respect to driver interactions with vehicles and technology. For instance, a modified version of the Technology Acceptance Model (TAM) (Chan & Teo 2007), the Car Technology Acceptance Model (CTAM) (Osswald et al. 2012), was used to explore perceived ease of use and perceived usefulness of SDV technology in order to investigate what factors may influence driver adoption of LSDVs and FSDVs. The CTAM augments the TAM by including analysis of anxiety while driving (e.g., enjoyment, relaxing, stressful), as well as acknowledges the difference between technology used in the office environment (single task) versus the driving environment (two tasks, the primary task of driving and secondary tasks including interacting with technology). The concept of trust in automation (Muir 1994) was used to develop questions to explore the extent to which drivers would trust SDVs which could explain ways in which they may modify their behaviour in response to new technology. Of particular interest here was to develop questions that would
AUTOMATED VEHICLES | DRIVER KNOWLEDGE, ATTITUDES, & PRACTICES33
APPENDIX A: METHODOLOGY

probe ‘false distrust,’ where drivers do not trust good technology, which could be based on incorrect knowledge and misperceptions. Related to trust, the broader theory of behavioural adaption, in the context of road safety, refers to ways in which drivers negatively modify their behaviour in response to changes in their environment (Cacciabue & Saad 2008; Rudin-Brown & Jamson 2013). Using this theory, questions were developed around different driving scenarios to better understand how drivers may respond to SDV technology, including the potential to misuse the technology.
Limitations
Although part of this study was to analyze the extent of driver knowledge and potential misperceptions about AV technology, other parts of the study required respondents to comment on how they would interact with technology that is not yet available. This required respondents to have some knowledge in order to make predictions about their potential interactions with unknown technology. In order to help reduce the chances of respondents providing a response when they did not know how to answer a question, respondents were provided a “don’t know” option for the majority of questions. This allowed the opportunity to analyze results with and without these respondents. Nonetheless, a few questions revealed that rather than respondents leaning strongly one way or the other (e.g., strongly disagree and strongly agree), responses instead were more frequent around the middle (e.g., somewhat disagree and somewhat agree). This may have occurred because these few questions required drivers to make assumptions about how they would interact with technology that they have limited information about and, thus, did not yet feel strongly one way or the other. As the technology becomes more widely known and available, additional studies could be conducted to determine if there are changes in driver responses.
Focus group participants were aware that they were attending a discussion on automated vehicles; therefore, some participants may have read up on the subject prior to coming to the session. This may have provided them additional information that could have altered their perceptions of AVs; however, only a few participants across all focus groups admitted to having looked into the subject and it did not appear to strongly alter their perceptions.
There were some challenges in recruiting greater numbers of participants for the non-driver focus groups. Additionally, the online survey only included drivers and therefore information provided by non-drivers in this study was limited to focus group participants. There did not appear to be research conducted on the non-driver population and, as such, it was not possible to compare results of this study to other findings. Given the potential that non-drivers may become a future user of FSDVs, future studies may wish to consider including non-drivers as a new group for an AV study.
AUTOMATED VEHICLES | DRIVER KNOWLEDGE, ATTITUDES, & PRACTICESAPPENDIX A: METHODOLOGY34

REFERENCES
Anderson, J.M., Kalra, N., Stanley, K.D., Sorensen, P., Samaras, C. & Oluwatola, O.A. (2016). Autonomous Vehicle Technology: A Guide for Policymakers. Santa Monica, CA: RAND Corporation, 2016. http://www.rand.org/pubs/research_reports/RR443-2.html. Also available in print form.
Artuso, A. (September 17, 2016). When will driverless cars roll into Toronto? Toronto Sun. http://www.torontosun.com/2016/09/17/when-will-driverless-cars-roll-into-toronto
Autocar Pro News Desk. (August 2, 2016). The question of how the driver (in an autonomous car) gains confidence is important. http://www.autocarpro.in/interview/-question-driver-autonomous-car-gains-confidence-21209
Blanco, M., Atwood, J., Russell, S., Trimble, T., McClafferty, J., & Perez, M. (2016). Automated Vehicle Crash Rate Comparison Using Naturalistic Data. Virginia Tech Transportation Institute (VTTI): Blacksburg, VA.
Boudette, N. E. (JUNE 4, 2016). 5 Things That Give Self-Driving Cars Headaches. New York Times. http://www.nytimes.com/interactive/2016/06/06/automobiles/autonomous-cars-problems.html?_r=0
Breuer, J.J., Faulhaber, A., Frank, P., & Gleissner, S. (2007). Real world safety benefits of brake assistance systems. Daimler Chrysler AG, Mercedes Car Group (MCG).
Cacciabue, P. C., & Saad, F. (2008). Behavioural adaptations to driver support systems: a modelling and road safety perspective. Cognition, Technology & Work, 10(1), 31-39.
Carlson, N. (2014). “Google reveals prototype car without pedals, brakes, or steering wheel.” Business Insider. Retrieved from http://www.businessinsider.com/google-reveals-prototype-car-without-pedals-breaks-and-steering-wheel-2014-5. October 2015.
Casualty Actuarial Society Automated Vehicles Task Force (CAS AVTF). (2014). Restating the National Highway Transportation Safety Administration’s National Motor Vehicle Crash Causation Survey for Automated Vehicles. Casualty Actuarial Society (CAS). E-Forum, Fall 2014.
Centre for Accident Research & Road Safety - Queensland (CARRS-Q) (2016). Advanced driving simulator. Retrieved from http://www.carrsq.qut.edu.au/simulator/index.jsp. July 2016. Motor Accident Insurance Commission and Queensland University of Technology.
Chan, H.C., & Teo, H. (2007). Evaluating the boundary conditions of the technology acceptance model: An exploratory investigation. ACM Trans. Comput.-Hum. Interact., 14(2), 9.
Cinder1280 (2014). “Mercedes S Class Active Lane Assist Hack.” Retrieved from https://www.youtube.com/watch?v=Kv9JYqhFV-M. October 2015.
Crazyerics (2013). “Audi A7 - Adaptive Cruise Control in Heavy Traffic “ Retrieved from https://www.youtube.com/watch?v=MKBCGZn3icY. October 2015.
Elmer, S. (2015). “Volvo, Google and Mercedes to accept responsibility in self-driving car collisions.” AutoGuide.com. Retrieved from http://www.autoguide.com/auto-news/2015/10/volvo-google-and-mercedes-to-accept-responsibility-in-self-driving-car-collisions.html. June 2016.
Farmer, C. M. (2010). Effects of Electronic Stability Control on Fatal Crash Risk. Insurance Institute for
AUTOMATED VEHICLES | DRIVER KNOWLEDGE, ATTITUDES, & PRACTICES35
REFERENCES

Highway Safety. Arlington, VA.
Google (2016). Compiled response to November 12, 2015 interpretation request submitted to the National Highway Traffic Safety Administration regarding Federal Motor Vehicle Safety Standards (FMVSSs). – February 4, 2016 final. Retrieved from http://isearch.nhtsa.gov/files/Google%20--%20compiled%20response%20to%2012%20Nov%20%2015%20interp%20request%20--%204%20Feb%2016%20final.htm
Gough, M. (September 9, 2016). Machine smarts: how will pedestrians negotiate with driverless cars? Reuters. https://www.theguardian.com/sustainable-business/2016/sep/09/machine-smarts-how-will-pedestrians-negotiate-with-driverless-cars
Insurance Institute for Highway Safety, “New Estimates of Benefits of Crash Avoidance Features on Passenger Vehicles,” Status Report, Vol. 45, No. 5, May 20, 2010.
Kang, C. (September 19, 2016). Self-Driving Cars Gain Powerful Ally: The Government. New York Times. http://www.nytimes.com/2016/09/20/technology/self-driving-cars-guidelines.html?_r=0
Kelkel, R. (2015). “Predicting consumers’ intention to purchase fully autonomous driving systems – Which factors drive acceptance?”. Universidade Católica Portuguesa. Lisbon, Portugal.
Kovacs, P. (2016). Automated Vehicles: Implications for the Insurance Industry of Canada. The Insurance Institute of Canada: Toronto, ON.
KPMG Insurance. (2015). Marketplace of change: Automobile insurance in the era of autonomous vehicles.
Levy, S. (2016). License to (not) drive. Backchannel. Retrieved from https://backchannel.com/license-to-not-drive-6dbea84b9c45#.6qunb98l0. April 2016.
Miller, J. (2014). Google’s driverless cars designed to exceed speed limit. BBC News. Retrieved from http://www.bbc.com/news/technology-28851996. April 2016.
Ministry of Transportation, Ontario (MTO) (October 13, 2015). Ontario first to test automated vehicles on roads in Canada: Province supports innovation in transportation technology. News release.
Muir, B.M. (1994). Trust in automation: Part I. Theoretical issues in the study of trust and human intervention in automated systems. Ergonomics, 37(11), 1905-1922.
National Association of City Transportation Officials (NACTO) (2016). NACTO Policy Statement on Automated Vehicles. Retrieved from http://nacto.org/2016/06/23/nacto-releases-policy-recommendations-for-automated-vehicles/. August 2016.
Nasr, A., & Johnson, F. (March 2016). “Voters aren’t ready for driverless cars, poll shows.” Morning Consult. Retrieved from https://morningconsult.com/2016/02/08/voters-arent-ready-for-driverless-cars-poll-shows/.
National Highway Traffic Safety Administration (NHTSA) (2008). National Motor Vehicle Crash Causation Survey: Report to Congress. U.S. Department of Transportation (DOT): Springfield, VA.
NHTSA (2010). Human Performance Evaluations of Light Vehicle Brake Assist Systems: Final Report. DOT HS 811 581. U.S. Department of Transportation: Washington, D.C.
NHTSA (2013). “Preliminary statement of policy concerning automated vehicles.” U.S. DOT
NHTSA (2016). Early estimate of motor vehicle traffic fatalities in 2015. Traffic Safety Facts, DOT HS 812
AUTOMATED VEHICLES | DRIVER KNOWLEDGE, ATTITUDES, & PRACTICESREFERENCES36

269. NHTSA National Center for Statistics and Analysis: Washington, DC.
Ni, R., & Leung, J. (n.a.). Safety and Liability of Autonomous Vehicle Technologies. Massachusetts Institute of Technology (MIT): Boston, MA.
Osswald, S., Wurhofer, D., Trösterer, S., Beck, E., & Tscheligi, M. (2012). Predicting information technology usage in the car: Towards a car technology acceptance model. In: Proceedings of the 4th International Conference on Automotive User Interfaces and Interactive Vehicular Applications. ACM: Portsmouth, NH.
Page, Y., Foret-Bruno, J., & Cuny, S. (2005). Are expected and observed effectiveness of emergency brake assist in preventing road injury accidents consistent? Proceedings of the 19th International Technical Conference on Enhanced Safety of Vehicles, Washington, D.C.
Perreault, S. (2013). Impaired driving in Canada; 2011. Canadian Centre for Justice Statistico ISSN 1209-6393. Statistics Canada.
Reimer, B., Mehler, B., & Coughlin, J.F. (2016). Reductions in self-reported stress and anticipatory heart rate with the use of a semi-automated parallel parking system. Applied Ergonomics, 52 (120-127).
Robertson, R. D., Vanlaar, W. G. M., Marcoux, K., & McAteer, H. J. (2012). Vehicle Safety Features: Knowledge, Perceptions, and Driving Habits. Traffic Injury Research Foundation (TIRF): Ottawa, ON.
Rudin-Brown, C.M., Burns, P., Jenkins, R., Whitehead, T., & Leblond, O. (2008). ESC (Electronic Stability Control) Public and Driver Surveys. Transport Canada. Canada, Transport.
Rudin-Brown, C.M., & Jamson, S.L. eds. (2013). Behavioural Adaptation and Road Safety: Theory, Evidence and Action. Boca Raton, FL: Taylor & Francis.
SAE International. (2014). Automated driving: Levels of driving automation are defined in new SAE International Standard J3016. SAE International.
Schoettle, B., & Sivak, M. (2014). A survey of public opinion about autonomous and self-driving vehicles in the US, the UK, and Australia. University of Michigan Transportation Research Institute: Ann Arbor, MI.
Shepardson, D. & Lienert, P. (2016). Exclusive: In boost to self-driving cars, U.S. tells Google computers can qualify as drivers. Retrieved from http://www.reuters.com/article/us-alphabet-autos-selfdriving-exclusive-idUSKCN0VJ00H. February 2016. Reuters.
The Associated Press (2016). Uber to use self-driving cars to haul people in next few weeks. Retrieved from http://www.cbc.ca/news/business/uber-pittsburgh-autonomous-cars-1.3726370. August 2016. CBC News: Business.
Transporation Research Board (TRB) (2015). Automated and Connected Vehicles: Summary of the 9th University Transportation Centers Spotlight Conference. In: Automated and Connected Vehicles. Washington, DC.
Vanlaar, W., Robertson, R., & Marcoux, K. (2014). An evaluation of Winnipeg’s photo enforcement safety program: Results of time series analyses and an intersection camera experiment. Accident Analysis & Prevention, 62, pp. 238-247.
Vanlaar, W., Robertson, R., & Marcoux, K. (2008). The Road Safety Monitor 2007: Excessive Speeding. Traffic Injury Research Foundation (TIRF): Ottawa, ON.
Womack, B. (2015). Google to unleash its self-driving cars on California roads. Bloomberg Technology. Retrieved from http://www.bloomberg.com/news/articles/2015-05-15/google-s-own-self-driving-cars-set-for-public-road-test. April 2016.
AUTOMATED VEHICLES | DRIVER KNOWLEDGE, ATTITUDES, & PRACTICES37
REFERENCES

T R A F F I C I N J U R Y R E S E A R C H F O U N D A T I O N
Traffic Injury Research Foundation (TIRF)
171 Nepean Street, Suite 200
Ottawa, Ontario
Canada K2P 0B4
www.tirf.ca
Toll Free: 1-877-238-5235
Fax: 613-238-5292
Registered Charity No. 10813 5641 RR0001