Automated Quantification of Enlarged Perivascular Spaces ...1T-scanners. Three of them were Siemens...
9
Automated Quantification of Enlarged Perivascular Spaces in Clinical Brain MRI across Sites Florian Dubost 1? , Max D¨ unnwald 2,3? , Denver Huff 2 , Vincent Scheumann 2 , Frank Schreiber 2 , Meike Vernooij 1,5 , Wiro Niessen 1,6 , Martin Skalej 4 , Stefanie Schreiber 2 , Steffen Oeltze-Jafra 2,7?? , and Marleen de Bruijne 1,8?? 1 Department of Radiology & Nuclear Medicine, Erasmus MC, the Netherlands 2 Department of Neurology, Otto-von-Guericke University Magdeburg, Germany 3 Faculty of Computer Science, Otto-von-Guericke University Magdeburg, Germany 4 Department of Neuroradiology, Otto-von-Guericke University Magdeburg, Germany 5 Department of Epidemiology, Erasmus MC, the Netherlands 6 Dept. of Imaging Physics, Faculty of Applied Science, TU Delft, the Netherlands 7 Center for Behavioral Brain Sciences (CBBS), Magdeburg, Germany 8 Department of Computer Science, University of Copenhagen, Denmark Abstract. Enlarged perivascular spaces (PVS) are structural brain changes visible in MRI, and are a marker of cerebral small vessel disease. Most studies use time-consuming and subjective visual scoring to assess these structures. Recently, automated methods to quantify enlarged perivas- cular spaces have been proposed. Most of these methods have been eval- uated only in high resolution scans acquired in controlled research set- tings. We evaluate and compare two recently published automated meth- ods for the quantification of enlarged perivascular spaces in 76 clinical scans acquired from 9 different scanners. Both methods are neural net- works trained on high resolution research scans and are applied without fine-tuning the networks parameters. By adapting the preprocessing of clinical scans, regions of interest similar to those computed from research scans can be processed. The first method estimates only the number of PVS, while the second method estimates simultaneously also a high res- olution attention map that can be used to detect and segment PVS. The Pearson correlations between visual and automated scores of en- larged perivascular spaces were higher with the second method. With this method, in the centrum semiovale, the correlation was similar to the inter-rater agreement, and also similar to the performance in high res- olution research scans. Results were slightly lower than the inter-rater agreement for the hippocampi, and noticeably lower in the basal gan- glia. By computing attention maps, we show that the neural networks focus on the enlarged perivascular spaces. Assessing the burden of said structures in the centrum semiovale with the automated scores reached a satisfying performance, could be implemented in the clinic and, e.g., help predict the bleeding risk related to cerebral amyloid angiopathy. ? equal contribution ?? equal contribution . CC-BY 4.0 International license is made available under a The copyright holder for this preprint (which was not peer-reviewed) is the author/funder. It . https://doi.org/10.1101/738955 doi: bioRxiv preprint
Transcript of Automated Quantification of Enlarged Perivascular Spaces ...1T-scanners. Three of them were Siemens...

Automated Quantification of EnlargedPerivascular Spaces in Clinical Brain MRI across
Sites
Florian Dubost1?, Max Dunnwald2,3?, Denver Huff2, Vincent Scheumann2,Frank Schreiber2, Meike Vernooij1,5, Wiro Niessen1,6, Martin Skalej4, Stefanie
Schreiber2, Steffen Oeltze-Jafra2,7??, and Marleen de Bruijne1,8??
1 Department of Radiology & Nuclear Medicine, Erasmus MC, the Netherlands2 Department of Neurology, Otto-von-Guericke University Magdeburg, Germany
3 Faculty of Computer Science, Otto-von-Guericke University Magdeburg, Germany4 Department of Neuroradiology, Otto-von-Guericke University Magdeburg, Germany
5 Department of Epidemiology, Erasmus MC, the Netherlands6 Dept. of Imaging Physics, Faculty of Applied Science, TU Delft, the Netherlands
7 Center for Behavioral Brain Sciences (CBBS), Magdeburg, Germany8 Department of Computer Science, University of Copenhagen, Denmark
Abstract. Enlarged perivascular spaces (PVS) are structural brain changesvisible in MRI, and are a marker of cerebral small vessel disease. Moststudies use time-consuming and subjective visual scoring to assess thesestructures. Recently, automated methods to quantify enlarged perivas-cular spaces have been proposed. Most of these methods have been eval-uated only in high resolution scans acquired in controlled research set-tings. We evaluate and compare two recently published automated meth-ods for the quantification of enlarged perivascular spaces in 76 clinicalscans acquired from 9 different scanners. Both methods are neural net-works trained on high resolution research scans and are applied withoutfine-tuning the networks parameters. By adapting the preprocessing ofclinical scans, regions of interest similar to those computed from researchscans can be processed. The first method estimates only the number ofPVS, while the second method estimates simultaneously also a high res-olution attention map that can be used to detect and segment PVS.The Pearson correlations between visual and automated scores of en-larged perivascular spaces were higher with the second method. Withthis method, in the centrum semiovale, the correlation was similar to theinter-rater agreement, and also similar to the performance in high res-olution research scans. Results were slightly lower than the inter-rateragreement for the hippocampi, and noticeably lower in the basal gan-glia. By computing attention maps, we show that the neural networksfocus on the enlarged perivascular spaces. Assessing the burden of saidstructures in the centrum semiovale with the automated scores reacheda satisfying performance, could be implemented in the clinic and, e.g.,help predict the bleeding risk related to cerebral amyloid angiopathy.
? equal contribution?? equal contribution
.CC-BY 4.0 International licenseis made available under aThe copyright holder for this preprint (which was not peer-reviewed) is the author/funder. It. https://doi.org/10.1101/738955doi: bioRxiv preprint

2 F. Dubost et al.
Keywords: Perivascular Spaces · Deep learning · clinical MRI.
1 Introduction
Enlarged perivascular spaces (PVS) are structural brain changes visible on MRI.They can be identified as thin hyperintense tubular structures on T2-weightedMRI scans. PVS are increasingly thought to reflect the presence of cerebralsmall vessel disease, which represents a leading cause of cognitive decline andfunctional loss in elderly patients. In most studies, enlarged perivascular spacesare quantified using visual scores that either classify the burden of PVS in sev-eral categories [8], or count PVS [1]. These quantification methods are tediousand observer-dependent. Recently, several methods have been proposed to auto-matically quantify PVS burden [2, 4–6, 10, 13]. None of these methods have beenevaluated in clinical scans, which present multiple challenges for the quantifi-cation of PVS. While in research studies, the scanning is highly standardized(same machine, same protocol, same scanning parameters, same investigators,etc.) to yield comparable results, this is not the case in clinical routine. Thelower resolution of clinical scans also results in the computation of less accurateshape features, the most discriminative feature for the detection of PVS. More-over, other MRI markers related to cerebral small vessel disease – such as whitematter hyperintensities – are more prevalent in clinical scans than in popula-tion studies [5, 6, 4, 2] and could be confused with PVS because of their similarappearance.
In most studies, PVS are quantified separately in one or several clinically andepidemiologically relevant brain regions: midbrain, hippocampi, thalamus, basalganglia, and centrum semiovale. In PVS research, the centrum semiovale is themost studied region, as PVS burden there has been most strongly associated topotential determinants of PVS and outcomes thereof. The centrum semiovale isalso often the region with highest inter-observer agreement in the visual scoringof PVS [1]. In this study, we quantified PVS in the hippocampi, basal ganglia,and centrum semiovale.
Zhang et al. [13] automatically quantified PVS on 7T MRI scans. Boespfluget al. [2] proposed an automated quantification method combining image in-tensities and morphologic features from several MRI sequences. They evaluatedtheir method in the centrum semiovale in research scans. Sudre et al. [10] pro-posed to use recurrent neural networks to detect PVS and lacunar infarcts in 16subjects of a longitudinal study investigating the relationship between cardio-vascular risk factors and brain health. Van Wijnen et al. [11] regressed intensitydistance maps of PVS in the centrum semiovale using neural networks. Recently,Dubost et al. [4] proposed to quantify PVS burden in four brain regions – mid-brain, hippocampi, basal ganglia, and centrum semiovale – with neural networkregressors trained with image level labels: the count of PVS in the target brainregion. In research scans, the authors showed that they could reach a correlationbetween visual scores and automated scores similar to that of the inter-observeragreement in each region. They also found that associations between 20 deter-
.CC-BY 4.0 International licenseis made available under aThe copyright holder for this preprint (which was not peer-reviewed) is the author/funder. It. https://doi.org/10.1101/738955doi: bioRxiv preprint

Automated Quantification of Perivascular Spaces in Clinical MRI 3
minants of PVS and visual PVS scores, and between the same determinants andautomated PVS scores, were similar. The same authors [5] proposed to use amore advanced model (GP-Unet) for weakly supervised detection of enlargedperivascular spaces. This method estimates simultaneously the number of PVSand a high resolution attention map that can be used to detect and segmentPVS. We decided to study the methods of Dubost et al. [4, 5] as the validationexperiments with associations with clinical variables already brought them onestep ahead of other methods for the application to clinical practice.
In this article, we applied and compared the two methods of Dubost et al. [4,5] on 76 clincial MRI scans with a varying, low resolution acquired in the clinicalroutine of a hospital using nine different scanners and different protocols, whileusing models weights learned from high-resolution population study MRI scansacquired at another hospital in a highly controlled and standardized setting usinga single scanner and protocol. The networks were not fine-tuned to the clinicaldata. For preprocessing, we used FSL packages instead of FreeSurfer parcellationsof [4, 5] to segment the regions of interest. Finally, we show examples of attentionmaps of GP-Unet.
2 Datasets
Training data. The training data consists of 1600 T2-weighted MRI scans from1600 elderly participants in a population study: the Rotterdam Study [7]. Scanswere acquired on a single 1.5T GE scanner, in a highly controlled and stan-dardized setting. The scan resolution was 0.5x0.5x0.8 mm3. PVS were visuallyscored by a single rater in all scans in the hippocampi, basal ganglia and centrumsemiovale, following the guidelines of Adams et al. [1].
Evaluation data. The MRI data used for evaluation were gathered retrospec-tively from the Picture Archiving and Communication System (PACS) of Uni-versity Hospital Magdeburg. MRI scans with visible signs of cerebral small vesseldisease were selected. All selected patients had cerebral microangiopathy, andwere diagnosed with at least one of the following: ischemic (i.e. lacunar) stroke ortransient ischemic attack, spontaneous intracerebral hemorrhage, dementia (i.e.Alzheimers disease or vascular dementia), and epileptic seizures. Initially, 100acquisitions from 100 different patients were collected. 24 Scans were excludedfrom the experiments either because FSL segmentation of the brain structures
Table 1. Characteristics of the clinical dataset (minimum, maximum, mean and stan-dard deviation)
min max mean std
Patient age (years) 35 89 71.39 9.32In-plane (axial) resolution (mm2) 0.39 0.68 0.45 0.04Resolution in z (mm) 3.30 7 4.94 0.89Spacing between slices (mm) 0.60 6.60 4.73 1.04
.CC-BY 4.0 International licenseis made available under aThe copyright holder for this preprint (which was not peer-reviewed) is the author/funder. It. https://doi.org/10.1101/738955doi: bioRxiv preprint

4 F. Dubost et al.
failed or because scans could not be rated visually, e.g. due to insufficient im-age quality caused by motion artifacts or presence of other pathologies such asextremely large lesions. This leaves a total of 76 scans for the study. Since theacquisitions have been obtained during the clinical routine, they present a con-siderable variance with respect to various image properties such as artifacts orimage resolution. T1-weighted and T2-weighted MRI scans have been acquiredwith 9 different scanners. Two of these scanners, a 3T and a 1.5T from Philips,make up 66 of the 76 images. In total, there are three 3T-, four 1.5T- and two1T-scanners. Three of them were Siemens (two 3T, one 1.5T), the rest werePhilips machines. The time frame in which the data was acquired is almost 15years and ranges from August 2004 until March 2019. The majority of the scans(43) has been acquired within the last 5 years of this period. The number of maleand female patients was 46 and 30, respectively. Table 1 provides additional in-formation about the data set. PVS were scored visually in the hippocampi, basalganglia and centrum semiovale following the guidelines of Adams et al. [1]. Tworaters scored PVS, the inter-rater agreement is reported in Table 2.
3 Methods
The target brain regions (hippocampi, basal ganglia, and centrum semiovale) arefirst segmented, masked and cropped. The result is then processed by trainedconvolutional neural networks that predict the count of PVS in each region. Theneural networks were trained with high resolution MRI scans of a populationstudy, but were used to predict PVS count in routine clinical scans of a hospital.The study was approved by the local ethics committee (No 28/16).
3.1 Preprocessing
To match the resolution of scans in the training set, all clinical scans were linearlyinterpolated to a resolution of 0.5x0.5x0.8 mm3.
Dubost et al. [4] used FreeSurfer parcellations to segment brain regions.FreeSurfer brain parcellation lasts usually several hours, which may prevent itsuse in clinical routine. In this study, we used instead FIRST and FAST algo-rithms from the FSL package [9] to segment brain regions from the T1 sequencein a matter of minutes. FIRST could compute segmentation of the basal gangliaand hippocampi. FAST was used to segment the white matter for the centrumsemiovale region. Dubost et al. [4] also evaluated their method in the midbrain.As midbrain segmentation is not implemented in FSL, this region was excludedfrom the study. The T1 sequence was then rigidly registered to the T2 sequenceusing FSL FLIRT, and the segmentation labels were propagated from the T1space to the T2 space.
Following the guidelines of Adams et al. [1] for visual scoring of PVS, Dubostet al. [4] quantified PVS in the centrum semiovale in the neighborhood of the slicelocated 1 cm above the top of the lateral ventricles. As FSL does not compute
.CC-BY 4.0 International licenseis made available under aThe copyright holder for this preprint (which was not peer-reviewed) is the author/funder. It. https://doi.org/10.1101/738955doi: bioRxiv preprint

Automated Quantification of Perivascular Spaces in Clinical MRI 5
CentrumSemiovale
Basal Ganglia
Hippocampi
R1 GP-Unet R1 CNN R1 R2 CNN GP-Unet
Fig. 1. Comparison between visual and automated PVS scores. The differentcolors represent different scanners. The visual PVS scores of the first rater (R1), on thex-axis, are compared with the predictions of GP-Unet, CNN, and with the visual scoresof the second rater (R2), on the y-axis. In the right column we plotted the automatedPVS scores of GP-Unet versus those of CNN.
ventricle segmentation, we used instead the segmentation of the basal ganglia asapproximation, and selected the slice 1 cm above the top of the caudate nucleus.
The following preprocessing steps were computed exactly as described byDubost et al. [4]. Namely, the segmentation masks were dilated, convolved witha gaussian kernel to smooth the border of the mask, and multiplied pixelwise withthe T2 intensities. The masked regions were then cropped, normalized between0 and 1 using the minimum and maximum intensity values in the masked region,and given as input to the neural networks.
3.2 Neural Networks
The preprocessed images were given as input to two different types of neuralnetworks proposed for automated PVS quantification: (1) a neural network withfour convolutional layers and a max-pooling layer which outputs the number ofPVS in a region [4] and that we call CNN, and (2) GP-Unet, a similar neuralnetwork proposed by the same authors [5], in which the downsampling path isfollowed by an upsampling path to enable weakly supervised detection of PVS.Networks of both methods were trained with only image-level labels.
Attention maps of GP-Unet were computed to visualize the focus of thenetworks using a linear combination of the feature maps of the last convolutionallayer, as described by Dubost et al. [5].
4 Results and Discussion
Table 2 shows the Pearson correlation, and Table 3 the mean absolute error,between visual and automated PVS scores for each region and for each method,
.CC-BY 4.0 International licenseis made available under aThe copyright holder for this preprint (which was not peer-reviewed) is the author/funder. It. https://doi.org/10.1101/738955doi: bioRxiv preprint
6 F. Dubost et al.
and the corresponding inter-rater agreement. Scatter-plots are shown in Figure1. Attention maps of GP-Unet are displayed for each region in Figure 2.
There was no noticeable difference in the computation of the regions of in-terest when using FSL masks instead FreeSurfer masks, but the interpolationto 0.5x0.5x0.8 mm3 was needed to reuse the networks optimized on high res-olution scans. The visual PVS scores were highly correlated to the automatedPVS scores of GP-Unet in the centrum semiovale (0.78 Pearson correlation),were moderately correlated in the hippocampi (0.52), and a lower correlation inthe basal ganglia (0.28). Attention maps of GP-Unet (Figure 2) show that, asexpected, the method focuses on perivascular spaces.
While on research scans, CNN and GP-Unet reached a similar performance inall regions, our experiments on clinical scans show that the correlation betweenvisual PVS scores and automated PVS scores of GP-Unet was significantly higherthan that of visual PVS scores and automated scores of CNN in the centrumsemiovale (Williams’ test, p-value < 0.0001) and in the hippocampi (p-value <0.05). Contrary to CNN, GP-Unet combines features of different scales via skipconnections, which may have assisted the computation of discriminative shapefeatures, and improved the detection of single PVS, as opposed to detecting –or missing because of their too large size – a cluster of PVS without being ableto individually count them.
The correlation in the basal ganglia (0.31 for GP-Unet) is lower than in theother regions and is notably lower than the inter-rater agreement (0.56). Atten-tion maps (Figure 2) show that the network only detects the largest PVS in thebasal ganglia, and misses less enlarged PVS. The scatter-plots (Figure 1) seemto confirm this observation: in the basal ganglia, the networks underestimate thenumber of PVS, and predict similarly low numbers of PVS for all scans.
Table 2 shows lower inter-rater agreement for the basal ganglia than for theother regions. This might be a consequence of PVS being visually rated only ina single slice in this region [1]. The low resolution of clinical scans in z directionmight cause a large variability in the selection of this slice, which might nega-tively influence the reproducibility of the visual rating. The automated methodsquantify PVS in the complete volume of the basal ganglia, which was previouslyshown to be more reproducible than the visual PVS scores [6]. Interestingly, theautomated PVS scores of both methods – CNN and GP-Unet – are highly cor-
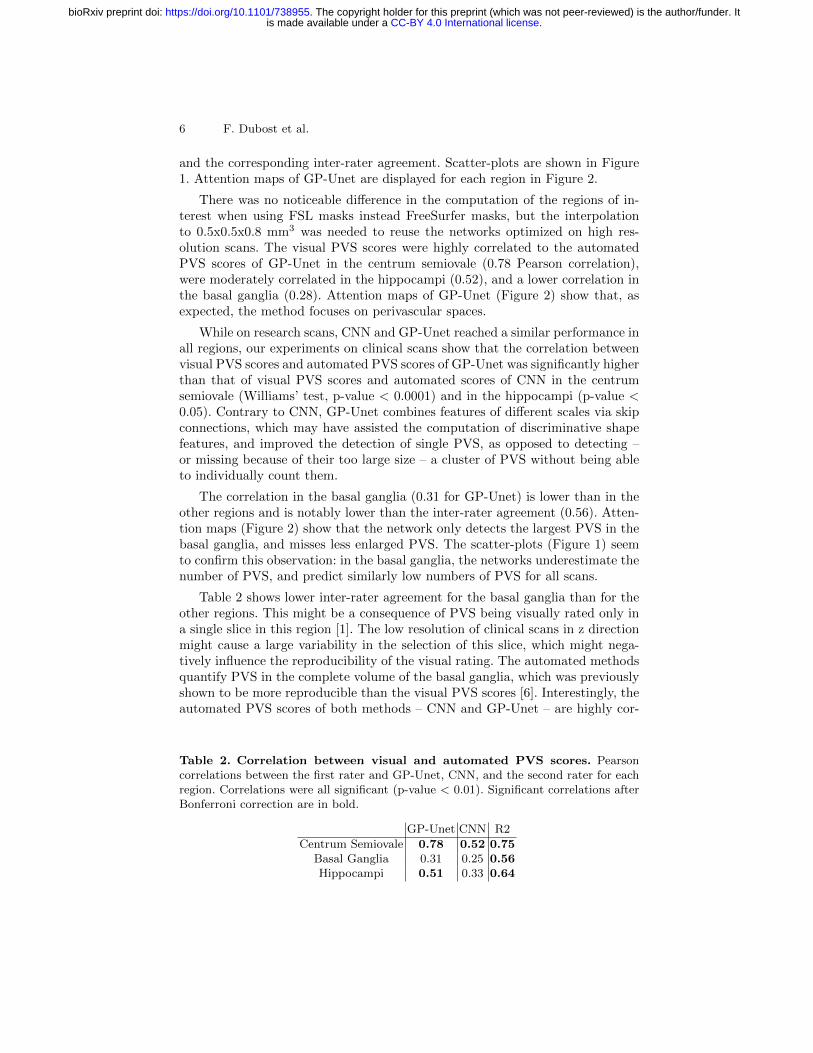
Table 2. Correlation between visual and automated PVS scores. Pearsoncorrelations between the first rater and GP-Unet, CNN, and the second rater for eachregion. Correlations were all significant (p-value < 0.01). Significant correlations afterBonferroni correction are in bold.
GP-Unet CNN R2
Centrum Semiovale 0.78 0.52 0.75Basal Ganglia 0.31 0.25 0.56Hippocampi 0.51 0.33 0.64
.CC-BY 4.0 International licenseis made available under aThe copyright holder for this preprint (which was not peer-reviewed) is the author/funder. It. https://doi.org/10.1101/738955doi: bioRxiv preprint

Automated Quantification of Perivascular Spaces in Clinical MRI 7
17
16
8
9
7
9
Fig. 2. Attention Maps of GP-Unet in an axial view. Attention maps for thecentrum semiovale are displayed on the left, for the basal ganglia on the top right, andfor hippocampi, on the bottom right. Visual scores are indicated below each region.For each selected image, from left to right, we show the original image, the attentionmap with drawn contours of the region, and the overlay of both. The colormaps ofthe attention maps were manually adjusted for each image. Highlighted structuresare considered as PVS by the networks. The redder a structure is, the higher is itsweight in the computation of the automated PVS scores by the network. For thecentrum semiovale, we selected two images that correspond to an average agreementbetween automated and visual score (human rater R1). For the basal ganglia andhippocampi, we selected one image with poor agreement (top), and another imagewith good agreement (bottom).
related in the basal ganglia (0.73 Pearson correlation). The correlation betweentheir scores was higher in the basal ganglia than in other regions.
Results in the centrum semiovale (0.78 Pearson correlation) are similar tothe inter-rater agreement (0.75). This is also close to the inter-rater agreement(0.80 intraclass correlation coefficient) as reported in earlier studies in high res-olution research scans [1]. Demonstrated quantification of PVS burden in thecentrum semiovale could aid in the better stratification of cerebral small vesseldisease subtypes, i.e. hypertensive arteriopathy and cerebral amyloid angiopa-thy, especially in large and hospital-based cohorts. This would presumably have
Table 3. Mean absolute errors between visual and automated PVS scores.Mean absolute error between the first rater and GP-Unet, CNN, and the second raterfor each region.
GP-Unet CNN R2
Centrum Semiovale 5.58 6.39 4.67Basal Ganglia 5.67 5.49 3.78Hippocampi 2.58 3.0 2.08
.CC-BY 4.0 International licenseis made available under aThe copyright holder for this preprint (which was not peer-reviewed) is the author/funder. It. https://doi.org/10.1101/738955doi: bioRxiv preprint
8 F. Dubost et al.
important therapeutic and prognostic implications in terms of prescribing oralanticoagulants and preventing intracerebral hemorrhage. This is of particularimportance in cerebral amyloid angiopathy, that has not only been related tosevere PVS burden in the centrum semiovale [3], but also to a significantly higherrisk for intracerebral bleeding in face of oral anticoagulant treatment. [12].
In future work, the results in the basal ganglia and the hippocampi maybe improved by fine-tuning the neural networks using the clinical dataset, andby adding data augmentation during training with research scans to imitatethe resolution of clinical scans and contrast variations between different scanprotocols or scanners. The results presented are already promising consideringthe large differences between training and test sets.
The complete computation of the automated PVS scores lasts only a fewminutes on CPU. Most of the computation time is spent on FSL brain structuressegmentation and registration from the T1-weighted scans to the T2-weightedscans. After this preprocessing, the computation of the automated PVS scorestook only about 6 seconds per brain region on CPU. This low computation timecan facilitate the implementation of such a method in clinical practice.
5 Conclusion
We showed that PVS burden could be automatically quantified in the centrumsemiovale in clinical scans, with an agreement with visual scores that was similarto the inter-observer agreement. Automated PVS scores were computed with aneural network that was trained high-quality research scans and with only globallabels of PVS burden. These results could contribute to bringing automated PVSquantification to the clinic and guide the administration of anti-coagulant drugs.
Acknowledgements
This work received funding from the Netherlands Organisation for Health Re-search and Development (ZonMw - Project 104003005) and the federal state ofSaxony-Anhalt, Germany (Project I 88).
References
1. Adams, H.H. et al., 2013. Rating method for dilated Virchow-Robin spaces on mag-netic resonance imaging. Stroke, 44(6), pp.1732-1735.
2. Boespflug, E.L. et al., 2017. MR imaging-based multimodal autoidentification ofperivascular spaces (mMAPS): automated morphologic segmentation of enlargedperivascular spaces at clinical field strength. Radiology, 286(2), pp.632-642.
3. Charidimou, A. et al., 2017. MRI-visible perivascular spaces in cerebral amyloidangiopathy and hypertensive arteriopathy. Neurology, 88(12), pp.1157-1164.
4. Dubost, F. et al., 2019. Enlarged perivascular spaces in brain MRI: Automatedquantification in four regions. NeuroImage, 185, pp.534-544.
.CC-BY 4.0 International licenseis made available under aThe copyright holder for this preprint (which was not peer-reviewed) is the author/funder. It. https://doi.org/10.1101/738955doi: bioRxiv preprint

Automated Quantification of Perivascular Spaces in Clinical MRI 9
5. Dubost, F. et al., 2019. Weakly Supervised Object Detection with 2D and 3D Re-gression Neural Networks. arXiv preprint arXiv:1906.01891.
6. Dubost, F. et al., 2019. 3D regression neural network for the quantification of en-larged perivascular spaces in brain MRI. Medical image analysis, 51, pp.89-100.
7. Ikram, M.A. et al., 2017. The Rotterdam Study: 2018 update on objectives, designand main results. European journal of epidemiology, 32(9), pp.807-850.
8. Potter, G.M. et al., 2015. Cerebral perivascular spaces visible on magnetic reso-nance imaging: development of a qualitative rating scale and its observer reliability.Cerebrovascular diseases, 39(3-4), pp.224-231.
9. Smith, S.M. et al., 2004. Advances in functional and structural MR image analysisand implementation as FSL. Neuroimage, 23, pp.S208-S219.
10. Sudre, C.H. et al., 2018. 3D multirater RCNN for multimodal multiclass detectionand characterisation of extremely small objects. MIDL 2019.
11. van Wijnen, K.M. et al., 2019. Automated Lesion Detection by RegressingIntensity-Based Distance with a Neural Network. MICCAI 2019.
12. Wilson, D. et al., 2018. Cerebral microbleeds and intracranial haemorrhage risk inpatients anticoagulated for atrial fibrillation after acute ischaemic stroke or transientischaemic attack (CROMIS-2): a multicentre observational cohort study. The LancetNeurology, 17(6), pp.539-547.
13. Zhang, J. et al., 2016. Segmentation of perivascular spaces using vascular featuresand structured random forest from 7T MR image. In International Workshop onMachine Learning in Medical Imaging. Springer, Cham, pp.61-68.
.CC-BY 4.0 International licenseis made available under aThe copyright holder for this preprint (which was not peer-reviewed) is the author/funder. It. https://doi.org/10.1101/738955doi: bioRxiv preprint