Interpreting Automated Perimetry __b_Thomas Ravi, George Ronn..
Upload
reynard-turnerCategory
view
220download
0
AUTOMATED PERIMETRYAUTOMATED PERIMETRY
..or....or..What do all those dots and What do all those dots and numbers mean?numbers mean?
Jason J S BartonJason J S Barton
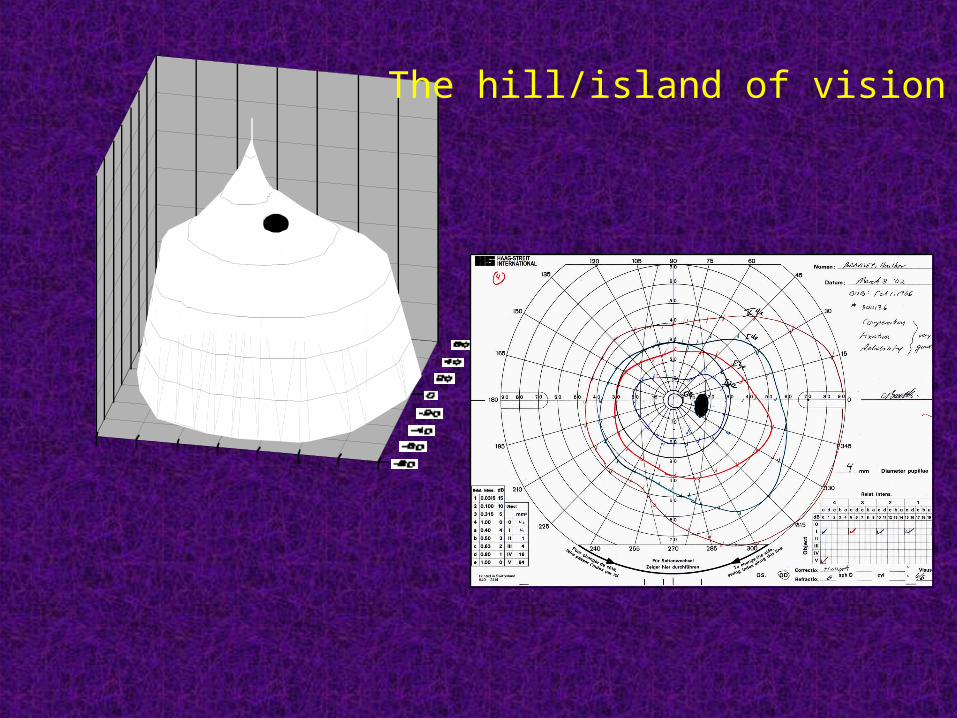
The hill/island of vision
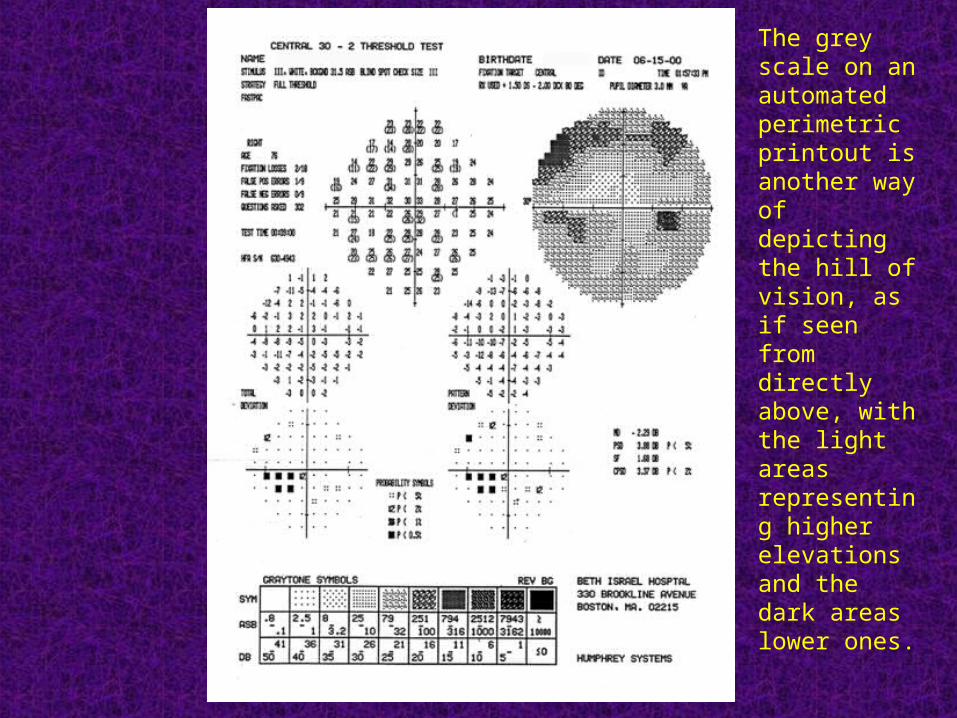
The grey scale on an automated perimetric printout is another way of depicting the hill of vision, as if seen from directly above, with the light areas representing higher elevations and the dark areas lower ones.
• Grid of points tested - sampling, not covering all field
• Trade-off - can’t cover the whole field in detail in a reasonable time, so we compromise:
test lots of the field crudely
test a bit of it extensively
**90% of neurons in the central 30 degrees**
• Garbage in- garbage out
• Differential light sensitivity
1. Strategy used:Screening program - is there a problem?Threshold program - how low can you go?
2. Area tested:Screening program
Full-field 120 point (60 degrees)Threshold program
30-2 24-210-2 macula
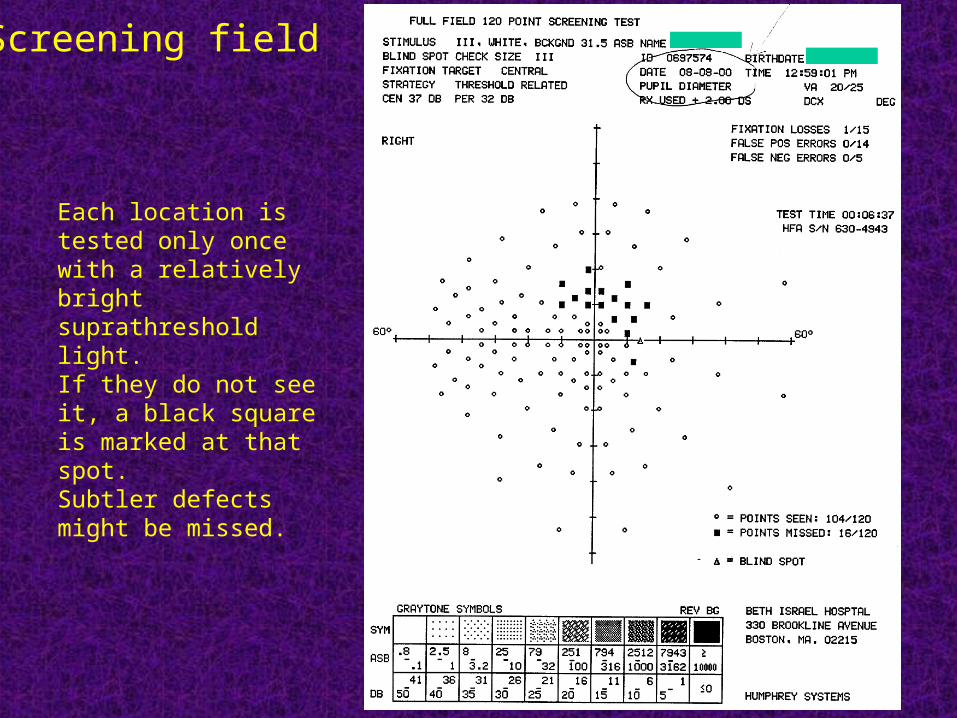
Screening field
Each location is tested only once with a relatively bright suprathreshold light.If they do not see it, a black square is marked at that spot.Subtler defects might be missed.
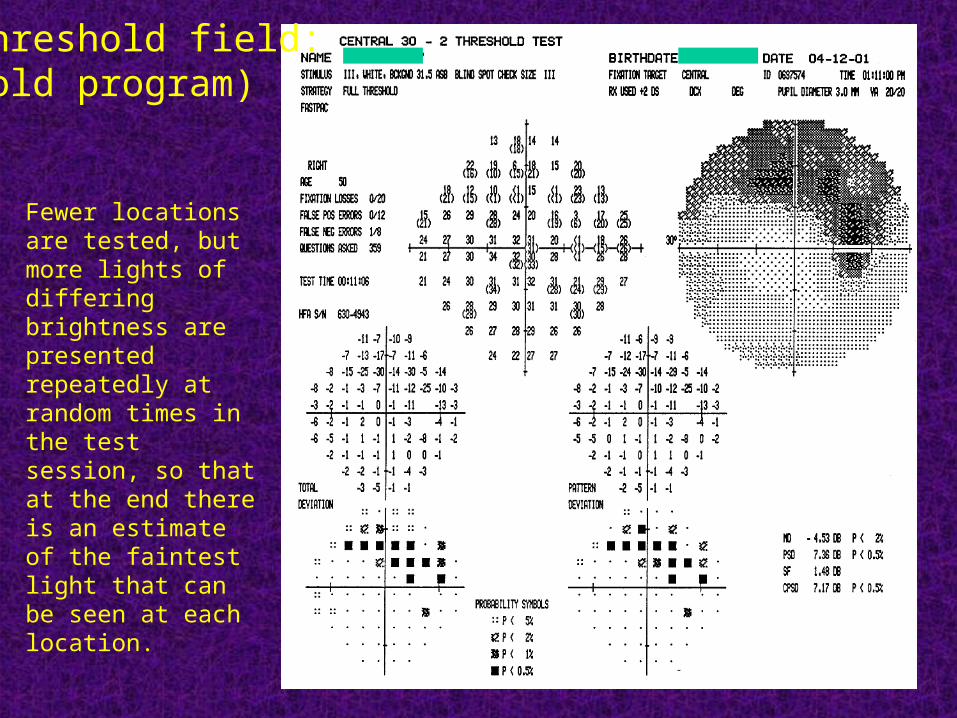
Threshold field:(old program)
Fewer locations are tested, but more lights of differing brightness are presented repeatedly at random times in the test session, so that at the end there is an estimate of the faintest light that can be seen at each location.
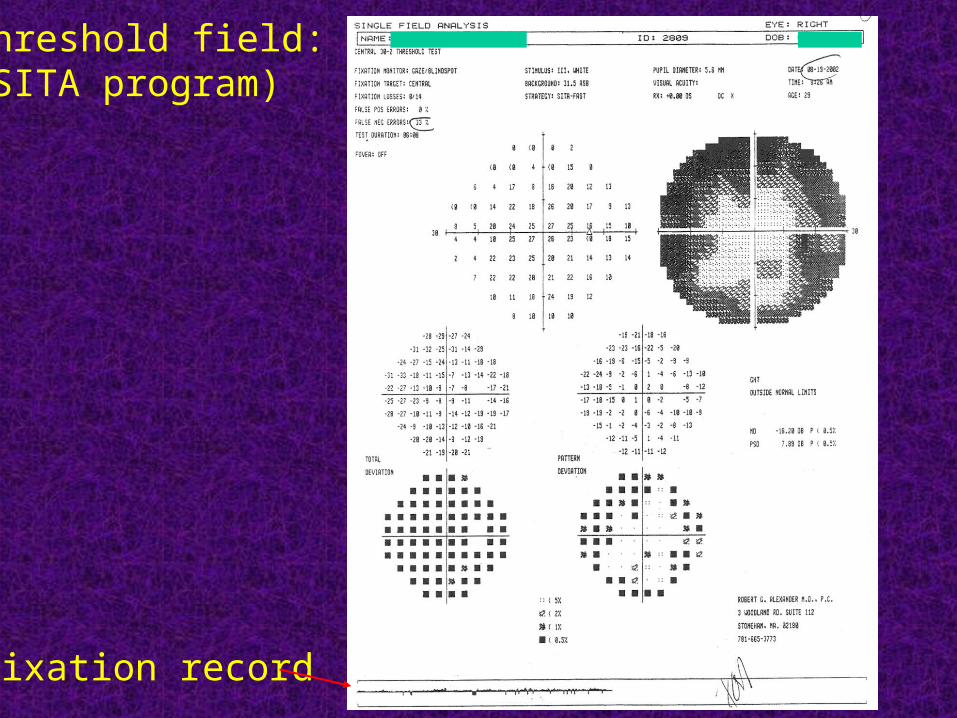
Threshold field:(SITA program)
Fixation record
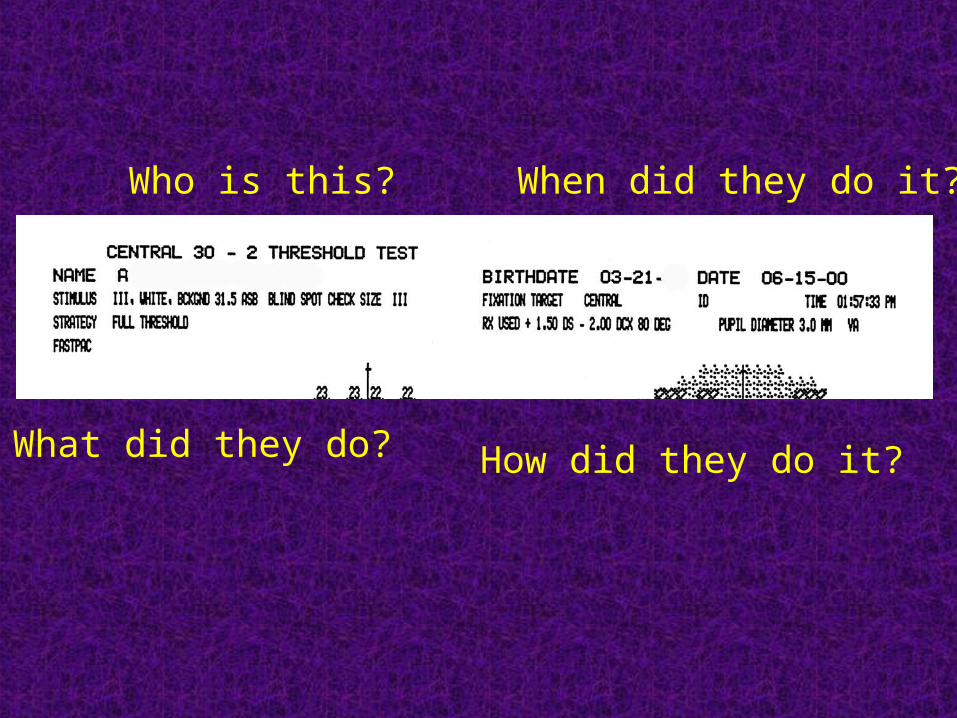
What did they do? How did they do it?
Who is this? When did they do it?
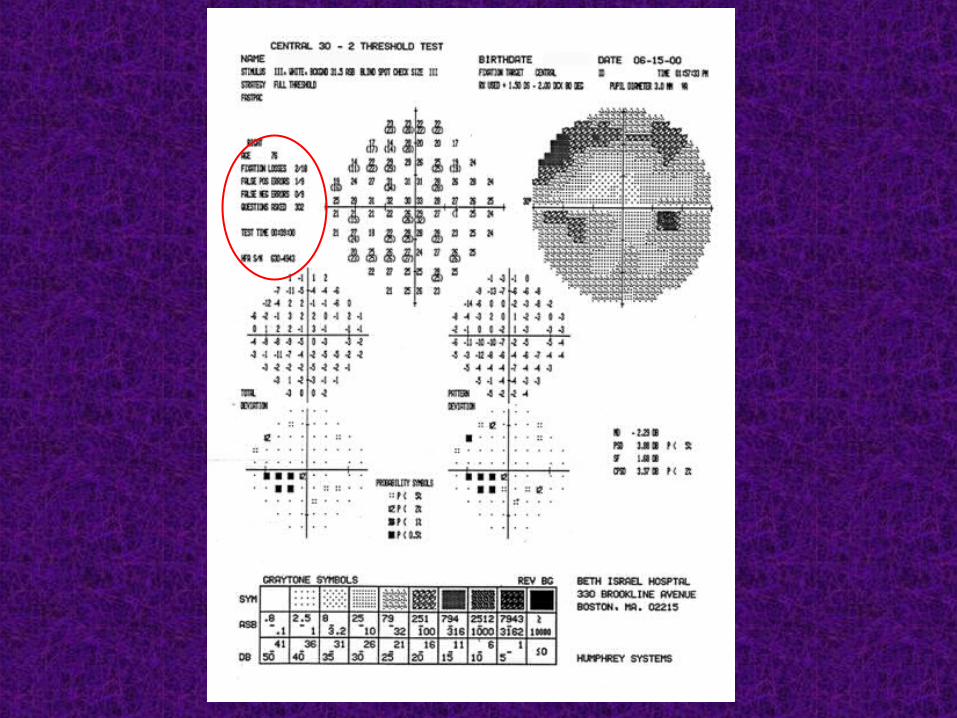
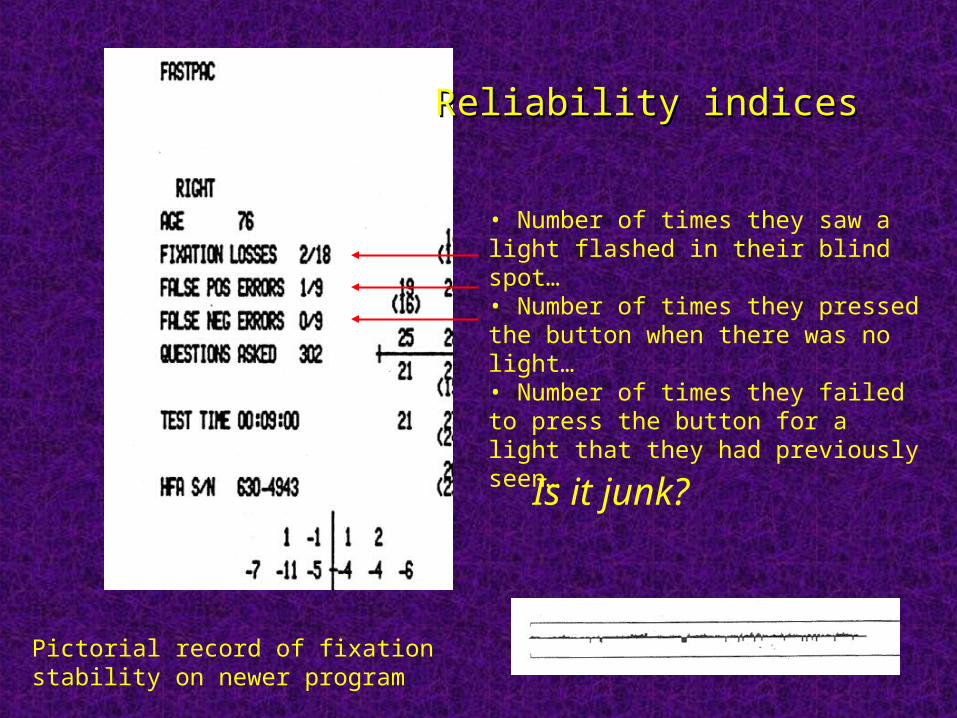
Reliability indicesReliability indices
Is it junk?
• Number of times they saw a light flashed in their blind spot…• Number of times they pressed the button when there was no light…• Number of times they failed to press the button for a light that they had previously seen…
Pictorial record of fixation stability on newer program
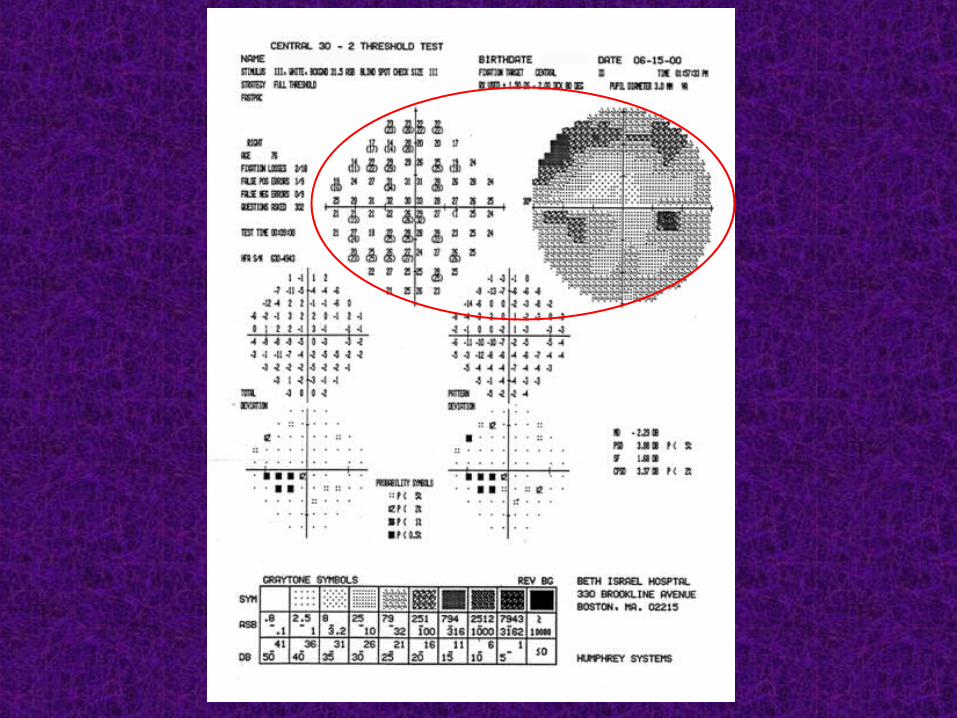
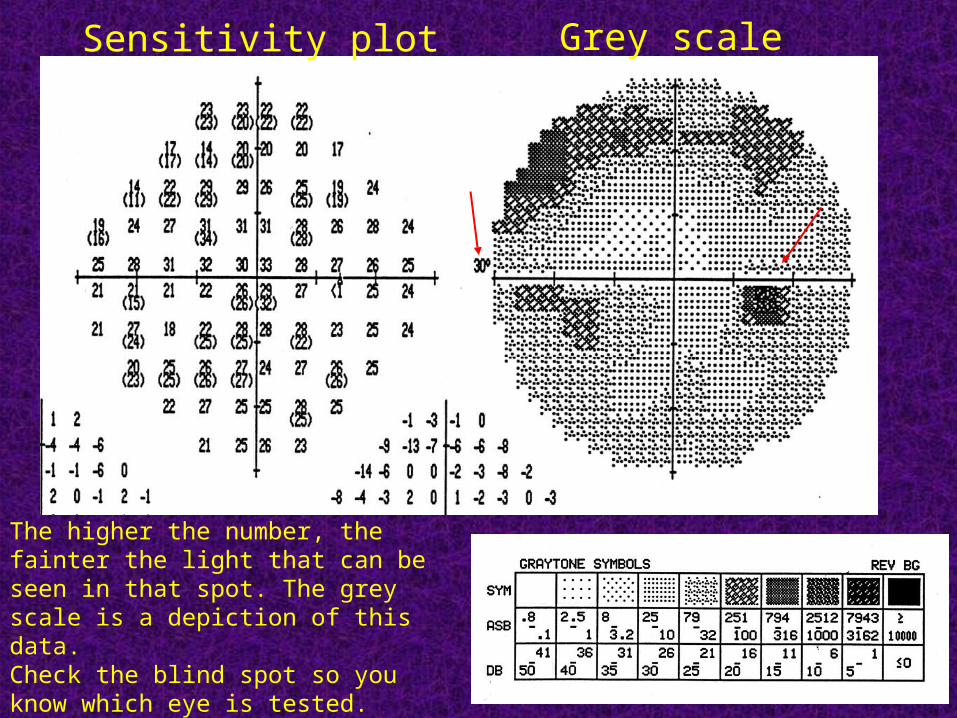
Grey scaleSensitivity plot
The higher the number, the fainter the light that can be seen in that spot. The grey scale is a depiction of this data.Check the blind spot so you know which eye is tested. Check the number so you know how much field is tested.
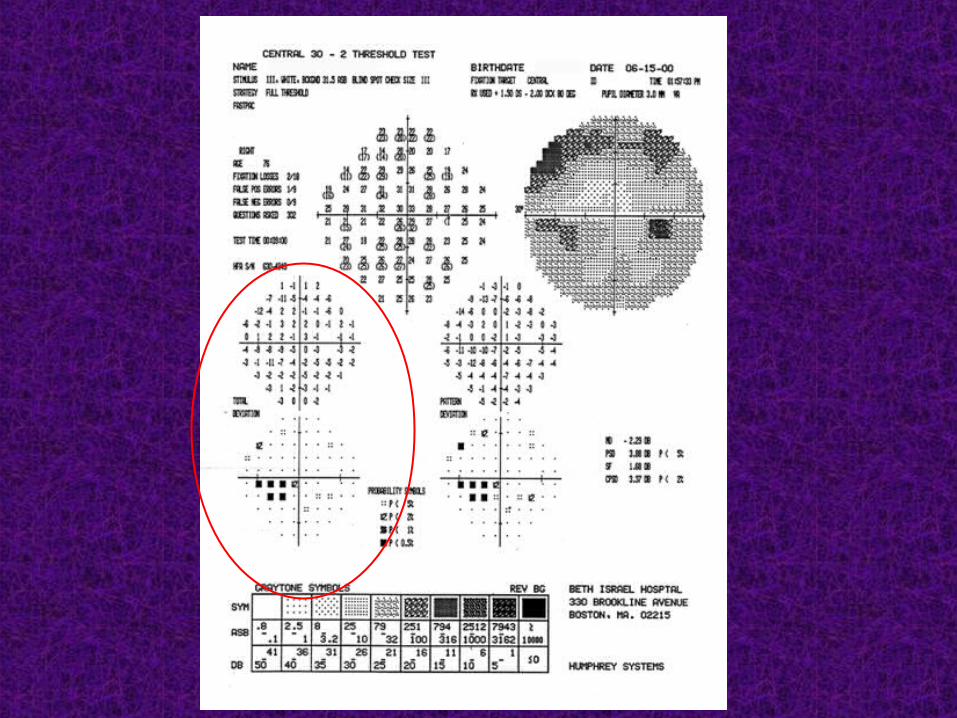
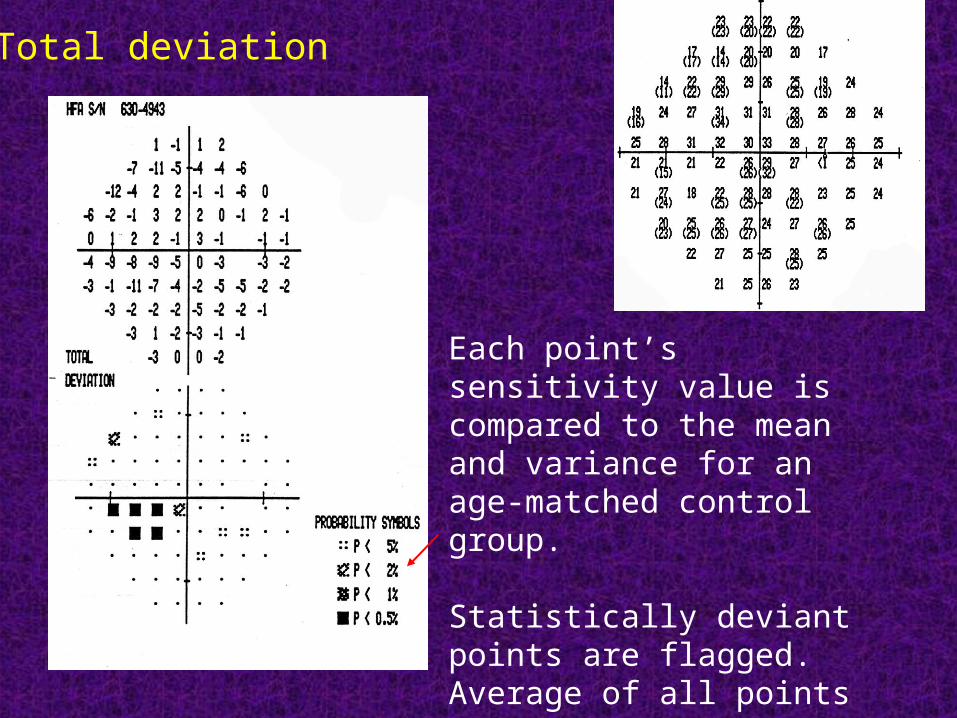
Total deviation
Each point’s sensitivity value is compared to the mean and variance for an age-matched control group.
Statistically deviant points are flagged.Average of all points is the mean deviation (MD).
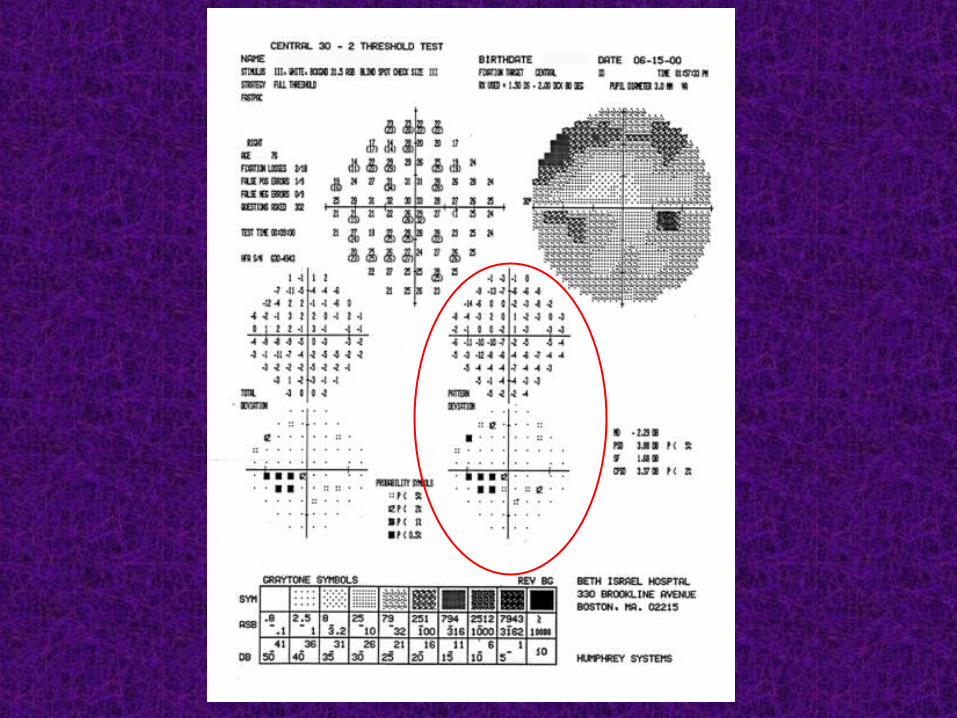
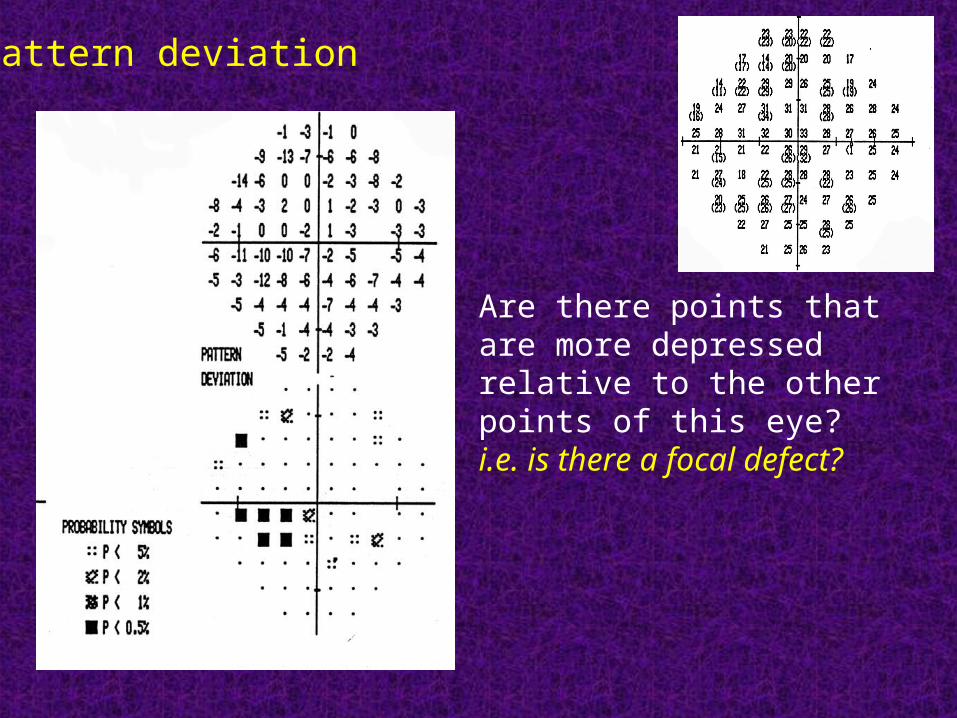
Pattern deviation
Are there points that are more depressed relative to the other points of this eye?i.e. is there a focal defect?
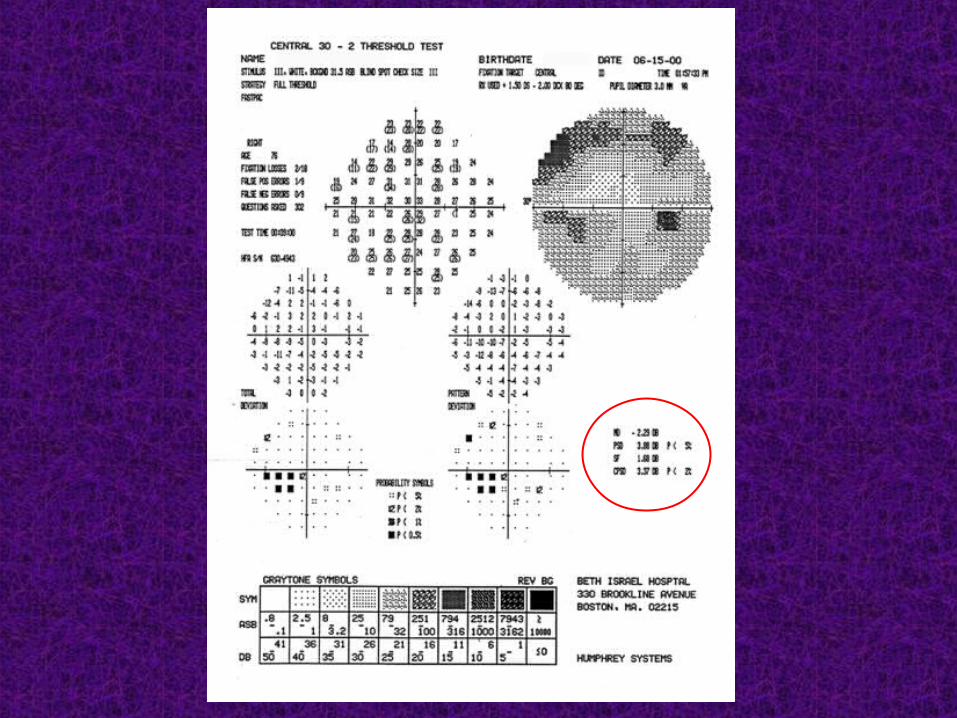
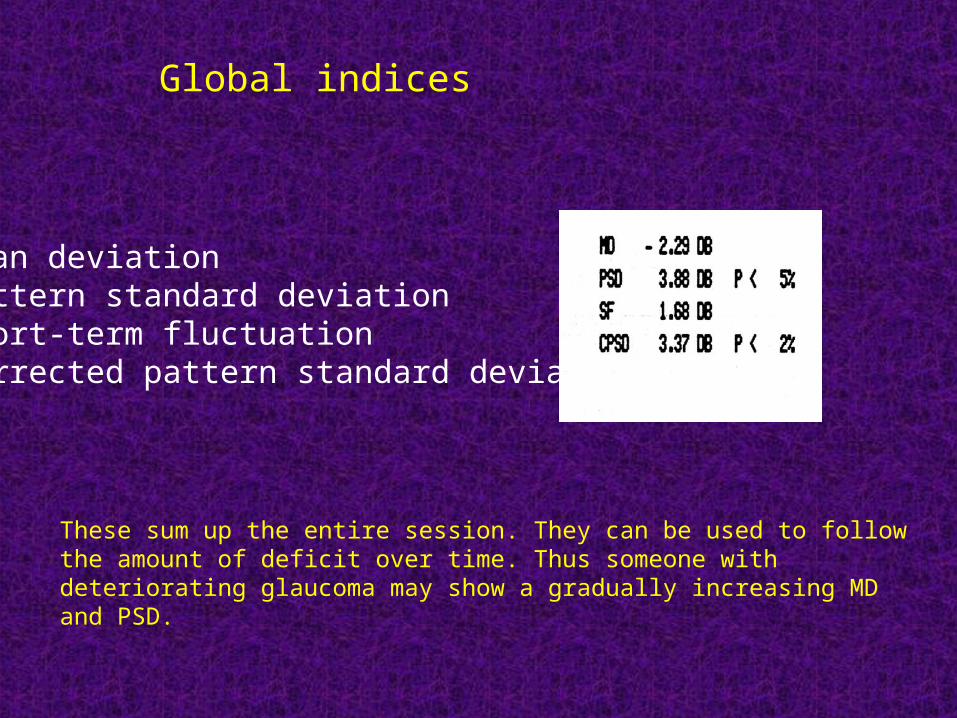
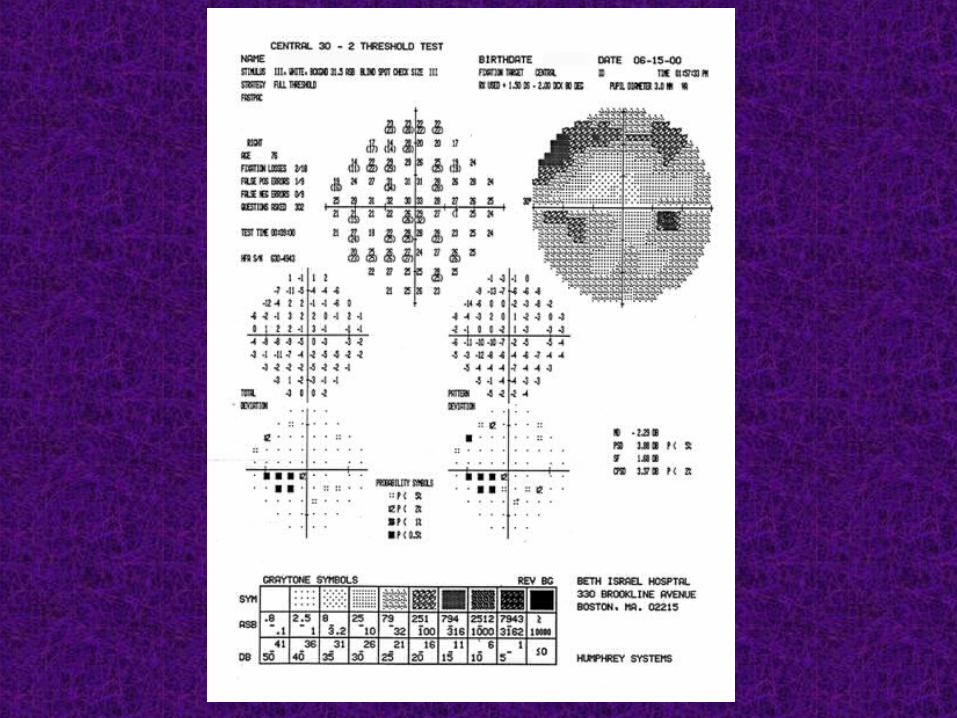
Global indices
Mean deviationPattern standard deviationShort-term fluctuationCorrected pattern standard deviation
These sum up the entire session. They can be used to follow the amount of deficit over time. Thus someone with deteriorating glaucoma may show a gradually increasing MD and PSD.
Reading the plot:
1. Reject trash.the 3Fs: FL, FP, FN
2. Recognize artifact.a. positive responder biasb. negative responder biasc. lens holder artifact d. lid artifact
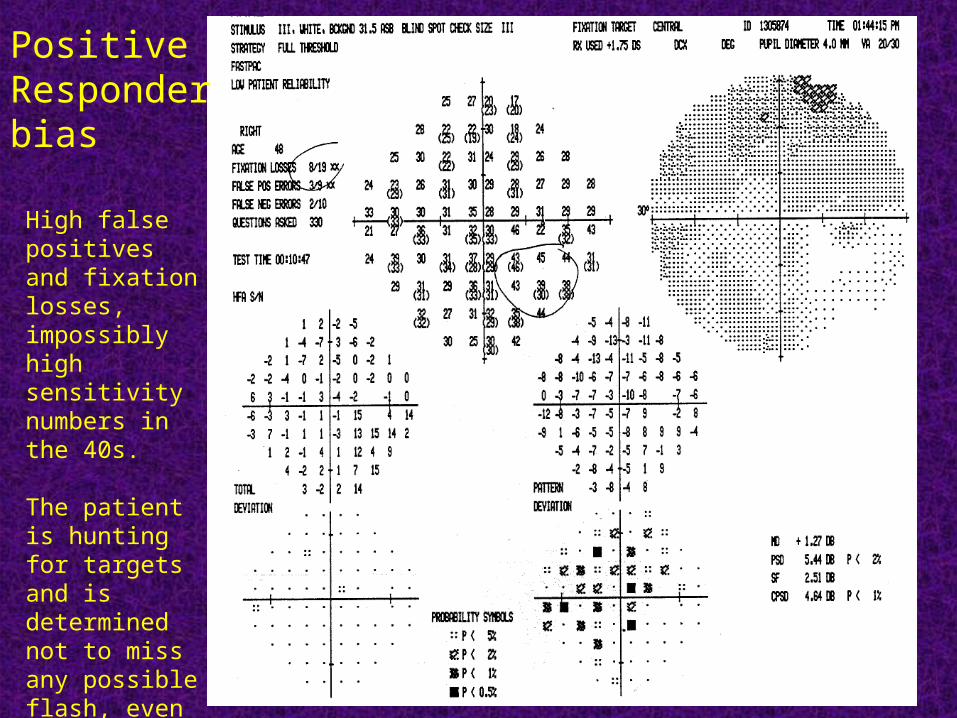
PositiveResponderbias
High false positives and fixation losses, impossibly high sensitivity numbers in the 40s.
The patient is hunting for targets and is determined not to miss any possible flash, even if there wasn’t one!
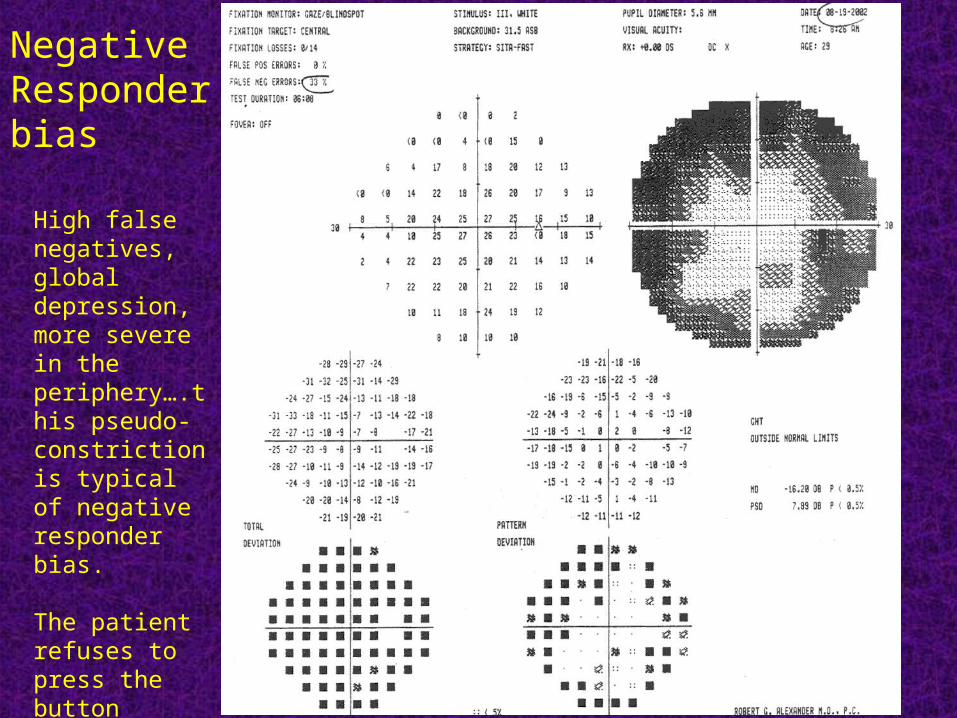
NegativeResponderbias
High false negatives, global depression, more severe in the periphery….this pseudo-constriction is typical of negative responder bias.
The patient refuses to press the button unless they are really sure the target is there.
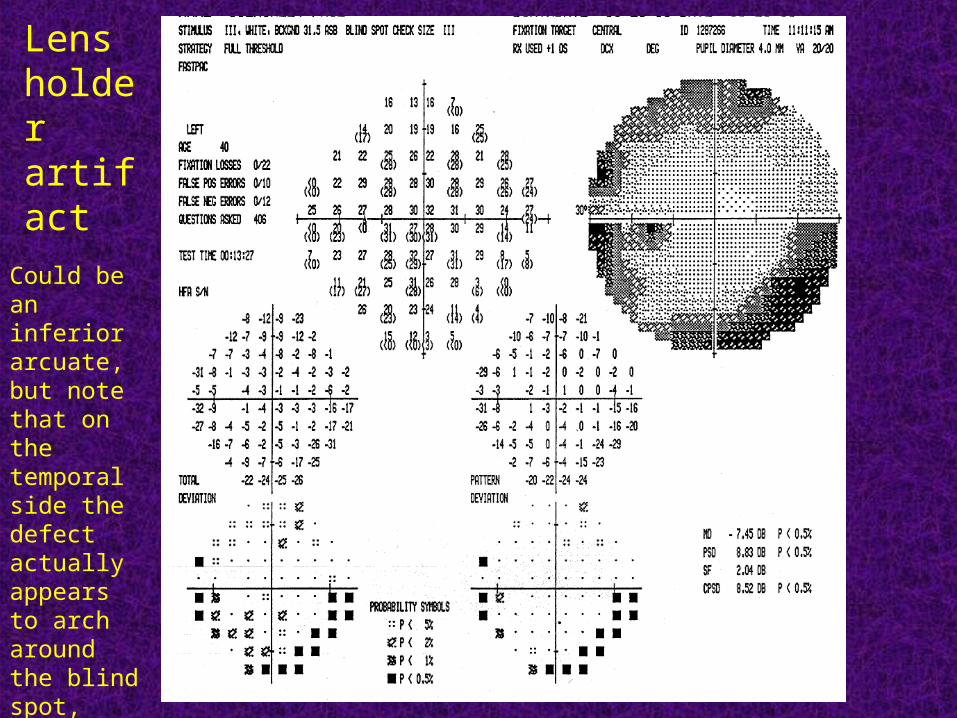
Lensholder artifactCould be an inferior arcuate, but note that on the temporal side the defect actually appears to arch around the blind spot, rather than emerging from it…
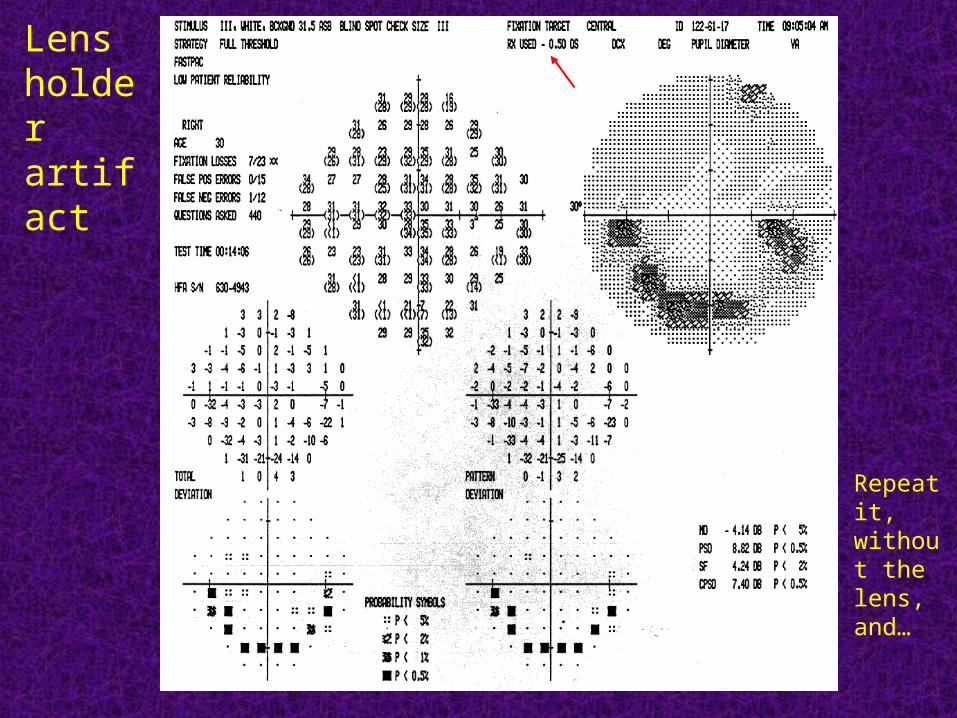
Lensholder artifact
Repeat it, without the lens, and…
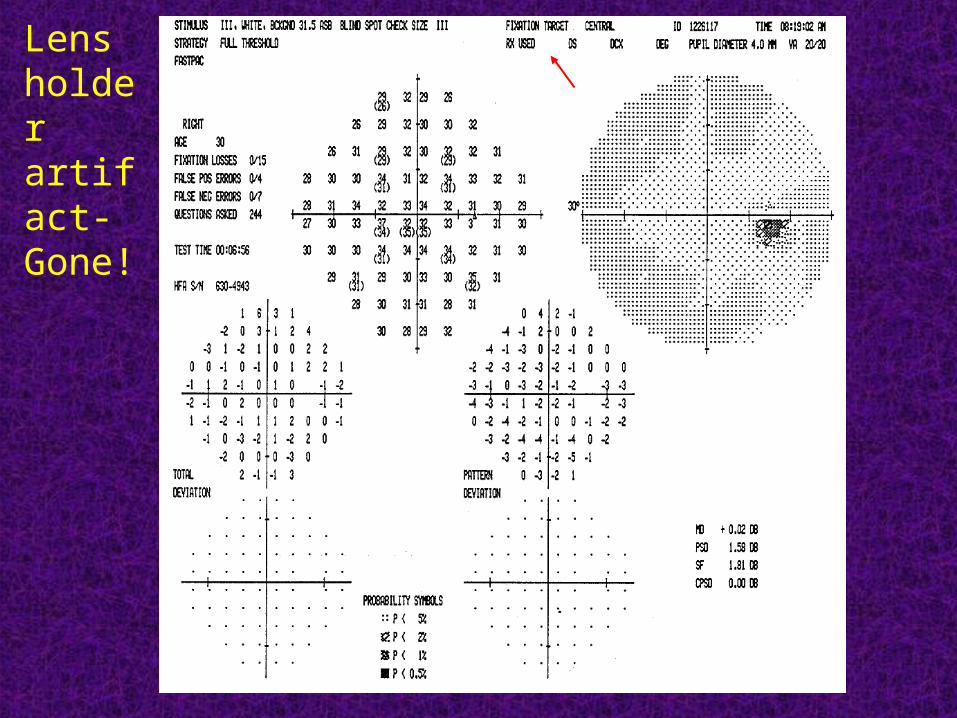
Lensholder artifact-Gone!
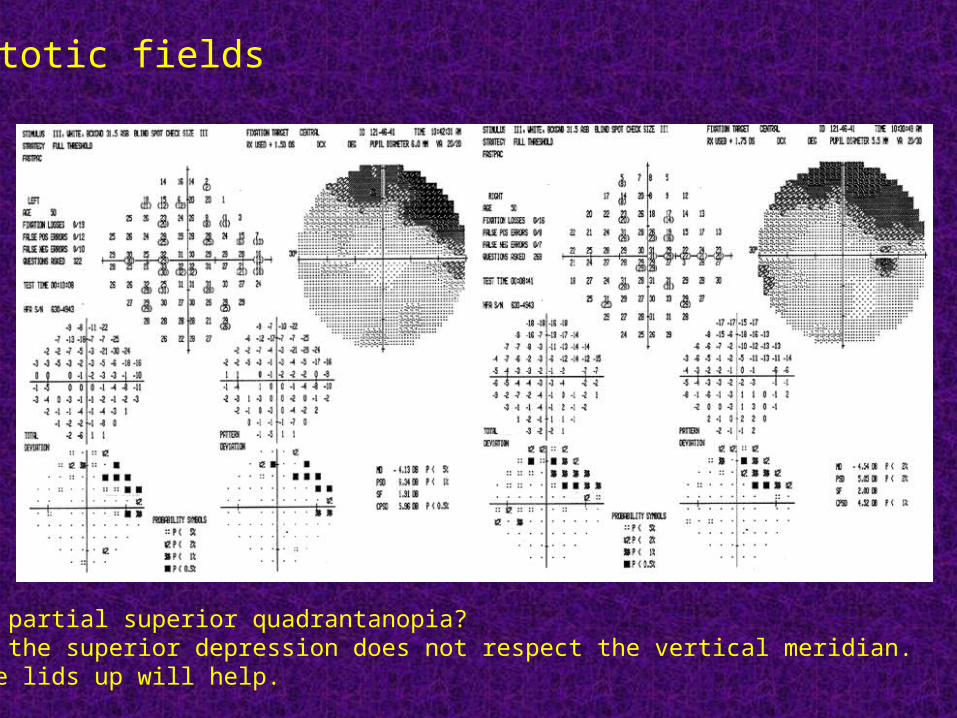
Ptotic fields
Ptosis or partial superior quadrantanopia?Note that the superior depression does not respect the vertical meridian. Taping the lids up will help.
Reading the plot:
3. Detect patterns.
• one abnormal point does not make a federal case.
• global depression is boring.
• look at one eye only and die.
• look at the probability plots!!!
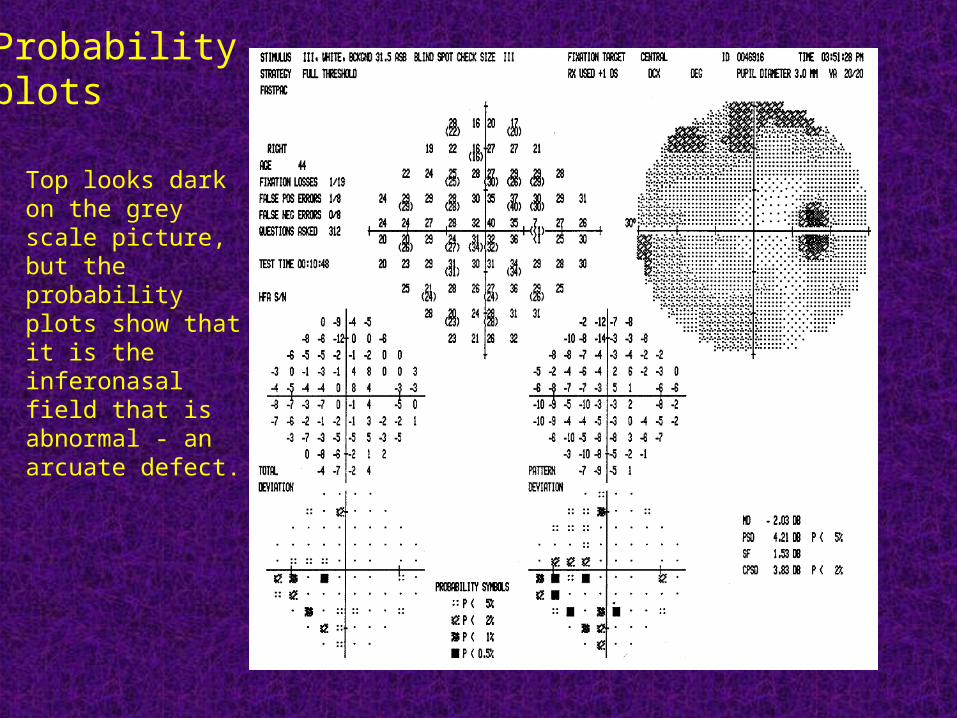
Probabilityplots
Top looks dark on the grey scale picture, but the probability plots show that it is the inferonasal field that is abnormal - an arcuate defect.
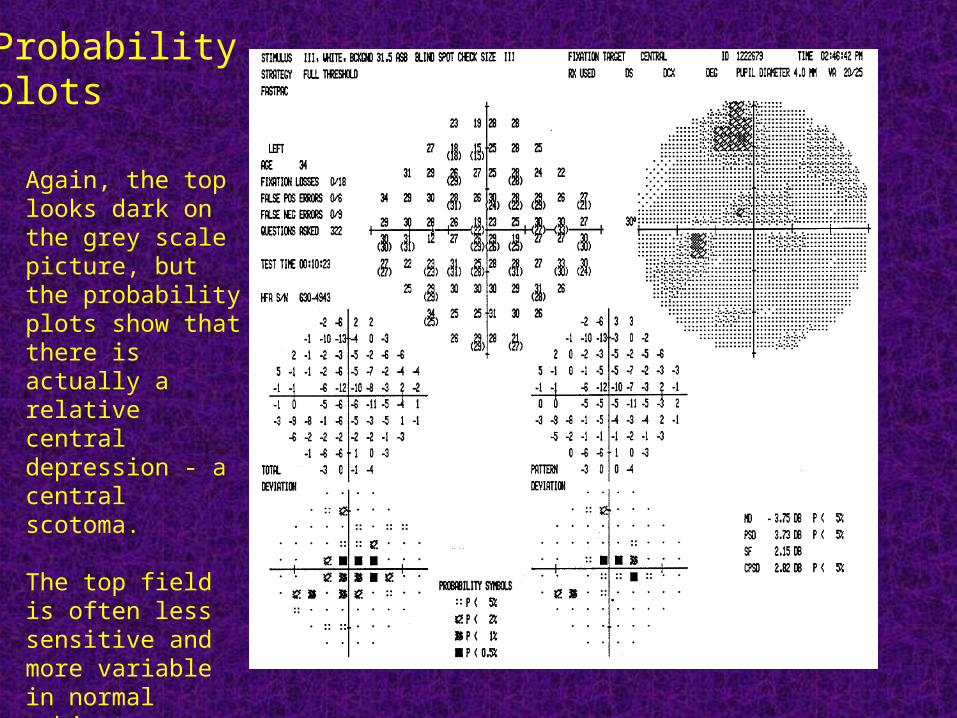
Probabilityplots
Again, the top looks dark on the grey scale picture, but the probability plots show that there is actually a relative central depression - a central scotoma.
The top field is often less sensitive and more variable in normal subjects.