Automated decision aids in future air traffic management ...
226
Automated decision aids in future air traffic management: Human performance and mental workload von Ulla Metzger, Dipl.-Psych. geboren in Worms/Rhld.-Pfalz Genehmigte Dissertation zur Erlangung des Grades eines Doctor rerum naturalium (Dr. rer. nat.) am Fachbereich 3: Humanwissenschaften (Erziehungswissenschaften, Psychologie und Sportwissenschaft) der Technischen Universität Darmstadt (D 17) Tag der Einreichung: 11. Juni 2001 Tag der Prüfung: 17. Juli 2001 Referenten: Prof. Dr. B. Rüttinger (Technische Universität Darmstadt) Prof. Dr. R. Singer (Technische Universität Darmstadt) Prof. R. Parasuraman, Ph. D. (The Catholic University of America, Washington, DC, USA) Darmstadt, Juli 2001
Transcript of Automated decision aids in future air traffic management ...

Automated decision aids in future air traffic management:
Human performance and mental workload
von Ulla Metzger, Dipl.-Psych.
geboren in Worms/Rhld.-Pfalz
Genehmigte Dissertation zur Erlangung des Grades eines Doctor rerum naturalium
(Dr. rer. nat.)
am Fachbereich 3: Humanwissenschaften
(Erziehungswissenschaften, Psychologie und Sportwissenschaft)
der Technischen Universität Darmstadt (D 17)
Tag der Einreichung: 11. Juni 2001
Tag der Prüfung: 17. Juli 2001
Referenten:
Prof. Dr. B. Rüttinger
(Technische Universität Darmstadt)
Prof. Dr. R. Singer
(Technische Universität Darmstadt)
Prof. R. Parasuraman, Ph. D.
(The Catholic University of America, Washington, DC, USA)
Darmstadt, Juli 2001

ii

iii
Acknowledgements
This research was supported by Grants NAG 2-1096 (“Dynamic Automation Tools for
Future Air Traffic Management”) and NCC2-1247 (“Human Factors in Distributed Air Ground
Traffic Management”) from NASA Ames Research Center, Moffett Field, CA (Technical
Monitors: Kevin Corker, Ph.D. and Richard Mogford, Ph.D.) awarded to Raja Parasuraman,
Ph.D. Additional funding was provided by a grant from the Flughafenstiftung Frankfurt/Main,
Germany awarded to Ulla Metzger.
I would like to thank all air traffic controllers that participated in my experiments.
During the course of this work, I have developed a great appreciation of their profession and the
services they provide.
No dissertation can be completed without the people that direct and later evaluate it. I
would like to thank Prof. Dr. B. Ruettinger for his flexibility in supporting and accomodating my
research endeavors abroad. I am indebted to Prof. Dr. R. Singer for his willingness to serve as a
reader and evaluator of my dissertation on a short notice. I am most grateful to Prof. Dr. Raja
Parasuraman for his support during my four great years in his lab and for providing a stimulating
work environment full of opportunities joined with a great degree of professional and personal
freedom.
Thanks are also due to Dr. Jürgen Sauer for valuable comments on a previous draft of my
dissertation, Dr. Bernd Lorenz for encouraging and helpful discussions of my research, and my
former colleagues at the Cognitive Science Lab, Diego Castaño, Jackie Duley, Scott Galster, and
Tony Masalonis, for the fruitful, and sometimes heated discussions of our projects. My work has
benefited from all of them.
Most of the work for this dissertation was done while I was abroad. While this has been
a great opportunity for personal and professional development, I believe that it is only possible
with a network of stable relationships - knowing that there is always someone to rely on. I
would like to thank my friends and, most of all, my family for providing this network for me.
Finally, I am most thankful to Jörg for not just supporting, but encouraging me in all my
ventures. His inspiration, both personally and professionally, has been invaluable.

iv
Table of contents
ACKNOWLEDGEMENTS ................................................................................................... III
TABLE OF CONTENTS....................................................................................................... IV
LIST OF FIGURES ............................................................................................................ VIII
LIST OF TABLES ...................................................................................................................X
LIST OF EQUATIONS ...........................................................................................................X
LIST OF ACRONYMS.......................................................................................................... XI
1. OVERVIEW.......................................................................................................................1
2. THE AIR TRAFFIC CONTROL SYSTEM .....................................................................3
2.1 THE CHALLENGE OF MODERNIZING THE ATC SYSTEM...................................................32.2 PROPOSALS FOR MODERNIZATION..................................................................................4
3. AUTOMATION .................................................................................................................8
3.1 DEFINITION ....................................................................................................................83.2 MODELS OF AUTOMATION ..............................................................................................83.3 HUMAN PERFORMANCE CONSEQUENCES OF AUTOMATION: COSTS AND BENEFITS........113.4 AUTOMATED SYSTEMS IN ATC.....................................................................................203.5 CONCLUSION................................................................................................................23
4. MENTAL WORKLOAD AND PERFORMANCE ........................................................24
4.1 THEORETICAL FOUNDATIONS OF MENTAL WORKLOAD.................................................25
v
4.2 MENTAL WORKLOAD AND PERFORMANCE IN ATC.......................................................274.2.1 Evidence from accidents and incidents ...............................................................274.2.2 Model of mental workload in air traffic control.................................................284.2.2.1 Workload drivers. ............................................................................................................... 29
4.2.2.2 Strategies and workload management................................................................................ 334.3 THE NEED FOR OPERATOR-IN-THE-LOOP STUDIES ........................................................344.4 MEASURING MENTAL WORKLOAD ................................................................................354.4.1 Primary task performance ..................................................................................364.4.2 Secondary task performance...............................................................................364.4.3 Physiological measures ........................................................................................374.4.4 Subjective measures.............................................................................................434.4.5 Relationship between measures...........................................................................44
5. REVIEW OF EMPIRICAL STUDIES ON THE IMPACT OF AUTOMATEDDECISION AIDS AND FREE FLIGHT................................................................................46
5.1 FREE FLIGHT ...............................................................................................................465.2 AUTOMATION...............................................................................................................555.3 AUTOMATION AND FF ..................................................................................................605.4 STATEMENT OF PROBLEM AND OVERVIEW OF RESEARCH .............................................62
6. METHODOLOGY...........................................................................................................64
6.1 OVERVIEW ...................................................................................................................646.2 ATC SIMULATION ........................................................................................................646.3 ADDITIONAL APPARATUS..............................................................................................71
7. EXPERIMENT 1: EFFECTS OF A DECISION AID AND TRAFFIC DENSITY.......74
7.1 INTRODUCTION ............................................................................................................747.1.1 Hypotheses and Research questions....................................................................757.2 METHODS.....................................................................................................................767.2.1 Participants ..........................................................................................................767.2.2 Apparatus.............................................................................................................767.2.3 Design ...................................................................................................................767.2.4 Procedure .............................................................................................................777.3 RESULTS ......................................................................................................................787.3.1 Primary task performance: Detection of conflicts and self-separations............787.3.2 Primary task performance: Accepting and handing-off aircraft.......................817.3.3 Secondary task performance...............................................................................827.3.4 Physiological measures: HRV .............................................................................837.3.5 Subjective ratings of mental workload ...............................................................837.3.6 Trust.....................................................................................................................837.4 DISCUSSION..................................................................................................................83

vi
8. EXPERIMENT 2: EFFECTS OF TRAFFIC DENSITY AND AUTOMATIONFEEDBACK TYPE.................................................................................................................89
8.1 INTRODUCTION ............................................................................................................898.1.1 Hypotheses and research questions.....................................................................958.2 METHOD ......................................................................................................................968.2.1 Participants ..........................................................................................................968.2.2 Apparatus.............................................................................................................968.2.3 Design .................................................................................................................1018.2.4 Procedure ...........................................................................................................1038.3 RESULTS ....................................................................................................................1048.3.1 Primary task performance: Detection of conflicts and self-separations..........1048.3.2 Primary task performance: Accepting and handing-off aircraft.....................1048.3.3 Secondary task performance.............................................................................1058.3.4 Physiological measures: Eye movements ..........................................................1068.3.5 Subjective ratings of mental workload .............................................................1108.3.6 Trust and self-confidence ..................................................................................1108.4 DISCUSSION................................................................................................................111
9. EXPERIMENT 3: EFFECTS OF A DECISION AID UNDER RELIABLE ANDFAILURE MODES OF OPERATION ................................................................................119
9.1 INTRODUCTION ..........................................................................................................1199.1.2 Hypotheses and research questions...................................................................1229.2 METHOD ....................................................................................................................1239.2.1 Participants ........................................................................................................1239.2.2 Apparatus...........................................................................................................1239.2.3 Design .................................................................................................................1239.2.4 Procedure ...........................................................................................................1269.3 RESULTS ....................................................................................................................1279.3.1 Primary task performance: Detection of conflicts and self-separations with
reliable automation............................................................................................1289.3.2 Primary task performance: Detection of conflicts and self-separations with
unreliable automation........................................................................................1289.3.3 Primary task performance: Accepting and handing-off aircraft.....................1329.3.4 Secondary task performance.............................................................................1339.3.5 Physiological measures: Eye movements ..........................................................1339.3.6 Subjective ratings of mental workload .............................................................1399.3.7 Trust and self-confidence ..................................................................................1399.4 DISCUSSION................................................................................................................140
10. DISCUSSION ...............................................................................................................149
10.1 SUMMARY OF THE RESEARCH.....................................................................................14910.2 INTEGRATION OF EMPIRICAL FINDINGS AND THEORETICAL IMPLICATIONS ................150
vii
10.2.1 Traffic density..................................................................................................15010.2.2 Automation ......................................................................................................15210.2.3 Automation as a moderator of traffic density effects .....................................15410.2.4 Automation feedback.......................................................................................15510.2.5 System performance ........................................................................................15610.2.6 Usefulness of research approach .....................................................................15810.3 IMPLICATIONS FOR SYSTEM DESIGN ...........................................................................15910.3.1 Reducing complacency ....................................................................................15910.3.2 The use of multimodal feedback......................................................................16010.3.3 The impact of datalink.....................................................................................16110.4 LIMITATIONS OF THE STUDIES....................................................................................16210.5 FUTURE DIRECTIONS FOR RESEARCH .........................................................................16410.6 CONCLUSION..............................................................................................................166
11. REFERENCES.............................................................................................................168
12. APPENDIX...................................................................................................................198
12.1 STUDY PROTOCOL AND CONSENT FOR EXPERIMENT 1 ................................................19812.2 STUDY PROTOCOL AND CONSENT FOR EXPERIMENTS 2 AND 3 ....................................20112.3 BIOGRAPHICAL INFORMATION SHEET ........................................................................20412.4 INSTRUCTIONS ...........................................................................................................20512.5 DESCRIPTION OF THE CONFLICT DETECTION AID EXPERIMENT 3 ...............................20812.6 TRUST AND SELF-CONFIDENCE RATING SCALES..........................................................209
13. CURRICULUM VITAE ..............................................................................................210

viii
List of figures
Figure 3.1: Types and levels of automation ...............................................................................10
Figure 4.1: Model of mental workload (from Wickens et al., 1997)...........................................29
Figure 4.2: Relationship between performance and workload measures.....................................34
Figure 5.1: Airspace structure under current and free flight conditions ......................................47
Figure 6.1: Primary visual display (PVD)..................................................................................66
Figure 6.2: Electronic flight strip (left half) and datalink display (right half) .............................67
Figure 6.3: Experimental set-up with eye-head tracking system.................................................68
Figure 7.1: Detection rate for self-separations as a function of traffic density and the availabilitof
a conflict detection aid ...........................................................................................79
Figure 7.2: Advance notification time for conflicts as a function of traffic density and the
availability of a conflict detection aid .....................................................................80
Figure 7.3: Advance notification time for self-separations as a function of traffic density and the
availability of a conflict detection aid .....................................................................81
Figure 8.1: PVD with conflict button and enhanced visual feedback .........................................97
Figure 8.2: Determination of point-of-gaze and pupil diameter..................................................99
Figure 8.3: Areas of interest created for analyzing eye fixations and dwells on the simulation.101
Figure 8.4: Feedback conditions..............................................................................................103
Figure 8.5: Number of fixations as a function of traffic density and area of interest.................107
Figure 8.6: Number of dwells as a function of traffic density and area of interest ....................108
Figure 8.7: Dwell duration as a function of traffic density and area of interest.........................109
Figure 8.8: Dwell time as a function of traffic density and area of interest...............................110
Figure 8.9: Self-confidence ratings as a function of traffic density and feedback type..............111
Figure 9.1: Order of scenarios ................................................................................................. 124
Figure 9.2: Situation in which an impending conflict remained undetected by the aid..............125
Figure 9.3: Advance notification as a function of failure condition and order of performance..132
Figure 9.4: Number of fixations as a function of area of interest, automation condition, and
detection performance ..........................................................................................135
Figure 9.5: Number of dwells as a function of area of interest, automation condition, and
detection performance ..........................................................................................136

ix
Figure 9.6: Dwell duration as a function of area of interest, automation condition, and detection
performance .........................................................................................................138
Figure 9.7: Dwell time as a function of area of interest, automation condition, and detection
performance .........................................................................................................139
Figure 10.1: Integration of empirical findings into the model (Wickens et al., 1997) ...............151

x
List of tables
Table 3.1: Levels of automation (Sheridan and Verplank, 1978; Sheridan, 1992) ........................9
Table 6.1: List of dependent variables .......................................................................................72
Table 9.1: Detection rates as a function of automation condition .............................................129
Table 9.2: Advance notification times as a function of automation condition...........................130
List of equations
Equation 8.1: Determination of eye line of gaze...........................................................................99
Equation 8.2: Entropy or scanning randomness..........................................................................101
xi
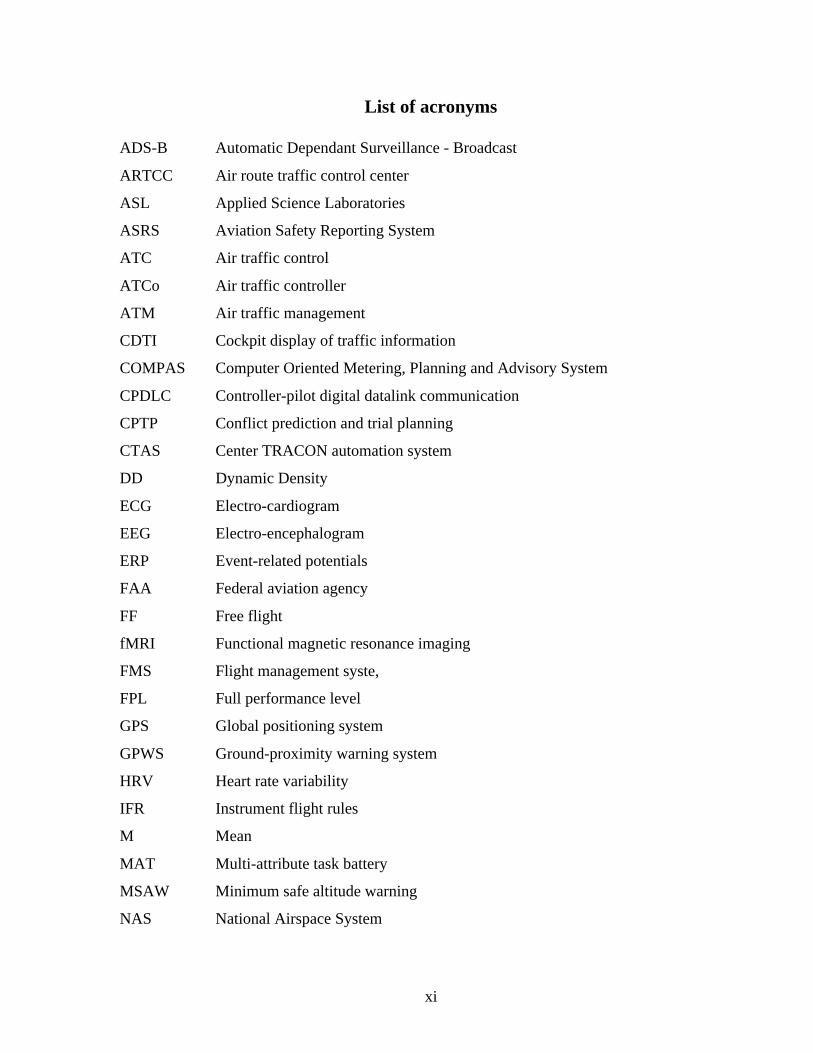
List of acronyms
ADS-B Automatic Dependant Surveillance - Broadcast
ARTCC Air route traffic control center
ASL Applied Science Laboratories
ASRS Aviation Safety Reporting System
ATC Air traffic control
ATCo Air traffic controller
ATM Air traffic management
CDTI Cockpit display of traffic information
COMPAS Computer Oriented Metering, Planning and Advisory System
CPDLC Controller-pilot digital datalink communication
CPTP Conflict prediction and trial planning
CTAS Center TRACON automation system
DD Dynamic Density
ECG Electro-cardiogram
EEG Electro-encephalogram
ERP Event-related potentials
FAA Federal aviation agency
FF Free flight
fMRI Functional magnetic resonance imaging
FMS Flight management syste,
FPL Full performance level
GPS Global positioning system
GPWS Ground-proximity warning system
HRV Heart rate variability
IFR Instrument flight rules
M Mean
MAT Multi-attribute task battery
MSAW Minimum safe altitude warning
NAS National Airspace System

xii
NASA National Aeronautics and Space Agency
NASA-TLX NASA-Task Load Index
NRC National Research Council
OE Operational error
OOTLUF Out-of-the-loop phenomenon
PCR Distance pupil-corneal reflection
PET Positron emission tomography
PUMA Performance and usability modeling in ATM
PVD Plan view display
SA Situation awareness
SAGAT Situation awareness global assessment technique
SD Standard deviation
SE Standard error
SMEQ Subjective mental effort questionnaire
STCA Short-term conflict alert
SWAT subjective workload assessment technique
SWORD Subjective workload dominance technique
TRACON Terminal radar control
URET User request evaluation tool
VFR Visual flight rules

They say that there dwelt at Naucratis in Egypt one of the old gods of that country, to
whom the bird they call Ibis was sacred, and the name of the god himself was Theuth. Among
his inventions were number and calculation and geometry and astronomy, not to speak of various
kinds of draughts and dice, and above all, writing. The king of the whole country at that time
was Thamus, who lived in the great city of Upper Egypt which the Greeks call Egyptian Thebes;
the name they give to Thamus is Ammon. To him came Theuth and exhibited his inventions,
claiming that they ought to be make known to the Egyptians in general. Thamus inquired into
the use of each of them, and as Theus went through them expressed approval or disapproval,
according as he judged Theuth's claims to be well or ill founded. It would take too long to go
through all that Thamus is reported to have said for and against each of Theuth's inventions. But
when it came to writing, Theuth declared: 'Here is an accomplishment, my lord the king, which
will improve both the wisdom and the memory of the Egyptians. I have discovered a sure receipt
for memory and wisdom.' 'Theuth, my paragon of inventors,' replied the king, 'the discoverer of
an art is not the best judge of the good or harm which will accrue to those who practise it. So it
is in this case; you, who are the father of writing, have out of fondness for your offspring
attributed to it quite the opposite of its real function. Those who acquire it will cease to exercise
their memory and become forgetful; they will rely on writing to bring things to their
remembrance by external signs instead of their own internal resources. What you have
discovered is a receipt for recollection, not for memory. And as for wisdom, your pupils will
have the reputation for it without the reality: They will receive a quantity of information without
proper instruction, and in consequence be thought very knowledgeable when they are for the
most part quite ignorant. And because they are filled with the conceit of wisdom instead of real
wisdom they will be a burden to society.'
From Plato, Phaedrus, translated by W. Hamilton (1973). London: Pinguin.

1. Overview
1
1. Overview
Rapidly increasing air traffic all over the world and economical considerations of the
airlines are forcing radical changes in the air traffic control (ATC) system. Free Flight (FF) is a
proposal in which authority for aircraft separation is transferred from the air traffic controller
(ATCo) on the ground to the pilots in the air. The ATCo will manage traffic flows within a
sector, but leave the detection and resolution of conflicts to the pilots. Nevertheless, ATCos will
be required to oversee the system and intervene if necessary. This changes the role of the ATCo
to an air traffic manager. The automation of higher-order cognitive functions such as decision-
making or planning as well as new concepts of air traffic management (ATM) have been
proposed to alleviate the pressure on the outdated system. In a high-risk environment like ATC,
it is crucial to understand how the human operator in the system is affected by new procedures
and automation tools. It is the ATCo who is ultimately held responsible for system safety. New
concepts implemented with the goal to increase capacity and efficiency should at least be safety-
neutral and, preferably, safety-enhancing. Although there has been much speculation about the
consequences of automation and new procedures on ATCo and system performance, empirical
evidence is scarce. The purpose of the present work was to provide empirical evidence on the
effects of automation in future ATM on ATCo performance and mental workload. This serves to
expand the knowledge on human interaction with automation of higher-order cognitive processes
in the ATC and other environments and contributes to the design of safe and efficient human-
machine systems.
The present work is comprised of ten chapters. After this brief overview, the next
chapter will give a general introduction to the current situation in the ATC system and proposals
such as FF and the introduction of advanced decision aids to support ATCo functions. How
these proposals could affect the job of the ATCo will also be discussed. Chapter 3 addresses the
issue of automation and gives an overview of its benefits and costs. In chapter 4, the concept of
mental workload, its measurement and application to ATC will be covered. Chapter 5 reviews
available empirical studies on the effects of automation on ATCo performance and mental
workload in ATC. The apparatus of the experimental studies conducted and the measurement of
dependent variables will be covered in Chapter 6. Chapters 7-9 represent the empirical part of
this dissertation. Chapter 7 describes an empirical study that was carried out to investigate

1. Overview
2
ATCo performance and mental workload under different levels of traffic with and without
assistance of a decision aid. The purpose was to study whether automation could compensate for
performance decrements brought about by FF and increased traffic. Chapter 8 describes a study
investigating the effects of a decision aid with different types of automation feedback and
different levels of traffic density on ATCo performance, mental workload, and visual attention.
Chapter 9 examines ATCo performance, mental workload, and visual attention under conditions
when the automation was reliable, unreliable and when ATCos were performing manually.
Finally, chapter 10 discusses the findings of the experiments as they apply to a model of
performance and workload in ATC. Implications for a better understanding of human-
automation interaction and the design of a safe ATC system are derived.
2. The air traffic control system
3
2. The air traffic control system
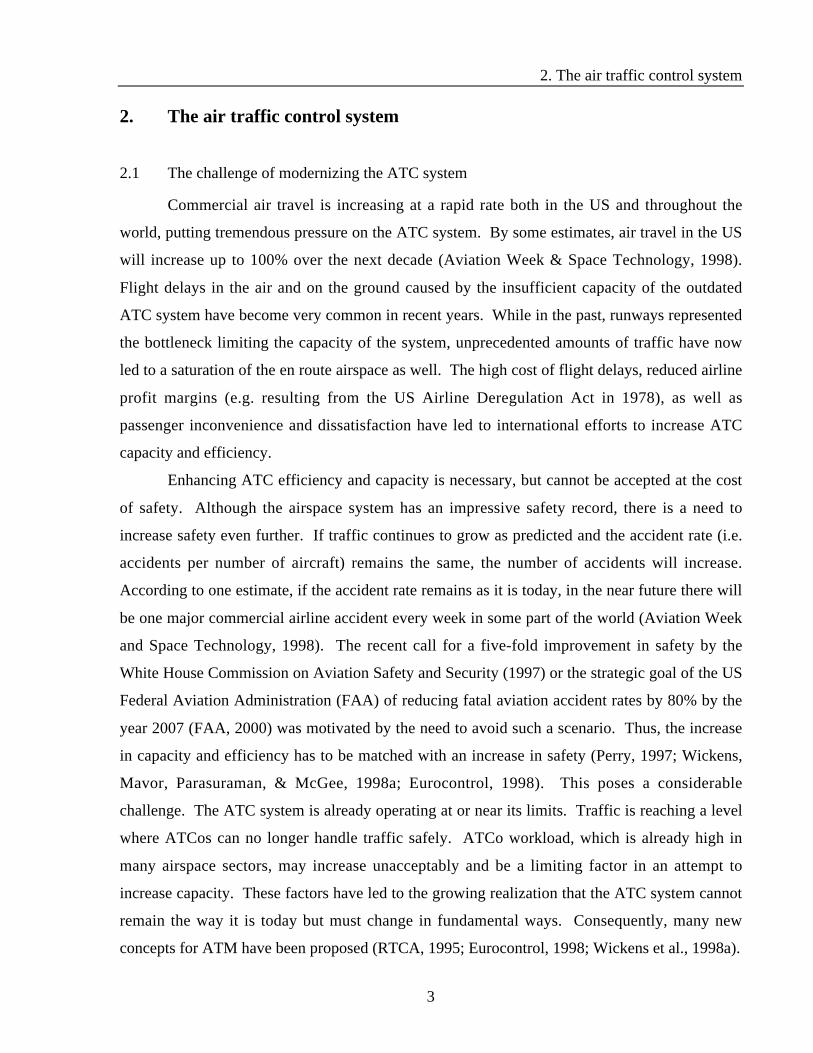
2.1 The challenge of modernizing the ATC system
Commercial air travel is increasing at a rapid rate both in the US and throughout the
world, putting tremendous pressure on the ATC system. By some estimates, air travel in the US
will increase up to 100% over the next decade (Aviation Week & Space Technology, 1998).
Flight delays in the air and on the ground caused by the insufficient capacity of the outdated
ATC system have become very common in recent years. While in the past, runways represented
the bottleneck limiting the capacity of the system, unprecedented amounts of traffic have now
led to a saturation of the en route airspace as well. The high cost of flight delays, reduced airline
profit margins (e.g. resulting from the US Airline Deregulation Act in 1978), as well as
passenger inconvenience and dissatisfaction have led to international efforts to increase ATC
capacity and efficiency.
Enhancing ATC efficiency and capacity is necessary, but cannot be accepted at the cost
of safety. Although the airspace system has an impressive safety record, there is a need to
increase safety even further. If traffic continues to grow as predicted and the accident rate (i.e.
accidents per number of aircraft) remains the same, the number of accidents will increase.
According to one estimate, if the accident rate remains as it is today, in the near future there will
be one major commercial airline accident every week in some part of the world (Aviation Week
and Space Technology, 1998). The recent call for a five-fold improvement in safety by the
White House Commission on Aviation Safety and Security (1997) or the strategic goal of the US
Federal Aviation Administration (FAA) of reducing fatal aviation accident rates by 80% by the
year 2007 (FAA, 2000) was motivated by the need to avoid such a scenario. Thus, the increase
in capacity and efficiency has to be matched with an increase in safety (Perry, 1997; Wickens,
Mavor, Parasuraman, & McGee, 1998a; Eurocontrol, 1998). This poses a considerable
challenge. The ATC system is already operating at or near its limits. Traffic is reaching a level
where ATCos can no longer handle traffic safely. ATCo workload, which is already high in
many airspace sectors, may increase unacceptably and be a limiting factor in an attempt to
increase capacity. These factors have led to the growing realization that the ATC system cannot
remain the way it is today but must change in fundamental ways. Consequently, many new
concepts for ATM have been proposed (RTCA, 1995; Eurocontrol, 1998; Wickens et al., 1998a).

2. The air traffic control system
4
2.2 Proposals for modernization
The ATCo's role in the airspace system is to assure the "safe, orderly, and expeditious
flow of traffic" (ICAO, 1993) through the airspace. The most important task of the ATCo is to
prevent collisions between aircraft, both on the ground and in the air. Under current conditions,
a number of procedures and rules assist ATCos to accomplish this. These will now be described
briefly. For more detailed treatments of ATC the reader may refer to Nolan (1990) or Luffsey
(1990).
Except for aircraft flying under visual flight rules (VFR), typically very small aircraft
flown by recreational pilots that are allowed to maneuver freely as long as they stay at certain
altitudes, aircraft are managed and controlled by ATC. All aircraft flying under instrument flight
rules (IFR) are required to file a flight plan to announce their intended flight path en route to
their destination. This is typically done by pilots or airline dispatchers before take-off. The
flight plan is then approved by ATC, with or without revisions, and the pilots must follow it. It
is entered into the ATC system and distributed to the ATCo in form of a flight strip about 20
minutes before the flight enters an ATCo's sector. If pilots wish to deviate from the intended
flight plan (e.g. because of weather or turbulence), they must both inform and get permission
from ATC. In addition, pilots usually cannot fly the most direct and fuel-efficient route (i.e. the
great circle) to their destination. The airspace is structured by airways and jet routes, like
highways in the sky, and flights are assigned to airways (at lower altitudes) and jet routes (at
higher altitudes) that take them from their origin to their destination. In the current system, ATC
has both authority over and responsibility for the events in the airspace. Together with the
requirement to have all deviations from the intended flight plan approved by ATC, the airspace
structure limits the areas where potential conflicts can occur to the points where airways and jet
routes converge. This makes it feasible for the ATCo to assure safety. However, the rigid
structure and rules restrict the pilots in their maneuvering, routing, and scheduling, often not
allowing them and the airlines to fly the fastest and most fuel-efficient routes. The system of
routes, for example, was designed to accommodate air traffic patterns many years ago (i.e. before
the airline deregulation) and has not been updated to account for the change in current route
preferences. In addition, ATCos often cannot accommodate pilot requests for deviations from
their intended flight paths in favor of more efficient routes because the ATCos are already
working at their capacity limit.

2. The air traffic control system
5
Another problem of the current ATC system is congestion on the radio frequencies that
ATCos and pilots use to communicate with each other. Because each aircraft is required to make
certain routine transmissions, the number of transmissions is directly related to the number of
aircraft. With the expected increase in traffic over the next few years, it will not be long before
the communication system breaks down. If frequencies are congested, pilots cannot contact
ATCos (and vice versa) and have to make several attempts before they can finally communicate.
This increases pilot and ATCo workload unnecessarily. Digital controller-pilot data link
communication (CPDLC) has been suggested as a solution to this problem. Instead of verbally
transmitting routine messages, messages would be transmitted digitally and displayed or even
printed on cockpit and ATC displays. Radio frequencies would be reserved for emergency
transmissions and transmissions that are relevant to other pilots (e.g. pilot weather and
turbulence reports).
The outdated ATC equipment has not kept up with technological advances on the flight
deck. Modern technologies such as the flight management systems (FMS) have capabilities (e.g.
estimating times of arrival, calculating the most fuel-efficient routes) well beyond the capabilites
of technology on the ground. This mismatch in technologies between the air and the ground
does not allow pilots and airlines to make use of their expensive and sophisticated on-board
equipment as much as they would like in order to save money (e.g. through reducing flight time
and fuel consumption). This has caused the airlines, industry, and government to propose the
modernization of the airspace system with new ways of conducting ATC and assuring the safety
in the airspace. Among the proposals for modernization are the concept of FF and the
introduction of automation. FF refers to a new concept of ATM in which pilots will be given the
freedom to choose their own heading, altitude, and speed in real time without being restricted by
ATC instructions or outdated route structures. While under current ATC procedures, pilots are
required to strictly follow the ATCos’ instructions, under FF conditions, pilots flying under IFR
would be allowed to maneuver freely and possibly deviate from their course without even
notifying the controller much like pilots flying under VFR. The RTCA (1995) defined FF as
"a safe and efficient flight operating capability under instrument flight rules (IFR) in
which the operators have the freedom to select their path and speed in real time. Air traffic
restrictions are only imposed (1) to ensure separation, (2) to preclude exceeding airport
capacity, (3) to prevent unauthorized flight through special use airspace, and (4) to ensure safety
2. The air traffic control system
6
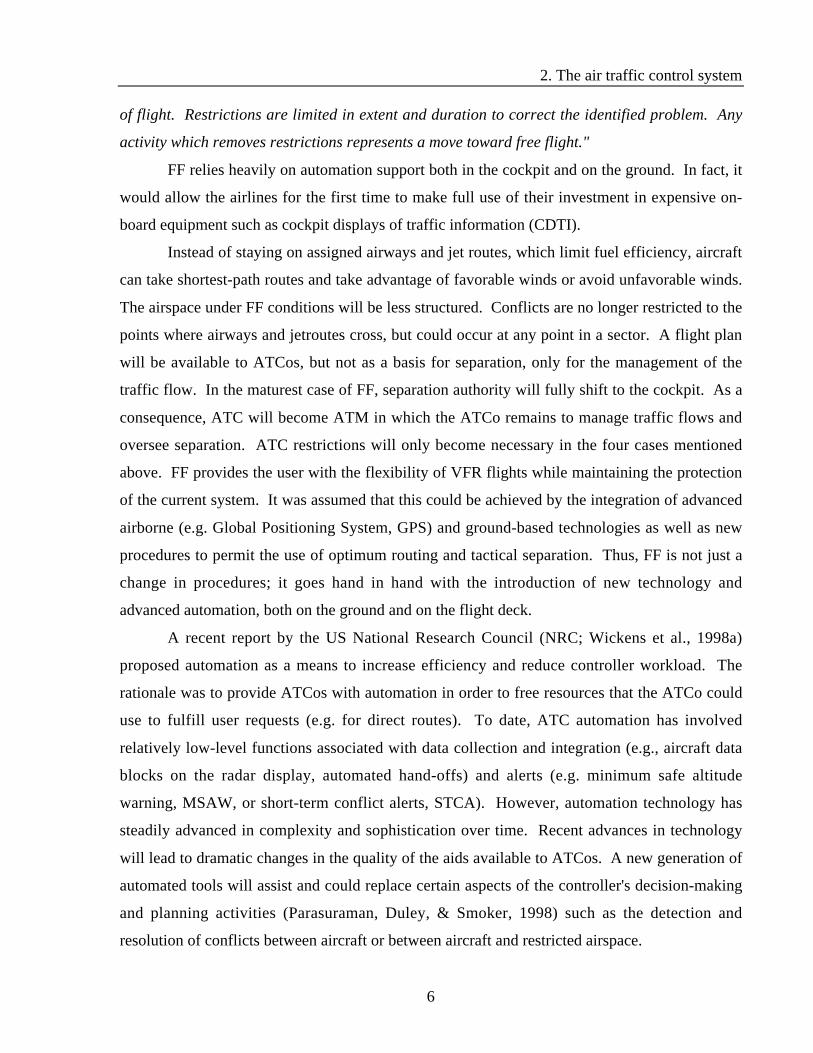
of flight. Restrictions are limited in extent and duration to correct the identified problem. Any
activity which removes restrictions represents a move toward free flight."
FF relies heavily on automation support both in the cockpit and on the ground. In fact, it
would allow the airlines for the first time to make full use of their investment in expensive on-
board equipment such as cockpit displays of traffic information (CDTI).
Instead of staying on assigned airways and jet routes, which limit fuel efficiency, aircraft
can take shortest-path routes and take advantage of favorable winds or avoid unfavorable winds.
The airspace under FF conditions will be less structured. Conflicts are no longer restricted to the
points where airways and jetroutes cross, but could occur at any point in a sector. A flight plan
will be available to ATCos, but not as a basis for separation, only for the management of the
traffic flow. In the maturest case of FF, separation authority will fully shift to the cockpit. As a
consequence, ATC will become ATM in which the ATCo remains to manage traffic flows and
oversee separation. ATC restrictions will only become necessary in the four cases mentioned
above. FF provides the user with the flexibility of VFR flights while maintaining the protection
of the current system. It was assumed that this could be achieved by the integration of advanced
airborne (e.g. Global Positioning System, GPS) and ground-based technologies as well as new
procedures to permit the use of optimum routing and tactical separation. Thus, FF is not just a
change in procedures; it goes hand in hand with the introduction of new technology and
advanced automation, both on the ground and on the flight deck.
A recent report by the US National Research Council (NRC; Wickens et al., 1998a)
proposed automation as a means to increase efficiency and reduce controller workload. The
rationale was to provide ATCos with automation in order to free resources that the ATCo could
use to fulfill user requests (e.g. for direct routes). To date, ATC automation has involved
relatively low-level functions associated with data collection and integration (e.g., aircraft data
blocks on the radar display, automated hand-offs) and alerts (e.g. minimum safe altitude
warning, MSAW, or short-term conflict alerts, STCA). However, automation technology has
steadily advanced in complexity and sophistication over time. Recent advances in technology
will lead to dramatic changes in the quality of the aids available to ATCos. A new generation of
automated tools will assist and could replace certain aspects of the controller's decision-making
and planning activities (Parasuraman, Duley, & Smoker, 1998) such as the detection and
resolution of conflicts between aircraft or between aircraft and restricted airspace.
2. The air traffic control system
7
The introduction of FF and automation represent a radical change in the way ATCos
currently operate and will significantly impact their jobs. The role of the ATCo will change
from actively controlling traffic to monitoring separation in a high-density airspace and
intervening in potential conflicts only if the pilots fail to resolve them on their own. Hence, the
ATCo’s role is to act as a back-up to the system in case something goes wrong. This could lead
to a much higher monitoring and scanning load for the ATCo and reduced conflict detection
performance because controllers constantly have to reevaluate the situation for aircraft that might
have changed their course and be in conflict with other aircraft. In addition, ATCos will have to
monitor and work the datalink display to exchange information. While in the current system
ATCos have both authority over and responsibility for the aircraft in their airspace, ATCos under
FF will have the responsibility, but not full authority over aircraft. Even though the emphasis of
this work is on automation, FF and automation are considered jointly for several reasons. First,
FF and automation both can lead to a transfer of some aspects of decision-making authority from
the ATCo to another agent, either pilots or automation, putting the ATCo in a monitoring role.
Therefore, the consequences of FF and automation for the ATCo are similar. Second, while
automation could be introduced into the ATC system on its own, FF will not be feasible without
automation. FF is heavily based on the use of automation, both on the ground and in the air.
Together, they will create a highly efficient and dense airspace. Third, it is important to study
automation in the context it will be used because its implications (e.g. reliability) could be
different under FF than under current conditions. How automation affects the en route ATCo as
a crucial part of the airspace system and its performance under FF conditions is the topic of this
work.

3. Automation
8
3. Automation
3.1 Definition
Before discussing the concept of automation, the term should be clearly defined. While
sometimes the term automation is used for mere additions of technology (e.g. typing on a
computer keyboard instead of typing on a typewriter), Parasuraman and Riley (1997) defined
automation as
“any device or system that accomplishes (partially or fully) a function that was
previously carried out (partially or fully) by a human operator”.
This definition emphasizes the replacement of a human function by a machine function.
Typing on a typewriter versus a computer keyboard requires the same human function (i.e.
typing) and does not constitute automation according to this definition. However, using the spell
checker of a word-processing software does constitute automation. The human function of
searching for incorrectly spelled words and deciding on the correct spelling is replaced by the
spell checking function of the program.
3.2 Models of automation
Automation is not an all-or-nothing concept. Human functions can be automated at
different levels. Sheridan (1987) proposed 10 levels of automation between full manual control
to full automation. At the lowest level of automation, no assistance to the human is provided at
all by a computer or any other machine. At the highest level, the computer decides everything
and acts autonomously, ignoring the human. Table 3.1 shows the levels of human and machine
control that lie between these two extremes.
For example, at a low level of automation, a spell checker could assist the writer in
searching for words that are spelled incorrectly, and highlight the words. The writer would then
have to decide on the correct spelling of the word perhaps by using a dictionary and make the
correction manually. At a moderate level of automation, the spell checker could search for
incorrectly spelled words and suggest the correct way of spelling. The writer would then have to
decide if he or she wants to accept the suggested spelling (level 5). At the highest level of

3. Automation
9
automation, the spell checker replaces the incorrect spelling with the correct spelling without
even notifying the writer that incorrectly spelled words were replaced.
Table 3.1: Levels of automation (Sheridan and Verplank, 1978; Sheridan, 1992)THE COMPUTER…
HIGH 10. decides everything, acts autonomously, ignoring the human.
9. informs the human only if it, the computer, decides to
8. informs the human only if asked, or
7. executes automatically, then necessarily informs the human, and
6. allows the human a restricted time to veto before automatic execution, or
5. executes that suggestion if the human approves, or
4. suggests one alternative
3. narrows the selection down to a few, or
2. offers a complete set of decision/action alternatives, or
Low 1. offers no assistance: human must take all decisions and actions.
However, automation cannot only occur at different levels. It can also support different
stages of information processing and decision-making from perception and information
acquisition to action implementation. Parasuraman, Sheridan, and Wickens (2000) expanded the
original one-dimensional concept of levels of automation and suggested that the 10 levels
originally proposed by Sheridan and Verplank (1978) best characterize automation for decision-
making and action selection, but that automation can be applied to other stages of information-
processing as well. The proposed types of automation are automation in the process of (1)
information acquisition (e.g. through attention guidance), (2) information analysis (e.g. through
inference), (3) decision selection, and (4) action implementation. Figure 3.1 shows the resulting
model of levels and types of automation that corresponds roughly to the stages of human
information-processing including sensation, perception, response selection, and response
execution. Automation of types 2 and 3 is typically characterized as decision-aiding (Wickens &
Hollands, 2000).

3. Automation
10
Type of automation:
1: Information
acquisition
2: Info analysis/
Integration
3: Decision
selection
4: Action
Implementation
High
Low
Figure 3.1: Types and levels of automation
The concept of levels and types of automation raises the design issue how to choose the
appropriate level and type of automation for a particular application. First, a different level of
automation can be chosen for each type of automation (e.g. high level automation for
information acquisition, low level for information analysis). However, regardless of the type or
level of automation, the associated human performance consequences should be evaluated before
implementing the automation. The human performance consequences should represent the
primary evaluative criteria. In addition, secondary evaluative criteria have to be considered.
These could be issues such as the reliability of automation, cost and risks of action outcomes,
ease of system integration, implementation cost, or liability issues. The assessment of primary
and secondary evaluative criteria are part of an iterative design process until an appropriate
solution is found (Parasuraman et al., 2000; Parasuraman, 2000).
For example, high levels of automation for information acquisition might be acceptable
given the high reliability of current automation technologies. On the other hand, high-level
automation, particularly of decision making and action selection, can lead to adverse human
performance effects discussed further below (Parasuraman & Riley, 1997). For example,
automation beyond level 6 on the decision scale would mean that a particular decision is
automatically made by the computer, with the human operator being informed only
subsequently. This might be appropriate for low-risk functions, such as automated hand-offs
Lev
el o
f au
tom
atio
n

3. Automation
11
between airspace sectors. It may also be necessary when decisions need to be made faster than
the human is capable of, for example when certain emergency events occur in a nuclear power
plant (Moray, 1986) or when there is an engine malfunction prior to the critical aircraft speed for
take-off (Inagaki, 1999).
3.3 Human performance consequences of automation: Costs and benefits
Automation has many benefits. It can spare humans from carrying out dangerous
functions such as the handling of hazardous materials like nuclear waste or the recovery of
material from the ocean floor after an aircraft accident. Automation can also carry out functions
that are impossible for humans to perform in a timely manner (e.g. the decision to continue or
abort the takeoff of an aircraft after an engine failure; Inagaki, 1999) or impossible to perform at
all due to physical disabilities (e.g. reading for the blind). Automation can take over functions
that the human is capable of carrying out, but are burdensome, fatiguing or error-prone (e.g.
complex mathematical calculations). Automation does not necessarily have to fully take over
human work; it can also aid the human in functions that are vulnerable such as some working
memory processes (Wickens, Gordon & Liu, 1998b). As Wickens (2000) points out, even if the
automation does not have immediate benefits for performance, it could reduce workload and
therefore be beneficial.
In the aviation system, automation has also had many beneficial effects on workload and
safety. The ground-proximity warning system (GPWS) is a good example of the beneficial
effects of automation on safety. It warns pilots when aircraft come in close proximity to the
ground (e.g. close to mountains). Terrain strike accidents have been drastically reduced since
GPWS became mandatory in 1974 (Wiener & Curry, 1980). The capability for automated hand-
offs has reduced ATCo workload and freed resources for other, more important tasks.
Automation can also bring large economic benefits, for example through aircraft fuel
conservation, reduced travel times, and a reduction in crew size from three to two persons in
most automated cockpits. However, these benefits have not come without a cost.
As suggested (Parasuraman et al., 2000; Parasuraman, 2000), human performance
consequences should be the primary evaluative criterion for designing an automated system.
This raises the issue of what some of the human performance consequences of automation are,

3. Automation
12
both positive and negative. In the cockpit and other human-machine systems, advances in
technology (e.g. microprocessor technology) make automation a reasonable alternative to manual
control. To automate functions because it is technologically feasible is considered a technology-
centered approach. To automate functions in order to support the human while leaving the
human operator to perform functions that humans are good at is considered a human-centered
approach (Billings, 1997).
Wiener et al. (1980) were among the first to point out disadvantages of a technology-
centered approach to automation in the aircraft cockpit and questioned that automation could
reduce human error by removing the human operator. In addition to the many psychosocial
implications of automation (e.g. job satisfaction, operator selection, training), several
automation-related problems have occurred. With the automation of a manual control task, the
human has become a monitor of the system rather than an active member (“supervisory control”,
Sheridan, 1992). Automating higher-order cognitive processes (e.g. the calculation of fuel
supply) also requires the operator to oversee the proper functioning of the automation. Effects
similar to the vigilance decrement can be expected (Mackworth, 1948, 1950; Teichner, 1974;
Parasuraman, 1979). Humans have difficulties sustaining attention over long periods of time to
oversee the automation. The change from a manual controller to a supervisor of a system also
has implications for the retention of the manual skill. More than likely the skill will decline if it
is not used. Finally, Wiener et al. (1980) discuss the issues of alerting and warning systems such
as frequent false alarms that lead to ignoring the warning.
In another seminal paper, Bainbridge (1983) points out the “ironies of automation” in
process control. Oftentimes, the human is considered unreliable by the designer and therefore
eliminated from the system. This leads to the first irony that the designer is also human and
therefore can be unreliable; i.e. make mistakes in the design of the automated system. In fact,
designer errors can be a major source of many operating problems. The second irony is that the
designer who tries to eliminate the human operator still leaves the human in the system with an
arbitrary collection of tasks that the designer cannot automate (yet). Indeed, the human seems to
play a rather important role in highly automated systems. He or she is expected to (a) monitor
the automation and (b) intervene in case it does not work as expected. It is incongruous that
automation is put into a system because it is superior to the human operator, but that the human
operator remains to oversee and diagnose the proper functioning of the automation. Problematic

3. Automation
13
is also that after monitoring the system for a long time, the manual skills of the operator decline
and intervention might be difficult. Still, human operators are given tasks that can only be
performed effectively if the operators are manually controlling the system.
The following section will review some of the automation-related human performance
consequences in more detail.
Excessive trust and misuse of automation. As increasingly more automation is
introduced in the cockpit and other domains, the human remains to oversee and supervise the
automation. However, human monitoring of automated systems is often poor (Parasuraman,
Molloy, & Singh, 1993; Parasuraman, Mouloua, Molloy, & Hilburn, 1996). Human operators
are able to detect system malfunctions fairly well when manually operating a system or when
monitoring an automated system is the only task. However, when a system is automated and
other tasks have to be accomplished, detection of system malfunctions deteriorates dramatically
over time. This inefficiency in human operator monitoring of automation is referred to as
complacency (Billings, Lauber, Funkhouser, Lyman, & Huff, 1976). It is interesting that even
very unreliable automation (e.g. reliability of 25%) can cause reduced monitoring performance
under automated compared to manual conditions (May, Molloy, & Parasuraman, 1993).
Several explanations for automation complacency have been put forward. Parasuraman
et al. (1993) proposed that complacency is due to the sub-optimal sharing of attentional
resources. This is reflected in reduced attention allocation to the automated system compared to
manual performance due to overreliance and high trust in the automation. The view that
automation-related complacency reflects a sub-optimal sharing of resources in a multi-task
environment is consistent with the absence of complacency in a single task situation in a basic
flight (Parasuraman et al., 1993) and an ATC (Thackray & Touchstone, 1989) task.
Complacency also does not appear to be a result of purely visual factors or insufficient visual
sampling of the automated task. Locating the monitoring task in the center of the monitor and in
central as opposed to peripheral vision did not reduce complacency (Singh, Molloy, &
Parasuraman, 1997). Moreover, spatial superimposition of the automated and primary manual
tasks did also not reduce complacency (Duley, Westerman, Molloy, & Parasuraman, 1997).
When eye fixations were forced on the automation monitoring task by superimposing it on the
primary tracking task in a simulation of multiple flight tasks, primary task performance was
3. Automation
14
preserved (indicating that the participants must have fixated in that area), but complacency was
not reduced. Even though performance in the primary task indicates that participants fixated on
the monitoring (and tracking) task, they might not have allocated any attentional resources to the
monitoring task. This raises the issue of the dissociation between eye movements and attention
(Palmer, 1998). While eye movements require a shift of attention prior to their execution
(“mandatory shift hypothesis), shifts in attention do not require eye movements (Hoffman, 1998;
Pashler, 1998). Humans can shift their attention while maintaining fixation.
Nevertheless, Moray (2000) proposed that the optimal monitoring or sampling (i.e. eye
fixation) of a system depends on the frequency of the occurrence of signals in the system.
According to Moray, even if the visual sampling of the automated system is optimal or “eutactic”
(i.e. calibrated to the frequency of the occurrence of signals in the system), system malfunctions
will inevitably be missed because of the unpredictability of system failures and the presumed
single-channel nature of human attention (a view that contrasts sharply with other theories that
maintain that attention can be divided (Parasuraman, 1998; Wickens, 1984)). Moray (2000)
postulated that an observer could only be called complacent if a source is sampled less frequently
than would be necessary by the occurrence of signals in the system (i.e. based on a model of
optimal sampling). Complacency can also not be determined by detection, but only by sampling.
According to Moray (2000), an operator should not be called complacent (which he associates
with “blaming” the operator) if he or she samples according to an optimal model, but
nevertheless misses a signal because of the unpredictability of the occurrence of the signal. An
observer would be called “skeptical” if he or she sampled more often than necessary according to
the frequency of signal occurrences. A problem with this theory arises from the difficulty in
establishing an optimal sampling rate in complex human-automation environments. Therefore, it
might not be possible to empirically validate Moray’s (2000) model.
Finally, Farrell and Lewandowsky (2000) proposed that complacency reflects a
weakening of the memory trace of the automated function over time. They explained this in
terms of the well established generation effect in the memory literature. Stronger memory traces
are induced by cognitive processes that are actively generated than by processes that are simply
observed. The advantage of adaptive over static automation is also consistent with the
hypothesis that complacency reflects a weakening of the memory trace of the automated function
over time.

3. Automation
15
Automation is typically introduced into systems to reduce biases in decision-making, for
example the bias of an ATCo to attend to only a limited number of cues with the potential
consequence to miss a conflict. However, while the introduction of automation reduces one type
of bias in decision-making, it introduces another, the "automation bias" (Mosier, Skitka, &
Korte, 1994; Mosier & Skitka, 1996; Mosier, Skitka, Heers, & Burdick, 1998; Skitka, Mosier, &
Burdick, 1999). The automation bias refers to errors resulting from the use of automation cues
as a replacement for continuous information seeking and processing (Mosier et al., 1998).
Decision aids do not present just another cue for decision-making. Often, the automation cues
are more salient and considered superior to conventional information. Sometimes, the cues
originally used for diagnosis are fully replaced by the automation cue. As trust in an automation
aid increases, humans rely on the automation without checking it. Sometimes, the “raw” data on
which the automated decision is based might not even be available for cross-checking of the
automation anymore. This heuristic of relying on the automation saves cognitive capacities and
is successful most of the time. However, when the automation fails, decision-making breaks
down. The automation bias is very similar to the complacency concept, particularly when
omission errors occur. Omission errors arise when decision-makers do not take appropriate
action (e.g. fail to detect a conflict) because the automated decision aid does not inform them of
an imminent problem or situation. Commission errors occur when decision makers
inappropriately follow automated information or recommendations even though there is
information in the environment that is inconsistent with the automation cue. Mosier et al. (1998)
found that experience does not make operators less prone to automation bias. In fact, in one of
her studies the more experienced pilots were more likely to rely on automated cues only.
Reduced trust and automation disuse. While complacency is a problem of excessive trust
in the automation, problems can also arise when operators trust the automation too little. After a
train accident near Baltimore in 1987, for example, it was found that the alarm in the train cab
had been taped over. Even after an inspection had been announced, investigators found other
trains in which the alarm had been taped over (Parasuraman & Riley, 1997). Disabling alarms
can be a consequence of frequent exposure to false alarms. Operators tend to ignore or even turn
off alarms that have "cried wolf" too often (Sorkin, 1988). In the case of a true emergency, the
alarm either is ignored or remains silent because the operator has learned not to take it seriously.

3. Automation
16
Ideally, alarms should be designed to maximize the likelihood of detection and minimize the
likelihood of false alarms. However, based on Bayesian analysis Parasuraman, Hancock, and
Olofinboba (1997) showed that this might not be enough. Even though systems have high
detection rates and low false alarm rates, the posterior probability for a true critical event (e.g. a
midair collision between aircraft or rear-end collision of cars) can be very low if the base rate for
the critical event is very low. Consequently, only a small proportion of alarms represents true
critical events. In fact, good operators (e.g. experts) are less likely to create situations in which
true critical events occur and thereby can reduce the base rate of a critical event even further.
Therefore, good operators could further increase the likelihood of false alarms by reducing the
base rate of a target event such as a collision (Meyer and Bitan, in press). Consequently, good
operators might distrust the automation even more than less experienced ones and not take
advantage of it in the rare occasion of a true problem. The concept of likelihood alarms (Sorkin,
Kantowitz, & Kantowitz, 1988) might be a solution to the problem. Instead of providing two
alarm states (i.e. collision versus no collision), likelihood alarms indicate the level of probability
that a given alarm represents in fact a dangerous condition (e.g. from very unlikely to highly
likely).
Manual skill degradation. That knowledge or skills deteriorate when they are not used
for extended periods of time is well established in the literature (Arthur, Bennett, Stanush, &
McNelly, 1998). In human-interaction with automated systems, skill degradation can result from
the infrequent opportunity to practice or perform a learned skill (e.g. because the automation is
carrying out the function that requires a particular skill). Typically, the longer the period of
nonuse, the greater the decay. The degradation of skill only becomes apparent when the
automation fails or becomes unavailable. In case of a sudden failure of the automated system
operators have to rely on manual skills that they have not had to use in a long time. Time
pressure, stress, and surprise might further aggravate the situation.
A decline in the ability to manually control aircraft was observed in pilots transitioning
from co-pilot positions on modern automated aircraft to pilot-in-command positions on less
automated aircraft (Wiener & Curry, 1980). As a consequence, some airlines suggested that
pilots should frequently resume manual control as they are approaching this transition in order to
regain their skill in manually controlling the aircraft (Wiener & Curry, 1980; Bainbridge, 1983;
3. Automation
17
Billings, 1997). It is typically assumed that higher degrees of overlearning (i.e. repeated use of a
skill) are associated with lower degrees of skill degradation (Arthur et al., 1998). However,
airline policies regarding the use of automation differ. Some air carriers require their pilots to
always make full use of the automation.
Skill degradation is not restricted to psychomotor skills, but can also be found in more
complex cognitive processes such as problem-solving or decision-making (e.g. the navigation
based on charts that is frequently conducted by the flight management system now). In fact, as
Arthur et al. (1998) concluded from their meta-analysis on the moderators of skill decay and
retention, cognitive tasks are much more susceptible to skill decay than physical tasks.
Comparing standardized units, the decay of cognitive skills was about twice the size of the decay
of physical skills. This will become of particular importance when increasingly more automation
of higher-order cognitive skills is introduced into many systems. High-level decision automation
could result in a degradation of cognitive skills because of their disuse due to automation.
In the ATC environment, ATCos are almost exclusively trained in full radar
environments, but expected to revert to procedural control (i.e. ATC based on their mental
picture of air traffic, communication, and flight strips) in case of a radar failure. Fortunately,
there is back-up equipment and full radar failures have become rare. The introduction of
decision-making automation could degrade skills such as decision-making in the detection and
resolution of conflicts. In the future, the problem of skill degradation will most likely be
aggravated by the fact that younger operators of human-machine systems transition to automated
systems much sooner than their older colleagues did and therefore lack the level of skill and
long-time experience with manual operations that their senior colleagues can fall back on
(Bainbridge, 1983). This applies both to manual control and higher-order cognitive skills (e.g.
decision-making).
To counteract manual skill degradation, manual skills are regularly trained in simulators
in aviation or process control systems. For the future, the concept of adaptive automation has
shown promise to reduce the problem. In contrast to conventional automation that statically
allocates a function either to the human or the machine, adaptive automation allows for the
flexible allocation of functions to humans or machines depending on the environmental situation,
operator state, or models of these (Parasuraman, Bahri, Deaton, Morrison, & Barnes, 1992;
Rouse, 1988).
3. Automation
18
Further, the disuse and the associated degradation of skills could lead to a decrease in
operator self-confidence to manually carry out that skill. Therefore, it is likely that trust in
automation will be greater than self-confidence and as a consequence, operators will use
automation more frequently, perhaps even in situation that do not warrant the use of automation
(Mosier et al., 1994).
Out-of-the-loop phenomenon. Wickens (1992; 1994) describes a complex of symptoms
induced by poorly designed automation and calls it the “out-of-the-loop unfamiliarity
(OOTLUF)” phenomenon. First, operators have difficulties to detect automation failures. A
complacent operator is less likely to monitor the automation therefore loosing awareness of the
elements and dynamics of the system and its current state. If a failure is detected, the human
operator needs a rather long time to intervene because he or she has to first regain awareness of
the system state. Operators have a better mental model or awareness of the system state when
they are actively involved in creating the state of the system than when they are passively
monitoring the actions of another agent or automation (Endsley, 1996; Endsley & Kiris, 1995).
Situation awareness (SA) refers to the operator’s awareness of (1) the elements in a system, (2)
their relationship to each other, and (3) the projection of their future state. All three elements are
necessary for effective decision-making in dynamic environments (Endsley, 1996). Mode errors
are an expression of reduced situation awareness (Sarter & Woods, 1994, 1995a). Automation
on modern flight decks has reached such a level of autonomy that modes of the flight
management system can change without the pilot’s awareness. In an ATC simulation of FF
conditions in which passive monitoring was compared to active control it took controllers longer
to detect conflicts when they were passively monitoring pilot self-separations than when they
were actively controlling traffic similar to current conditions (Metzger & Parasuraman, in press).
The problem of manual skill degradation discussed in the previous section can also contribute to
the fact that it takes longer to intervene from a monitoring than a passive role.
Mental workload. While many of the costs associated with automation have been on
performance, the following paragraph focuses on the effects of automation on mental workload.
One of the problems associated with mental workload in automated systems is the unbalanced
distribution of mental workload. Automation can reduce workload in phases of work that

3. Automation
19
already require little workload and increase workload even further in phases that already impose
a high demand on the operator (“clumsy automation”, Wiener, 1989). A typical example is
automation in modern cockpits. Through the autopilot and flight management system, pilot
workload has been reduced considerably. However, while workload is reduced significantly
during cruise flight - a phase in flight that already imposes relatively little demand - workload
can be significantly increased during take-off or landing. For example, if the crew is informed of
a last-minute runway change during the final approach, the FMS has to be reprogrammed in a
relatively short amount of time causing considerable workload for the crew during a phase of
flight that already imposes a relatively high demand. In this case, an automation aid
implemented with the goal to reduce workload becomes a burden and actually increases
workload in an unforeseen situation.
As mentioned before, automation also leads to the situation that instead of manually
performing a task, the operator is left to monitor or supervise the automation over extended
periods of time (“supervisory control”; Sheridan, 1992). This requires considerable sustained
attention or vigilance. For a long time, vigilance tasks were associated with under-arousal and
very low mental workload. The vigilance decrement typically observed in these tasks (e.g.
Parasuraman, 1979) was explained by the lack of stimulation that is necessary to support
alertness (arousal or activation model of the vigilance decrement; Frankmann & Adams, 1962).
Recent studies (Warm, Dember, & Hancock, 1996), however, have shown that vigilance tasks
impose a rather high level of mental workload characterized by high subjective ratings on the
frustration and mental demand sub-scales on the National Aeronautics and Space Administration
Task Load Index (NASA-TLX; NASA Ames Research Center, 1986; Hart & Staveland, 1988).
These findings are incompatible with the arousal model of the vigilance decrement. Rather, it
was suggested that the vigilance decrement could be explained with a resource model. The
depletion of information-processing resources during the course of a vigilance task is due to the
constant need for the operator to make a decision regarding the presence of a signal or non-signal
in the environment. This can be associated with considerable mental workload. Decision-
making can be facilitated and mental workload can be reduced if careful consideration is given to
system design (e.g. high signal salience, low background event rate, avoidance of noise, reduced
spatial uncertainty).
3. Automation
20
Most of the research on the costs and benefits addressed the automation of relatively low-
level cognitive functions (e.g. monitoring or tracking) in the cockpit. It remains to be studied
how mental workload is affected by the automation of complex decision-making processes and
other higher-order functions. One speculation is that operator mental workload would not be
reduced as much in higher-order functions as in lower-order functions, if it is reduced at all. The
operator's evaluation of the output of the automated decision-making process might require
similar levels of mental workload as if the operator made the decision by him- or herself. The
present work will help to gain an understanding of the effects of the automation of higher-order
cognitive processes on mental workload in ATC. Eventually, this will help in the early
identification and avoidance of problems that were encountered in other domains such as the
cockpit or maritime automation (Lee & Sanquist, 1996).
As noted previously, human factors research on cockpit automation has shown that
automation can have subtle and sometimes unanticipated effects on human performance
(Parasuraman & Riley, 1997; Wiener, 1989). A recent FAA-sponsored report on crew-flight
deck system interfaces has documented several incidents and accidents that have resulted from
difficulties flight crews have interacting with cockpit automation (FAA, 1996). The report
makes a number of recommendations in the areas of design, research, training, and regulatory
standards. Similar effects of automation on human performance have been noted in other
domains where advanced automation has been introduced, including medical systems, ground
transportation, process control, and maritime systems (Parasuraman & Mouloua, 1996).
3.4 Automated systems in ATC
ATC automation has not been of the scale and complexity of cockpit automation.
Controllers still only have few automation tools available and the tools available provide
assistance with mostly lower-order cognitive functions. Automated data integration on the radar
display is one example for the automation of a lower-order cognitive function (Hopkin, 1999).
While primary radar only provides the lateral and longitudinal position of aircraft, secondary
radar associates a label or data block to each aircraft target including aircraft identity, altitude,
speed, and aircraft type. In addition, routine actions such as handing-off aircraft from one
controller to the next have been facilitated by automation. This reduces the requirement for

3. Automation
21
coordination between ATCos and frees ATCo resources for other, more important tasks or to
accommodate user requests. Short-term conflict alerts (STCA) warn controllers of impending
conflicts within the next two minutes based on current aircraft altitude, speed, and heading
information. They do not take intended flight paths as indicated on the flight strips into account
for conflict prediction. Whenever a set threshold is crossed (e.g. two minutes to collision), the
ATCo is alerted. Even if one of the aircraft is expected to change its flight path (e.g. based on
the flight plan) or one of the two aircraft involved is flying under VFR the controller is alerted
resulting in frequent false alarms. Another type of alert is the minimum safe altitude warning
(MSAW) that alerts the controller of aircraft flying dangerously low in order to avoid controlled
flights into terrain. Most of these automation tools support or replace relatively low-level
cognitive functions (e.g. monitoring for low altitude flights). Whenever a set threshold is
crossed, an alarm goes off. Pilot intentions are not taken into account or projections into the
future are not made. Aids such as the STCA or MSAW support the operator's information-
processing in the first stage of information acquisition (see figure 3.1) by capturing and guiding
the ATCo's attention to the relevant information. Nevertheless, these automation tools have
yielded several benefits (e.g. increased safety) and freed up controller resources and time to
concentrate on other important task such as conflict detection or to respond to user requests. In
the future, a new generation of automation will be able to provide assistance with higher-order
cognitive processes such as decision-making (Parasuraman, Duley, & Smoker, 1998; Wickens et
al., 1998a; Billings, 1997). A few such tools have been studied and are already implemented.
These tools and their effects on ATCo performance and mental workload will be described
below.
As part of the FAA Free Flight Phase (FFP) 1 and 2 programs (Human Solutions, 1999),
ATCos will be provided with several automated decision aids to make FF feasible. En route
ATCos will be given access to tools that assists them in making decisions on where and when in
the future aircraft will be in conflict and how to resolve the conflicts. These tools are already
being field tested and scheduled for deployment to en route centers. The implementation of the
User Request Evaluation Tool (URET) is among the FAA's top priorities. URET is a conflict
detection and resolution aid that assists controllers in detecting potential conflicts between
aircraft or between aircraft and restricted airspace and suggests conflict resolutions. URET
continuously checks current flight plan trajectories for strategic conflicts up to 20 minutes into
3. Automation
22
the future. Tools like URET include highly sophisticated algorithms that analyze and integrate
data from different sources (e.g. radar data, flight plans) considering numerous additional
parameters (e.g. climb rates for different aircraft types, wind and weather models, etc.). They go
well beyond the capability of simple alerts such as the STCA.
Such decision aids are expected to be especially useful in the unstructured airspace under
FF conditions. URET also allows controllers to evaluate pilot requests or potential conflict
resolutions for conflicts in the form of a "what if" function before actually giving a clearance. It
monitors conformance of flight trajectories and provides access to electronic flight data
eventually replacing paper flight progress strips (Brudnicki & McFarland, 1997; Human
Solutions, 1999). Similar tools such as Direct-to (Erzberger, McNally, Foster, Chiu, & Stassart,
1999) or the conflict prediction and trial planning (CPTP) tool (McNally, Bach, & Chan, 1998)
are also being discussed and considered for implementation.
Conflict detection aids like URET, CPTP, or Direct-to provide decision aiding at the
stage of information analysis and integration or decision selection (to the extent that they
recommend a course of action). Conflict detection aids integrate a subset of information from
several different sources (e.g. flight plans, radar track, weather information), project aircraft
status into the future, and assess if a conflict is to be expected within a specific period of time.
This goes beyond the stage of information acquisition in which specific information is
highlighted or attention is cued, for example when an alarm goes off if a specific threshold is
crossed such as in the STCA or MSAW. In those cases, there is no projection into the future or
inference from the observed information. Conflict detection aids make a decision based on an
inference on the current state of the world (Wickens, 2000). It is expected that conflict detection
aids will guide selective attention and reduce biases in controller decision-making by assisting
controllers in attending to the appropriate information. However, this needs to be evaluated
empirically.
As the ATC system matures, increasingly higher-order cognitive functions are automated.
This process ranges from the host system of the 1980s that provided data acquisition for the
ATCo to the more sophisticated systems that detect and resolve conflicts. While none of the tools
under development implement actions automatically (yet), it is conceivable that in the future
actions might be implemented automatically by a decision aid (e.g., an automated conflict
resolution could be automatically uplinked into the cockpit).

3. Automation
23
3.5 Conclusion
While automation has provided many benefits, it has not always come without a cost.
Often, the introduction of automation into a system was associated with unanticipated human
performance consequences. Therefore, it is important to assess the effects of a proposed system
on human performance before the system is built and implemented in high-risk environments. A
new system should at least be safety-neutral, preferably safety-enhancing, and never compromise
safety. The modernization of the ATC system cannot occur at the expense of safety. On the
contrary, to neutralize the increase in traffic, accident rates have to be reduced and safety
increased within the next few years. One of the most important aspects of system safety is the
human operator in the system. Operators typically perform many system functions and even as
increasingly more functions can be performed by highly reliable automation, an additional
function of the human operator is to oversee the automation and assure safety. Therefore, it is
essential to understand how the proposed changes affect operator performance and mental
workload in order not to compromise system safety.
The impending introduction of automation into the ATC system provides a unique
opportunity to further our understanding of human interaction with automation and take into
account the lessons learned from other domains (e.g. cockpit automation) to design a safe
system. Problems encountered with previous attempts to automate other systems can be foreseen
and avoided while automation benefits can be exploited. The early involvement of human
factors researchers is essential to have an impact on system design.
The purpose of this chapter was to review some of the costs and benefits of automation
encountered in the ATC and other domains. The next chapter will focus on the concept of
mental workload and performance in the ATC environment.

4. Mental workload and performance
24
4. Mental workload and performance
Mental workload and performance in the ATC environment are determined by many
factors. The number of aircraft under control is one of the most obvious ones. With increasing
air traffic, the workload of the ATCo increases up to a point where the controller can no longer
handle traffic safely or efficiently. Until recently, controller workload could be reduced by
dividing larger sectors into smaller ones and assigning additional controllers to the newly created
smaller sectors. However, sectors cannot be divided perpetually. While increasing the number
of sectors reduces the number of aircraft a controller is responsible for, it also increases the need
for inter-controller coordination and communication. The reduction in workload due to the
smaller number of aircraft is neutralized by the greater need for coordination between
controllers. In addition, the smaller the sector size, the less time the controller spends with an
aircraft giving him or her less chances to “learn” about an aircraft (e.g. characteristics such as
heavy or slow) and to build a picture of the situation. Smaller sector sizes also cause
proportionally more work per aircraft because of the shorter time in the sector. A more recent
approach is to reduce controller mental workload by reducing the amount of time and effort an
ATCo spends per aircraft. This might be achieved with the introduction of FF and automation.
However, it needs to be assured that these approaches will not reduce safety.
Mental workload is one of the factors that determines performance and therefore is
important to assess. In addition, mental workload assessments provide an index of the operator's
spare capacity to perform other tasks. While performance assessment determines the effects of a
new design on performance under certain operating conditions, workload assessment allows the
designer to determine the operator's spare capacity and predict performance in responding to and
recovering from unusual situations (e.g. bad weather) or emergencies. While controllers might
perform equally well under design options A and B, their mental workload might be moderate in
option A leaving enough spare capacity and very high in option B leaving no spare capacity to
respond to additional demands. Based on a workload assessment, design option A would be
preferable. Therefore, performance is not a sufficient criterion for the design of a safe system.
Operator mental workload needs to be taken into account equally, as it can be the limiting factor
in an attempt to increase efficiency, capacity, and safety.

4. Mental workload and performance
25
4.1 Theoretical foundations of mental workload
The concept of mental workload evolved from attention research. While the study of
selective attention addresses why and when humans selectively attend to one versus other
stimuli, the study of workload refers to the intensity of this process. Attention is not an "all-or-
nothing" process. It is a matter of degree how intensive the level of attention is that is expended
and how much information is processed, especially in a multi-task environment (Kahneman,
1973; Manzey, 1998).
Measuring human capacity and the amount of information humans can process has long
been of interest in psychology. The application of information theory (Attneave, 1959; Garner,
1962) tried to provide measures of channel capacity in terms of how much information was
processed in a certain time (bits/sec). However, variables such as stimulus-compatibility and
stimulus discriminability proved to be more important determinants of performance than the
amount of information that was processed (Kahneman, 1973).
Most human-machine systems require the division of attention among concurrent
activities. Two types of models can be distinguished to explain the division of attention among
concurrent activities: structural and capacity models. Structural models assume that interference
between concurrent activities occurs when the same mechanism is required to carry out two
incompatible activities at the same time. Broadbent’s (1958) filter theory assumed that the
structural mechanism (i.e. the filter) where parallel processing is impossible is located between
the stages of sensory registration or storage and perceptual analysis (“early selection”). Deutsch
and Deutsch (1963) on the other hand proposed that the filter is located before response selection
takes place so that only one action can be executed at a time (“late selection”). Structural models
imply that interference between concurrent activities is specific and takes place to the extent that
activities call for the same mechanism. In a capacity theory of attention, Moray (1967)
suggested that there is a general limit on capacity to perform concurrent tasks and that this
limited capacity can be freely allocated among concurrent activities. When an activity demands
more capacity than can be supplied, performance degrades. Performance can fail if there is not
enough capacity to meet the demands or if the allocation of capacity is sub-optimal or allocation
is not allocated to relevant information at all.
Kahneman (1973) introduced a theory of mental effort in which one source of resources
is assumed to meet all demands imposed by the processing of information. Models based on the
4. Mental workload and performance
26
concept of attentional capacity or resources describe mental workload in terms of how much
capacity a particular task requires in order to complete it. Mental workload is the ratio of
capacity available to capacity required to complete a task. Resource models assume that certain
tasks can be performed concurrently and information is processed in parallel. Models of mental
workload differ in the number of resource pools they assume. Kahneman (1973) assumed a
single pool of resources. All tasks, (e.g. visual or auditory, psychomotor or memory tasks)
compete for the same resources and physiological measures of activation can be used to assess
the use of resources or mental effort.
Wickens (1980; 1984) expanded the capacity model by assuming separate pools of
resources for different stages and modalities of information processing. His model divides
information processing into three dimensions: (1) stages of information processing
(perceptual/cognitive and response), (2) codes of processing (verbal and spatial), and (3) input
and output modalities (visual and auditory for input, speech and manual for output). Tasks
interfere with each other to the extent that they share or compete for the same resources. E.g. a
controller could communicate and search the radar for a conflict without interference as one task
uses auditory, the other visual resources.
While some empirical evidence supports the validity of resource theory (e.g. Isreal,
Wickens, Chesney, & Donchin, 1980), the theory has also been criticized (e.g. Navon, 1984;
Neumann, 1985, 1996). It has been criticized that the number of resource pools could be further
divided until they match any empirical data. Others have said that empirical data does not
require the assumption of resources, but that interference can be explained by an outcome
conflict.
Although there is no single agreed upon definition of mental workload, O’Donnell and
Eggemeier (1986) define mental workload as
“the portion of the operator’s limited capacity actually required to perform a particular
task. The objective of workload measurement is to specify the amount of expended capacity.”
Therefore, operator workload reflects the level of demand for resources imposed by a
certain task. Workload is an intervening construct that reflects the relationship between the
demands of the environment imposed on the human operator and the capability of the operator to
meet those demands (Parasuraman & Hancock, 2001). However, the definition makes it clear
that there are individual differences in workload because operators can have different capacities

4. Mental workload and performance
27
or a task might require different amounts of resources depending on the operator. Novices need
more attentional resources to perform a task than experts do. While task performance is
automatic for experts, novices rely on effortful rather than automatic information processing
(Schneider & Shiffrin, 1977; Shiffrin & Schneider, 1977). Effortful processing is more
susceptible to interference than automatic processing.
In addition to the resource-limited information processing, information can be data-
limited (Norman & Bobrow, 1975). While under resource-limited information processing an
increase in effort can lead to better performance, this is not the case for data-limited processing.
The allocation of additional resources does not improve performance when processing is data-
limited. For example, if an operator is required to detect a very dim signal on a noisy
radarscope, the limits of the sensory system and the quality of the data prevent the operator from
improving his or her performance. No matter how hard the operator tries, performance will not
improve. The only way to improve performance is to improve the quality of the data or the
operator's sensory system, for example after resting (Kramer, 1991).
4.2 Mental workload and performance in ATC
4.2.1 Evidence from accidents and incidents
It is a common belief that ATC is a very busy, stressful job with constant high ATCo
workload and that the higher the workload the higher the likelihood for incidents or accidents.
This might not be true. While some researchers have found an increase in operational errors
under high traffic load (Morrison and Wright, 1989), others have also found an increase under
low to moderate traffic loads (Redding, 1992; Stager, Hameluck, & Jubis, 1989). Fowler (1980)
noted that most controllers perform well under high traffic, but that errors tend to occur once
traffic slows down. This suggests that the change in workload might be related to the occurrence
of errors.
In an analysis of incidents in US air route traffic control centers, Schroeder and Nye
(1993) studied the relationship between severity (i.e. aircraft proximity in the horizontal and
vertical dimension) of operational errors and mental workload as indexed by the number of
aircraft and ratings of sector complexity. Neither the number of aircraft in a sector nor sector

4. Mental workload and performance
28
complexity were related to the severity of operational errors. Different levels of error severity
were distributed equally across all levels of complexity.
The authors also studied the contributing factors to fifteen major operational errors, seven
of them classified as near midair collisions. They found major operational errors under all levels
of workload. In another analysis of incident reports, Rodgers, Mogford, and Strauch (2000)
found more frequent and more severe operational errors (i.e. a smaller separation remained,
especially in the horizontal dimension) when controllers were unaware of the developing
situation than when they were aware, but did not resolve the situation appropriately.
4.2.2 Model of mental workload in air traffic control
These inconclusive findings indicate that the relationship between ATCo performance
and workload is not a simple one. Figure 4.1 displays a model on the relationship between
taskload or workload drivers and performance (Wickens, Mavor, & McGee, 1997) that could
elucidate the relationship between workload and operational errors. Central to the model is the
distinction between workload drivers or taskload and workload. In addition, strategies is
included to explain operator and system performance. The relationship between workload
drivers and controller workload is mediated by the strategies that the controller chooses. High
traffic load in a sector leads to high workload, but also to the choice of strategies (e.g. task
shedding) that keep workload at an acceptable level. Examples for strategies include prioritizing
of important tasks or shedding of less important tasks. Inappropriate levels of workload (i.e.
excessive overload and underload) can degrade controller performance and lead to suboptimal
system performance. The following sections discuss workload drivers and strategies in more
detail.
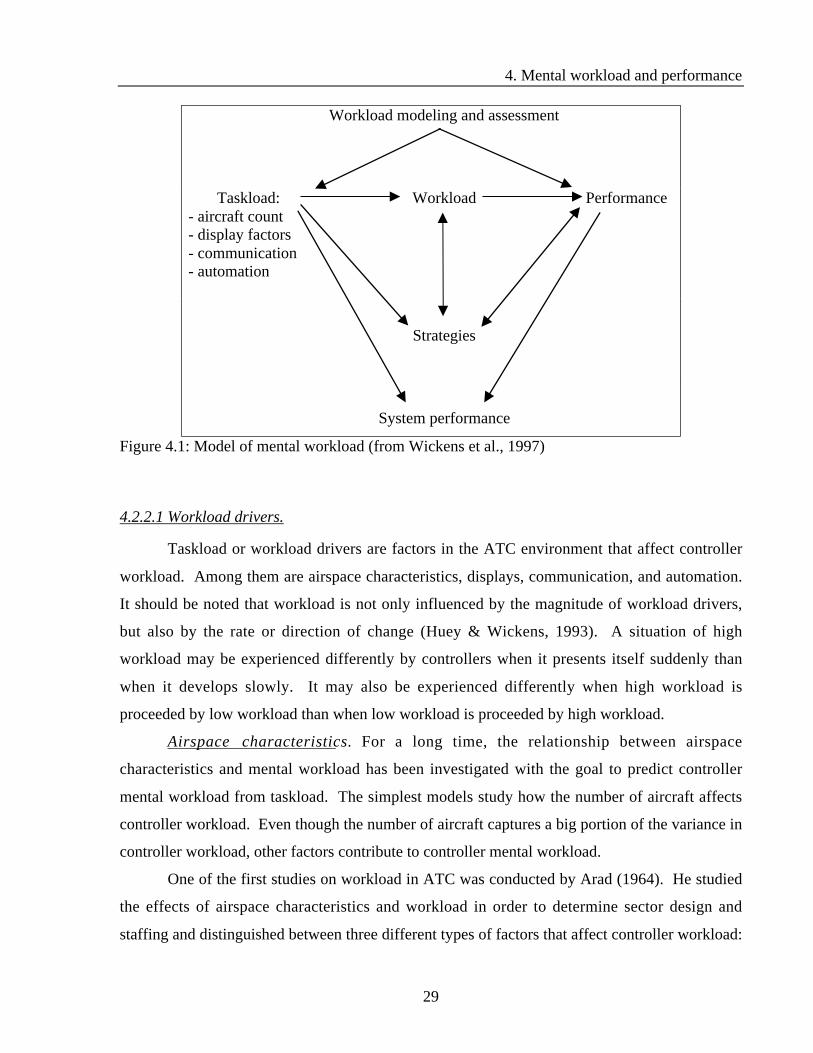
4. Mental workload and performance
29
Workload modeling and assessment
Taskload:- aircraft count- display factors- communication- automation
Workload Performance
Strategies
System performance
Figure 4.1: Model of mental workload (from Wickens et al., 1997)
4.2.2.1 Workload drivers.
Taskload or workload drivers are factors in the ATC environment that affect controller
workload. Among them are airspace characteristics, displays, communication, and automation.
It should be noted that workload is not only influenced by the magnitude of workload drivers,
but also by the rate or direction of change (Huey & Wickens, 1993). A situation of high
workload may be experienced differently by controllers when it presents itself suddenly than
when it develops slowly. It may also be experienced differently when high workload is
proceeded by low workload than when low workload is proceeded by high workload.
Airspace characteristics. For a long time, the relationship between airspace
characteristics and mental workload has been investigated with the goal to predict controller
mental workload from taskload. The simplest models study how the number of aircraft affects
controller workload. Even though the number of aircraft captures a big portion of the variance in
controller workload, other factors contribute to controller mental workload.
One of the first studies on workload in ATC was conducted by Arad (1964). He studied
the effects of airspace characteristics and workload in order to determine sector design and
staffing and distinguished between three different types of factors that affect controller workload:

4. Mental workload and performance
30
(1) routine load (e.g. the number of aircraft under control, the number of terminal area hand-offs
that have to be scheduled and sequenced over a certain fix, or the time an aircraft spends in a
sector), (2) airspace load (e.g. average airspeed in a sector, average aircraft separation, or size of
airspace), and (3) background load.
Kalsbeek (1971) attempted to quantify controller workload in order to establish limits of
human capacity and determine the requirements for current and future ATC systems. He
assumed that controller workload is determined by the number of elements under control and the
complexity of the control to be exercised. Other early studies were done by Barrer (1982),
Swedish (1982), Swedish and Niedrighaus (1983), and Stein (1985).
Mental workload in ATC is also determined by the relationship of the aircraft to each
other, that is, the proximity of aircraft to each other and the angle of their vectors. Lamoureux
(1999) recently investigated the impact of different aircraft-to-aircraft relationships on ATCo
mental workload indicated by subjective ratings. The greatest driver for mental workload was a
relationship where one aircraft was level while the other was climbing or descending and the
aircraft were on converging tracks. The least significant contributors to mental workload were
relationships where aircraft were head-to-head to each other. This can be attributed to the fact
that the former situation is much more difficult to resolve than the later (turn both aircraft right).
In general, aircraft in one-dimensional flight (flying straight and level) contributed less to mental
workload than aircraft in two-dimensional (changing altitude or heading) or three-dimensional
flight (changing altitude and heading). These experimental findings correspond to the findings
of Rodgers et al. (2000) based on incident analysis.
Stager, Ho, and Garbutt (2000) showed that the single variable of total flight minutes,
that is the number of minutes an aircraft spends in a controller's sector summed across all aircraft
in the sector for a 10-minute period accounted for up to 70% of observed controller workload as
indexed by over-the-shoulder expert ratings. Stager et al. (2000) demonstrated the feasibility to
automatically and continuously measure controller workload for a specific sector with a
regression equation that is based on one-time ratings of observed workload and continuously
recorded flight minutes. This equation can serve as a criterion to assess the impact of system
changes on controller workload and performance or to decide on appropriate staffing.
As the aviation community moves towards FF, there has been an renewed interest in
understanding the contribution of various sector characteristics to sector complexity and

4. Mental workload and performance
31
controller mental workload and efficiency with the goal to determine sector design, controller
training and staffing, display coding, and understand controller decision making (Mogford,
Murphy, & Guttman, 1994; Mogford, Guttman, Morrow, & Kopardekar, 1995). Under FF, the
structure of the traditional ATC system will be replaced by a more unstructured and complex
system. Dynamic Density (DD) is a measure to predict controller efficiency and workload by
airspace factors relevant to the FF concept (Mogford et al., 1995; Wyndemere, 1996). Different
equations to predict mental workload have been proposed by different researchers (Wyndemere,
1996; Laudeman, Shelden, Branstrom, & Brasil, 1998; Mogford et al., 1994; Stein, 1985; Smith,
Scallen, Knecht, & Hancock, 1998). Beside aircraft count, a common contributor to controller
workload in most equations is the number of aircraft that are changing their heading, speed, or
altitude as well as the angle of convergence. In an equation by Wyndemere (1996), level of
ATCo knowledge about aircraft intent and aircraft density were the strongest predictors of sector
complexity. Dynamic Resectorization is a concept closely related to DD. Depending on the DD
determined for a particular sector, the sector design or size could be changed and adjusted so that
the controller workload remains within an acceptable level. However, Pawlak, Bowles, Goel,
and Brinton (1997) found that a fixed set of sector designs would be superior to an unlimited set
so that controllers can be trained on different designs and know what to expect. Besides, it was
concluded that sector boundaries should not change as dynamically as originally proposed. The
amount of coordination that is required for a sector boundary change (e.g. when aircraft belong
to a different sector before versus after the boundary change) would outweigh the benefits of the
new sector design. It was suggested that sector boundary changes could follow a daily schedule
based on known traffic flows and jet streams. Besides, sector boundary changes should only
occur when workload is low and should be modifiable by managers or supervisors. Hadley,
Sollenberger, D'Arcy, and Bassett (2000) came to a different conclusion. Dynamic
resectorization did not interfere with controller performance in a simulation study with twelve
ATCos. In fact, controllers experienced fewer losses of separation in the dynamic
resectorization condition, rated mental workload on the NASA-TLX lower, and had higher
situation awareness than in the baseline condition. Clearly, more research is needed regarding
the feasibility of this concept.
Display factors. Controllers depend largely on radar displays to receive information such
as aircraft callsigns, reported and assigned altitudes, and speed. Therefore, displays play an

4. Mental workload and performance
32
important role. They can either significantly reduce workload if they are well designed or
significantly increase workload if they are poorly designed. A poorly designed display (e.g.
clutter, poor luminance, contrast, and font size) can disrupt the controllers selective attention
process and therefore increase workload. The need to project aircraft poses a high workload on
the controller (e.g. when merging two streams of traffic approaching an airport). New displays
that aid the controller in the projection and prediction of aircraft paths have become available
(e.g. the computer-assisted approach sequencing/ghosting; Mundra, 1989). Three-dimensional
displays could help to facilitate the visualization of the vertical dimension.
Communication. Voice is still the primary means of communication between controllers
and pilots through radiotelephony in order to keep aircraft separated and avoid that they enter
weather, restricted airspace, or other hazards (e.g. on or around the runway). Voice
communication is also necessary between controllers for taking hand-offs and handing aircraft
off to the next controller. Several studies have focused on the role of voice communication on
workload. High levels of communication might not only increase workload, but also
compromise situation awareness and building a mental model of the situation. Other issues are
misunderstandings and confusions (e.g. callsign confusion), "hearback" problem (Morrow, Lee
& Rodvold, 1994), and incorrect or partial readbacks from pilots that could increase workload.
Voice communication has also been used as a dependent variable for workload measurement.
Sperandio (1971; 1978) found that controllers reduced the time they spent communicating with
aircraft as workload increased. In the future, voice communication will be replaced, at least for
routine communications, by a digital datalink. It remains to be studied how the use of a digital
datalink affects controller performance and mental workload. The digital transmission of data
could support memory functions (e.g. controllers could save messages and look them up at a
later point in time). However, the transmission of data via datalink might interfere with the
visual scanning of the radar because processing of information from both sources requires visual
attention.
Automation. Automation can moderate taskload. For example, it is expected that
automation will reduce the negative effects of high traffic density on workload and ATCo
performance. How automation can affect mental workload has already been discussed in the
chapter on the costs and benefits of automation. Even though automation is usually introduced
with the goal to reduce mental workload, this has not always been successful. Automation can

4. Mental workload and performance
33
reduce or increase mental workload or leave it unchanged. Therefore, the effects of automation
as a moderator of taskload are less predictable than other drivers (e.g. traffic density). The
unbalanced distribution of workload as well as the supervisory or monitoring role of the operator
are among the issues that need to be taken into consideration when automation is introduced into
a system. As advanced decision-making automation is being introduced into the ATC system,
this issue should receive special consideration.
4.2.2.2 Strategies and workload management
It is difficult to specify the relationship between taskload, workload, and performance
because human operators do not passively respond to their environment. Operators use strategies
to cope with the load imposed by tasks and to balance their workload. They respond adaptively
to their environment and by doing so can manipulate the environment. In his seminal papers,
Sperandio (1971, 1978) first emphasized the role of strategies in the relationship between
taskload and controller workload. In an experiment with French tower controllers, he found that
controller workload increased with traffic, but that controllers significantly shortened their
communication, became more proactive in controlling traffic, and increased the amount of
information per unit of time to cope with the taskload. Several different types of strategies can
be distinguished (Parasuraman & Hancock, 2001). Workload can be distributed over time such
that controllers prepare for high-priority tasks when workload is low or shed low-priority tasks
when workload is high. Workload can also be distributed over available resources. If the
demands exceed a controller's resources, a second controller can be called for help or the sector
can be divided. However, as sectors are divided into smaller sectors, the need for coordination
and communication between controllers increases and diminishes the expected reduction in
workload. Controllers can also change the nature of their task by postponing or aborting tasks,
or choosing a different standard of performance. Not accepting any more aircraft into the sector
by putting aircraft into a holding pattern or increasing the spacing between aircraft (which both
can reduce the efficiency of the system significantly) represent the most common strategies in
ATC to reduce both taskload and workload. If controller strategies are not successful in coping
with the demands of the environment or controllers do not have adequate strategies (e.g.

4. Mental workload and performance
34
inexperienced controllers), performance breaks down. Most of the time, however, controllers are
successful in adapting to the demands of the situation with strategies.
The ATCo’s adaptation to the demands of the situation is the reason why we do not
necessarily observe an association between taskload, workload, and performance. A dissociation
is found when taskload is high, but workload is low. This could occur when the load gets so
high that the operator gets overwhelmed, disengages and reduces his or her workload. Figure 4.2
displays potential relationships between workload and performance (Parasuraman & Hancock,
2001). Workload insensitivity is found when workload remains constant, but performance
changes. Performance insensitivity is present when operator performance remains constant, but
workload changes. Association is found when performance and workload increase together,
dissociation when one increases as the other decreases. An understanding of this relationship is
helpful to interpret performance and workload data.
Performance increase
Dissociation Workload insensitivity Association
Performance
insensitivity
Associat., Dissociat.,
Workload insensitivity
Performance
insensitivity
Workload
increase
Association Workload insensitivity Dissociation
Figure 4.2: Relationship between performance and workload measures (Parasuraman &
Hancock, 2001)
4.3 The need for operator-in-the-loop studies
The complicated association between taskload, mental workload, and performance
supports the need for controlled operator-in-the-loop studies in the laboratory to investigate their
relationship. Incident reports can only provide evidence for correlation, but not cause. While the
level of workload must be inferred from recorded traffic or reports in incident analysis, it can be
easily determined and manipulated in operator-in-the-loop studies.

4. Mental workload and performance
35
While modeling (e.g. Performance and usability modeling in ATM - PUMA; Rose,
Kilner, & Hook, 1997) provides an inexpensive means to determine mental workload before the
system is implemented (e.g. during design and prototyping) the prediction will only be as good
as the underlying model. Even though the influence of workload drivers can be modeled, the
prediction of system performance has to be complemented by operator-in-the-loop simulations in
order to take operator strategies into account. Taskload is mediated by strategies and together
with workload determines controller performance. The same amount of workload drivers can
result in a considerably different performance between controllers.
While laboratory experiments often lack the ecological validity and complexity of the
real world, field studies usually do not allow for experimental control. Simulator experiments
with subject matter experts allow researchers to incorporate the real world complexities while
maintaining experimental control. Operator-in-the-loop simulations allow for a relatively easy
manipulation of the variables that influence performance and mental workload (e.g. number of
aircraft, presence or absence of a decision aid) and for the measurement of operator performance
as well as strategies. By manipulating taskload, different strategies can be observed (Brookings,
Wilson, & Swain, 1996). These features together make operator-in-the-loop simulations
advantageous over accident or incident analysis, field observations and modeling approaches.
The following sections describe how mental workload can be measured in operator-in-the-loop
experiments.
4.4 Measuring mental workload
Research on mental workload that is based on capacity or resource-theory approaches
typically assesses mental workload in operator-in-the-loop simulations using a battery of four
measures: (1) primary task performance, (2) secondary task performance, (3) subjective ratings
of mental workload, and (4) physiological measures. A combination of all four measures
provides greater sensitivity to workload variations than each measure individually (Eggemeier &
Wilson, 1991) and the assessment has greater stability than any measure by itself (Parasuraman
et al.; 1992). Especially, when workload is not high enough to degrade performance in the
primary task because the operator can compensate for increased task demand, secondary task,

4. Mental workload and performance
36
subjective, or physiological measures can discriminate higher from lower levels of operator
workload.
4.4.1 Primary task performance
Primary task measures assess the operator’s capability to perform a particular task of
interest. The task of interest is typically an operator function within the human-machine system
of investigation (e.g. driving a car, flying an aircraft, or controlling air traffic). Therefore,
primary tasks are very domain-specific and must be chosen for the respective application.
Measures of primary task performance assume that an increase in information-processing
demands is associated with an increase in resource expenditure. If the task demands exceed the
available resources, task performance degrades (Eggemeier & Wilson, 1991). Speed and
accuracy in the task of interest are typical measured.
In an ATC system, a primary task of interest is the detection of aircraft on a conflict
course. It is important to investigate detection rate as well as timeliness of detection. If conflicts
are detected too late, there might not be enough time to resolve a detected conflict. Examples of
ATC studies will be presented in a review of empirical studies in ATC in chapter 5.
An additional approach to mental workload is the assessment of operator strategies. It is
not only of interest what the level of operator performance is, but also how it was obtained.
Modifications in the way an operator performs the primary task of interest could be an indicator
for mental workload. This approach is highly sensitive since it allows to observe variations in
workload before performance degrades (Welford, 1978). ATCos, for example, treat aircraft
individually if they have enough resources available. However, as soon as demand exceeds
capacity, ATCos treat aircraft as a group rather than individually thereby reducing demand
(Sperandio, 1971).
4.4.2 Secondary task performance
Based on a resource or capacity view of mental workload, performance in a secondary
task is measured to assess spare capacity (Kahneman, 1973). The assumption is that as the
demand in the primary task increases, performance in the secondary task declines. Subsidiary
4. Mental workload and performance
37
task or loading task paradigms have been used to evaluate mental workload. In a subsidiary task
paradigm, the operator is instructed to maintain primary task performance at a single-task
performance level and perform the secondary task as much as possible. The difference in the
secondary task performance should reflect differences in the resource expenditure in the primary
task. In loading task paradigms, the emphasis lies on the secondary task. Variations of resource
expenditure on the secondary task are reflected in the primary task performance.
Secondary tasks can be artificial or embedded. An embedded task is a task that is usually
part of a job, but of lower priority such as the updating of flight strips in an ATC task. Artificial
secondary tasks include visual or auditory choice reaction times tasks (Kantowitz, Hart, &
Bortolussi, 1983; Kantowitz, Bortolussi & Hart, 1987; Kantowitz, Hart, Bortolussi, Shively, &
Kantowitz, 1984) time estimation or time interval production tasks (Hart, 1975; Michon, 1966),
mental arithmetic (Brown & Poulton, 1961; Wierwille & Connor, 1983), or memory search tasks
(Sternberg, 1966; Wierwille & Connor, 1983; Wickens, Hyman, Dellinger, Taylor, & Meador,
1986).
Brown and Poulton (1961) conducted one of the first studies to measure mental workload
in driving with an artificial secondary task. Two groups of drivers that differed in their level of
driving experience were instructed to drive in a residential (moderate load) and a shopping area
(high load) while performing a secondary task that required adding three-digit numbers. The
experiment showed both the sensitivity of the secondary task to driving and rest conditions and
to driving in different areas. Secondary tasks are more likely to be sensitive if participants have
to rely on effortful processing and cannot automatically perform them, and if the secondary task
relies on the same type of resources as the primary task (e.g. a visual secondary task in an ATC
task which is highly visual). The problem with artificial secondary tasks is that they might face
acceptance problems in operational settings. For an overview on secondary tasks, see O’Donnell
and Eggemeier (1986) or Eggemeier and Wilson (1991).
4.4.3 Physiological measures
The use of physiological measures for the assessment of mental workload has several
advantages (Kramer, 1991; Wilson & Eggemeier, 1991). One of the most important ones is the
fact that physiological measure do not require overt behavior to assess mental workload.

4. Mental workload and performance
38
Supervisory control tasks or the monitoring of automated systems typically require little overt
operator behavior leaving the researcher with little behavior to observe and limited data to
collect. Therefore, physiological measures are especially useful when assessing human
monitoring of and interaction with automation. In addition, physiological measures can be
obtained relatively unobtrusively and do not change the primary task of interest. They can
provide different views of the multi-dimensional concept of mental workload. As different
measures are sensitive of different aspects of mental workload, a battery of physiological
measures allows for a diagnosis of the source of workload. While some physiological measures
respond faster (e.g. event-related potentials, ERP; heart rate variability, HRV) than others (e.g.
brain metabolism measured with Positron Emission Tomography, PET, or functional magnetic
resonance imaging, fMRI), all respond relatively quickly to phasic shifts in workload. This
makes them valuable for the approach to implement automation adaptively (adaptive automation,
adaptive function allocation, or adaptive aiding, Parasuraman et al., 1992; Rouse, 1988). Rather
than implementing automation statically in an all-or-none fashion, adaptive automation adjusts
the level of automation based on events in the environment, models of optimal operator
performance, or user states to make maximum use of the benefits of automation while reducing
the disadvantages. Physiological measure could be used as indicators of operator overload or
underload states. Disadvantages of physiological measures include the high cost, the lack of
standardized scaling and interpretation, the difficulty to discriminate signal from noise, and the
contamination of the signal by factors other than workload (e.g. physical workload or movement,
emotions, environmental factors such as ambient lighting).
A multitude of physiological measures have been used for mental workload assessment
such as the electro-encephalo-gram (EEG, e.g. alpha and theta activity), ERP (Parasuraman,
1990), in particular the P300, heart rate and heart rate derived measures, in particular the .10 Hz
component of HRV, epinephrine levels in the blood, and ocular measures such as pupil diameter,
eye blink rate, and saccadic eye movements (Backs & Boucsein, 2000).
Measures of cardiovascular activity. Aasman, Mulder & Mulder (1987) showed that the
.10 Hz band was sensitive to manipulations of memory load and concluded that changes in the
amplitude of the .10 Hz band "reflect the use of resource-limited, effortful, mental operations"
that rely on working memory. The .10 Hz amplitude is associated with the regulation of blood
pressure. It is suppressed with increased load on working memory, but only resource-limited,

4. Mental workload and performance
39
and not data-limited processes lead to a change in the .10 Hz amplitude. Vicente, Thornton, and
Moray (1987) showed the sensitivity of the .10 Hz band of HRV to difficulty manipulations in a
psychomotor task. In a study on the detection, diagnosis and correction of faults and incidents in
flight engineer trainees in a flight simulation, the .10 Hz band of HRV was reduced during a high
workload problem-solving phase during level flight (Tattersall and Hockey, 1995). The .10 Hz
band has shown sensitivity to detect fatigue in driving (Egelund, 1982). However, not all
researchers have found HRV to be sensitive to different levels of mental demand (Wilson, 1992).
Byrne, Chun, and Parasuraman (1995) found that the .10 Hz band of HRV was sensitive to rest-
task manipulations, but not to manipulations of tracking difficulty in flight simulator tracking
task. Similarly, Jorna (1992) concluded in a review paper on HRV that the .10 Hz band can
reliably distinguish between rest and load conditions, but is not as sensitive to distinguish
between levels of difficulty of a task. Therefore, HRV has great potential to detect underload
conditions in the context of automated systems (Byrne & Parasuraman, 1996). Meshkati (1988)
concluded that heart rate variability is considered one of the most used and most promising
physiological measures of mental workload.
ATC has a long tradition in the use of physiological measures to assess workload
(Kalsbeek, 1971). Several studies have shown HRV to be useful for the assessment of mental
workload in ATC. In a study with eight military ATCos, Brookings et al. (1996) assessed the
differential sensitivity of different physiological measures of workload in an ATC simulation.
Workload was manipulated by varying traffic volume and traffic complexity. Complexity was
manipulated by varying the mixture of aircraft types and the ratio of departing and arriving
traffic. Brookings et al. (1996) showed the sensitivity of HRV to workload manipulations for
several physiological measures. HRV was sensitive to the complexity manipulation, but not as
expected in the .10 Hz band, but the .15-.4 Hz band.
Visual attention. Perhaps the most directly related to the attentional resource concept of
mental workload, at least in the visual domain, are the measures of saccadic eye movements and
eye fixations. How long the eye rests at a given coordinate is an indicator for the amount of
information that is gathered or the effort expended to gather the information. That eye
movement patterns can describe the objects of attention in the environment was first described in
the classic work by Yarbus (1965/1967). Recent advances in technology have made saccadic
eye movement recording devices more affordable and data collection in dynamic environments

4. Mental workload and performance
40
more feasible than in the past allowing for a unique insight into visual attention processes of
operators of human-machine systems (Velichkovsky & Hansen, 1996). The primarily visual
nature of tasks in the flight deck or the ATC environment make eye movement recording a prime
candidate to the understanding of mental workload in these systems. The recording of saccadic
eye movements in the context of automation is relatively new.
Saccadic eye movements and visual attention are closely related, even though not fully.
While a shift in attention preceding a saccade is mandatory to determine where the next fixation
will occur (“mandatory shift hypothesis”), a saccade to or a fixation of a location does not
guarantee a shift in attention to that same location. In other words, attention can move
independent of the eyes (Pashler, 1998; Hoffman, 1998). This can be shown in a simple
demonstration in which a participant is asked to maintain eye fixation on a particular point in the
environment and name the color of an object in the periphery. Even though the participant
maintains eye fixation on a point, he or she can shift his or her attention to an object in the
periphery and name the color. Nevertheless, saccadic eye movements and attention are related to
a great extent. A functional tie between the two is given due the fact that visual acuity is greater
in the center of the fovea than in the periphery. If an object in the environment is of special
importance, it becomes necessary to move the eyes and foveate or fixate the object in order to
improve the quality of the information and perceive details (Pashler, 1998). Therefore, eye
movements and fixations can serve as a measure of the allocation of attentional resources to a
particular point in the environment or the information-processing demand of a particular task
(Wickens & Hollands, 2000). Humans make about 3-4 saccades during a second (Becker, 1991
as cited in Hoffman, 1998) during which information processing is suppressed. Information is
processed only during fixations, the time between saccades as a person looks at a stationary
target in the visual field. Saccades are extremely fast and can reach speeds of up to 900° of
visual angle per second (Goldberg, 2000).
Visual sampling in a supervisory control task can be distinguished from a target search
task. In a supervisory control task the location of a target is known. The frequency and timing
of the sampling is of interest. In a target search like the search for conflicting aircraft in ATC,
the existence and location of targets is unknown.
Van Orden, Limbert, Makeig, & Jung (in press) found systematic changes in several eye
measures as a function of target density in a visuospatial memory task. Blink frequency, fixation

4. Mental workload and performance
41
frequency, and the extent of saccades in degrees were associated with greater visual information
processing load (early stages) while pupil diameter as associated with greater cognitive
processing (later stages of information processing).
Wierwille, Rahimi, and Casali (1985) found an effect for the total time spent fixating on
the navigation display in their flight simulation with a navigational task that required
trigonometric calculations. The time fixating on the display increased with task difficulty.
Callan (1998) on the other hand found that the frequency of fixations longer than 500 ms was
related to the number of flight rule errors committed in a flight simulation.
In a study on visual scanning and pilot expertise Bellenkes, Wickens, and Kramer (1997)
found that experts fixated on most instruments more frequently and had shorter dwell times (i.e.
their gaze remained in an area for shorter periods of time) than novices. The most information-
rich instruments were fixated more often than others and experts extracted information more
efficiently (i.e. in a shorter amount of time) than novices, especially from the instruments that
conveyed the most information. Experts also showed a pattern that guarded them from tunneling
in on displays by checking primary flight indicators even when they performed maneuvers that
were not expected to change the indicator. Bellenkes et al. (1997) proposed that visual scanning
is a good indicator of the underlying mental model of the operator by showing that experts
demonstrated the cross-coupling of instruments during a maneuver while novices did not show
this cross-coupling pattern. That experts (as indicated by flight hours) had more frequent
fixations and shorter dwell times than novices was also found by Kasarskis, Stehwien, Hickox,
Arentz, and Wickens (2001) in a study of scanning behavior during VFR landings. Better
landing performance was associated with the same pattern of more frequent fixations, but shorter
dwell times. This pattern is consistent with other studies in simulated instrument flight (Fitts,
Jones, Milton, 1950; Kramer, Tham, Konrad, Wickens, Lintern, Marsh, Fox, & Merwin, 1994;
Tole, Stephens, Harris, & Ephrath, 1982) and ATC (Stein, 1992). Tole et al. (1982) found an
increase in fixations on the attitude directional indicator, one of the most information-rich
displays in the cockpit, for novices, but not in experts. Experts had shorter dwell times
indicating higher automaticity of information-processing. Tole et al. also found that dwell
duration increased with mental workload in a simulated communication task. Increased dwell
duration under high workload was also found by Harris, Tole, Stephens, and Ephrath (1982).

4. Mental workload and performance
42
An FAA task force in 1987 found that operational errors in ATC were associated with the
ATCos’ failure to see critical information and initiated a research program on controller
information scanning to understand why controllers fail to see critical information so that errors
could eventually be reduced. Stein (1989) defined scanning as “a systematic and continuous
effort to acquire all necessary information in order to maintain complete awareness of activities
and situations which may affect the controller’s area of responsibility.”
In Stein's (1992) study on the effects of ATCo experience and traffic load on ocular
measures such as saccade duration and extent, fixation frequency and duration, he found that
experienced controllers searched their environment more frequently than less experienced
controllers. An impact of taskload on performance or eye movements was not found. However,
activity level was related to saccade duration. The busier the controller became, the shorter and
more frequent were his or her saccades. Stein (1992) also found that scanning behavior changes
significantly in the first five minutes on the radar. Saccade extent and duration became shorter
and then stabilized. Average fixation duration increased during the same period. This correlates
with controller reports that most operational errors happen in the beginning of a shift or after
controllers return to the radar after a break. Stein (1992) also investigated if the eye tracker had
an impact on controller perception in the study. Controllers reported wearing the eye tracker was
most annoying when traffic was low, but tended to forget about it when traffic load was high.
However, none of the controllers reported that it influenced their operational strategy. In fact,
ATCos made fewer operational errors when they were wearing the eye tracker than without it,
perhaps due to the fact that the eye tracker and visor that the participants look through help to
focus on the task.
In a study on the effects of active versus passive control and traffic load in sixteen air
traffic controllers, Willems and Truitt (1999) found that the level of control (active or passive) or
traffic load did not affect the number or duration of fixations, but changed the scan pattern.
Controllers showed a less structured or more random scanning pattern as indicated by a
conditional information index (Ellis & Stark, 1986) under high traffic and when controllers were
actively controlling under high traffic.
Willems, Allen, and Stein (1999) studied the effects of task load, visual noise on the
radar, and intrusions of VFR or IFR aircraft into controlled airspace on eye movements and other
variables of twelve controllers. They found that the number of fixations on the radar decreased
4. Mental workload and performance
43
with increasing traffic load. The increase in traffic load diverted the attention of the controller to
other areas and tasks in the ATC environment (e.g. the keyboard to update flight strips).
Controllers also focussed on areas of high traffic density. This could be the reason why
controllers missed to detect airspace intruders in some cases and detected them late in others. A
problem with the measure of saccade duration in these studies is the fact that eye movements
were recorded at a speed of 60 Hz (i.e. every 17 ms). Assuming that saccades typically take only
about 30 ms, this measure is not very reliable.
Another difficulty with ocular measures such as fixation or dwell frequency and duration
is the lack of definition of these terms. Oftentimes, the studies do not describe their criteria for
fixations or dwells. Sometimes, these terms are used synonymously, sometimes dwells are
defined as a series of fixations. In addition, each eye tracking system gives a different output
with different criteria for fixations or dwells and most systems are flexible to allow researchers
to set their own criteria. Standardization in the use of terms and criteria would allow for a better
understanding and comparison between the different studies. Nevertheless, the studies show
promise for fixation frequency and duration as new measures of mental workload. Compared to
other measures, eye parameters allow researchers to capture attentional strategies as a response
to task demands that are otherwise difficult to obtain.
4.4.4 Subjective measures
The easiest way to measure mental workload is to ask the person performing a task how
much workload he or she experienced. Several standardized scales have been developed for this
purpose among them the NASA-TLX (NASA-Ames Research Center, 1986; Hart & Staveland,
1988; Byers, Bittner, & Hill. 1989; Nygren, 1991), the subjective workload assessment technique
(SWAT; Reid & Nygren, 1988; Reid & Colle, 1988; Biers & McInerney, 1988; Reid, Potter &
Bressler, 1989), the subjective workload dominance technique (SWORD, Vidulich & Tsang,
1987; Vidulich, Ward, & Schueren, 1991; Tsang & Vidulich, 1994), the Cooper-Harper Scale
(Cooper, 1957; Cooper & Harper, 1969; Wierwille & Casali, 1983), or the Bedford Scale
(Roscoe, 1987; Wainwright, 1987). Most of them have multiple dimensions (e.g. mental
demand, temporal demand, physical demand, frustration) corresponding to the findings that
mental workload is affected by factors independent of each other. Research has not shown major

4. Mental workload and performance
44
advantages of one of the scales over the others (Eggemeier & Wilson, 1991). However, they all
rely on the participants’ ability to accurately recall their level of resource expenditure
retrospectively. There has been some concern regarding the reliability of such information
(Eggemeier & Wilson, 1991). The Air Traffic Workload Input Technique (ATWIT; Stein, 1985)
is a unidimensional subjective rating scale specifically designed to measure workload in air
traffic control. However, the unidimensionality of the scale does not lend the scale much
diagnostic value (i.e. does not help to determine if workload is caused by frustration or mental
demand, e.g.).
The NASA-TLX consists of six subscales three of which characterize the demand a task
places on the operator (mental, physical, temporal demand) and three that results from the
interaction between operator and task (performance, effort, frustration). The NASA-TLX is
considered to be one of the most effective measures of subjective mental workload (Nygren,
1991; Hill, Iavecchia, Byers, Zakland, & Christ, 1992). It is convenient to use and has good
(test-retest) reliability (Warm et al., 1996).
Subjective measures of mental workload might also reveal information on future user
acceptance of the tool or procedure under investigation. If operators subjectively experience
increased workload when using a tool, they might be hesitant to accept and use it. Conversely,
when operators experience a reduction in workload, they might be very interested in
implementing and using a tool. In the worst case, this could contribute to an overreliance on the
tool.
4.4.5 Relationship between measures
Although the use of all four types of measures allows for a comprehensive evaluation of
performance and mental workload consequences of design alternatives in human-machine
systems, results from the four types of measures do not always lead to the same conclusion.
Sometimes dissociation between the different measures of workload can be observed (Yeh &
Wickens, 1988). Physiological and subjective measures might indicate higher workload, but
primary performance might improve. Such a dissociation of measures provides a unique insight
into operator strategies and could reflect increased effort to keep up with the primary task which
is reflected in improved or constant performance, higher subjective ratings of mental workload,

4. Mental workload and performance
45
and physiological measures indicating higher workload. Therefore, a dissociation of different
workload measures provides valuable information about the strategies operators employ to cope
with the situation (see 4.2.2). While dissociations between performance and workload measures
indicate strategies, dissociations between workload measures could increase the diagnosticity of
the assessment. For example, the .10 Hz band of HRV is only sensitive within the resource-
limited region of information-processing (Aasman et al., 1987). If subjective ratings of mental
workload are very high, but the .10 Hz band of HRV shows no effects, operators could have
reached the data-limited region of information-processing.
5. Review of empirical studies on FF and ATC automation
46
5. Review of empirical studies on the impact of automated decision aids
and Free Flight
The following sections provide a review of studies on the effects of automated decision
aids and FF on ATCo mental workload and performance. It is essential to review the literature
on both, FF and ATC automation. First, automation is essential for FF and therefore, the two
concepts go hand in hand. In fact, future ATC automation has to be designed for use in a FF
environment. In addition, FF and automation are similar in terms of their effects on the
controllers. Both can lead to a transfer of some aspects of decision-making away from the
controller. Humans are less aware of changes in the environmental or system state when those
changes are under the control of another agent, either automation or another human (i.e. the
pilots). The operator may not be able to sustain a good picture of the situation when not actively
engaged. Therefore, the effect of airborne separation is similar to the effect of automation in that
it could lead to a loss of controller situation awareness.
5.1 Free Flight
The move towards FF (RTCA, 1995) and the projected increase in air traffic over the
next decade (Wickens et al., 1998a; Eurocontrol, 1998) will change the airspace structure
drastically. An increase in the number of flight paths and flight path variability has been shown
with computer simulations. Traffic patterns became less uniform and predictable under FF (Ball,
DeArmon & Pyburn, 1995). This change will most likely increase the difficulty of detecting
conflicts. While under current conditions potential conflict points are limited to the intersecting
airways, FF conditions will create more potential intersections. Figure 5.1 demonstrates the
structure of the airspace under current and FF conditions. With the same number of aircraft it is
much more difficult to control traffic under FF than under current conditions. In addition, pilots
will be allowed to change their flight plan at any time making aircraft movements unpredictable
for the ATCo.
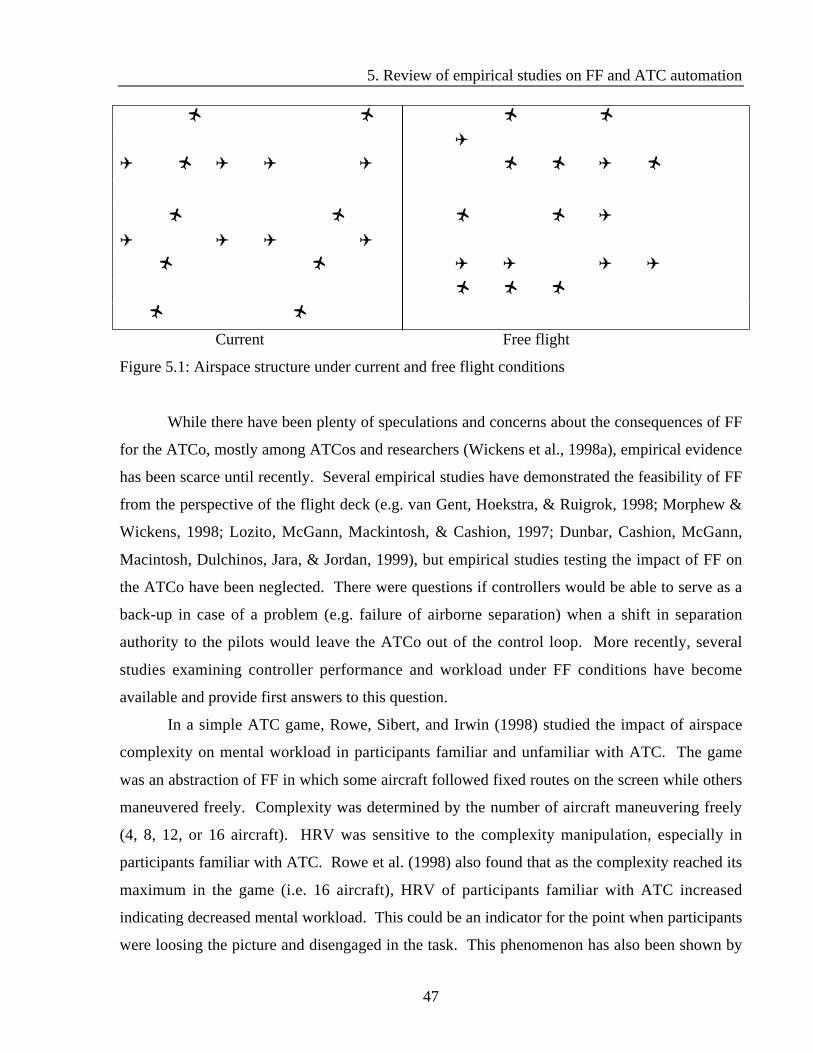
5. Review of empirical studies on FF and ATC automation
47
! ! ! !
✈
✈ ! ✈ ✈ ✈ ! ! ✈ !
! ! ! ! ✈
✈ ✈ ✈ ✈
! ! ✈ ✈ ✈ ✈
! ! !
! !
Current Free flight
Figure 5.1: Airspace structure under current and free flight conditions
While there have been plenty of speculations and concerns about the consequences of FF
for the ATCo, mostly among ATCos and researchers (Wickens et al., 1998a), empirical evidence
has been scarce until recently. Several empirical studies have demonstrated the feasibility of FF
from the perspective of the flight deck (e.g. van Gent, Hoekstra, & Ruigrok, 1998; Morphew &
Wickens, 1998; Lozito, McGann, Mackintosh, & Cashion, 1997; Dunbar, Cashion, McGann,
Macintosh, Dulchinos, Jara, & Jordan, 1999), but empirical studies testing the impact of FF on
the ATCo have been neglected. There were questions if controllers would be able to serve as a
back-up in case of a problem (e.g. failure of airborne separation) when a shift in separation
authority to the pilots would leave the ATCo out of the control loop. More recently, several
studies examining controller performance and workload under FF conditions have become
available and provide first answers to this question.
In a simple ATC game, Rowe, Sibert, and Irwin (1998) studied the impact of airspace
complexity on mental workload in participants familiar and unfamiliar with ATC. The game
was an abstraction of FF in which some aircraft followed fixed routes on the screen while others
maneuvered freely. Complexity was determined by the number of aircraft maneuvering freely
(4, 8, 12, or 16 aircraft). HRV was sensitive to the complexity manipulation, especially in
participants familiar with ATC. Rowe et al. (1998) also found that as the complexity reached its
maximum in the game (i.e. 16 aircraft), HRV of participants familiar with ATC increased
indicating decreased mental workload. This could be an indicator for the point when participants
were loosing the picture and disengaged in the task. This phenomenon has also been shown by

5. Review of empirical studies on FF and ATC automation
48
Aasman et al. (1987) and could be an indication of a switch from resource-limited to data-limited
information processing (Norman & Bobrow, 1975). Subjective ratings of mental workload
measured with the NASA-TLX increased with the number of free flyers even when the number
of free flyers was increased from 12 to 16.
Endsley, Mogford, Allendoerfer, Snyder, and Stein (1997) tested ten full performance
level (FPL) civilian controllers in a high-fidelity ATC simulation under four conditions: a
baseline corresponding to current ATC procedures, direct routing with intended flight path
information, direct routing with deviations from intended flight path after sharing intent with the
controller, and direct routing with deviations from intended flight path without sharing intent
with the controller. Measures of performance, mental workload, and situation awareness served
as dependent variables. Situation awareness was assessed using subjective measures and the
Situation Awareness Global Assessment Technique (SAGAT; Endsley & Kiris, 1995). SAGAT
stopped the simulation at random intervals and controllers were probed about their awareness of
the current and future traffic situation (e.g. aircraft location, callsign, separation, hand-offs, etc.).
While operational errors were significantly increased only in the condition in which pilots
deviated from their flightplan without sharing their intent, subjective mental workload increased
and situation awareness decreased in all FF conditions. Higher levels of FF were associated with
higher levels of workload and lower levels of situation awareness. Endsley et al. (1997) noted
that direct routing increases the controllers need to communicate and query the pilot’s intent
suggesting that the increased communication was the major contributor to the increase in mental
workload under FF. The knowledge of pilot intent seems to be a critical determinant of
controller performance.
Galster, Duley, Masalonis, and Parasuraman (2001) investigated ATCo conflict-detection
performance and mental workload in a medium-fidelity ATC simulation. Ten active en route
ATCos were required to monitor air traffic under moderate and high traffic density, but were not
provided with pilot intent information. Results indicate that ATCos had difficulties in detecting
conflicts or self-separating events in a timely manner. In the moderate traffic condition, 10% of
the conflicts were not detected prior to the loss of separation. In the high traffic condition 50%
of the conflicts were missed. Self-separating events remained unreported even more frequently.
70% in the moderate and 85% in the high traffic load condition were missed. Under high traffic,
notification of impending conflicts was reduced and mental workload increased as indexed by

5. Review of empirical studies on FF and ATC automation
49
subjective ratings and secondary task performance. Galster et al. (2001) concluded that FF will
create a highly efficient and dense airspace leaving the ATCo with little time to respond to
emergencies.
In an experiment by Endsley and Rodgers (1998), twenty controllers passively monitored
recorded traffic scenarios that each included an operational error. The scenarios froze two
minutes prior and at the time of the operational error and controllers were asked a series of
questions that addressed their awareness of the system state (e.g. where on a blank sector map
particular aircraft were at the point of freezing and in the next two minutes, aircraft callsign,
altitude, speed, etc.). Controllers had difficulties recalling many system parameters (e.g. the
location of aircraft or speed). Reporting of dynamics (e.g. recalling which aircraft were in a
turn) was especially poor as was their awareness if aircraft had complied with a clearance or if
the execution of the clearance was finished or still impending. Lower accuracy was associated
with a higher number of aircraft under control and, to a lesser extent, higher reported mental
workload. While the accuracy for most aircraft details decreased significantly with the number
of aircraft, accuracy in reporting which aircraft were in conflict, both currently and in the near
future, was unaffected. This probably indicates a prioritizing strategy. Since attending to all
aspects of the situation would exceed controller capacity, controllers focus on important over
unimportant aspects. While this heuristic is efficient most of the time, there may be instances in
which it will lead to a failure (e.g. when a pilot does not follow the controllers' clearance or when
an aircraft reaches the assigned altitude later than expected).
The authors concluded that the low awareness of aircraft parameters was at least partially
due to the passive monitoring as opposed to active controlling condition. In a similar
experiment, Mogford and Tansley (1991; as cited in Endsley & Rodgers, 1998) studied
controller trainees under active controlling conditions. Although they found a similar
distribution of attention to each type of information (e.g. aircraft location or callsign), controllers
achieved a much higher accuracy in their awareness of current and future system states. This has
implications both for FF conditions and the automation of higher-order cognitive functions.
Since both can put controllers in a monitoring role, reductions in situation awareness can be
expected.
These studies provided the first empirical evidence that ATCo performance under FF
might be compromised. They also indicated that the passive monitoring role of the ATCo might

5. Review of empirical studies on FF and ATC automation
50
be one of the reasons for reduced ATCo performance under FF conditions. Metzger and
Parasuraman (in press) directly compared the effects of active control versus passive monitoring
and moderate and high traffic density on controller mental workload and performance in an ATC
simulation. Eighteen ATCos participated in an ATC simulation under active control and passive
monitoring of traffic and under moderate and high traffic density. Dependent variables included
accuracy and timeliness in detecting potential conflicts, accepting and handing-off aircraft.
Mental workload was assessed with a secondary task, heart rate variability and NASA-TLX
ratings. Results showed detrimental effects of high traffic and passive control on performance.
Even though there was no difference in the number of potential conflicts detected, it took
controllers under high traffic density and monitoring conditions significantly longer to detect
potential conflicts. This is an important finding considering that FF will create a highly efficient
and dense airspace leaving the ATCo with little time available to resolve conflicts or other
emergencies. If less time is available, but ATCos require more time under FF conditions as
shown in this study, performance and safety could be severely compromised.
Willemsen and Truitt (1999) conducted a similar study on the effects of reduced
involvement in en route ATC on eye movements, workload, and situation awareness. Mental
workload was rated lower under monitoring than active control conditions. Workload correlated
well with traffic load. Response times to questions related to SA were unaffected by traffic load
under active control. However, SA was significantly decreased under monitoring conditions in
the high traffic condition. ATCos were able to recall more datablocks correctly under active than
monitoring conditions. However, controllers did not seem to be aware of their reduced SA.
Responses in a questionnaire revealed that they found the active control condition more difficult
and felt that their SA had not suffered from reduced involvement. The unawareness of reduced
situation awareness could be potentially dangerous. If the ATCo is not aware of it, he or she
might not choose appropriate strategies (e.g. putting aircraft in holding patterns until they are
capable to safely handle the aircraft) in order to cope with the situation safely. The control
condition or traffic load did not affect the number or duration or eye fixations or blinks.
However, the scan pattern changed as a function of traffic load and level of control. Controllers
showed a less structured or more random scanning pattern under high traffic and when they were
actively controlling under high traffic.

5. Review of empirical studies on FF and ATC automation
51
These experiments clearly support the notion that the ATCo’s passive monitoring role is
one contributor to the reduced performance under FF. Another contributor, the lack of
information on intended flight paths, has already been mentioned by Endsley et al. (1997).
Under FF, the airspace will be less structured and pilot intentions that are now inferred from
flightplans and airspace structure will be uncertain. Castaño and Parasuraman (1999) studied the
impact of different levels of intent information, traffic density, and conflict geometries (i.e.
angles of convergence in a conflict) on controller performance and mental workload in an ATC
simulation. Intent level was manipulated through the presence or absence of flight strips,
airspace structure components, and route displays. High intent was equivalent to current ATC
conditions with the addition of a route display. While in the low intent condition, only the sector
boundaries and callsigns of aircraft were available, the medium intent condition included
waypoints and a route display. Controllers had to detect and resolve conflicts. Performance
measures included the number of operational errors (OEs) and clearances issued. Mental
workload was assessed using the NASA-TLX as a subjective measure. ATCos had more
difficulties detecting conflicts with obtuse conflict geometries (e.g. head-on collisions) than
conflicts with acute angles. As predicted, more operational errors were committed under low
than under medium intent conditions in the high traffic condition. However, the most OEs were
committed under high intent information. This was probably due to display clutter associated
with high intent information. Under low intent conditions, significantly more conflicts were
predicted by the controllers than were scripted in the scenarios compared to the medium intent
information. This could be interpreted as a controller tendency to err on the side of caution and
might have implications for efficiency in the airspace. If controllers are more cautious than
necessary, they might adopt strategies to increase safety (e.g. spacing aircraft further apart or
issuing clearances that are not necessary) and at the same time reduce efficiency. However, in
the high intent condition, controllers predicted more conflicts than in the medium intent
condition. Again, this might be due to clutter on the display, which is confounded with the level
of intent information available. Subjective mental workload was higher under high than under
moderate traffic conditions. Highest workload was reported in the medium intent condition. The
lowest workload was rated in the low intent condition possibly due to the lack of display clutter.
This could indicate that clutter had a greater effect than the intent manipulation for subjective
mental workload.
5. Review of empirical studies on FF and ATC automation
52
Another potential contributor to reduced performance under FF is the lack of airspace
structure. While altitude and route restrictions in the current ATC system might not make the
system as efficient as it could be, they give the system the structure that ATCo have come to rely
on. The goal of FF is to remove those restrictions in order to make flights more efficient.
Remington, Johnston, Ruthruff, Gold, and Romera (2000) studied the effects of the presence or
absence of route and altitude restrictions, traffic load, and conflict geometries on ATCo conflict
detection in a series of short scenarios. The absence of route and altitude restrictions
corresponded to proposed FF conditions. It was found that both traffic load and conflict
geometry had strong effects on the detection of conflicts. The higher traffic load, the longer it
took ATCo to detect conflicts. The shorter the time to conflict and the smaller the angle of
closure, the earlier the detection of conflicts. The removal of altitude restrictions had a (small)
negative effect, the removal of route restrictions had very little effect. The authors suggested
that controller strategies such as a clockwise visual search path might have mitigated any
potential negative effects of the removal of restrictions. The lack of an effect of the removal of
route restrictions could also be due to the fact that display clutter is reduced when the traffic is
spread out more evenly over the display. The authors conclude that the lack of large effects of
the removal of restrictions does not justify the introduction of FF. They note that in their
experiments, controllers performed only one (i.e. conflict detection) out of several tasks that
ATCo usually perform in a sequence of independent very short scenarios that is uncharacteristic
for real-world ATC tasks. In addition, all aircraft flew straight lines at constant speeds. The
removal of restrictions in the real world might have much stronger effects.
Another issue with FF is the accommodation of mixed equipage by ATCos. While some
aircraft will be sufficiently equipped to participate in FF (e.g. with GPS, ADS-B) and will only
need monitoring, others will not have sufficient equipage and require ATC similar to current
procedures. Corker, Fleming, and Lane (1999) studied the effects of different proportions of
mixed equipage on ATCo detection of airborne self-separation and workload under FF
conditions. Eight controllers were each tested under the following conditions: traditional
ground-based control (baseline); traditional control, but with all aircraft flying direct routes; all
aircraft flying direct routes with 20% aircraft self-separating; and all aircraft flying direct routes
with 80% aircraft self-separating.

5. Review of empirical studies on FF and ATC automation
53
Controllers rated that conflict resolution and separation assurance increased in difficulty
with increasing proportions of aircraft that were self-separating. A regression analysis revealed
that communication time between pilots and controllers was the greatest contributor to ATCo
subjective mental workload. Aircraft mix (e.g. slow versus fast moving aircraft) and the number
of aircraft waiting to enter the sector also were greater contributors than the number of aircraft
alone. Under baseline conditions, communication time increased with the number of aircraft. In
the direct routing condition, communication time decreased compared to the baseline probably
because there was no need to communicate after the direct route was approved and pilot intent
was clear. In the 20% self-separating condition, communication time for the exchange of intent
information increased significantly, but was not accompanied by an increase in reported
workload. Apparently, the exchange of intent information does not pose a significant workload
burden on the controller. Communication time was further analyzed. Under direct routing with
80% aircraft self-separating, communication time was significantly decreased compared to all
other conditions. Workload, however, was markedly increased probably due to the constant high
monitoring requirement which is even higher without the knowledge of pilot intent. It was
concluded that automation is needed to provide controllers with intent information and to
monitor pilot conformance with their stated intent in order to reduce the workload burden on
controllers when monitoring aircraft under mature FF conditions. It was difficult for controllers
to decide without intent information if aircraft will self-separate in time or not. In most cases,
controllers took over control to preclude a separation violation. Not only can this lead to an
increase in controller workload, but also to sub-optimal controller decisions in terms of system
efficiency. In fact, controllers might feel so uncomfortable with this situation that they impose
tighter control and cancel the expected benefits of FF.
With the exception of the study by Remington et al. (2000) that did not find any adverse
effects of FF, these experiments have provided the first empirical evidence that FF might be
associated with reduced ATCo performance and increased mental workload. Factors, leading to
the performance decrement were identified. The passive monitoring role, lack of intent
information, and mixed equipage could all contribute to a reduction in ATCo performance and
an increase in mental workload.
A study with ten United Kingdom Royal Air Force military controllers (Hilburn, Bakker,
Pekela, and Parasuraman, 1997), however, found performance benefits of FF. ATCos performed
5. Review of empirical studies on FF and ATC automation
54
in conditions of controlled flight, FF with intent sharing, and FF without intent sharing under
high and low traffic density. Pupil diameter indicated that under low traffic, workload was
lowest in the FF condition with intent sharing, but highest under high traffic and controlled flight
conditions. Blink rate measures suggested an interaction between traffic and control condition.
Under low traffic load, workload was lowest for the controlled flight condition, but under high
traffic load, workload was lowest in the FF condition with intent sharing. Although those results
are trends only, measures of subjective workload point towards the same direction. Similar to
the results of Endsley et al. (1997), more flightplan information queries were made by the
controllers under FF conditions than under controlled flight conditions.
This study showed much less detrimental effects of FF than the studies described before,
perhaps due to the different controller populations that the different studies tested. Hilburn et al.
(1997) tested military, all others civilian ATCos. Differences between civilian and military
controllers have been noted (Hilburn & Parasuraman, 1997). Since military controllers do not
file flight plans and therefore are used to work without flight strips and with little intent
information, they might represent a more appropriate population for FF studies. Perhaps they are
used to the higher uncertainty under FF conditions. This also points to the possibility that some
of the negative problems associated with FF could be reduced once ATCo have been trained
appropriately and have gained some experience with it.
Conclusion. Except for Remington et al. (2000) who found neutral effects and Hilburn et
al. (1997) who found beneficial effects, most studies found a rather negative impact of FF on
ATCo performance and workload. ATCos were moved from strategic management and the
availability of aircraft intent information to a system in which they were reactive to the
environment. Still, the operational concept expected the controller to make decisions based on a
strategic management paradigm. ATCos experienced great difficulties when tactical information
became less available. If ATCo are still expected to be responsible for the separation of aircraft
in future ATC automated decision aids need to be provided to the ATCo. Especially tactical and
dynamic, not strategic decision aids have to be developed because controllers will no longer be
able to make decisions based on flightplans (Corker et al., 1999). Although flightplans will still
be filed under FF, pilots may change their intent at any time. This creates a need for information
on short-term tactical intent to make FF feasible from the perspective of the ATCo.

5. Review of empirical studies on FF and ATC automation
55
5.2 Automation
Currently, very little decision-making automation is implemented in the ATC system. As
a consequence, only few studies were conducted examining the impact of automated decision
aids on ATCo performance and mental workload. However, recently a few automated decision
aids for ATCos have become available and research on those will be discussed in this section.
Although the automation aids will be described briefly, the focus is on examining the effects of
the tools on the ATCo.
The Computer Oriented Metering, Planning and Advisory System (COMPAS) is an
automated planning aid assisting ATCos in the planning and control of traffic approaching an
airport. It has been implemented at the Regional ATC Center in Frankfurt, Germany since
September 1989 (Völckers, 1991). The goal of COMPAS is to make optimal use of the runways,
recognize and reduce congestion of incoming traffic in a timely manner, reduce delay times and
ATCo workload while maintaining a high level of safety. COMPAS uses information from radar
data and flight plans and integrates it with information on weather, airspace, aircraft performance
and separation standards to propose a plan to the ATCo. The recommendation is advisory and
leaves controllers in the loop to make and execute decisions. System performance and
acceptance, and controller workload were evaluated in a series of simulator experiments in which
ATCos worked traffic with and without COMPAS (Schick, 1991a). Dependent performance
measures were the observed and planned time distribution of aircraft over certain waypoints,
approach sequences, and tracks of horizontal vectoring. Frequency and duration of controller
communications to aircraft, frequency and duration of phone calls to other controllers as a
measure of coordination, and the actuation of keys on the COMPAS keyboard served as
measures of communication load and manual input load. Subjective ratings of controller
acceptance of the system were obtained. Workload ratings were obtained using the SWAT.
Two types of control units are involved in handling the approach traffic, namely terminal area
control and sector (en route) control. For approach control, the average flight time of aircraft as
well as radio communication between controllers and pilots was significantly reduced in the
terminal area. In addition, controllers issued less clearances for heading changes and more
clearances for direct vectoring increasing efficiency in the airspace. Subjective ratings showed a
high degree of acceptance of COMPAS. On the other hand, the average flight time and
subjective ratings of mental workload in the en route sectors were increased. However, controller

5. Review of empirical studies on FF and ATC automation
56
time on the radio and the number of heading changes were not affected by the use of COMPAS.
Overall, it was found that the approach sequences were fairer, i.e. the first-come-first-serve rule
was not violated as often when COMPAS was used versus when it was not used. Coordination
between en route and terminal area radar control (TRACON) controllers as indicated by phone
calls between the two facilities was significantly reduced.
A field evaluation of COMPAS (Schick, 1991b) found similar results. COMPAS
contributes to a steady traffic flow and greater fairness in the approach sequence facilitating
planning and executive work in the approach area. In en route or area control, evidence was
found for an increased control load. Approach control can take advantage of the en route
controllers' prior effort to establish a sequence. It was concluded that COMPAS could contribute
to a better distribution of workload across control units or facilities.
Similar to COMPAS, the center TRACON automation system (CTAS) is a decision aid
that supports the controller in the sequencing and scheduling of traffic in or transitioning to the
terminal area. The software tools assist ATCos in planning and controlling by means of
advisories presented on ATC displays. The design philosophy of CTAS is to provide automation
tools that augment rather than replace the human. One software component, the descent advisor
calculates aircraft trajectories and estimated times of arrival for each aircraft within 200 miles of
the airport, and dynamically develops a plan to sequence and schedule each aircraft. Advisories
are displayed to the controller in the form of four-dimensional trajectories with the goal to
maximize total efficiency and accuracy of arrival time for the arrival stream. The descent advisor
detects planning or separation conflicts and provides the controller with advisories on how to
resolve them.
Hilburn (1996) studied how the level of automation and traffic load affected mental
workload, operator and system performance in two experiments using the descent advisor. The
level of automation was either manual control, automated conflict detection, or automated
conflict resolution. Traffic density was either low or high. Performance measures included
monitoring performance for failures in the datalink as well as arrival accuracy and number of
arrival sequence changes, and number and severity of separation violations as measures of ATC
system performance. Pupil diameter, frequency and duration of eye fixations and dwells,
scanning randomness, and HRV served as physiological measures, ratings on the NASA-TLX
and the Subjective Mental Effort Questionnaire (SMEQ; Zijlstra & van Doorn, 1985) as
5. Review of empirical studies on FF and ATC automation
57
subjective measures of mental workload. High traffic load was associated with higher mental
workload than low traffic load. This was reflected in measures of pupil diameter, dwell time,
fixation frequency, scanning entropy, and HRV. Automation demonstrated benefits on mental
workload and performance. A trend indicated an automation benefit in pupil diameter, however,
this was found in experienced ATCos only. Dwell duration as an indicator for the amount of
information that is extracted from a display or the effort expended, did not find a strong
automation effect. However, fixation frequency was increased with automation indicating higher
workload. HRV showed a workload reduction with automation, especially under high traffic.
While HRV and pupil diameter suggested reduced workload under both automated conditions,
for most measures, workload reduction was greater for conflict detection than for conflict
resolution automation. Subjective ratings indicated higher workload with high traffic. In the
high traffic condition, workload was rated higher under automated than manual conditions
suggesting that ATCos experienced increased workload under automation, especially with
resolution automation.
Monitoring performance as indicated by response times to simulated failures in the
datalink was significantly better under resolution automation compared to the manual condition
across both traffic loads. A trend suggested that the benefit of automation was greater under
high than under low traffic conditions. This is contrary to findings that automation of monitoring
and control tasks has a negative effect on monitoring performance in case of an automation
failure (Parasuraman et al., 1993).
System performance was studied using the measures of arrival accuracy, number of
arrival sequence changes, and the number and severity of separation violations. Both automation
levels resulted in a trend for better arrival accuracy than the manual condition and a lower
number of arrival sequence changes under manual control than under the automation conditions.
Fewer separation violations were seen under detection automation than under resolution
automation or manual control. Looking at the duration of the violations reveals a slightly
different picture. The average duration of separation violations was longest for detection
automation and shortest for resolution automation.
While the first experiment suggested a benefit of static automation on mental workload
and performance, a second experiment showed that the benefits of automation on mental
workload and monitoring performance in an ATC decision-making task could be enhanced by

5. Review of empirical studies on FF and ATC automation
58
implementing automation adaptively, for example only when traffic load is high. HRV indicated
the highest workload under the static automation schedule and lowest under adaptive automation.
Adaptive automation showed the greatest benefit on mental workload under high traffic as
indicated by HRV. Under low traffic, HRV showed an automation cost of the static automation
schedule over the manual or adaptive schedule. Pupil diameter indicated increased workload
with increased traffic load and a trend for a benefit of adaptive over static automation. Fixation
duration indicated a trend for higher workload under high than under low traffic load.
In both experiments, results from objective and subjective workload measures
dissociated. While objective measures found a benefit, subjective measures found a cost of
automation on workload. This could have consequences for ATCo acceptance of the automated
tool. If ATCos do not subjectively experience a workload benefit, they might be resistant to
accept the automation. However, the number of participants in the two experiments (Hilburn,
1996) was fairly low (n = 8) and many results were only marginally significant. Further research
could clarify, if these findings can be replicated.
Harwood, Sanford, and Lee (1998) describde a field assessment of CTAS. While field
assessments are typically conducted during the later stages of system production and deployment
(i.e. when it is difficult to implement changes in the system design), the one by Harwood et al.
(1998) was conducted very early in the development process and ATCo were involved
throughout the development process. Field assessments of CTAS revealed benefits for all three
software modules of CTAS. The assessment focussed on the effects of the descent advisor on
ATCo workload and acceptance. Subjective ratings on a 10-point scale showed no effect of the
use of the automated advisories on the quantity of decisions, planning, and calculations. Fewer
clearances had to be issued and accuracy in estimating times of crossing certain fixes was
increased. However, the use of the automated advisories increased workload for type and
number of coordination. This could be an artifact since coordination and communication were
increased during the assessment procedure. Harwood et al. (1998) reported that one of the
biggest benefits of the CTAS assessment in an operational setting was the increased acceptance
and trust that controllers had in CTAS. Even though some ATCos had experienced the
performance and workload benefits of CTAS in the laboratory, their confidence in the system
was increased after experiencing the same benefits in the field.
5. Review of empirical studies on FF and ATC automation
59
A few other automated decision aids are available in ATC. The Precision Runway
Monitor and Final Monitor Aid System (Lind, 1993) or the converging runway display aid
(Mundra, 1989; Mundra & Levin, 1990) assist ATCos in the terminal and tower area to merge
traffic without conflicts. Their main goal is to increase runway capacity. They will not be
discussed here because this work focuses on the en route environment and no human
performance study is available on the converging runway display aid.
Surprisingly little research has been conducted on conflict detection and resolution aids
like URET, CPTP, or Direct-to. Initial analyses of URET revealed that false alarm rates might
be quite high (Cale, Paglione, Ryan, Timotea, & Oaks, 1998). However, although URET is
already being field tested, there is no data on its effects on ATCo performance and workload.
Results of a field trial at the Indianapolis Air route traffic control center revealed that the
controllers unanimously supported the tool with respect to the presentation of information,
computer interface, accuracy of the conflict prediction and trajectory modeling. It was believed
to be suitable for clearance decision making as well as sector planning. It was expected that
safety and productivity for the data controller were enhanced. Given the reduced requirements
for flight strip manipulation and elimination of the need to scan flight strips for potential
problems, workload could potentially be reduced. However, to date, no human-in-the-loop
study has been reported with ATCos using URET (Brudnicki & McFarland, 1997).
Conclusion. While the purpose of the introduction of automation or new procedures in
the ATC system is to increase capacity and efficiency, this goal should not be achieved at the
expense of safety. Automation or new procedures implemented with a view to increasing
capacity and efficiency must at least be safety neutral and preferably should enhance safety. The
automation tools discussed above had mostly beneficial effects on controller performance and
mental workload. Both, COMPAS and CTAS, find reductions in workload and no negative
consequences on performance. In fact, CTAS is already in commission in several facilities in the
US. The studies by Schick (1991a, 1991b) point toward an important issue. The introduction of
automation tools does not only have an effect on the immediate user, but also on other members
in the system. In their case, COMPAS reduced workload in the terminal area, but increased
workload in the en route areas leading to a better distribution of load across the facilities.
With the introduction of FF, it becomes necessary to also examine the impact of these
tools under FF conditions. It may also be necessary to assess new tools in the context that they
5. Review of empirical studies on FF and ATC automation
60
will be used in (e.g. FF conditions, digital datalink). Simply adding new tools to the old system
is not sufficient. Automation tools should be integrated into the system in which they will be
used in a way that they do not interfere with each other, with other tasks, or the operational
concept.
5.3 Automation and FF
The literature on the consequences of FF for the ATCo, with the exception of two studies
(Hilburn et al., 1997; Remington et al., 2000), demonstrates the negative effects of FF on ATCo
performance and mental workload. A review of the (scarce) literature on the effects of ATC
automation suggests benefits of automation on ATCo performance and mental workload under
current ATC conditions. It remains to be studied if automation tools such as conflict detection
aids have beneficial effects on ATCo performance and mental workload under FF and if they
could compensate for some of the negative effects associated with FF.
Conflict detection requires the reliable projection of aircraft status and conflicts into the
future. However, such projections are based on expected flight paths and factors such as wind,
weather, or turbulence. Under current conditions expected flight paths could be predicted
relatively reliably from filed flight plans because pilots have to stay on the agreed upon routes
and ask for ATCo permission if they wish to deviate. Under FF, however, pilots may change
their intended flight path at any time, thereby reducing the predictability and limiting the utility
of conflict detection aids. By changing their flight path, pilots could resolve their own conflicts
or even create new ones.
Only two studies so far have investigated the effects of automation and FF jointly. The
emphasis of these studies was on ATCo trust in conflict detection automation under FF
conditions. Trust and self-confidence determine, among other factors (cf. Riley, 1996), the use
of automation. Lee and Moray (1992) and Tan and Lewandowsky (1996) found that the
difference between ratings of trust and self-confidence predicted the use of automation. If trust
in the automation was greater than self-confidence to perform without the automation, the
automation was used. If self-confidence to perform without the automation was greater than
trust in the automation, the automation remained unused. Even though trust and self-confidence
5. Review of empirical studies on FF and ATC automation
61
have some influence on operator performance and mental workload through the usage of
automation, performance and workload were not addressed per se in these two studies.
In an experiment by Masalonis, Duley, Galster, Castaño, Metzger, and Parasuraman
(1998) current en-route ATCos viewed 45 brief ATC on a PC-based ATC simulator. Aircraft
predicted to be in conflict were highlighted. In some trials the prediction became inaccurate
because pilots self-separated, i.e. resolved an existing conflict themselves, but the aid still
indicated a conflict (error of commission or false alarm). In other trials, pilots maneuvered freely
creating conflicts which went undetected by the conflict detection aid (error of omission or
miss). There was no significant difference in trust ratings following the detection of a conflict
that was resolved by the pilot (false alarm) or a correct assessment. However, when the aid did
not show a pilot-created conflict (miss), trust declined. Apparently, trust was more affected by
misses than by false alarms. It was concluded that conflict detection aids would be more
accepted if they were programmed to predict unexpected maneuvers, perhaps through intelligent
modeling of pilot behavior in FF. In addition, training is needed to calibrate trust in a conflict
detection aid and trust in pilots to successfully self-separate. Controllers tended to intervene less
often in self-separations as time passed. Objective measures of trust were unaffected. The
agreement with correct automation decisions was high even when the automation had just failed
on the previous trial. Therefore, controllers may perform well with conflict detection aids even
under FF.
In another experiment (Masalonis, 1999), trust and usage of a conflict detection aid were
studied under FF and current ATC conditions. The conflict detection aid was either reliable or
unreliable and the participants were either informed about the weaknesses of a conflict detection
aid under FF conditions or received no information on this issue. Masalonis (1999) found that
ATCo detected about 90% of all conflicts. However, they missed almost half of the conflicts
that were missed by the automation suggesting that they might have overly relied on the
automation. Trust was lower in FF for participants who were informed about the weakness of
the aid under FF before they started the experiment. The difference between FF and non-FF
scenarios was not reflected in the non-informed participants' trust ratings, not even toward the
end of the experiment. Only the uninformed showed a relationship between trust ratings and the
tendency to accept the decision of the automation without verifying it.
5. Review of empirical studies on FF and ATC automation
62
Conclusion. These experiments elucidated some of the issues associated with the use and
utility of conflict detection automation under FF conditions. The finding that ATCos missed a
large number of conflicts that remained undetected by the aid points toward a potential for
automation-related complacency. This is an important issue that requires further investigation.
Clearly, more research is needed studying the effects of automation and FF jointly. While the
focus of these experiments was ATCo trust in automation, it is of particular interest how ATCo
performance and mental workload are affected under both reliable automation and in cases when
automation reliability might be reduced due to uncertainty in the FF environment.
5.4 Statement of problem and overview of research
Research has shown mostly negative effects of FF conditions on ATCo performance and
mental workload. In addition, the goal of FF is to increase airspace capacity. Therefore, traffic
density and complexity will be much higher under FF. The combination of increased traffic
density and the negative impact of the authority shift from the ground to the flight deck could
have a dramatic impact on ATCo performance and workload and therefore system safety.
Automation could be a remedy to the negative impact of FF on the ATCo. However, while the
effects of automation on the ATCo have been studied under current ATC conditions, they have
not been investigated under FF and high traffic density conditions. Due to the high uncertainty
of pilot intent in the FF environment, the reliability and utility of automated decision aids might
be limited. It is still an open question whether supporting ATCo with decision-aiding
automation could compensate for the negative effects of FF conditions and high traffic density.
Hence, there is a need for research investigating the effects of automated decision aids on ATCo
performance and mental workload under FF conditions.
Overview of the research. The present research investigated whether a conflict detection
aid can neutralize the negative effects associated with FF and high traffic density. Therefore,
ATCo performance and workload under automated conditions was compared to a baseline in
which ATCos operate under FF conditions without a conflict detection aid. In addition to
traditional automation that heavily relies on the visual system, a fairly new approach to the
design of automation that attempts to distribute information-processing across modalities was
studied. The utility of multimodal feedback in guiding ATCo attention in an increasingly visual
5. Review of empirical studies on FF and ATC automation
63
environment was examined. While the first two experiments assumed that the automated
decision aid functions 100% reliably, a third experiment examined the effects of automation that
is highly reliable, but could fail occasionally due to the high uncertainty in the FF environment.
Studying ATCo performance and mental workload under conditions of FF, high traffic density
and unreliable automation conditions is important in order to anticipate if ATCos would be able
to detect automation failures and intervene in time to recover from the situation. A timely
recovery from emergency situations is a critical issue if the introduction of automation and FF is
not to compromise safety.

6. Methodology
64
6. Methodology
6.1 Overview
Three operator-in-the-loop experiments were conducted to examine the effects of a
conflict detection aid and traffic density under reliable and unreliable automation conditions on
ATCo performance and mental workload. The choice of the independent variables was guided
by the imminent introduction of conflict detection automation into the ATC system, rapidly
increasing air traffic, and the lack of research literature on the effects of these changes on the
ATCo and ultimately system safety. The experiments were conducted on a mid-fidelity ATC
simulation (Masalonis, Le, Klinge, Galster, Duley, Hancock, Hilburn, Parasuraman, 1997) using
professional FAA ATCos from the Washington area en route and TRACON facilities as
participants. Although recruiting professional ATCo was problematic due to the shortage of
personnel at the FAA facilities and incurred a high cost, it was deemed necessary. A pilot study
(Galster, 1998) revealed that college students performed poorly at the ATC tasks even after
extensive training. Besides, they would not use the same strategies that professional ATCos use.
To account for the multi-task environment in which ATCos operate and based on the
resource view of mental workload, a battery of tasks was chosen to obtain primary and secondary
task performance. This was supplemented by subjective ratings and physiological measures to
obtain a comprehensive picture of ATCo performance and mental workload. Besides, ratings of
trust in the aid and self-confidence to perform without the aid were obtained.
The simulation of air traffic in all scenarios was created with the input of a subject matter
expert, an ATCo with Human Factors training and experience from the London area traffic
control center.
6.2 ATC simulation
A PC-based medium-fidelity ATC simulator (Masalonis et al., 1997) was used to
simulate an en route airspace. The simulation ran on a Pentium-I processor on an X-windows
platform and a Linux operating system with two 21-inch monitors attached (15- and 21-inch
monitor in Experiment 1). The simulation consisted of the primary visual display (PVD) or radar
display and a combined datalink and electronic flight strip display (15-inch monitor in
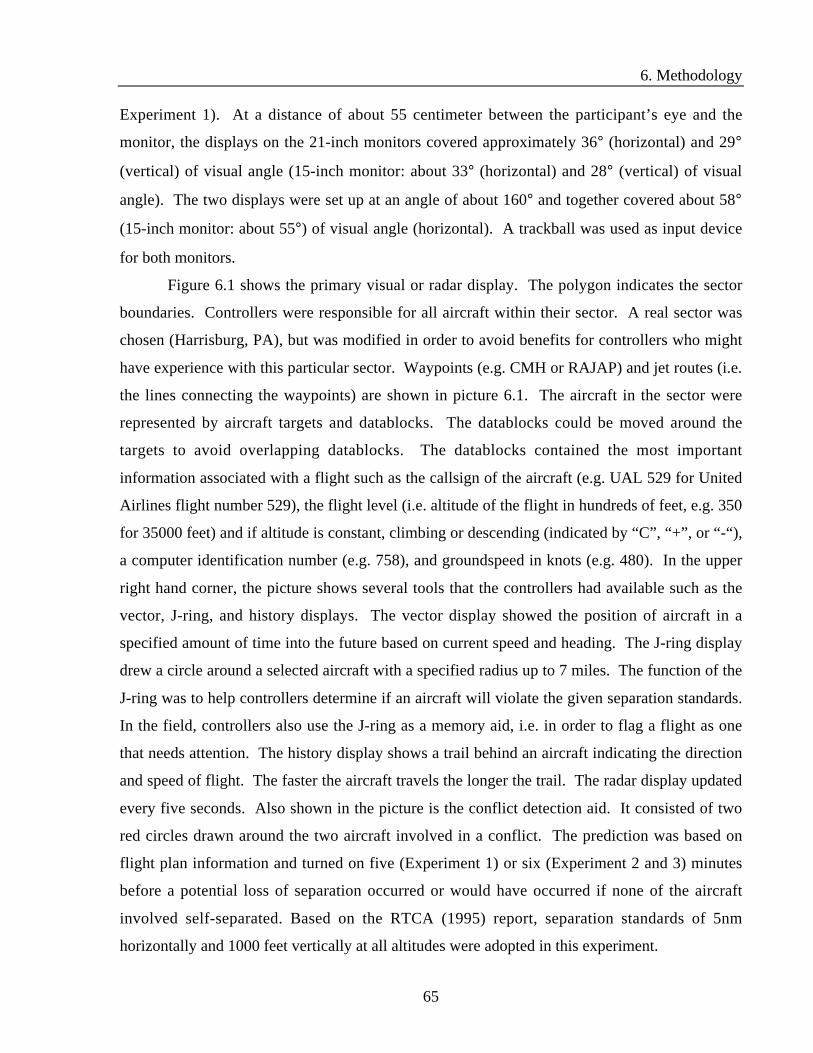
6. Methodology
65
Experiment 1). At a distance of about 55 centimeter between the participant’s eye and the
monitor, the displays on the 21-inch monitors covered approximately 36° (horizontal) and 29°
(vertical) of visual angle (15-inch monitor: about 33° (horizontal) and 28° (vertical) of visual
angle). The two displays were set up at an angle of about 160° and together covered about 58°
(15-inch monitor: about 55°) of visual angle (horizontal). A trackball was used as input device
for both monitors.
Figure 6.1 shows the primary visual or radar display. The polygon indicates the sector
boundaries. Controllers were responsible for all aircraft within their sector. A real sector was
chosen (Harrisburg, PA), but was modified in order to avoid benefits for controllers who might
have experience with this particular sector. Waypoints (e.g. CMH or RAJAP) and jet routes (i.e.
the lines connecting the waypoints) are shown in picture 6.1. The aircraft in the sector were
represented by aircraft targets and datablocks. The datablocks could be moved around the
targets to avoid overlapping datablocks. The datablocks contained the most important
information associated with a flight such as the callsign of the aircraft (e.g. UAL 529 for United
Airlines flight number 529), the flight level (i.e. altitude of the flight in hundreds of feet, e.g. 350
for 35000 feet) and if altitude is constant, climbing or descending (indicated by “C”, “+”, or “-“),
a computer identification number (e.g. 758), and groundspeed in knots (e.g. 480). In the upper
right hand corner, the picture shows several tools that the controllers had available such as the
vector, J-ring, and history displays. The vector display showed the position of aircraft in a
specified amount of time into the future based on current speed and heading. The J-ring display
drew a circle around a selected aircraft with a specified radius up to 7 miles. The function of the
J-ring was to help controllers determine if an aircraft will violate the given separation standards.
In the field, controllers also use the J-ring as a memory aid, i.e. in order to flag a flight as one
that needs attention. The history display shows a trail behind an aircraft indicating the direction
and speed of flight. The faster the aircraft travels the longer the trail. The radar display updated
every five seconds. Also shown in the picture is the conflict detection aid. It consisted of two
red circles drawn around the two aircraft involved in a conflict. The prediction was based on
flight plan information and turned on five (Experiment 1) or six (Experiment 2 and 3) minutes
before a potential loss of separation occurred or would have occurred if none of the aircraft
involved self-separated. Based on the RTCA (1995) report, separation standards of 5nm
horizontally and 1000 feet vertically at all altitudes were adopted in this experiment.

6. Methodology
66
The circle within the sector designated the hand-off circle. Controllers were instructed to
hand-off aircraft as soon as possible after the aircraft passed the circle. Controllers under current
procedures hand-off aircraft and responsibility much earlier. Since aircraft are under positive
control at all times, the controllers know the intentions of the aircraft. Under FF conditions,
however, pilot intentions might change on short notice. Therefore, controllers cannot give up
responsibility as early as currently. The buttons on the bottom of the monitor allowed the
controllers to adjust the brightness of foreground and background and to change the display
range. The use of this functionality was not allowed in the experiments in which eye movements
were recorded.
Figure 6.1: Primary visual display (PVD)
Figure 6.2 shows the datalink and electronic flight strip display. The datalink was chosen
as the means of communication between ATCos and aircraft because it allowed for maximum
experimental control and did not require any confederate experimenters as pseudo-pilots. More
importantly, however, the use of datalink is envisaged in future ATC systems for routine
communications and information that is not important to other pilots in the sector in order to
Conflictdetectionaid
Sectorboundary
Hand-offcircle

6. Methodology
67
reduce frequency congestion. The datalink consisted of a list of flights, an area for incoming
messages from the aircraft, as well as several buttons for accepting aircraft into the sector or
handing off to the next sector. As soon as an aircraft came close to entering the sector
boundaries on the PVD, it sent a message to the area where incoming messages appeared on the
datalink display. It was marked "Incoming message" and could be opened by clicking on it.
After clicking, it said "Entering sector". To accept the aircraft into the sector, the controllers
clicked the "Accept"-button and the aircraft sent a message "Roger" back to confirm that they
received the controller acceptance. To hand-off aircraft, the controller had to select the aircraft
in the list of flights and click "Auto Hand" in the lower right corner. The aircraft acknowledged
the instruction by returning a message "Wilco". The electronic flight strips for each flight that
were displayed on the same monitor contained the most important information of a flight such as
the callsign, computer identification number, the waypoints the flight passed on its way through
the sector and the flightlevels.
Figure 6.2: Electronic flight strip (left half) and datalink display (right half)
List offlights
Accept button
Flight progress stripsAuto hand-off button
Incomingmessages

6. Methodology
68
Figure 6.3 displays the full simulation set-up with a participant wearing an eye-head
tracking system.
Figure 6.3: Experimental set-up with eye-head tracking system
The simulation contained the tasks described in the next section from which the
dependent variables of performance were obtained.
Primary task performance: Conflict detection. The detection and resolution of potential
conflicts between aircraft is the most important task of the ATCo in order to assure safety in the
air and on the ground. Therefore, it was chosen as the primary task of interest.
In a FF environment, potential conflicts can result in an actual conflict or a self-
separation of the aircraft involved. A self-separation exists when one of two aircraft on a
conflict course makes an evasive maneuver to avoid the loss of separation either by changing
heading, speed, or altitude. A conflict occurs when two aircraft on a conflict course fail to self-
separate and loose separation (i.e. come within 1000 feet vertically and 5nm horizontally of each
other, RTCA, 1995).
While self-separations represent instances of successful airborne separation and would
not require ATCo intervention in the real world, conflicts are instances in which airborne
6. Methodology
69
separation fails and the controller would have to step in to resolve the conflict in order to avoid a
disaster. Therefore, conflict detection performance serves as an estimate of safety and the
likelihood that controllers will be able to act as a back-up in the case that airborne separation
fails. The detection of self-separation serves as a measure of situation awareness and indicates
how aware controllers are of the elements and dynamics in the airspace they are responsible for,
a prerequisite for successful decision-making.
ATCos were instructed that their most important task was to detect potential conflicts that
could result in either actual conflicts or self-separations. ATCos were asked to report potential
conflicts as soon as possible either by calling out the callsigns of the two aircraft involved
(Experiment 1) or by clicking on a "conflict"-button on the radar display (Experiments 2 and 3)
that became available after a software update. The callsigns as well as the time of the report
were recorded.
Accuracy and timeliness in the detection of conflicts and self-separations served as
dependent variables. The percentage of correctly reported conflicts and self-separations were
obtained as well as advance notification times for both events. The advance notification time
was defined as the interval between the time when the loss of separation occurred (for conflicts)
or would have occurred had the aircraft not self-separated (for self-separations) minus the time
when the controller indicated that he or she detected a potential conflict. The greater the time,
the earlier the detection took place and the better was the conflict detection performance. If
ATCos did not indicate that they detected a conflict before the loss of separation occurred or
after the evasive maneuver started, a miss was recorded.
Primary task: Accepting and handing-off aircraft. To facilitate the control of air traffic
and, ultimately, the detection of conflicts, it is important that ATCo and pilots communicate with
each other, especially as aircraft are accepted into a sector or handed-off to the next sector. This
highly proceduralized communication task establishes the transfer of responsibility between
ATCos in different sectors. In the simulation, it yielded additional performance measures such
as the accuracy and timeliness in accepting and handing-off of aircraft.
Aircraft approaching the sector boundaries sent messages (“incoming message”) to the
ATCos that appeared in the communication interface on the lower right hand side of the datalink
display. Controllers were instructed to open all incoming messages by clicking on them with the
cursor and accept the aircraft as soon as possible by clicking on the “accept”-button.

6. Methodology
70
The percentage of aircraft successfully accepted before the end of a scenario and the time
it took controllers to accept aircraft into the sector were obtained. The response times was
obtained by calculating the interval between the time the controller received the message
"entering sector" on the datalink and the time the controller took the hand-off by clicking the
"accept"-button on the datalink.
Controllers were instructed to hand-off all aircraft as soon as they passed the designated
hand-off circle on their way to the next sector. They were specifically instructed not to hand-off
aircraft before they passed the circle. Handing-off a particular aircraft was achieved by selecting
that aircraft from the list of flights on the datalink display and clicking the “hand-off” button.
The percentage of aircraft handed-off successfully was obtained as well as the percentage
of aircraft handed-off early. Aircraft handed-off successfully were aircraft that were handed off
after the aircraft had passed the hand-off circle. Early hand-offs were aircraft that were handed
off before they crossed the hand-off circle. Response times for handing-off aircraft to the next
sector were obtained by calculating the interval between the time when the aircraft crossed the
hand-off circle and the time the controller actually handed the aircraft off to the next sector
controller by clicking the "hand-off"-button on the datalink.
Secondary task performance: Updating flightstrips. Consistent with the attentional
resource view of mental workload a subsidiary task paradigm was used. Participants were
instructed to maintain primary task performance allocating their attention to the secondary task
as much as they could. Flight progress strips contain all the information a controller needs to
control traffic such as intended route of travel, waypoints to cross, altitudes, etc. In case of a
radar failure, flight strips (in addition to the ATCos’ mental picture of the traffic and
communication) serve as a back-up that the controller can rely on. Flight strips are generated by
the main ATC computer system and distributed to the ATCo prior to the arrival of the aircraft in
the ATCo’s sector. ATCo manually update the information on the flight strips as the aircraft
progresses through the sector or if changes are made to the flightplan. However, this is not their
main priority. Therefore, the updating of flight progress strips was chosen as an embedded
secondary task in the simulation.
ATCo were instructed to check off waypoints on the electronic flightstrip as soon as
aircraft passed the corresponding waypoints on the PVD. E.g. as soon as a particular aircraft
6. Methodology
71
passed the waypoint CMH on the PVD, the controller was supposed to click on the CMH
waypoint on the flightstrip for that aircraft.
Accuracy and timeliness in updating the waypoints on the flightstrip served as a
dependent measure of secondary task performance. The percentage of missed waypoint updates
as well as the percentage of early updates were obtained. Missed waypoints were waypoints that
the aircraft had passed on the radar display, but were not updated on the flightstip before the
flight was handed off. If a controller clicked on a waypoint button before an aircraft actually
passed the waypoint on the radar, an early update was registered. For successfully updated
waypoints, response times were obtained by calculating the interval between the time when an
aircraft crossed one of the waypoints on the PVD and the time the controller acknowledged that
an aircraft passed the waypoint by clicking on the corresponding waypoint button on the
electronic flight progress strip.
6.3 Additional apparatus
Beside the objective performance measures obtained from the ATC simulation, additional
dependent variables were obtained from a heart rate monitor, an eye-head tracking system, as
well as subjective ratings scales to measure subjective mental workload and trust.
Physiological measures. Measures of cardiovascular and ocular activity were obtained as
physiological measures of mental workload and visual attention (ocular measures). The .10 Hz
band of HRV served as a measure of mental workload in experiment 1. The number and
duration of fixations, the number and duration of dwells on different areas of interest in the
simulation as well as gaze transitions between the areas of interest served as physiological
measures of mental workload and visual attention in Experiments 2 and 3. Detailed descriptions
of the apparatus (i.e. heart rate monitor and eye-head tracking system) are provided in the
respective chapters.
Subjective ratings of mental workload. ATCos were asked to fill out the NASA-TLX
after each scenario. The ratings on the NASA-TLX were chosen as a measure of subjective
mental workload. Scores were obtained by averaging the ratings of the six NASA-TLX
subscales, a method found to be psychometrically equivalent (Nygren, 1991) to the weighted
subscore averaging originally suggested by the authors of the NASA-TLX.

6. Methodology
72
Trust. Because the use of automation depends to a large part on the operator's trust in the
system and self-confidence to perform a task without the aid of automation (Riley, 1996; Lee &
Moray, 1992, 1994), subjective rating scales were used to obtain ratings of trust and self-
confidence from ATCos. The scales were similar to the ones used by Lee & Moray (1992;
1994), i.e. Likert-rating scale ranging from 0-100 with endpoints labeled from "not at all" to
"extremely". The scales can be found in the appendix. Table 6.1 gives on overview of all
dependent variables investigated in the three experiments.
Table 6.1: List of dependent variables
Primary task performance: Detection of conflicts and self-separations
- Percentage of detected conflicts and self-separations
- Advance notification time
Primary task performance: Accepting and handing-off aircraft
- Percentage of successfully accepted aircraft
- Response times to request for acceptance
- Percentage of aircraft handed-off successfully
- Percentage of aircraft handed-off early
- Response times to hand-off
Secondary task performance
- Percentage of missed waypoint updates
- Percentage of early waypoint updates
- Response times
Physiological measures
Exp. 1:
- .10-Hz band of HRV
Exp. 2 and 3:
- Entropy
- Number and duration of fixations on different areas of interest
- Number and duration of dwells on different areas of interest
- Dwell time (= number x duration of dwells)

6. Methodology
73
Subjective ratings of mental workload
- NASA-TLX scores
Trust and self-confidence ratings
- Trust
- Self-confidence (Exp. 2 and 3)

7. Exp. 1: Effects of a decision aid and traffic density
74
7. Experiment 1: Effects of a decision aid and traffic density
7.1 Introduction
A review of the literature found mostly negative effects of FF on ATCo performance and
mental workload. FF will allow the ATCo to accommodate more aircraft than before and create
a highly efficient and dense airspace leaving the ATCo with less time to respond to emergencies
(Galster et al., 2001). Metzger and Parasuraman (in press), however, found that ATCos need
more time to detect conflicts under these conditions. This raises the question if automation could
improve ATCo performance and reduce mental workload under FF conditions and the associated
high traffic density. In fact, the concept of FF has always assumed the availability of automation
support for pilots and ATCos and automation has repeatedly been suggested in the literature as a
means to support ATCo performance (e.g. Galster, 1998; Galster et al., 2001; Wickens et al.,
1998a).
While previous studies have shown promising results for automated decision aids under
current ATC conditions (e.g. Schick, 1991a, 1991b; Hilburn, 1996), no empirical data is
available studying the effects of advanced decision aids on ATCo performance and mental
workload under FF conditions. This is surprising given that decision aids such as URET are
already scheduled for implementation. Because automation can sometimes have unanticipated
consequences it should be carefully evaluated regarding the expected benefit and potential cost
before being implemented. This is especially important given the requirement for improved
safety and the envisioned reduction of accident rates by 80% (FAA, 2000).
Therefore, the purpose of the first experiment was to study the impact of a conflict
detection aid on mental workload and controller performance in an ATC task simulating FF
under moderate and high traffic density and to investigate the potential of a conflict detection aid
to compensate for the reduced performance and increased mental workload associated with
increased traffic density and FF conditions.
FF comes in many varieties and the specific way it will be implemented is still to be
determined. FF could range from full separation authority on the flight deck to keeping authority
on the ground with controller decision aids that free up controller resources that can be used to
respond to more user requests. Most likely, the implementation will be gradually, from moderate
to mature levels of FF. For the following simulations, a rather mature level of FF was chosen in

7. Exp. 1: Effects of a decision aid and traffic density
75
anticipation of a worst-case scenario for the future. Even though pilots stayed on routes and filed
a flight plan, they could deviate from the flight plan and routes at any time without notifying the
controller. Authority for separation was on the flight deck. Controllers monitored traffic and
were expected to act as a back-up in case self-separations failed. Conditions of moderate and
high traffic as well as conditions of automation support and manual performance were
investigated.
7.1.1 Hypotheses and Research questions
Consistent with findings in other studies it was expected that conflict detection
performance would be reduced under high compared to moderate levels of traffic when ATCos
had no automation support available. With the support of a decision aid, however, performance
should be improved under both moderate and high traffic density.
Likewise, it was expected that mental workload would be reduced under high compared
to moderate levels of traffic when ATCos had no automation support available. With the support
of a decision aid, however, mental workload should be reduced under both moderate and high
traffic density.
To make automation beneficial, performance and mental workload under high traffic in
the presence of the conflict detection aid should be at least at the same level as performance and
mental workload under moderate traffic in the absence of the aid.
It was also expected that the performance of routine ATC tasks (e.g. communication)
would be reduced under high compared to moderate traffic conditions without the aid and that
the conflict detection aid would free resources and improve performance in routine ATC tasks
compared to unaided performance.
Because the use of automation, and eventually operator performance, is determined,
among other factors, by operator trust in the automation, ATCo ratings of trust were investigated.
7. Exp. 1: Effects of a decision aid and traffic density
76
7.2 Methods
7.2.1 Participants
Twelve active full performance level en-route ATCos from the Washington Center air
route traffic control center (ARTCC) between the ages of 32 and 51 years (M = 37.17, SD =
4.84) served as paid volunteers. Their average overall ATC experience including all military and
civilian positions ranged from 11 to 19.5 years (M = 13.46, SD = 3.24). All were male.
7.2.2 Apparatus
For a description of the ATC simulation refer to Chapter 6. In addition to the ATC
simulation, a heart rate monitor was used in order to obtain the .10 Hz band of HRV as a
measure of mental workload. To obtain the data, three electrodes were placed on the forearms of
the ATCos in a Lead I configuration, that is, two electrodes were placed on the right arm and
one, the ground, on the left arm. As Kramer (1991) pointed out, the heartbeat has a fairly large
signal-to-noise ratio and does not require a very precise placement of electrodes to successfully
detect the R-wave of the Electro-cardiogram (ECG) signal. The ECG was amplified using a
Scope Service ECG preamplifier. A bandpass filter (Krohn-Hite 3550) was applied to filter out
noise below 5 Hz (high pass) to attenuate movement artifacts and anything above 50 Hz (low
pass) to eliminate 60 Hz line noise. In addition, a UFI Impedance Pneumograph Resp I and UFI
Pneumotrace (Amplifier for Respiration with respiration belt) were used. The ECG was
digitized at 1 KHz using PC-based software. Interbeat intervals were measured using a software-
based Schmitt trigger algorithm (CSLacq, Byrne, 1994a). After removing and editing artifacts in
the heartrate data, a power spectral analysis was applied to the heart rate variability data (HRV)
in order to obtain the 0.10 Hz band of the HRV. The calculation was done using CSLstat 1.07
(Byrne, 1994b). The program ran on a PC-DOS system with a 386 processor.
7.2.3 Design
A two-factorial repeated measures design with two treatment levels on each factor was
chosen. Independent variables were (1) traffic density with (a) moderate or (b) high levels of

7. Exp. 1: Effects of a decision aid and traffic density
77
traffic in the ATC sector and (2) the availability of a detection aid with (a) aid absent and (b) aid
present as treatment levels. All ATCos performed in all resulting four conditions. The order of
conditions was presented according to a complete double cross-over design with the availability
of the detection aid as the first, and traffic density as the second cross-over. Hence, half of the
participants performed the two traffic conditions (one moderate, one high traffic) with the aid
first, the other half performed the two traffic conditions without the aid first. The two different
traffic density conditions were always performed in (varying) sequence before switching to the
other automation condition. The order of traffic density was balanced so that half of the
participants that first performed with the aid present were presented with the moderate, the other
half with the high traffic density first. In the same way, half of the participants that first
performed with the aid absent were presented with the moderate, the other half with the high
traffic density first. This resulted in the equal distribution of all conditions across all four
positions in the order of presentation. The participants were randomly assigned to an order.
Dependent variables are listed in table 6.1.
For each condition, one scenario was created. ATCos were presented with four 30-
minute scenarios that were created to combine high (on average about sixteen aircraft after a 10-
minute ramp-up period) and moderate (about ten aircraft after a 10-minute ramp-up period)
traffic load with the absence and presence of a conflict detection aid in a sector with a 50-mile
radius. Each scenario contained two conflicts and four self-separations.
In scenarios with a conflict detection aid, five minutes before a potential conflict
occurred, a red circle appeared around the two aircraft involved. As soon as one aircraft made an
evasive maneuver (e.g. descended 1000 feet), the circle disappeared. In scenarios without
detection aid, the circle only appeared when aircraft had already lost separation in order to give
the controller a feedback similar to their real work environments.
7.2.4 Procedure
After signing the informed consent form, the controllers were connected to the heart rate
monitor. Three electrodes were attached to their forearms, one on the left side, two on the right
side. A respiration belt was put around their lower ribcage. The controllers then were given a
demonstration of the simulation, completed a fourteen-minute practice trial, and were

7. Exp. 1: Effects of a decision aid and traffic density
78
familiarized with the NASA-TLX. After that, a five-minute baseline of their heart rate was
obtained during which controllers were instructed to relax. Then, controllers each completed
four 30-minute scenarios and filled out the NASA-TLX after each scenario. Two more five-
minute baselines of their heart rate were obtained, one after the second scenario, the other one
after the last scenario.
7.3 Results
All twelve participants were entered into the statistical analyses. For all dependent
variables, 2 (presence or absence of aid) x 2 (high or moderate traffic load) repeated measures
ANOVAs were calculated. Both independent variables were within-subject factors. An alpha
level of .05 was used for all statistical tests.
7.3.1 Primary task performance: Detection of conflicts and self-separations
Averaged across all condition, ATCos detected 78.13% (SE = 4.44%) of all conflicts.
Controllers detected a higher percentage of conflicts when traffic density was moderate (M =
89.58%; SE = 4.23%) than when traffic was high (M = 66.67%; SE = 7.16%), F(1, 11) = 8.59, p
< .05. Neither the presence or absence of the aid, F(1, 11) = .06, p > .05, nor the interaction
between the presence or absence of the aid and traffic density had a significant effect on the
detection of conflicts, F(1, 11) = 1.32, p > .05.
Overall, ATCos detected 53.13% (SE = 4.80%) of all self-separations. More self-
separations were detected under moderate (M = 68.75%; SE = 6.60%) than under high traffic
density (M = 37.50%; SE = 5.43%), F(1, 11) = 25.00, p < .001. More self-separations were
detected when the decision aid was present (M = 69.79%; SE = 6.73%) than when it was absent
(M = 36.46%; SE = 4.99%), F(1, 11) = 30.61, p = .001. The trend for an interaction between the
presence or absence of the aid and traffic density, F(1, 11) = 3.00, p = .11, is shown in figure 7.1.
The detection of self-separations had a greater benefit from the presence of the aid under
moderate than under high traffic density.

7. Exp. 1: Effects of a decision aid and traffic density
79
27.08
47.92
45.83
91.67
0
1020
30
4050
60
7080
90
100
Aid absent Aid present
Det
ectio
n ra
te (
%)
Moderate traffic High traffic
Figure 7.1: Detection rate for self-separations as a function of traffic density and the
availability of a conflict detection aid
Advance notification times were averaged across the two conflicts and four self-
separations in each scenario. Due to undetected potential conflicts, eight out of 96 cells (=
8.33%) were empty. In these cases controllers did not detect any of the conflicts or self-
separations in a scenario. Since this would only leave six subjects in the analysis, the eight
empty cells were replaced by the respective means of the conditions in which the cell was
missing (e.g. mean of the condition aid present/high traffic).
Conflicts were detected earlier under moderate (M = 221.65 s; SE = 16.23 s) than under
high traffic density (M = 199.41 s; SE = 20.92 s), but the effect failed to reach significance, F(1,
11) = 1.52, p > .05. Conflicts were detected earlier when the aid was present (M = 256.99 s; SE
= 10.12 s) than when it was absent (M = 164.06 s; SE = 20.53 s), F(1, 11) = 24.39, p < .001. A
trend for the interaction between the presence or absence of the aid and traffic density is
displayed in figure 7.2, F(1, 11) = 2.10, p = .18. The presence of the aid achieved a greater
performance benefit under high than under moderate traffic density.

7. Exp. 1: Effects of a decision aid and traffic density
80
131.91
266.90
247.08
196.21
0
50
100
150
200
250
300
350
400
Aid absent Aid present
Adv
ance
not
ific
atio
n tim
e (s
) Moderate traffic High traffic
Figure 7.2: Advance notification time for conflicts as a function of traffic density and the
availability of a conflict detection aid
Self-separations were detected earlier under moderate (M = 347.03 s; SE = 18.01 s) than
under high traffic density (M = 251.20 s; SE = 11.39 s), F(1, 11) = 17.23, p < .01. A trend was
found for an earlier detection of self-separations when the aid was present (M = 314.12 s; SE =
13.52 s) than when it was absent (M = 284.12 s; SE = 21.24 s), F(1, 11) = 2.17, p = .17. A trend
for an interaction between the presence or absence of the aid and traffic density, F(1, 11) = 2.03,
p = .18, is shown in figure 7.3. Similar to the detection of conflicts, a greater benefit was
achieved under high than under moderate traffic density by the presence of the aid. There was
no effect of the aid under moderate traffic because ATCos detected self-separations before the
aid did.

7. Exp. 1: Effects of a decision aid and traffic density
81
224.45
277.95
343.78 350.29
0
50
100
150
200
250
300
350
400
Aid absent Aid present
Adv
ance
not
ific
atio
n tim
e (s
)
Moderate traffic High traffic
Figure 7.3: Advance notification time for self-separations as a function of traffic density and
the availability of a conflict detection aid
7.3.2 Primary task performance: Accepting and handing-off aircraft
Controllers accepted more than 98% of the aircraft (M = 98.43%; SE = 0.42%) into their
sector with an average response time of 41.91 seconds (SE = 2.48 s). Due to the small number of
misses, no inferential statistics were calculated for the percentage of successfully accepted
aircraft. There were no effects of the presence or absence of the aid, F(1, 11) = .01, p > .05, or
the interaction, F(1, 11) = .49, p > .05, on response times. A trend was found for longer response
times to accept aircraft under high (M = 46.01 s; SE = 4.20 s) than under moderate (M = 37.82 s;
SE = 2.46 s) traffic conditions, F(1, 11) = 2.63, p = .13.
Controllers handed-off more aircraft successfully when the aid was present (M = 81.71%;
SE = 3.19%) than when it was absent (M = 70.00%; SE = 4.91%), F(1, 11) = 8.22, p < .05.
There were no effects of traffic density, F(1, 11) = .06, p > .05, or the interaction, F(1, 11) =
1.44, p > .05, on the percentage of aircraft handed-off successfully.
Controllers also handed off more aircraft prematurely when the aid was absent (M =
24.40%; SE = 5.08%) than when it was present (M = 13.80%; SE = 3.23%), F(1, 11) = 6.78, p <
.05. Under high traffic density, ATCos handed-off significantly more aircraft early when the aid

7. Exp. 1: Effects of a decision aid and traffic density
82
was absent (M = 25.95%; SE = 7.22%) than when it was present (M = 9.78%; SE = 3.35%).
Under moderate traffic density, the effect of the absence (M = 22.86%; SE = 7.44%) or presence
of the aid (M = 17.82%; SE = 5.43%) was smaller. This interaction was marginally significant,
F(1, 11) = 3.39, p = .09. No main effect for traffic density was found, F(1, 11) = .55, p > .05.
Controllers handed-off aircraft significantly later under high (M = 44.41 s; SE = 5.98 s)
than under moderate traffic conditions (M = 27.51 s; SE = 5.46 s), F(1, 11) = 24.76, p < .001. No
significant effects for the presence or absence of the aid, F(1, 11) = 1.58, p > .05, or the
interaction between traffic load and the presence or absence of the aid, F(1, 11) = 1.06, p > .05,
on response times were found.
7.3.3 Secondary task performance
Performance in the secondary task was mostly affected by traffic density, but not by the
presence or absence of the aid or the interaction between traffic density and the presence or
absence of the aid. Controllers missed updating more waypoints under high (M = 63.41%; SE =
6.23%) than under moderate traffic density (M = 41.55%; SE = 6.73%), F(1, 11) = 14.14, p <
.01. The presence or absence of the aid, F(1, 11) = .00, p > .05, or the interaction between the
presence or absence of the aid and traffic density, F(1, 11) = 1.25, p > .05, had no significant
effects. ATCos updated more waypoints early under moderate (M = 15.00%; SE = 3.62%;) than
under high traffic density (M = 7.62%; SE = 2.39%), F(1, 11) = 3.93, p = .07. The presence or
absence of the aid, F(1, 11) = .02, p > .05, or the interaction between the presence or absence of
the aid and traffic density, F(1, 11) = .03, p > .05, had no significant effects on early updates.
Only ten ATCos entered the analysis of response times. One ATCo had no response
times in the aid absent-moderate traffic condition, another participant missed updating all
waypoints in all conditions. On average, controllers updated a waypoint 86.36 seconds (SE =
6.39) after the aircraft passed the corresponding waypoint on the radar display. No significant
results were obtained for traffic density, F(1, 9) = .29, p > .05, presence or absence of the aid,
F(1, 9) = .21, p > .05, or the interaction, F(1, 9) = .83, p > .05.

7. Exp. 1: Effects of a decision aid and traffic density
83
7.3.4 Physiological measures: HRV
The effect of traffic on the .10-Hz band of the HRV was significant, F(1, 11) = 5.43, p <
.05, and indicated higher mental workload under high (M = 4.63; SE = .19) than under moderate
traffic density (M = 4.74; SE = .19). The effect of the presence or absence of the aid, F(1, 11) =
.03, p > .05, and the interaction, F(1, 11) = .61, p > .05, were non-significant. Other measures of
cardiovascular activity (i.e. heart rate, heart rate variability, respiratory sinus arrhythmia) did not
reveal effects of traffic density, the presence or absence of the aid, or the interaction between the
two variables.
7.3.5 Subjective ratings of mental workload
Controllers rated their mental workload significantly higher under high (M = 66.29; SE =
3.55) than under moderate traffic conditions (M = 52.57; SE = 3.47), F(1, 11) = 28.47, p < .001.
No significant effects were found for the presence or absence of the aid, F(1, 11) = 1.27, p > .05,
or the interaction between the presence or absence of the aid and traffic density, F(1, 11) = 1.01,
p > .05.
7.3.6 Trust
Controller ratings of trust in the conflict detection aid on a scale from 0 to 100 ranged
from 30 to 90 with an average of 63.33 (SE = 4.7). Median and mode were both 70. This can be
considered a moderate level of trust.
7.4 Discussion
The purpose of the experiment was to investigate if ATCos would perform better and
experience lower workload under FF when they had a conflict detection aid available and if a
conflict detection aid would be able to compensate for the reduced performance and increased
workload associated with FF and the high traffic density expected for the future.
As expected, ATCos missed more potential conflicts and detected them later under high
than under moderate traffic density. This validates the findings of adverse effects of high traffic

7. Exp. 1: Effects of a decision aid and traffic density
84
density on controller performance and therefore system safety in earlier FF studies (Galster et al.,
2001; Metzger & Parasuraman, in press). Especially the reduced timeliness of the detection of
potential conflicts is of concern given that the highly dense and efficient airspace under FF
conditions will leave the ATCos with less time to resolve conflicts. This could have serious
implications for safety. However, the presence of a conflict detection aid significantly improved
performance compared to manual conditions. ATCos detected conflicts and self-separations
earlier and detected more self-separations with the support of a decision aid. Advance
notification of conflicts and, to a smaller extent, the detection of self-separations in the presence
of the aid and high traffic conditions (i.e. approximating future conditions) even exceeded
performance levels in the absence of the aid and moderate traffic conditions (i.e. representing
current conditions). Therefore, detection aids might be able (at a minimum) to compensate for
the performance decrements typically induced by high traffic density and perhaps even exceed
current levels of performance and safety. This is an encouraging result with respect to the
FAA’s goal to increase system safety and reduce accident rates drastically (FAA, 2000).
Previous studies found that it took ATCos longer to detect potential conflicts under FF than
under current conditions without decision aid (Metzger & Parasuraman, in press) even though FF
will require ATCos to detect potential conflicts earlier due to the high density of traffic. The
results of the present study suggest that the detection aid can reduce the time required to detect
potential conflicts compensating for some of the adverse effects of FF conditions.
It should be pointed out, however, that the automation had a benefit on the percentage of
detected self-separations, but not conflicts. Because conflicts represent failures of airborne
separation, their detection is more important for system safety than the detection of self-
separations. Therefore, an automation benefit would be more desirably for conflicts than for
self-separations. Hence, the availability of a conflict detection aid might compensate partially,
but not fully for the performance decrements induced by FF and high traffic. Further, the
availability of a detection aid might not be an appropriate justification to expect controllers to
manage an excessive amount of traffic because even with a detection aid they detected fewer
conflicts under high than under moderate traffic density.
Performance in routine communication tasks showed similar adverse effects of high
traffic density with and without a decision aid. Under moderate traffic conditions, aircraft were
accepted earlier and response times to hand-offs were shorter than under high traffic conditions.
7. Exp. 1: Effects of a decision aid and traffic density
85
Beneficial effects were found for the decision aid. For example, ATCos handed off more aircraft
successfully when the aid was present than when it was absent indicating that the conflict
detection aid freed attentional resources that could be allocated to other tasks such as
communication. Interestingly, more aircraft were handed off prematurely with than without the
aid. This effect was particularly prominent under high traffic density. This could be interpreted
as a controller strategy to manage workload. Perhaps controllers felt more time pressure when
they were manually performing and under high traffic and were trying to hand off aircraft
whenever they could, even if it was prematurely.
To summarize, the decision aid was successful in promoting ATCo performance in the
detection of potential conflicts and routine tasks and could compensate for negative effects of FF
and high traffic density. FF transfers separation authority from the ATCo to the pilots removing
the ATCo from the decision-making process. Reduced performance (e.g. delayed conflict
detection) under FF conditions (Metzger & Parasuraman, in press) is a reflection of the ATCo
being out of the decision loop. Even though automation does not bring the ATCo back into the
decision loop, it improves ATCo performance by performing the ATCo's decision-making
function. Moreover, one could indeed argue that the automation removes ATCos further from
the processes in the system because ATCos now become passive monitors not only of pilot
actions, but also of the automation. This is acceptable as long as the ATCo is not required to
intervene, but could pose problems once ATCo intervention is required.
Mental workload was increased under high compared to moderate traffic density
irrespective of the presence or absence of the detection aid. In contrast to the hypothesis, the
decision aid did not reduce mental workload. While performance increased tremendously with
the aid, mental workload remained unchanged. In the terms of figure 4.2, this represents a
workload insensitivity (Parasuraman & Hancock, 2001). According to the model by Wickens et
al. (1997), it could be argued that decision aid freed resources that ATCos chose to allocate to
other tasks (e.g. communication) leaving workload unchanged. That successful hand-offs
benefited from the aid supports this view. However, alternative interpretations are conceivable.
It could be argued that due to the high demand for ATCo monitoring of pilot actions and the
automation workload was not reduced (Warm et al., 1996). An additional explanation is that
traffic density might be a stronger workload driver than automation. Each aircraft requires the

7. Exp. 1: Effects of a decision aid and traffic density
86
ATCo to perform many routine and coordination tasks that are not supported by the decision aid.
Hence, a conflict detection aid would not reduce these tasks and their associated workload.
The lack of a workload reduction could also be a consequence of the short look-ahead
time of the aid. Controllers might have felt that a five-minute look-ahead time would not be
enough to control the situation. Therefore, they relied on their own skills rather than fully
depending on the aid and used the aid as a back-up in case they missed a potential conflict. That
many self-separations under moderate traffic conditions were detected before the aid indicated a
potential conflict and the moderately high ratings of trust support this view. Using the
automation only as a back-up would be a good strategy because it keeps the operator involved
and able to intervene in a timely manner should the need arise. However, if controllers rely on
their own skill to detect conflicts, it is obvious that mental workload cannot be considerably
reduced by the introduction of the aid. Therefore, a conflict detection aid might be helpful in
increasing safety by helping controllers to detect conflicts earlier, but it might not be an
appropriate means to increase the amount of traffic they can manage if they only use it as a back-
up and workload is not reduced. Even though it seems surprising that controllers did not
experience lower workload with the aid of a conflict detection aid, other studies found similar
results (Skitka et al, 1999). For example, pilots did not rate their workload lower when they had
a decision aid available than when they were unsupported. This creates the potential for an
acceptance problem. If operators do not subjectively experience the benefit of a tool, they might
be hesitant to accept and use it.
Based on discussions with the controllers, it is not surprising that trust ratings were not
higher. Their comments were not very favorable of detection aids in general and the one used in
the simulation. Currently, en route centers and TRACON have short term conflict alerts (STCA)
that indicate, based on a simple threshold-crossing algorithm, if aircraft will be in conflict within
the next two minutes based on current speed and heading. This algorithm leads to frequent false
alarms, for example for aircraft flying under VFR that are not subject to the 5nm/1000 feet
separation standards. The conflict detection aid used in the study analyzed and integrated data
from different sources (e.g. radar data, flight plans) and projected aircraft status several minutes
into the future. Real-world detection aids can include highly sophisticated algorithms that
consider additional numerous parameters (e.g. climb rates for different aircraft types, wind and
weather models, etc.). They have little in common with the simple threshold-crossing alerting

7. Exp. 1: Effects of a decision aid and traffic density
87
mechanism of the STCA. Perhaps this difference between the aid in the experiment and the aid
they use on the job was not made clear enough. Better instructions as well as training to improve
the ATCos' understanding of the aid could help to increase their trust in and reliance on the aid
and therefore reduce workload. As Masalonis (1999) found, ATCos vary their trust and are
mostly affected by misses rather than false alarms. Perhaps ATCos perceived the aid as too
conservative to be trustworthy because it did not give any false alarms. In addition, ATCos
might have felt that the five-minute look-ahead time of the aid would not give them enough time
to resolve a conflict. In fact, ATCos detected self-separations under moderate traffic before the
aid indicated a potential conflict. This represents a ceiling effect and the look-ahead time of the
aid should be increased in future studies. However, the earlier the warning the more likely it is
that a controller will be notified of an impending conflict which later turns out not to be a
conflict, for example because of changing winds or because pilots self-separated. In the real
world, longer look-ahead times might lead to high false alarm rates and an underutilization of the
aid as a long-term consequence. This illustrates the challenge of designing decision support
tools for ATC systems. Unlike in other systems (e.g. power plants) where processes follow well
understood principles of physics and are relatively easy to predict, processes in the ATC system
are much more difficult to predict. Weather and temperature predictions are still not very
accurate (e.g. the prediction of clear air turbulence) and the prediction of human actions presents
an even greater challenge. In the current ATC system, rules and tight control of ATCos over
pilots make the pilots quite predictable. But if rules and restrictions are lifted in favor of a
greater level of freedom for the pilots in a FF environment, the prediction of pilot actions
becomes much more difficult (cf. Corker, 2000).
Finally, it should be noted that although controller performance was significantly
improved by the aid, it was not perfect. A significant number of potential conflicts was still
missed. In the real world, this would not be acceptable. The high number of missed events can
probably be attributed to the fact that traffic patterns were created by the experimenter and did
not represent recorded or live traffic as in some higher-fidelity ATC simulations. Therefore, they
lacked some of the structure that ATCos are used to. However, that would be the case under FF
as well. Also, ATCos were not nearly as familiar with the sector as they would be in the real
world. Therefore, the values obtained (e.g. detection rates) should be considered as a
conservative estimate and not be directly compared to real world numbers, but rather to the

7. Exp. 1: Effects of a decision aid and traffic density
88
different conditions created in the simulations. Another reason for the less than optimal
controller performance in terms of conflict detection even with the detection aid might be the
high visual demand of the separate, non-integrated datalink display. Accepting and handing off
aircraft as well as the secondary task of updating the waypoints required a high level of searching
for and monitoring of information leading to a potential attention diversion away from the radar
display. ATCos might have missed conflicts because they did not see them due to their attention
to the data link and flight strips. If attention is allocated to the datalink and flight strip displays,
the onset of a conflict alert would have to be detected through peripheral vision. However, slow
movements and color are not easily detected in peripheral vision (Palmer, 1998). Conflict
detection aids with auditory feedback might be more salient and draw the attention of the
controller back to the radar display. The use of eye tracking equipment would reveal ATCo
attention allocation strategies and how they are affected by different levels of traffic density.
This leads to the conclusion that the provision of a conflict detection aid could serve to
mitigate some of the performance problems that several studies have shown (Endsley et al.,
1997; Galster et al., 2001) and even increase system safety under high traffic and FF conditions.
In addition, the decision aid might free resources that can be allocated to the performance of
other tasks.

8. Exp. 2: Traffic density and automation feedback type
89
8. Experiment 2: Effects of traffic density and automation feedback type
8.1 Introduction
The main driver of proposals such as FF and automation is the need to accommodate
unprecedented amounts of traffic. Increasing airspace capacity is the ultimate goal of any
attempt to modernize the ATC system. While it is possible to divide sectors into smaller sectors
to reduce ATCo workload this strategy has its limits as pointed out previously (see chapter 4).
Increased airspace capacity can be achieved by allowing more aircraft to occupy the same
amount of airspace. As a consequence, traffic density will be considerably increased. Traffic
density, however, is a major contributor to ATCo mental workload and ATCos are limited in the
amount of traffic they can safely handle. Less space between aircraft translates into less time to
detect and resolve potential conflicts and therefore into reduced safety margins. Several
experiments found that ATCos required extra time under FF conditions to detect potential
conflicts (Galster et al., 2001; Metzger & Parasuraman, in press). While ATCos in these studies
were not assisted by decision support tools, the previous experiment indicated that decision aids
could improve ATCo performance under FF conditions. Still, performance was reduced and
workload increased under high compared to moderate traffic density. Not only will FF increase
traffic density, it will also make traffic patterns less structured than they currently are (see figure
5.1; Ball et al., 1995). While under current conditions conflicts between aircraft can only occur
at the intersections of jetroutes, under mature forms of FF conflicts could occur at any point in
the airspace.
These factors have implications for the ATCos' visual scanning of the radar display and
other information sources in the ATC environment. If controllers miss a conflict or commit an
operational error, they often report that they failed to notice or see critical information (Stein,
1989, 1992). Clearly, the multitude of stimuli that competes for the controller's attention at one
time is an important contributor to such failures to attend to critical information. The ATCo's job
is composed of many tasks and mostly based on visual information - scanning the radar display
to build "the picture" of the situation and detect conflicts or reading the flight strips to plan and
avoid problems ahead of time. Only for voice communication with pilots and other ATCos, the
ATCo uses the auditory channel. Selecting one of many sources of visual information can lead
8. Exp. 2: Traffic density and automation feedback type
90
to a failure to perceive critical information especially when traffic density is high and many
information sources compete for the controller's scarce resources.
Voice communication is a rather direct way of communicating and has the advantage that
even prosodic information is transmitted that could alert ATCos of emergency situations (e.g.
when an ATC can "sense" from the sound of the pilot's voice that he or she is distressed or in
panic). However, controller-pilot digital datalink communicaton (CPDLC) has been proposed as
a means to alleviate pressure on the often congested radio frequencies. It is envisioned that
CPDLC will be used for the transmission of most routine messages and to individually address
single aircraft instead of addressing all aircraft on a frequency. Only emergency transmissions or
information that is useful for other pilots on the same frequency will be transmitted via radio-
telephony. The introduction of datalink communication will considerably alter the ATCo's
workplace. CPDLC will add a layer of technology between pilots and ATCos and distance them
from each other. Pilots will loose party-line information (e.g. transmissions from pilots on the
same frequency that might be of interest to other pilots) and prosodic aspects of human speech
will no longer be available. While the use of voice communication allows ATCos to take
advantage of different information-processing channels (i.e. visual and auditory), datalink will
reduce the use of the auditory and pose a greater burden on the visual channel. As a
consequence, the ATC environment will become even more visual in nature because ATCos will
have to rely on the visual channel to compose and read datalink messages (unless synthetic
speech is used) and to operate the interface. Together, increasing traffic density, unstructured
traffic patterns, and datalink communication will create unprecedented demands for limited
visual attentional resources. Moreover, it could be speculated that the datalink display diverts
attention away from the radar. How this will affect ATCo performance and the distribution of
visual attention especially under high traffic density remains to be studied. Hilburn (1996) found
few effects of traffic density on the scanning of a datalink display. However, the datalink in his
study was integrated on the radar and the aircraft datablocks. While this might be a preferred
design option, it might not actually be implemented that way.
The increasingly visual nature of the ATCo environment parallels an earlier trend in the
cockpit. In older aircraft, pilots received feedback from cues other than the visual modality.
They were “flying by the seat of their pants”. Vibration or sound of the rather noisy engines
provided the pilot with feedback on the state of the engines. Moving throttles gave feedback on

8. Exp. 2: Traffic density and automation feedback type
91
the amount of thrust. Today, engines are less noisy and throttles do not move anymore.
Technology added a layer between the human and the machine and the information that pilots
used to be able to hear or feel now have to be conveyed through a large number of visual
displays.
Sklar and Sarter (1999) attributed many break-downs in human-machine cooperation in
the aviation domain to the almost exclusive use of visual feedback. Multi-modal feedback has
recently been suggested as a means to improve human interaction with automation and to
mitigate some automation costs (Parasuraman, 2000; Sarter, 2000). As systems become
increasingly automated and the human element is further removed from the system, the user
needs more feedback on the state of the system especially under high levels of automation
(Norman, 1990; Sarter, 2000). To avoid overloading the visual modality, the use of input
modalities other than the visual one has been discussed (Sklar & Sarter, 1999; Sarter, 2000;
Brickman, Hettinger, & Haas, 2000). Focal visual attention might not be an appropriate resource
for all information. Because humans cannot attend to all visual stimuli at the same time, it
becomes necessary to guide and capture the attention of the operator with other types of
feedback. Sarter (2000) suggested the use of cues in the operator's visual periphery as well as
tactile and auditory feedback. Sklar and Sarter (1999) conducted a study in which pilots received
feedback on unexpected changes in an automated cockpit system with either visual, tactile or a
combination of visual and tactile feedback. Pilots detected the highest percentage of events in
the tactile feedback condition and responded fastest in the multi-modal (i.e. visual and tactile)
feedback condition.
Focal visual attention is an appropriate resource when the operator is aware of the need to
attend to information. However, if the operator needs to be informed that important information
is available (e.g. when a conflict between aircraft is present on the PVD), an omnidirectional
modality could provide benefits. Auditory or tactile feedback can capture and guide the attention
of the operator irrespective of where he or she might be looking.
In the highly visual environment of the flight deck and other systems (e.g. process
control), the auditory modality is already being used to guide and capture attention. For
example, the traffic collision and avoidance system (TCAS), now mandatory in all commercial
aircraft in the US, uses visual and auditory feedback to notify the crew of aircraft in close
proximity and to advise the pilot on an avoidance maneuver. While visual feedback provides the

8. Exp. 2: Traffic density and automation feedback type
92
pilot with the spatial information (i.e. where the intruding aircraft is), traditional auditory
feedback does not include such information. The function of most auditory feedback is to direct
attention to the spatial information on the visual display (Begault & Pittman, 1996). In the future
however, three-dimensional auditory displays will even allow information on the location of a
stimulus to be provided to the operator (Brickman et al., 2000).
Brickman et al. (2000) discussed the use of multi-modal feedback in combat aircraft.
While compared to older aircraft more visual information is available in modern aircraft, the
pilot is expected to respond faster and is allowed increasingly less time to attend to the
information. Brickman et al. suggested the use of haptic, tactile, three-dimensional auditory, and
even olfactory feedback to support visual performance in such environments.
The advantage of tactile and auditory cues are their omnidirectionality and little space
requirement. Further, they are difficult to suppress and allow for parallel processing.
Disadvantages include their intrusiveness and clutter if used in excess (Sarter, 2000).
Currently, auditory channels are not utilized for automation feedback due to the heavy
use of voice communication in ATC. However, auditory automation feedback could be an
option for future ATM systems that will rely heavily on controller-pilot digital datalink
communication. The use of auditory feedback is already being investigated by the FAA
(Newman & Allendoerfer, 2000). While the current system makes use of visual and auditory
information-processing channels, the introduction of datalink in future systems will emphasize
the visual and de-emphasize the auditory channel. Hence, auditory feedback would be an option
to direct attention to visual stimuli in an increasingly visual environment. The increasing traffic
and the associated amount of information on the PVD will make it essential to find better ways
to guide and capture controller attention. Multi-modal feedback could be one such way.
There has been a long debate on the basic mechanisms of dividing attention between
modalities and selectively attending to different modalities. Researchers disagree whether there
is one supramodal attention mechanism that limits the processing of information from different
modalities (e.g. interference, time requirement when shifting from one modality to the other) or
if there are different attentional mechanisms for different modalities that operate independently
leading to performance benefits when two modalities are used.
Multiple resource theory (Wickens, 1984) suggests that task-sharing is improved if
information is distributed across different resources. Sensory modalities define one dimension of
8. Exp. 2: Traffic density and automation feedback type
93
resources. Each modality has its own pool of resources. If two or more sensory modalities
instead of one are used, information can be processed in a parallel rather than serial manner
because additional resources from another pool are available for allocation. Based on this
theory, a performance benefit would be expected when different input modalities are addressed.
Indeed, empirical evidence for performance benefits was found in dual-task studies. However,
the benefit of distributed attention across modalities could be due to a lack of interference in the
periphery.
Spence and Driver (1997a, 1997b, 1997c) proposed that auditory and visual resources do
not operate independently. They found a significant performance cost when participants had to
shift their attention from one modality to the other in a range of tasks such as simple detection or
discrimination tasks. Further, shifts of attention in one modality were associated with shifts of
attention in the other modality. They also found that is was difficult for participants to direct
visual and auditory attention to different locations simultaneously and that this could only be
achieved with a cost in performance. This was interpreted as evidence that the visual and
auditory modalities do not operate independently. Spence and Driver (1997a) characterized the
link between different modalities as a one-way cross-modal link. While an unpredictive (e.g. of
location) auditory alert reduced response times to both, auditory and visual stimuli, a visual alert
produced performance benefits for visual, but not for auditory stimuli (Spence & Driver, 1996).
Auditory orienting leads to visual orienting, but visual orienting does not lead to auditory
orienting.
Researchers seem to agree on the notion that auditory signals have greater alerting
properties than visual warnings (Posner, Nissen, & Klein, 1976; Perrott, Sadralodabai, Saberi, &
Strybel, 1991; Spence & Driver, 1997a). Posner et al. (1976) found that an auditory warning
signal was more effective than a visual one in reducing response times to a visual target. While
an auditory signal presented simultaneously with or after a visual target reduced response time to
a visual target stimulus, the opposite was not true. Visual warning signals did not speed up
response to visual targets. The reason for this asymmetry has not been fully explained yet.
While alerting based on visual stimuli usually requires effortful processing, auditory
signals can often be processed automatically. However, if situations are created in which visual
signals can also be processed automatically (e.g. when the subject is already expecting a visual
signal), the benefit of auditory alerting is reduced.
8. Exp. 2: Traffic density and automation feedback type
94
Perrott et al. (1991) found an advantage of spatially correlated auditory cues on response
latencies over no-sound cue conditions in a visual search task under different levels of visual
load and different distances between the fixation point and search target (0-14.8 degrees, i.e.
within the central visual field). After an initial fixation point was presented, participants had to
search for a target in an array of distractors and press one of two buttons depending on the
orientation of the target ("<" or ">"). The presence of spatially correlated auditory information
improved visual search performance compared to no-sound conditions. Even when the target
appeared at the initial fixation point (i.e. no search was necessary), performance was better with
auditory cues. This is an important indicator of the greater alerting properties of auditory
compared to visual cues. However, the benefits of spatially correlated auditory cues became
even more evident when the target was located at greater distances from the initial fixation point
(i.e. requiring a shift of gaze) and the display became more cluttered. Comparing a spatially
correlated auditory cue to a visually enhanced target (i.e. white target on black background and
black distractors on white background) revealed a similar advantage of the auditory over the
enhanced visual cue. The utility of the auditory cue was small when the target was near the
initial fixation point and few distractors were present, but became greater when the target was
remote and more distractors were present. This indicates that sound is useful even in situation
when a very distinct and easy to detect visual stimulus requires attention.
Consequently, the benefits of better conveying information with visual and auditory
signals simultaneously (e.g. auditory information can be presented outside the current field of
view) and the better alerting properties of auditory signals need to be weighted against
performance decrements due to the division of attention between the visual and auditory
modality when introducing multimodal feedback into systems.
The purpose of the next experiment was to twofold. First, the impact of different levels
of traffic density on ATCo performance, mental workload, and eye movements were investigated
when ATCos were supported by a decision aid. Of particular interest was the distribution of eye
movements across different areas of interest (e.g. the datalink) under levels of moderate and high
traffic density in an environment where ATCos were supported by a decision aid. Second, the
effectiveness of different types of feedback to capture and guide ATCo attention in a highly
visual environment was investigated. It was investigated if a conflict detection aid with visually
8. Exp. 2: Traffic density and automation feedback type
95
enhanced and multi-modal feedback could improve conflict detection performance further and
reduce mental workload.
Hence, the present study investigated the effect of different levels of traffic density and
different types of feedback (single modality versus multi-modal) on controller performance,
mental workload, and visual attention in an ATC task simulating FF conditions.
8.1.1 Hypotheses and research questions
The distribution of visual attention across the displays as indicated by eye fixations and
dwells was examined under moderate and high traffic. This should indicate how a datalink
display and the expected high levels of traffic expected for the future will impact (visual)
attention processes of the ATCo. Due to its purely visual nature, the datalink has the potential to
divert ATCo attention away from the PVD, especially under high traffic, when there is increased
demand for communication. So far, very few studies have investigated visual attention in ATC
using eye movements, especially when controllers were using a datalink for communication
under FF conditions. This was an exploratory investigation without specific hypotheses.
It was expected that multi-modal feedback would result in better conflict detection
performance (i.e. higher detection rates and earlier detection) than simple visual feedback,
especially under high traffic density. Therefore, the hypothesized performance benefits of multi-
modal feedback would be greater under high than under moderate traffic density. The same
prediction was made for a visually enhanced form of feedback that provided information on the
expected flight path and the resulting location of the predicted conflict. In the previous
experiment it appeared that controllers were not always sure why they received a conflict
feedback when aircraft were not on an immediate head-on conflict course (i.e. when one or both
aircraft had to make a heading change as indicated on their flight plan before they got into
conflict). It was expected that a visually enhanced feedback would make the decision of the aid
more transparent leading to a reduced visual search requirement. Under FF conditions, it is
essential that ATCos detect and respond to potential conflicts fast because traffic density is high
and leaves little time before a loss of separation occurs. Therefore, benefits of visually enhanced
and multi-modal feedback were expected especially for advance notification times. It was also
expected that mental workload would be reduced under enhanced and multi-modal feedback

8. Exp. 2: Traffic density and automation feedback type
96
compared to simple visual feedback because both provided an indication of where the conflict
would occur and should reduce the need to search the display to find this point of conflict. In
addition, it makes the decision of the aid more transparent and comprehensible to the ATCo by
displaying the converging flight paths.
Among other factors, the use of automation and ultimately performance in a human-
automation system is determined by the operator’s trust in the aid and self-confidence to perform
the task without the aid. It was anticipated that controllers would be less self-confident to detect
conflicts without the aid under high than moderate traffic density and that controllers would trust
the enhanced aid more than the simple visual aid because it makes the reason for the decision
and the alert more comprehensible.
8.2 Method
8.2.1 Participants
Eight active ATCos from the Washington Center air route traffic control center (ARTCC;
n = 5), Baltimore-Washington International (BWI; n = 2) and Dulles (IAD; n = 1) terminal radar
control area (TRACON) facilities served as paid volunteers. Due to the introduction of new
equipment as part of the modernization of the en route ATC system at the Washington Center
ARTCC and scheduled training and overtime for most staff, it was difficult to recruit en route
controllers at the time of the study. Therefore, TRACON controllers were included in the
experiment. ATCos were between the ages of 33 and 45 years (M = 37.38; SD = 3.82). Their
overall ATC experience in terms of years on-the-job ranged from 11 to 21 years (M = 15.31; SD
= 3.71). En route and TRACON controllers did not differ in terms of age, F(1, 6) = 1.47, p >
.05, or years on-the-job, F(1, 6) = 0.56, p > .05. All participants were male.
8.2.2 Apparatus
For a description of the ATC simulator see Experiment 1. The set-up was identical to the
previous experiment with the exception that the PVD and the datalink display were both
presented on 21-inch monitors. The 21-inch monitor was used to facilitate the search for
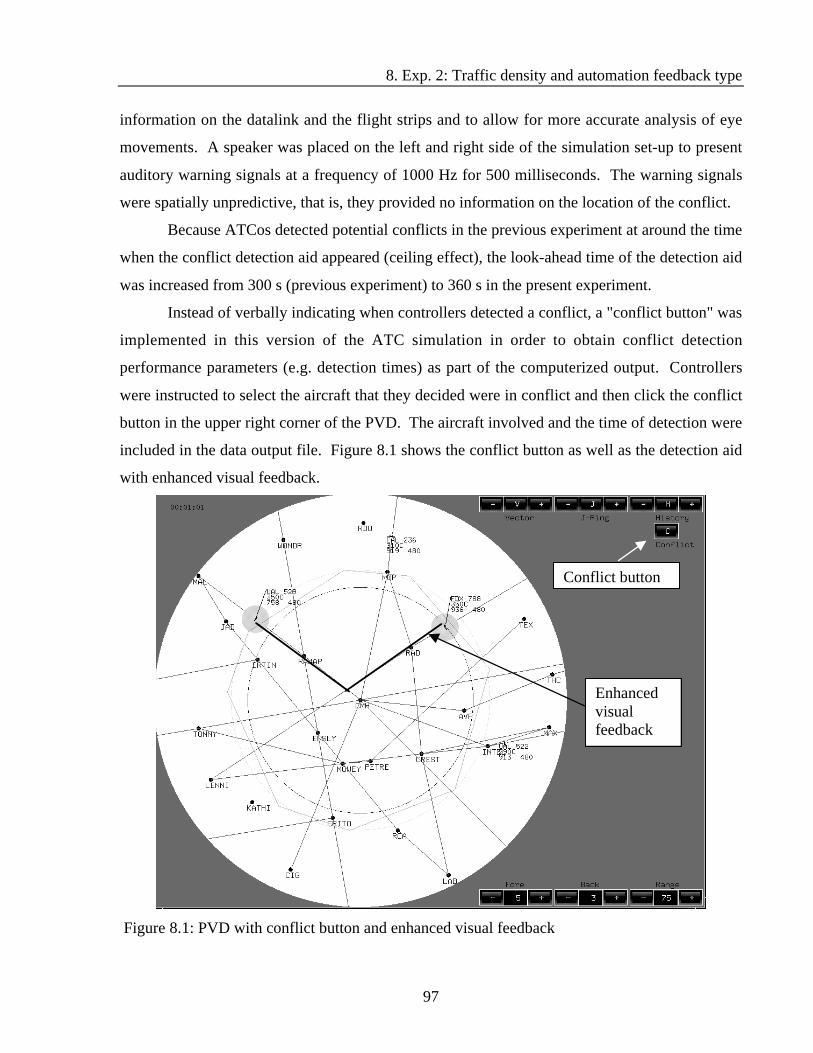
8. Exp. 2: Traffic density and automation feedback type
97
information on the datalink and the flight strips and to allow for more accurate analysis of eye
movements. A speaker was placed on the left and right side of the simulation set-up to present
auditory warning signals at a frequency of 1000 Hz for 500 milliseconds. The warning signals
were spatially unpredictive, that is, they provided no information on the location of the conflict.
Because ATCos detected potential conflicts in the previous experiment at around the time
when the conflict detection aid appeared (ceiling effect), the look-ahead time of the detection aid
was increased from 300 s (previous experiment) to 360 s in the present experiment.
Instead of verbally indicating when controllers detected a conflict, a "conflict button" was
implemented in this version of the ATC simulation in order to obtain conflict detection
performance parameters (e.g. detection times) as part of the computerized output. Controllers
were instructed to select the aircraft that they decided were in conflict and then click the conflict
button in the upper right corner of the PVD. The aircraft involved and the time of detection were
included in the data output file. Figure 8.1 shows the conflict button as well as the detection aid
with enhanced visual feedback.
Figure 8.1: PVD with conflict button and enhanced visual feedback
Conflict button
Enhancedvisualfeedback
8. Exp. 2: Traffic density and automation feedback type
98
Subjective ratings of trust in the detection aid and self-confidence to detect conflicts
without the aid as well as NASA-TLX ratings were obtained.
The tasks and dependent variables were the same as in experiment 1 with the exception
that cardiovascular activity was not recorded in this experiment. However, ocular activity (i.e.
eye fixations and dwells) was recorded as a measure of visual attention.
Eye and head tracking system. An Applied Science Laboratory (ASL) Model 5000 eye
tracker was used to record eye movements from the left eye. The head-mounted system
determines eye movements based on the corneal reflection technique at a sampling rate of 60 Hz.
A magnetic head-tracker (The Flock of Birds , Ascension Technology Corporation) was used to
allow and account for participants’ head movements. The Flock of Birds is a six-degree-of-
freedom measuring device that tracks the position and orientation of a receiver by a transmitter
when the receiver is located within about 1.3 meters of the transmitter. Position and orientation
of a receiver mounted on the headband are determined by the transmission of a pulsed magnetic
field from the transmitter to the receiver. From the measured magnetic field characteristics, the
receiver computes position and orientation of the head and sends the information to the host
computer where the information is then merged with the eye position data. The computer system
is then able to separate and "subtract" the head movements from the eye movements. Eye and
head tracker together determine the participants' point-of-gaze with respect to a scene while
accounting for head movements (e.g. from the flightstrips to the PVD).
The eye-head tracking system consisted of a PC with interface cards and the necessary
software, control units for the eye tracking system and an adjustable headband including an
optics system and a visor to mount the equipment on the participants' head. The optics system
contained an eye camera and an illuminator that sends a near-infrared beam to a visor. The
illumination beam is coaxial with the optical axis of the eye camera. The visor deflects the light
beam into the participant's left eye to illuminate the cornea. At the same time, the eye camera
continuously records images of the eye and the reflection of the beam off the cornea that are
mirrored in the visor. This is transmitted to the eye camera control unit. The eye tracker control
unit consists of three monitors (experimenter monitor, monitor for scene and eye image) and
connects to the PC.

8. Exp. 2: Traffic density and automation feedback type
99
The ASL 5000 eye tracker uses the corneal reflection technique to compute the eye line
of gaze. The distance between the reflection of the illuminator from the front surface of the
cornea and the midpoint of the pupil is approximately proportional to the extent of the eye
movement. The relationship between eye line of gaze and the distance between pupil and
corneal reflection (PCR) is determined with equation 8.1.
PCR = K sin( )θ (Equation 8.1)
K is the distance between the iris and corneal center of curvature and θ is the eye line of
gaze angle with respect to the light source and camera. The corneal reflection is detectable over
about a 30-40°-diameter field of visual angle (without head movements).
A calibration process adjusts this relationship to interindividual differences such as
cornea shape. Figure 8.2 explains how the distance between pupil center and corneal reflection
is obtained. As the eye moves, the reflection off the cornea stays constant. Only the center of
the pupil moves. The change in distance between the midpoint of the corneal reflection and the
midpoint of the pupil is proportional to the change in point-of-gaze.
Figure 8.2: Determination of point-of-gaze and pupil diameter
There is no single agreed upon definition of a fixation other than that a fixation refers to
the time between saccades when the eye is stationary. The analysis program provided by ASL
defines a fixation as the mean x- and y-coordinates measured over a minimum of 100
milliseconds during which the eye does not move more than 1° visual angle vertically and
horizontally. A dwell was defined as a series of contiguous fixations within a defined area of
Pupil center
Cornealreflection
Distance pupilcenter-cornealreflection (PCR)
Eye

8. Exp. 2: Traffic density and automation feedback type
100
interest (e.g. the radar display). Dwell duration is the “sum of all the fixation durations that
make up a dwell” (ASL, 1999).
In more detail, fixations are determined with a three-boundary approach with boundaries
of 0.5°, 1.0°, and 1.5°. For data sampled at 60 Hz, the program starts by examining a window of
six data points or samples (16.6 ms each) for their standard deviation (SD) of the horizontal (x)
and vertical (y) eye position coordinates. If the SD are smaller than 0.5°, the mean x and y
coordinates are used as the temporary fixation coordinates (xt, yt). If the SD is greater than 0.5°,
the window is moved until a window of six data samples is found that has a SD of smaller than
0.5°. This is the fixation start point. Then the program calculates the horizontal and vertical
distance (dx, dy) of the next data sample from xt and yt. If dx and dy is smaller than 1°, the sample
is included in the fixation and the next sample is tested. If it is not smaller than 1°, the next
sample is tested. This process is repeated until a data sample is found that is less than the 1°
criterion or until three sequential samples have been tested. If one of these samples is less than
1°, previous samples that were greater than 1° are tested against a third criterion, namely 1.5°.
All samples that are less than 1° or 1.5° are then included in the fixation and used for the
determination of the final fixation position. If dx and dy from three sequential samples exceed 1°,
the means of x and y are calculated. If the means do not differ from xt and yt by more than 1°,
they are included in the fixation. If they differ more than 1°, the previous fixation is terminated
at the last acceptable sample and the process reiterates with a new fixation. Blinks were defined
as a pupil loss of 200 ms or less. However, a blink does not terminate a fixation. Pupil loss of
more than 200 ms terminates a fixation at the last acceptable sample.
For the analysis of eye movements, three areas of interest were defined corresponding to
the three ATC simulation tasks of conflict detection, communication to accept and hand-off
traffic, and updating the flight strips: (1) the radar display, (2) the communication area, and (3)
the flight strips. The ASL analysis program allows to match fixations and dwells to these areas
and determine how often and how long the eye fixated or dwelled on each area. Figure 8.3
shows a schematic of these areas of interest. While the eight points in the figure represent eight
fixations, the series of five contiguous fixations within the radar display constitutes one dwell.
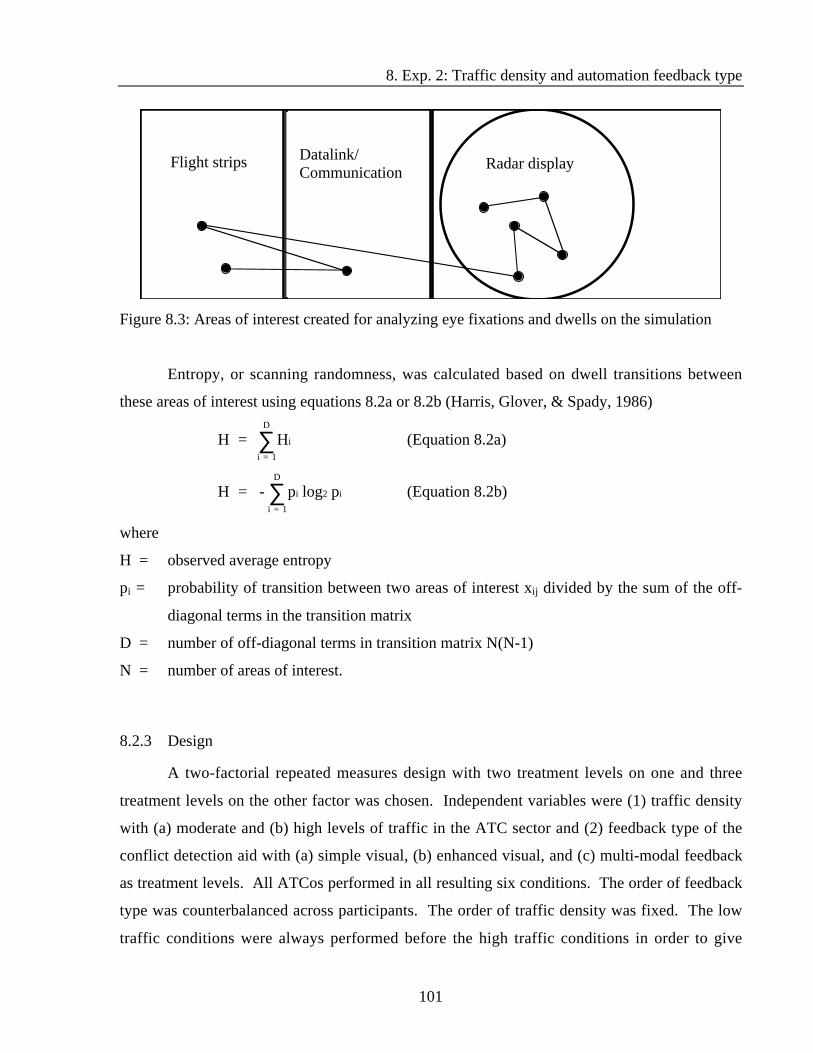
8. Exp. 2: Traffic density and automation feedback type
101
Figure 8.3: Areas of interest created for analyzing eye fixations and dwells on the simulation
Entropy, or scanning randomness, was calculated based on dwell transitions between
these areas of interest using equations 8.2a or 8.2b (Harris, Glover, & Spady, 1986)
H = Hi
i = 1
D
∑ (Equation 8.2a)
H = - p log pi 2 i
i = 1
D
∑ (Equation 8.2b)
where
H = observed average entropy
pi = probability of transition between two areas of interest xij divided by the sum of the off-
diagonal terms in the transition matrix
D = number of off-diagonal terms in transition matrix N(N-1)
N = number of areas of interest.
8.2.3 Design
A two-factorial repeated measures design with two treatment levels on one and three
treatment levels on the other factor was chosen. Independent variables were (1) traffic density
with (a) moderate and (b) high levels of traffic in the ATC sector and (2) feedback type of the
conflict detection aid with (a) simple visual, (b) enhanced visual, and (c) multi-modal feedback
as treatment levels. All ATCos performed in all resulting six conditions. The order of feedback
type was counterbalanced across participants. The order of traffic density was fixed. The low
traffic conditions were always performed before the high traffic conditions in order to give
Datalink/Communication
Radar displayFlight strips

8. Exp. 2: Traffic density and automation feedback type
102
ATCos additional practice before performing under high traffic density. Both traffic density
conditions per feedback were completed before performing in the next feedback condition. The
dependent variables are listed in table 6.1.
For each condition, one scenario was created. Controllers were presented with six 25-
minute scenarios that were created to combine high (on average about sixteen aircraft in the
sector at one time after an initial 10-minute ramp-up period) and moderate (ten aircraft) traffic
density with three different types of feedback in a 50-mile radius sector. The conflict detection
aid alerted the controllers of an impending conflict six minutes before the loss of separation.
Because in the previous experiment ATCos sometimes reported potential conflicts before the aid
appeared, the look ahead time was increased from five (previous experiment) to six minutes.
The three different types of feedback presented in figure 8.4 were used: (1) a simple visual aid
indicating with a red filled circle which aircraft were predicted to be in conflict, (2) an enhanced
visual aid indicating with a red filled circle which aircraft were predicted to be in conflict and
indicating with two red heading lines why and where they were predicted to be in conflict, and
(3) an enhanced visual aid with an auditory component (multi-modal feedback condition). The
enhanced visual aid was provided in order to make the decision of the aid more transparent. The
auditory feedback produced two short tones (approximately 500 ms) at 1000 Hz as soon as the
visual aid appeared on the screen. In fact, only two different scenarios (one for moderate and
one for high traffic) were used. In order to create a second set of scenarios, the sector and traffic
patterns were rotated to simulate a different flow of traffic. Therefore, the scenarios for the three
feedback type conditions were essentially the same and differences in controller performance and
mental workload should be due to the feedback manipulation and not other variables specific to a
particular scenario (e.g. conflict geometries). Each scenario contained five potential conflicts
that were to be detected - three self-separations and two conflicts.

8. Exp. 2: Traffic density and automation feedback type
103
DLH 123350C569 500
UAL 456350C324 500
USA 333290C901 480 FDX 878
370C369 450
DLH 123350C569 500
UAL 456350C324 500
USA 333290C901 480 FDX 878
370C369 450
DLH 123350C569 500
UAL 456350C324 500
USA 333290C901 480 FDX 878
370C369 450
(1) Simple visual feedback (2) Enhanced visual feedback (3) Multi-modal feedback
Figure 8.4: Feedback conditions
8.2.4 Procedure
After providing biographical information, controllers were given a demonstration of the
simulation, completed a fourteen-minute practice trial, and were familiarized with the NASA-
TLX. Training was more extensive than in the previous study. ATCos received more
information on the functionality of the aid with a specific emphasis on the differences between
the STCA controllers currently use in their facilities and the more advanced functions of the aid
in the study. ATCos were told that the aid used in this experiment detected conflicts not just
based on current location, speed, and heading, but also based on the flightplans of aircraft and six
minutes in advance. They were given several examples.
Then, controllers completed the six 25-minute scenarios and rated their mental workload
on the NASA-TLX and the trust rating scales after each scenario. Two controllers wore the eye-
tracker in all three high traffic conditions. Due to the weight of the eye tracker and the pressure
from the headband, this proved to be too long a time for the participants to wear the eye tracker
comfortably. Therefore, the remaining six ATCos wore the eye tracker in two (one high and one
moderate traffic condition) out of six scenarios.
+ Tone

8. Exp. 2: Traffic density and automation feedback type
104
8.3 Results
All eight participants could be entered into the analyses. The following measures of
performance and mental workload were analyzed with 3 (feedback type) x 2 (traffic density)
repeated measures ANOVAs. Both variables were within-subject factors. An alpha level of .05
was used for all statistical tests.
8.3.1 Primary task performance: Detection of conflicts and self-separations
Controllers detected almost all events except for five potential conflicts out of 240 events
to be detected. This corresponds to a near-perfect detection rate of 97.92% (SE = 0.93%). Due
to the small number of missed events no inferential statistics were calculated. The missed
potential conflicts were in five different scenarios (two under high, three under moderate traffic;
three self-separations and two conflicts). Only in the high traffic and simple visual feedback
condition did all ATCos detect all events.
Advanced notification times for conflicts and self-separations were calculated by
averaging notification times across the two conflicts and three self-separations, respectively. For
the five missing events, the advance notification time was based on the available datapoints only
(e.g. data was averaged across two instead of three advance notification of self-separations in a
condition). Note that the advance notification of the decision aid was 360 seconds.
Neither traffic density, (1, 7) = .06, p > .06, feedback type, F(2, 14) = .08, p > .05, nor the
interaction between traffic density and feedback type, F(2, 14) = .96, p > .05, had significant
effects on the advanced notification time for conflicts (M = 388.06 s; SE = 15.81 s).
Self-separations were detected significantly earlier under moderate (M = 447.95 s; SE =
8.06 s) than under high traffic density (M = 362.29 s; SE = 3.99 s), F(1, 7) = 73.00, p < .0001.
Neither feedback type, F(2, 14) - .32, p > .05, nor the interaction between traffic density and
feedback type, F(2, 14) = .35, p > .05, had significant effects.
8.3.2 Primary task performance: Accepting and handing-off aircraft
Controllers accepted more than 98% of the aircraft (M = 98.91%; SE = 0.30%) into their
sector with an average response time of 26.20 seconds (SE = 1.17 s). The number of misses was

8. Exp. 2: Traffic density and automation feedback type
105
too low to calculate meaningful inferential statistics. There were no effects of traffic, F(1, 14) =
.59, p . .05, feedback, F(2, 14) = .08, p > .05, or the interaction, F(2, 14) = 1.39, p > .05, on
response times to requests for acceptance.
There were no effects on the percentage of successful handoffs for traffic, F(1, 14) =
1.97, p > .05, feedback type, F(2, 14) = .30, p > .05, or the interaction between traffic and
feedback type, F(2, 14) = 1.44, p > .05.
More aircraft were handed-off early under moderate (M = 31.60 %; SE = 3.92 %) than
under high traffic load (M = 25.99 %; SE = 3.10 %), F(1, 7) = 3.66, p = .10. Effects of feedback
type, F(2, 14) = .45, p > .05 and the interaction, F(2, 14) = 1.11, p > .05, were non-significant.
It took controllers longer to hand-off aircraft under high (M = 25.19 s; SE = 2.47 s) than
under moderate traffic density (M = 22.25 s; SE = 2.10 s), F(1, 14) = 3.50, p = .10. A trend was
found for feedback type, F(2, 14) = 2.32, p = .14. It took ATCos longest to hand-off aircraft
with the multi-modal feedback (M = 26.22 s; SE = 3.16 s) followed by the enhanced feedback (M
= 25.33 s; SE = 2.78 s). Fastest response times were obtained with the simple visual feedback
(M = 19.61 s; SE = 2.26 s). No significant effect of the interaction between feedback type and
traffic was found for response times, F(2, 14) = .96, p > .05.
8.3.3 Secondary task performance
Performance in the secondary task was mostly affected by traffic density. Controllers
missed to update more than three times as many waypoints under high (M = 34.72%; SE =
2.32%) than under moderate traffic load (M = 10.00%; SE = 1.43%), F(1,14) = 146.72, p < .001.
Controllers updated a higher percentage of waypoints early when traffic was moderate (M =
27.08%; SE = 3.70%) than when traffic was high (M = 15.12%; SE = 2.33%), F(1,14) = 26.61, p
= .001. Response times to the secondary task were more than twice as long for high (M = 138.27
s, SE = 10.21 s) than for moderate traffic load (M = 62.73 s; SE = 4.26 s), F(1, 14) = 35.11, p <
.001.
There was no effect of feedback type on the percentage of missed updates, F(2, 14) =
1.22, p > .05, early updates, F(2, 14) = .05, p > .05, or response times, F(2, 14) = .32, p > .05.
A marginally significant effect was found for the interaction between feedback type and
traffic, F(2, 14) = 2.89, p = .09 on the percentage of missed updates. While there was no

8. Exp. 2: Traffic density and automation feedback type
106
significant difference between simple (M = 9.58%; SE = 3.3%), enhanced (M = 11.25%; SE =
1.88%), and multi-modal feedback (M = 9.17%; SE = 2.34%) under moderate traffic density,
more updates were missed in the multi-modal feedback condition (M = 40.28%; SE = 4.55%)
than in the simple (M = 33.10%; SE = 3.40%) or enhanced feedback condition (M = 30.78%; SE
= 3.74%) under high traffic. No interaction effect was found on response times, F(2, 14) = .51, p
> .05. However, a trend was also found for the interaction between feedback type and traffic
density on early updates, F(2, 14) = 2.24, p = .14. Under high traffic density, the fewest early
updates were made in the multi-modal feedback condition (M = 11.11%; SE = 2.95%) followed
by the simple visual (M = 15.28%; SE = 4.14%) and the enhanced visual (M = 18.98%; SE =
4.83%). Under moderate traffic density, the most early updates were made in the multi-modal
feedback condition (M = 30.00%; SE = 7.07%), followed by the simple visual (M = 26.25%; SE
= 6.41%), and the enhanced visual condition (M = 25.00%; SE = 6.46%).
8.3.4 Physiological measures: Eye movements
Two participants were excluded from the analyses of eye movements because they
performed in the high traffic density conditions only. This left six participants for the analyses
of eye movements under moderate and high traffic conditions. One additional participant
requested to take the eye tracker off due to discomfort and pain about 18 minutes and 40 seconds
into a high traffic scenario (i.e. he completed about 75% of the scenario). In order to make his
results comparable to other participants’ results, the number of fixations and dwells was adjusted
by adding 25% to the number of fixations and dwells on each area of interest in the scenario that
he cut short.
Entropy. Entropy was higher under moderate (M = 2.50; S E = .03) than under high
traffic density (M = 2.33; SE = .07), even though the effect did not reach significance, F(1, 5) =
3.91, p = .11. Higher values under moderate traffic reflect a more random scan than under high
traffic, an indicator for lower workload under moderate traffic (e.g. Hilburn, 1996). The effects
of feedback type on scanning randomness were not investigated due to the low number of
participants and the fact that ATCos could wear the eye tracking equipment for a limited amount
of time only due to discomfort.
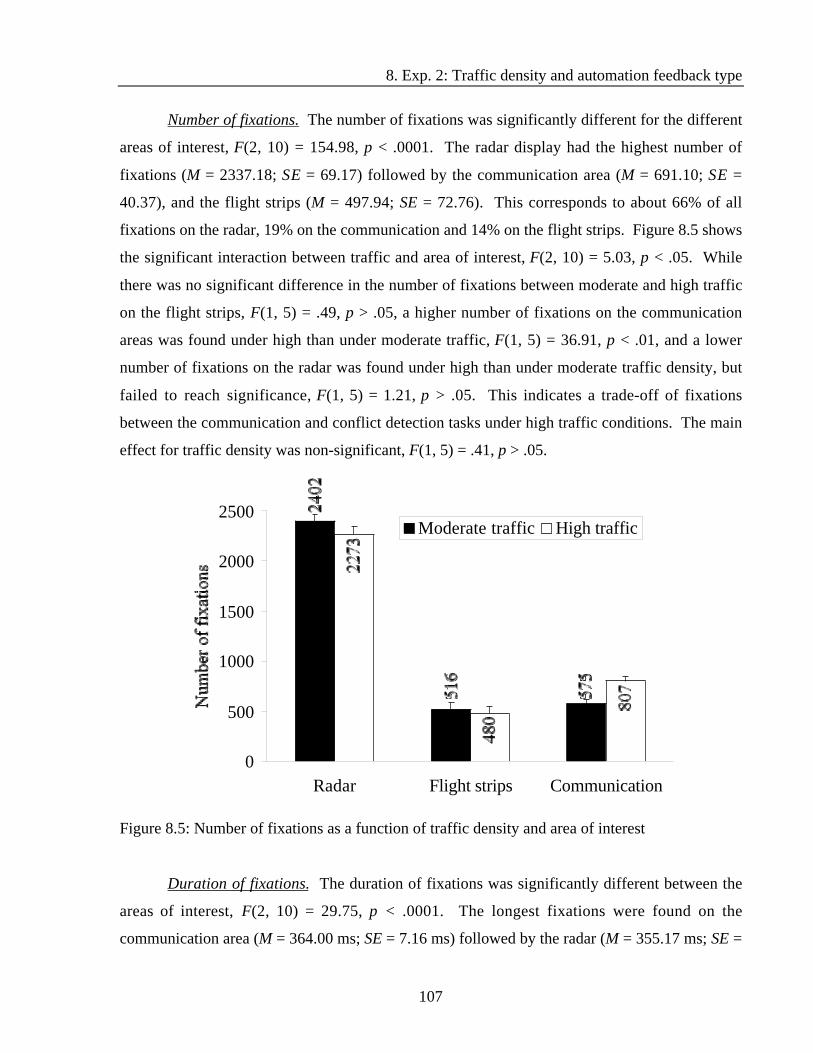
8. Exp. 2: Traffic density and automation feedback type
107
Number of fixations. The number of fixations was significantly different for the different
areas of interest, F(2, 10) = 154.98, p < .0001. The radar display had the highest number of
fixations (M = 2337.18; SE = 69.17) followed by the communication area (M = 691.10; SE =
40.37), and the flight strips (M = 497.94; SE = 72.76). This corresponds to about 66% of all
fixations on the radar, 19% on the communication and 14% on the flight strips. Figure 8.5 shows
the significant interaction between traffic and area of interest, F(2, 10) = 5.03, p < .05. While
there was no significant difference in the number of fixations between moderate and high traffic
on the flight strips, F(1, 5) = .49, p > .05, a higher number of fixations on the communication
areas was found under high than under moderate traffic, F(1, 5) = 36.91, p < .01, and a lower
number of fixations on the radar was found under high than under moderate traffic density, but
failed to reach significance, F(1, 5) = 1.21, p > .05. This indicates a trade-off of fixations
between the communication and conflict detection tasks under high traffic conditions. The main
effect for traffic density was non-significant, F(1, 5) = .41, p > .05.
575
2273
480
807
2402
516
0
500
1000
1500
2000
2500
Radar Flight strips Communication
Num
ber
of f
ixat
ions
Moderate traffic High traffic
Figure 8.5: Number of fixations as a function of traffic density and area of interest
Duration of fixations. The duration of fixations was significantly different between the
areas of interest, F(2, 10) = 29.75, p < .0001. The longest fixations were found on the
communication area (M = 364.00 ms; SE = 7.16 ms) followed by the radar (M = 355.17 ms; SE =

8. Exp. 2: Traffic density and automation feedback type
108
5.78 ms) and the flight strips (M = 282.75 ms; SE = 10.69 ms). The difference in the duration of
fixations between high (M = 328.44 ms; SE = 11.05 ms) and moderate traffic density (M =
339.50 ms; SE = 10.76 ms) did not reach significance, F(1, 5) = 1.95, p > .05. The interaction
between traffic density and area of interest had no significant effect on the duration of fixations,
F(2, 10) = .84, p > .05.
Number of dwells. The number of dwells was significantly different in the areas of
interest, F(2, 10) = 57.02, p < .0001. The most dwells were on the radar (M = 198.50; SE =
9.99), followed by the communication areas (M =122.35; SE =4.15) and the flight strips (M
=92.26; SE = 10.80). Overall, traffic density had no effect on the number of dwells, F(1, 5) = .88,
p > .05. Figure 8.6 shows the interaction between traffic and area of interest, F(2, 10) = 3.09, p =
.09. Traffic density had a significant effect on the number of dwells on the flightstrips, F(1, 5) =
5.98, p = .06, but not on the number of dwells on the radar, F(1, 5) = .48, p > .05, or the
communication areas, F(1, 5) = .01, p > .05.
122
203
80
123
104
194
0
50
100
150
200
250
Radar Flight strips Communication
Num
ber
of d
wel
ls
Moderate traffic High traffic
Figure 8.6: Number of dwells as a function of traffic density and area of interest
Dwell duration. Figure 8.7 displays dwell durations. There was no significant difference
in dwell durations between moderate (M = 2.57 s; SE = .37 s) and high traffic (M = 2.71 s; SE =
.31 s), F(1, 5) = .67, p > .05. The duration of dwells was significantly different between the
different areas of interest, F(2, 10) = 41.65, p < .0001. The longest dwells were found on the
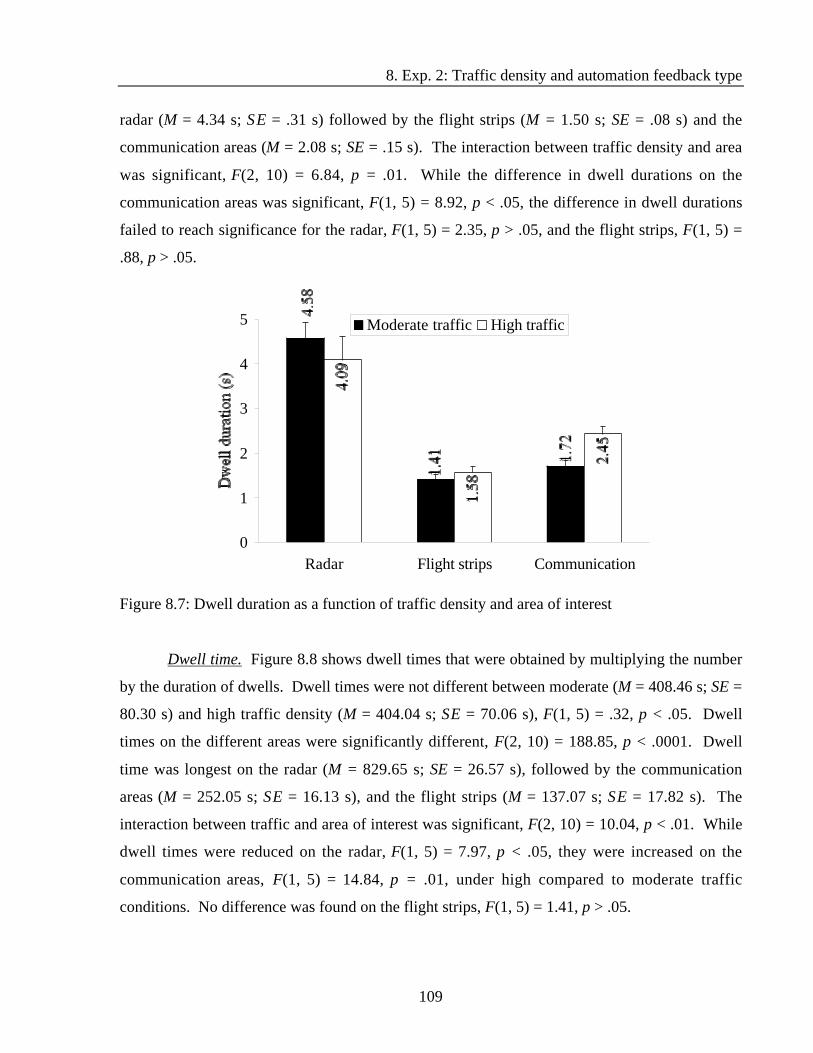
8. Exp. 2: Traffic density and automation feedback type
109
radar (M = 4.34 s; SE = .31 s) followed by the flight strips (M = 1.50 s; SE = .08 s) and the
communication areas (M = 2.08 s; SE = .15 s). The interaction between traffic density and area
was significant, F(2, 10) = 6.84, p = .01. While the difference in dwell durations on the
communication areas was significant, F(1, 5) = 8.92, p < .05, the difference in dwell durations
failed to reach significance for the radar, F(1, 5) = 2.35, p > .05, and the flight strips, F(1, 5) =
.88, p > .05.
1.41 1.
72
4.09
1.58
2.45
4.58
0
1
2
3
4
5
Radar Flight strips Communication
Dw
ell d
urat
ion
(s)
Moderate traffic High traffic
Figure 8.7: Dwell duration as a function of traffic density and area of interest
Dwell time. Figure 8.8 shows dwell times that were obtained by multiplying the number
by the duration of dwells. Dwell times were not different between moderate (M = 408.46 s; SE =
80.30 s) and high traffic density (M = 404.04 s; SE = 70.06 s), F(1, 5) = .32, p < .05. Dwell
times on the different areas were significantly different, F(2, 10) = 188.85, p < .0001. Dwell
time was longest on the radar (M = 829.65 s; SE = 26.57 s), followed by the communication
areas (M = 252.05 s; SE = 16.13 s), and the flight strips (M = 137.07 s; SE = 17.82 s). The
interaction between traffic and area of interest was significant, F(2, 10) = 10.04, p < .01. While
dwell times were reduced on the radar, F(1, 5) = 7.97, p < .05, they were increased on the
communication areas, F(1, 5) = 14.84, p = .01, under high compared to moderate traffic
conditions. No difference was found on the flight strips, F(1, 5) = 1.41, p > .05.

8. Exp. 2: Traffic density and automation feedback type
110
208.
30
789.
52
295.
80
147.
32
869.
78
126.
81
0
100
200
300
400
500
600
700
800
900
Radar Flight strips Communication
Dw
ell t
ime
(s)
Moderate traffic High traffic
Figure 8.8: Dwell time as a function of traffic density and area of interest
8.3.5 Subjective ratings of mental workload
Controllers rated their subjective mental workload significantly higher when traffic
density was high (M = 70.97; SE = 2.61) than when it was moderate (M = 50.83; SE = 3.67), F(1,
14) = 44.37, p < .001. No significant effects were found for type of feedback, F(2, 14) = .96, p >
.05, or the interaction between traffic density and feedback type, F(2, 14) = .21, p > .05.
8.3.6 Trust and self-confidence
Trust ratings ranged from 50 to 100 with an average of 82.60 (SE = 1.95). Traffic
density, F(1, 14) = .22, p > .05, feedback types, F(2, 14) = .40, p > .05, or the interaction, F(2,
14) = 1.13, p > .05, did not have significant effects on trust ratings.
Ratings of self-confidence ranged from 10 to 100 with an average of 69.48 (SE = 3.51).
Figure 8.9 shows the ATCo’s ratings of self-confidence to perform without the automation aid.
While under high traffic, self-confidence was highest for the enhanced visual feedback, under
moderate traffic density self-confidence was lowest for the enhanced visual feedback, F(1, 14) =
8.61, p < .01. Traffic, F(1, 14) = .03, p > .05, or feedback type, F(2, 14) = 1.23, p > .05, did not
have significant effects on the ratings.
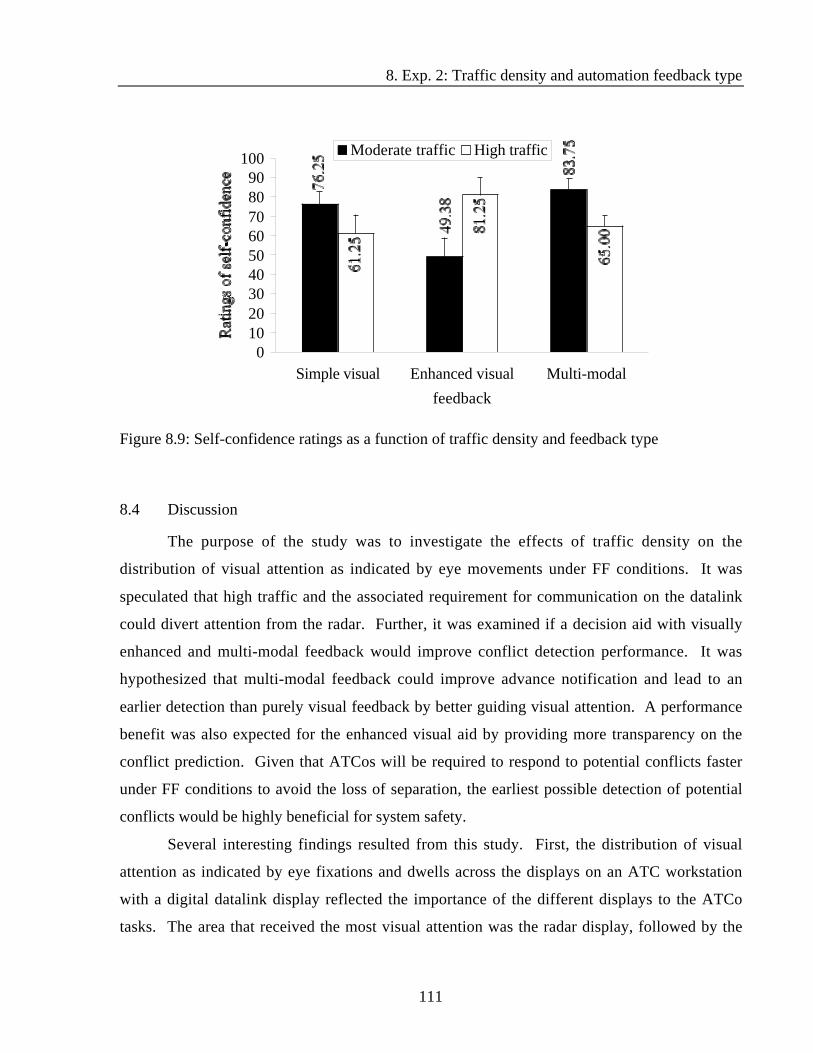
8. Exp. 2: Traffic density and automation feedback type
111
83.7
5
49.3
8
76.2
5
81.2
5
61.2
5
65.0
0
0102030405060708090
100
Simple visual Enhanced visual Multi-modal
feedback
Rat
ings
of
self
-con
fide
nce
Moderate traffic High traffic
Figure 8.9: Self-confidence ratings as a function of traffic density and feedback type
8.4 Discussion
The purpose of the study was to investigate the effects of traffic density on the
distribution of visual attention as indicated by eye movements under FF conditions. It was
speculated that high traffic and the associated requirement for communication on the datalink
could divert attention from the radar. Further, it was examined if a decision aid with visually
enhanced and multi-modal feedback would improve conflict detection performance. It was
hypothesized that multi-modal feedback could improve advance notification and lead to an
earlier detection than purely visual feedback by better guiding visual attention. A performance
benefit was also expected for the enhanced visual aid by providing more transparency on the
conflict prediction. Given that ATCos will be required to respond to potential conflicts faster
under FF conditions to avoid the loss of separation, the earliest possible detection of potential
conflicts would be highly beneficial for system safety.
Several interesting findings resulted from this study. First, the distribution of visual
attention as indicated by eye fixations and dwells across the displays on an ATC workstation
with a digital datalink display reflected the importance of the different displays to the ATCo
tasks. The area that received the most visual attention was the radar display, followed by the

8. Exp. 2: Traffic density and automation feedback type
112
communication areas and the flight strips. Overall, about 66% of all fixations were on the radar
display, a large proportion, but less than what other researchers found. Karsten, Goldberg, Rood,
and Sultzer (1975) found that controllers spend about 80% of their time looking at the radar
display, 13% at the flight strips, and 5% at input devices. That the radar was fixated the most
was consistent with the radar being the most important display. Information for the most
important task (i.e. conflict detection) is presented there. While communication is important, it
is not of concern by itself. It is only subservient to conflict detection. Similarly, updating flight
strips is secondary to ATCos and even less important than communicating. This was reflected in
the little amount of visual attention allocated to the flight strips. Flight strips are important for
planning, but under FF, flight strips loose their importance for conflict detection because pilots
could change their intended flight path (as stated on the flight strips) at any moment. This
distribution of visual attention was also consistent with data reported by Willems and Truitt
(1999). That fewer fixations were made on the radar in this study than in the study by Karsten et
al. (1975) could be due to the use of datalink in the present experiments. However, this can only
be speculated.
The trend for reduced entropy or scanning randomness under high traffic density is
consistent with findings by Hilburn (1996). This represents a narrowing or filtering of
information under high workload and, as Wickens and Holland (2000) point out can reflect a
perceptual process as well as an adaptive strategy. Task priorities guide the attentional filtering
so that performance on the most important task remains at a constant level while tasks of lower
priority are filtered out. This is an effective strategy as long as the prioritization matches the
requirements of the environment, but could pose a problem if this is not the case.
Overall, no differences in fixation or dwell duration between moderate and high traffic
were found. This is in contrast with other studies in which increased workload was associated
with increased dwell durations in a cockpit (Tole et al., 1982; Harris et al., 1982) and an ATC
simulation (Stein, 1992).
The most important finding, however, was the shift in attention allocation to the different
sources of information from moderate to high traffic conditions. Visual attention to the
communication areas was increased under high compared to moderate traffic at the expense of
visual attention to the radar display. Due to the limited pool of attentional resources, additional
attentional resources to communicate on the datalink had to be "borrowed" from a different area.

8. Exp. 2: Traffic density and automation feedback type
113
In this case, ATCos chose to “borrow” resources from the radar. This shift in attention allocation
strategy could be due to the need for more communication under high than under moderate
traffic. Even though communication is not the highest-priority task of controllers, it is very
much driven by pilot-initiated transmissions (e.g. request for acceptance) that need to be
responded to fast. The high traffic density increases the number of such transmissions
considerably.
This finding has important implications for the design of an increasingly crowded ATC
system and the increasingly visual nature of the ATC environment due to the introduction of
datalink. If FF allows for the accommodation of increasing traffic, ATCo attention might be
diverted away from the radar display, the most important source of information for conflict
detection, because ATCos need to attend to other displays and sources of information associated
with routine tasks such as updating flight strips and communicating. Each additional aircraft
does not only increase ATCo workload because it needs to be considered for conflict detection,
but also because each is associated with many routine or "housekeeping" tasks, communication,
and coordination. In fact, ATCos report that these tasks represent a large part of their workload.
In the current system, the eyes can remain fixated on the radar during communication. If
datalink displays will be used in the future to accommodate the need for communication with an
unprecedented amount of traffic and to reduce frequency congestion on the radio, ATCos will
need to shift their eyes and visual attentional resources from the radar to the datalink. This
points to the increasing importance to integrate different displays with each other instead of
simply adding displays to the ATCo workstation. Systems need to be designed in a way that all
tools within a system "fit together" and do not compete for the same attentional resources
(Nijhuis, 1994). If this principle is violated, performance can deteriorate and lead to critical
events that controllers might "fail to notice". This should be kept in mind for the implementation
of datalink displays. The combination of increased traffic and a separate datalink or other
displays that are not integrated with the radar could have disastrous consequences. Perhaps, if
synthetic speech were used as a channel for datalink it would make use of an additional resource
and free capacity in the pool of visual resources. An alternative suggestion would be to integrate
the datalink capabilities on the radar display as in the study by Hilburn (1996). He did not find
the same diversion of attention away from the radar under high traffic density.

8. Exp. 2: Traffic density and automation feedback type
114
The present experiment provided additional evidence that controller performance under
FF can be improved with the help of effective automated decision aids. The near-perfect conflict
detection shows that the availability of a conflict detection aid to the ATCos was successful in
promoting good performance under FF conditions. This is a promising result with respect to the
impending implementation of conflict detection aids into the ATC system.
However, the prediction that multi-modal feedback would result in better conflict
detection performance (especially earlier detection) than simple visual feedback was not
supported. The expected benefit of the visually enhanced feedback was also not found. The data
also did not support the hypothesis that conflict detection benefits of visually enhanced or multi-
modal feedback would be greater under high than under moderate traffic density. Self-
separations were detected earlier under moderate than under high traffic density across all types
of feedback. The percentage of detected conflicts was affected neither by traffic nor by
feedback. Instead, the multi-modal feedback produced some negative effects for tasks other than
conflict detection. It took ATCos longer to hand-off aircraft in the multi-modal feedback
condition and ATCos missed to update more waypoints in the high traffic density and multi-
modal feedback condition. Likewise, the fewest early waypoint updates were made in the multi-
modal condition under high traffic. A lower number of early updates can be interpreted as being
related to higher mental workload because ATCos experiencing high workload do not have spare
time to update the waypoints ahead of time (even though they were instructed not to do so).
Therefore, the reduced number of early updates in the multi-modal feedback condition under
high traffic could indicate a negative effect of the multi-modal feedback. This can be interpreted
in light of the preemption phenomenon (Wickens & Liu, 1988). Preemption considers the
alerting characteristic of auditory stimulus presentation. Typically, auditory stimuli are more
intrusive and alerting than visual stimuli. Therefore, the presentation of a discrete auditory
stimulus during the performance of an ongoing visual task could call attention to the auditory
stimulus and divert attentional resources away from the ongoing visual task. As a consequence,
a performance benefit in the response to the discrete auditory stimulus (i.e. visual and auditory
feedback) and task (i.e. conflict detection) can be found at the expense of performance in the
ongoing visual task (i.e. handing-off aircraft, updating waypoints). This indicates that the use of
multi-modal feedback should be carefully evaluated before such technology is implemented.

8. Exp. 2: Traffic density and automation feedback type
115
Multi-modal feedback might not always have positive or neutral effects. In some instances, it
could be associated with performance decrements in concurrent visual tasks.
The high percentage of fixations on the radar display could explain why no difference in
conflict detection performance was found for the different types of feedback. If ATCos attend to
the radar most of the time it is unlikely that a salient visual aid would be missed. This finding
and interpretation is consistent with basic research on cross-modal attention. Posner et al. (1976)
conducted a study in which participants were asked to press one of two keys depending whether
a tone was presented to the left or right side of the ear (auditory task) or whether an "X" appeared
on the left or right side of a monitor in front of them (visual task). The participants’ expectation
of a visual or auditory task was manipulated. Posner et al. (1976) found that participants took
longer to respond when they performed the unexpected task (i.e. the visual task when they were
expecting the auditory task) than when they could not reliably predict or expect which task was
going to occur. On the other hand, participants responded faster when they performed the
expected task. Most importantly, however, the faster response to the auditory than to the visual
task (as often found due to the greater alerting characteristic of auditory stimuli) was eliminated
when the participants were expecting a visual task and had already oriented their attention to it.
A similar mechanism could be responsible for the finding that auditory feedback did not have an
effect in this study. ATCos were expecting conflicts and alerts to occur on the radar and had
already oriented their eyes and attention to the radar as reflected in the large proportion of eye
fixations on the radar. Therefore, the typical small advantage (in the order of milliseconds) of
auditory over visual cues in redirecting attention was not found. If this finding would hold true
for detection aids that are not integrated on the radar is on open question. Tools like URET
present conflict information on a tabular display that is close to, but not integrated on the display
of traffic. Results might be different with such a constellation.
Perhaps visual attention strategies in ATC are different from strategies in piloting an
aircraft for which performance benefits of multi-modal aids have been found (e.g. Sklar &
Sarter, 1999). The controllers primary display is the radar display and this is also where critical
events would most likely unfold and have to be detected. Therefore, visual attention might be
directed there by default. If the visual alert that indicates a conflict is integrated on the PVD,
chances are low that it will be missed. For pilots, the most important areas are the out-of-the
window view or the instruments (depending on meteorological conditions). Critical events such
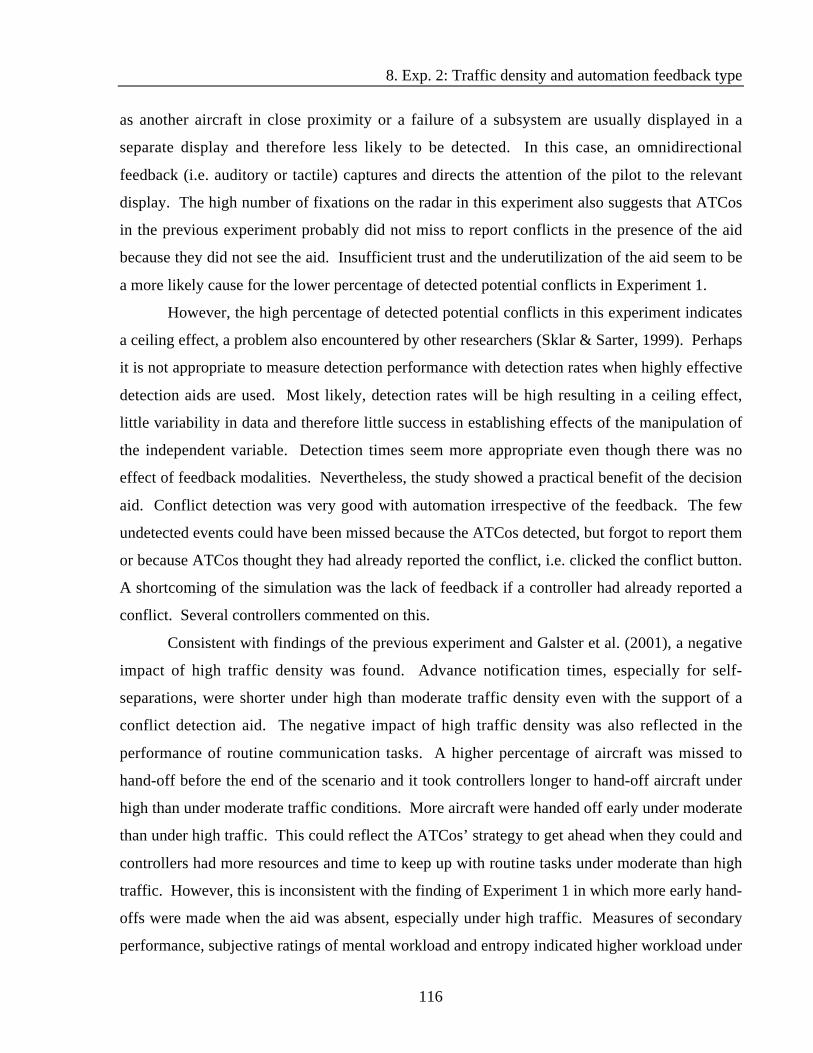
8. Exp. 2: Traffic density and automation feedback type
116
as another aircraft in close proximity or a failure of a subsystem are usually displayed in a
separate display and therefore less likely to be detected. In this case, an omnidirectional
feedback (i.e. auditory or tactile) captures and directs the attention of the pilot to the relevant
display. The high number of fixations on the radar in this experiment also suggests that ATCos
in the previous experiment probably did not miss to report conflicts in the presence of the aid
because they did not see the aid. Insufficient trust and the underutilization of the aid seem to be
a more likely cause for the lower percentage of detected potential conflicts in Experiment 1.
However, the high percentage of detected potential conflicts in this experiment indicates
a ceiling effect, a problem also encountered by other researchers (Sklar & Sarter, 1999). Perhaps
it is not appropriate to measure detection performance with detection rates when highly effective
detection aids are used. Most likely, detection rates will be high resulting in a ceiling effect,
little variability in data and therefore little success in establishing effects of the manipulation of
the independent variable. Detection times seem more appropriate even though there was no
effect of feedback modalities. Nevertheless, the study showed a practical benefit of the decision
aid. Conflict detection was very good with automation irrespective of the feedback. The few
undetected events could have been missed because the ATCos detected, but forgot to report them
or because ATCos thought they had already reported the conflict, i.e. clicked the conflict button.
A shortcoming of the simulation was the lack of feedback if a controller had already reported a
conflict. Several controllers commented on this.
Consistent with findings of the previous experiment and Galster et al. (2001), a negative
impact of high traffic density was found. Advance notification times, especially for self-
separations, were shorter under high than moderate traffic density even with the support of a
conflict detection aid. The negative impact of high traffic density was also reflected in the
performance of routine communication tasks. A higher percentage of aircraft was missed to
hand-off before the end of the scenario and it took controllers longer to hand-off aircraft under
high than under moderate traffic conditions. More aircraft were handed off early under moderate
than under high traffic. This could reflect the ATCos’ strategy to get ahead when they could and
controllers had more resources and time to keep up with routine tasks under moderate than high
traffic. However, this is inconsistent with the finding of Experiment 1 in which more early hand-
offs were made when the aid was absent, especially under high traffic. Measures of secondary
performance, subjective ratings of mental workload and entropy indicated higher workload under
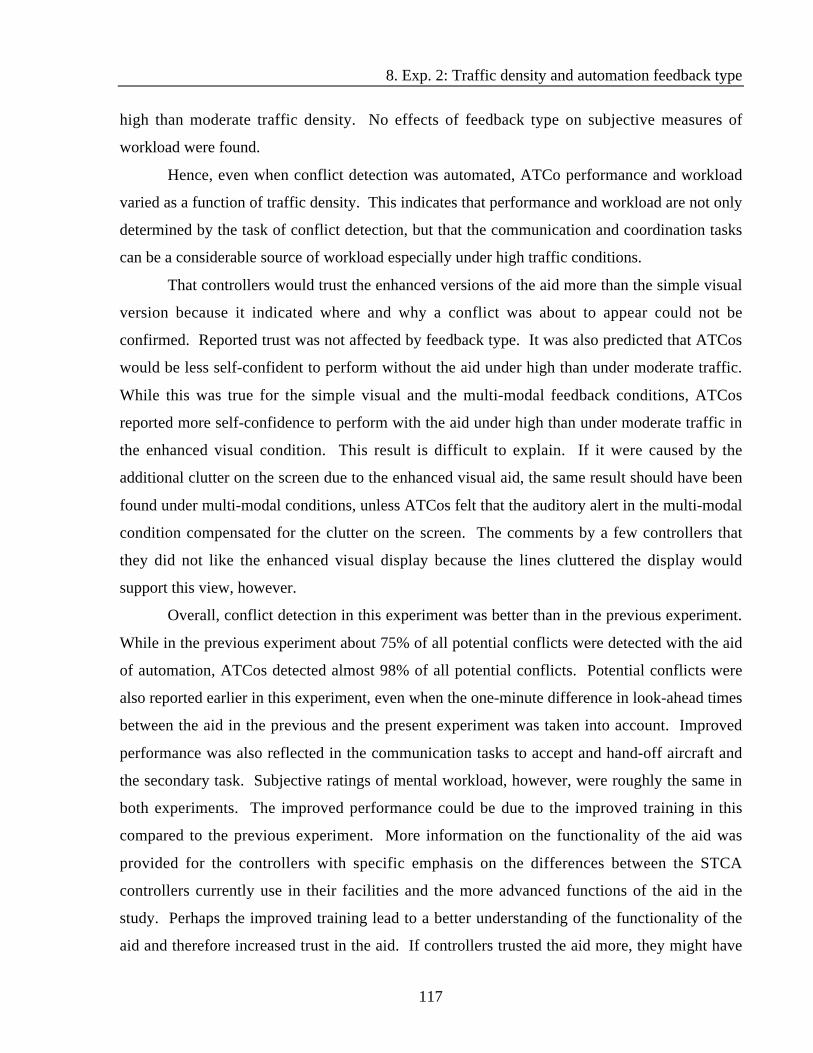
8. Exp. 2: Traffic density and automation feedback type
117
high than moderate traffic density. No effects of feedback type on subjective measures of
workload were found.
Hence, even when conflict detection was automated, ATCo performance and workload
varied as a function of traffic density. This indicates that performance and workload are not only
determined by the task of conflict detection, but that the communication and coordination tasks
can be a considerable source of workload especially under high traffic conditions.
That controllers would trust the enhanced versions of the aid more than the simple visual
version because it indicated where and why a conflict was about to appear could not be
confirmed. Reported trust was not affected by feedback type. It was also predicted that ATCos
would be less self-confident to perform without the aid under high than under moderate traffic.
While this was true for the simple visual and the multi-modal feedback conditions, ATCos
reported more self-confidence to perform with the aid under high than under moderate traffic in
the enhanced visual condition. This result is difficult to explain. If it were caused by the
additional clutter on the screen due to the enhanced visual aid, the same result should have been
found under multi-modal conditions, unless ATCos felt that the auditory alert in the multi-modal
condition compensated for the clutter on the screen. The comments by a few controllers that
they did not like the enhanced visual display because the lines cluttered the display would
support this view, however.
Overall, conflict detection in this experiment was better than in the previous experiment.
While in the previous experiment about 75% of all potential conflicts were detected with the aid
of automation, ATCos detected almost 98% of all potential conflicts. Potential conflicts were
also reported earlier in this experiment, even when the one-minute difference in look-ahead times
between the aid in the previous and the present experiment was taken into account. Improved
performance was also reflected in the communication tasks to accept and hand-off aircraft and
the secondary task. Subjective ratings of mental workload, however, were roughly the same in
both experiments. The improved performance could be due to the improved training in this
compared to the previous experiment. More information on the functionality of the aid was
provided for the controllers with specific emphasis on the differences between the STCA
controllers currently use in their facilities and the more advanced functions of the aid in the
study. Perhaps the improved training lead to a better understanding of the functionality of the
aid and therefore increased trust in the aid. If controllers trusted the aid more, they might have

8. Exp. 2: Traffic density and automation feedback type
118
used it more to improve their performance. Indeed, ratings of trust in the conflict detection aid
were higher in the present experiment compared to the previous one (83 versus 63). Of course, a
comparison between the present and the previous experiment does not allow for an explanation
of training as the cause of the performance differences between the two experiments. However,
the focus of the study was not training. The purpose was to create conditions in which
controllers would trust the aid and make use of it. It can be assumed that ATCos in the real
world will receive adequate training before the implementation of tools.
The results of these experiments compare to the "success" of FF in airborne studies
(Lozito et al., 1997; van Gent et al., 1998; Dunbar et al., 1999) and lead to the conclusion that FF
could be feasible with the support of decision aids for ATCos. Automation was successful in
promoting ATCo performance in conflict detection and routine tasks and compensated for the
negative effects of FF and high traffic density found in earlier studies. Even though automation
still does not make the ATCo part of the decision-making loop, it improves ATCo performance
by performing the ATCo's decision-making function. In fact, it could be argued that the
automation removes the ATCos even further from the processes in the system because ATCos
now become passive monitors not only of pilot actions, but also of the automation. This is
acceptable as long as the ATCo is not required to intervene. However, even the best conflict
detection aid can fail or become inaccurate and this raises the issue if ATCos will be able to
intervene in case airborne separation fails and the decision aid does not point out the particular
conflict. This will be the topic of the next experiment.

9. Exp. 3: Automation failure
119
9. Experiment 3: Effects of a decision aid under reliable and failure modes
of operation
9.1 Introduction
The previous two experiments have clearly shown the benefits of a conflict detection aid
on ATCo performance and mental workload under FF and demonstrated that automation can
compensate for some of the negative effects of FF that earlier studies have found (Galster et al.,
2001; Endsley et al., 1997; Metzger & Parasuraman, in press). Yet, these two experiments have
only investigated ATCo performance and mental workload under reliable automation conditions.
Problems can occur when automation fails, becomes inaccurate, or is given contextually-
inappropriate or incorrect information. FF removes the ATCo from the decision-making process
by transferring authority to the pilots. Previous studies have shown that ATCo performance is
poor if ATCos are required to intervene in case airborne separation fails. Automation can
improve performance, but just like FF, it moves the ATCo further away from the decision-
making process. As long as the automation performs the conflict detection function reliably
system safety is maintained. It remains to be studied if ATCos would be able to intervene in
case airborne separation and automation fail.
Accidents, incidents, and previous research have shown that humans can become
complacent and less likely to detect system malfunctions when relying on automation (National
Transportation and Safety Board, 1973, 1997; Parasuraman et al., 1993). Hence, it is important
not only to investigate the effects of automation on performance and mental workload when the
automation works as expected, but also when it becomes unreliable. In fact, the NRC report
(Wickens et al., 1998a) advocated that human factors analyses under degraded modes of
operation are performed before implementing any decision support tools into the ATC system. It
recommended
“investing sufficient resources in studies of human response to low-probability
emergencies; actively pursuing failure modes/fault tree analysis, particularly to identify
situations in which two or more coordinating agents receive information that are incongruous or
contradictory; and involving human factors specialists in the development and testing of system
recovery procedures. "

9. Exp. 3: Automation failure
120
Recovery from an automation failure is of great concern under FF conditions (Galster et
al., 2001). Under manual conditions or low levels of automation, system throughput is low.
Relatively few aircraft can be accommodated and controllers have plenty of time to respond to
unexpected critical events. However, the goal of FF and automation is to increase capacity and
system throughput. More aircraft will be accommodated in the same amount of airspace creating
a denser airspace and leaving the controller with less time to respond to emergencies. At the
same time, automation and FF can increase the time ATCos need to make decisions and recover
from a critical event (Metzger & Parasuraman, in press). If the time ATCos require is greater
than the time ATCos have available to recover from a critical situation, danger is imminent.
Automating the conflict detection function in ATC is a challenging task and even more so
under FF conditions. Unlike other system operators (e.g. in process control) that are controlling
physical and closed-loop processes, ATCos are controlling other human beings (i.e. pilots) or
more specifically, other human-machine systems (e.g. pilot-aircraft systems) in a dynamic
environment that cannot easily be predicted. A prediction of conflicts well in advance requires
the accurate and up-to-date projection of the state of the system into the future. However, this is
not easy. The future status of the ATC system is determined by the current status of aircraft (e.g.
aircraft location, aircraft performance parameters), pilot intent for the future, as well as current
and future meteorological conditions at all points in the airspace (e.g. wind, temperature). While
information on the current status in the system is relatively easy to obtain given today’s
technology, information on meteorological conditions is more difficult to gather. Incidents
related to clear air turbulence demonstrate how difficult it still is to predict meteorological
conditions. Further aggravating the prediction problem is the introduction of FF. While pilot
actions currently are relatively easy to predict because they are tightly controlled by ATC, this
might change. FF would allow pilots to modify their intent at any moment (e.g. to self-separate
and resolve a conflict, due to a TCAS alert, or for any other reason). While modern conflict
detection and resolution algorithms are extremely powerful and reliable, these limitations make
any projection of the state of the system into the future probabilistic and potentially inaccurate.
As Bilimoria (1998) notes, changes in pilot intent, might in some cases not be received in
time or not received at all by the ATC computer system from which URET receives the
information required by its conflict prediction algorithm. These changes in the intended flight
path might therefore not be available for analysis by URET or other conflict detection aids and

9. Exp. 3: Automation failure
121
could cause the detection aid to miss a conflict (error of omission) or report a conflict when in
fact there is none (error of commission). Even though the automation algorithm might work
100% reliably, conflict prediction could become inaccurate because the automation does not
have complete or the most-up-to-date information. Although it might become possible that all
intent changes could be entered into the computer system or the system could at least detect that
a deviation has occurred, it is doubtful that the prediction would always be 100% accurate,
especially when the exact nature of the deviation is not known and when the changes in intent
create a conflict in the very near future. Hence, conflict detection aids such as URET will
probably have lower reliability under FF conditions when pilots will be allowed to change their
intended flight path at any moment than they would under current conditions. While any human
factors analysis should involve the analysis of degraded modes of operation, the potential for a
reduced reliability of URET under FF represents an even greater reason to conduct such studies.
The question is whether the ATCo will be able to detect a potential conflict if the
automation does not. This requires the ATCo to continuously and carefully monitor the
automation while performing other tasks. However, the literature on human performance with
automation has shown that human monitoring of automated systems is often poor, especially in
multi-task environments (Parasuraman et al., 1993). When a system is automated and other tasks
have to be accomplished, operators become complacent (i.e. the detection of system
malfunctions deteriorates dramatically over time). While complacency effects are well
documented in accidents and incidents in the aviation as well as other domains (e.g. National
Transportation and Safety Board, 1973, 1997) and in basic research (e.g. Parasuraman et al.,
1993), they have not yet been studied empirically in the ATC environment. It could be
speculated that ATCos might not be as likely to become complacent because they are aware of
the dynamic nature and the challenges of the system under their control, especially under FF. On
the other hand, it could be expected that workload becomes so high under traffic densities
expected for the future that they will have to rely on the automation in order to be able to handle
the traffic and be just as complacent as pilots or the general population. Only empirical studies
will be able to answer this question. Another concern pertains to the timeliness of conflict
detection. Metzger and Parasuraman (in press) found that ATCo required more time to detect
conflicts under passive monitoring than under active control conditions. Decision aids could
further aggravate this effect because both, automation and FF, move the ATCo away from the
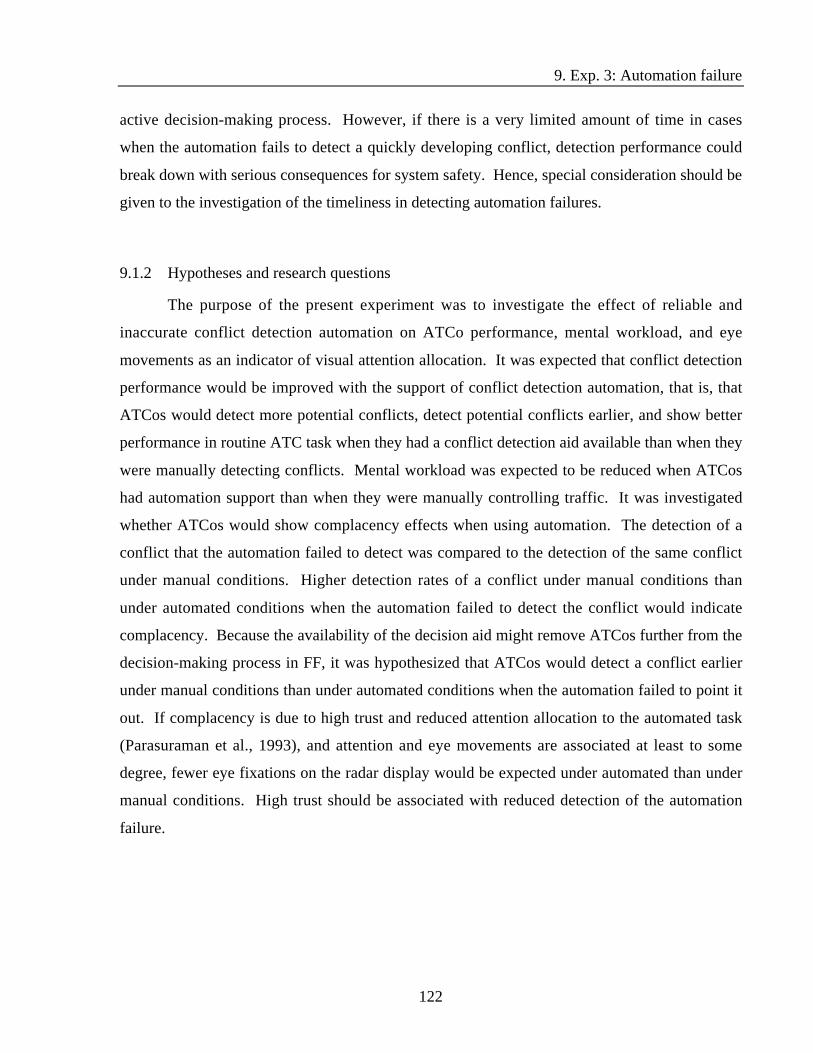
9. Exp. 3: Automation failure
122
active decision-making process. However, if there is a very limited amount of time in cases
when the automation fails to detect a quickly developing conflict, detection performance could
break down with serious consequences for system safety. Hence, special consideration should be
given to the investigation of the timeliness in detecting automation failures.
9.1.2 Hypotheses and research questions
The purpose of the present experiment was to investigate the effect of reliable and
inaccurate conflict detection automation on ATCo performance, mental workload, and eye
movements as an indicator of visual attention allocation. It was expected that conflict detection
performance would be improved with the support of conflict detection automation, that is, that
ATCos would detect more potential conflicts, detect potential conflicts earlier, and show better
performance in routine ATC task when they had a conflict detection aid available than when they
were manually detecting conflicts. Mental workload was expected to be reduced when ATCos
had automation support than when they were manually controlling traffic. It was investigated
whether ATCos would show complacency effects when using automation. The detection of a
conflict that the automation failed to detect was compared to the detection of the same conflict
under manual conditions. Higher detection rates of a conflict under manual conditions than
under automated conditions when the automation failed to detect the conflict would indicate
complacency. Because the availability of the decision aid might remove ATCos further from the
decision-making process in FF, it was hypothesized that ATCos would detect a conflict earlier
under manual conditions than under automated conditions when the automation failed to point it
out. If complacency is due to high trust and reduced attention allocation to the automated task
(Parasuraman et al., 1993), and attention and eye movements are associated at least to some
degree, fewer eye fixations on the radar display would be expected under automated than under
manual conditions. High trust should be associated with reduced detection of the automation
failure.

9. Exp. 3: Automation failure
123
9.2 Method
9.2.1 Participants
Twenty active full performance level ATCos from the Washington Center air route traffic
control center (ARTCC; n = 14), Baltimore-Washington International (BWI; n = 2), Dulles
(IAD; n = 3), and Andrews airforce base (n = 1) terminal radar control area (TRACON) facilities
served as paid volunteers. Even though Andrews airforce base is a military facility, air traffic is
controlled by civilian FAA ATCos. One of the twenty controllers had experience in both en
route and TRACON environments. At the time of the study he had been working at the
TRACON facility for 4 years, but had 9 years of experience in the en route environment.
Therefore, he was categorized as an en route controller. This resulted in fourteen en route and
six TRACON controllers ranging from 31 to 53 years of age (M = 37.65, SD = 5.05) with overall
ATC experience from 8 to 22 years (M = 14.08, SD = 3.86). There was no significant difference
in age, F(1,18) = .43, p > .05, or years on-the-job, F(1, 18) = .003, p > .05, between the six
TRACON and fourteen en route controllers. Three (15%) en route controllers were female, all
other ATCos were male. This reflects roughly the current gender ratio in the FAA facilities.
9.2.2 Apparatus
For a description of the ATC simulator and eye tracking equipment see the previous
chapters. Tasks and dependent variables were the same as in the previous experiments. One
exception was that in addition to detecting conflicts, controllers were asked to also provide a
suggestion on how they would resolve the conflict. The experimenter recorded the verbal
clearance given by the controllers. Eye movements were recorded as physiological measures of
mental workload. Again, subjective ratings of mental workload, trust in the detection aid, and
self-confidence to detect conflicts without the aid were obtained.
9.2.3 Design
The design was a one-factorial repeated measures design with four levels of treatment.
Independent variable was the automation condition with the following four levels: (1) reliable

9. Exp. 3: Automation failure
124
automation, (2) automation failure with 2 minutes to recover, (3) automation failure with 4
minutes to recover, and (4) manual condition. All ATCos performed in all four conditions. The
order of presentation was the following: One group of participants performed the manual
condition before all the automated conditions (i.e. all other conditions), the other group
performed the manual after the automated conditions. In both groups, the reliable automation
condition was always presented before the two unreliable automation conditions. This was
chosen deliberately so that the ATCos would get enough training and experience with a reliably
operating automation aid and build trust before being exposed to failures. The order of the two
automation failure conditions was so that half of the participants performed the two-minute
failure condition before the four-minute failure condition and the other half performed the order
in reverse. This resulted in a double cross-over design. The first cross-over resulted from the
order of the manual versus automated conditions (i.e. all others). The second cross-over resulted
from the order of the two automation failure conditions. This was nested in the first cross-over
because it only applied to the automated conditions. Figure 9.1 visualizes the resulting four
orders of presentation. All ATCos wore eye tracking equipment for the manual and both failure
conditions. Shaded cells indicate when the controllers wore the eye tracking equipment. The
dependent variables are listed in table 6.1.
Automated conditions
Order Reliable auto Auto failure conditions
1: Manual Reliable Auto failure (2 min) Auto failure (4 min)
2: Manual Reliable Auto failure (4 min) Auto failure (2 min)
3: Reliable Auto failure (2 min) Auto failure (4 min) Manual
4: Reliable Auto failure (4 min) Auto failure (2 min) Manual
Figure 9.1: Order of scenarios
The four different automation conditions were created with five scenarios. The reliable
automation condition included a reliable conflict detection aid and consisted of two scenarios.
This was chosen so that ATCos could get enough experience and exposure to the reliable
decision aid and build trust in the aid. The aid was the simple visual detection aid used in

9. Exp. 3: Automation failure
125
Experiment 2 with a look-ahead time of 6 minutes, i.e. 6 minutes before the loss of separation
occurred or would have occurred (in the case of a self-separation) the alert appeared on the radar
screen. In the reliable condition, the aid reliably detected all five potential conflicts (two
conflicts and three self-separations). In the two automation failure conditions, the same conflict
detection aid detected the five potential conflicts reliably. However, the aid failed to detect a
sixth event 21 minutes into the scenario. The event was a situation in which one aircraft deviated
from its flight plan (e.g. after a TCAS alert) in order to avoid a conflict and climbed or
descended into the path of another aircraft that also deviated from its altitude filed on the flight
plan. Figure 9.2 depicts such a situation. Flights DLH 123 and UAL 456 at flight level 350 are
predicted to be in conflict based on the conflict detection aid (i.e. circles around the aircraft
targets). Flight DLH 123 climbs to flight level 360 in order to avoid the conflict. At the same
time, flight USA 333 makes a tactical altitude change to flight level 360 (e.g. in order to avoid
weather or because TCAS indicates a conflict that may or may not actually be there). Now flight
DLH 123 and USA 333 are both changing their altitude to the same flight level and get into
conflict. However, this conflict is unpredicted by the conflict detection aid because it is a short-
term change and the information is not yet available to the main computer system, from which
the conflict detection aid gathers its information.
DLH 123350+360569 480
UAL 456350C324 500
USA 333370-360901 500 FDX 878
370C369 450
Figure 9.2: Situation in which an impending conflict remained undetected by the aid

9. Exp. 3: Automation failure
126
In one scenario, the maneuvers left controllers with four minutes to detect and resolve the
conflict before the loss of separation occurred. In the other scenario, the controllers had only two
minutes for detection and resolution. Altitudes and altitude changes of the aircraft involved in
this situation were slightly different in the two automation failure scenarios (e.g. an aircraft
climbed in one and descended in another scenario) so that controllers would not easily recognize
that the same situation was presented repeatedly. A fifth scenario was assigned for the manual
condition in which no conflict detection aid was available. However, the controllers were
presented with the same situation in which the automation failed in the automation condition and
4 minutes remained for detection. This allowed for a direct comparison of conflict detection
performance between the manual and automated conditions.
Controllers were presented with five 25-minute scenarios that included on average about
sixteen aircraft in a 50-mile radius sector after a 10-minute ramp-up period. As in previous
studies, modified versions of the same scenario were used for maximum experimental control.
In order to create a set of five scenarios, the sector and traffic patterns were rotated to simulate a
different flow of traffic. Waypoints and flights were renamed so that the participants did not
recognize that the scenarios were almost the same.
9.2.4 Procedure
After signing a consent form and providing biographical information, controllers were
given instructions, a demonstration of the simulation, completed a fourteen-minute practice trial,
and were familiarized with the NASA-TLX and the trust ratings. Then, controllers completed the
five 25-minute scenarios and rated their mental workload on the NASA-TLX after each scenario.
Ratings of trust and self-confidence were obtained after the automated conditions only.
Before completing the automated conditions, controllers were interviewed about their
experience with conflict detection aids. They were asked if they knew any conflict detection
aids, specifically the more intelligent ones that are planned to be introduced into the facilities,
and if so, which ones they knew. If they did not know about any, they were asked if they knew
URET. Participants who knew about URET were asked what they knew about it. All
participants were queried if they thought that a conflict detection aid would be useful to them.
After the interview, they were told that the following four scenarios would contain a conflict
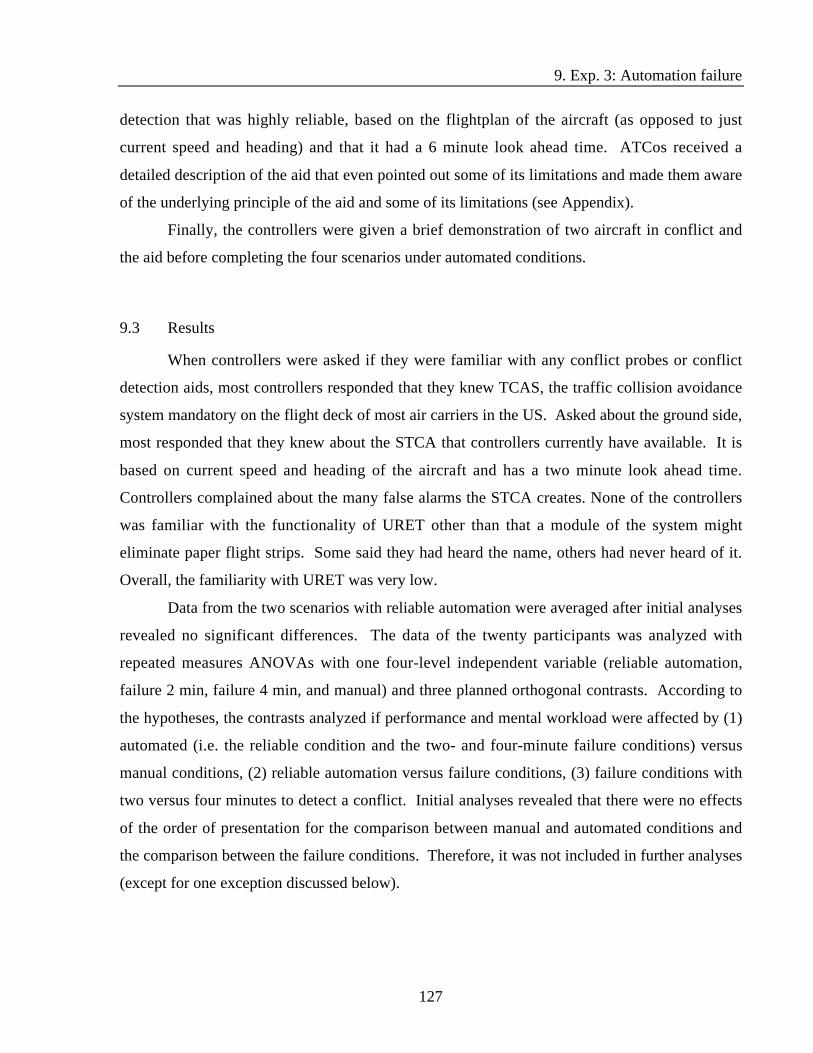
9. Exp. 3: Automation failure
127
detection that was highly reliable, based on the flightplan of the aircraft (as opposed to just
current speed and heading) and that it had a 6 minute look ahead time. ATCos received a
detailed description of the aid that even pointed out some of its limitations and made them aware
of the underlying principle of the aid and some of its limitations (see Appendix).
Finally, the controllers were given a brief demonstration of two aircraft in conflict and
the aid before completing the four scenarios under automated conditions.
9.3 Results
When controllers were asked if they were familiar with any conflict probes or conflict
detection aids, most controllers responded that they knew TCAS, the traffic collision avoidance
system mandatory on the flight deck of most air carriers in the US. Asked about the ground side,
most responded that they knew about the STCA that controllers currently have available. It is
based on current speed and heading of the aircraft and has a two minute look ahead time.
Controllers complained about the many false alarms the STCA creates. None of the controllers
was familiar with the functionality of URET other than that a module of the system might
eliminate paper flight strips. Some said they had heard the name, others had never heard of it.
Overall, the familiarity with URET was very low.
Data from the two scenarios with reliable automation were averaged after initial analyses
revealed no significant differences. The data of the twenty participants was analyzed with
repeated measures ANOVAs with one four-level independent variable (reliable automation,
failure 2 min, failure 4 min, and manual) and three planned orthogonal contrasts. According to
the hypotheses, the contrasts analyzed if performance and mental workload were affected by (1)
automated (i.e. the reliable condition and the two- and four-minute failure conditions) versus
manual conditions, (2) reliable automation versus failure conditions, (3) failure conditions with
two versus four minutes to detect a conflict. Initial analyses revealed that there were no effects
of the order of presentation for the comparison between manual and automated conditions and
the comparison between the failure conditions. Therefore, it was not included in further analyses
(except for one exception discussed below).
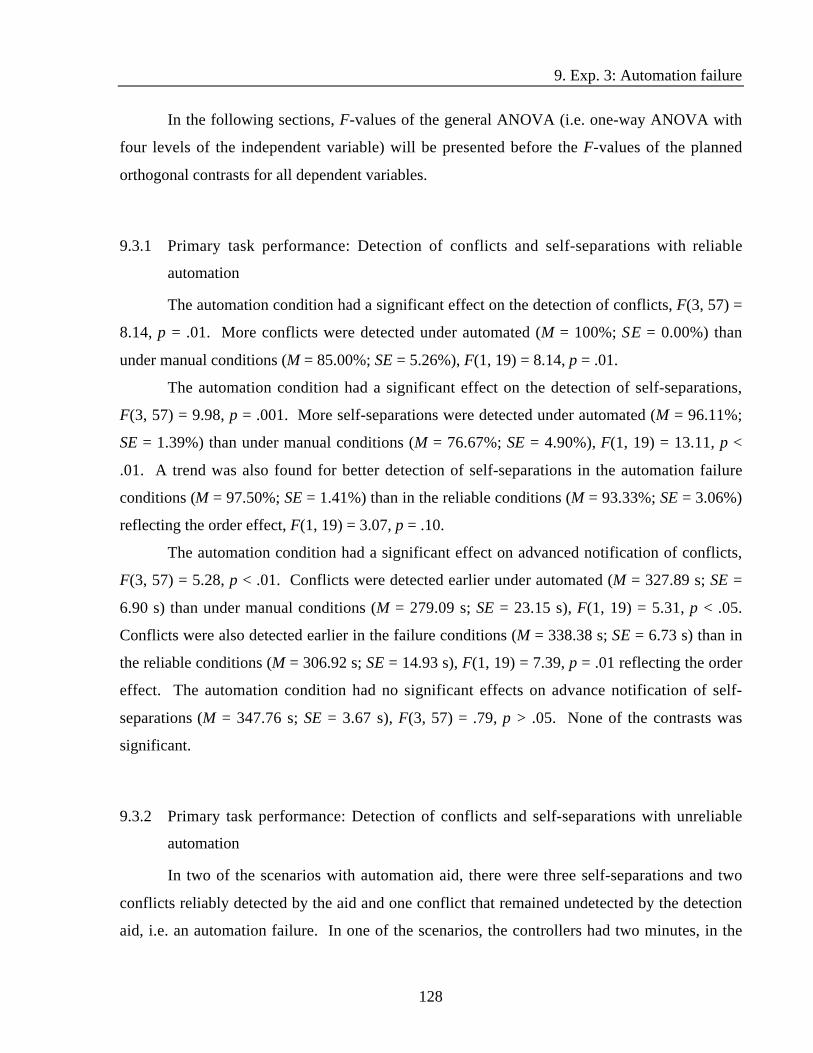
9. Exp. 3: Automation failure
128
In the following sections, F-values of the general ANOVA (i.e. one-way ANOVA with
four levels of the independent variable) will be presented before the F-values of the planned
orthogonal contrasts for all dependent variables.
9.3.1 Primary task performance: Detection of conflicts and self-separations with reliable
automation
The automation condition had a significant effect on the detection of conflicts, F(3, 57) =
8.14, p = .01. More conflicts were detected under automated (M = 100%; SE = 0.00%) than
under manual conditions (M = 85.00%; SE = 5.26%), F(1, 19) = 8.14, p = .01.
The automation condition had a significant effect on the detection of self-separations,
F(3, 57) = 9.98, p = .001. More self-separations were detected under automated (M = 96.11%;
SE = 1.39%) than under manual conditions (M = 76.67%; SE = 4.90%), F(1, 19) = 13.11, p <
.01. A trend was also found for better detection of self-separations in the automation failure
conditions (M = 97.50%; SE = 1.41%) than in the reliable conditions (M = 93.33%; SE = 3.06%)
reflecting the order effect, F(1, 19) = 3.07, p = .10.
The automation condition had a significant effect on advanced notification of conflicts,
F(3, 57) = 5.28, p < .01. Conflicts were detected earlier under automated (M = 327.89 s; SE =
6.90 s) than under manual conditions (M = 279.09 s; SE = 23.15 s), F(1, 19) = 5.31, p < .05.
Conflicts were also detected earlier in the failure conditions (M = 338.38 s; SE = 6.73 s) than in
the reliable conditions (M = 306.92 s; SE = 14.93 s), F(1, 19) = 7.39, p = .01 reflecting the order
effect. The automation condition had no significant effects on advance notification of self-
separations (M = 347.76 s; SE = 3.67 s), F(3, 57) = .79, p > .05. None of the contrasts was
significant.
9.3.2 Primary task performance: Detection of conflicts and self-separations with unreliable
automation
In two of the scenarios with automation aid, there were three self-separations and two
conflicts reliably detected by the aid and one conflict that remained undetected by the detection
aid, i.e. an automation failure. In one of the scenarios, the controllers had two minutes, in the

9. Exp. 3: Automation failure
129
other scenario four minutes to detect the automation failure and resolve the conflict before a loss
of separation occurred. The same conflict was presented in the manual condition, but not in the
scenarios with reliable automation. Table 9.1 shows descriptive statistics for the detection rates
in the two automated and the manual condition.
Table 9.1: Detection rates as a function of automation condition
Condition Auto failure 2-min (%) Auto failure 4-min (%) Manual (%)
n 20 20 18
Mean 35.00 40.00 55.56
SE 10.94 11.24 12.05
Minimum 0.00 0.00 0.00
Maximum 100.00 100.00 100.00
Mode 0.00 0.00 100.00
Median 0.00 0.00 100.00
Under automated conditions, only 35 and 40% of the controllers detected the conflict
when they had 2 and 4 minutes available, respectively. In contrast, 55.56% of the controllers
detected the conflict under manual conditions. There was no difference in the detection of the
conflict under manual conditions between ATCos who performed the manual conditions first and
those who performed it last, F(1, 16) = .16, p > .05. Two cells in the manual condition were
missing due to technical difficulties and were replaced by the overall mean (M = 55.56%; see
table 9.1) so that the two subjects could be entered into the ANOVA. The analysis revealed a
trend for an effect of the automation condition, F(2, 38) = 1.78, p = .18. Orthogonal contrasts
revealed no significant effect between the 2 and 4-minute failure condition, F(1, 19) = .32, p >
.05. However, the contrast comparing automated and manual conditions found a trend for better
detection under manual than automated conditions, F(1, 19) = 2.40, p = .14. This finding of
reduced detection performance under automated compared to manual conditions points toward a
complacency effect.
Table 9.2 shows advance notification times in the automation and manual conditions.
For more than 50% of the cells, no notification time was available due to the high number of

9. Exp. 3: Automation failure
130
missed events. Only five controllers detected the event in all three conditions (manual, 2-min
failure, 4-min failure). This number was too low to calculate meaningful inferential statistics.
Besides, the maximum advance notification time was restricted by the onset of the conflict (i.e.
two or four minutes before the loss of separation occurred). For example, in the two-minute
automation failure condition, the maximum possible advance notification time was 120 seconds,
in the four-minute automation failure and manual conditions it was 240 seconds.
Nevertheless, the automation failure condition with four minutes can be compared to the
manual condition in which also a four-minute period was chosen between the onset of the
conflict and the loss of separation. The visual inspection of the descriptive statistics revealed no
marked differences between the manual and automated (four-minute) condition even though the
advance notification time in the automation condition was about 17 seconds earlier than the
advance notification under manual conditions. Also, the minimum advance notification time in
the four-minute automation condition (40.53 s) was greater than in the manual condition (7.39 s).
However, the median performance was better in the manual condition.
Table 9.2: Advance notification times as a function of automation condition
Condition Auto failure 2-min (s) Auto failure 4-min (s) Manual (s)
n 7 8 10
Mean 83.23 127.12 110.27
SE 12.19 24.26 23.53
Minimum 28.8 40.53 7.39
Maximum 118.01 217.52 216.25
Mode - - -
Median 87.38 102.62 120.00
Again, it should be pointed out that there was no difference in the detection of the
conflict under manual conditions between ATCos who performed the manual conditions first and
those who performed it last, F(1, 8) = .06, p > .05. This will become important for the discussion
of the results. Most ATCos either detected none of the two automation failures or both. Only
three ATCos detected the automation failure in only one of the two failure scenarios. Two

9. Exp. 3: Automation failure
131
ATCos detected the automation failure in the four-minute failure condition, but not in the two-
minute failure condition even though both ATCos performed the four-minute condition before
the two-minute automation failure. The third ATCo detected the failure in the two-minute
condition, but not in the four-minute condition even though he performed in the two-minute
condition first.
Six out of the twenty ATCos detected the automation failure in both, the 2-minute and 4-
minute condition. For these ATCos, advance notification times were further analyzed. Because
advance notification times depend on the time of the onset of the failure event (two or four
minutes before the loss of separation), the two-minute and four-minute failure conditions cannot
be compared and have to be analyzed separately.
The experience of an automation failure might change the operator's interaction with
automation. An exploratory data analysis was conducted to investigate if the previous
experience of a failure might have led to earlier detection the second time. Note that only six
participants (i.e. three in each group) detected the failure in both failure conditions and could be
included here. Only descriptive data is presented. As figure 9.3 shows, there was no large
performance difference in the two-minute condition between ATCos who had been exposed to
(and detected) the failure before in the four-minute condition (M = 81.86 s; SE = 26.60 s) and
ATCos who were exposed to the failure and detected it for the first time (M = 73.01 s; SE = 8.83
s). In the four-minute condition, ATCos who had already been exposed to and detected the
failure in the previous scenario, detected it earlier the second time (M = 167.99 s; SE = 47.42 s)
than ATCos who had not been exposed to an automation failure yet (M = 123.81 s; SE = 32.24
s). Even though the number of available data was small, the standard errors large, and the
exposure to the failure is confounded with practice, this could possibly indicate that ATCos
improved their detection of an automation failure once they experienced that it might not be
100% reliable.

9. Exp. 3: Automation failure
132
73.01
123.81
167.99
81.86
0
50
100
150
200
2-min condition 4-min condition
Adv
ance
not
ific
atio
n (s
)
2-min first 4-min first
Figure 9.3:Advance notification as a function of failure condition and order of performance
9.3.3 Primary task performance: Accepting and handing-off aircraft
Controllers accepted more than 98% of the aircraft (M = 98.13%; SE = 0.32%) into their
sector with an average response time of 36.79 seconds (SE = 2.39 s). There was a significant
effect of automation condition on response times to requests for acceptance, F(3, 57) = 3.40, p <
.05. The contrast between reliable (M = 39.36 s; SE = 5.61 s) and failure conditions (M = 32.04
s; SE = 3.42 s) was significant, F(1, 19) = 5.28, p < .03, reflecting faster responses in the failure
condition probably due to more practice. A trend for faster response times under automated (M
= 34.48 s; SE = 2.50 s) than under manual conditions (M = 41.14 s; SE = 7.15 s) was also found,
F(1, 19) = 2.71, p = .12.
No significant effects were found for the percentage of successful hand-offs, F(3, 57) =
.36, p > .05, or early hand-offs, F(3, 57) = 1.95, p > .05. Aircraft were handed-off faster in the
failure (M = 26.42 s; SE = 2.49 s) than in the reliable (M = 31.58 s; SE = 3.54 s) condition, F(1,
19) = 4.77, p < .05, again reflecting the order effect.
ATCos had experiencedautomation failure inprevious scenario

9. Exp. 3: Automation failure
133
9.3.4 Secondary task performance
A significant effect of the automation condition on the percentage of missed updates was
found, F(3, 57) = 4.28, p < .01. Controllers missed to update more waypoints under manual (M
= 66.00%, SE = 2.87%) than under automated conditions (M = 56.48%, SE = 2.46%), F(1, 19) =
7.73, p = .01.
One participant had to be excluded from the analysis of response times because he did
not update any waypoints in three of the five scenarios. For the remaining participants, a
significant effect of the automation condition was found, F(3, 54) = 3.54, p < .05. Contrasts
showed that it took controllers significantly longer to update waypoints under automated (M =
126.56 s; SE = 8.74 s) than under manual conditions (M = 97.15 s; SE = 12.20 s), F(1, 18) =
7.27, p < .05. The automation condition did not have an effect on the percentage of early
updates, F(3, 57) = 1.47, p > .05.
9.3.5 Physiological measures: Eye movements
Entropy. Entropy was calculated based on dwell transitions between the three areas of
interest and was not significantly different between manual (M = 2.18; SE = .04) and automated
conditions (M = 2.18; SE = .07), F(1, 19) = .01, p > .05.
Based on the hypothesis that complacency is due to reduced visual attention to the
automated task under automated compared to manual conditions (Parasuraman et al., 1993), and
the assumption that visual attention and eye movements are related at least to some extent, it was
predicted that people who detect automation failures have different scan patterns than people
who do not detect automation failures (i.e. who are complacent). As a consequence, eye
movement data was analyzed using the variable detection or non-detection of the automation
failure (i.e. non-complacent or complacent) as a between-subject variable. Most participants
either detected the automation failure in both failure scenarios or did not detect it in either one.
Only three participants detected the failure in one, but not the other scenario. These three
participants were excluded from the analysis of the eye data. For the different eye data
parameters, 3 (area) x 2 (automation condition: manual or automated) x 2 (group: did detect or
did not detect) mixed-model ANOVAs were calculated with detection or non-detection of the
automation failure as a between-subject variable.

9. Exp. 3: Automation failure
134
Eye movements up to the point when the loss of separation after the automation failure
occurred were included (i.e. 21 minutes and 20 seconds into the scenario). Because the study
investigated differences in visual attention strategies leading to the detection or non-detection of
the automation failure, the last 3 minutes and 40 seconds were excluded from the analysis. It is
possible that ATCos changed their attention strategies if they realized that a failure had occurred.
However, this was not of interest in this study. The study was concerned with the attentional
processes before the detection or non-detection of an automation failure.
Number of fixations. The number of fixations on the different areas of interest was
significantly different, F(2, 30) = 849.19, p < .0001. The most fixations were made on the radar
display (M = 2180.93; SE = 47.00), followed by the communication areas (M = 509.04; SE =
18.32) and the flight strips (M = 216.43; SE = 22.29).
A significant interaction between area and group was found, F(2, 30) = 4.08, p < .05.
ATCos who detected the automation failure had more fixations on the radar (M = 2332.71; SE =
61.26) than ATCos who did not detect the automation failure (M = 2098.14; SE = 58.04), F(1,
15) = 5.85, p < . 05. There was no difference between the groups for the number of fixations on
the flight strips (Mdet = 196.88; SEdet = 24.75; Mnon-det = 227.09; SEnon-det = 31.87), F(1, 15) = .59,
p > .05 or the communication areas (Mdet = 496.33; SEdet = 20.10; Mnon-det = 515.98; SEnon-det =
26.33), F(1, 15) = .16, p > .05.
Figure 9.4 shows the marginally significant three-way interaction between automation
condition, area of interest, and detection group, F(2, 30) = 2.42, p = .11. Fixations on the radar
display are of the greatest interest because the radar display is the area where the automated task
takes place. ATCos who detected the failure had significantly more fixations on the radar (M =
2332.71; SE = 61.26) than ATCos who did not detect the failure (M = 2098.14; SE = 58.04), F(1,
15) = 4.85, p < .05. The interaction between automation condition and detection group did not
reach significance, F(1, 5) = 1.94, p = .18. There were no significant effects of detection group,
F(1, 15) = .29, p > .05, automation condition, F(1, 15) = .39, p > .05, or the interaction, F(1, 15)
= 2.43, p = .14 on the number of fixations on the flight strips. No significant effects of detection
group, F(1, 15) = .16, p > .05, automation condition, F(1, 15) = 1.87, p = .19, or the interaction,
F(1, 15) = .01, p > .05, on the number of fixations on the communication areas were found.

9. Exp. 3: Automation failure
135
535
51326
6
188
497
200221
94
180
480
2330
2335
214
0
500
1000
1500
2000
2500
Radar Strips Comm Radar Strips Comm
Num
ber
of f
ixat
ions
Did not detect Detected
Manual Auto
Figure 9.4: Number of fixations as a function of area of interest, automation condition, and
detection performance
Duration of fixations. Few effects were found on the duration of fixations. The duration
of fixations was significantly different between the different areas of interest, F(2, 30) = 35.17, p
< .0001. Fixations were longest on the radar display (M = 353 ms; SE = 8 ms) followed by the
communication areas (M = 349 ms; SE = 9 ms) and the flight strips (M = 276 ms; SE = 6 ms). A
trend for a three-way interaction between automation condition, detection group and area of
interest was found, F(2, 30) = 2.09, p = .14. No significant effects of detection group, F(1, 15) =
.60, p > .05, automation condition, F(1, 15) = .72, p > .05, or the interaction, F(1, 15) = 2.17, p =
.16, were found on the duration of fixations on the radar display. For fixation duration on the
flight strips, no effects were found for detection group, F(1, 15) = .87, p > .05, automation
condition, F(1, 15) = .00, p > .05, or the interaction, F(1, 15) = 1.66, p > .05. For the
communication areas, no effects were found for detection group, F(1, 15) = .03, p > .05,
automation condition, F(1, 15) = .06, p > .05, or the interaction, F(1, 15) = .14, p > .05.
Number of dwells. The number of dwells differed by area, F(2, 30) = 162.59, p < .0001.
The most dwells were made on the radar display (M = 127.40; SE = 4.81) followed by the
communication areas (M = 79.28; SE = 3.54) and the flight strips (M = 40.16; SE = 3.53). A

9. Exp. 3: Automation failure
136
significant interaction between the automation condition and detection group was found, F(1, 15)
= 3.70, p = .07. While there was little difference in the number of dwells between manual (M =
81.94; SE = 10.84) and automated conditions (M = 77.17; SE = 8.91) for the ATCos who
detected the automation failure, there was a difference between manual (M = 76.76; SE = 6.92)
and automated conditions (M = 90.77; SE = 8.09) for the ATCos who did not detect the failure.
Figure 9.5 shows the marginally significant three-way interaction between detection group,
automation condition, and areas of interest, F(2, 30) = 2.77, p = .08. For the radar display, the
interaction between detection group and automation condition was significant, F(1, 15) = 6.14, p
< .05. For the ATCos who did not detect the automation failures, the difference in the number of
dwells between automated and manual conditions was significant, F(1, 10) = 6.81, p < .05. For
ATCos who detected the failures, the difference in the number of dwells between manual and
automated conditions was non-significant, F(1, 5) = 1.46, p > .05. For the flights strips, there
was no effect of detection group, F(1, 15) = .19, p > .05, automation condition, F(1, 15) = .23, p
> .05, or the interaction, F(1, 15) = 1.45, p > .05. For the communication areas, no effects of
detection group, F(1, 15) = .39, p > .05, automation condition, F(1, 15) = 1.15, p > .05, or the
interaction, F(1, 15) = .59, p > .05 were found.
76
77
37
117
86
47
140
75
40
131
36
120
0
25
50
75
100
125
150
Radar Strips Comm Radar Strips Comm
Num
ber
of d
wel
ls
Did not detect Detected
Manual Auto
Figure 9.5: Number of dwells as a function of area of interest, automation condition, and
detection performance

9. Exp. 3: Automation failure
137
Duration of dwells. Dwells were longer under manual (M = 3.64 s; SE = 0.39 s) than
under automated conditions (M = 3.20 s; SE = 0.31 s), F(1, 15) = 3.81, p = .07, indicating higher
workload under manual than under automated conditions.
The duration of dwells was significantly different between areas of interest, F(2, 30) =
141.13, p < .0001. Dwells were longest on the radar display (M = 6.39 s; SE = .33 s), followed
by the communication area (M = 2.40 s; SE = .18 s) and the flight strips (M = 1.47 s; SE = .08 s).
The interaction between automation condition and detection group was significant, F(1, 15) =
5.91, p < .05. While there was no significant difference in the duration of dwells between
manual (M = 3.50; SE = .63) and automated conditions (M = 3.57; SE = .60) for ATCos who
detected the automation failure, F(1, 5) = .07, p > .05, there was a significant difference between
manual (M = 3.71 s; SE = 0.49 s) and automated conditions (M = 3.00 s; SE = 0.36 s) for the
ATCos who did not detect the automation failure, F(1, 10) = 15.71, p < .01. The interaction
between automation condition and area of interest was significant, F(2, 30) = 3.00, p = .06.
While there was no significant difference in dwell durations between manual (M = 1.47 s; SE =
0.10 s) and automated conditions (M = 1.46 s; SE = .14 s) on the flights strips, F(1, 16) = .00, p >
.05, or on the communication areas (Mman = 2.46; SEman = .31; Mauto = 2.33; SEauto = .20), F(1,
16) = .72, p > .05, there was a significant difference in dwell durations between manual (M =
6.97 s; SE = .47 s) and automated conditions (M = 5.81 s; SE = .44 s) on the radar display, F(1,
16) = 6.18, p < .05.
Figure 9.6 shows the significant three-way interaction between detection group,
automation condition, and area of interest, F(2, 30) = 5.74, p < .01. For the radar display, dwells
were significantly longer under manual (M = 6.97; SE = .47) than under automated conditions (M
= 5.81; SE = .44), F(1, 15) = 4.04, p = .06. The interaction between detection group and
automation condition was significant, F(1, 15) = 7.12, p < .05. For the flight strips, no
significant effect of the detection group, F(1, 15) = .38, p > .05, automation condition, F(1, 15) =
.02, p > .05, or the interaction, F(1, 15) = .11, p > .05, were found. Likewise, for the
communication area no significant effects were found for detection group, F(1,15) = .03, p > .05,
automation condition, F(1, 15) = .35, p > .05, or the interaction, F(1, 15) = .46, p > .05.

9. Exp. 3: Automation failure
138
1.43
1.41
6.84
1.53
2.34
6.57
1.59 2.
33
7.20
2.54
2.33
5.25
0
1
2
3
4
5
6
7
8
Radar Strips Comm Radar Strips Comm
Dw
ell d
urat
ion
(s)
Did not detect Detected
Manual Auto
Figure 9.6: Dwell duration as a function of area of interest, automation condition, and
detection performance
Dwell time. Dwell times were obtained by multiplying the number by the duration of
dwells. ATCos spent the longest time on the radar display (M = 764.63 s; S E = 19.05 s)
followed by the communication area (M = 178.62 s; SE = 8.63 s) and the flight strips (M = 61.05
s; SE = 6.48 s), F(2, 30) = 657.53, p < .0001. The interaction between automation condition and
area of interest was significant, F(2, 30) = 3.97, p < .05. ATCos spent more time dwelling on the
radar under manual (M = 799.89 s; SE = 18.91 s) than under automated conditions (M = 729.37
s; SE = 31.38 s), F(1, 16) = 6.63, p < .05. No significant effect of the automation condition was
found for the flight strips (Mman = 54.69 s; SEman = 6.57 s; Mauto = 67.41 s; SEauto = 11.17 s), F(1,
16) = 1.53, p > .05, or the communication areas (Mman = 171.69 s; SEman = 11.18 s; Mauto =
185.54 s; SEauto = 13.27 s), F(1, 16) = 1.47, p > .05.
Figure 9.7 shows the significant interaction between automation condition, area of
interest, and detection group, F(2, 30) = 4.42, p < .05. A significant difference between manual
and automated conditions was found for the dwell time on the radar display, F(1, 15) = 4.39, p =
.05. More dwell time was spent on the radar under manual (M = 729.37 s; SE = 31.38 s) than
under automated conditions (M = 799.89 s; SE = 18.91 s). The interaction between detection
group and automation condition was also significant, F(1, 15) = 5.22, p < .05. Neither the

9. Exp. 3: Automation failure
139
detection group, F(1, 15) = .14, p > .05, nor automation condition, F(1, 15) = .67, p > .05, nor the
interaction, F(1, 15) = 1.77, p > .05 had a significant effect on dwell time on the flight strips.
Likewise, the effects of detection group, F(1, 15) = .13, p > .05, automation condition, F(1, 15) =
1.07, p > .05, or the interaction, F(1, 15) = .10, p > .05, on dwell times on the communication
areas were all non-significant.
789.
44
794.
26
693.
97805.
60
74.5
2 189.
84
173.
31
51.9
1
54.3
6
177.
65
168.
74
59.7
7
0
100
200
300
400
500
600
700
800
900
Radar Strips Comm Radar Strips Comm
Dw
ell t
ime
(s)
Did not detect Detected
Manual Auto
Figure 9.7: Dwell time as a function of area of interest, automation condition, and detection
performance
9.3.6 Subjective ratings of mental workload
The effect of the automation condition on ratings of mental workload failed to reach
significance, F(3, 57) = 1.86, p > .05. Contrasting automated versus manual conditions indicated
a trend towards higher ratings of mental workload under manual (M = 65.46; SE = 3.76) than
under automated conditions (M = 60.03; SE = 1.71), F(1, 19) = 2.59, p = .12.
9.3.7 Trust and self-confidence
Ratings of trust ranged from 0 to 100 with an average of 75.71 (SE = 2.14). Trust ratings
differed significantly between the automation conditions, F(2, 38) = 1.63, p > .05. Controllers
rated their trust higher under reliable (M = 79.33; SE = 2.66) than under failure conditions (M =

9. Exp. 3: Automation failure
140
72.10; SE = 3.30), F(1, 19) = 5.96, p < .05. There was no difference in trust ratings between
ATCos who detected both and ATCos who did not detect any automation failures, F(1, 15) =
.01, p > .05. Even though trust ratings in ATCos who detected the automation failure indicated a
greater drop from reliable (M = 78.75; SE = 4.88) to unreliable automation conditions (M =
68.25; SE = 5.27) than trust ratings in ATCos who did not detect the automation failure (Mrel =
79.36; SErel = 4.03; Munrel = 73.18; SEunrel = 5.27) the interaction was non-significant, F(1, 15) =
.35, p > .05. Ratings of self-confidence ranged from 25 to 100 with an average of 65.70 (SE =
2.42). No differences between automation conditions were found for self-confidence.
9.4 Discussion
The purpose of the experiment was to investigate the effects of reliable and inaccurate
automation conditions on ATCo performance in the detection of potential conflicts and
communication tasks, mental workload, trust in the automation, and self-confidence to perform
without automation. Of particular interest was the question whether ATCos would be able to
intervene in cases when both airborne separation and the conflict detection aid failed.
Performance in detecting a failure of airborne separation was studied under manual conditions
and under automated conditions when the automation failed to point out an identical conflict.
Further, it was studied if reliable automation could improve performance and reduce mental
workload compared to manual performance.
Like in the previous two experiments, a marked benefit of the conflict detection
automation on ATCo performance was found when the automation functioned 100% reliably.
More potential conflicts were detected and conflicts were detected earlier under automated than
under manual conditions. The automation effects did not carry over to the communication task
of accepting and handing-off aircraft with the exception of a few order effects due to the fixed
order of reliable and unreliable automation. In those tasks, ATCos performed better under
unreliable conditions suggesting a practice effect. The performance of routine tasks imposes a
considerable amount of workload, but did not benefit from the availability of a decision aid.
Apparently, the aid did not free enough resources or the ATCos chose not to allocate them to
improve communication performance.

9. Exp. 3: Automation failure
141
Trends were found for reduced mental workload under automated compared to manual
conflict detection conditions. ATCos rated their workload lower and updated more waypoints
when they had conflict detection automation available. However, it took them longer to update
the waypoints when they had automation available. This could represent either a speed-accuracy
trade-off or a cost of the automation. Perhaps, it took ATCos longer to update waypoints from
an automated or automation monitoring mode than from a manual mode. The ocular measure of
mental workload found shorter dwell durations under automated than manual operations
indicating reduced allocation of attentional resources under automated conditions. Scanning
randomness or entropy did not reflect an automation effect. This is in contrast with other ATC
research that found higher scanning randomness (indicating lower mental workload) under
automated conditions (Hilburn, 1996). However, Hilburn (1996) used five areas of interest (i.e.
traffic, datalink, time line, pre-acceptance, and hand-off area) and eye fixations were more
equally distributed across these areas in his simulation of air traffic transitioning to TRACON.
Because in the present study about two thirds of all fixations were on the radar and transitions
could be made to only two other areas of interest (i.e. flightstrips and communication area), there
might not have been enough scanning of other areas and not enough transitions between areas of
interest for entropy to be sensitive to automation effects. In the past, the measure of entropy was
mostly used to study scanning in the cockpit where there is more scanning between displays,
instruments, and out-of-the window (Harris et al., 1986) than in the ATC environment where
most of the scanning takes place within the radar display.
In general, automation had mostly beneficial effects as long as it functioned 100%
reliably. Under inaccurate automation conditions however, the findings were not so positive.
ATCos were more likely to detect a particular conflict when they were manually detecting
potential conflicts than when they were assisted by automation and the automation failed to point
out a particular conflict. Overall, trust in the automation was rated relatively high under reliable
automation conditions (i.e. in the upper quartile) and was reduced after the automation failed to
point out a conflict. That ATCos detected the four-minute automation failure earlier when they
experienced it the second time could reflect the calibration of their trust with the experienced
level of accuracy of the detection aid (Wickens, 2000). However, this should remain only a
speculation as the analysis was purely exploratory and based on a very small number of
participants.
9. Exp. 3: Automation failure
142
Visual attention as measured by eye fixations and dwells indicated that ATCos who did
not detect the automation failures reduced their visual attention to the radar (i.e. the automated
task) under automated compared to manual operations. No difference in detection rates was
found when ATCos had two versus four minutes available between the onset of the failure event
and the loss of separation. Timeliness in the detection of a potential conflict was also not
markedly different between manual performance and a comparable automation failure condition.
No support was found for the view that ATCos under automated conditions would require more
time to detect and respond to a conflict because they are further removed from the decision-
making process. However, this was only an exploratory data analysis. It is possible that a longer
time frame would have shown an effect. Two or four minutes might simply not have been
enough to show a variation. However, inaccuracies in a conflict detection aid like URET are
more likely to be short-term. Longer term changes in flightplan, for example, would eventually
be available to URET so that they could be taken into account for the conflict or no-conflict
decision.
These results show that the detrimental effects of FF conditions on the ATCo such as
reduced conflict detection and increased mental workload found in earlier experiments (Galster
et al., 2001; Endsley et al., 1997; Metzger & Parasuraman, in press) can be compensated for by
supporting ATCos with automated decision aids. However, this study suggests that these
automation benefits do not come without a cost. ATCos performed better in detecting conflicts
without automation than when they had automation support that was less than 100% accurate.
This points toward a complacency effect.
The vigilant reader may have noticed that the complacency effect was "only" a trend and
not statistically significant. Still, it was interpreted. To study operator response to very rare
failures of system components or other surprises, a surprising event can only be presented once
or twice before the participants start to expect them and adapt their behavior accordingly (Molloy
& Parasuraman, 1996; Wickens, 1998). However, low numbers of events result in low power
and therefore a likelihood for statistically non-significant results. The described study addressed
complex phenomena under multi-task conditions in which multiple human information-
processing components are involved. This can lead to large variances in overall multi-task
performance because variance in a multi-task situation is composed of the variance for each task
component, variance for task-sharing, strategies, and trade-offs. Likewise, the response to

9. Exp. 3: Automation failure
143
surprises can lead to high variance between participants. This makes it evident that empirical
data on the response to unexpected events is difficult, expensive, and time consuming to obtain,
especially if it becomes necessary to keep the sample size in a study low to meet cost or time
constraints, if a specific population is tested (e.g. air traffic controllers, pilots, astronauts, etc.)
and expensive equipment is used (e.g. simulators, eye-tracking equipment). As a consequence,
the analysis and interpretation of the results focused on practical considerations rather than
statistical significance (Wickens et al., 1998b; Wickens, 1998; Bortz & Döring, 1999). In
studying safety-critical environments such as the ATC system it is better to err on the side of
caution and take a potentially detrimental effect for system safety serious, even if it is small and
not statistically significant, than to reject the effect for purely statistical reasons and perhaps find
out later in the real world that the effect was indeed of practical significance. Rather than relying
exclusively on inferential statistics, we should also rely on the replication of results as suggested
by Cohen (1994). In the case of the complacency effect, it has been demonstrated repeatedly and
reliably in more basic laboratory simulations and has been reported by pilots and in accident
reports. Therefore, the effect in the presented experiment should be taken seriously even if it did
not reach significance. It should further be noted that the reliability of the detection aid in this
study (one failure per scenario) was rather low, in fact, much lower than would be acceptable for
a real world system. However, higher reliabilities are associated with even more complacent
behavior (May et al., 1993). Therefore, the complacency effect in this study should be
considered a rather conservative estimate. Automation-related complacency could be much
more pronounced with the very high reliability of real world systems.
One limitation of the experimental design should be pointed out, however. The order of
presentation of the reliable and unreliable automation was not balanced. ATCos always
performed in the reliable automation before performing in the unreliable automation conditions
so that they could get enough experience and build trust. Therefore, order was confounded with
the reliability of the aid and it is possible that the reduced detection of an automation failure was
due to effects other than the reliability. For example, one could argue that ATCos became tired
after repeated performance in these scenarios and, as a result, did not detect the automation
failures. Communication performance suggested quite the opposite, however. Communication
performance was better in the unreliable than in the reliable condition suggesting a practice
effect. Based on this finding, ATCos should be expected to be more, rather than less efficient in
9. Exp. 3: Automation failure
144
their task performance, including conflict detection. In addition, if fatigue were the cause of the
complacency trend, then manual performance should be reduced in those ATCos that performed
the manual condition last (order 3 and 4 in figure 9.1). Again, this was not found in the data.
There was no difference in ATCos who performed the manual conditions first and those that
performed it last making it unlikely that fatigue was the cause of the reduced conflict detection
under automated conditions.
Different explanations for complacency have been proposed (Parasuraman et al., 1993;
Farrell & Lewandowsky, 2000; Moray, 2000) and discussed previously (see 3.3). The results of
this study support the view that complacency is associated with reduced attention allocation to
the automated task under automated conditions compared to manual conditions (Parasuraman et
al., 1993) assuming that eye movements and attention are associated at least to some extent.
Attention allocation to the automated task (i.e. the radar display) as measured by the number of
fixations and dwells and dwell time was reduced under automated compared to manual
conditions in the ATCo group that did not detect the automation failure (i.e. the group that was
complacent). Because eye movements were only analyzed up to the point when the loss of
separation occurred, the difference in eye fixations and dwells between the ATCos who detected
and did not detect the failure cannot be due to the fact that the ATCos who detected the event
spent more time looking at the display after they realized that the automation had missed
something.
However, recording and analyzing eye movements in the ATC environment points out a
particular challenge. In contrast to eye movement studies performed in the cockpit or in process
control, the elements of interest carrying relevant information (i.e. the aircraft and datablocks)
are very small and not in a static location in the ATC environment. Instead, they move around
the large radar display. Pinpointing which aircraft or datablock exactly an ATCo is fixating
requires a very high accuracy and resolution of the eye tracking equipment and sophisticated
analysis software which were not available for the present experiments. Therefore, it is possible
that even though ATCos who did not detect the automation failure fixated on the radar less under
automated conditions, they fixated the particular aircraft or the datablocks of the aircraft
involved in the conflict undetected by the automation. Because they did not detect it, this is
unlikely. However, it should be recalled that the relationship between visual attention and eye
fixation is only of partial interdependence. Even though there is a functional tie between eye

9. Exp. 3: Automation failure
145
movements and attention, a fixation does not guarantee attention. Attention is necessary
however to determine where the eye will fixate next (“mandatory shift hypothesis”; Pashler,
1998). A classic study by Mackworth and Kaplan (1964) found that even though critical signals
on a display were fixated, study participants often missed reporting them. Duley et al. (1997)
conducted a study in which they forced fixation on an automation monitoring task by
superimposing it over the primary tracking task in a simulation of multiple flight tasks (modified
mutli-attribute task or MAT battery; Parasuraman et al., 1993). Even though fixations were
forced on the monitoring task, the detection of automation failures was not improved compared
to the non-superimposed condition while tracking performance was preserved. Metzger, Duley,
Abbas, and Parasuraman (2000) found that even though a group of students that was trained in
that same simulation of multiple flight tasks with variable priority manipulations (e.g. Kramer,
Larish, Weber, & Bardell, 1999; Gopher, 1996, Gopher, Weil, & Siegel, 1989) performed better
than students who were trained with conventional whole-task or part-task training approaches, no
difference in eye movements was found.
Thus, eye fixations and attention could have been dissociated in ATCos as well. They
could have fixated on a datablock, but attend to stimuli in the periphery or to internal processing,
for example in working memory. This seems unlikely in the ATC simulation though. The
reason for the dissociation of eye movements and attention in the MAT battery could be due to
the fact that the MAT display used in these studies was relatively small (17 inches) and attention
could have been allocated to parts of the display using peripheral vision. Both, the primary
tracking task and the automation monitoring tasks are dynamic. Changes could have been
captured in the peripheral vision without requiring to foveate. The ATC simulation is different.
First, the radar display is much larger (21 inches) and fills a large part of the visual field. The
two other displays (the flightstrips and communication areas) were displayed on a second
monitor of the same size. Transitioning from the datalink displays to the radar required the
ATCos to move their head. In addition, the relevant data on the radar or the datalink displays
was printed in relatively small font (about 12 point), similar to the real world systems.
Extracting information from these datapoints (e.g. the datablock) most likely required the
participants to fixate them. Therefore, it seems unlikely that ATCos were able to process
information from the ATC simulation with peripheral vision only and could explain why
attention and eye movements were associated in the ATC task, but dissociated in other studies

9. Exp. 3: Automation failure
146
such as the MAT task. With appropriate equipment and software, it would be interesting,
however, to examine the allocation of attention on the basis of fixations on individual aircraft
and aircraft datablocks and study the association and dissociation between attention and eye
movements.
Of course, Moray's view (2000) cannot be refuted with these data because the present
study did not compare visual sampling under automated conditions to an optimal sampling
strategy. Due to the complexity of the ATC tasks, it is very difficult to establish an optimal
sampling strategy. This difficulty in establishing the optimal sampling strategy might further be
the reason why Moray or others have not been able to provide empirical support for their view in
complex human-automation environments.
These findings have important implications for the introduction of automation. Unless
automation is extremely reliable, operators might be better off performing manually than
performing with automation that works unreliably. Automation should not be introduced into
systems in the expectation that it “does not hurt” to have automation available. It has been
shown that even when automation is extremely unreliable and should not be trusted (e.g. 25%;
May et al., 1993), humans still rely on it and show (slightly) poorer detection performance under
automated than manual operation. Mosier and Skitka (e.g. Mosier & Skitka, 1996) have argued
that automation use acts like a heuristic in decision-making. Rather than relying on the raw data
to make a decision, operators base their decision on the automation. If the automation is
unreliable, this can have catastrophic consequences.
For highly reliable automation that is beneficial to operator and system performance,
automation should be designed in a way that the risk for complacency is reduced. Depending on
the assumed underlying mechanisms of complacency different options have been suggested.
Based on the hypothesis that complacency is an attentional phenomenon several solutions have
been proposed in the automation research literature. Adaptive automation combines the benefits
of automation with the benefits of manual control and has been shown to reduce complacency in
the MAT battery (Parasuraman, Mouloua, & Molloy, 1996) and provide performance benefits in
an ATC simulation (Hilburn, 1996). In addition, it could reduce other costs of automation such
as manual skill degradation. The advantage of adaptive over static automation is also consistent
with the hypothesis that complacency reflects a weakening of the memory trace of the automated
function over time (Farrell & Lewandowsky, 2000). If automation were able to communicate its

9. Exp. 3: Automation failure
147
level of accuracy to the operator, the control function could be allocated to the operator or the
machine based on the automation's self-diagnosed level of accuracy. For example, if wind or
weather are difficult to predict and conflict prediction consequentially could become inaccurate,
the automation could return control to the ATCo. It has been suggested previously that
complacency might have to do with visual factors, e.g. that the operator was distracted by a
primary task and failed to detect the malfunction of the automated system because it was in
peripheral rather than central vision. However, positioning the monitoring in the center of a
monitor (Singh, Molloy, & Parasuraman, 1997) or superimposing the automated system on the
primary task (i.e. in central vision; Duley et al., 1997) did not reduce the complacency effect
suggesting that the effect is due to attentional rather than pure visual factors. Solutions need to
be found to reduce the attentional demand in order to free resources so that controllers can pay
attention to the automated system. The use of integrated displays has also been demonstrated to
reduce complacency (Molloy & Parasuraman, 1994; Molloy, Deaton & Parasuraman, 1995). If
reduced detection of automation failures is associated with reduced visual attention to the
automated task, automation should be designed in a way that it does not require a lot of
attentional resources for operators to detect a system malfunction. By forming an emergent
feature such as an object or a shape, integrated displays decrease the demand for attentional
resources associated with detecting malfunctions. Information on the malfunction can then be
processed in parallel with other information. Molloy and Parasuraman (1994) showed the
benefit of integrated displays in a simulation in which an engine-status display was presented to
non-pilot participants either conventionally (i.e. four round gauges that had to be monitored) or
in its integrated form (i.e. vertical bars with a bar as the emergent feature indicating a
malfunction when the bars crossed the line). Molloy and Parasuraman (1994) found that subjects
detected 70% of the malfunctions in the manual condition. In the automated condition,
participants performed significantly better with the integrated (64% detection rate) than with the
conventional display (36% detection rate). A replication of the study with pilot participants
(Molloy et al., 1995) found similar results.
Training could represent a complementary approach to system design. There is strong
evidence that variable priority training can improve time-sharing or task-coordination abilities in
complex multi-task environments and make attention strategies more flexible, particularly in
comparison to conventional whole or part-task (PT) training (Kramer et al., 1999; Gopher, 1996;
9. Exp. 3: Automation failure
148
Gopher et al., 1989). Trainees in a variable priority training give (varying) priority to one of the
tasks while still performing the others. This allows the trainee to experience the effects of
different attention allocation strategies. Metzger et al. (2000) found a trend for reduced
complacency in group of students that was trained with variable priority training strategy
compared to groups trained with traditional part-task or whole-task strategies in the MAT
battery, a multi-task battery simulating different flight tasks. This supports the hypothesis that
complacency is due to suboptimal sharing of attentional resources and indicates that training
might be a valuable approach to reduce complacency effects.
However, any of these approaches to reduce complacency need to be evaluated. As long
as the ATCo does not have authority for separation and is not actively involved in the decision-
making process, none of these techniques to reduce complacency might be useful.
While complacency effects have been reported in the NASA ASRS by pilots and have
been shown reliably in simple PC-based multi-task batteries with student participants and pilots
(Parasuraman et al., 1993; Dzindolet, Pierce, Dawe, Peterson, & Beck, 2000; Mosier & Skitka,
1996), this is the first study showing complacency in a mid-fidelity ATC simulation in a sample
of professional ATCos. This is a very important finding because it indicates that ATCos could
exhibit the same complacency effects that have been found in the general population (i.e.
students) and pilots, both in the laboratory and in the field as some accident and incident reports
show. So far, controllers have not been exposed to sophisticated automation, but rather to fairly
simple and unreliable automation (e.g. the current conflict alert). In addition, ATCos are aware
that the task of detecting and resolving conflicts is already a difficult one and can even become
more difficult under FF conditions. Therefore, it could be speculated that ATCos would not be
as susceptible to complacency and excessive trust as other groups. As the data showed, this was
not the case. Operators in the ATC environment seem as susceptible to complacency effects as
operators in other domains.

10. Discussion
149
10. Discussion
The final chapter summarizes and integrates the findings of the empirical studies and
concludes with the discussion of their implication for both, theory and the design of effective and
safe human-automation systems in ATC and other domains.
10.1 Summary of the research
The ATC system is undergoing major changes to accommodate unprecedented amounts
of traffic (RTCA, 1995; FAA, 1997). Authority for aircraft separation will shift to the flightdeck
reducing the involvement of ATCo in the control of air traffic. However, ATCos are expected to
intervene when airborne separation fails. Previous studies found reduced performance under
such FF conditions and automated decision aids were suggested as a means to improve ATCo
performance (Endsley et al., 1997; Galster et al., 2001; Metzger & Parasuraman, in press).
While a few studies have shown benefits of automated decision aids under current ATC
conditions (Hilburn, 1996; Schick, 1991a, 1991b), no literature was available examining the
effects of automated decision aids on ATCo performance and workload under FF and high traffic
density conditions. The present work was conducted to bridge this gap in the research literature.
In particular, it was studied whether automated decision aids could remedy some of the negative
effects associated with FF and high traffic density expected for the future. It was further
examined how the potentially reduced utility of a decision aid (i.e. automation failures) would
affect ATCo performance. In addition, a relatively new approach to human-automation
interaction was studied. It was investigated if multimodal automation feedback would have
beneficial effects in guiding attention in an increasingly visual environment.
The experiments demonstrated that increased traffic densities could result in reduced
ATCo conflict detection and communication performance validating previous findings (Galster
et al., 2001; Metzger & Parasuraman, in press). Conflict detection automation had many
beneficial effects on performance and mental workload and could compensate for detrimental
effects of high traffic density. However, despite the many beneficial effects that the decision aid
had on ATCo mental workload and performance, there were also adverse effects when the aid
failed. Fewer ATCos detected a particular conflict when an automation failure occurred than

10. Discussion
150
when they were manually detecting conflicts. Multimodal feedback was not as efficient in
guiding ATCo attention as expected. In fact, evidence for a disruption of the performance in an
ongoing visual task was found.
These findings will now be discussed as they apply to the model on the interrelationship
of taskload, workload, strategies, and performance (Wickens et al., 1997; see figure 4.1) that was
central to the research approach. Additionally, theoretical implications of the empirical findings
(e.g. for complacency or cross-modal attention) will be covered.
10.2 Integration of empirical findings and theoretical implications
Figure 10.1 shows how the findings of the three empirical studies can be integrated and
applied to the model (Wickens et al., 1997). Although automation might not be a direct taskload
factor (like traffic density, e.g.), it can moderate the effects of taskload on workload,
performance, and the choice of strategies. The experiments presented in chapters 7-9
investigated the effects of traffic density, the availability of automation, and automation display
variations (i.e. feedback). These are all relevant factors with respect to future developments in
ATC. The ATCos’ adaptation to the changing demands of their environment is central to the
model.
10.2.1 Traffic density
Traffic density had a great impact on ATCo workload, performance, and the choice of
strategies. Mental workload increased significantly with increased traffic density. This was
reflected in both subjective and physiological measures. ATCos managed the increased
workload under high traffic density by postponing flight strip updates and some even chose to
shed this low-priority task completely. Interesting was also the ATCos' strategy under moderate
traffic conditions to update flight strips prematurely even though they were instructed not to do
so. ATCos probably tried to accomplish these tasks whenever they had capacity to do so in an
attempt to prepare for periods of higher load, ignoring the instructions. Both tasks, updating
flight strips and handing-off aircraft, contain prospective memory components. ATCos have to
remember to perform these tasks at a certain point later in time. Prospective memory has

10. Discussion
151
Taskload Workload Performance
Traffic: Increased WL
(physiological, subjective)
Reduced and delayed detection of conflicts and
self-separations; delayed communication
Automation: Reduced WL
(dwell duration, subjective)
Increased and earlier detection of conflicts and
self-separations; earlier detection especially under
high traffic (= compensation); increased detection
rate under moderate traffic; reduced detection with
auto failure; more timely communication
Feedback: -- Delayed hand-offs with multimodal and enhanced
FB
Strategies
Traffic: postponing and shedding of flight strip updates; shift in attention allocation from
radar (and strips) to communication
Automation: reduced shedding, but greater delay of flight strip updates; shift in attention
allocation from radar to communication (esp. for non-detection group); fewer
early hand-offs under high traffic
Feedback: High traffic: most shedding of flight strip updates with multimodal, least with
enhanced FB; moderate traffic: most early updates with multimodal, least with
enhanced FB; high traffic: most early updates with enhanced, least with
multimodal FB
Figure 10.1: Integration of empirical findings into the model (Wickens et al., 1997)
been shown to be very susceptible to workload (Sauer, 2000). Therefore, it is reasonable to
assume that performing these tasks earlier than instructed, represents a workload reduction
strategy. If the task is completed, the ATCo no longer has to remember to perform it. In
addition, handing-off aircraft as early as possible would result in a very efficient workload
reduction for ATCos in the real world (if the ATCo in the adjacent sector accepted them early)
because they would no longer have responsibility for these aircraft. They could drop the
datablock and reduce visual load and load imposed by considering these aircraft in their decision
making.

10. Discussion
152
Increased traffic density also led to a shift in the attention allocation strategy as reflected
in eye movements. Attention allocation to the datalink was increased to keep up with
communication at the expense of attention allocation to the radar display. This is probably a
consequence of the requirement for coordination and communication for each single aircraft.
That the shift in strategies was not completely successful to maintain performance was reflected
in the delayed communications under high traffic. Due to the human’s limited supply of
attentional resources, resources that are allocated to one task cannot be allocated to another.
Resources allocated to communication had to be “borrowed” from a different area, in this case
the radar display and, to a lesser extent, the flight strips. The reduced attention allocation to the
radar under high traffic density was also associated with the reduced and delayed detection of
potential conflicts.
10.2.2 Automation
Automation had numerous effects on mental workload, strategies, and performance. In
the first experiment, mental workload and strategies were not affected. ATCos might have
allocated the resources freed by the automation to other tasks as reflected in the improved
performance in the communication tasks. Alternatively, the lack of an automation effect on
workload could be due to the only moderate levels of trust and, as a consequence, the
underutilization of the aid. ATCos might not have understood its functionality well enough to
rely on it and, therefore, the availability of automation did not affect their workload. In the third
experiment, in which ATCos rated trust considerably higher, mental workload as indicated by
subjective ratings and reduced dwell durations was reduced with automation. Dwell durations
can indicate the amount of information presented or the level of effort required for information
extraction from a display. Therefore, the shorter dwell durations, particularly on the radar
display, under automated conditions were interpreted as an indicator of reduced mental
workload. In the third experiment, strategies were also affected by automation. More aircraft
were handed-off prematurely under manual than under automated conditions. The great
effectiveness of this strategy to reduce mental workload was already discussed above. Under
automated conditions, more flight strips were updated successfully indicating that the automation
might have freed attentional resources that could be allocated to this task of lower-priority.

10. Discussion
153
However, ATCos delayed the flight strip updates longer under automated than under manual
conditions. More research is needed to determine if this reflected a simple speed-accuracy trade-
off or, more seriously, a cost of the automation. It might take ATCos longer to update the flight
strips when they are removed from the decision-making loop (automated condition) than when
they are part of the decision loop (manual condition). This could be an indicator for the ATCos'
reduced awareness of the location or status of the elements in their airspace, which can
negatively impact their decision-making.
Most importantly, however, the availability of conflict detection automation resulted in
markedly increased and advanced detection of potential conflicts as long as the automation was
reliable and even carried over to the communication tasks. ATCos responded faster to requests
for acceptance into the sector and handed-off more aircraft successfully. The resources that were
freed by the conflict detection automation were invested in the communication tasks. When the
automation failed, however, fewer ATCos detected a conflict that the automation failed to point
out under automated conditions than under manual conditions. Therefore, the effects of
automation on ATCo performance have to be differentiated for reliable and unreliable
automation.
Associated with the rather poor detection of automation failures, and perhaps the most
interesting result, was an automation-related strategy shift revealed by eye movements. The
availability of automation was associated with a reduction in visual attention to the radar. This
strategy shift was linked to performance in the detection of the automation failure. ATCos who
did not detect automation failures allocated fewer attentional resources, as indexed by eye
fixations, to the radar (where the automated task was located) under automated than under
manual conditions. ATCos who detected conflicts even though the automation failed to point
them out allocated the same amount of visual attention to the radar under manual and automated
conditions.
Theoretical implications: Complacency. If it is assumed that eye fixations and attention
allocation are related, this supports the attention-related explanation of complacency that
automation failures are not detected because fewer attentional resources are allocated to the
automated task (Parasuraman et al., 1993). However, although trust was rated relatively high
and dropped in the unreliable condition, there was no difference in trust ratings between ATCos
who detected and ATCos who did not detect the failure. Therefore, no support was found for the

10. Discussion
154
hypotheses that complacency is due to high trust in the aid as suggested by Parasuraman et al.
(1993). The immediate implications of this and other interpretations for system design will be
discussed below.
10.2.3 Automation as a moderator of traffic density effects
Of particular interest is how automation moderates the effects of traffic density. This is
central to the research question whether automation would be able to compensate for the
negative effects of traffic density. Again, more aircraft were handed-off prematurely under
manual than under automated conditions. However, this became especially evident under high
traffic density. That ATCos made the most use of this strategy in the manual high density traffic
condition when taskload was highest of all conditions shows how efficient ATCos were in
managing their workload. Perhaps as a consequence of this, mental workload was not affected by
the interaction between automation and traffic.
Most important, however, was the moderating effect of automation on the detection of
potential conflicts. While the number of detected self-separations benefited the most from the
aid under moderate traffic conditions, advance notification of potential conflicts had the greatest
benefit from the aid under high traffic density. Without automation, potential conflicts were
detected later under high than under moderate density. Not only did advance notification
improve considerably with the aid, advance notification under high traffic density exceeded
performance levels under manual conditions at both traffic levels. Bearing in mind that future
airspace will be much denser and more efficient leaving the ATCo less time to detect and resolve
problems, the improved timeliness in the detection of potential conflicts is a very notable and
encouraging finding. That the greatest effect was found for advance notification of conflicts as
opposed to self-separations matches the greater relevance of the detection of conflicts for system
safety. Self-separations represent successful airborne separation and do not require ATCo
intervention. Conflicts, however, are the situations in which ATCos would be required to
intervene. This indicates that automation could diminish and fully compensate for the negative
impact of traffic density on advance notification of potential conflicts and, to a lesser extent, on
the detection of self-separations.

10. Discussion
155
That conflict detection performance was better maintained when automation was
available at high levels of traffic density in Experiment 2 than in Experiment 1 could be due to
the ATCos’ stronger reliance on the reliable decision aid in Experiment 2. The stronger reliance
could have compensated for the effects of traffic density and the reduced allocation of attention
to the radar under high traffic density.
10.2.4 Automation feedback
Display design is another important workload driver. Display type (i.e. visual, enhanced
visual, and multimodal automation feedback) of the conflict detection aid had fewer effects on
mental workload, strategies or ATCo performance than traffic density or automation. In fact,
display type had no effects on mental workload and, interestingly, on the conflict detection
performance. Rather, it affected strategies and communication performance. There was a
tendency for a greater hand-off delay in the multimodal and enhanced visual conditions than in
the simple visual conditions. This could reflect the influence of display clutter and distraction in
the search for aircraft ready for hand-off because both, enhanced visual and multimodal
feedback, included an additional red line indicating the location of the detected potential conflict.
ATCo complaints of clutter in these conditions would support this interpretation. The fewest
early flight strip updates under high traffic density and the most early updates under moderate
traffic density were made with multimodal feedback. Even though multimodal feedback should
allow ATCos to shift their attention to other displays away from the radar, more flight strip
updates were missed in the multimodal than in the visual feedback conditions under high traffic.
Multimodal feedback seemed to disrupt rather than facilitate performance in this task.
Theoretical implications: Cross-modal attention. The preemption phenomenon could
provide an explanation for these findings (Wickens & Liu, 1988). Due to the great alerting
characteristic of an auditory stimulus (e.g. Posner et al., 1976; Spence & Driver, 1997a; Perrott et
al., 1991), attention is diverted away from an ongoing visual task (e.g. updating flight strips) and
shifted to the source of the auditory alert (i.e. the radar) leading to disruption of performance in
the ongoing visual task. This is also consistent with findings by Spence and Driver (1997b,
1997c) who found performance costs when participants had to shift their attention from one
modality to the other. They interpreted their results as evidence against the view that there are

10. Discussion
156
different independent attentional mechanisms allocating attention to different modalities and in
favor of the view that one supramodal mechanism might be responsible for the allocation of
attention to both modalities.
10.2.5 System performance
System performance is another component of the model by Wickens et al. (1997) that has
not been addressed yet. To the extent that operators play a role in system performance, operator
performance and workload assessments allow conclusions on system performance. In fact,
predicting system performance often is the ultimate goal of performance and workload
assessments (unless e.g. the effects of automation on operator stress and health are of interest by
themselves). Based on this research, the conclusion can be drawn that automation in future
ATM systems can have beneficial effects on system performance and safety because it can
compensate for the negative effects on operator performance associated with high traffic density
and the FF concept. However, measures need to be taken to assure that the operator does not
become complacent to the automation thereby reducing safety. This is not to say that the
operator is to blame for complacency and resulting safety glitches. Rather, complacency results
from the interaction with a system that was designed without taking into account the capabilities
and limitations of human performance. That humans are not good at monitoring under multi-
task conditions is well established in the research literature and reflected in many accident and
incident reports. If systems impose a high monitoring demand on the operator, resulting errors
are not to blame on the human, but are design-induced.
That ATCos missed conflicts in these studies is not to say that, in the real world, there
would have been a midair collision every time they missed one. Of course, in addition to ATCos
other players and their respective systems contribute to system performance and safety. Most
important among them are pilots and airline dispatchers. They were not addressed in this
research and integrating all elements of the system is a huge endeavor well beyond the
capabilities of this project. Still, further research is needed to investigate how automated
decision aids can support not just the ATCos, but all elements of the system jointly in achieving
the goals of increased safety and efficiency. Research efforts are currently under way at the
NASA-Ames Research Center. A particular problem from the system perspective that is not

10. Discussion
157
being addressed yet is the interaction between ATCos and pilots that arises from the different
algorithms for conflict detection and resolution on the ground and in the air. There is no single
agreed upon algorithm for conflict detection and resolution. That is, pilots will have different
algorithms than ATCos and most likely different airlines will install different algorithms on their
aircraft. Because algorithms differ in how they predict conflicts (e.g. due to different wind
models), they could come to different conclusions in terms of the time or severity of potential
conflicts and their resolutions. How different predictions and recommendations for resolution
will affect the interaction and negotiations between ATCos and pilots and ultimately system
safety has not been addressed in the research literature.
To summarize, the findings suggest that the negative effects of FF on ATCo
performance, mental workload, and eventually system safety found in previous studies (Galster
et al., 2001; Endsley et al., 1997; Metzger & Parasuraman, in press) could be mitigated by
providing advanced decision aids to the ATCos. The support of a 100% reliable conflict
detection aid improved ATCo performance significantly and reduced mental workload under FF
conditions and high traffic. Under FF, authority for separation is transferred to the pilots and
ATCos are only expected to intervene in case airborne self-separation fails. This is quite
difficult for ATCos given that the transfer of authority to the pilots and the lack of intent
information removes them from the decision-making loop. However, automation can
compensate for these negative consequences. Even though the ATCo now becomes a monitor of
pilot separations and automation and is even further removed from the decision-making loop,
automation alerts ATCos of critical situations in which they might be required to intervene. The
findings of all three experiments conform with previous findings of automation performance
benefits under current ATC conditions and reliable operation of the automation (Hilburn, 1996;
Schick, 1991a, 1991b; Völckers, 1991). However, even though modern automated systems are
extremely reliable (e.g. 99.9%), it is unlikely that they are 100% reliable. Automation is
designed by humans and humans can make errors in the design of a system. Further, even if the
algorithm performs reliably, the decision aid might not get complete or up-to-date information.
Due to uncertainties in a FF environment ("unanticipated variation", Roth, Bennett & Woods,
1987) this is more likely under FF than under current ATC conditions. Indeed, when the
automation failed or became inaccurate ATCos were even less likely to detect a failure of
airborne separations when automation was provided than when they were manually performing.

10. Discussion
158
Both FF and automation shift the ATCo’s role from an active participant in the decision process
to a monitor with the consequences that the ATCo is unable to act as a back-up in case self-
separations and automation fail. This indicates that the expectation that the ATCo could act as a
last resort and intervene in case both agents (i.e. pilots and automation) fail to detect a conflict
might be a dangerous illusion. In fact, the system is designed in a way that the human is left to
do what humans are very poor at, that is to passively monitor a system without active
involvement in the decision processes. Active involvement in the decision-making process is
crucial to operator performance and system safety (Metzger & Parasuraman, in press). If
operators are not actively involved in controlling the system and instead are removed from the
decision loop and left to monitor the system, it can take them longer to detect system
malfunctions. Longer detection times, however, leave less time to recover. Consequently, the
success of FF and automation might depend on the active involvement or at least the choice of
active involvement of the operator. If operators are actively involved they should be better able
to revert to manual control in a timely manner in case of a failure of airborne self-separation or
automation. It could be investigated if the benefits of advanced decision automation in terms of
operator and system performance under current ATC conditions and active ATCo involvement
(Völckers, 1991; Schick, 1991a, 1991b; Hilburn, 1996) would persist in case the automation
fails. No empirical data is available to answer this question yet.
10.2.6 Usefulness of research approach
The empirical findings emphasize the importance and usefulness of the model by
Wickens et al. (1997) for studying ATCo and other operator interaction with automated systems.
Only the joint investigation of taskload, workload, strategies, and performance allowed to
capture the complex relationship between these factors and to map the changes in operator-
system interaction induced by automation. Observing the pattern of interaction of the elements
in the model (e.g. shedding of a low-priority task to reduce workload and maintain performance
in the more important conflict detection task) leads to a fuller understanding of the effects of
automation on operator performance and to the extent that ATCo performance affects system
performance, on system safety.

10. Discussion
159
These findings of sometimes quite complex interrelationships between the central
components of the model (i.e. workload, strategies, and performance) also validate the use of
operator-in-the-loop simulations as a very appropriate approach for this research. While
modeling approaches allow for the economical prediction of the effects of system parameters on
operator and system performance, they do not take operator strategies into account. Laboratory-
based tasks, on the other hand, typically lack ecological validity. They lack the complexity of
real world systems and therefore do not elicit the same strategies and interactions between
demands in the environment and operator responses as in the real system. Typically, participants
untrained and unfamiliar with the domain of interest are tested. Most likely, they do not use the
same strategies as subject-matter experts. While the analysis of accidents or incidents might give
some information on workload, strategies, and (unsuccessful) performance in the real system
with real operators, it does not allow for the manipulation of taskload factors. In fact, oftentimes
the taskload factors can only be reconstructed or guessed after the fact and can sometimes not be
determined at all. It is not possible to observe how operators adjust to the varying demands of
the situation. Besides, this approach only allows for the analysis of system parameters already
implemented in the system and is not valuable for the evaluation of future systems.
Humans do not passively respond to the demands of the environment. Rather, their
nature is to adapt to the demands of the environment and even manipulate the environment
according to their needs and capabilities by employing strategies. Operator-in-the-loop
simulations allow the operator to make use of this human capability and at the same time, allow
the researcher to observe and map such adaptation processes.
10.3 Implications for system design
The presented research yielded some important implications for system design. Three
examples will now be given.
10.3.1 Reducing complacency
Depending on the assumed causes of complacency, different solutions to the problem
result. Moray (2000) suggested that the failure to detect system malfunctions is due to sub-
10. Discussion
160
optimal sampling of the automated system and the unpredictability of the failures. If this is true,
alarms are the only way to alert the operator and improve the detection of system malfunctions.
Parasuraman et al. (1993) proposed that complacency is associated with reduced attention
allocation to the automated task. The empirical findings of this study supported this view. If
complacency is due to reduced attention allocation to the automated task, systems need to be
designed in a way that system malfunctions can be detected with little expenditure of attentional
resources. This can be achieved through the use of integrated displays (Molloy & Parasuraman,
1994) or ecological designs (Vicente & Rasmussen, 1992). Integrated displays are designed so
that little attention allocation is required in order to process the information they convey. If only
little attentional resources are required, information is more likely to be attended to and
processed. The adaptive implementation of automation periodically returns control to the
operator (either based on a model, performance, workload, or hybrid approaches) and
counteracts the shift in attention allocation strategies (away from the automated task) that occurs
over time when automation is used (Parasuraman, Mouloua, & Molloy, 1996). A
complementary approach to design strategies is training (Metzger et al., 2000). Variable-priority
training has been shown to make attentional strategies more flexible and reduce complacency in
a laboratory study (Metzger et al., 2000). If this would be a viable approach in the real world
remains to be studied, however.
The differential design implications of different theories show the importance of
understanding the underlying mechanisms of human interaction with automation. If systems and
operator training are designed according to the causes of complacency, complacent behavior
could be reduced.
10.3.2 The use of multimodal feedback
The use of multimodal feedback in human-automation interaction has recently attracted a
lot of attention in the literature, even in ATC (Newman & Allendoerfer, 2000), which
traditionally did not use auditory feedback as much as other domains. Based on other research
(e.g. Sklar & Sarter, 1999) it was expected that multimodal feedback could capture and guide
ATCo attention in an increasingly visual environment. This was not the case. Instead,
multimodal feedback had a tendency to disrupt ongoing visual tasks. Therefore, the

10. Discussion
161
implementation of auditory feedback should be used only after careful evaluation of its effects.
In addition to the problem that auditory feedback can become a nuisance (especially with false
alarms), they might actually disrupt ongoing visual tasks by calling attention to the automation
feedback. While traditional alarms usually indicate an immediate problem, decision aids project
further into the future. Therefore, traditional alarms might benefit from an auditory component.
Modern decision aids, however, that leave operators with enough time to respond to critical
situations should make it unnecessary, or even disruptive, to back-up visual with auditory
feedback.
10.3.3 The impact of datalink
Even though the impact of datalink was not the main topic of this work and was not
experimentally manipulated, the results have implications for its expected effects. High traffic
density and the availability of conflict detection automation was associated with increased
attention to the communication tasks performed on the datalink. This additional visual attention
allocated to the datalink display was “borrowed” from the radar display. Voice transmission,
however, allows ATCos to keep visual attention on the radar during communication. Therefore,
datalink, to the extent that it is based on visual information and is not integrated on the radar,
could lead to reduced attention allocation to the radar and the increased risk to miss relevant
information there.
The use of datalink in this study was similar to its use envisioned for the future when
most routine communications will be transmitted by datalink. However, the real world
transmission delays of up to 30 seconds were not present. Waiting times of that order can pose a
heavy burden on ATCo working memory and reduce the time available to maneuver aircraft in
case it becomes necessary. In a study comparing different delay times, mental workload
increased as message transfer delays increased. In addition, increasing aircraft separation was
reported as a strategy to cope with long delay times in a few reports. Therefore, instead of
increasing capacity and efficiency, they were reduced (e.g. Talotta & Cole, 1992a; Talotta &
Cole, 1992b). Hence, the effects of datalink in the present experiments might actually
underestimate the effects of a non-integrated visual datalink display. Although the literature has
found beneficial effects of datalink on working memory load and reduced confusion through

10. Discussion
162
individual addressing of aircraft, reduced attention allocation to the radar and the long delay
times might neutralize these benefits. The potential of datalink to divert attention away from the
radar could be reduced by either integrating the datalink on the radar (e.g. on the datablock) or
the use of synthetic speech. Synthetic speech would allow the ATCos to keep their eyes and
attention on the radar while communicating with potential benefits for the detection of conflicts.
10.4 Limitations of the studies
While the research led to many conclusions and implications, several limitations have to
be pointed out as well. Among the most important is the problem of dealing with ill-defined and
changing concepts such as FF. Exact FF procedures are still not established and the actual
implementation of the concept or its automated systems has not been determined yet. Studying
FF is like chasing a moving target. The challenge is to study and test a concept or an
“envisioned world” (Dekker & Woods, 1999) that does not exist yet and keeps changing as new
findings becomes available. Therefore, specific assumptions on procedures or technology have
to be made even though they might not be the ones eventually implemented (and perhaps so as a
response to unfavorable results of such research). This could reduce the validity of the findings
to the extent that the assumptions are different from the actual implementation. Thus, there is the
challenge to test concepts or systems that are not well established, yet to make predictions about
future concepts early in system development so that modifications to the concept can still be
made. If concepts or systems are tested at later stages of the system development the concepts
and systems might be better defined, but there is the danger that it is too late to implement
changes. Often the human factors researcher is called then to “fix” problems that were not
recognized early on. In the presented research, a rather mature level of FF was assumed to test
the worst-case scenario of FF in which the ATCo’s role will shift from an active decision maker
to a monitor of pilot actions and automation. Also, automation of a particular type was chosen
and implemented in a particular way. However, this might not necessarily be the actual
implementation.
It should also be noted that traffic in the simulation scenarios was not live or recorded
traffic, but traffic created by the researcher with the input of a subject matter expert (i.e. an
ATCo with a background in Human Factors research). In the real world, ATCos can rely on

10. Discussion
163
information stored in long-term memory (e.g. all aircraft flown by Southwest are B737s;
knowledge of airspace and typical traffic patterns). This was not possible in these experiments.
All ATCos could rely on their experience with the airspace from the demonstration and practice
periods only. However, under FF conditions experience with a certain airspace might not play a
large role either. Typical traffic patterns would be given up under FF and ATCos would have to
carefully monitor which routes the pilots decide to take. The pattern could change at any
moment (e.g. due to a change in weather). Therefore, the conditions in the experiment might
resemble those under FF quite closely.
Another issue is whether experience and learning could reduce the negative impact of FF.
Perhaps ATCos who were all trained to operate under current conditions would get used to the
new system. Hilburn and Parasuraman (1997) did not find any negative effects of FF in British
military ATCos who already work in a system similar to FF. Perhaps experience and training
could remedy some of the negative effects associated with FF. However, if this also applies to
the impact of automation inaccuracies needs to be studied. ATCos were not much more
succesful in detecting the automation failure the second time around. Most ATCos (except for
three) either detected the failure both times or not at all.
In the presented studies, taskload was manipulated by the number of aircraft in the sector.
While the number of aircraft is a major contributor to mental workload under FF conditions, it is
not the only one. Conflict geometries, the proportion of climbing or descending to level aircraft,
the percentage of aircraft flying at significantly lower speeds than other aircraft and many other
factors can affect ATCo mental workload. Research on dynamic density and airspace
complexity (Mogford et al., 1994; Mogford et al., 1995; Laudeman et al., 1998; Wyndemere,
1996) is trying to establish the factors that determine ATCo mental workload under FF
conditions. However, this was not central to the thesis and the number of aircraft was used to
manipulate taskload.
Benefits and costs of automation in the real system will depend among other factors on
the implementation of the particular decision aid. For example, if a large amount of cognitive
overhead is involved in engaging the automation it might not be used and therefore not improve
performance or reduce mental workload (Parasuraman & Riley, 1997; Kirlik, 1993; Wiener &
Curry, 1980). The implementation of automation in this study was simple (e.g. it did not require
any cognitive overhead to engage it) and integrated on the primary radar display, but system

10. Discussion
164
designers may choose other ways of implementing a conflict detection aid. In fact, URET, the
aid chosen by the FAA is being implemented an a separate tabular display. Such an
implementation might have different benefits and costs than the ones found in this study.
However, it should be emphasized that the particular human-computer interface was not of
interest in this study. Rather, the goal was to identify more general issues of the implementation
of automation into the ATC and other systems.
10.5 Future directions for research
Several issues for future research were already described. Additional topics in need of
further investigation will now be covered.
According to the model of types and levels of automation (Parasuraman et al., 2000),
decision-making can be aided at different stages of information-processing and at different
levels. The aid used in these experiments supported ATCos in data integration and analysis at a
relatively high level. As discussed above, the aid was associated with benefits, but also costs
when the aid failed. Research on the effects of automation is ambiguous. While some
researchers have found positive effects of automation (e.g. on maintaining situation awareness),
others have found negative effects. Recently, the application of the model of types and levels of
automation has shown some promise for the more reliable prediction of costs and benefits of
automation. For example, automation of information acquisition or analysis can lead to
attentional tunneling. When a soldier's attention is directed to a specific target location he or she
is less likely to detect uncued higher-priority threats elsewhere than if no cueing was provided
(e.g. Yeh & Wickens, 2000). So-called "action-tunneling" (Wickens, 2000) could occur if an
action recommended by a decision aid is executed while an alternative better action that is not
recommended is overlooked. It could be speculated that automation-related complacency would
be stronger the more advanced the type of automation is because the operator is further removed
from the decision-making process the higher the type of automation. For example, it could be
hypothesized that operators are less likely to become complacent when information analysis
rather than action implementation is automated.

10. Discussion
165
However, further research is needed, to study what the specific consequences of each
type and level of automation on different aspects of performance are. There is a need for studies
that directly compare the impact of different types and levels of automation to elucidate the
mechanisms of human-interaction with automation and to better predict the specific costs of
automation. Eventually, this would allow to make system design recommendations. It should
also be noted that the model of types and levels of automation does not just apply to ATC, but to
all automated systems (e.g. medical, maritime, space, cockpit, vehicle systems) in which
advanced decision aiding is introduced.
A more fundamental question is whether to automate the decision process, especially if it
is associated with high risk as in ATC, medical and other systems. Alternatively, routine actions
such as handing-off aicraft could be supported by automation. Based on the empirical findings
and discussions with ATCos, routine tasks such as communication and coordination represent a
large taskload especially as traffic density increases. Supporting ATCos in these functions has
the potential to reduce mental workload considerably and free resources that could be allocated
to functions that bear higher risks.
An issue associated with FF is mixed equipage. While it was assumed that all aircraft
participated in FF in the described simulation experiments, this will not be the case in the real
world. During a transition phase only few aircraft will be fully equipped to participate in FF
(e.g. with CDTI, TCAS, GPS, etc.), while most others will require the ATCo's attention similar
to current conditions. As more aircraft are equipped, this proportion will change. However,
there will always be some aircraft that require the ATCo's attention similar to current conditions
while others are allowed to maneuver freely and require the ATCo's attention only in cases when
airborne separation fails. It remains to be studied whether ATCos will be able to detect and
resolve conflicts among FF aircraft and among FF and non-FF aircraft if their role is to only
monitor separation assurance and act as a back-up to the pilots.
Technology is moving from automating low to higher-order cognitive functions such as
decision-making or planning. In the future, there will most likely be several highly complex
automated systems within a system such as the ATCo’s workplace some of them coupled to each
other. System safety will depend to a large part on the appropriate integration of these systems.
The appropriate integration and the assessment of these systems in human-in-the-loop studies is

10. Discussion
166
important to avoid unexpected and negative effects from the interaction between different
systems.
Last, but not least, the effects of automation do not only depend on the individual
operator's performance. The effects of automation are determined at many levels, among them
team, management, or organizational levels (Reason, 1990). If the management institutes a
policy with regard to the use of automation, for example that the automation cannot be overruled
and the operator is not free to choose between manual and automated modes of operation as in
the tragic accident involvement of a commuter train (Parasuraman & Riley, 1997; Jenner 2000)
or the policy that pilots are required to follow a TCAS alert, the management is at least partially
responsible for the outcome of the operator's interaction with the automation. Managers need to
be educated about the immediate impact of their policies or actions on system safety even though
they might be far removed from the actual process. The ultimate decision to use or not to use
automation should be made by the operator.
Individual and cultural differences in human interaction with automation have also been
noted although research on this issue is scarce (Wickens et al., 1998a). In the same way that
humans in different cultures interact with each other differently, humans in different cultures
could interact with automation differently. This analogy is particularly appropriate as
automation becomes more human-like in its capabilities. Apart from the fact that it is not known
how individual or cultural factors should affect system design, it would be too costly to design
large systems for different cultures or even individuals. It should be possible, however, to make
systems adaptable to user preferences or abilities. Moreover, a better understanding of
differences in human interaction with automation could guide the design of training curricula.
Similar to the way crews are trained to interact with each other (crew resource management
training; Wiener, Kanki, & Helmreich, 1993), training curricula could be developed for effective
interaction with automation.
10.6 Conclusion
The introduction of automation into future aviation systems is advancing fast, much
faster than the research. Even though the implementation of automated decision aids in future
ATM and other systems is immediately imminent, still little is known about the consequences for

10. Discussion
167
operator performance, mental workload, and ultimately system performance and safety. The
described research provided first empirical evidence on the impact of automated decision aids on
future ATM. The numerous benefits of automation did not come without a cost when the
automation became inaccurate. However, this is not to say that advanced decision aids should
not be implemented in high-risk systems like ATC or others. Automation has brought
innumerable benefits and has become indispensable in many domains. Rather, this thesis
advocates the need for a better understanding of the capabilities and limitations of humans in
their interactions with automation. If safety is not to be compromised, the impact of automation
needs to be understood. The gained knowledge can then be applied to the design of systems that
complement the human operator. The goal is to take advantage of the benefits of automation
while minimizing the cost on human performance and system safety.

11. References
168
11. References
Aasman, J., Mulder, G., & Mulder, L. J. M. (1987). Operator effort and the measurement
of heart-rate variability. Human Factors, 29, 161-170.
Arad, B. A. (1964). The control load and sector design. Journal of ATC, May, 12-31.
Arthur, W., Jr., Bennett, W., Jr., Stanush, P.L. and McNelly, T.L. (1998). Factors that
influence skill decay and retention: a quantitative review and analysis. Human Performance, 11,
57-101.
ASL (1999). Eyenal [Software program]. Bedford, MA: Author.
Attneave F. (1959). Applications of information theory to psychology: A summary of
basic concepts, methods, and results. New York, NY: Holt, Rinehart & Winston.
Aviation Week & Space Technology (1998). Answers to the gridlock. February 2, pp.
42-62.
Backs, R. W. & Boucsein, W. (2000). Engineering psychophysiology. Mahwah, NJ:
Lawrence Erlbaum Associates.
Bainbridge, L. (1983). Ironies of automation. Automatica, 19, 775-779.
Ball, M., DeArmon, J. S., & Pyburn, J. O. (1995). Is free flight feasible? Results from
initial simulations. Journal of ATC, 1, 14-17.
Barrer, J. N. (1982). Testing of workload probe models. MITRE Memo No. W41-
M6071. McLean, VA: Mitre.
11. References
169
Becker, W. (1991). Saccades. In R. H. S. Carpenter (Ed.), Eye movements (pp. 95-137),
Boca Raton, FL: Macmillan.
Begault, D. R., & Pittman, M. T. (1996). Three-Dimensional Audio Versus Head-Down
Traffic Alert and Collision Avoidance System Displays. International Journal of Aviation
Psychology, 6, 79-93.
Bellenkes, A. H., Wickens, C. D., & Kramer, A. F. (1997). Visual scanning and pilot
expertise: The role of attentional flexibility and mental model development. Aviation, Space,
and Environmental Medicine, 68, 7, 569-579.
Biers, D. W. & McInerney, P. (1988). An alternative to measuring workload: Use of
SWAT without the card sort. In Proceedings of the Human Factors and Ergonomics Society 32nd
Annual Meeting (pp. 1136-1139). Santa Monica, CA: HFES.
Bilimoria, K.D. (1998). A methodology for the performance evaluation of a conflict
probe. Presented at AIAA Guidance, Navigation, and Control Conference, Boston, August 10-
12. Report No. AIAA-98-4238. Reston, VA: American Institute of Aeronautics and
Astronautics.
Billings, C. E. (1997). Aviation automation: The search for a human-centered approach.
Mahwah, NJ: Lawrence Erlbaum Associates.
Billings, C. E., Lauber, J. K., Funkhouser, H., Lyman, G., & Huff, E. M. (1976). NASA
Aviation Safety Reporting System (Technical Report TM-X-3445). Moffett Field, CA: NASA
Ames Research Center.
Bortz, J. & Döring, N. (1999). Forschungsmethoden und Evaluation für
Sozialwissenschaftler (2nd Edition). Berlin: Springer.

11. References
170
Boucsein, W. (1991). Arbeitspsychologische Beanspruchungsforschung heute – eine
Herausforderung an die Psychophysiologie. Psychologische Rundschau, 42, 129-144.
Brickman, B. J., Hettinger, L. J., & Haas, M. W. (2000). Multisensory interface design
for complex task domains: Replacing information overload with meaning in tactical crew
stations. The International Journal of Aviation Psychology, 10, 273-290.
Broadbent, D. E. (1958). Perception and communication. Oxford, England, UK: Oxford
University Press.
Brookings, J. B., Wilson, G. F., & Swain, C. R. (1996). Psychophysiological responses
to changes in workload during simulated air traffic control. Biological Psychology, 42, 361-377.
Brown, I. D. & Poulton, E. C. (1961). Measuring the spare mental capacity of car drivers
by a subsidiary task. Ergonomics, 4, 35-40.
Brudnicki, D. J. & McFarland, A. L. (1997). User request evaluation tool (URET)
conflict probe performance and benefits assessment (Technical report). McLean, VA: MITRE.
Byers, J. C., Bittner, A. C., & Hill, S. G. (1989). Traditional and raw Task Load Index
(TLX) correlations: Are paired comparisons necessary? In A. Mital (Ed.), Advances in industrial
ergonomics and safety I (pp. 481-485). London: Taylor & Francis.
Byrne, E.A. (1994a). CSLacq [Computer software]. Washington, DC: Cognitive
Science Lab.
Byrne, E. A. (1994b). CSLstat [Computer software]. Washington, DC: Cognitive Science
Laboratory, The Catholic University of America (Version 1.07).
11. References
171
Byrne, E. A., Chun, K., & Parasuraman, R. (1995). Differential sensitivity of heart rate
and heart rate variability as indices of mental workload in a multi-task environment. Proceedings
of the 8th International Symposium on Aviation Psychology (pp. 881-885). Columbus, OH: Ohio
State University.
Byrne, E. A. & Parasuraman, R. (1996). Psychophysiology and adaptive automation.
Biological Psychology,42, 249-268.
Cale, M. L., Paglione, M., Ryan, H., Timotea, D. & Oaks, R. (1998). User request
evaluation tool (URET) conflict prediction accuracy report (Technical report DOT/FAA/CT-
TN98/8). Atlantic City International Airport, NJ: FAA Technical Center.
Callan, D. J. (1998). Eye movement relationships to excessive performance error in
aviation. Proceedings of the Human Factors and Ergonomics Society 42nd Annual Meeting (pp.
1132-1136). Santa Monica, CA: HFES.
Castaño, D. & Parasuraman, R. (1999). Manipulation of pilot intent under free flight: a
prelude to not-so-free flight. Proceedings of the Tenth International Symposium on Aviation
Psychology (pp. 170-176). Columbus, OH: Ohio State University.
Cohen, J. (1994). The earth is round (p < .05). American Psychologist, 49, 997-1003.
Cooper, G. E. (1957). Understanding and interpreting pilot opinion. Aeronautical
Engineering Review, 16, 47-51.
Cooper, G. E. & Harper, R. P. (1969). The use of pilot rating in the evaluation of aircraft
handling qualities (Technical report NASA-TN-D-5153). Washington, D.C.: National
Aeronautics and Space Administration.
Corker, K., Fleming, K., & Lane, J. (1999). Measuring controller reactions to free flight
in a complex transition sector. Journal of ATC, 4, 9-16.

11. References
172
Corker, K. (2000). Cognitive models and control: Human and system dynamics in
advanced airspace operations. In N. B. Sarter and R. Amalberti (Eds.), Cognitive Engineering in
the Aviation Domain (pp. 13-42). Mahwah, NJ: LEA.
Dekker, S. W. A. & Woods, D. D. (1999). To Intervene or not to Intervene: The
Dilemma of Management by Exception. Cognition, Technology and Work, 1, 86-96.
Deutsch, J. A. & Deutsch, D. (1963). Attention: Some theoretical considerations.
Psychological review, 70, 80-90.
Duley, J. A., Westerman, S., Molloy, R., & Parasuraman, R. (1997). Effects of display
superimposition on monitoring of automation. Proceedings of Ninth International Symposium
on Aviation Psychology (pp. 322-328). Columbus, OH: Ohio State University.
Dunbar, M., Cashion, P., McGann, A., Macintosh, M.-A., Dulchinos, Jara, D., & Jordan,
K. (1999). Air-ground integration issues in a self-separation environment. In Proceedings of the
10th International Symposium on Aviation Psychology (pp. 183-189). Columbus, OH: Ohio State
University.
Dzindolet, M. T., Pierce, L. G., Dawe, L. A., Peterson, S. A. & Beck, H. P. (2000).
Building trust in automation. Proceedings of the Human Performance, Situation Awareness, and
Automation Conference: User-Centered Design for the New Millenium (pp. 63-69). Marietta,
GA: SA Technologies.
Egelund, N (1982). Spectral analysis of heart rate variability as an indicator of driver
fatigue. Ergonomics, 25, 663-672.
Eggemeier, F. T. & Wilson, G. F. (1991). Performance-based and subjective assessment
of workload in multi-task environments. In D. L. Damos (Ed.), Multiple-task performance.
Washington, D.C.: Taylor and Francis.

11. References
173
Ellis, S. R. & Stark, L. (1986). Statistical dependency in visual scanning. Human
Factors, 28, 4, 421-438.
Endsley, M. R. (1996). Automation and situation awareness. In R. Parasuraman & M.
Mouloua (Eds.), Automation and Human Performance: Theory and Applications (pp. 163-181).
Mahwah, NJ: Lawrence Erlbaum Associates.
Endsley, M. R. & Kiris, E. O. (1995). The out-of-the-loop performance problem and
level of control in automation. Human Factors, 37, 381-394.
Endsley, M. R. & Rodgers, M. D. (1998). Distribution of attention, situation awareness
and workload in a passive ATC task: Implications for operational errors and automation. Air
Traffic Control Quarterly, 6, 1, 21-44.
Endsley, M. R., Mogford, R. H., Allendoerfer, K. R., Snyder, M. D., & Stein, E.S.
(1997). Effect of free flight conditions on controller performance, workload, and situation
awareness (DOT/FAA/CT-TN97/12). Atlantic City International Airport: Federal Aviation
Administration William J. Hughes Technical Center.
Erzberger, H., B. D., McNally, D., Foster, M., Chiu, D., & Stassart, P. (1999). Direct-To
Tool for En Route Controllers, ATM '99: IEEE Workshop on Advanced Technologies and their
Impact on Air Traffic Management in the 21st Century. Available: http://www.ctas.arc.nasa.gov
Eurocontrol (1998). Operational concept document. Brussels, Belgium: Author.
FAA Human Factors Team (1996). The interface between flightcrews and modern flight
deck systems. Washington, D. C.: Author
FAA (1997). ATS Concept of Operations for the National Airspace System in 2005.
Department of Transportation, Federal Aviation Administration. Washington, D.C.: Author.

11. References
174
FAA (2000). FAA Strategic plan. Washington, DC: Author. Available:
http://api.hq.faa.gov/sp00/sp2000.htm
Farrell, S. & Lewandowsky, S. (2000). A connectionist model of complacency and
adaptive recovery under automation. Journal of Experimental Psychology: Learning, Memory,
and Cognition, 26, 2, 395-410.
Fitts, P. M., Jones, R. E., & Milton, J. L. (1950). Eye movements of aircraft pilots during
instrument landing approaches. Aeronautical Engineering Review, 9, 24-29.
Fowler, F. D. (1980). Air traffic control problems: a pilot's view. Human Factors, 22,
645-653.
Frankmann, J. P. & Adams, J. A. (1962). Theories of vigilance. Psychological Bulletin,
59, 257-272.
Galster, S. M. (1998). Effects of aircraft self-separation on controller conflict detection
performance and workload in mature free flight. Unpublished Master's thesis. Washington,
D.C.: The Catholic University of America.
Galster, S. M., Duley, J. A., Masalonis, A. J., & Parasuraman, R. (2001). Air traffic
controller performance and workload under mature Free Flight: Conflict detection and resolution
of aircraft self-separation. International Journal of Aviation Psychology, 11, 71-93.
Garner, W. R. (1962). Uncertainty and structure as psychological concepts. New York,
NY: Wiley.
Goldberg, M. E. (2000). The control of gaze. In E. Kandel, J. H. Schwartz, & T. M.
Jessell (Eds.), Principles of Neural Science (4th Ed., pp. 782-800). New York: McGraw-Hill.

11. References
175
Gopher, D. (1996). Attention control: explorations of the work of an executive
controller. Cognitive Brain Research, 5, 23-38.
Gopher, D., Weil M. & Siegel, D. (1989). Practice under changing priorities: An
approach to the training of complex skills. Acta Psychologica, 71, 147-177.
Hadley, J., Sollenberger, R., D'Arcy, J.-F., & Bassett, P. (2000). Interfacility boundary
adjustment. (Technical report DOT/FAA/CT-TN00/06). Atlantic City International Airport, NJ:
FAA Technical Center.
Harris, R. L., Tole, J. R., Stephens, A. T., & Ephrath, A. R. (1982). Visual scanning
behavior and pilot workload. Aviation, Space, and Environmental Medicine, 53, 1067-1072.
Harris, R. L., Glover, B. J., & Spady, A. A. (1986). Analytical techniques of pilot
scanning behavior and their application (NASA Technical Paper 2525). Washington, D.C.:
NASA.
Hart, S. G. (1975). Time estimation as a secondary task to measure workload. In
Proceedings of the Annual Conference on Manual Control (Report No. NASA TM X-62, 464,
pp. 64-77). Washington, DC: US Government Printing Office.
Hart, S. G. & Staveland, L. E. (1988). Development of NASA-TLX (Task Load Index):
Results of empirical and theoretical research. In P. A. Hancock & N. Meshkati (Eds.), Human
mental workload (pp. 139-183). Amsterdam: North-Holland.
Harwood, K., Sanford, B. D. & Lee, K. K. (1998). Developing ATC automation in the
field: It pays to get your hands dirty. Air Traffic Control Quarterly, 6, 1, 45-70.
Hilburn, B. G. (1996). The impact of advanced decision aiding automation on mental
workload and human-machine system performance. Unpublished Dissertation. Washington,
D.C.: The Catholic University of America.

11. References
176
Hilburn, B. G., & Parasuraman, R. (1997). Free flight: Military controllers as an
appropriate population for evaluation of advanced ATM concepts. In Proceedings of the 10th
International CEAS Conference on Free Flight. Amsterdam: CEAS.
Hilburn, B. G., Bakker, M. W. P., Pekela, W. D., & Parasuraman, R. (1997). The effect
of free flight on air traffic controller mental workload, monitoring, and system performance. In
Proceedings of the 10th International CEAS Conference on Free Flight (pp. 14-1-14-12).
Amsterdam: Confederation of European Aerospace Societies.
Hill, S. G., Iavecchia, H. P., Byers, J. C., Bittner, A. C., Zakland, A. L., & Christ, R. E.
(1992). Comparison of four subjective workload rating scales. Human Factors, 34, 429-439.
Hoffman, J. E. (1998). Visual attention and eye movements. In H. E. Pashler (Ed.),
Attention. Hove, East Sussex, UK: Psychology Press.
Hopkin, V. D. (1999). Human factors in air traffic control. London: Taylor and Francis.
Huey, B. M. & Wickens, C. D. (1993). Workload transitions: Implications for individual
and team performance. Washington, D.C.: National Academy Press.
Human Solutions (1999). Human factors action plan for Free Flight Phase One.
Washington, DC: FAA Free Flight Phase One Program Office.
ICAO (1993). Human Factors in air traffic control. ICAO-Circular 241-AN/145.
Montreal, Canada: ICAO.
Inagaki, T. (1999). Situation-adaptive autonomy: Trading control of authority in human-
machine systems. In M.W. Scerbo & M. Mouloua (Eds.), Automation technology and human
performance: Current research and trends (pp. 154-158). Mahwah, NJ: Lawrence Erlbaum
Associates.

11. References
177
Isreal, J. B., Wickens, C. D., Chesney, G. L. & Donchin, E. (1980). The event-related
brainpotential as an index of display-monitoring workload. Human Factors, 22, 211-224.
Jenner, S. M. (2000). The role of automation in the collision on Washington’s rapid
transit system. Proceedings of the Human Performance, Situation Awareness, and Automation
Conference: User-Centered Design for the New Millennium (p. 34-39). Marietta, GA: SA
Technologies.
Jorna, P. G. M. A. (1992). Spectral analysis of heart rate and psychological state: A
review of its validity as a workload index. Biological Psychology, 34, 237-257.
Kahneman, D. (1973). Attention and effort. Englewood Cliffs, NJ: Prentice-Hall.
Kalsbeek, J. W. H. (1971). Standards of acceptable load in ATC tasks. Ergonomics, 14,
5, 641-650.
Kantowitz, B. H., Bortolussi, M. R., & Hart, S. G. (1987). Measuring workload in a
motion base simulator: III. Synchronous secondary task. In Proceedings of the 31st Annual
Meeting of the Human Factors Society (pp. 834-837). Santa Monica, CA: Human Factors and
Ergonomics Society.
Kantowitz, B. H., Hart, S. G., & Bortolussi, M. R. (1983). Measuring pilot workload in a
moving-based simulator: I. Asynchronous secondary choice-reaction task. In Proceedings of the
27th Annual Meeting of the Human Factors Society (pp. 319-322), Santa Monica, CA: Human
Factors and Ergonomics Society.
Kantowitz, B. H., Hart, S. G., Bortolussi, M. R., Shively, & Kantowitz, (1984).
Measuring pilot workload in a moving-based simulator: II. Building levels of load. In
Proceedings of the Annual Conference on Manual Control, 20, 359-372.
11. References
178
Karsten, G., Goldberg, B., Rood, R. & Sultzer, R. (1975). Oculomotor measurement of
air traffic controller visual attention (FAA-NA-74-61). Atlantic City International Airport, NJ:
DOT/FAA Technical Center.
Kasarskis, P., Stehwien, J., Hickox, J., Arentz, A., & Wickens, C. D. (2001).
Comparison of expert and novice scan behaviors during VFR flight. Proceedings of the 11th
International Symposium on Aviation Psychology. Columbus, OH: Ohio State University.
Kirlik, A. (1993). Modeling strategic behavior in human-automation interaction: why an
aid can (and should) go unused. Human Factors, 35, 221-242.
Kramer, A. F. (1991). Physiological metrics of mental workload: A review of recent
progress. In D. L. Damos (Ed.), Multiple-task performance. Washington, D.C.: Taylor and
Francis.
Kramer, A. F., Larish, J. L., Weber, T. A., & Bardell, L. (1999). Training for executive
control: Task coordination strategies and aging. In D. Gopher & A. Koriat (Eds.), Attention and
Performance XVII Cognitive Regulation of Performance: Interaction of theory and application
(pp. 617-652). Cambridge, MA: MIT Press.
Kramer, A., Tham, M., Konrad, C., Wickens, C., Lintern, G., Marsh, R., Fox, J., &
Merwin, D. (1994). Instrument scan and pilot expertise. Proceedings of the Human Factors and
Ergonomics Society 38th Annual Meeting. Santa Monica, CA: HFES.
Lamoureux, T. (1999). The influence of aircraft proximity data on the subjective mental
workload of controllers on the air traffic control task. Ergonomics, 42, 11, 1482-1491.
Laudeman, I.V., Shelden S.G., Branstrom, R., & Brasil, C.L. (1998) Dynamic Density:
an air traffic management metric (NASA-TM-1998-112226). Moffett Field, CA: NASA Ames
Research Center.

11. References
179
Lee, J. D., & Moray, N. (1992). Trust, control strategies and allocation of function in
human-machine systems. Ergonomics, 35, 1243-1270.
Lee, J. D., & Moray, N. (1994). Trust, self-confidence, and operators’ adaptation to
automation. International Journal of Human-Computer Studies, 40, 153-184.,
Lee, J. D. & Sanquist, T. (1996). Maritime automation. R. Parasuraman & M. Mouloua
(Eds.), Automation and Human Performance: Theory and Applications (pp. 365-384). Mahwah,
NJ: Lawrence Erlbaum Associates.
Lind, A. T. (1993). Two simulation studies of precision runway monitoring of
independent approaches to closely spaced parallel runways (DOT/FAA/NR-92/9). Lexington,
MA: Lincoln Laboratory.
Luffsey, W. S. (1990). Air traffic control: How to become an air traffic controller. New
York: Random House.
Lozito, S., McGann, A., Mackintosh, M., & Cashion, P. (1997). Free flight and self-
separations from the flight deck perspective. Paper presented at The First United
States/European Air Traffic Management Research and Development Seminar, Saclay, France.
Mackworth, N. H. (1948). The breakdown of vigilance during prolonged visual search.
Quarterly Journal of Experimental Psychology, 1, 6-21.
Mackworth, N. H. (1950). Researches on the measurement of human performance.
(Medical Research Council Special Report Series 268). London: His Majesty’s Stationery
Office.
Mackworth. N. H. & Kaplan, I. T. (1964). Eye movements during vigilance. Perceptual
and Motor Skills, 18, 397-402.

11. References
180
Manzey, D. (1998). Psychophysiologie mentaler Beanspruchung. In F. Rösler (Ed.),
Enzyklopädie der Psychologie: Themenbereich C: Theorie und Forschung, Serie 1: Biologische
Psychologie, Band 5: Ergebnisse und Anwendungen der Psychophysiologie. Göttingen:
Hogrefe.
Masalonis, A. J. (1999). Effects of situations-specific reliability on trust and usage of
automated decision aids. Unpublished dissertation. Washington, DC: The Catholic University
of America.
Masalonis, A. J., Le, M. A., Klinge, J. C., Galster, S. M., Duley, J. A., Hancock, P. A.,
Hilburn, B. G., & Parasuraman, R. (1997). Air traffic control workstation mock-up for Free
Flight experimentation: Lab development and capabilities. Proceedings of Human Factors &
Ergonomics Society 41st Annual Meeting (pp. 1379). Santa Monica, CA: HFES.
Masalonis, A.J., Duley, J.A., Galster, S.M., Castaño, D.J., Metzger, U., & Parasuraman,
R. (1998). Air traffic controller trust in a conflict probe during Free Flight. Proceedings of
Human Factors & Ergonomics Society 42nd Annual Meeting, (p. 1601). Santa Monica, CA:
HFES.
May, P. A., Molloy, R. J., & Parasuraman, R. (1993). Effects of automation reliability
and failure rate on monitoring performance in a multi-task environment. Technical Report.
Washington, D.C.: Cognitive Science Laboratory, The Catholic University of America.
McNally, B. D., Bach, R. E. & Chan, W. (1998). Field test evaluation of the CTAS
conflict prediction and trial planning capability. Boston MA: American Institute of Aeronautics
and Astronautics Guidance, Navigation, and Control.
Meshkati, N. (1988). Heart rate variability and mental workload assessment. In P. A.
Hancock & N. Meshkati (Eds.), Human mental workload (pp. 101-115). Amsterdam: North-
Holland.

11. References
181
Metzger, U., Duley, J. A., Abbas, R., & Parasuraman, R. (2000). Effects of variable-
priority training on automation-related complacency: Performance and eye movements.
Proceedings of the 14th Triennial Congress of the International Ergonomics Association and the
44th Annual Meeting of the Human Factors and Ergonomics Society (pp. 2-346-349). Santa
Monica, CA: HFES.
Metzger, U. & Parasuraman, R. (1999). Free Flight and the air traffic controller: Active
Control versus Passive Monitoring. Proceedings of the Human Factors & Ergonomics Society
43rd Annual Meeting (pp. 1-5). Santa Monica, CA: HFES.
Metzger, U. & Parasuraman, R. (in press). The role of the air traffic controller in future
air traffic management: An empirical study of active control versus passive monitoring. Human
Factors.
Meyer, J. & Bitan, Y. (in press). Why better operators receive worse warnings. Human
Factors.
Michon, J. A. (1966). Tapping regularity as a measure of perceptual motor load,
Ergonomics, 9, 401-412.
Mogford, R. & Tansley, B. W. (1991). Studies of the air traffic controller’s mental
model. Paper presented at the annual meeting of the Canadian Human Factors Association,
Vancouver, B.C., August 27, 1991.
Mogford, R. H., Murphy, E. D. and J. A. Guttman (1994). Using Knowledge Exploration
Tools to Study Airspace Complexity in Air Traffic Control. The International Journal of
Aviation Psychology, 4, 29-45.
Mogford, R. H., Guttman, J. A., Morrow, S. L., and Kopardekar, P. (1995). The
complexity construct in air traffic control: A review and synthesis of the literature. (Report No.
DOT/FAA/CT-TN95/22). Atlantic City International Airport, N. J.: FAA Technical Center

11. References
182
Molloy, R. & Parasuraman, R. (1994). Automation-induced monitoring inefficiency: The
role of display integration and redundant color coding. In M. Mouloua & R. Parasuraman (Eds.)
Human performance in automated systems: Current research and trends (pp. 224-228).
Hillsdale, NJ: Erlbaum.
Molloy, R. & Parasuraman, R. (1996). Monitoring an automated system for a single
failure: Vigilance and task complexity effects. Human Factors, 38, 311-322.
Molloy, R., Deaton, J. & Parasuraman, R. (1995). Monitoring performance with the
EMACS display. Proceedings of the 8th International Symposium on Aviation Psychology (pp.
68-71). Columbus, OH: Ohio State University.
Moray, N. (1967). Where is capacity limited: A survey and a model. Acta Psychologica,
27, 84-92.
Moray, N. (1986). Monitoring behavior and supervisory control. In K. R. Boff & L.
Kaufman (Eds.), Handbook of perception and human performance. Vol. 2: Cognitive processes
and performance. New York: John Wiley & Sons.
Moray, N. (2000). Are observers really complacent when monitoring automated
systems? Proceedings of the 14th Triennial Congress of the International Ergonomics
Association and the 44th Annual Meeting of the Human Factors and Ergonomics Society (pp. 1-
592-595). Santa Monica, CA: HFES.
Morphew, M. E. & Wickens, C. D. (1998). Pilot performance and workload using traffic
displays to support Free Flight. In Proceedings of the Human Factors and Ergonomics Society
42nd Annual Meeting (pp. 52-56). Santa Monica: HFES.
Morrison, R., & Wright, R.H. (1989). ATC control and communications problems: An
overview of recent ASRS data. In R. S. Jensen (Ed.,) Proceedings of the Fifth International
Symposium of Aviation Psychology (pp. 902-907), Columbus, OH: Ohio State University.
11. References
183
Morrow, D., Rodvold, M., & Lee, A. (1994). Nonroutine transactions in controller-pilot
communication. Discourse processes, 17, 235-258.
Mosier, K. L., Skitka, L. J., & Korte, K. J. (1994). Cognitive and social psychological
issues in flight crew-automation interaction. In M. Mouloua and R. Parasuraman (Eds.), Human
performance in automated systems: Current research and trends (pp. 191-197). Hillsdale, NJ:
Lawrence Erlbaum Associates.
Mosier K. L. & Skitka, L. J. (1996). Human decision-makers and automated decision
aids: Made for each other? In R. Parasuraman & M. Mouloua (Eds.), Automation and Human
Performance: Theory and Applications (pp. 201-220). Mahwah, NJ: Lawrence Erlbaum
Associates.
Mosier, K. L., Skitka, L. J., Heers, S., & Burdick, M. (1998). Automation bias: decision
making and performance in high-tech cockpits. The International Journal of Aviation
Psychology, 8, 47-63.
Mundra, A. (1989). A new automation aid to air traffic controllers for improving airport
capacity. (MP-89W00034). McLean, VA: The MITRE Corporation.
Mundra, A. & Levin, K. M. (1990). Developing automation for terminal air traffic
control: Case study of the imaging aid (MP90W0029). McLean, VA: The MITRE Corporation.
NASA Ames Research Center (1986). NASA Task Load Index (TLX): Paper and Pencil
Version. Moffett Field, CA: NASA Ames Research Center Aerospace Human Factors Research
Division.
National Transportation Safety Board (1973). Eastern Airlines L-1011, Miami Florida,
20 December 1972 (Rep. NTSB-AAR-73-14). Washington, DC: Author.

11. References
184
National Transportation Safety Board (1997). Grounding of the Panamanian passenger
ship Royal Majesty on Rose and Crown shoal near Nantucket, Massachusetts, June 10, 1995
(Rep. NTSB/MAR-97-01). Washington, DC: Author.
Navon, D. (1984). Resources – A theoretical soupstone? Psychological Review, 91, 216-
234.
Neumann, O. (1985). Die Hypothese begrenzter Kapazität und die Funktionen der
Aufmerksamkeit. In O. Neumann (Ed.), Perspektiven der Kognitionspsychologie. Berlin:
Springer.
Neumann, O. (1996). Theories of attention. In O. Neumann & A.F. Sanders (Eds.),
Handbook of perception and action, Vol. 3: Attention. (pp. 389-446). London: Academic Press.
Newman, R. A. & Allendoerfer, K. (2000). Assessment of current and proposed audio
alarms in terminal air traffic control (Technical report). Atlantic City International Airport, NJ:
FAA Technical Center.
Nijhuis, H. B. (1994). A study into the consequences of data-link for the mental
workload of the air traffic controller. Technical report (PHARE - Programme for harmonised air
traffic management research in Eurocontrol). Brussels, Belgium: Eurocontrol.
Nolan, M. S. (1990). Fundamentals of air traffic control. Belmont, CA: Wadsworth.
Norman, D. & Bobrow, D. J. (1975). On data and resource limited processes. Cognitive
Psychology, 7, 44-66.
Norman, D. A. (1990). The "problem" of automation: Inappropriate feedback and
interaction, not "over-automation." Philosophical Transactions of the Royal Society of London,
B. 327, 585-593.
11. References
185
Nygren, T. E. (1991). Psychometric properties of subjective workload measurement
techniques: Implications for their use in the assessment of perceived mental workload. Human
Factors, 33, 17-31.
O’Donnell, R. D. & Eggemeier, F. T. (1986). Workload assessment methodology. In J.
R. Boff, L. Kaufman, & J. P. Thomas (Eds.), Handbook of human perception and performance,
Vol. II. Cognitive processes and performance (pp. 41-1-42-49). New York, NY: Wiley.
Palmer, S. E. (1998). Vision Science. Cambridge, MA: MIT Press.
Parasuraman, R. (1979). Memory load and event rate control sensitivity decrement in
sustained attention. Science, 205, 924-927.
Parasuraman, R. (1990). Event-related brain potentials and human factors research. In
Rohrbaugh, J. W. and Parasuraman, R. (Eds.), Event-related brain potentials: Basic issues and
applications. (pp. 279-300). New York, NY, USA: Oxford University Press.
Parasuraman, R. (Ed.) (1998). The attentive brain. Cambridge, MA: MIT Press.
Parasuraman, R. (2000). Designing automation for human use: empirical studies and
quantitative models. Ergonomics, 43, 7, 931-951.
Parasuraman, R, Bahri, T., Deaton, J.E., Morrision, J.G., & Barnes, M. (1992). Theory
and design of adaptive automation in aviation systems. Progress Report No. NAWCADWAR-
92033-60. Warminster, PA: Naval Air Warfare Center, Aircraft Division.
Parasuraman, R., Molloy, R. & Singh, I. L. (1993). Performance consequences of
automation-induced “complacency”. International Journal of Aviation Psychology, 3 (1), 1-23.

11. References
186
Parasuraman, R., Mouloua, M., Molloy, R., Hilburn, B. (1996). Monitoring of automated
systems. In Parasuraman, R. & Mouloua, M. (Eds.), Automation and human performance:
Theory and applications. (pp. 91-115). Mahwah, NJ, USA: Lawrence Erlbaum Associates.
Parasuraman, R. & Mouloua, M. (1996) (Eds.). Automation and human performance:
Theory and applications. Mahwah, NJ: Lawrence Erlbaum Associates.
Parasuraman, R., Mouloua, M., & Molloy, R. (1996). Effects of adaptive task allocation
on monitoring of automated systems. Human Factors, 38(4), 665-679.
Parasuraman, R., Hancock, P. A., & Olofinboba, O. (1997). Alarm effectiveness in
driver-centered collision-warning systems. Ergonomics, 40, 390-399.
Parasuraman, R. & Riley, V. (1997). Humans and automation: Use, misuse, disuse,
abuse. Human Factors, 39, 230-253.
Parasuraman, R., Duley, J. A., & Smoker, A. (1998). Automation tools for controllers in
future air traffic control. The Controller: Journal of Air Traffic Control, 37, 7-13.
Parasuraman, R., Sheridan, T. B., & Wickens, C. D. (2000). A model for types and
levels of human interaction with automation. IEEE Transactions on systems, man, and
cybernetics – Part A: Systems and humans, 30, 3, 286-297.
Parasuraman, R. & Hancock, P. A. (2001). Adaptive control of mental workload. In
Hancock, P. A. and Desmond, P. A. (Eds.), Stress, workload, and fatigue. (pp. 305-320).
Mahwah, NJ: Lawrence Erlbaum Associates.
Pashler, H. E. (1998). The psychology of attention. Cambridge, MA: MIT Press.

11. References
187
Pawlak, W. S., Bowles, A., Goel, V., & Brinton, C. (1997). Initial evaluation of the
dynamic resectorization and route coordination (DIRECT) system concept (Final report for
NASA SBIR Contract # NAS2-97057). Boulder, CO: Wyndemere.
Perrott, D. R., Sadralodabai, T., Saberi, K. & Strybel, T. Z. (1991). Aurally aided visual
search in the central visual field: Effects of visual load and visual enhancement of the target.
Human Factors, 33, 389-400.
Perry, T. S. (1997). In search of the future of air traffic control. IEEE Spectrum, August,
19-35.
Posner, M. I., Nissen, M. J., & Klein, R. M. (1976). Visual dominance: An information-
processing account of its origins and significance. Psychological review, 83, 157-171.
Reason, J. (1990). Human error. Cambridge University Press: Cambridge, UK.
Redding, R. E. (1992). Analysis of operational errors and workload in air traffic control.
Proceedings of the 36th Annual Meeting of the Human Factors Society (pp. 1321-1325). Santa
Monica, CA: Human Factors Society.
Reid, G.B. & Colle, H.A. (1988). Critical SWAT values for predicting operator overload.
In Proceedings of the Human Factors Society 32nd Annual meeting (pp. 1414-1418). Santa
Monica, CA: Human Factors Society.
Reid, G. B. & Nygren, T. E. (1988). The subjective workload assessment technique: A
scaling procedure for measuring mental workload. In P.A. Hancock & N. Meshkati (Eds.),
Human mental workload (pp. 185-218). Amsterdam: North-Holland.
Reid, G.B., Potter, S.S., & Bressler, J.R. (1989). Subjective workload assessment
technique (SWAT): A user's guide (Report No. AAMRL-TR-89-023). Wright-Patterson Air
Force Base, OH: Harry G. Armstrong Aerospace Medical Research Laboratory.

11. References
188
Remington, R. W., Johnston, J. C., Ruthruff, E., Gold, M., Romera, M. (2000). Visual
search in complex displays: Factors affecting conflict detection by air traffic controllers. Human
Factors, 42, 349-366.
Riley, V. (1996). Operator reliance on automation: theory and data. In R. Parasuraman
& M. Mouloua (Eds.), Automation and Human Performance: Theory and Applications (pp. 19-
36). Mahwah, NJ: Lawrence Erlbaum Associates.
Rodgers, M. D., Mogford, R. H., & Strauch, B. (2000). Post hoc assessment of situation
awareness in air traffic control incidents and major aircraft accidents. In M. R. Endsley & D. J.
Garland (Eds.), Situation Awareness Analysis and Measurement (pp. 73-112). Mahwah, NJ:
Lawrence Erlbaum Associates.
Roscoe, A. H. (1987). In-flight assessment of workload using pilot ratings and hear rate.
In A. H. Roscoe (Ed.), The practical assessment of pilot workload (pp. 78-82), AGARDograph
No. 282. Meuilly sur Seine: Advisory Group for Aerospace Research & Development.
Rose, I. J., Kilner, A. R., & Hook, M. K. (1997). PUMA support to new Scottish Centre
Modelling. (R & D report 9720). London, UK: Department of ATM Systems Research,
Strategy and Development Directorate, National Air Traffic Services Ltd.
Roth, E. M.., Bennett, K, B. & Woods, D. D. (1987). Human interactions with an
“intelligent” machine. In E. Hollnagel, G. Mancini, and D. D. Woods (Eds.). Cognitive
engineering in complex dynamic worlds (pp. 23-51). London, UK: Academic Press.
Rouse, W. B. (1988). Adaptive aiding for human/computer control. Human Factors, 30,
431-443.
Rowe, D. W., Sibert, J., and Irwin, D. (1998). Hear rate variability: Indicator of user
state as anaid to human-computer interaction. In: Proceedings of the ACM CHI conference (pp.
480-487). Los Angeles, CA.

11. References
189
RTCA (1995). Report of the RTCA Board of Director’s Select Committee on Free Flight.
Washington, D.C.: RTCA.
Sarter, N. B. (2000). The need for multisensory interfaces in support of effective
attention allocation in highly dynamic event-driven domains: The case of cockpit automation.
The International Journal of Aviation Psychology, 10, 3, 231-245.
Sarter, N. B. & Woods, D. D. (1994). Pilot interaction with cockpit automation II: An
experimental study of pilots' model and awareness of the flight management system. The
International Journal of Aviation Psychology, 4, 1, 1-28.
Sarter, N. B. & Woods, D. D. (1995a). How in the world did we ever get into that mode?
Mode error and awareness in supervisory control. Human Factors, 37, 5-19.
Sauer, J. (2000). Prospective memory: a secondary task with promise. Applied
Ergonomics, 31, 131-137.
Schick, F. V. (1991a). Evaluation of the COMPAS Experimental System. In Schick, F.
V. & Völckers, U. (Eds.), The COMPAS system in the ATC environment (pp. 3-1 – 3-18).
Mitteilung Deutsche Forschungsanstalt für Luft- und Raumfahrt. Braunschweig: DLR Institut
für Flugführung.
Schick, F. V. (1991b). Evaluation of the COMPAS Operational System. In Schick, F. V.
& Völckers, U. (Eds.), The COMPAS system in the ATC environment (pp. 6-1 – 6-19).
Mitteilung Deutsche Forschungsanstalt für Luft- und Raumfahrt. Braunschweig: DLR Institut
für Flugführung.
Schneider, W. & Shiffrin, R. M. (1977). Controlled and automatic human information-
processing: I. Detection, search and attention. Psychological review, 84, 1-66.
11. References
190
Schroeder, D. J. & Nye, L. G. (1993). An examination of the workload conditions
associated with operational errors/deviations at Air Route Traffic Control Centers. In M. D.
Rodgers (Ed.), An examination of the operational error database for air route traffic control
centers (Report No. DOT/FAA/AM-93/22). Washington, D.C.: Federal Aviation
Administration.
Sheridan, T. B. & Verplank, W. L. (1978). Human and computer control of undersea
teleoperators. Cambridge, MA: MIT Man-Machine Systems Laboratory Report.
Sheridan, T. B. (1992). Telerobotics, automation, and human supervisory control.
Cambridge, MA: MIT Press.
Shiffrin, R. M. & Schneider, W. (1977). Controlled and automatic human information-
processing: II. Perceptual learning, automatic attending and a general theory. Psychological
Review, 84, 127-190.
Singh, I. L., Molloy, R. J., & Parasuraman, R. (1997). Automation-related monitoring
efficiency: The role of display location. International Journal of Human-Computer Studies, 46,
17-30.
Skitka, L. J., Mosier, K. L., Burdick, M. (1999). Does automation bias decision-making?
International Journal of Human-Computer Studies, 51, 991-1006.
Sklar, A. E. & Sarter, N. B. (1999). Good vibrations: Tactile feedback in support of
attention allocation and human-automation coordination in event-driven domains. Human
Factors, 41, 543-552.
Smith, K., Scallen, S. F., Knecht, W., Hancock, P. A. (1998). An Index of Dynamic
Density. Human Factors, 40, 69-78.

11. References
191
Sorkin, R. D. (1988). Why are people turning off our alarms? The Journal of the
Acoustical Society of America, 84, 1107-1108.
Sorkin, R. D., Kantowitz, B. H., & Kantowitz, S. C. (1988). Likelihood alarm displays.
Human Factors, 30, 445-459.
Spence, C. & Driver, J. (1996). Audiovisual links in endogenous covert spatial attention.
Journal of Experimental Psychology: Human Perception & Performance, 22, 1005-1030.
Spence, C. & Driver, J. (1997a). Audiovisual links in attention: implications for interface
design (pp. 185-192). In D. Harris (Ed.), Engineering psychology and cognitive ergonomics.
Volume 2: Job design and product design. Aldershot, UK: Ashgate.
Spence, C. & Driver, J. (1997b). On measuring selective attention to an expected sensory
modality. Perception & Psychophysics, 59, 389-403.
Spence, C. & Driver, J. (1997c). Audiovisual links in exogenous covert spatial orienting.
Perception & Psychophysics, 59, 1-22.
Sperandio, J. C. (1971). Variation of operator’s strategies and regulating effects on
workload. Ergonomics, 14, 571-577.
Sperandio, J. C. (1978). The regulation of working methods as a function of workload
among air traffic controllers. Ergonomics, 21, 195-202.
Stager, P., Hameluck, D., & Jubis, R. (1989) Underlying factors in air traffic control
incidents. In Proceedings of the Human Factors Society 33rd Annual Meeting (pp. 43-46). Santa
Monica, CA, USA: Human Factors and Ergonomics Society.
11. References
192
Stager, P., Ho, G., & Garbutt, J. M. (2000). An Automated Measure of Sector Workload.
In Proceedings of the Human Performance, Situation Awareness and Automation: User-
Centered Design for the New Millennium (pp. 28-33). Savannah, GA: SA Technologies, Inc.
Stein, E. S. (1985). Air traffic controller workload: An examination of workload probe.
Technical report DOT/FAA/CT-TN84/24. Atlantic City International Airport: FAA Tech
Center.
Stein, E. S. (1989). Air traffic controller scanning and eye movements in search of
information – A literature review (Technical Report DOT/FAA/CT-TN89/9). Atlantic City, NJ:
FAA Technical Center.
Stein, E. S. (1992). Air traffic control visual scanning (Technical report DOT/FAA/CT-
TN92/16). Atlantic City International Airport, NJ: FAA Technical Center.
Sternberg, S. (1966). High-speed scanning in human memory. Science, 153, 652-654.
Swedish, W. J. (1982). Proposed algorithm for AERA sector density probe. MITRE
memo No. W41-M5676. McLean, VA: MITRE.
Swedish, W. J. & Niedrighaus, W. P. (1983). Workload probe letter to Dr. E. Stein.
Mitre Memo No. W41-3316. McLean, VA: MITRE.
Tan, G. & Lewandowsky, S. (1996). A comparison of operator trust in humans vs.
machines. Cyberg International Electronic Ergonomics Conference. Available:
http://www.curtin.edu.au/conference/cyberg/centre/outline.cgi/frame?dir=tan
Talotta, N.J. (1992) Controller evaluation of initial datalink terminal ATC services: Mini
study 2 vol 1 (Report DOT/FAA/CT-92/2.1). Washington DC: US Department of
transportation/FAA.

11. References
193
Talotta, N. J. (1992) Controller evaluation of initial datalink terminal ATC services: Mini
study 2 vol 2 (Report DOT/FAA/CT-92/2.2). Washington DC: US Department of
transportation/FAA.
Tattersall, A., & Hockey, G. (1995). Level of operator control and changes in heart rate
variability during simulated flight maintenance. Human Factors, 37, 682-698.
Teichner, W. H. (1974). The detection of a simple visual signal as a function of time on
watch. Human Factors, 16, 339-353.
Thackray, R. I. & Touchstone, R. M. (1989). Detection efficiency on an air traffic
control monitoring task with and without computer aiding. Aviation, Space, and Environmental
Medicine, 60, 744-748.
Tole, J. R., Stephens, A. T., Harris, R. L., Ephrath, A. R. (1982). Visual scanning
behavior and mental workload in aircraft pilots. Aviation, Space, and Environmental Medicine,
53, 1, 54-61.
Tsang, P. S. & Vidulich, M. A. (1994). The role of immediacy and redundancy in
relative subjective workload assessment. Human Factors, 36, 503-513.
Van Gent, R. N. H. W., Hoekstra, J. M., & Ruigrok, R. C. J. (1998). Free Flight with
airborne separation assurance: A man-in-the-loop simulation study. (Technical Report).
Amsterdam, The Netherlands: National Aerospace Laboratory NLR.
Van Orden, K. F., Limbert, W., Makeig, S., & Jung, T.-P. (in press). Eye activity
correlates of workload during a visuospatial memory task. Human Factors.
Velichkovsky, B.M. & Hansen, J.P. (1996). New technological windows into mind:
There is more in eyes and brains for human-computer interaction. In CHI-96: Human factors in
computing systems. NY: ACM Press.

11. References
194
Vicente, K. J., Thornton, D.C., & Moray, N. (1987). Spectral analysis of sinus
arrhythmia: a measure of mental effort. Human Factors, 29, 171-182
Vicente, K. & Rasmussen, J. (1992) Ecological interface design: Theoretical foundations.
IEEE Transactions on Systems, Man and Cybernetics. SMC-22, 589-606.
Vidulich, M. A. & Tsang, P. S. (1987). Absolute magnitude estimation and relative
judgement approach to subjective workload assessment. In Proceedings of the Human Factors
and Ergonomics Society 31st Annual Meeting (pp. 1057-1061). Santa Monica: CA.
Vidulich, M. A., Ward, G. F., & Schueren, J. (1991). Using the subjective workload
dominance (SWORD) techniquefor projective workload assessment. Human Factors, 33, 677-
691.
Völckers, U. (1991). Application of planning aids for air traffic control: Design
principles, solutions, results. In Wise, J. A, Hopkin, V. D., & Smith, M. L. (Eds.), Automation
and systems issues in air traffic control (pp. 169-172). Berlin: Springer.
Wainwright, W. A. (1987). Flight test evaluation of crew workload. In A. H. Roscoe
(Ed.), The practical assessment of pilot workload (pp. 60-68), AGARDograph No. 282. Meuilly
sur Seine: Advisory Group for Aerospace Research & Development.
Warm, J. S., Dember, W. N., & Hancok, P. A. (1996). Vigilance and workload in
automated systems. In R. Parasuraman & M. Mouloua (Eds.), Automation and human
performance: Theory and Applications (pp. 183-200). Mahwah, NJ: LEA.
Welford, A. T. (1978). Mental workload as a function of demand, capacity, strategy, and
skill. Ergonomics, 21, 151-167.
White House Commission on Aviation Safety and Security (1997). Final report to
President Clinton. Vice President Al Gore, Chairman. (February 12). Washington DC: Author.
11. References
195
Wickens, C. D. (1980). The structure of attentional resources. In R.S. Nickerson
(Ed.).Attention and performance, VIII (pp. 239-257). Hillsdale, NJ: Erlbaum.
Wickens, C. D. (1984). Processing resources in attention. In R. Parasuraman & D. R.
Davies (Eds.), Varieties of attention (pp. 63-102). Orlando, FL: Academic Press.
Wickens, C. D. (1992). Engineering psychology and human performance (2nd ed.).
Scranton, PA: Harper Collins.
Wickens, C.D. (1994). Designing for situation awareness and trust in automation. In
Proceedings of the IFAC Conference on Integrated Systems Engineering. Baden-Baden,
Germany.
Wickens, C. D. (1998). Commonsense statistics. Ergonomics in Design, 6, 4, 18-22.
Wickens, C. D. (2000). Imperfect and unreliable automation and its implications for
attention allocation, information access and situation awareness. Technical report ARL-00-
10/NASA-00-2. Aviation Research Lab, Institute of Aviation, Urbana-Champaign, Illinois.
Wickens, C. D., Hyman, F., Dellinger, J., Taylor, H., & Meador, M. (1986). The
Sternberg memory search task as an index of pilot workload. Ergonomics, 29, 1371-1383.
Wickens, C. D. & Liu, Y. (1988). Codes and modalities in multiple resources: A success
and a qualification. Human Factors, 30, 5, 599-616.
Wickens, C. D., Mavor, A., & McGee, J. (1997). Flight to the future. Washington, D.C.:
National Academy Press.
Wickens, C. D., Gordon, S. E., & Liu, Y. (1998b). An Introduction to Human Factors
Engineering. New York, NY: Longman.
11. References
196
Wickens, C. D., Mavor, A., Parasuraman, R., & McGee, J. (1998a). The future of air
traffic control: Human operators and automation. Washington, D.C.: National Academy Press.
Wickens, C. D. & Hollands, J. G. (2000). Engineering psychology and human
performance (3rd ed.). Upper Saddle River, NJ: Prentice Hall.
Wiener, E. L. & Curry, R. E. (1980). Flight-deck automation: promises and problems.
Ergonomics, 23, 995-1011.
Wiener, E. L. (1989). Human Factors of Advanced Technology (‘glass cockpit’)
Transport Aircraft, Tech. Rep. 117528. Moffet Field, CA: NASA Ames Research Center.
Wiener, E. L., Kanki, B. G., & Helmreich, R. L. (1993). Cockpit resource management.
San Diego, CA: Academic Press.
Wierwille & Casali, (1983). A validated rating scale for global mental workload
measurement applications. In Proceedings of the Human Factors and Ergonomics Society 27th
Annual Meeting (pp. 129-133). Santa Monica, CA: HFES.
Wierwille, W. W. & Connor, S. A. (1983). Evaluation of 20 workload measures using a
psychomotor task in a moving-base aircraft simulator. Human Factors, 25, 1-16.
Wierwille, W. W., Rahimi, M., Casali, J. G. (1985). Evaluation of 16 measures of mental
workload using a simulated flight task emphasizing mediational activity. Human Factors, 27,
489-502.
Willems, B., Allen, R. C., and Stein, E. S. (1999). Air traffic control specialist visual
scanning II: Task load, visual noise, and intrusion into controlled airspace. (Technical report
DOT/FAA/CT-TN99/23). Atlantic City International Airport, NJ: FAA Technical Center.

11. References
197
Willems, B. & Truitt, T. R. (1999). Implications of Reduced Involvement in En Route Air
Traffic Control. Technical report (DOT/FAA/CT-TN99/2). Atlantic City International Airport,
NJ: FAA Technical Center.
Wilson, G.F. & Eggemeier, F. T. (1991). Psychophysiological assessment of workload in
multi-task environements. In D. L. Damos (Ed.), Multiple-task performance. Washington, D.C.:
Taylor and Francis.
Wilson, G.F. (1992). Applied use of cardiac and respiration measures: practical
considerations and precautions. Biological Psychology, 34, 163-178.
Wyndemere (1996). An evaluation of air traffic control complexity. Final report NASA
contract NAS2-14284. Boulder, CO: Author.
Yarbus, A. L. (1967). Eye movements and vision (B. Haigh & L. A. Riggs, Trans.). New
York: Plenum. (Original work published 1965)
Yeh, Y. Y. & Wickens, C. D. (1988). Dissociation of performance and subjective
measures of workload. Human Factors, 30, 111-120.
Yeh, M. & Wickens, C. D. (2000). Effects of cue reliability, realism, and interactivity on
biases of attention and trust in augmented reality. Proceedings of the IEA/HFES 2000 Meeting.
Santa Monica: Human Factors and Ergonomics Society.
Zijlstra, F. R. H. & Doorn, L. van (1985). The construction of a scale to measure
subjective effort (Technical report). Delft: Delft University of Technology.
12. Appendix
198
12. Appendix
12.1 Study protocol and consent for Experiment 1
DYNAMIC AUTOMATION TOOLS FOR AIR TRAFFIC MANAGEMENT
STUDY PROTOCOL
INVESTIGATORS: Raja Parasuraman, Ph.D.
Brian Hilburn, Ph.D.
Diego Castano, M.S.
Jackie Duley, M.S.
Scott Galster, B.A.
Anthony Masalonis, M.A.
Ulla Metzger, Dipl.-Psych.
PHONE NUMBER TO CALL IF QUESTIONS ARISE: 202-319-5825
PURPOSE OF THE STUDY
This research seeks to examine how advanced computer automation and new procedures
will affect the performance of air traffic controllers and pilots to maintain safe and efficient
separation of aircraft during simulated flight and simulated air traffic management. In particular,
new automation concepts, including flexible decision aiding and dynamic task allocation, will be
investigated. New procedures will also be studied. The present study will examine effects of
these automation concepts and procedures on controller performance and workload during
simulated air traffic control.
DESCRIPTION OF PROCEDURES
In this experiment participants will be required to perform tasks that will be presented on
the color monitor of a computer workstation. The tasks simulate the types of functions often
required of air traffic controllers. A primary visual display (PVD) will display aircraft and their
associated flight paths. Each aircraft symbol will display a "data block" containing variables
such as the aircraft name, airspeed, altitude, etc. A "data-link" interface will allow you to "query"

12. Appendix
199
a particular aircraft and to issue commands to the aircraft (such as a command to descend to a
particular altitude). Participants will interact with the system using a trackball device. Their
overall goal will be to keep the flow of air traffic smooth and to identify and act upon any
potential "conflicts", i.e. when two flight paths come within a specified distance of each other.
The details of the task will be described to participants in detail prior to the beginning of data
collection. Participants will receive several training and practice sessions in which to learn to
perform the task.
The measures to be collected are noninvasive and involve little or no risk to participants.
The measures include performance indices derived from the trackball device (errors, reaction
times, patterns of information acquisition, etc). In addition, mental workload will be measured
using subjective measures of perceived mental workload (the NASA Task Load Index) and using
objective measures of heartrate variability. In order to measure heartrate, three sensors will
temporarily be placed on your arms. An additionial sensor around your lower ribcage will
monitor you respiration. Finally, participants will complete a brief biographical questionnaire
and a questionnaire assessing their aviation and computer knowledge.
The experiment will last approximately four hours, including all breaks. Participation is
this study is voluntary. All individuals will be told that they are free to discontinue participation
at any time.
CONTRIBUTIONS
The results of this study are expected to provide information relevant to the design and
implementation of future systems for air traffic management. The results should also advance
knowledge of how people interact with dynamic automation tools in carrying out complex
problem solving tasks.
RISKS AND DISCOMFORTS
Previous experience with participants performing similar tasks indicates that the potential
risk or discomfort from participating in this study will be minimal. The air traffic control
simulation task is challenging, much like an arcade videogame, and most persons find them
interesting and stimulating. Fatigue or other discomfort should not be a major factor because
frequent rest breaks will be given.

12. Appendix
200
CONFIDENTIALITY
The data obtained from participants will be recorded with coded numbers to preserve
confidentiality. Only the principal investigator will have access to the codes, which will be kept
securely. Participants will not be identified by name in any report of the results.
INFORMED CONSENT FORM
I understand that I may refuse to participate or discontinue my participation at any time
without loss of benefits to which I am entitled. If for any reason I wish to withdraw from the
experiment before it is completed, I am free to do so at any time, by notifying the experimenter.
Prorated amounts for compensation based on participation will be paid if I do not complete the
experiment either due to voluntary withdrawal or inability to perform the task. I understand that
I will not be identified by name in any report or publication that may result from this research.
I understand that any information about me obtained as a result of participation in this
research will be kept as confidential as legally possible. I understand that my research records,
just like my hospital records, may be subpoenaed by court order.
I have had an opportunity to ask any questions about the research and/or my participation
in the research, and these have been answered to my satisfaction.
I have received a signed copy of this consent form. I volunteer to participate in the above
study.
If I have any concerns at the end of this study related to the procedures involved or how
the study was conducted I should direct them to Ulla Metzger at the end of the study. I may also
contact the Secretary of the Committee for the Protection of Human Subjects at (202) 319-5218.
The secretary is located in the Office of Sponsored Research on the CUA campus.
________________________________________________________________________
SIGNATURE DATE
________________________________________________________________________
INVESTIGATOR'S SIGNATURE DATE
12. Appendix
201
12.2 Study protocol and consent for Experiments 2 and 3
DYNAMIC AUTOMATION TOOLS FOR AIR TRAFFIC MANAGEMENT
STUDY PROTOCOL
INVESTIGATORS: Raja Parasuraman, Ph.D.
Brian Hilburn, Ph.D.
Jackie Duley, M.S.
Scott Galster, M.A.
Ulla Metzger, Dipl.-Psych.
PHONE NUMBER TO CALL IF QUESTIONS ARISE: 202-319-5825
PURPOSE OF THE STUDY
This research seeks to examine how advanced computer automation and new procedures
will affect the performance of air traffic controllers and pilots to maintain safe and efficient
separation of aircraft during simulated flight and simulated air traffic management. In particular,
new automation concepts, including flexible decision aiding and dynamic task allocation, will be
investigated. New procedures will also be studied. The present study will examine effects of
these automation concepts and procedures on controller performance and workload during
simulated air traffic control.
DESCRIPTION OF PROCEDURES
In this experiment participants will be required to perform tasks that will be presented on
the color monitor of a computer workstation. The tasks simulate the types of functions often
required of air traffic controllers. A primary visual display (PVD) will display aircraft and their
associated flight paths. Each aircraft symbol will display a "data block" containing variables
such as the aircraft name, airspeed, altitude, etc. A "data-link" interface will allow you to "query"
a particular aircraft and to issue commands to the aircraft (such as a hand-off command).
Participants will interact with the system using a trackball device. Their overall goal will be to
keep the flow of air traffic smooth and to identify and act upon any potential "conflicts", i.e.

12. Appendix
202
when two flight paths come within a specified distance of each other. The details of the task will
be described to participants in detail prior to the beginning of data collection. Participants will
receive several training and practice sessions in which to learn to perform the task.
The measures to be collected are noninvasive and involve little or no risk to participants.
The measures include performance indices derived from the trackball device (errors, reaction
times, patterns of information acquisition, etc). In addition, mental workload will be measured
using subjective measures of perceived mental workload (the NASA Task Load Index) and using
objective measures of pupil size. To measure pupil size and study eye movements, you will be
wearing eye-tracking equipment, worn as a headband. Finally, participants will complete a brief
biographical questionnaire and a questionnaire assessing their aviation and computer knowledge.
The experiment will last approximately 3-4 hours, including all breaks. Participation in
this study is voluntary. All individuals will be told that they are free to discontinue participation
at any time.
CONTRIBUTIONS
The results of this study are expected to provide information relevant to the design and
implementation of future systems for air traffic management. The results should also advance
knowledge of how people interact with dynamic automation tools in carrying out complex
problem solving tasks.
RISKS AND DISCOMFORTS
Previous experience with participants performing similar tasks indicates that the potential
risk or discomfort from participating in this study will be minimal. The air traffic control
simulation task is challenging, much like an arcade video-game, and most persons find them
interesting and stimulating. Fatigue or other discomfort should not be a major factor because
frequent rest breaks will be given. Due to the nature of eye movement data collection, some
people may find the eye tracking equipment uncomfortable after a period of time. Participants
will be permitted to discontinue wearing the headband or discontinue participation completely at
any time.
CONFIDENTIALITY

12. Appendix
203
The data obtained from participants will be recorded with coded numbers to preserve
confidentiality. Only the principal investigator will have access to the codes, which will be kept
securely. Participants will not be identified by name in any report of the results.
INFORMED CONSENT FORM
I understand that I may refuse to participate or discontinue my participation at any time
without loss of benefits to which I am entitled. If for any reason I wish to withdraw from the
experiment before it is completed, I am free to do so at any time, by notifying the experimenter.
Prorated amounts for compensation based on participation will be paid if I do not complete the
experiment either due to voluntary withdrawal or inability to perform the task. I understand that
I will not be identified by name in any report or publication that may result from this research.
I understand that any information about me obtained as a result of participation in this
research will be kept as confidential as legally possible. I understand that my research records,
just like my hospital records, may be subpoenaed by court order.
I have had an opportunity to ask any questions about the research and/or my participation
in the research, and these have been answered to my satisfaction.
I have received a signed copy of this consent form. I volunteer to participate in the above
study.
If I have any concerns at the end of this study related to the procedures involved or how
the study was conducted I should direct them to Ulla Metzger at the end of the study. I may also
contact the Secretary of the Committee for the Protection of Human Subjects at (202) 319-5218.
The secretary is located in the Office of Sponsored Research on the CUA campus.
_____________________________________________________________________
Participant Name (please print) Participant Signature Date
_____________________________ _____________________
Investigator’s Signature Date
12. Appendix
204
12.3 Biographical information sheet
NAME(optional)_____________________________AGE_____GENDER_______
HANDEDNESS: RIGHT_____LEFT_____BOTH_____
EDUCATION: NUMBER OF YEARS COMPLETED: _____ (e.g. high school senior = 12)
COMPUTER FAMILIARITY: LOW_____MEDIUM_____HIGH_____
DO YOU HAVE 20/20 VISION OR CORRECTED 20/20 VISION? YES_____NO_____
POSITION_________________ RETIRED___ FPL___ TMU___SHIFT________________
NAME OF FACILITY_________________________________________________________
YEARS OF ATC EXPERIENCE_________OVERALL
EXPERIENCE IN OTHER AIR TRAFFIC ENVIRONMENTS:
CIVILIAN
YEARS OF EXPERIENCE_________TOWER LOCATION_______________________
YEARS OF EXPERIENCE_________TRACON LOCATION_______________________
YEARS OF EXPERIENCE_________EN ROUTE LOCATION_______________________
MILITARY
YEARS OF EXPERIENCE_________TOWER LOCATION_______________________
YEARS OF EXPERIENCE_________TRACON LOCATION_______________________
YEARS OF EXPERIENCE_________EN ROUTE LOCATION_______________________
OTHER (e.g. oceanic, etc.): ___________________________________________________
WHAT DOES THE TERM “FREE FLIGHT” MEAN TO YOU?
___________________________________________________________________________
___________________________________________________________________________
WHAT COMMENTS, IF ANY, DO YOU HAVE REGARDING FREE FLIGHT?
___________________________________________________________________________
___________________________________________________________________________
ARE YOU INTERESTED IN PARTICIPATING AS A PAID VOLUNTEER IN ANY
FUTURE STUDIES ? YES__ NO__

12. Appendix
205
12.4 Instructions
This is what you will see on the screen. Show screenshots of sector and datalink. This is a
sector. Show octangle. You will be responsible for all aircraft you see within this sector. There
are basicly four different tasks:
The first is to accept aircraft that are coming into your sector. The second task is to
monitor their flight path and the third is to hand off aircraft to the next sector. The four – and
most important task – is detecting potential conflicts.
1. Accepting incoming aircraft
You have to accept all aircraft that enter your sector. For each aircraft that enters your
sector you will get an incoming message on the datalink. Show datalink.. The datalink is a means
of communication between the pilot and the air traffic controller and substitutes voice
communication. Open the message by double-clicking on it with the left mouse button. Read the
message and click accept to take over responsibility for that aircraft. On the radar, the call sign of
the aircraft will change from orange to green. On the datalink, you will get a message saying
“Roger” to indicate that the pilot received your message of acceptance. If you click on the call
sign of the aircraft in the list of flights the flight strip will open up. Show. The flight strip gives
you the most important information for an aircraft, e.g. its callsign, the waypoints, its speed and
altitude. You need the flight strip to monitor the flight plan of the aircraft which is your second
task in this experiment.
2. Monitoring the flight path
You will have to monitor the flightpath of each aircraft. As soon as an aircraft passes one
of the waypoints, click on the waypoint it just passed on the flightstrip. The waypoint will be
highlighted as soon as you click it.
3. Handing-off in a FF scenario
When an aircraft reaches this circle you have to hand it off to the next sector giving the
next air traffic controller responsibility of the aircraft. You hand off by clicking and highlighting
the call sign of the aircraft in the flight list and then click the auto hand-off button. As soon as
12. Appendix
206
the aircraft is handed-off the call sign of the aircraft on the radar will turn orange and you will
see an R next to that flight on the flight list. This tells you that you don’t have responsibility for
that aircraft anymore. It is more important to hand-off an aircraft than to monitor the flightplan.
I will give you a demonstration of what I just explained and then there will be a practice
scenario where you can practice the tasks. If you have questions, please ask at any time.
4. Detecting conflicts
The fourth task, detecting conflicts, is the most important task. Whenever you think you
see a potential conflict you are to report the conflict. A potential conflict can result in an actual
conflict where the aircraft involved loose separation. It can also result in a self-separation in
which one of the two aircraft makes an evasive maneuver by changing speed, heading, or altitude
to avoid the impending conflict. In either case, conflict or self-separation, please report a
potential conflict as soon as possible.
How to report a conflict
If you would like to report a conflict, click on the datablock of the aircraft involved using
the left mouse button. The datablock will change from green to white to give you feedback that
you selected the aircraft. Then click the conflict button in the upper right corner of the right side
monitor [show]. After clicking the conflict button, the datablocks will change back to green.
Conflict resolution (Experiment 3 only)
Also, if you detect a conflict, decide on how you would resolve the conflict by issuing a
clearance. So, for example, if you there is a conflict between AAL123 and USA 456 and you
would resolve the conflict by telling USA to descend to FL 350 say “USA 456, climb and
maintain FL350”. I will record your resolution suggestion. However, the resolution in the
scenario might be different, but that doesn’t matter. I am not evaluating how good your
resolution is.
There will be no feedback which conflicts you have already reported. If you're not sure if
you already reported a conflict or not, report it again. There is no penalty for reporting a conflict
more than once. If you report a conflict more than once, only the first report will be counted.

12. Appendix
207
Demonstration of a scenario
Here you see the sector, the datalink and the different aircraft coming in. The data block
on each aircraft tells you the aircraft’s call sign, its altitude, if the aircraft is descending
(indicated by a -), climbing (indication by a +) or remains at a constant altitude (C), a computer
identification number and its ground speed.
Fore, Back, Range buttons
With those buttons, you can change the foreground and background color of the screen
and change the range of the screen. With + you can zoom in, with - you can zoom out.
J-Ring, History, Vector
History and Vector are general and affect all aircraft. J-Ring can be turned on and off for
each single aircraft.
Self-separation, Conflict
As soon as two aircraft get too close to each other (5nm horizontal and 1000 feet vertical)
you will see a red bubble around them (similar to a J-Ring). This indicates that they could crash
or that they self-separate without a problem. If you think you can see a conflict, please let me
know as soon as possible by reporting it to me.

12. Appendix
208
12.5 Description of the conflict detection aid Experiment 3
“As the demands on the NAS continue to increase, there is a need for ATM decision
support tools that assist controllers in conflict detection and other tasks. Conflict detection aids
predict conflicts in advance using information on aircraft position, speed and flight plans along
with forecasts of wind and temperature profiles. Conflict detection aids would be especially
useful in a Free Flight environment with a less structured traffic flow compared to the current
environment. Conflict detection aids merely provide information to the controller; the controller
retains authority and responsibility for safe separation of air traffic. Flight intent information is
available to a conflict detection aid through the current flight plan obtained from the host.
Changes in flight intent information are known to the relevant pilots and controllers and in most
cases are known to the conflict detection aid through a filed flight plan amendment obtained
from the host. In some cases, changes in flight intent information are not explicitly available to
the conflict probe, e.g. when flight plan amendments are not entered into the host. The conflict
probe is simply providing you with information. It is your choice to use it or not. The controller
retains authority and responsibility for safe separation of air traffic.”

12. Appendix
209
12.6 Trust and self-confidence rating scales
1. To what extent did you trust (i.e. believe in the accuracy of) the conflict detection aid in
this scenario?
Extremely Not at all
2. To what extent were you self-confident that you could accurately detect conflicts without
the conflict detection aid in this scenario?
Extremely Not at all
Comments:

13. Curriculum vitae
210
13. Curriculum Vitae
Ulla Metzger
Geboren
27. April 1971 in Worms
Schule
Grundschule Eich, 1977-1981
Rudi-Stephan Gymnasium (altsprachl.) Worms, 1981-1990
Abitur, 1990
Universität
Grundstudium: Johannes-Gutenberg Universität Mainz, 1990-1992
Vordiplom Psychologie, 1992
Hauptstudium: Technische Universität Darmstadt, 1992-1996
Diplom Psychologie, 1996
Promotionstudium: Technische Universität Darmstadt, 1999-
Wissenschaftliche Tätigkeit
Vermont Alcohol Research Center, Colchester, VT, USA, 1995-1996
Wissenschaftliche Hilfskraft
Friedrich-Schiller Universität Jena, 1996 - 1997
Wissenschaftliche Mitarbeiterin
The Catholic University of America, Washington, DC, USA, 1997-
Wissenschaftliche Mitarbeiterin

13. Curriculum vitae
211
Veröffentlichungen
Nenadic, I., Volz, H. P., Gaser, C., Facius, M., Rammsayer, T., Metzger, U., Kaiser, W.
A., Sauer, H. (1997). Cerebral activation during time estimation and frequency discrimination in
healthy volunteers. Pharmacopsychiatry, 30: 204.
Krause, W., Kotkamp, N., Tietze, H., Metzger, U., Möller, E., & Schack, B. (1999). Kann
man Klassifizierungsprozesse sichtbar machen? Abruf von Kategoriebegriffen aus dem
Gedächtnis und EEG-Kohärenzanalyse. In E. Witruk & H.-J. Lander (Eds.),
Informationsverarbeitungsanalysen (pp. 67-82). Leipzig: Leipziger Universitätsverlag.
Masalonis, A.J., Duley, J.A., Galster, S.M., Castaño, D.J., Metzger, U., & Parasuraman,
R. (1998). Air traffic controller trust in a conflict probe during Free Flight. Proceedings of
Human Factors & Ergonomics Society 42nd Annual Meeting, (p. 1601). Santa Monica, CA:
HFES.
Metzger, U. & Parasuraman, R. (1999). Effects of a conflict detection aid and traffic
density on controller mental workload and performance in an ATC task simulating Free Flight.
Proceedings of the 10th International Symposium on Aviation Psychology (pp. 541-547).
Columbus, OH: Ohio State University.
Metzger, U. & Parasuraman, R. (1999). Free Flight and the air traffic controller: Active
Control versus Passive Monitoring. Proceedings of the Human Factors & Ergonomics Society
43rd Annual Meeting (pp. 1-5). Santa Monica, CA: HFES.
Metzger, U., Duley, J. A., Rovira, E., & Parasuraman, R. (1999). The effect of training on
monitoring of an automated system. Proceedings of the Human Factors & Ergonomics Society
43rd Annual Meeting (p. 1406). Santa Monica, CA: HFES.
Metzger, U., Duley, J. A., Abbas, R., & Parasuraman, R. (2000). Training to reduce
inefficiencies in monitoring of automated systems: Performance and eye movements.
Proceedings of the 14th Triennial Congress of the International Ergonomics Association and
44th Annual Meeting of the Human Factors and Ergonomics Society (pp. 2-346-349). Santa
Monica, CA: HFES.
Metzger, U. & Parasuraman, R. (2000). Improving Conflict Detection Performance under
Free Flight with Automated Detection Aids. Proceedings of the Human Performance, Situation
Awareness, and Automation Conference: User-Centered Design for the New Millennium (p.
355). Savannah, GA: SA Technologies, Inc.

13. Curriculum vitae
212
Metzger, U. (in press). [Book review of Human Performance: Cognition, Stress and
Individual Differences von Matthews, G., Davies, D. R., Westerman, S. J., & Stammers, R. B.].
Ergonomics in Design.
Metzger, U. & Parasuraman, R. (in press). Conflict detection aids for air traffic
controllers in Free Flight: Effects of reliable and failure modes on performance and eye
movements. Proceedings of the 11th International Symposium on Aviation Psychology.
Columbus, OH: Ohio State University.
Metzger, U. & Parasuraman, R. (in press). The Role of the Air Traffic Controller in
Future Air Traffic Management: An Empirical Study of Active Control versus Passive
Monitoring. Human Factors.
Vorträge/Poster
Metzger, U. & Parasuraman, R. (1999, May). Effects of a conflict detection aid and
traffic density on controller mental workload and performance in an ATC task simulating Free
Flight. Paper presented at the 10th International Symposium on Aviation Psychology, Columbus,
OH.
Metzger, U. & Parasuraman, R. (1999, September). Free Flight and the air traffic
controller: Active Control versus Passive Monitoring. Paper presented at the Human Factors &
Ergonomics Society 43rd Annual Meeting, Houston, TX.
Metzger, U., Duley, J. A., Rovira, E., & Parasuraman, R. (1999, September). The effect
of training on monitoring of an automated system. Poster presented at the Human Factors &
Ergonomics Society 43rd Annual Meeting, Houston, TX.
Metzger, U., Duley, J. A., Abbas, R., & Parasuraman, R. (2000, August). Training to
reduce inefficiencies in monitoring of automated systems: Performance and eye movements.
Paper presented at the 14th Triennial Congress of the International Ergonomics Association and
44th Annual Meeting of the Human Factors and Ergonomics Society, San Diego, CA.
Metzger, U. & Parasuraman, R. (2000, October). Improving Conflict Detection
Performance under Free Flight with Automated Detection Aids. Poster presented at the
Conference on Human Performance, Situation Awareness, and Automation: User-Centered
Design for the New Millenium, Savannah, GA, Oct. 15-19, 2000.

13. Curriculum vitae
213
Metzger, U. & Parasuraman, R. (2001, March). Conflict detection aids for air traffic
controllers in Free Flight: Effects of reliable and failure modes on performance and eye
movements. Paper presented at the 11th International Symposium on Aviation Psychology,
March 5-8, 2001, Columbus, OH: Ohio State University.
Stand: 23-Jul-01