Automated Assessment of NIIRS and GRD of High Resolution...
29
Automated Assessment of NIIRS and GRD of High Resolution Satellite Images through Edge Profile Analysis of Natural Targets Taejung Kim, Jae-In Kim Image Engineering Lab Dept. of Geoinformatic Engineering Inha University
Transcript of Automated Assessment of NIIRS and GRD of High Resolution...
Automated Assessment of NIIRS and GRD of
High Resolution Satellite Images through
Edge Profile Analysis of Natural Targets
Taejung Kim, Jae-In Kim
Image Engineering Lab
Dept. of Geoinformatic Engineering
Inha University

L o g o
Backgrounds
Various ways of describing image quality
From engineering side, there are many technical parameters
Ground sampling distance,
Modulation Transfer Function(MTF) (ratio @ sampling freq.),
Signal to Noise Ratio (SNR),
Relative Edge Response (RER), etc.
Tech. parameters may not represent “image quality” for user
Image users may be more interest in other parameters
mapping accuracy, interpretability, etc.
Image quality regarding interpretability
NIIRS (National Image Interpretability Rating Scales)
GRD (Ground Resolvable Distance)

L o g o
Backgrounds
Image quality assessed mostly by Artificial Targets Usually for calibration / validation purpose
Specially manufactured artificial targets are used
Special arrangements (target size, orientation) are required
Images around targets are analyzed for RER and SNR
Edge profiles are transformed to MTF through curve fitting
(Helder et al., 2004)

L o g o
Research Purpose
Automated image quality assessment from natural targets
artificial targets natural targets
manual edge selection automated selection
RER, MTF, SNR GRD, NIIRS
reliability of image quality parameters
Operational image quality assessment of all remote sensing
images without extra costs

L o g o
Research Purpose
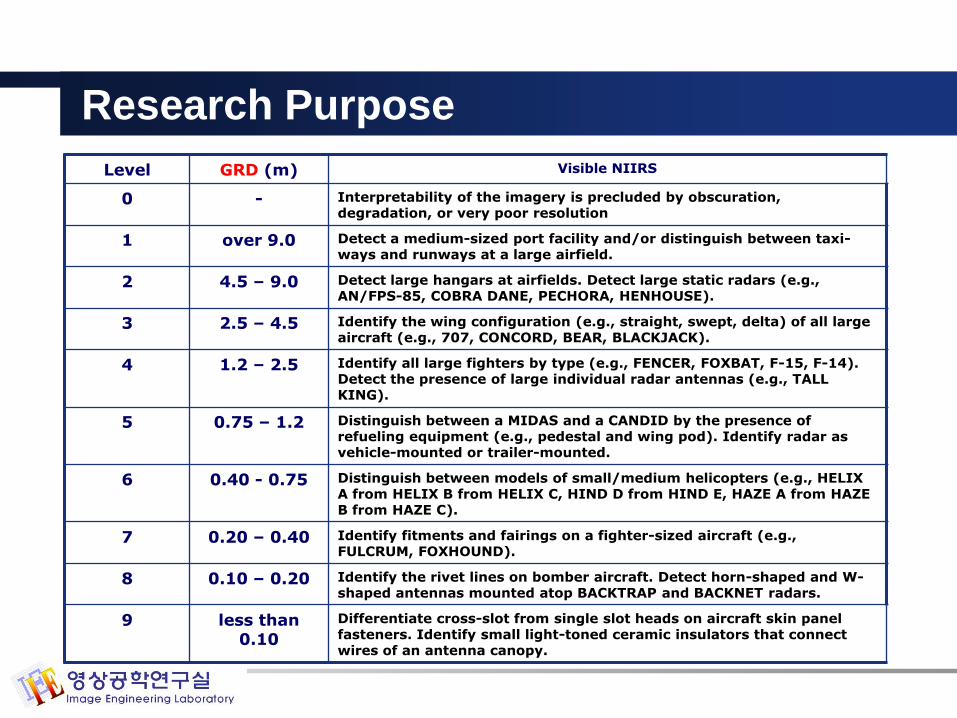
NIIRS (National Image Interpretability Rating Scales)
Originally used for intelligence/military images
In 1996, published by IRARS (Imagery Resolution Assessments and Reporting Standards)
For each rating, identifiable targets are defined
Separate rating scales exist for military targets and civil/natural targets and for panchromatic, multispectral, radar images
NIIRS values are assessed visually by certified image analysts
NIIRS values are provided within the satellite metadata
L o g o
Research Purpose
Level GRD (m) Visible NIIRS
0 - Interpretability of the imagery is precluded by obscuration, degradation, or very poor resolution
1 over 9.0 Detect a medium-sized port facility and/or distinguish between taxi-ways and runways at a large airfield.
2 4.5 – 9.0 Detect large hangars at airfields. Detect large static radars (e.g., AN/FPS-85, COBRA DANE, PECHORA, HENHOUSE).
3 2.5 – 4.5 Identify the wing configuration (e.g., straight, swept, delta) of all large aircraft (e.g., 707, CONCORD, BEAR, BLACKJACK).
4 1.2 – 2.5 Identify all large fighters by type (e.g., FENCER, FOXBAT, F-15, F-14). Detect the presence of large individual radar antennas (e.g., TALL KING).
5 0.75 – 1.2 Distinguish between a MIDAS and a CANDID by the presence of refueling equipment (e.g., pedestal and wing pod). Identify radar as vehicle-mounted or trailer-mounted.
6 0.40 - 0.75 Distinguish between models of small/medium helicopters (e.g., HELIX A from HELIX B from HELIX C, HIND D from HIND E, HAZE A from HAZE B from HAZE C).
7 0.20 – 0.40 Identify fitments and fairings on a fighter-sized aircraft (e.g., FULCRUM, FOXHOUND).
8 0.10 – 0.20 Identify the rivet lines on bomber aircraft. Detect horn-shaped and W-shaped antennas mounted atop BACKTRAP and BACKNET radars.
9 less than 0.10
Differentiate cross-slot from single slot heads on aircraft skin panel fasteners. Identify small light-toned ceramic insulators that connect wires of an antenna canopy.

L o g o
Research Purpose
NIIRS assessment by GIQE General Image quality Equation
Proposed by regression analysis between NIIRS, GSD, MTF and SNR values of images
Enables assessment of NIIRS from tech. parameters determined by edge analysis
NIIRS = a - b* log(GSDGM) + c* log(RERGM) – (d*H) –(e*G/SNR)
RERGM: Geometric means of Relative Edge Response in x and y direction
H: Geometric means of Overshoot height
G: Noise gain due to Edge sharpening, Kernel Value of MTF Correction
GSD: Ground Sampling Distance
SNR: Signal to Noise Ratio

L o g o
Research Purpose
GRD (Ground Resolvable Distance)
The minimum distance between two objects to be identified as separate objects
Inverse of Line pairs per mm (lp/mm)
GRD is assessed by image analysts
GRD assessment GRD can be assessed from PSF (Point Spread Function)
H : Flying height
f : Focal length
R : Half peak width of PSF

L o g o
Research Purpose
Proposed procedures
Select initial edge points
from artificial vs. natural targets
manually vs. automatically
Determine edge orientation and generate edge profiles
Calculate normalized edge profile and edge center
Check the criteria for accepting edge profiles
Calculate RER, H, SNR and NIIRS
Generate point spread function and calculate GRD
Repeat the process for other edge points (usually > 50)
Determine NIIRS and GRD for the whole scene

L o g o
Validation of GRD/NIIRS Assessment
Orientation-invariant edge analysis GIQE uses RER in only x- and y-directions
For natural targets, we have to use edges of arbitrary orientation
We need to extract edge profiles perpendicular to edge orientation
Test image: bar patterns with orientation changed incrementally by 15° by different cameras
10
Camera Tested:
SONY Siber-Shot DSC-S950
SONY α550(DSLR)
Cannon Exsus 900 Ti
Samsung Kenox S500

L o g o
Validation of GRD/NIIRS Assessment
Orientation-invariant edge analysis
11
0.00
0.20
0.40
0.60
0.80
1.00
0 15 30 45 60 75 90
RE
R
Angle SONY Siber-Shot DSC-…
0.00
0.20
0.40
0.60
0.80
1.00
0 15 30 45 60 75 90
RE
R
SONY α550(DSLR)
0.00
0.20
0.40
0.60
0.80
1.00
0 15 30 45 60 75 90
RE
R
Cannon Exsus 900 Ti
0.00
0.20
0.40
0.60
0.80
1.00
0 15 30 45 60 75 90
RE
R
Samsung Kenox S500

L o g o
Validation of GRD/NIIRS Assessment
GRD estimation from in-door scenes
Test image:
Camera spec.:
Imaging distance (Flying height):
981mm, 1232mm,1454mm, 2090mm, 3132mm
12
Model EOS 450D
CCD size 22.2mm × 14.8mm
Focal Length 55mm
Image Size 4272 × 2848
CCD Cell size 0.005197mm

L o g o
Edge analysis for quality assessment
GRD estimation from in-door scenes
From bar pattern, extract edge profiles, PSF and GRD
GRD values assessed by 7 researcher were averaged as reference GRD values
13

L o g o
GRD estimation from edge analysis GRD values from edge analysis were almost identical to reference
(RMSE: 0.01mm)
Validation of GRD/NIIRS Assessment
ImagingDistance
ReferenceGRD
2 * GSD
GRD
Average of Individual
GRDs
GRD of Average
Edge Profile
3132mm 0.7081mm 0.5863mm 0.7094mm 0.7057mm
2090mm 0.4753mm 0.3912mm 0.4747mm 0.4665mm
1454mm 0.3288mm 0.2722mm 0.3305mm 0.3230mm
1232mm 0.3001mm 0.2306mm 0.3058mm 0.3063mm
981mm 0.2324mm 0.1836mm 0.2127mm 0.2112mm
14

L o g o
Validation of GRD/NIIRS Assessment
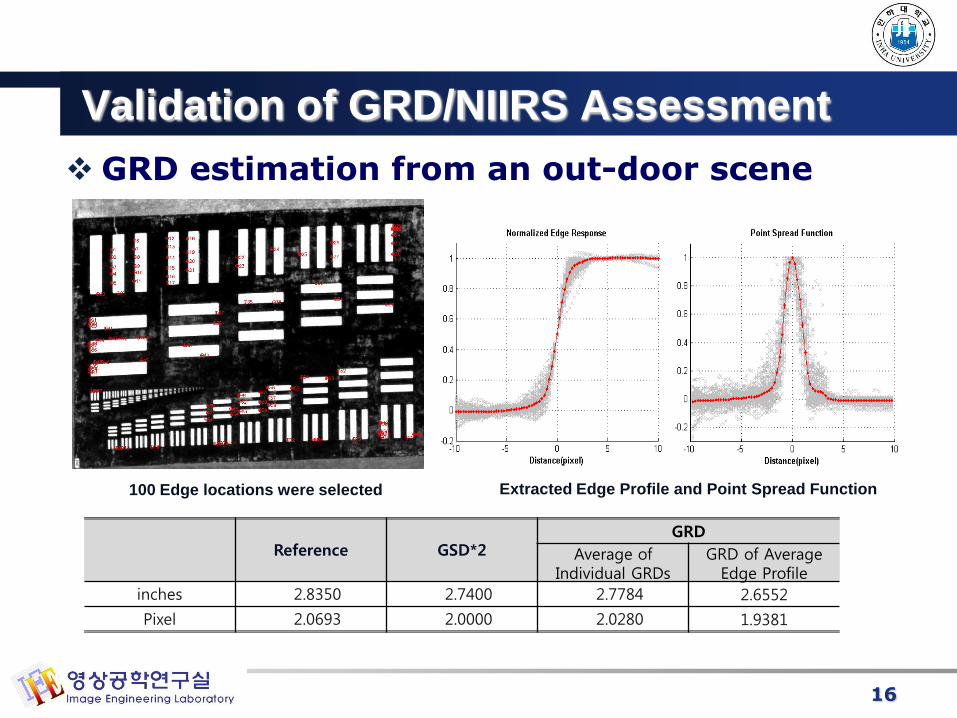
15
GRD estimation from an out-door scene
Test data
- Tri bar pattern with varying sizes
- Reference GRD is estimated by checking minimum
identifiable bar pattern
(Bruce Mathews and Theodore Zwicker, 1999)
27th Group
BarGroup
Size(inches) BarGroup
Size(inches)
Horiz. Vert. GRD (in) Horiz. Vert. GRD (in)
1 151.25 30.25 60.50 20 16.84 3.37 6.74
7 75.60 15.13 30.25 26 8.42 1.68 3.37
8 67.40 13.47 26.95 27 7.50 1.50 3.00
9 60.00 12.00 24.01 28 6.68 1.34 2.67
10 53.50 10.69 21.39 29 5.96 1.19 2.38
11 47.60 9.53 19.06 30 5.31 1.06 2.12
L o g o
Validation of GRD/NIIRS Assessment
16
GRD estimation from an out-door scene
100 Edge locations were selected Extracted Edge Profile and Point Spread Function
Reference GSD*2GRD
Average of Individual GRDs
GRD of Average Edge Profile
inches 2.8350 2.7400 2.7784 2.6552
Pixel 2.0693 2.0000 2.0280 1.9381

L o g o
GRD estimation from simulated images
from each ref. images, 3 simulated images were generated
reference GRDs were estimated by visual inspection
theoretic GRDs were also calculated mathematically
Ref. Image * PSF (Gaussian with GRD 1,2,3)
Validation of GRD/NIIRS Assessment
17
(a)scene1, distance 3132mm (b)scene2, distance 2090mm (c)scene3, distance 1454mm (d)scene4, distance 1232mm (f)scene5, distance 981mm
5 refs Х 3 PSFs = 15 simulated images

L o g o
Validation of GRD/NIIRS Assessment
18
GRD estimation from simulated images For each image, edge profiles at 200 locations were extracted
Scene 1 Scene 2 Scene 3 Scene 4 Scene 5
Conv PSF’s GRD 0001 0002 0003 0004 0005 Total RMSE(Pixel)
기준영상 0.0756 0.0177 0.0227 -0.2043 0.0309 0.0992
1.0Pixel 0.0493 0.2727 -0.0007 -0.2051 0.0027 0.1542
2.0Pixel 0.0327 0.0261 -0.1624 -0.1480 0.0589 0.1034
3.0Pixel -0.0223 -0.2207 -0.1842 -0.2021 -0.1369 0.1690
Difference between theoretically driven GRDs vs estimated GRDs

L o g o
Validation of GRD/NIIRS Assessment
NIIRS estimation from simulated images generated images with NIIRS by changing GSDs
check the minimum identifiable font size for each image
blur the reference by Gaussian filter to make the same minimum font size as the images with different GSDs
19
GSD0, Reference
Reference 1.4145 x GSD0 2.0000 x GSD0 2.8302 x GSD0
ΔNIIRS 0.0 -0.5 -1.0 -1.5
Minimum font size (pt)
4 5 7 11
Image size 1000 x 1500 707 x 1060 500 x 750 353 x 530

L o g o
Validation of GRD/NIIRS Assessment
NIIRS estimation from simulated images Estimated NIIRS were very close to the true values
20
Reference Min. pt = 5 Min pt = 7 Min pt = 11
RER 0.6376 0.3993 0.2347 0.1560
SNR 47.5078 162.0340 92.2690 21.9131
H 1.0664 0.9692 0.7727 0.6898
GRD 1.5861 2.3732 3.8407 5.5866
NIIRS 3.9320 3.4427 2.9258 2.4688
True NIIRS -0.5000 -1.0000 -1.5000
Estimated NIIRS -0.4893 -1.0062 -1.4632
|Error| 0.0107 0.0062 0.0368

L o g o
Validation of the use of natural targets
Artificial targets vs. natural targets Test images: Komspat-2 images with tarps
21
Area Taejeon Kimje Jinju Hamyang
GSDx 0.979 1.000 0.980 1.092
GSDy 0.994 1.000 0.996 1.048

L o g o
Validation of the use of natural targets
Daejeon Tarp NaturalPoints 10 2069RER 0.2967 0.3028SNR 59.10 49.48H 0.8353 0.8834GRD(m) 2.37 2.68NIIRS 3.53 3.48
22
Artificial targets vs. natural targets Using natural targets, similar quality parameters were assessed
Differences in NIIRS are within the error range of GIQE (1σ=0.30)
Degradation in SNRs from natural targets
We need more test with other dataset
Kimje Tarp Natural
Points 10 976RER 0.2238 0.2768 SNR 38.18 36.84 H 0.7987 0.8324 GRD(m) 2.89 2.87 NIIRS 3.15 3.40
Jinju Tarp Natural
Points 10 730RER 0.3065 0.2898SNR 59.52 42.94H 0.8058 0.8529GRD(m) 2.56 2.86NIIRS 3.62 3.46
Hamyang Tarp NaturalPoints 10 707RER 0.2413 0.2736 SNR 48.68 44.04 H 0.7704 0.8357 GRD(m) 3.34 3.26 NIIRS 3.21 3.29

L o g o
Validation of automated edge selection
Automated edge selection
apply line detection algorithm
check line length (10 pixels)
Extract edge profiles
edge profile selection criteria are same as manual selection
23

L o g o
Validation of automated edge selection Tests with Kompsat-2 images
Quality degradation for automated edge selection (in particular in GRD)
better edge selection criteria required
Differences in NIIRS are within the error range of GIQE (1σ=0.30)
24
Daejeon TarpNaturalManual
NaturalAuto
Points 10 2069 55806RER 0.2967 0.3028 0.2837SNR 59.10 49.48 39.38H 0.8353 0.8834 0.8474GRD(m) 2.37 2.68 3.03NIIRS 3.53 3.48 3.44
Kimje Tarp NaturalNaturalAuto
Points 10 976 55806RER 0.2238 0.2768 0.2707SNR 38.18 36.84 34.49H 0.7987 0.8324 0.8198GRD(m) 2.89 2.87 3.11NIIRS 3.15 3.40 3.39
Jinju Tarp NaturalNaturalAuto
Points 10 730 17858RER 0.3065 0.2898 0.2768SNR 59.52 42.94 38.15H 0.8058 0.8529 0.8445GRD(m) 2.56 2.86 3.31NIIRS 3.62 3.46 3.40
Hamyang Tarp NaturalNaturalAuto
Points 10 707 36101RER 0.2413 0.2736 0.2716SNR 48.68 44.04 36.02H 0.7704 0.8357 0.8314GRD(m) 3.34 3.26 3.44NIIRS 3.21 3.29 3.28

L o g o
Validation of automated edge selection
GRD/NIIRS estimation from sat. images
25
QB001
QB001 IK001 K001
Acquisition date 2005/1/15/2/27 2002/2/7/2/34 2007/2/23/01/49
Area Daejeon Daejeon Damyang
Image size 25044×27552 11004×11004 15000×15500
GSD X(m) 0.793 0.90 1.086
GSD Y(m) 0.711 0.96 1.039
G(Noise Gain) 4.16 4.16 2.34
QB001IK001 K001

L o g o
Validation of automated edge selection
typeedge
selectionpoints RER SNR H GRD(m) NIIRS
PublishedNIIRS
QuickBirdmanual 2692 0.6389 42.89 1.037 1.11 4.65
4.5000 auto 20991 0.6128 38.55 1.043 1.15 4.57
IKONOSmanual 1247 0.5354 38.04 1.012 1.46 4.11
4.3000 auto 7387 0.5334 36.67 1.023 1.49 4.09
Kompsat-2manual 372 0.3705 36.41 0.957 2.68 3.51
-auto 11749 0.3336 34.29 0.932 2.99 3.39
26
GRD/NIIRS estimation from sat. images- using natural targets
- manual or automatic selection
- Published NIIRS : Value in Metadata (QB) or in literature (IK)
- Slight quality degradation for automated selection (but not big)
- Differences in NIIRS are within the error range of GIQE (1σ=0.30)

L o g o
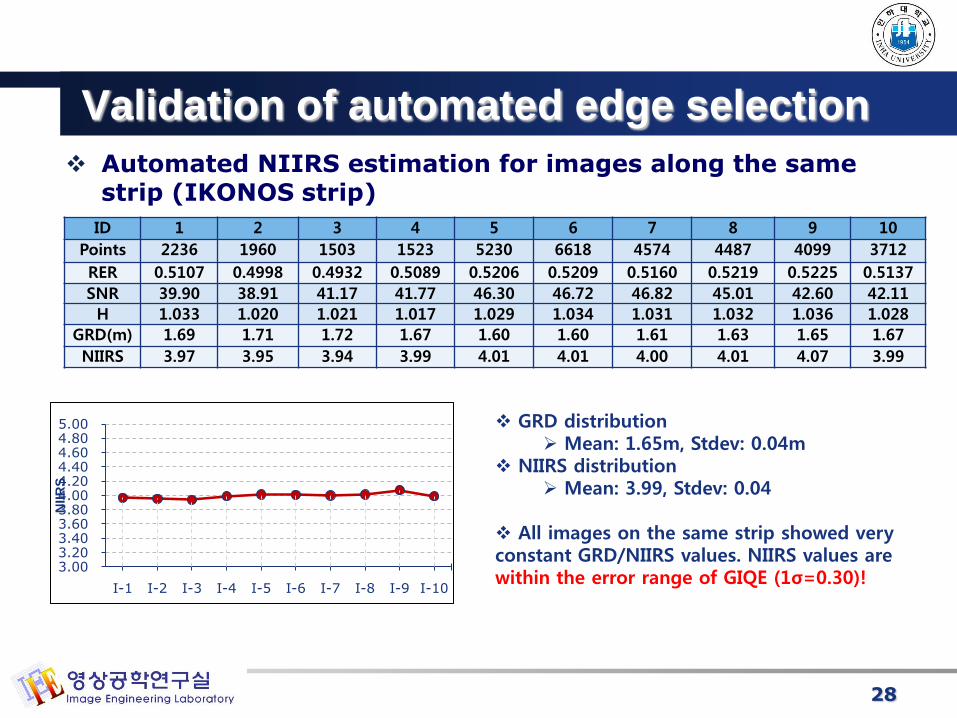
Validation of automated edge selection
Automated NIIRS estimation for images along the same strip (Komspat-2 strip)
27
ID 1 2 3 4 5 6 7 8 9 10
Points 2316 2054 2493 1995 3059 3876 4336 3683 3497 2310
RER 0.3841 0.3894 0.3966 0.3901 0.4026 0.4186 0.4205 0.4160 0.4190 0.4201
SNR 36.34 34.77 35.19 35.24 34.80 34.10 34.41 35.17 35.32 35.32
H 1.051 1.056 1.057 1.055 1.059 1.060 1.058 1.064 1.066 1.071
GRD(m) 2.92 2.93 2.89 2.91 2.87 2.79 2.78 2.81 2.82 2.82
NIIRS 3.36 3.36 3.39 3.37 3.41 3.46 3.42 3.40 3.46 3.45
GRD distribution Mean: 2.86m, Stdev: 0.06m
NIIRS distribution Mean: 3.40, Stdev: 0.04
All images on the same strip showed very constant GRD/NIIRS values. NIIRS values are within the error range of GIQE (1σ=0.30)!2.00
2.20 2.40 2.60 2.80 3.00 3.20 3.40 3.60 3.80 4.00
NIIR
S
L o g o
Validation of automated edge selection
Automated NIIRS estimation for images along the same strip (IKONOS strip)
28
ID 1 2 3 4 5 6 7 8 9 10
Points 2236 1960 1503 1523 5230 6618 4574 4487 4099 3712
RER 0.5107 0.4998 0.4932 0.5089 0.5206 0.5209 0.5160 0.5219 0.5225 0.5137
SNR 39.90 38.91 41.17 41.77 46.30 46.72 46.82 45.01 42.60 42.11
H 1.033 1.020 1.021 1.017 1.029 1.034 1.031 1.032 1.036 1.028
GRD(m) 1.69 1.71 1.72 1.67 1.60 1.60 1.61 1.63 1.65 1.67
NIIRS 3.97 3.95 3.94 3.99 4.01 4.01 4.00 4.01 4.07 3.99
3.00 3.20 3.40 3.60 3.80 4.00 4.20 4.40 4.60 4.80 5.00
I-1 I-2 I-3 I-4 I-5 I-6 I-7 I-8 I-9 I-10
NIIR
S
GRD distribution Mean: 1.65m, Stdev: 0.04m
NIIRS distribution Mean: 3.99, Stdev: 0.04
All images on the same strip showed very constant GRD/NIIRS values. NIIRS values are within the error range of GIQE (1σ=0.30)!

L o g o
Conclusions
Conclusions
GRD/NIIRS estimation through edge analysis
Feasible but tests with ref. NIIRS are required.
The use of natural target
Feasible but tests with more dataset are required.
Automated image quality assessment is feasible
But, more rigorous selection criteria is required
Can the proposed method be used for image quality assessment for operational basis?