Automated Analysis of Spatial Grids: Introduction - Cooperative
34
Transcript of Automated Analysis of Spatial Grids: Introduction - Cooperative
VAL L I AP PA L AK S H M AN A N
L AK S H M AN @ O U . E D U
METR 5970
Automated Analysis of Spatial
Grids
What’s this course about?
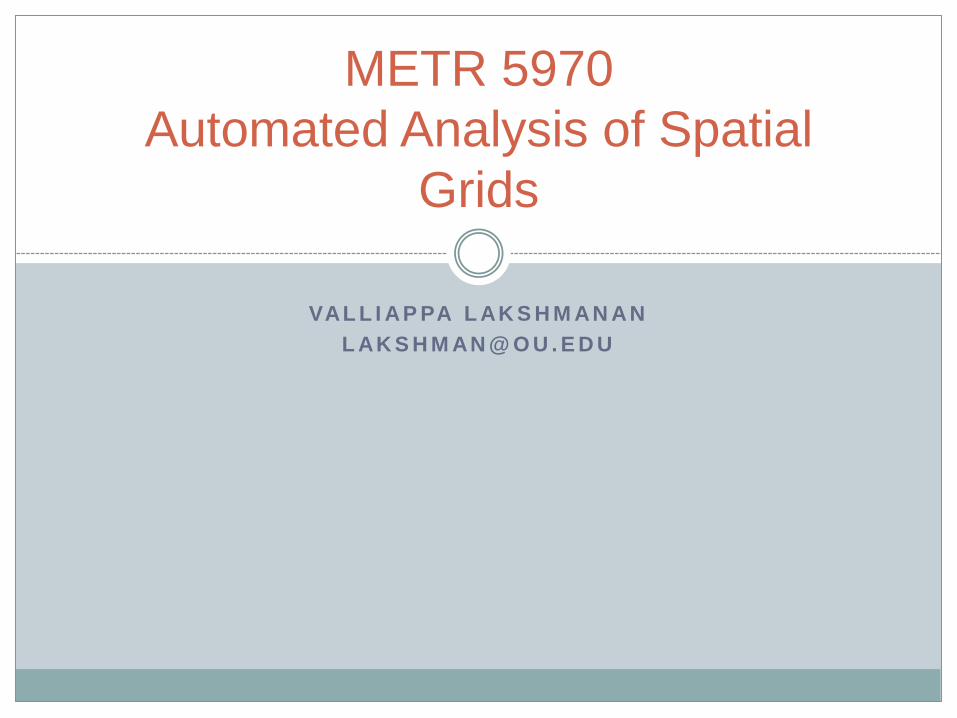
Provides a foundation in topics of digital image processing and data
mining as applied to geospatial datasets
Devise and implement automated techniques to extract information
from spatial grids
Example grids that we’ll use in this course:
Population density grid
Objectively analyzed precipitation grid
Satellite infrared (11-micron) channel
Ground-based radar reflectivity image
Reanalysis data (AI 2014 competition)
http://ai.metr.ou.edu/contest/

Hours
3 credit hours per week = 120 min
Class meets Tues and Thurs 3.15pm to 4.30pm (w/5 min break)
NWC 5820
Office hours at NWC 4457 on Fridays 3pm-5pm
Feel free to drop in to my office on other afternoons
Or make an appointment via email
Textbook and slides
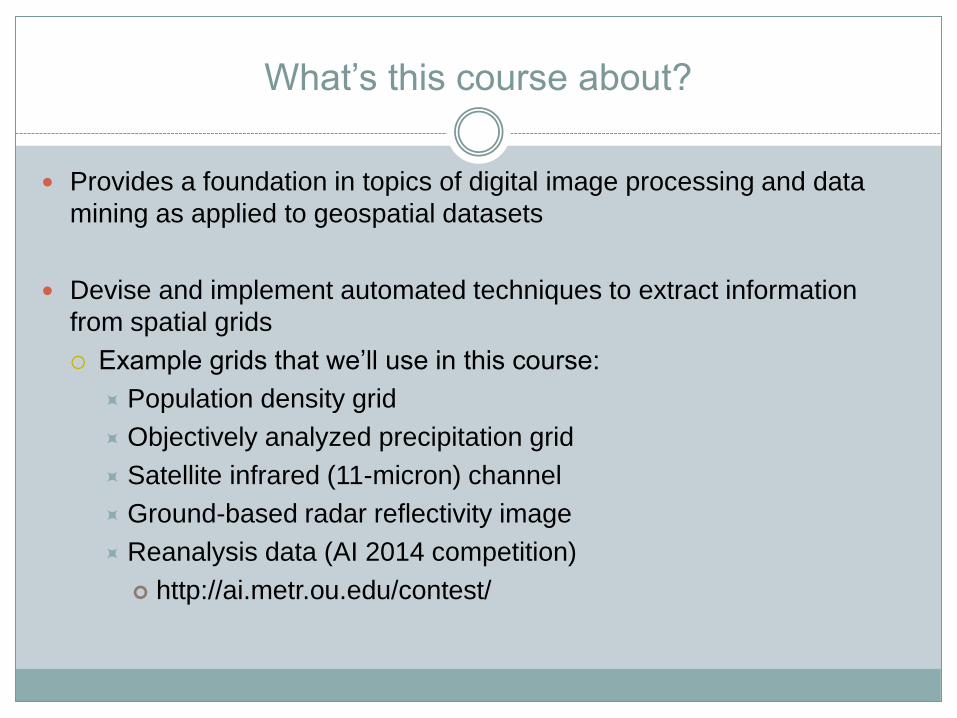
You can download the PDF free
Make sure you are on OU (or other university) network
www.springer.com/engineering/signals/book/978-94-007-4074-7
Can also order paper copy for $25
Have to be on OU network
The textbook is targeted toward practitioners
Does not get into much of the theory
For our graduate-level course, we will supplement it with journal papers
All my slides will be placed online by the time the class starts:
http://cimms.ou.edu/~lakshman/
Supplementary Material
You will be expected to look up any necessary information in academic
journals and in readily available sources such as maps. Most papers
can be obtained free from the journal websites if you are on an OU
network.
Majority of your learning will happen through reading, programming and
experimentation. Class work and homework are meant to get you
thinking and are an integral part of this course.
Office hours are exclusively for discussion of ideas/concepts. Do not
bring code that needs to be debugged.
Grading policy
Undergraduate students: course grade will be based on five lab
assignments (80%) and an exam (20%).
Graduate students: course grade will be based on six lab assignments
(60%), an exam (20%) and a term project (20%).
Letter grades are based on absolute points and will not be curved: A
(>= 90%), B (>= 80%), C (>= 70%), D (>= 60%), F (< 60%).
Each lab assignment and term project is graded on a scale of 10
points. Late submissions are subject to a penalty of 2 points off per day.
No credits will be given for assignments or projects that are late for
more than 5 days, unless granted prior permissions.
Exams and Reports
The exam will cover concepts covered in the class; the exact format of the exam (multiple-choice/short-answer/computer-project etc.) is subject to change.
The topic of the term project (graduate students only) will be chosen by the student and approved by the instructor; the term project sometime after the mid-point of the semester.
You will have to present your work as a 12-minute talk
All work should be submitted digitally (learn.ou.edu).
Reports should follow the format of conference papers of either the American Meteorological Society (AMS) or the IEEE and be in PDF (Microsoft Word, Powerpoint, etc. are not acceptable).
Extra credit homework
I’ll assign more than six homework assignments
I will take the best 5/6 to compute your homework grade
i.e. “extra-credit” homeworks can be used to replace/make-up any
mandatory homework
I strongly recommend that you do them all, as this is the best way to
learn the subject
Graduate students can also use extra-credit homework as the starting
point for your term projects
Have to talk to me first to make sure scope is reasonable
Undergraduates can do a term project for makeup/extra credit
Classes have a heavy hands-on component
You can use the meteorology computer lab or your laptop
If you need specific software in the computer lab, let me know
My examples will use Eclipse and Java
The textbook comes with example code; you can use it as a guide,
but you should attempt to implement it yourself
Alternate software (IDL, Python, Matlab, C++, etc.) and hardware
(your own laptop) are allowed: pick a tool/language that supports
arrays, data structures, display capability
Bring your laptop to class if you are using it
If the homework task (e.g. map projection, object identification,
smoothing, etc.) is a built-in library function, you should not use that
library function; instead, you should implement it yourself Did I mention that I will not help you debug your code? Organize assignments so that you have intermediate outputs. You will not receive any credit for partial code, only for partial outputs.

Integrity
Each student in this course is expected to abide by Academic Integrity
You are encouraged to study together and to discuss information and
concepts covered in lecture and the sections with other students. You
can give "consulting" help to or receive "consulting" help from such
students on lab assignments or activities.
However, this permissible cooperation should never involve one
student having possession of a copy of all or part of work done by
someone else.

Accommodations
Any student in this course who has a disability that may prevent him or
her from fully demonstrating his or her abilities should contact the
instructor personally as soon as possible so accommodations can be
made to ensure full participation and facilitate your educational
opportunities.
It is the policy of the University to excuse absences of students that
result from religious observations and to provide without penalty for the
rescheduling of examinations and additional required class work that
may fall on religious holidays.

L AK S H M AN @ O U . E D U
Introduction
Why Geography?
Geography a very good way to tie together disparate data sets
Suppose you have two datasets:
Location of fire hydrants
Population density
How would you answer:
Are there clusters of population too far away from a fire hydrant?
Is a fire hydrant required to support too many people?
Answers to both questions rely on the two data sets being tied together
by location
GIS
Geographic Information Systems (GIS) is the term for software that
allows one to tie together geographical data sets so as to carry out
spatial analyses.
Database capable of storing data that describes places on earth
Operation that makes use of geographic coordinates
What is a spatial operation?
What spatial operations are required for hydrant example?
Can you provide an instance of a non-spatial operation?
GIS are interactive
Off-the-shelf GIS, such as ESRI’s ArcInfo, are commonly used to
answer spatial queries in an interactive manner
In Scotland, it is permissible to camp without permission on any public
hill land as long as you are 100m from a road
What are the datasets you might need to address this with GIS?
What are the spatial operations you might perform?
How would you obtain the answer?
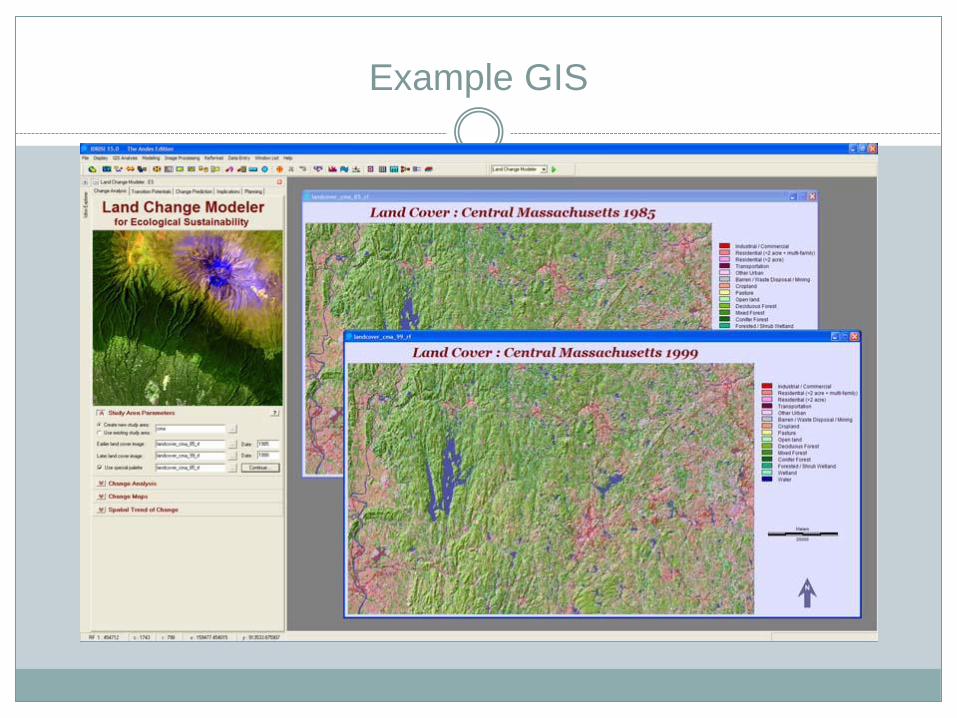
Example GIS
Problem with interactivity
The last step in Scotland camping problem is to visually inspect where
there is public hill land outside a 100m buffer drawn around roads
Human interaction does not scale very well
Workable if analyzing data for a single town or at a single time
Human interaction does not scale to “Big Data”
Data sets are not static, but dynamic: you get new data to analyze
every few minutes (e.g: weather)
Data sets are large and cover more than just a single town
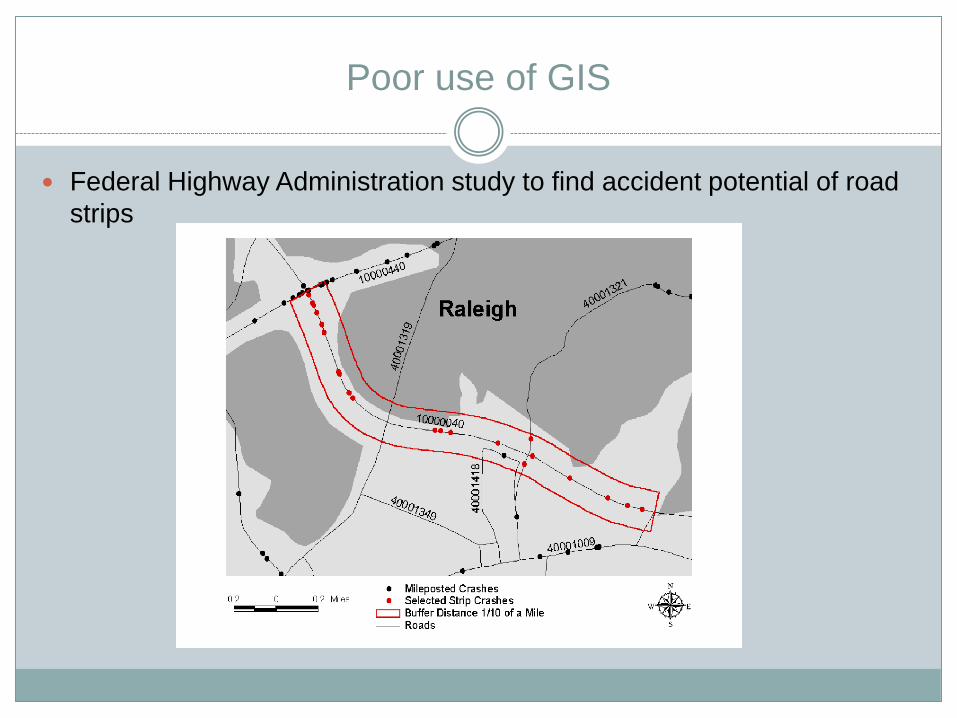
Poor use of GIS
Federal Highway Administration study to find accident potential of road
strips
Aim of course
The aim of this course is to describe techniques to carry out analyses
of spatial data sets, specifically gridded data sets, automatically i.e.
without human intervention.
Human intervention will be required when you create the algorithm to
analyze the data, of course, but once created, the algorithm can be
applied automatically to large or to dynamic data sets without constant
human supervision.
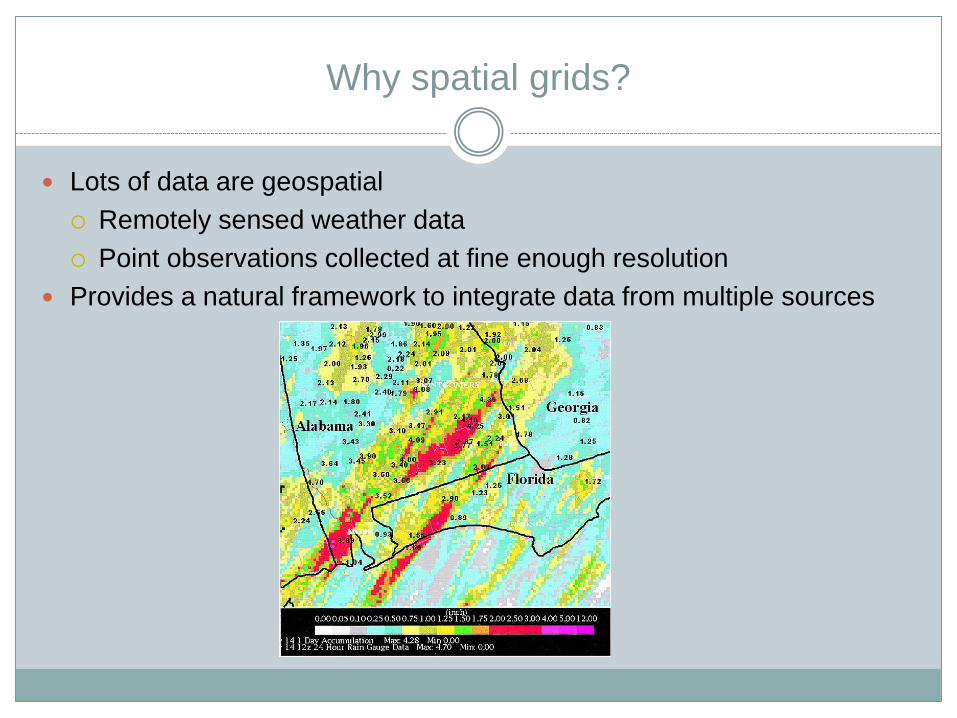
Why spatial grids?
Lots of data are geospatial
Remotely sensed weather data
Point observations collected at fine enough resolution
Provides a natural framework to integrate data from multiple sources
Data quantities can be tremendous
As quantity of data increases, manual analysis no longer possible
WSR-88D weather radar data from just the Southern Region of the
US amounts to an average of 480KB per second compressed i.e.
this is the true "information content" of the data.
Source: IRADS: www.irads.net/technical.php
GOES-R data rate after compression may be as much as 3
MB/second
Source: www.aero.org/publications/crosslink/winter2005/07.html
10m terrain resolution publicly available for much of the world
www.gearthblog.com/blog/archives/2007/06/google\_releases\_hig
h.html
Advantageous to replace visual analysis by automated algorithms
Real-time analysis required
Automated analysis often has to replace interactive analysis
Data arriving in real-time
Data rate can be quite high
Information from images may not matter if not timely
Need fast, reliable, accurate automated algorithms
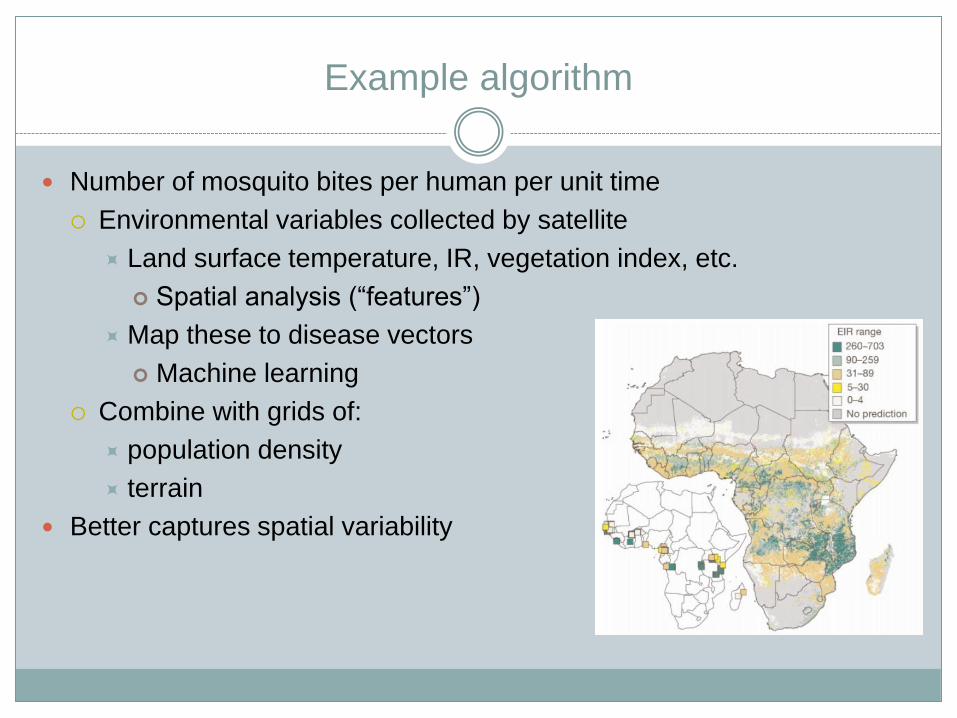
Example algorithm
Number of mosquito bites per human per unit time
Environmental variables collected by satellite
Land surface temperature, IR, vegetation index, etc.
Spatial analysis (“features”)
Map these to disease vectors
Machine learning
Combine with grids of:
population density
terrain
Better captures spatial variability
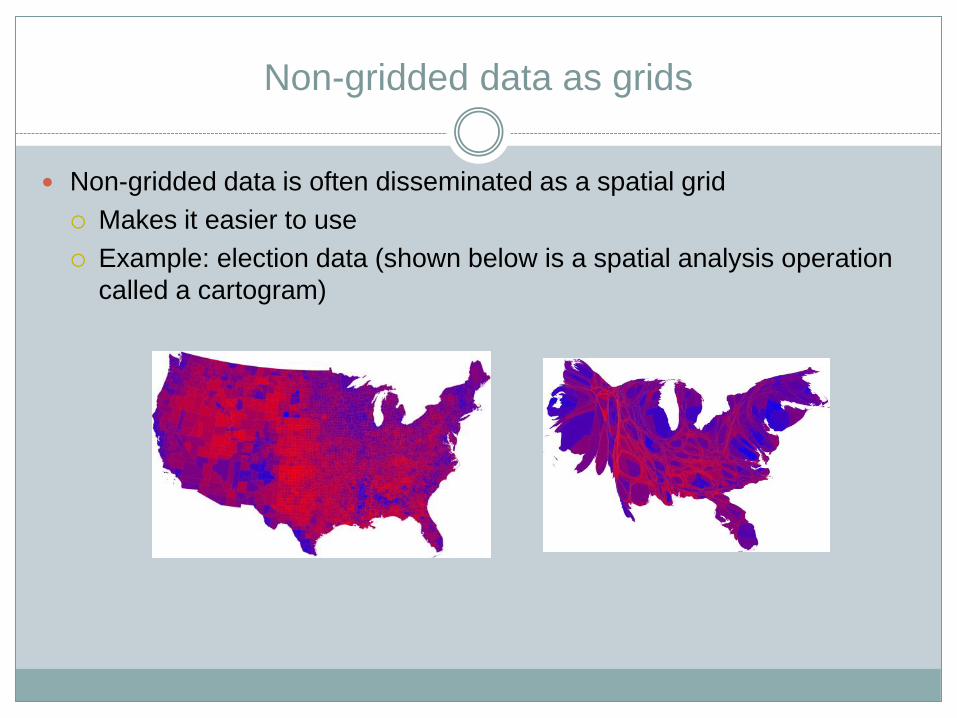
Non-gridded data as grids
Non-gridded data is often disseminated as a spatial grid
Makes it easier to use
Example: election data (shown below is a spatial analysis operation
called a cartogram)
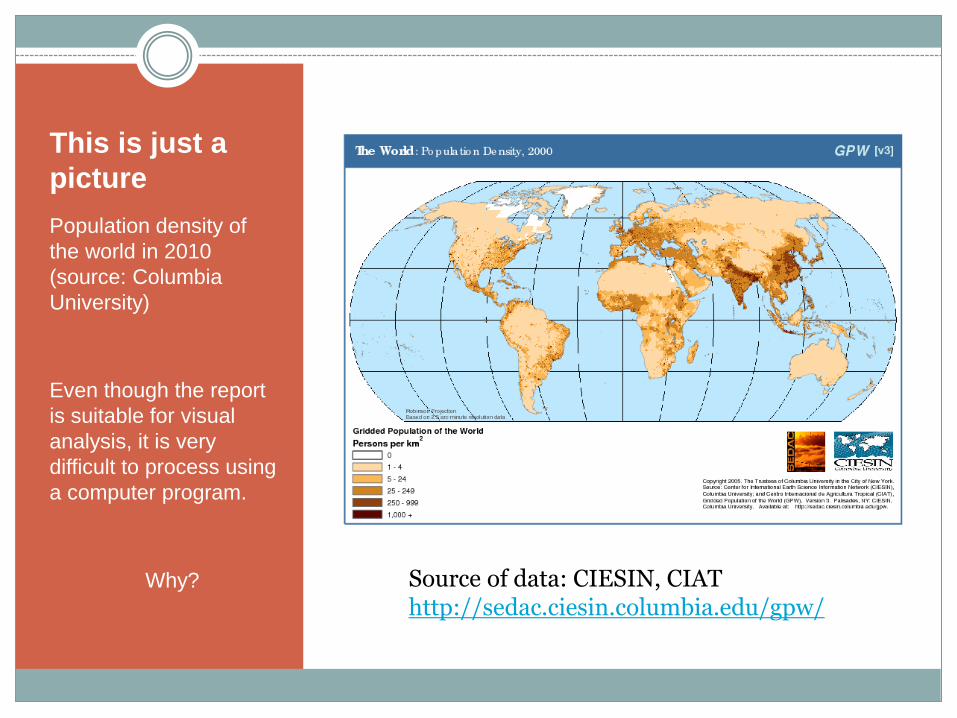
This is just a
picture
Population density of
the world in 2010
(source: Columbia
University)
Even though the report
is suitable for visual
analysis, it is very
difficult to process using
a computer program.
Why?
Source of data: CIESIN, CIAT http://sedac.ciesin.columbia.edu/gpw/
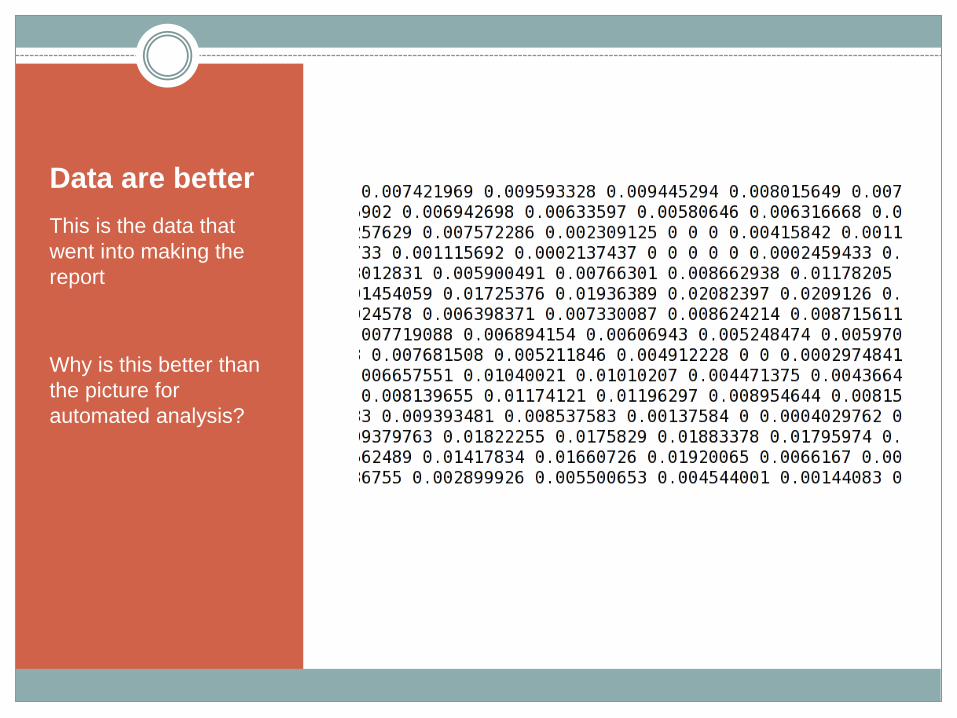
Data are better
This is the data that
went into making the
report
Why is this better than
the picture for
automated analysis?
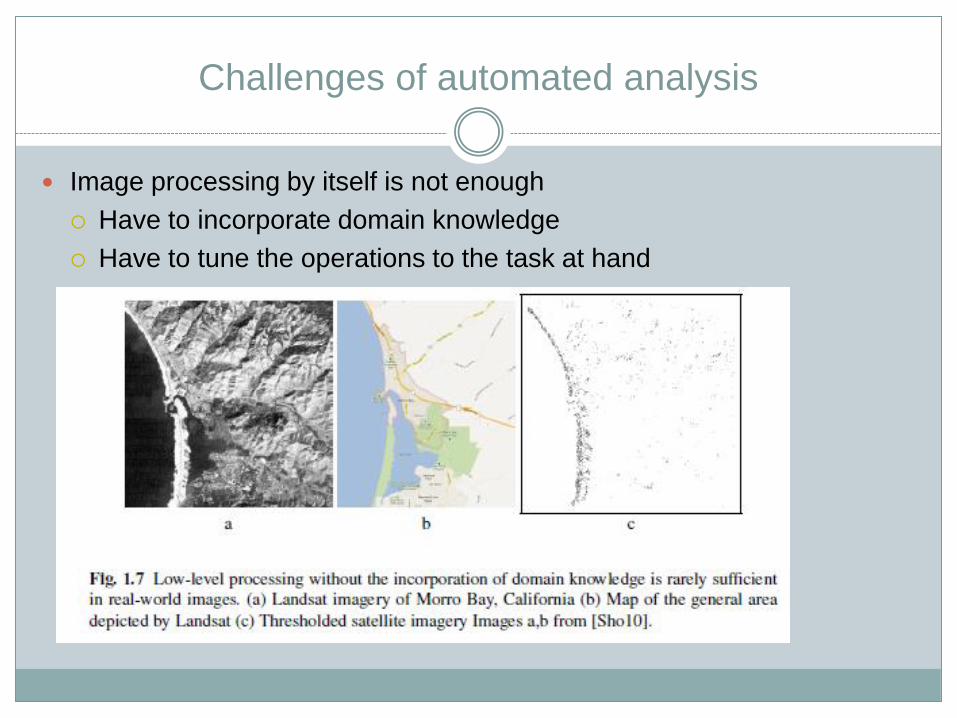
Challenges of automated analysis
Image processing by itself is not enough
Have to incorporate domain knowledge
Have to tune the operations to the task at hand
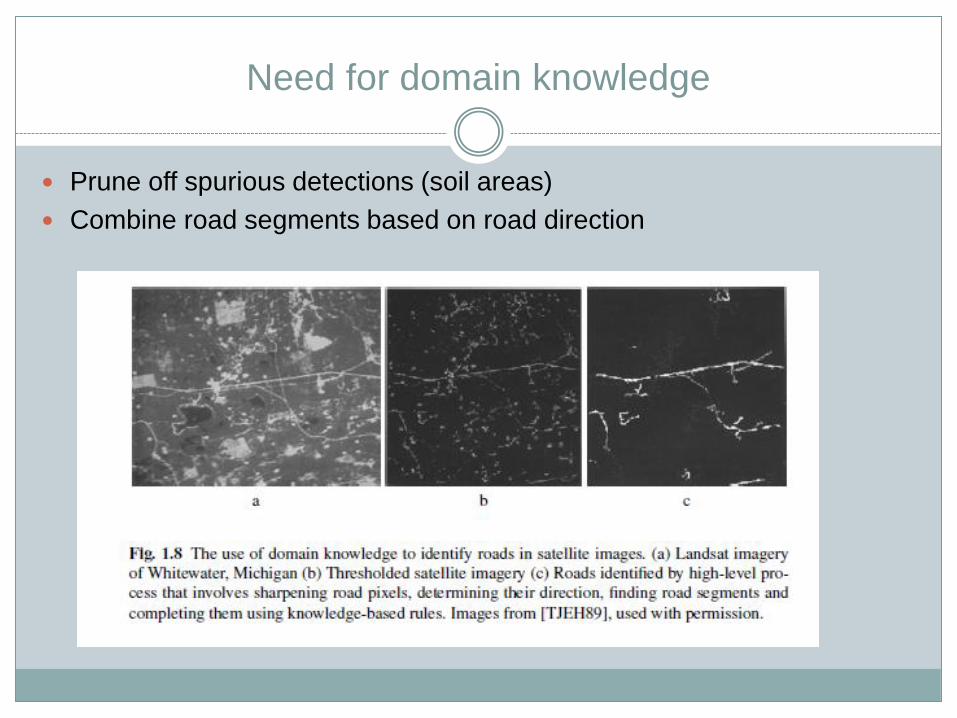
Need for domain knowledge
Prune off spurious detections (soil areas)
Combine road segments based on road direction
Codification of knowledge
Hardest aspect of processing spatial grids is to encode instinctive
knowledge into rules for automated system
What kinds of road intersections are reasonable?
Under what circumstances can you have roads that are not
connected to anything else?
Where are roads likely to asphalt vs. concrete?
How would you distinguish between rivers and roads?
Will manmade canals mess up this distinction?
How about bridges?
Challenges in automated spatial analysis
A combination of three things:
processing needs to be carried out on data, not on pictures
domain knowledge needs to inform the choice of low-level operations
and post-processing of the results
seemingly obvious relationships have to be carefully encoded as
rules
Highly unlikely that any off-the-shelf, general-purpose toolkit will be
able to extract just the right information from your data
Image processing frameworks are “toolkits”
You will have to code up your processing technique, understand the
operations that are being performed and be able to adapt them to the
needs of your domain and the quirks of your data set
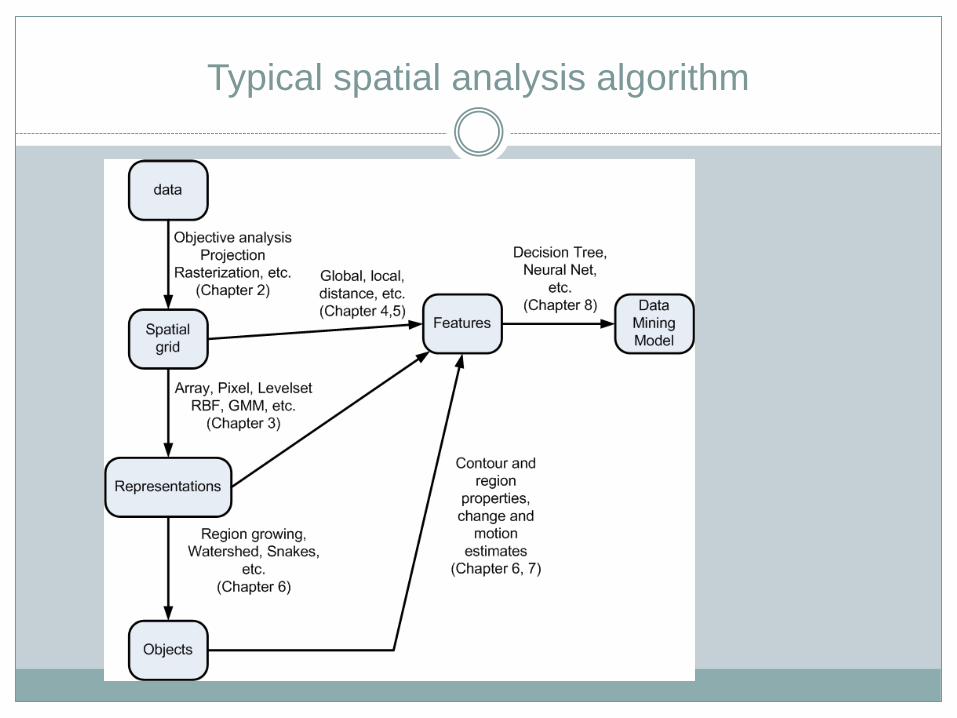
Typical spatial analysis algorithm
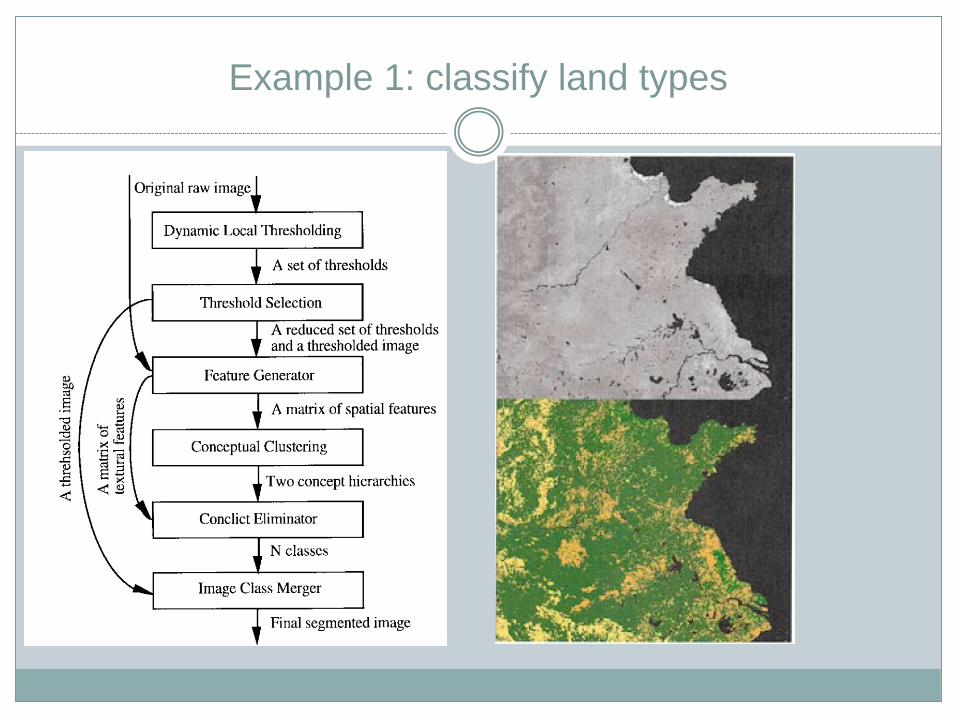
Example 1: classify land types
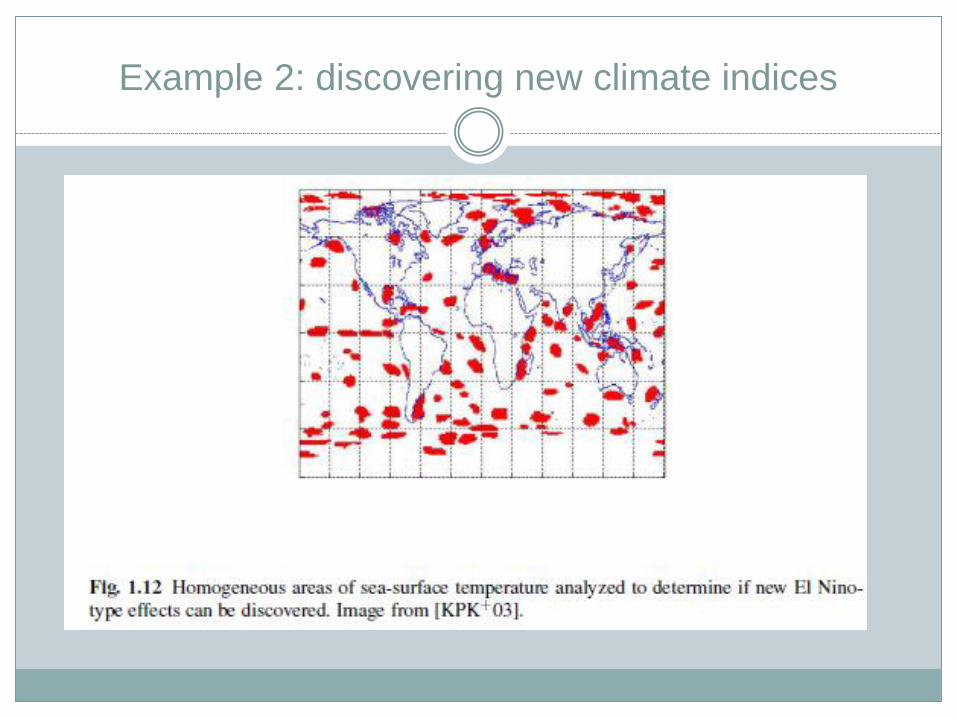
Example 2: discovering new climate indices
Reading
Chapter 1 of textbook
S. Goetz, S. Prince, and J. Small. Advances in satellite remote sensing
of environmental variables for epidemiological applications. Adv.
Parasitol., 47:289–307, 2000
R. Fraser, A. Abuelgasim, and R. Latifovic. A method for detecting
large-scale forest cover change using coarse spatial resolution
imagery. Remote Sensing of Environment, 95(4):414–427, 4 2005.
All three are available as PDFs free from OU libraries
Just access site from an OU network