Author's personal copyenergetics.chm.uri.edu/system/files/mh_cer_as_cs07.pdfAuthor's personal copy...
11
This article appeared in a journal published by Elsevier. The attached copy is furnished to the author for internal non-commercial research and education use, including for instruction at the authors institution and sharing with colleagues. Other uses, including reproduction and distribution, or selling or licensing copies, or posting to personal, institutional or third party websites are prohibited. In most cases authors are permitted to post their version of the article (e.g. in Word or Tex form) to their personal website or institutional repository. Authors requiring further information regarding Elsevier’s archiving and manuscript policies are encouraged to visit: http://www.elsevier.com/copyright
-
Upload
trankhuong -
Category
Documents
-
view
215 -
download
1
Transcript of Author's personal copyenergetics.chm.uri.edu/system/files/mh_cer_as_cs07.pdfAuthor's personal copy...

This article appeared in a journal published by Elsevier. The attachedcopy is furnished to the author for internal non-commercial researchand education use, including for instruction at the authors institution
and sharing with colleagues.
Other uses, including reproduction and distribution, or selling orlicensing copies, or posting to personal, institutional or third party
websites are prohibited.
In most cases authors are permitted to post their version of thearticle (e.g. in Word or Tex form) to their personal website orinstitutional repository. Authors requiring further information
regarding Elsevier’s archiving and manuscript policies areencouraged to visit:
http://www.elsevier.com/copyright

Author's personal copy
Shock loading and drop weight impact response of glassreinforced polymer composites
Michael Hebert, Carl-Ernst Rousseau *, Arun Shukla
Department of Mechanical Engineering, University of Rhode Island, 222-B Wales Hall, Kingston, RI 02881, United States
Available online 27 July 2007
Abstract
Response of E-glass reinforced vinyl ester and urethane panels of varying structures subjected to shock loading and drop weightimpact loading have been studied. Shock waves are created using a shock tube with a testing range of 3.08–7.53 MPa peak incident pres-sure. The materials performance under shock loading was evaluated by post-mortem visual damage assessment, residual compressivestrength, and permanent deformation mapping of the panels. Drop weight impact performance was measured by energy absorbed bythe samples, depth of penetration, and extent of internal damage. Glass preforms having total areal weights 144 and 216oz=yd2 (4.88and 7:32kg=m2 ) were infused with either one of three separate types of vinyl ester and one urethane resin. The results show that urethanepanels having total glass preform areal weight of 216oz=yd2 ð7:32kg=m2Þ performed better than similar vinyl ester resin panels. It was alsofound that of two materials with identical vinyl ester resins having total preform areal weight of 144oz=yd2 ð4:88kg=m2Þ, the one with a finerglass structure consistently performed better in all evaluation criteria for shock wave and drop weight impact testing.� 2007 Elsevier Ltd. All rights reserved.
Keywords: Shock loading; Shock tube; Impact testing; Glass reinforced composites
1. Introduction
The response of composite materials subjected todynamic loading has received much attention recently.Application of the materials can be found both in thetransportation industry and in military structures. Thesematerials are being used increasingly due to their superiorstrength, light weight, and adaptable design. However, indynamic situations their behavior is very complex due toa large number of factors that govern the response. Thesefactors include the strain rate sensitivity of many propertiesof the polymer resin [1], the arrangement of fibers, andthickness of the material [2]. Further developing the under-standing of composite materials behavior under impulsiveloading conditions is crucial for applications such as trans-portation of explosive material, collision, and use as armor.Common methods of dynamically loading composite mate-
rials are shock wave loading by use of explosives [3] andshock tubes [4–6], high velocity impact loading [7–9], anddrop weight impact tests [2,10].
The use of shock tubes to create impulsive loading sce-narios is preferred over the use of explosives given thatshock tubes allow for the formation of a planar and uni-form wave front [4]. Indeed uniformity in loading is crucialto both precise experimental measurements and modelingpurposes. Measurements often taken from materials sub-jected to shock loading are plate deflection during loading[6], post-mortem compressive strength, permanent defor-mation, and visual assessment [5]. These allow for compar-ative analysis of various material structures. Other workhas also been undertaken to develop numerical formula-tions for these materials when subjected to shock loading[4,11].
Impact loading behavior of glass fiber reinforced poly-mer composites has been studied primarily to evaluatestress wave progression in these materials [7–9]. Other stud-ies have used drop weight impact testing to provide com-parative results of the damage resistance of different
0263-8223/$ - see front matter � 2007 Elsevier Ltd. All rights reserved.
doi:10.1016/j.compstruct.2007.07.002
* Corresponding author. Tel.: +1 401 874 2542; fax: +1 401 874 2355.E-mail address: [email protected] (C.-E. Rousseau).
www.elsevier.com/locate/compstruct
Available online at www.sciencedirect.com
Composite Structures 84 (2008) 199–208

Author's personal copy
material types [2,10]. These studies measure force, acceler-ation, velocity, displacement, and energy during the impactevent and focus mainly on the energy absorbed by the sam-ples and visible damage as evaluation criteria.
The present study focuses on a series of woven E-glassreinforced polymer resin sheets (manufactured by Vector-Ply, Rhode Island) subjected to both shock wave loadingand drop weight impact loading. These panels display vari-ations in the polymer resin material and in the areal weightof the fiber preforms. Post-shock loading measurementsinclude visual damage assessment, residual compressivestrength, and plots of permanent deformation. Dropweight impact test measurements include total energyabsorbed, depth of penetration, and extent of radial inter-nal damage. The assessment method is primarily compara-tive and judges material performance as a function of resintype and internal structure.
2. Materials
A series of E-Glass reinforced polymer panels was man-ufactured by VectorPly. Each type of panel was con-structed from one of three different glass preforms havingareal weights of 36oz=yd2 ð1:22kg=m2Þ, 72oz=yd2 ð2:44kg=m2Þ,or 108oz=yd2 ð3:66kg=m2Þ, and either a vinyl ester or a ure-thane resin. The 36oz=yd2 ð1:22kg=m2Þ preforms (E-2LTi3600) consist of four plies of areal weights 9oz=yd2
ð0:31kg=m2Þ with layered orientation alternating between0� and 90� as seen in Fig. 1. The dry preforms are stitchedtogether in order to hold position and structure with apolyester fiber as seen in Fig. 2. The stitching is performedcarefully, such as to avoid crimping, which can become asource of stress concentration. The 72oz=yd2 ð2:44kg=m2Þ pre-forms (E-2LTi 7200) consist of four plies of areal weights18oz=yd2 ð0:61kg=m2Þ layered in the same manner as the3600 preform. Separate vinyl ester resin panels were madeof two 72oz=yd2 ð2:44kg=m2Þ and four 36oz=yd2 ð1:22kg=m2Þpreforms so that the thickness and total areal weight ofglass were the same. Hence the materials vary only in rela-
tion to the structure of the glass. The 108oz=yd2 ð3:66kg=m2Þpreforms (E-3LTi 10800) consist of six plies of arealweights 18oz=yd2 ð0:61kg=m2Þ with layered orientation alter-nating between 0 � and 90 �. All glass preforms have tensileand compressive strengths of 438 MPa and elastic modulusof 23 GPa in both the warp (0 �) and fill (90 �) directions.
The polymer is added to the preforms in a close moldedinfusion process. The non-crimped and spaced performlayout allows for proper flow of polymer throughout thepanel. Panels having total areal weights of 144oz=yd2
ð4:88kg=m2Þ have final laminate thickness between 4.3 mmand 4.8 mm, while the panels of weights 216oz=yd2
ð7:32kg=m2Þ are 5.6–6.2 mm thick. The variation in thick-ness is due to pressure from the vacuum bag during themanufacturing process. Table 1 lists the six types of com-posite materials that were studied.
3. Methods of evaluation
3.1. Dynamic evaluation of pure resins
To further supplement the mechanical characteristics ofthe pure resins, high strain rate compression tests were per-formed using a split-Hopkinson pressure bar (SHPB).Thin, cylindrical specimens are located between incidentand transmitted aluminum bars, both of which are pre-pared with strain gages located at equal distance fromthe specimen. A third bar, the striker bar is fired into theincident bar to create a strain pulse. As the pulse reachesthe specimen, part of the pulse is reflected due to the mate-rial mismatch, and part is transmitted through the speci-men and into the transmitter bar. Using the recordedstrain waves and one-dimensional wave propagation the-ory, the following equations are derived to determine thestress and strain history in the specimen [12,13] :Fig. 1. 36oz=yd2 ð1:22 kg=m2 Þ E-glass preform diagram (E-2Lti 3600).
Fig. 2. 36oz=yd2 ð1:22 kg=m2 Þ E-glass preform prior to polymer infusion.
200 M. Hebert et al. / Composite Structures 84 (2008) 199–208

Author's personal copy
rðtÞ ¼ EAAs
� �eT; ð1Þ
eðtÞ ¼ �2C0
L
ZeR dt; ð2Þ
where As is the specimen cross sectional area, eT is thetransmitted strain, eR is the reflected strain, C0 is the wavespeed in aluminum, and L is the specimen thickness. Spec-imens of thickness 3.175 mm (0.125 in.) and diameter9.525 mm (0.375 in.) were cut from the pure resin samplesand tested using a 13 mm (0.5 in.) diameter SHPB testingapparatus. Strain data was recorded using dynamic strainrecording instruments and processed using a MATLABcode to obtain dynamic stress–strain curves.
3.2. Drop weight impact testing
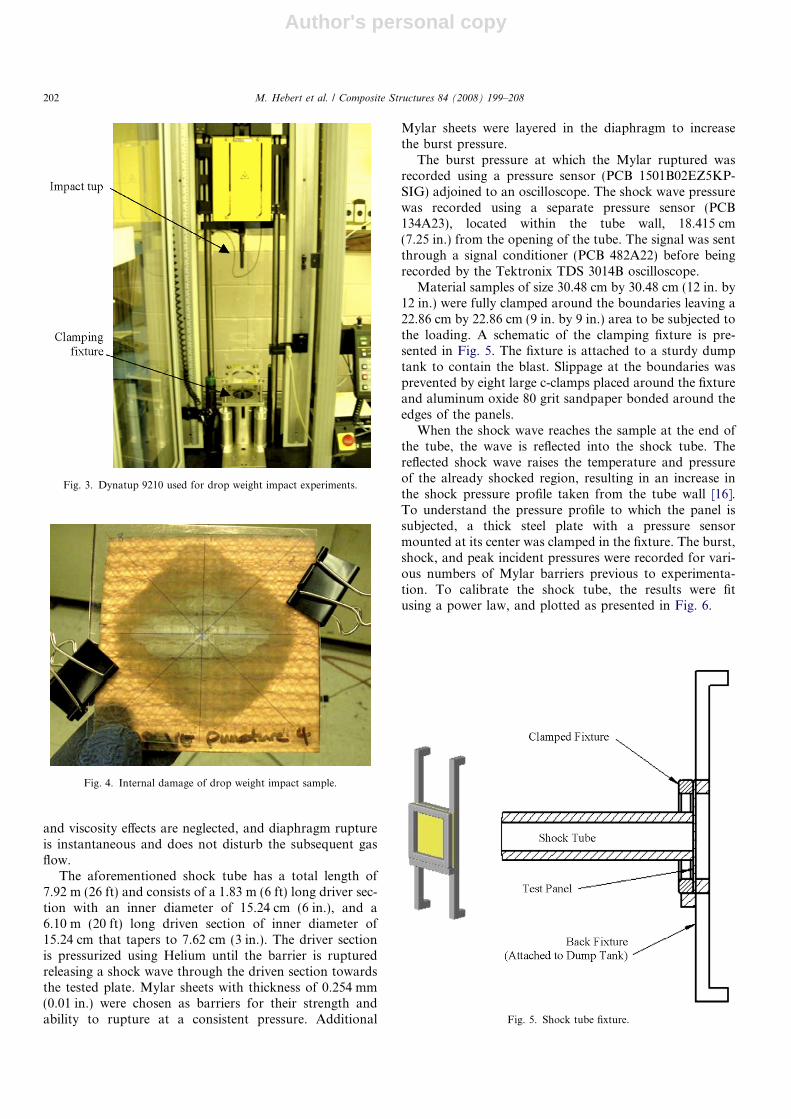
Drop weight impact tests were performed on 10.16 cmby 10.16 cm (4 in. by 4 in.) plates, and the impact tough-ness calculated. The tests were performed on an InstronDynatup model 9210 in. accordance to ASTM D7136[14]. The clamping fixture presented in Fig. 3 was used tosecure the sample and prevent rebound. A 12 kg masswas dropped from a height of 46.6 cm such as to provideat least 3 m/s of impact velocity and 55 J of total impactenergy. The data was recorded from a dynamic load celllocated in the tup head and from a velocity flag positionedto monitor tup velocity during the impact process.
From the recorded load, time, and initial velocity the fol-lowing integration yields the tup velocity versus time curve
vðtÞ ¼ vo �Z
F ðtÞm
dt; ð3Þ
where vo is the initial velocity measured by the flag atimpact. The displacement of the impactor over time isfound by
dðtÞ ¼Z
vðtÞdt: ð4Þ
Integrating the load versus deflection yields an energyabsorbed over time curve:
EðtÞ ¼Z
F ðtÞ ddðtÞdt
dt: ð5Þ
The total energy absorbed by the samples is used as a mea-sure of materials toughness. Post-mortem measurementsinclude the depth of the indentation and damaged area.Indentation depth was calculated according to the ASTMstandard using a depth micrometer and two gage blockspositioned 2.5 cm from the impact site. The extent of thevisual internal damage was measured radially from the cen-ter of the indentation at eight locations as shown in Fig. 4to estimate an average damage radius and area.
3.3. Shock tube testing
A shock tube was used to generate high pressure, shortduration shock waves with planar wave fronts. Fundamen-tally, a shock tube is a long cylinder divided into a highpressure (driver) section and low pressure (driven) sectionby a diaphragm. A sufficient pressure difference causesthe diaphragm to burst, generating a subsequent rapidexpansion of gas. Conservation of mass, energy, andmomentum has been used to generate the following rela-tionships for the pressure, temperature, and density infront of and behind this shock wave [15]:
P 2
P 1
¼ 2cM21 � ðc� 1Þcþ 1
; ð6Þ
T 2
T 1
¼ ½2cM21 � ðc� 1Þ�½ðc� 1ÞM2
1 þ 2�ðcþ 1Þ2M2
1
; ð7Þ
q2
q1
¼ M21ðcþ 1Þ
ðc� 1ÞM21 þ 2
; ð8Þ
where c is the ratio (Cp/Cv) of specific heats of the drivergas, M1 is the mach number of the shock wave relativeto the driven gas, and subscripts 1 and 2 represent proper-ties ahead of and behind the shock wave front, respec-tively. Eqs. (6)–(8) are valid for the followingassumptions of the gas flow: one-dimensional flow, thegas is ideal and has constant specific heats, heat transfer
Table 1Panels and compositions
Panel type Resin Resin tensilemodulus (GPa)
Resin tensilestrength (MPa)
Glassstructure
Fiber content per preformðoz=2
ydÞ=ðkg=m2 Þ
# ofPreforms
2 · 108Urethane
RS technologiesversion
2.4 88.5 E�3LTi10800
108/3.66 2
2 · 72 Urethane RS technologiesversion
2.4 88.5 E�2LTi7200
72/2.44 2
2 · 108 Vinylester (1)
Ashland Derakane411–350
3.2 86.0 E�3LTi10800
108/3.66 2
2 · 108 Vinylester (2)
Reichhold Hydrex100HF
3.8 83.4 E�3LTi10800
108/3.66 2
2 · 72 Vinylester
Hexion 781–2140 3.4 82.7 E�2LTi7200
72/2.44 2
4 · 36 Vinylester
Hexion 781–2140 3.4 82.7 E�2LTi3600
36/1.22 4
M. Hebert et al. / Composite Structures 84 (2008) 199–208 201
Author's personal copy
and viscosity effects are neglected, and diaphragm ruptureis instantaneous and does not disturb the subsequent gasflow.
The aforementioned shock tube has a total length of7.92 m (26 ft) and consists of a 1.83 m (6 ft) long driver sec-tion with an inner diameter of 15.24 cm (6 in.), and a6.10 m (20 ft) long driven section of inner diameter of15.24 cm that tapers to 7.62 cm (3 in.). The driver sectionis pressurized using Helium until the barrier is rupturedreleasing a shock wave through the driven section towardsthe tested plate. Mylar sheets with thickness of 0.254 mm(0.01 in.) were chosen as barriers for their strength andability to rupture at a consistent pressure. Additional
Mylar sheets were layered in the diaphragm to increasethe burst pressure.
The burst pressure at which the Mylar ruptured wasrecorded using a pressure sensor (PCB 1501B02EZ5KP-SIG) adjoined to an oscilloscope. The shock wave pressurewas recorded using a separate pressure sensor (PCB134A23), located within the tube wall, 18.415 cm(7.25 in.) from the opening of the tube. The signal was sentthrough a signal conditioner (PCB 482A22) before beingrecorded by the Tektronix TDS 3014B oscilloscope.
Material samples of size 30.48 cm by 30.48 cm (12 in. by12 in.) were fully clamped around the boundaries leaving a22.86 cm by 22.86 cm (9 in. by 9 in.) area to be subjected tothe loading. A schematic of the clamping fixture is pre-sented in Fig. 5. The fixture is attached to a sturdy dumptank to contain the blast. Slippage at the boundaries wasprevented by eight large c-clamps placed around the fixtureand aluminum oxide 80 grit sandpaper bonded around theedges of the panels.
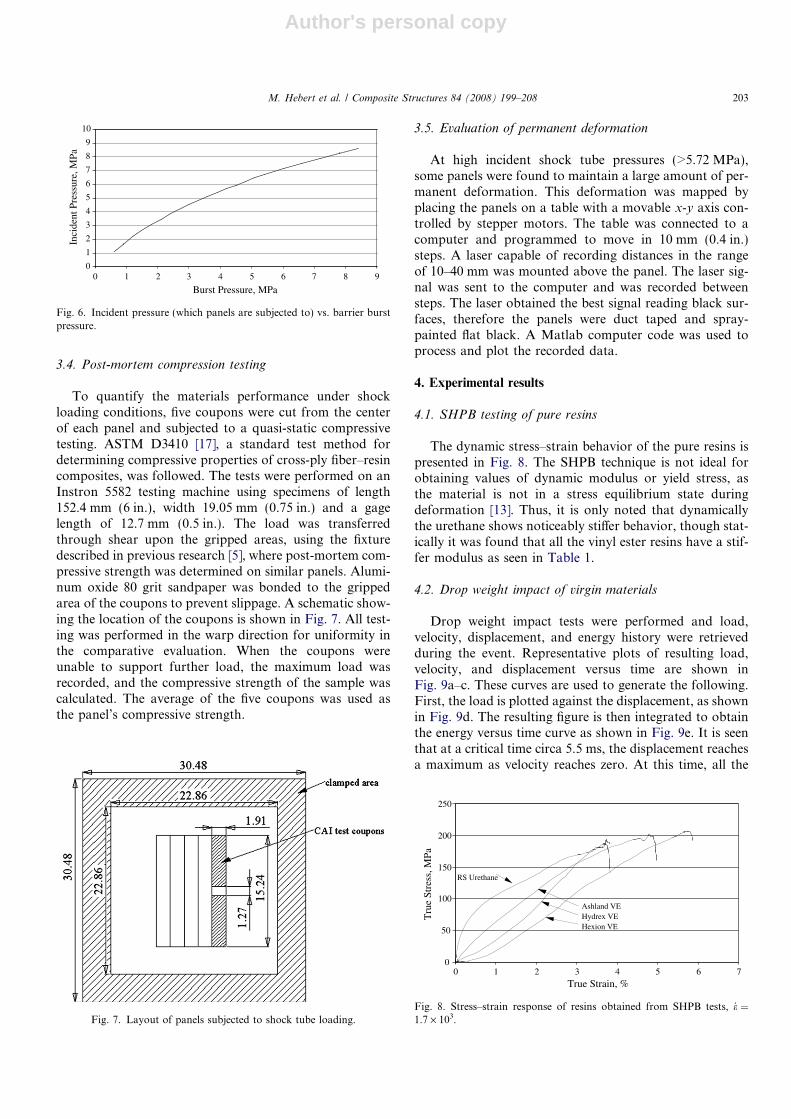
When the shock wave reaches the sample at the end ofthe tube, the wave is reflected into the shock tube. Thereflected shock wave raises the temperature and pressureof the already shocked region, resulting in an increase inthe shock pressure profile taken from the tube wall [16].To understand the pressure profile to which the panel issubjected, a thick steel plate with a pressure sensormounted at its center was clamped in the fixture. The burst,shock, and peak incident pressures were recorded for vari-ous numbers of Mylar barriers previous to experimenta-tion. To calibrate the shock tube, the results were fitusing a power law, and plotted as presented in Fig. 6.
Fig. 3. Dynatup 9210 used for drop weight impact experiments.
Fig. 4. Internal damage of drop weight impact sample.
Fig. 5. Shock tube fixture.
202 M. Hebert et al. / Composite Structures 84 (2008) 199–208
Author's personal copy
3.4. Post-mortem compression testing
To quantify the materials performance under shockloading conditions, five coupons were cut from the centerof each panel and subjected to a quasi-static compressivetesting. ASTM D3410 [17], a standard test method fordetermining compressive properties of cross-ply fiber–resincomposites, was followed. The tests were performed on anInstron 5582 testing machine using specimens of length152.4 mm (6 in.), width 19.05 mm (0.75 in.) and a gagelength of 12.7 mm (0.5 in.). The load was transferredthrough shear upon the gripped areas, using the fixturedescribed in previous research [5], where post-mortem com-pressive strength was determined on similar panels. Alumi-num oxide 80 grit sandpaper was bonded to the grippedarea of the coupons to prevent slippage. A schematic show-ing the location of the coupons is shown in Fig. 7. All test-ing was performed in the warp direction for uniformity inthe comparative evaluation. When the coupons wereunable to support further load, the maximum load wasrecorded, and the compressive strength of the sample wascalculated. The average of the five coupons was used asthe panel’s compressive strength.
3.5. Evaluation of permanent deformation
At high incident shock tube pressures (>5.72 MPa),some panels were found to maintain a large amount of per-manent deformation. This deformation was mapped byplacing the panels on a table with a movable x-y axis con-trolled by stepper motors. The table was connected to acomputer and programmed to move in 10 mm (0.4 in.)steps. A laser capable of recording distances in the rangeof 10–40 mm was mounted above the panel. The laser sig-nal was sent to the computer and was recorded betweensteps. The laser obtained the best signal reading black sur-faces, therefore the panels were duct taped and spray-painted flat black. A Matlab computer code was used toprocess and plot the recorded data.
4. Experimental results
4.1. SHPB testing of pure resins
The dynamic stress–strain behavior of the pure resins ispresented in Fig. 8. The SHPB technique is not ideal forobtaining values of dynamic modulus or yield stress, asthe material is not in a stress equilibrium state duringdeformation [13]. Thus, it is only noted that dynamicallythe urethane shows noticeably stiffer behavior, though stat-ically it was found that all the vinyl ester resins have a stif-fer modulus as seen in Table 1.
4.2. Drop weight impact of virgin materials
Drop weight impact tests were performed and load,velocity, displacement, and energy history were retrievedduring the event. Representative plots of resulting load,velocity, and displacement versus time are shown inFig. 9a–c. These curves are used to generate the following.First, the load is plotted against the displacement, as shownin Fig. 9d. The resulting figure is then integrated to obtainthe energy versus time curve as shown in Fig. 9e. It is seenthat at a critical time circa 5.5 ms, the displacement reachesa maximum as velocity reaches zero. At this time, all the
0
1
2
3
4
5
6
7
8
9
10
0 1 2 3 4 5 6 7 8 9
Burst Pressure, MPa
Inci
dent
Pre
ssur
e, M
Pa
Fig. 6. Incident pressure (which panels are subjected to) vs. barrier burstpressure.
Fig. 7. Layout of panels subjected to shock tube loading.
0
50
100
150
200
250
0 1 2 3 4 5 6 7True Strain, %
Tru
e St
ress
, MPa
RS Urethane
Ashland VEHydrex VEHexion VE
Fig. 8. Stress–strain response of resins obtained from SHPB tests, _e ¼1.7 · 103.
M. Hebert et al. / Composite Structures 84 (2008) 199–208 203

Author's personal copy
energy has been transferred from the tup into the specimen.The energy is stored as both elastic energy and plasticenergy. The latter includes deformation and damage com-ponents. The decrease in the energy absorbed followingthe critical time can be attributed to the stored elasticenergy causing the tup weight to rebound. The remainingenergy absorbed in the material is damage and plasticenergy, and is representative of the level of damage sufferedby the sample, as indicated in Fig. 9f. A lower final energyabsorbed would therefore, correspond to a material moreresistant to impact, so long as the sample absorbs all theenergy from the tup and causes the weight to rebound.Evaluation of the energy absorbed was further verified bymonitoring of velocity profiles throughout the test. Thederived change in kinetic energy correlated faithfully withthe absorbed energy evaluated above, thus provides analternative methodology for implementing and energy cri-terion. Table 2 presents the total energy absorbed by thematerial, the depth of penetration by the tup head, andthe extent of visible internal damage. Two samples of eachmaterial were tested to verify consistency, and the resultswere averaged.
The data is normalized with respect to the sample thick-ness. The 2 · 108 urethane resin samples show superiorimpact resistance as measured by energy absorbed, depthof penetration, and damaged area compared to all othermaterials. On the other hand, the 2 · 72 urethane was theweakest material as measured by energy absorbed and pen-etration, though little damage is observed radially in thesesamples. It should be noted that, generally the two different
2 · 108 vinyl ester resin samples displayed similar impactresistance. However vinyl ester(2) sustained greater visibleinternal damage than vinyl ester(1). The 4 · 36 structuredvinyl ester samples appears to be slightly superior to the2 · 72 samples of the same resin based on all evaluationcriteria.
4.3. Shock tube experiments
The plates were subjected to shock waves of peak inci-dent pressures 3.08, 4.54, 5.72, and either 7.12 or
Fig. 9. Drop weight impact experiment plots.
Table 2Drop weight impact test results
Material Thickness(mm)
Energyabsorbed perunit thickness(J/mm)
Depth ofindentationper unitthickness(mm/mm)
Estimateddamaged areaper unitthickness(cm̂2/mm)
(2 · 108) Vinylester(1)
5.59 6.59 0.21 2.18
(2 · 108) Vinylester(2)
5.59 5.46 0.21 8.56
(2 · 72) Vinylester
4.70 9.10 0.77 2.02
(4 · 36) Vinylester
4.45 8.75 0.63 1.86
(2 · 108)Urethane
6.35 4.54 0.14 1.25
(2 · 72)Urethane
3.94 10.19 0.88 1.23
204 M. Hebert et al. / Composite Structures 84 (2008) 199–208

Author's personal copy
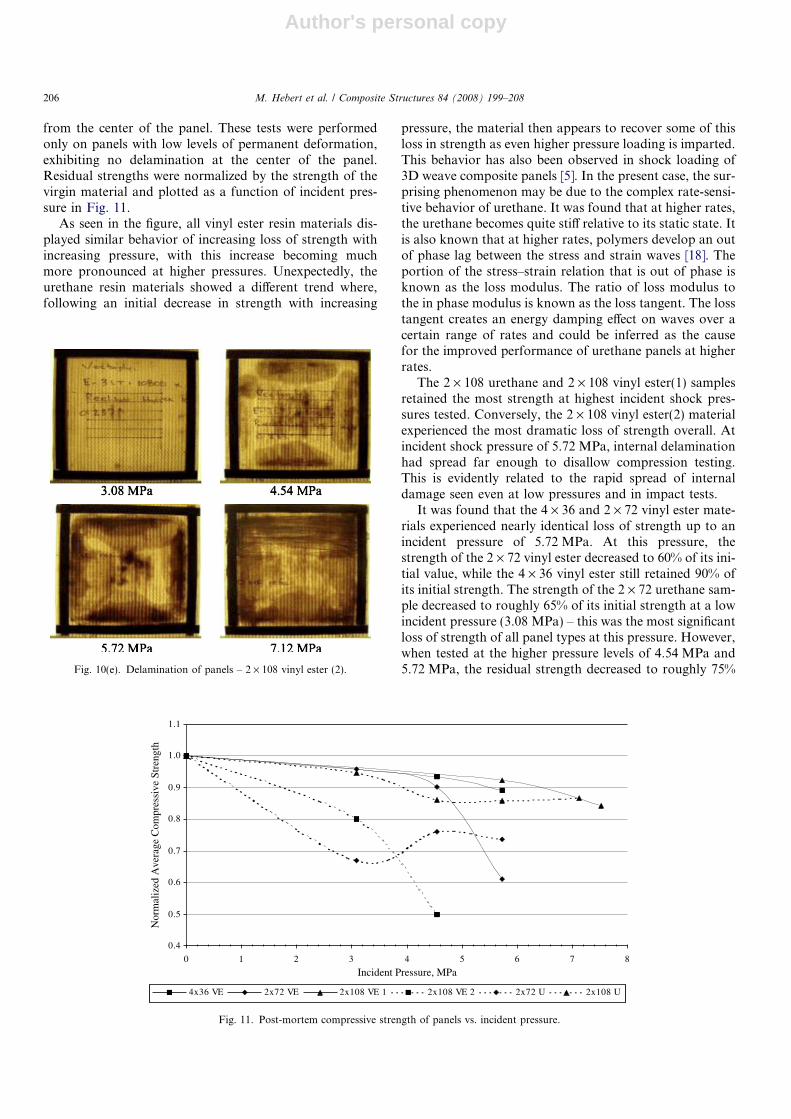
7.53 MPa. Damage was first observed in the form of fiberbreakage around the boundaries and slight discolorationson the back surface of the plate. As shock pressuresincreased, the primary form of damage consisted of inter-nal delamination spreading inwards from the boundaries.The amount of internal delamination is easily seen whenthe panels are placed over a bright light source. Figs. 10shows the progression of damage in each type of panel.No images are available for the 2 · 108 vinyl ester(1) sam-ples made from the Ashland resin.
The 2 · 108 urethane samples experienced little visibledamage even at high incident pressures, as seen in
Fig. 10(b). A similar damage progression was observedwith 2 · 108 vinyl ester(1) panels. On the other hand, the2 · 108 vinyl ester(2) suffered from significant delaminationbeginning at low incident pressures (see Fig. 10(e)). Thesetrends parallel those observed in the drop weight impacttests, where relatively extensive radial damage was foundin the 2 · 108 vinyl ester(2) specimens. Figs. 10a,c,d showthat all panels having total areal weights of 144oz=yd2
ð4:88kg=2mÞ, both urethane and vinyl ester resin based, expe-
rienced damage progression comparable to each other.The residual structural integrity of the panels was found
by performing quasi-static compression tests on coupons
Fig. 10(a). Delamination of panels – 2 · 72 urethane.
Fig. 10(b). Delamination of panels – 2 · 108 urethane.
Fig. 10(c). Delamination of panels – 4 · 36 vinyl ester.
Fig. 10(d). Delamination of panels – 2 · 72 vinyl ester.
M. Hebert et al. / Composite Structures 84 (2008) 199–208 205
Author's personal copy
from the center of the panel. These tests were performedonly on panels with low levels of permanent deformation,exhibiting no delamination at the center of the panel.Residual strengths were normalized by the strength of thevirgin material and plotted as a function of incident pres-sure in Fig. 11.
As seen in the figure, all vinyl ester resin materials dis-played similar behavior of increasing loss of strength withincreasing pressure, with this increase becoming muchmore pronounced at higher pressures. Unexpectedly, theurethane resin materials showed a different trend where,following an initial decrease in strength with increasing
pressure, the material then appears to recover some of thisloss in strength as even higher pressure loading is imparted.This behavior has also been observed in shock loading of3D weave composite panels [5]. In the present case, the sur-prising phenomenon may be due to the complex rate-sensi-tive behavior of urethane. It was found that at higher rates,the urethane becomes quite stiff relative to its static state. Itis also known that at higher rates, polymers develop an outof phase lag between the stress and strain waves [18]. Theportion of the stress–strain relation that is out of phase isknown as the loss modulus. The ratio of loss modulus tothe in phase modulus is known as the loss tangent. The losstangent creates an energy damping effect on waves over acertain range of rates and could be inferred as the causefor the improved performance of urethane panels at higherrates.
The 2 · 108 urethane and 2 · 108 vinyl ester(1) samplesretained the most strength at highest incident shock pres-sures tested. Conversely, the 2 · 108 vinyl ester(2) materialexperienced the most dramatic loss of strength overall. Atincident shock pressure of 5.72 MPa, internal delaminationhad spread far enough to disallow compression testing.This is evidently related to the rapid spread of internaldamage seen even at low pressures and in impact tests.
It was found that the 4 · 36 and 2 · 72 vinyl ester mate-rials experienced nearly identical loss of strength up to anincident pressure of 5.72 MPa. At this pressure, thestrength of the 2 · 72 vinyl ester decreased to 60% of its ini-tial value, while the 4 · 36 vinyl ester still retained 90% ofits initial strength. The strength of the 2 · 72 urethane sam-ple decreased to roughly 65% of its initial strength at a lowincident pressure (3.08 MPa) – this was the most significantloss of strength of all panel types at this pressure. However,when tested at the higher pressure levels of 4.54 MPa and5.72 MPa, the residual strength decreased to roughly 75%Fig. 10(e). Delamination of panels – 2 · 108 vinyl ester (2).
0.4
0.5
0.6
0.7
0.8
0.9
1.0
1.1
0 1 2 3 4 5 6 7 8
Incident Pressure, MPa
Nor
mal
ized
Ave
rage
Com
pres
sive
Str
engt
h
4x36 VE 2x72 VE 2x10⁸ VE 1 2x10⁸ VE 2 2x72 U 2x10⁸ U
Fig. 11. Post-mortem compressive strength of panels vs. incident pressure.
206 M. Hebert et al. / Composite Structures 84 (2008) 199–208
Author's personal copy
of its initial strength, thus resulting in better performancethan the 2 · 72 vinyl ester samples at these higherpressures.
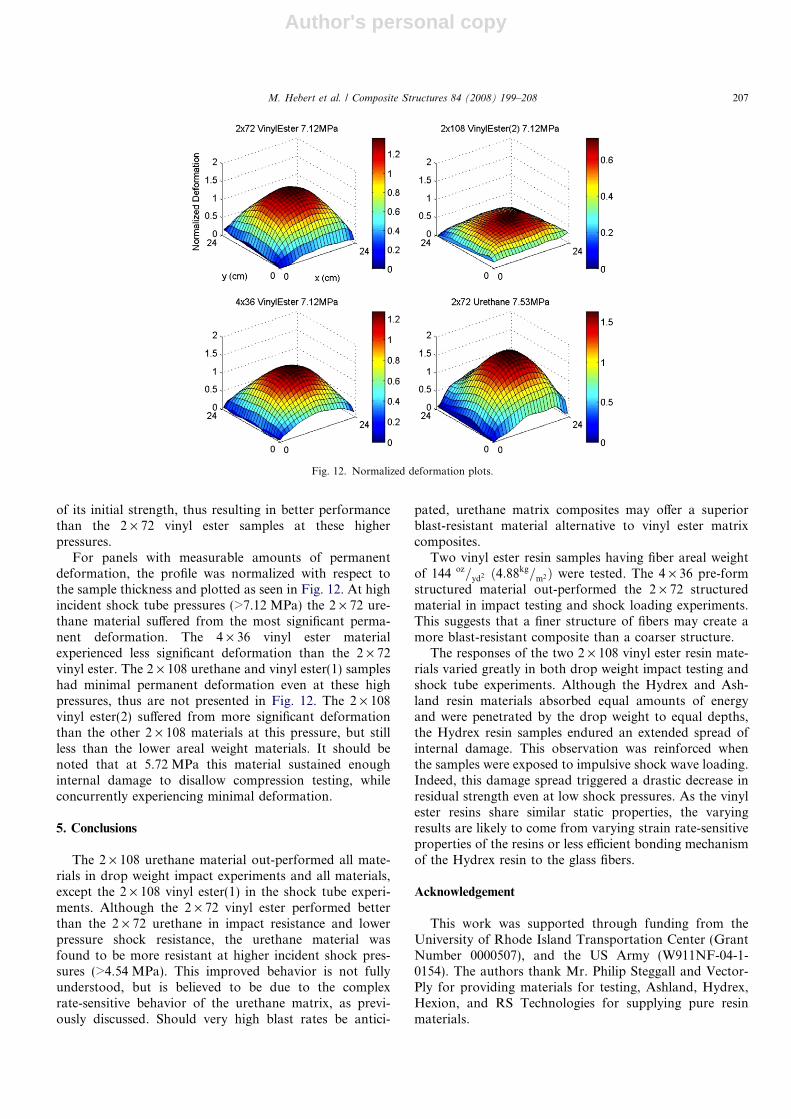
For panels with measurable amounts of permanentdeformation, the profile was normalized with respect tothe sample thickness and plotted as seen in Fig. 12. At highincident shock tube pressures (>7.12 MPa) the 2 · 72 ure-thane material suffered from the most significant perma-nent deformation. The 4 · 36 vinyl ester materialexperienced less significant deformation than the 2 · 72vinyl ester. The 2 · 108 urethane and vinyl ester(1) sampleshad minimal permanent deformation even at these highpressures, thus are not presented in Fig. 12. The 2 · 108vinyl ester(2) suffered from more significant deformationthan the other 2 · 108 materials at this pressure, but stillless than the lower areal weight materials. It should benoted that at 5.72 MPa this material sustained enoughinternal damage to disallow compression testing, whileconcurrently experiencing minimal deformation.
5. Conclusions
The 2 · 108 urethane material out-performed all mate-rials in drop weight impact experiments and all materials,except the 2 · 108 vinyl ester(1) in the shock tube experi-ments. Although the 2 · 72 vinyl ester performed betterthan the 2 · 72 urethane in impact resistance and lowerpressure shock resistance, the urethane material wasfound to be more resistant at higher incident shock pres-sures (>4.54 MPa). This improved behavior is not fullyunderstood, but is believed to be due to the complexrate-sensitive behavior of the urethane matrix, as previ-ously discussed. Should very high blast rates be antici-
pated, urethane matrix composites may offer a superiorblast-resistant material alternative to vinyl ester matrixcomposites.
Two vinyl ester resin samples having fiber areal weightof 144 oz=yd2 ð4:88kg=m2Þ were tested. The 4 · 36 pre-formstructured material out-performed the 2 · 72 structuredmaterial in impact testing and shock loading experiments.This suggests that a finer structure of fibers may create amore blast-resistant composite than a coarser structure.
The responses of the two 2 · 108 vinyl ester resin mate-rials varied greatly in both drop weight impact testing andshock tube experiments. Although the Hydrex and Ash-land resin materials absorbed equal amounts of energyand were penetrated by the drop weight to equal depths,the Hydrex resin samples endured an extended spread ofinternal damage. This observation was reinforced whenthe samples were exposed to impulsive shock wave loading.Indeed, this damage spread triggered a drastic decrease inresidual strength even at low shock pressures. As the vinylester resins share similar static properties, the varyingresults are likely to come from varying strain rate-sensitiveproperties of the resins or less efficient bonding mechanismof the Hydrex resin to the glass fibers.
Acknowledgement
This work was supported through funding from theUniversity of Rhode Island Transportation Center (GrantNumber 0000507), and the US Army (W911NF-04-1-0154). The authors thank Mr. Philip Steggall and Vector-Ply for providing materials for testing, Ashland, Hydrex,Hexion, and RS Technologies for supplying pure resinmaterials.
Fig. 12. Normalized deformation plots.
M. Hebert et al. / Composite Structures 84 (2008) 199–208 207

Author's personal copy
References
[1] Shah Khan MZ, Simpson G, Gellert EP. Resistance of glass-fibrereinforced polymer composites to increasing compressive strain ratesand loading rates. Compos Part A 2000;31:57–67.
[2] Naik NK, Joglekar MN, Arya H, Borade SV, Ramakrishna KN.Impact and compression after impact characteristics of plain weavefabric composites: effect of plate thickness. Adv Comp Mater2004;12:261–80.
[3] Mouritz AP. The effect of underwater explosion shock loading onthe flexural properties of grp laminates. Int J Impact Eng 1996;18:129–39.
[4] Stoffel M, Schmidt R, Weichert D. Shock wave-loaded plates. Int JSolids Struct 2001;38:7659–80.
[5] Leblanc J, Shukla A, Rousseau C, Bogdanovich A. Shock loading ofthree-dimensional woven composite materials. Compos Struct2007;79:344–55.
[6] Stoffel M. A measurement technique for shock wave-loaded struc-tures and its application. Exp Mech 2006;46:47–55.
[7] Zaretsky E, deBotton G, Perl M. The response of a glass fibersreinforced epoxy composite to an impact loading. Int J Solids Struct2004;41:569–84.
[8] Dandekar DP, Hall CA, Chhabildas LC, Reinhart WD. Shockresponse of a glass-fiber-reinforced polymer composite. ComposStruct 2003;61:51–9.
[9] Boteler JM, Rajendran AM, Grove D. Shock wave profiles in polymermatrix composites. Shock Comp Cond Matter 1999. Presented at.
[10] Ku H, Cheng YM, Snook C, Baddeley D. Drop weight impact testfracture of vinyl ester composites: micrographs of pilot study. JCompos Mater 2005;39:1607–20.
[11] Dyka CT, Badaliance R. Damage in marine composites caused byshock loading. Compos Sci Tech 1998;58:1433–42.
[12] Gray III GT. Classic split-Hopkinson pressure bar testing. 10th ed.Metals Handbook, Mechanical Testing, vol. 8. ASM; 2000. p.462–73.
[13] Lee OS, Kim MS. Dynamic material property characterization byusing split Hopkinson pressure bar (SHPB) technique. Nucl Eng Des2003;226:119–25.
[14] ASTM D 7136, Standard test method for measuring the damageresistance of a fiber-reinforced polymer matrix composite to a drop-weight impact event. ASTM International.
[15] Wright J. Shock Tubes. New York: John Wiley and Sons Inc.; 1961.[16] Badiger SM. Design and fabrication of an experimental facility for
controlled, transient shock wave loading. Masters Eng. Thesis,University of Rhode Island. 2004.
[17] ASTM D 3410, Standard test method for compressive properties ofpolymer matrix composite materials with unsupported gage sectionby shear loading. ASTM International.
[18] McCrum NG, Buckley CP, Bucknall CB. Principles of PolymerEngineering. 2nd ed. New York: Oxford Science Publications; 1997.
208 M. Hebert et al. / Composite Structures 84 (2008) 199–208