
Author's personal copy - Semantic Scholar · PDF fileAuthor's personal copy ... high-skill...
13
This article appeared in a journal published by Elsevier. The attached copy is furnished to the author for internal non-commercial research and education use, including for instruction at the authors institution and sharing with colleagues. Other uses, including reproduction and distribution, or selling or licensing copies, or posting to personal, institutional or third party websites are prohibited. In most cases authors are permitted to post their version of the article (e.g. in Word or Tex form) to their personal website or institutional repository. Authors requiring further information regarding Elsevier’s archiving and manuscript policies are encouraged to visit: http://www.elsevier.com/copyright
Transcript of Author's personal copy - Semantic Scholar · PDF fileAuthor's personal copy ... high-skill...

This article appeared in a journal published by Elsevier. The attachedcopy is furnished to the author for internal non-commercial researchand education use, including for instruction at the authors institution
and sharing with colleagues.
Other uses, including reproduction and distribution, or selling orlicensing copies, or posting to personal, institutional or third party
websites are prohibited.
In most cases authors are permitted to post their version of thearticle (e.g. in Word or Tex form) to their personal website orinstitutional repository. Authors requiring further information
regarding Elsevier’s archiving and manuscript policies areencouraged to visit:
http://www.elsevier.com/copyright
Author's personal copy
Labor migration, human capital agglomeration and regional development in China
Yuming Fu a, Stuart A. Gabriel b,⁎a Department of Real Estate, National University of Singapore, 4 Architectural Drive, 117566, Singaporeb Anderson School of Management, University of California, Los Angeles, 110 Westwood Plaza, Los Angeles, CA 90095-1481, USA
a b s t r a c ta r t i c l e i n f o
Article history:Received 22 June 2010Received in revised form 17 August 2011Accepted 17 August 2011Available online 1 September 2011
JEL classification:J24J31J61O15O18R23
Keywords:Internal migrationHuman capitalEconomic developmentChinese economy
We estimate a skill-based directionalmigrationmodel to assess the effects of regional human capital agglomerationon labor migration in China. Upon accounting for regional differentials in skill-based compensation, cost-of-living,amenities, and the like, model estimates indicate the importance of destination human capital concentration tohigh-skill migrants. In marked contrast, low-skill migrants are found to have little incentive to co-locate withhigh-skill workers, likely reflecting institutional and other impediments to human capital investment amonglow-skill migrants. Research findings suggest the importance of human capital agglomeration benefits to disparateregional growth trajectories in China.
© 2011 Elsevier B.V. All rights reserved.
1. Introduction
Internal labor migration long has been viewed as central to efficientlabor allocation. Aggregate labor productivity rises as workers movefrom less to more productive places (e.g., Sjaastad, 1962; Gabrielet al., 1993). Further, research has demonstrated that workers relo-cate in response to differential returns to human capital (e.g., Roy,1951; Borjas et al., 1992; Dahl, 2002) and that suchmoves ease regionaldisparities in both productivity and skills as arise from exogenousshocks (Borjas, 2001;Whalley and Zhang, 2004). In the developmentliterature, numerous studies (e.g., Lewis, 1954; Ranis and Fei, 1961;Harris and Todaro, 1970) also have shown the importance of urbanmigration in reduction of rural–urban productivity gaps.
In this paper, we draw upon modern theories of economic growthand spatial equilibrium (Lucas, 1988; Romer, 1990; and Glaeser andGottlieb, 2009), which emphasize increasing returns to human capitaland agglomeration, to assess internal migration and regional economicdevelopment in China. In particular, we seek to provide new insights asregards disparate regional growth evidenced in China during the 1990s.Indeed, those disparities became more pronounced despite increasedlabor mobility and eased regulation of household location choice (see,for example, Fujita and Hu, 2001; Démurger et al., 2002; Candelariaet al., 2009; Villaverde et al., 2010). Our analysis highlights the influence
of regional human capital agglomeration on disparate regional growthvia migration choices among skill-based population strata.
Regional differences in human capital concentration can affect migra-tory incentives in variousways. First, such differences can affect the place-specific demand for skills. Giannetti (2003) and Berry andGlaeser (2005),for example, suggest that high concentrations of skilled people in citiesgenerate more skilled jobs. In the presence skill complementarities,wage rates for skilled workers will be higher in areas of high human cap-ital concentration. Second, concentration of human capital supports con-sumer amenities, such as cultural vibrancy, that attract high-skill people(e.g., Shapiro, 2006). Third, as suggested by Lucas (1988, 2004, 2009),Eaton and Eckstein (1997), Glaeser (1999) and Glaeser and Mare(2001), the concentration of proximate human capital results in spilloverbenefits to private investment in human capital and ideas, which in turncontribute to higher productivity growth for city migrants. The humancapital spillover benefits are of particular importance to regional growth(e.g., Glaeser et al., 1995; Gennaioli et al., 2011). Accordingly, agglomera-tion of human capital may provide incentives for labor migration that re-inforces spatial inequality in human capital concentration and economicdevelopment. In this paper we explore the hypothesis, as suggested bytheory, that human capital spillover benefits in regions of human capitalagglomeration resulted in divergent rates of migration across skill-basedpopulation strata in China. Such movement of population would thenexacerbate disparities in regional growth among China's provinces.
Our empirical analysis employs a utility-maximizing directional mi-gration model, which allows for competing migration incentives as wellas heterogeneous migration costs and preferences in determination of
Regional Science and Urban Economics 42 (2012) 473–484
⁎ Corresponding author.E-mail addresses: [email protected] (Y. Fu), [email protected]
(S.A. Gabriel).
0166-0462/$ – see front matter © 2011 Elsevier B.V. All rights reserved.doi:10.1016/j.regsciurbeco.2011.08.006
Contents lists available at SciVerse ScienceDirect
Regional Science and Urban Economics
j ourna l homepage: www.e lsev ie r .com/ locate / regec
Author's personal copy
mobility outcomes among population strata. Such models have been ap-plied in the place-to-place migration literature, which offers evidencethat regional differences in return to skills are important to the magni-tude and to the skill composition of interregional migration flows (as inRoy, 1951).1 That model has several distinct advantages relative to priorcross-sectional analyses of the effects of human capital agglomerationon regional economic growth (see, for example, Glaeser et al., 1995;Glaeser and Shapiro, 2003; Shapiro, 2006; Glaeser et al., 2011). First, di-rectional migration analysis allows controls for destination fixed effectsto account for unobserved locational heterogeneities.2 Second, direc-tional migration analysis accounts for spatial heterogeneity in destina-tion labor supply arising from distance-sensitive migration costs. Third,application of the directional migration model focuses on gross popula-tion flows, which unlike net population growth, are less affected by re-gional housing supply constraints.3 Finally, use of gross directionalpopulation flows allows an examination of the differential impor-tance attached to potential human capital spillover benefits andother migratory incentives by different migrant strata, as is usefulfor welfare evaluation.
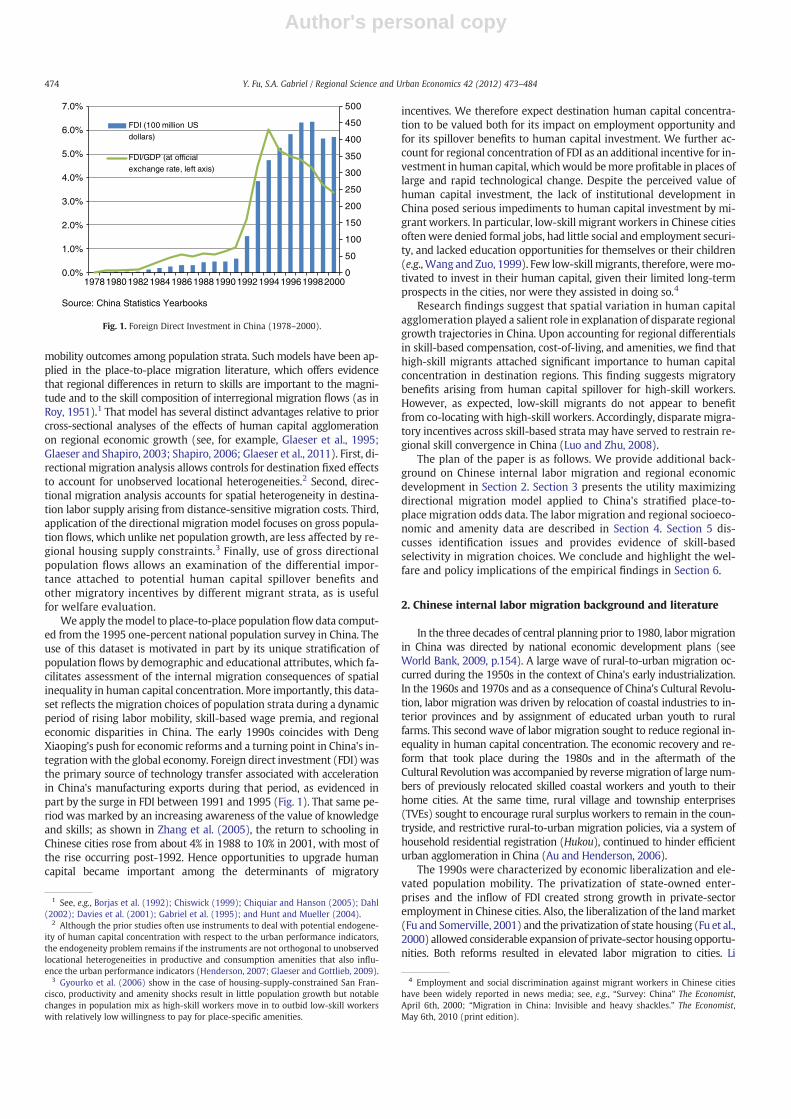
We apply themodel to place-to-place population flowdata comput-ed from the 1995 one-percent national population survey in China. Theuse of this dataset is motivated in part by its unique stratification ofpopulation flows by demographic and educational attributes, which fa-cilitates assessment of the internal migration consequences of spatialinequality in human capital concentration. More importantly, this data-set reflects the migration choices of population strata during a dynamicperiod of rising labor mobility, skill-based wage premia, and regionaleconomic disparities in China. The early 1990s coincides with DengXiaoping's push for economic reforms and a turning point in China's in-tegrationwith the global economy. Foreign direct investment (FDI) wasthe primary source of technology transfer associated with accelerationin China's manufacturing exports during that period, as evidenced inpart by the surge in FDI between 1991 and 1995 (Fig. 1). That same pe-riod was marked by an increasing awareness of the value of knowledgeand skills; as shown in Zhang et al. (2005), the return to schooling inChinese cities rose from about 4% in 1988 to 10% in 2001, with most ofthe rise occurring post-1992. Hence opportunities to upgrade humancapital became important among the determinants of migratory
incentives. We therefore expect destination human capital concentra-tion to be valued both for its impact on employment opportunity andfor its spillover benefits to human capital investment. We further ac-count for regional concentration of FDI as an additional incentive for in-vestment in human capital, whichwould bemore profitable in places oflarge and rapid technological change. Despite the perceived value ofhuman capital investment, the lack of institutional development inChina posed serious impediments to human capital investment by mi-grant workers. In particular, low-skill migrant workers in Chinese citiesoftenwere denied formal jobs, had little social and employment securi-ty, and lacked education opportunities for themselves or their children(e.g., Wang and Zuo, 1999). Few low-skill migrants, therefore, weremo-tivated to invest in their human capital, given their limited long-termprospects in the cities, nor were they assisted in doing so.4
Research findings suggest that spatial variation in human capitalagglomeration played a salient role in explanation of disparate regionalgrowth trajectories in China. Upon accounting for regional differentialsin skill-based compensation, cost-of-living, and amenities, we find thathigh-skill migrants attached significant importance to human capitalconcentration in destination regions. This finding suggests migratorybenefits arising from human capital spillover for high-skill workers.However, as expected, low-skill migrants do not appear to benefitfrom co-locating with high-skill workers. Accordingly, disparate migra-tory incentives across skill-based strata may have served to restrain re-gional skill convergence in China (Luo and Zhu, 2008).
The plan of the paper is as follows. We provide additional back-ground on Chinese internal labor migration and regional economicdevelopment in Section 2. Section 3 presents the utility maximizingdirectional migration model applied to China's stratified place-to-place migration odds data. The labor migration and regional socioeco-nomic and amenity data are described in Section 4. Section 5 dis-cusses identification issues and provides evidence of skill-basedselectivity in migration choices. We conclude and highlight the wel-fare and policy implications of the empirical findings in Section 6.
2. Chinese internal labor migration background and literature
In the three decades of central planning prior to 1980, labormigrationin China was directed by national economic development plans (seeWorld Bank, 2009, p.154). A large wave of rural-to-urban migration oc-curred during the 1950s in the context of China's early industrialization.In the 1960s and 1970s and as a consequence of China's Cultural Revolu-tion, labor migration was driven by relocation of coastal industries to in-terior provinces and by assignment of educated urban youth to ruralfarms. This second wave of labor migration sought to reduce regional in-equality in human capital concentration. The economic recovery and re-form that took place during the 1980s and in the aftermath of theCultural Revolutionwas accompanied by reversemigration of large num-bers of previously relocated skilled coastal workers and youth to theirhome cities. At the same time, rural village and township enterprises(TVEs) sought to encourage rural surplus workers to remain in the coun-tryside, and restrictive rural-to-urban migration policies, via a system ofhousehold residential registration (Hukou), continued to hinder efficienturban agglomeration in China (Au and Henderson, 2006).
The 1990s were characterized by economic liberalization and ele-vated population mobility. The privatization of state-owned enter-prises and the inflow of FDI created strong growth in private-sectoremployment in Chinese cities. Also, the liberalization of the landmarket(Fu and Somerville, 2001) and the privatization of state housing (Fu et al.,2000) allowed considerable expansionof private-sector housing opportu-nities. Both reforms resulted in elevated labor migration to cities. Li
1 See, e.g., Borjas et al. (1992); Chiswick (1999); Chiquiar and Hanson (2005); Dahl(2002); Davies et al. (2001); Gabriel et al. (1995); and Hunt and Mueller (2004).
2 Although the prior studies often use instruments to deal with potential endogene-ity of human capital concentration with respect to the urban performance indicators,the endogeneity problem remains if the instruments are not orthogonal to unobservedlocational heterogeneities in productive and consumption amenities that also influ-ence the urban performance indicators (Henderson, 2007; Glaeser and Gottlieb, 2009).
3 Gyourko et al. (2006) show in the case of housing-supply-constrained San Fran-cisco, productivity and amenity shocks result in little population growth but notablechanges in population mix as high-skill workers move in to outbid low-skill workerswith relatively low willingness to pay for place-specific amenities.
Source: China Statistics Yearbooks
0
50
100
150
200
250
300
350
400
450
500
0.0%
1.0%
2.0%
3.0%
4.0%
5.0%
6.0%
7.0%
197819801982198419861988199019921994199619982000
FDI (100 million US
dollars)
FDI/GDP (at official
exchange rate, left axis)
Fig. 1. Foreign Direct Investment in China (1978–2000).
4 Employment and social discrimination against migrant workers in Chinese citieshave been widely reported in news media; see, e.g., “Survey: China” The Economist,April 6th, 2000; “Migration in China: Invisible and heavy shackles.” The Economist,May 6th, 2010 (print edition).
474 Y. Fu, S.A. Gabriel / Regional Science and Urban Economics 42 (2012) 473–484

Author's personal copy
(2004) estimates that inter-provincial migration totaled about 11 millionpeople during the first half of the 1990s; also, twice that number movedwithin provinces. Zhang and Song (2003) estimate that about 70% of Chi-na's urban population growth during the 1990s derived from net migra-tion. Accordingly, the level of urbanization in China increased by about1 percentage point a year from 28% in 1990 to 33% in 1995 (Shen, 2005).5
China's vast rural-to-urban population flow has been the focus of nu-merous studies (see, for example, Johnson, 2003; Zhao, 1999, 2003). Liangand White (1997), Wu and Yao (2003) and Poncet (2006), for example,have demonstrated the increased responsiveness of inter-provincial mi-gration flows during the 1980s and 1990s to regional disparities in em-ployment opportunities and earnings. Other studies have documentedincreased income inequality between China's coastal and interior regionsduring the 1990s, which is attributed to economic policies and globaliza-tion that favored coastal regions (e.g. Fujita andHu, 2001; Démurger et al.,2002). In addition, extantwelfare analysis of rural–urbanmigration large-ly focuses on the impact of migration on consumption and investment inrural origins (e.g. Zhao, 2002; De Brauw and Rozelle, 2008; De Brauw andGiles, 2008). In contrast, migrant prospects in destination cities and therole of agglomeration economies, including those associated withhuman capital spillovers, have received substantially less attention inassessment of China inter-regional migration and regional economicdevelopment. It is to those issues that we now turn.
3. A directional migration odds model
We use a utility-maximizing framework to describe individualplace-to-place migration choice. Let a resident of type k in region i de-rive utility Uk,ij from migration to region j. We assume that the utilityis a linear function of relevant economic and amenity conditions inthe origin and destination regions, denoted by a vector zij; thus,
Uk;ij ¼ zijβk þωk;ij; ð1Þ
where βk is a conforming vector of utility coefficients, which may varydepending on the type of resident indexed by k, andωk,ij is a random dis-turbance. Assume N alternative destination regions. The probability thatthis individual migrates to region j (including j= i), denoted by πk,ij, is
πk;ij ¼ Prob Uk;ij N Uk;is
� �for all s≠j: ð2Þ
McFadden (1973)has shown thatwhen theNdisturbances are inde-pendent and follow identical Weibull distribution,6 the probability inEq. (2) is a conditional logit function:
πk;ij ¼exp zijβk
� �∑N
j¼1exp zijβk
� � : ð3Þ
Direct estimation of the conditional logit function of πk,ij, as inDavies et al. (2001), is complex because πk,ij depends on the vectorzij for all potential destinations. A simpler approach, found in Gabrielet al. (1987), Gabriel et al. (1993), Poncet (2006) and Sasser (2010),is to estimate the function of the migration odds ratio πk,ij/πk,ii, whichdescribes the probability of an individual in region imoving to regionj, relative to that of staying put:
πk;ij
πk;ii¼ exp Zijβk
� �: ð4Þ
In Eq. (4) Zij≡zij−zii measures the relevant origin and destinationconditions and Zijβk represents the net benefit of migration for type-kresidents. Zijwould include origin conditions that push or discouragemi-gration, origin–destination differential “pull” conditions, the expectedcost of migration between origins and the destinations, and fixed effectsfor origins and destinations to control for unobserved location heteroge-neities. The migration odds ratio can be computed empirically usingplace-to-place population flows over a given time period. Let mk,i, bethe population of type-k residents in region i at the beginning of the pe-riod, mk,ij, the number of them migrating to region j during the period,and mk,ii, the number remaining in region i. Then, for a large enoughmk,i we should have πk, ij/πk, ii=mk, iπk, ij/(mk, iπk, ii)=mk, ij/mk, ii. Further-more, following extant studies, we apply a log linear transformation toEq. (4), substituting themigration odds ratiowith observed empirical di-rectional migration odds ratio, to obtain our linear regression equation7:
lnmk;ij
mk;ii
!¼ Zijβk þ εk;ij; ð5Þ
where εk,ij is a residual error.We apply the above directional migration regression to a unique
dataset of place-to-place population flows fully stratified by educa-tion attainment and age. The stratification enables an examinationof how migration motives and costs vary across different populationgroups. To facilitate such examination, however, it is helpful to im-pose a structure on the way βk varies across the population strata.We assume that the education and age effects are additive so thatthe importance of the average age effect across the education stratacan be separately estimated; hence, for education group e and agegroup a, the directional migration regression equation is:
lnme;a;ij
me;a;ii
!¼ Zij βe þ βað Þ þ εe;a;ij: ð6Þ
Our analysis is similar to Hunt and Mueller (2004) in that we seekto account for both migrant selectivity as well as the tradeoff amongwage and non-wage motives of migration. Hunt and Mueller (2004)employ individual-level data, which allow them to use a nestedlogit specification where the individual skill and demographic attri-butes affect the upper-level choice of whether or not to migrate butthe location attributes influence the lower-level choice of migrationdestinations. Our analysis based on population flow statistics pre-cludes a nested logit specification but allows a more reliable examina-tion of the location effects based on a large population sample.
4. Data and variables
Our place-to-place population flow statistics are derived from the1995 One-percent Population Survey conducted by the Chinese Govern-ment (see National Population Survey Office, 1997). The survey coversall 30 provincial-level jurisdictions in China (including 22 provinces, 5 au-tonomous regions and 3 provincial level cities). In this study, we referto these 30 jurisdictions as provinces. Within each province, the sur-vey randomly sampled one-third to one-half of the county-level ju-risdictions. Altogether, more than 12 million people were sampled.
The 30 provinces vary considerably in population size. Tibet, locat-ed in the southwest high plateau, was the least populated region withjust 2.2 million people in 1990, whereas Sichuan, located in the fertileupper-Yangzhi-River basin, was themost populous of China's provinceswith over 100 million people. Per-capita income also varied considerably,from RMB 654 Yuan in the southwest province of Guizhou to RMB 4822Yuan in Shanghai, the emerging economic powerhouse at the mouth of
5 The accuracy of official urban population statistics is impaired by the exclusion ofnew rural migrants to cities. Shen (2005)'s estimation of urban population adjustsfor such undercounting.
6 The Weibull distribution has a cumulative distribution function F (ω)=exp (−e−ω).
7 We handle the problem of censored value of the empirical migration odds ratio be-tween relatively distance origins and destinations in our sample due to limited samplesize mk,i by adding a constant of 1×10⁻⁶ to the dependent variable mk,ij /mk,ii.
475Y. Fu, S.A. Gabriel / Regional Science and Urban Economics 42 (2012) 473–484

Author's personal copy
Yangzhi River in the east.8 These provinces, except Tibet, form the set ofalternative origins and destinations in our place-to-placemigration anal-ysis. We exclude Tibet from our analysis as it was largely isolated fromthe rest of the Chinese economy during our sample period due to thelack of transportation links. These 29 provinces are grouped intoseven geographic regions according to geographic and economic simi-larities (these regional groupings are listed in column 2 ofAppendix A). In general, per-capita income is lower in thewestern inte-rior and rises with proximity to the east coast.
For this study, province-to-province population-flow matrices wereconstructed using the survey sample first sorted into strata by gender,age and schooling. For each stratum, the population-flow statistics mk,ij,i,j=1,…,29, are defined as the number of people residing in region j in1995 (for no less than 6 months) whose regular residence 5 years earlier(in 1990) was in region i (the origin region). Accordingly, our analysis isbased on the first comprehensive and statistically-based estimates of di-rectional migration by socio-economic strata available formodern China.The rates of inter-provincial migration in our sample of economically ac-tive population (aged 15 to 65) are shown in the last two columns in Ap-pendix A. Note that the data reveal limited provincial level variability inrates of out-migration, relative to a preponderance of in-migration to afew fast-growing provinces. The four biggest winners in terms of popu-lation gain as a percentage of their 1990 population were Beijing (thenational capital in the northern coastal region), Shanghai (the emerg-ing commercial center of China in the southern coastal region), Guang-dong (a leading area of economic liberalization in the coastal south), andXinjiang (a far northwestern province with a rich resource base). Overall,about 1.14% of the population migrated beyond their original provinceduring the 5 year period. Zhang et al. (1998) show that householdmigra-tion during this period was predominately rural-to-urban; in that regard,urban-to-rural migration (from both urban districts and county-level cit-ies) accounted for only 3.6% of all migrants, whereas rural-to-urban mi-gration accounted for nearly 60% of all population moves (see Table 1).Overall, about 78% of themigrants chose urban destinations; urban desti-nations are likely more dominant among inter-provincial moves, whichare the object of our analysis.
Table 2 shows the distribution of the sample population by age andeducational attainment. Our sample of economically active persons(aged 15 to 65) in the one-percent National Population Survey consistsof about 8.4 million people, of which 52% are below age 35. The majorityof the population did not complete high school (about 49% had at most aprimary school education and whereas 36% had completed middleschool). Note as well that the younger age group (below age 35) had ahigher education attainment level than the older group. Furthermore,the table shows that the younger and more educated groups weremore mobile (higher average migration odds ratios) as well as more se-lective in their migration destinations (higher standard deviation in mi-gration odds). The table also reports the correlation in directionalmigration odds between population strata, to show the similarity in mi-gration pattern between these strata. The bottom education strata appearto follow very different spatial pattern of migration than the populationwith at least middle school education, as indicated by the low correlation
coefficients. Similar to Hunt and Mueller (2004), we find relatively smalldifferences in migration pattern by gender; the correlation in directionalmigration odds between the gender groups is 0.81 for the bottom educa-tion strata and 0.92 for those attained at least middle school education.For simplicity, we focus our analysis of the directional migration patternon the age and education based population strata as shown in Table 2.
Table 3 provides sample statistics of the explanatory variablesused in Zij, where origin–destination (o–d) differences are calculatedas the destination value minus the origin value of the variables. Wereport the mean absolute value and the standard deviation of eachvariable (the mean values of o–d difference variables are necessarilyzero). Except the return-to-schooling measures, the variables in Zij
are reflective of the regional characteristics as of 1990, the beginningof our sample period. The value and the data source for these provin-cial-level variables are listed in Appendix A.
The first three variables in Zij reflect origin conditions that push ordiscourage people to move. Since the majority of inter-regional mi-grants are of rural origin, rural farming conditions (indicated by theamount of arable land per rural resident) are an important push fac-tor. A higher level of arable land per rural resident would contributeto higher farming productivity and hence reduce incentives for ruralresidents to leave. Similarly a higher level of rural industrial employ-ment opportunities (indicated by the share of rural workforceemployed by township and village enterprises, or TVEs), would di-minish the incentive for rural workers to migrate. The origin urban–rural economic gap (indicated by urban-to-rural ratio of per capitaconsumer spending) reflects rural–urban segregation (Wei and Wu,2001), which hampers the mobility of rural unskilled workers but atthe same time would push the more educated to leave.
We employ a number of controls for origin–destination bilateraldifferences in real income to account for migration incentives andchoice of destination. Since the large majority of migration destina-tions in our sample are urban, these bilateral measures pertain tothe urban sector in the origin and destination regions. Differentialwage rates and skill premia (returns to schooling) between originand destination urban sectors allow for specification and test of theRoy (1951) hypothesis in the context of China's sizable labor migra-tion.9 Cost of living differences are proxied by urban per capita con-sumer spending, which should be positively correlated with bothhousehold income and local cost of living. We further compute a re-gional temperature severity index (defined as the square root of thesum of the lowest temperature squared and the highest temperaturesquared) to reflect regional climatic amenities; a high value of thisindex indicates that the province has a more severe temperature ei-ther in the winter or in the summer or both. We would expect prov-inces with a temperate climate (hence a relatively low temperatureseverity) to be more attractive to migrants. We also include the sizeof the regional urban workforce as an indicator of destination employ-ment opportunities. In addition, the availability of housing in the destina-tion region, indicated by average housing space per person, is included tofurther differentiate cost of living between alternative destinations.
The empirical specification includes a bell-shaped distance function tocapture the variable cost of migration, which is assumed to increase withmigration distance at an increasing rate for short distances but at a de-creasing rate for long distances. The variable cost not only reflects the pe-cuniary transport cost of relocation but also the cultural and informationgaps that tend to be significantly higher once an individualmoves beyond
8 In 1995, 1 US dollar buys 8.35 RMB at the official exchange rate.
Table 1Distribution of migration flows between rural and urban areas (1995 Population Survey,including migration both within and across provinces).Source: Zhang et al. (1998), Table 1.
Origin (1990residing place)
Destination (1995 residing place)
Urban district County-level cities Rural counties Total
Urban district 1.8% 1.0% 1.7% 4.5%County-level cities 5.3% 10.3% 1.9% 17.5%Rural counties 41.8% 17.6% 18.7% 78.0%Total 48.8% 28.9% 22.3% 100%
9 The wage rates represent the average wage of employees in urban firms in 1990 andare not adjusted for potential differences in skill mix across regions. To address this issue,we estimate provincial-level returns to schooling using a sample of residents in 90 citiesacross the provinces derived from 1997 Urban Household Survey (see Appendix B). Ourpreferencewould have been to compute returns to schooling using earlier sample. Unfor-tunately, that datawas not available. Regardless, the 1997 estimate of returns to schoolingwould have been appropriate to forward looking migrants. Note further that returns toschooling have been rising across Chinese cities since the 1980s, in the wake of economicreforms and China's integration into the global economy (see, e.g. Zhang et. al. 2005).
476 Y. Fu, S.A. Gabriel / Regional Science and Urban Economics 42 (2012) 473–484

Author's personal copy
the adjacent provinces. Specifically, the distance-related disincentive ofmigration is computed as exp(−(dij/d0)2), where dij is the direct distancebetween the capitals of the origin and the destination provinces as mea-sured on amapand d0 is chosen to be10 (36thpercentile value ofdij acrossthe 29 origin and destinations) to maximize the statistical significance ofthe distance-related disincentive. A constant is included in Zij to allow fora fixed cost of migration that must be offset for migration to be profitable.
The key regional attribute included in Zij for the purpose of this studyis the bilateral difference in the share of regional urban population withhigh school or above education.10 This measure of regional concentrationof human capital can influence migratory incentives via its effect onskilled-based wage compensation, consumer amenities, and cost ofhuman capital accumulation. Although the primary focus of this studyis not to isolate these alternative channels of influence, note that we do
control for regional differences in skill-based wage compensation andamenities in the analysis. We further control for regional differences inforeigndirect investment concentration (FDI share of cumulativefixed in-vestment over 1990–1993 at official exchange rates), to account for thepotential productivity-growth effect of technology change and knowl-edge spillovers to different migrant strata.11 Accordingly, in this analysis,the share of educated urban population seeks to proxy for non-wage in-centives associated with regional human capital concentration. Regionalhuman capital concentration averages about 16% in 1990 in our sample.Regional FDI concentration is about 6% on average.
Despite the fact that the independent variables in Zij are con-structed mostly to reflect regional conditions as of 1990, prior to themigration phenomenon we examine, spatial equilibrium theories tell usthat these variables are not necessarily exogenous in the presence of
10 Shapiro (2006) finds the human capital spillover effects in the context of US met-ropolitan employment growth to derive from urban concentration of college graduatesrather than high-school graduates. However, share of college graduates in Chinese re-gional population was less than 3% on average in 1995.
11 The role of FDI in augmenting host region productivity growth in developing econ-omies is widely documented (e.g., Mastromarco and Ghosh, 2009; Tuan et al., 2009).Mastromarco and Ghosh (2009) find that productivity spillover effects of FDI dependpositively on local concentration of human capital, suggesting complementarities be-tween human capital and knowledge spillovers.
Table 3Sample statistics of explanatory variables (29 origin by 28 destination provinces, 812 observations).
Variables Mean absolute value Standard deviation
1 Origin log farm land per rural resident 0.626 0.5842 Origin township & village enterprise (TVE) share of rural workforce 0.137 0.1353 Origin urban–rural log per capita consumer spending differential 0.337 0.1614 o–d differential: log urban wage rate 0.152 0.1935 o–d differential: urban return to schooling 0.018 0.0236 o–d differential: per capita urban consumer spending 0.356 0.4617 o–d differential temperature severity 2.723 3.7408 o–d differential: log urban workforce size 0.771 1.0039 Destination log housing space per person 2.937 0.19910 negative exponential o-d distance squared, exp(−dij
2/100) 0.311 0.29411 o–d differential: FDI share of fixed investment 0.105 0.15012 o–d differential: share of urban population with high school or above education 0.069 0.09013 o-d migration odds ratio, primary school or below (%) 0.030 0.08314 o–d migration odds ratio, middle school (%) 0.052 0.14515 o-d migration odds ratio, high school or above (%) 0.072 0.15916 Mean years of schooling of o–d migration flow 8.767 1.573
Correlation coefficients
Variables 2 3 4 5 6 7 8 9 10 11 12
1 −0.267 0.569 0.166 0.040 0.059 −0.230 0.082 0.021 −0.130 0.377 −0.1653 0.1684 −0.429 −0.1905 −0.326 −0.146 0.1086 −0.624 −0.240 0.633 0.2897 −0.162 −0.058 −0.149 0.210 0.3768 −0.179 0.190 −0.182 0.156 0.180 0.2739 −0.006 0.023 −0.016 −0.024 0.038 0.058 0.32210 0.086 −0.154 0.000 0.000 0.000 0.000 0.000 0.13711 −0.209 0.196 0.335 0.163 0.372 0.147 0.037 0.099 0.00012 −0.333 −0.488 0.419 0.288 0.587 0.186 −0.323 −0.274 0.000 0.04313 −0.045 −0.003 0.124 −0.008 0.083 0.044 0.170 0.122 0.314 0.092 −0.05114 −0.078 0.007 0.176 0.064 0.135 0.030 0.183 0.152 0.264 0.160 −0.02515 −0.068 0.098 0.176 0.159 0.166 0.038 0.273 0.178 0.259 0.193 −0.02616 0.346 0.373 −0.067 −0.014 −0.167 −0.171 0.001 −0.116 −0.224 0.066 −0.160
Note: Origin–destination (o–d) differences are calculated as the destination value minus the origin value.
Table 2Sample size and sample statistics of migration odds ratio by population strata.
Education level Age group Sample size % total sample Odds ratio Correlation in directional migration odds
Mean Std dev. Primary school Middle school High school
Primary school or below 15–34 1,495,764 17.8% 0.056% 0.164% Age 15–34 35–65 15–34 35–65 15–3435–65 2,612,208 31.1% 0.016% 0.061% 0.55
Middle school 15–34 2,117,577 25.2% 0.074% 0.310% 0.42 0.3335–65 918,346 10.9% 0.034% 0.164% 0.18 0.37 0.79
High school or above 15–34 774,493 9.2% 0.108% 0.402% 0.26 0.34 0.92 0.8235–65 481,854 5.7% 0.061% 0.401% 0.07 0.17 0.82 0.90 0.87
Note: The sample size refers to the number of observations in the 1995 One-percent Population Survey. The odds ratio and the correlation statistics are based on 812 observations oforigin–destination pairs for each education–age stratum.
477Y. Fu, S.A. Gabriel / Regional Science and Urban Economics 42 (2012) 473–484
Author's personal copy
unobserved locational heterogeneities that may influence observed re-gional conditions in 1990.We therefore seek to control for the unobservedlocational heterogeneities by including regional fixed effects in the direc-tional migration regression. However, certain restrictions on the locationfixed effects are necessary in order for the effects of bilateral social eco-nomic differences to be identified. Except for the distance-relatedmeasureofmigration cost, these bilateral variables are perfectly correlatedwith thefull set of bothorigin anddestinationfixedeffects. Accordingly, inourbase-line estimation, we include the origin and destination fixed effects at thelevel of the seven broad geographic regions (as shown in column 2 ofAppendix A). We then examine the robustness of these bilateral effectestimateswith less restrictive specifications of thedestinationfixed effects.
The lower panel of Table 3 displays amatrix of correlation coefficientsbetween the variables in Zij. Origin rural farm land per capita is negativelycorrelated with rural industrialization, but is positively correlated withrural–urban per-capita spending disparities. The positive but moderatecorrelation between regional wage-rate differential and the differentialper-capita consumer spending indicates regional differences in cost of liv-ing; indeed, the variance of the spending differentials is much greaterthan that of the wage-rate differential. Regions with higher FDI leveland human capital concentration are more productive but offer lowerreal income (these two concentration measures are more strongly corre-latedwith cost of living thanwithwage rates), indicative of the non-wagebenefits of FDI and human capital spillovers; those correlation coefficientsare consistent with Roback's (1982) compensating-variation principle ofspatial equilibrium. Interestingly, more temperate regions (with lowertemperature severity) are not compensated with lower real income (thetemperature severity index is positively correlated with the cost of livingbut somewhat negatively correlated with wage rates). Regions with alarger urban sector do not appear more productive but appear to valueskill more highly (offering higher returns to schooling). Finally, regionswith a relatively higher urban concentration of high-school graduatesoffer somewhat higher returns to schooling, possibly reflecting the skillcomplementarities in employment as suggested by Giannetti (2003)and Berry and Glaeser (2005).12
In addition, the lower panel of Table 3 provides the simple correlationsbetweenmigration odds and the variables in Zij. Note thatmigration oddsare somewhat positively correlated with o–d differential wage rates andhousing space per person but slightly negatively correlated with theo–d differential with respect to high-school graduate share of urban pop-ulation. We also observe some degree of skill-based selectivity in migra-tion choices with respect to migration distance. Skill-based selectivity isalso evidenced in o–d differentials with respect to urban workforce size,FDI level, and returns to schooling. Further,meanyears of schooling ofmi-gration flows are elevated among more distant destinations as well asdestinationswith relatively low temperature severity (more favorable cli-mate) and lower shares of more highly educated urban populations. Weturn next to the examination of the marginal effects of the independentvariables Zij on the size and mix of the directional migration flows.
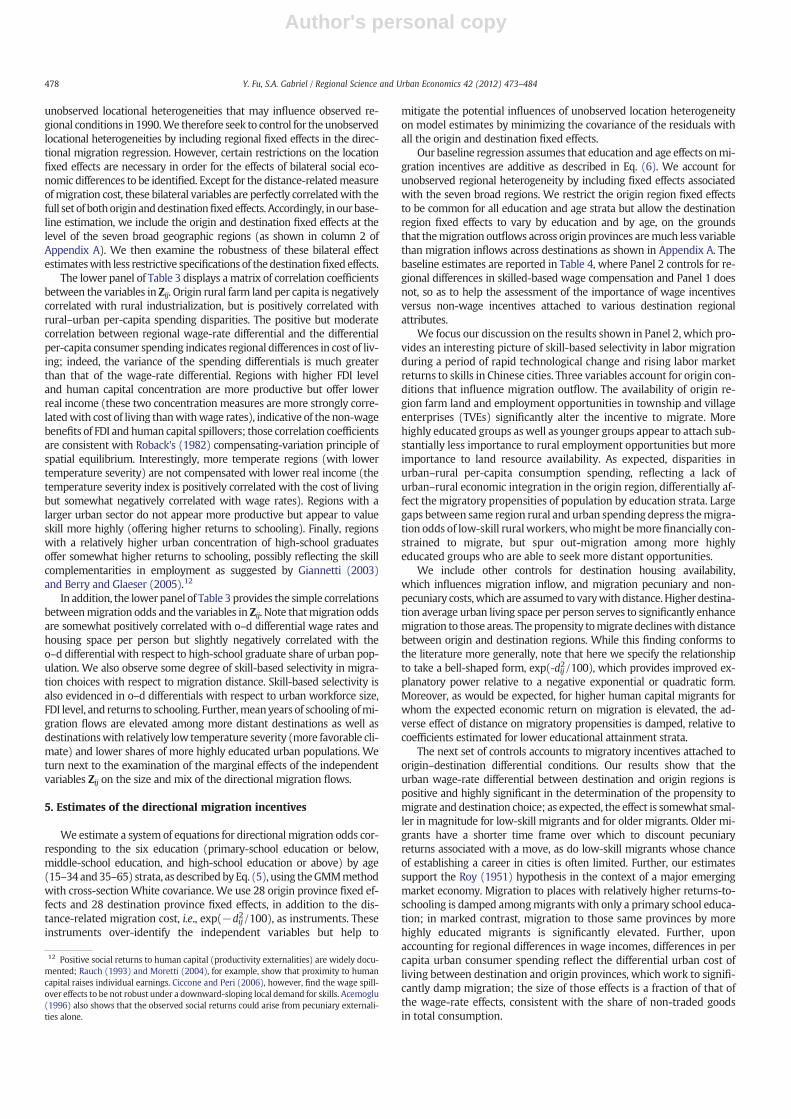
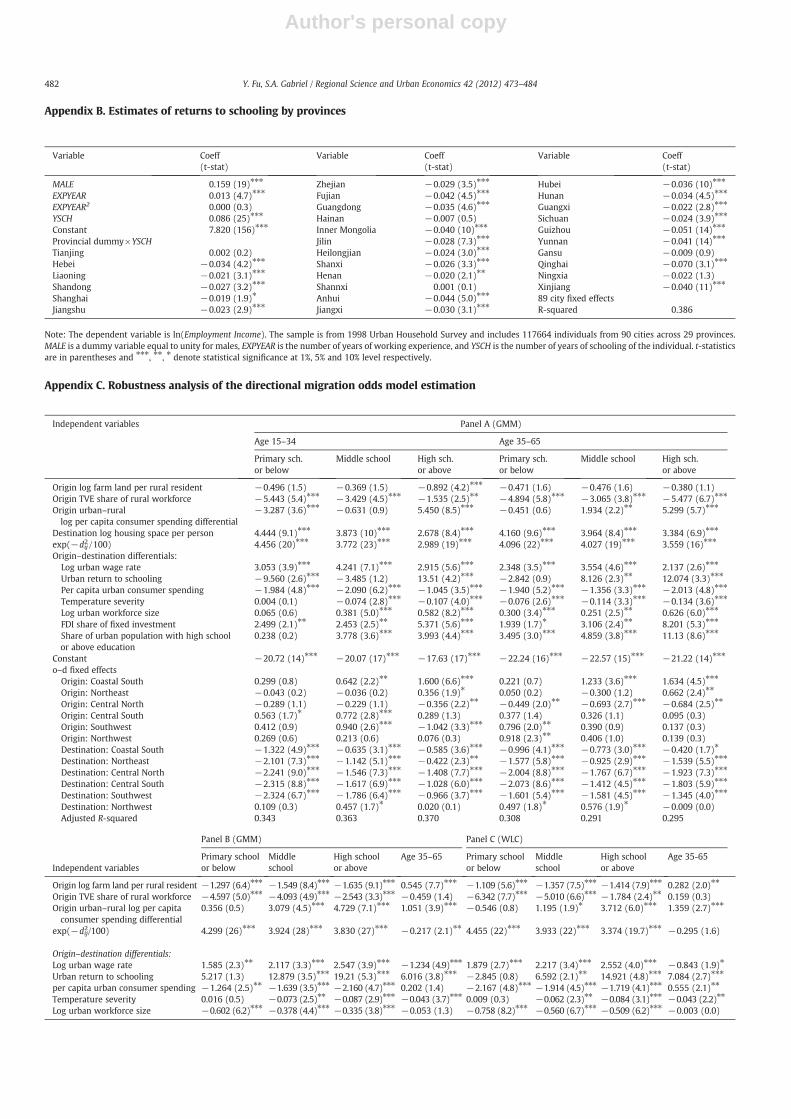
5. Estimates of the directional migration incentives
We estimate a system of equations for directional migration odds cor-responding to the six education (primary-school education or below,middle-school education, and high-school education or above) by age(15–34 and35–65) strata, as described byEq. (5), using theGMMmethodwith cross-sectionWhite covariance. We use 28 origin province fixed ef-fects and 28 destination province fixed effects, in addition to the dis-tance-related migration cost, i.e., exp(−dij
2/100), as instruments. Theseinstruments over-identify the independent variables but help to
mitigate the potential influences of unobserved location heterogeneityon model estimates by minimizing the covariance of the residuals withall the origin and destination fixed effects.
Our baseline regression assumes that education and age effects onmi-gration incentives are additive as described in Eq. (6). We account forunobserved regional heterogeneity by including fixed effects associatedwith the seven broad regions. We restrict the origin region fixed effectsto be common for all education and age strata but allow the destinationregion fixed effects to vary by education and by age, on the groundsthat themigration outflows across origin provinces aremuch less variablethan migration inflows across destinations as shown in Appendix A. Thebaseline estimates are reported in Table 4, where Panel 2 controls for re-gional differences in skilled-based wage compensation and Panel 1 doesnot, so as to help the assessment of the importance of wage incentivesversus non-wage incentives attached to various destination regionalattributes.
We focus our discussion on the results shown in Panel 2, which pro-vides an interesting picture of skill-based selectivity in labor migrationduring a period of rapid technological change and rising labor marketreturns to skills in Chinese cities. Three variables account for origin con-ditions that influence migration outflow. The availability of origin re-gion farm land and employment opportunities in township and villageenterprises (TVEs) significantly alter the incentive to migrate. Morehighly educated groups aswell as younger groups appear to attach sub-stantially less importance to rural employment opportunities but moreimportance to land resource availability. As expected, disparities inurban–rural per-capita consumption spending, reflecting a lack ofurban–rural economic integration in the origin region, differentially af-fect the migratory propensities of population by education strata. Largegaps between same region rural and urban spending depress themigra-tion odds of low-skill ruralworkers, whomight bemore financially con-strained to migrate, but spur out-migration among more highlyeducated groups who are able to seek more distant opportunities.
We include other controls for destination housing availability,which influences migration inflow, and migration pecuniary and non-pecuniary costs,which are assumed to varywithdistance. Higher destina-tion average urban living space per person serves to significantly enhancemigration to those areas. The propensity tomigrate declineswithdistancebetween origin and destination regions. While this finding conforms tothe literature more generally, note that here we specify the relationshipto take a bell-shaped form, exp(-dij2/100), which provides improved ex-planatory power relative to a negative exponential or quadratic form.Moreover, as would be expected, for higher human capital migrants forwhom the expected economic return on migration is elevated, the ad-verse effect of distance on migratory propensities is damped, relative tocoefficients estimated for lower educational attainment strata.
The next set of controls accounts to migratory incentives attached toorigin–destination differential conditions. Our results show that theurban wage-rate differential between destination and origin regions ispositive and highly significant in the determination of the propensity tomigrate and destination choice; as expected, the effect is somewhat smal-ler in magnitude for low-skill migrants and for older migrants. Older mi-grants have a shorter time frame over which to discount pecuniaryreturns associated with a move, as do low-skill migrants whose chanceof establishing a career in cities is often limited. Further, our estimatessupport the Roy (1951) hypothesis in the context of a major emergingmarket economy. Migration to places with relatively higher returns-to-schooling is damped amongmigrants with only a primary school educa-tion; in marked contrast, migration to those same provinces by morehighly educated migrants is significantly elevated. Further, uponaccounting for regional differences in wage incomes, differences in percapita urban consumer spending reflect the differential urban cost ofliving between destination and origin provinces, which work to signifi-cantly damp migration; the size of those effects is a fraction of that ofthe wage-rate effects, consistent with the share of non-traded goodsin total consumption.
12 Positive social returns to human capital (productivity externalities) are widely docu-mented; Rauch (1993) and Moretti (2004), for example, show that proximity to humancapital raises individual earnings. Ciccone and Peri (2006), however, find the wage spill-over effects to be not robust under a downward-sloping local demand for skills. Acemoglu(1996) also shows that the observed social returns could arise from pecuniary externali-ties alone.
478 Y. Fu, S.A. Gabriel / Regional Science and Urban Economics 42 (2012) 473–484

Author's personal copy
Seasonal temperature extremes, indicative of a less amenable climate,appear to discouragemovement by more educated and older groups, buthave little effect on moves by low skill migrants. This result is similar tothefindings in Hunt andMueller (2004) and reflects a greaterwillingnessto pay for climate amenities by higher skilled population strata. The des-tination–origin region differential in the size of the urban workforce, as ameasure of labor market opportunities associated with the relative scaleof the provincial urban job markets, exerts notably more positive effectson place-to-place migration for individuals with more schooling andwork experience, indicating the importance of the labor-market poolingbenefits for skilledworkers. In addition, the destination FDI concentrationdraws migrants across education and age strata and, interestingly, thedraw is considerably stronger for the top education stratum.
Turning to the benefits of human capital agglomeration, we find thatregional concentration of human capital has a substantial but asymmetricinfluence on the migration destination choices of different educationalstrata. Whereas migrants in the top educational stratum appear to bestrongly encouraged to move to regions with high concentrations ofhuman capital, those in the bottom stratum appear to be discouragedfrommaking such a choice. Consequently, in thewake of global economicintegration of Chinese cities, increased internal labor mobility served toreinforce regional variation in human capital concentration, in turn con-tributing importantly to the widening regional disparities in economicdevelopment in China. While disparate regional growth trajectoriesin China are often attributed to location advantages or policy bias(Fujita and Hu, 2001; Démurger et al., 2002), our results indicatethe importance of migrant self-selection so as to reinforce differen-tial regional trajectories in human capital agglomeration.
Comparing Panels 1 and 2, note, as expected, that the migration ef-fects of per capita urban consumer spending differentials are muchmore positive in Panel 1, where wage differentials are not accountedfor. The values of other controls are modestly affected by the inclusionof the skill-specific wage differentials in the regression. The effects oforigin–destination differences in regional climate, labormarket pooling,and FDI concentration are somewhat weaker after accounting for wagedifferentials, suggesting that differences in those regional amenity andeconomic factors are partly but not fully compensated by skill-specificwage differences. Upon accounting for skill-specific wage differences,the effect of regional human capital concentration becomes somewhatweaker for low education and oldermigrants households but somewhatstronger for themore educatedmigrants. Overall, regional climatic ame-nities, urban labormarket pooling, FDI concentration and human capitalconcentration continue to contribute importantly to migratory incen-tives upon controlling for wage differentials.13
As shown in Table 4, the chi-squared tests for the J statistics of theGMMestimates reject the hypothesis that the over-identification condi-tions are satisfied. In other words, the explanatory variables in themodel do not fully capture the regional heterogeneities encompassedby the GMM instruments. We provide further robustness analysis ofthe GMM estimates against alternative controls of origin and destina-tion fixed effects in the regression. Those results are reported in Appen-dix C. In Panel A, we relax the assumption that the education and ageeffects are additive aswell as allow the 12origin and destination region-al fixed effects to vary across the 6 educate and age strata. As shown, thegeneral pattern of skill-based selectivity in migratory choices evidencedin Table 4 is robust to the more detailed estimates in Panel A. We notethat the regional fixed effects vary more significantly among the destina-tions than the origin regions but appear quite highly correlated across
13 It is unlikely that the much of the influence of the regional human capital concen-tration on migratory incentives, as well as the effects of regional climate, labor marketpooling, and FDI concentration, are due to deficiencies in quality-adjustment of region-al wage compensation. As a robust check, we used the human capital adjusted wagerates derived from the 1997 Urban Household Survey (see footnote 9) in place of theaverage urban wage rate. The former measure of urban wage rate differential turnsout to have much weaker explanatory power than the latter. Other estimates are large-ly robust to variations in the definition of the urban wage rate measure.Ta
ble4
GMM
estimates
ofthedirectiona
lmigration
odds
mod
el:ba
selin
eestimates.
Inde
pend
entv
ariables
Pane
l1Pa
nel2
Prim
aryscho
olor
below
Middlescho
olHighscho
olor
abov
eAge
35–65
Prim
aryscho
olor
below
Middlescho
olHighscho
olor
abov
eAge
35–65
Originlogfarm
land
perruralresiden
t−
0.72
3(3.1)⁎⁎⁎
−0.76
7(3.7)⁎⁎⁎
−0.84
6(4.2)⁎⁎⁎
0.37
9(5
.0)⁎⁎⁎
−0.71
8(3.2)⁎⁎⁎
−0.80
2(3.9)⁎⁎⁎
−0.83
1(4.2)⁎⁎⁎
0.37
6(4.8)⁎⁎⁎
OriginTV
Eshareof
ruralw
orkforce
−4.46
3(5.9)⁎⁎⁎
−3.96
0(6.4)⁎⁎⁎
−2.03
0(3.9)⁎⁎⁎
−1.54
7(4
.3)⁎⁎⁎
−3.95
5(5
.1)⁎⁎⁎
−3.14
5(4
.9)⁎⁎⁎
−0.98
9(1
.9)⁎
−1.46
1(3
.8)⁎⁎⁎
Originurba
n–rurallog
percapita
consum
erspen
ding
diffe
rential
0.80
6(1
.2)
2.97
5(5
.2)⁎⁎⁎
4.60
2(8
.1)⁎⁎⁎
1.34
6(4.9)⁎⁎⁎
−0.52
8(0
.8)
2.08
9(3
.5)⁎⁎⁎
3.72
7(6
.3)⁎⁎⁎
1.42
0(5
.1)⁎⁎⁎
Destina
tion
logho
usingsp
acepe
rpe
rson
3.39
7(8
.5)⁎⁎⁎
3.68
3(1
1)⁎⁎⁎
2.98
6(1
0)⁎⁎⁎
0.23
8(1
.0)
3.79
0(9
.6)⁎⁎⁎
3.85
0(1
1)⁎⁎⁎
3.23
1(1
1)⁎⁎⁎
0.01
3(0
.1)
exp(
−d i
j2/100
)4.14
3(2
3)⁎⁎⁎
3.91
7(2
6)⁎⁎⁎
3.43
0(2
4)⁎⁎⁎
0.17
4(1
.6)
4.16
9(2
3)⁎⁎⁎
3.87
0(2
6)⁎⁎⁎
3.48
3(2
4)⁎⁎⁎
0.13
9(1
.2)
Origin–
destinationdiffe
rentials:
Logurba
nwag
erate
1.88
0(3
.3)⁎⁎⁎
2.32
9(4
.6)⁎⁎⁎
2.35
8(4
.8)⁎⁎⁎
−1.34
0(4.6)⁎⁎⁎
Urban
return
toscho
oling
−6.10
1(1
.9)⁎
1.06
0(0
.4)
4.92
7(1
.8)⁎
2.65
4(1
.5)
Percapita
urba
nco
nsum
ersp
ending
0.44
4(1
.8)⁎
−0.02
4(0
.1)
−0.12
0(0
.7)
−0.89
8(7
.1)⁎⁎⁎
−0.53
8(1
.7)⁎
−0.96
2(3
.3)⁎⁎⁎
−1.07
8(4
.0)⁎⁎⁎
−0.37
2(2
.3)⁎⁎
Tempe
rature
seve
rity
−0.05
1(2.2)⁎⁎
−0.11
5(5.6)⁎⁎⁎
−0.12
1(5.8)⁎⁎⁎
−0.01
6(1
.3)
−0.01
6(0
.6)
−0.08
5(3.7)⁎⁎⁎
−0.09
7(4.0)⁎⁎⁎
−0.06
9(4.7)⁎⁎⁎
Logurba
nworkforce
size
0.31
5(3
.8)⁎⁎⁎
0.59
8(8
.9)⁎⁎⁎
0.71
9(1
2)⁎⁎⁎
0.07
9(1
.7)⁎
0.23
9(2
.8)⁎⁎⁎
0.54
0(8
.0)⁎⁎⁎
0.61
4(9
.8)⁎⁎⁎
0.12
9(2
.7)⁎⁎⁎
FDIsha
reof
fixe
dinvestmen
t5.58
7(6
.4)⁎⁎⁎
6.46
7(8
.1)⁎⁎⁎
10.38(1
3)⁎⁎⁎
0.56
5(1
.4)
3.77
0(3
.9)⁎⁎⁎
4.98
9(5
.7)⁎⁎⁎
9.06
7(1
0)⁎⁎⁎
1.64
2(3
.6)⁎⁎⁎
Shareof
urba
npo
pulatio
nwith
high
scho
olor
abov
eed
ucation
−4.98
8(4.7)⁎⁎⁎
2.79
7(3
.1)⁎⁎⁎
4.42
2(5.6)⁎⁎⁎
5.47
1(9.0)⁎⁎⁎
−3.67
3(3.3)⁎⁎⁎
3.20
7(3
.4)⁎⁎⁎
4.97
7(5
.8)⁎⁎⁎
4.78
8(7
.6)⁎⁎⁎
Cons
tant
−19
.00(16)⁎⁎⁎
−20
.35(20)⁎⁎⁎
−18
.27(20)⁎⁎⁎
−2.51
0(3.8)⁎⁎⁎
−19
.71(17)⁎⁎⁎
−20
.57(20)⁎⁎⁎
−18
.90(20)⁎⁎⁎
−1.85
4(2.8)⁎⁎⁎
o–dfixe
deffects
Common
6origin
effectsan
d6de
stinationeffect
forea
ched
ucationleve
land
one
agegrou
p(total
30fixe
deffects)
Common
6origin
effectsan
d6de
stinationeffect
forea
ched
ucationleve
land
oneag
egrou
p(total
30fixe
deffects)
Adjus
ted
Age
15–34
0.21
80.32
10.34
90.23
90.34
10.24
5R-sq
uared
Age
35–65
0.25
80.25
70.24
90.26
30.25
70.24
5
Note:
Theregression
equa
tion
sareln(m
e,a,ij/m
e,a,ii)=
Z ij(β e
+β a
)+ε e
,a,ij,whe
rethede
pend
entva
riab
leisthelogof
migration
odds
ratio(p
lus1×10
−6)forea
chof
thesixed
ucation-
agestrata.β
aforag
e15
–34
issetto
zero.T
heeq
uation
sarejointlyestimated
usingEv
iewsGMM
metho
dwithcross-sectionW
hite
cova
rian
ce.T
heinstrumen
tsinclud
eex
p(−
d ij2/100
)an
dthefixe
deffectsfor28
origin
prov
incesan
d28
destinationprov
inces.Th
enu
mbe
rof
observations
is81
2(2
9originsby
28de
stinations
).t-statistics
arein
parenthe
ses;
⁎⁎⁎,⁎
⁎,⁎
deno
testatisticals
ignificanc
eat
1%,5
%an
d10
%leve
lrespe
ctively.
Jstatisticsare0.55
1an
d0.56
4,resp
ective
ly,for
Pane
l1an
d2.
479Y. Fu, S.A. Gabriel / Regional Science and Urban Economics 42 (2012) 473–484

Author's personal copy
education and age strata. A chi-squared test based on J statistics fails to re-ject the hypothesis of additive effects of education and age on model co-efficients at 5% statistic significance level.14 In Panel B, we assume theorigin and destination fixed effects to be common across the educationand age strata but we expand the destination fixed effects to cover allthe 29 different provinces (28 destination fixed effects in addition to theconstant). Also, the destination housing availability control is omitted asit is now accounted for by the expanded destination fixed effects. Exceptthat the effects of urban labor market pooling are damped and those ofreturns to schooling considerably upward revised, the other estimatesand the general pattern of skill-based selectivity in migration choicesare robust to the inclusion of expanded destination fixed effects. In partic-ular, migrants in the top education stratum are strongly attracted to re-gions with high human capital concentration, in contrast to these in thebottom education stratum,who appear to be discouraged frommigratingto high human capital regions. In Panel C, we apply the EquationWeight-ed Least Square (WLS) estimator to the directional migration model inPanel B without the over-identification instruments employed in theGMM estimator. We obtain fairly consistent results.
In summary, we find the differential migratory effects among educa-tional strata to be both significant and robust to the inclusion of skill-specific wage rates and origin and destination region fixed effects. Ourresults are consistent with findings that human capital concentrationis important to metropolitan economic growth (e.g., Glaeser et al.,1995; Glaeser and Shapiro, 2003; Glaeser et al., 2011; Gennaioli et al.,2011). Our findings further suggest that studies based on cross-sectional regressions of net population flows may underestimate themigratory effects of metropolitan human capital concentration, asthe migratory responses of low-skill workers may offset the inflowhigh-skill workers to high-human-capital places. Results indicate thathigh-skill workers attach significant importance to destination humancapital concentration in their migratory choices—as a 1 percentagepoint increase in the share of urban populationwith at least high-schooleducation in the destination province raises the migration odds tothe province of the top education stratum by almost 5% (from thebase migration odds). That magnitude of effect is similar to that ofan additional percentage point of returns to schooling and suggests sub-stantial benefits to human capital agglomeration in Chinese cities. Thesebenefits seem to arise, not only from social returns to human capitalthat help to raise the productivity of skilled workers (see footnote 12),but also from human capital spillover effects that aid in individualhuman capital accumulation and productivity growth, as the high-skillmigrants in our sample value the destination human capital concentra-tion in addition to regional differences in returns to schooling.
As suggested above, our findings also point to the existence of impor-tant impediments to human capital investment among low-skill migrantsto Chinese cities, who are found to attach little importance to destinationhuman capital concentration. Low-skill migrants enjoy little social andemployment security in cities and typically have no access to public ser-vices, including public education (Wang and Zuo, 1999). Their chance ofsuccessfully settling in cities is low and so too is their motivation to investin human capital. Furthermore, the informal employment and housing oflow-skill migrants considerably limit their opportunities for social inter-actions and human capital spillovers with high-skill workers. Were socialinteractions and employment opportunities in cities unhindered for low-skill workers, one might expect them to attach greater importance tohuman capital spillover benefits as the low-skilled are more likely tolearn from the high-skilled in social interactions and to reap elevatedreturns to human capital investment. Indeed, Glaeser (1999) and Lucas(2004) assume that benefits to social interactions in cities accrue primar-ily to the less skilled. Further, Duleep and Regets (1999) show that inter-nal migrants in the United States with a greater skill gap at their
destinations invest more in learning. The absence of human capital ag-glomeration benefits among low-skill migrants, according to the endoge-nous growth model of Lucas (2004), thus would contribute to wideningskill gaps among Chinese population and represent important welfarelosses associatedwith China's internal labormigration. Indeed, income in-equality in Chinese cities has widened since the early 1990s: the incomeGini coefficient, according to World Bank (2009), rose from 0.335 in1990 to 0.469 in 2004.
6. Conclusions
In this paper, we undertake analyses of internal labor migration inChina during the 1990s. That period was characterized by liberalizationof labor markets, rising returns to skills, and accelerating urbanization.We focus on the role of human capital agglomeration in determinationof migration choices and regional economic disparities. Research findingsindicate that more educated households weremoremobile andmore se-lective in their migration choices. These households attached greater im-portance to destination amenities, labor market pooling, technologicalchange, and notably, human capital concentration, even after accountingfor regional differences in skill-specific wage compensation. The mobilitychoices of high human capital households, therefore, appeared to havereinforced the disparate regional distribution of human capital. The find-ing that regional human capital concentration attracts mostly skilledworkers helps to explain the failure of labor migration over recent de-cades to alleviate persistent regional disparities in Chinese economicdevelopment.
Whereas increasing geographic concentration of human capital neednot be detrimental to national economic growth when human capital isscarce and can be more productively employed through agglomeration(Henderson, 2003), the study finding that low-skill workers attach littleimportance to destination human capital concentration, and appear un-likely to locate in high human capital zones, remains a cause for concern.Modern economic development theories emphasize the instrumentalrole labor migration plays in enabling skill upgrading via human capitalspillovers from high-skill to proximate lower-skilled workers (Lucas,2004). The apparent exclusion of low-skill migrants from the benefitsof human capital spillovers reflects in part institutional short-comings as-sociated with Chinese urbanization that impedes human capital invest-ment by low-skill migrants. Removal of those impediments has becomecrucial to sustaining themomentum of Chinese economic growth but re-mains a challenge to Chinese policymakers.15 By articulating welfare is-sues pertinent to labor migration in China, this present study may alsoserve to demonstrate the usefulness of modern theories of growthand development to normative analysis of migration in a developmentcontext. Such discussion is lacking in extant literature (Lall et al., 2006).16
Acknowledgements
We thank Matthew Kahn, Paul Romer, Romain Wacziarg, severalreviewers, and seminar participants at Technion-Tel Aviv University-USC, UCLA and NUS symposiums for helpful comments.
14 We test the restriction that the coefficients of the top 13 variables in Panel C can be reducedto 3×13 coefficients for the education strata plus 13 coefficients for the older age stratum.Theprobability for the null hypothesis to hold according to chi-squared distribution is 9.7%.
15 Political resistance to reforms to remove such impediments remains strong, al-though the reform issues recently surfaced to the forefront of the policy debate duringthe National People's Congress held in March 2010; See, e.g., Financial Times report“Beijing Edges Towards Residence Reform” (March 5, 2010, available online at http://www.ftchinese.com/story/001031584/en) and The Economist report “Migration inChina: Invisible and heavy shackles” (May 6th, 2010, print edition).16 In the traditional development literature, absent controls for human capital accumu-lation, unchecked rural-urban migration is often found to have negative welfare impact,as demonstrated by Harris and Todaro (1970). Recently Fan and Stark (2008) show that,in the presence of human capital externalities on labor productivity, migration of skilledrural labor to citiesmay lower the average human capital level in both origin and destina-tion locations, resulting in a downward shift in productivity for all workers. In contrast, themodern development literature emphasizes the importance of human capital accumula-tion for economic growth and the role of migration in raising private incentives to investin human capital through harnessing human capital spillover effects.
480 Y. Fu, S.A. Gabriel / Regional Science and Urban Economics 42 (2012) 473–484

Author's personal copy
Prov
ince
Regio*
Ruralp
.c.
arab
leland
1990
(mu)
1
Towns
hip&
villa
geen
terprise
shareof
rural
workforce
1
Urban
-to-rural
p.c.
cons
umer
spen
ding
ratio,
1990
1
Ave
rage
urba
nwag
erate,1
990
(yua
n/mon
th)1
Urban
return
toscho
oling4
Urban
p.c.
cons
umer
spen
ding
,199
0(yua
n/mon
th.)1
Lowest/high
est
tempe
rature
(Celsius
)1
Urban
workforce
1990
(10,00
0)1
Hou
sing
spacepe
rpe
rson
(sq.m.)2
FDIs
hare
of19
90–93
cumulativefixe
dinve
stmen
t1
Shareof
urba
npo
pulation
withat
leasthigh
scho
oled
ucation3
Outflow
,%of
1990
popu
la-tion2
Inflow
,%of
1990
popu
la-tion2
Beijing
CN1.02
48.0%
1.61
2,65
38.58
%1,54
8−
15.0/37.6
454.9
20.8
7.8%
31.0%
1.32
%7.16
%Tian
jing
CN1.68
43.4%
1.79
2,43
88.77
%1,31
0−
13.0/36.9
284.3
16.0
8.1%
22.8%
1.00
%3.03
%Heb
eiCN
2.16
9.6%
1.43
2,01
95.16
%66
4−
12.2/38.5
652.7
20.4
2.8%
13.9%
0.80
%1.01
%Liao
ning
CN2.7
21.6%
1.68
2,18
06.50
%1,07
4−
24.3/32.0
1,01
2.2
16.8
7.7%
14.9%
0.56
%1.23
%Sh
ando
ngCN
1.48
16.1%
1.32
2,14
95.86
%68
1−
13.5/37.5
767.5
20.7
8.0%
10.9%
0.52
%0.72
%Sh
angh
aiCS
1.12
58.0%
1.51
2,91
76.70
%1,90
8−
5.2/39
.650
8.1
22.0
15.2%
28.2%
1.06
%6.72
%Jia
ngsh
uCS
1.38
24.1%
1.07
2,12
96.23
%84
1−
6.5/40
.087
9.9
27.0
9.8%
11.4%
0.80
%1.77
%Zh
ejian
CS0.91
17.3%
1.02
2,22
05.64
%91
2−
4.1/40
.347
6.0
32.3
4.4%
9.0%
1.43
%1.38
%Fu
jian
CS0.95
13.8%
1.18
2,16
24.37
%83
74.0/41
.731
0.9
22.9
27.9%
10.0%
0.91
%1.54
%Gua
ngdo
ngCS
1.04
14.3%
1.14
2,92
95.09
%97
24.1/37
.878
5.5
17.8
23.1%
11.8%
0.49
%4.42
%Haina
nCS
1.17
3.5%
1.39
1,98
27.85
%70
87.4/38
.610
5.9
15.1
23.7%
24.7%
1.86
%1.99
%Inne
rMon
golia
NE
6.76
5.5%
1.43
1,84
64.60
%70
3−
25.3/33.7
369.7
13.6
1.2%
16.6%
1.27
%1.41
%
Jilin
NE
4.82
9.2%
1.51
1,88
85.82
%88
2−
27.3/33.0
517.3
15.9
3.6%
17.0%
1.23
%0.62
%Heilong
jian
NE
7.46
10.9%
1.71
1,85
06.19
%91
8−
25.9/34.2
856.2
15.3
2.1%
18.1%
1.75
%0.65
%Sh
anxi
NC
3.07
14.2%
1.34
2,11
15.97
%60
7−
20.2/33.4
438.7
18.1
1.3%
15.3%
0.56
%0.67
%Hen
anNC
1.58
7.4%
1.26
1,82
56.62
%49
9−
9.4/36
.869
2.6
19.6
1.9%
12.0%
1.02
%0.38
%Sh
annx
iNC
2.6
7.7%
1.49
2,04
28.66
%61
4−
9.0/39
.337
9.2
18.4
3.5%
17.5%
0.93
%0.60
%Anh
uiSC
1.58
7.3%
1.18
1,82
74.19
%58
8−
6.3/40
.348
4.8
19.1
2.5%
10.2%
1.63
%0.34
%Jia
ngxi
SC1.33
7.0%
1.30
1,72
95.61
%65
2−
2.1/39
.538
6.1
20.8
3.9%
12.9%
1.76
%0.42
%Hub
eiSC
1.45
11.3%
1.38
1,90
34.97
%75
9−
2.5/39
.669
8.5
24.3
5.0%
17.4%
0.89
%0.59
%Hun
anSC
1.16
8.1%
1.32
2,03
85.18
%66
6−
4.5/40
.655
1.0
26.1
4.1%
11.7%
1.58
%0.43
%Gua
ngxi
SW1.16
2.9%
1.41
2,04
96.38
%57
6−
0.8/37
.031
1.8
16.0
11.2%
14.8%
1.73
%0.36
%Sich
uan
SW1.13
6.2%
1.32
2,01
16.15
%61
60.55
/37.6
936.1
24.5
2.8%
8.1%
1.64
%0.44
%Guizh
ouSW
1.21
1.8%
1.10
1,94
73.43
%44
5−
3.4/33
.522
5.5
15.8
1.6%
13.0%
1.62
%0.56
%Yu
nnan
SW1.54
4.2%
1.39
2,13
04.51
%62
8−
0.9/30
.329
1.9
19.0
1.2%
12.3%
0.81
%0.69
%Gan
suNW
3.17
6.2%
1.76
2,40
77.71
%55
2−
12.8/34.3
231.9
15.4
0.3%
14.7%
1.27
%0.72
%Qingh
aiNW
2.71
4.6%
1.86
2,63
21.53
%78
6−
20.0/30.7
66.4
10.6
0.2%
20.2%
2.82
%1.33
%Ningx
iaNW
3.48
5.6%
1.41
2,25
26.42
%63
4−
21.2/34.4
67.4
15.5
0.6%
17.7%
1.28
%1.19
%Xinjia
ngNW
4.06
6.5%
1.89
2,28
94.58
%90
4−
22.8/34.1
300.6
18.5
0.5%
33.2%
1.19
%4.24
%Co
efficien
tof
variation
74.2%
100%
16.3%
19.0%
27.3%
38.7%
57.6%
26.7%
115%
38.8%
44.7%
157%
Sources:
1.Ch
inaStatistics
Yearbo
ok;2.
1%Po
pulation
Survey
,199
5;3.
Popu
lation
Cens
us19
90;4.
1998
Urban
Hou
seho
ldSu
rvey
.⁎Notationforregion
s:CN
=co
astaln
orth,C
S=
coastals
outh,N
E=
northe
ast,NC=
northcentral,SC
=southcentral,SW
=southw
est,an
dNW
=no
rthw
est.
App
endixA.P
rovincial
econ
omic
indica
tors
481Y. Fu, S.A. Gabriel / Regional Science and Urban Economics 42 (2012) 473–484
Author's personal copy
Variable Coeff(t-stat)
Variable Coeff(t-stat)
Variable Coeff(t-stat)
MALE 0.159 (19)⁎⁎⁎ Zhejian −0.029 (3.5)⁎⁎⁎ Hubei −0.036 (10)⁎⁎⁎
EXPYEAR 0.013 (4.7)⁎⁎⁎ Fujian −0.042 (4.5)⁎⁎⁎ Hunan −0.034 (4.5)⁎⁎⁎
EXPYEAR2 0.000 (0.3) Guangdong −0.035 (4.6)⁎⁎⁎ Guangxi −0.022 (2.8)⁎⁎⁎
YSCH 0.086 (25)⁎⁎⁎ Hainan −0.007 (0.5) Sichuan −0.024 (3.9)⁎⁎⁎
Constant 7.820 (156)⁎⁎⁎ Inner Mongolia −0.040 (10)⁎⁎⁎ Guizhou −0.051 (14)⁎⁎⁎
Provincial dummy×YSCH Jilin −0.028 (7.3)⁎⁎⁎ Yunnan −0.041 (14)⁎⁎⁎
Tianjing 0.002 (0.2) Heilongjian −0.024 (3.0)⁎⁎⁎ Gansu −0.009 (0.9)Hebei −0.034 (4.2)⁎⁎⁎ Shanxi −0.026 (3.3)⁎⁎⁎ Qinghai −0.070 (3.1)⁎⁎⁎
Liaoning −0.021 (3.1)⁎⁎⁎ Henan −0.020 (2.1)⁎⁎ Ningxia −0.022 (1.3)Shandong −0.027 (3.2)⁎⁎⁎ Shannxi 0.001 (0.1) Xinjiang −0.040 (11)⁎⁎⁎
Shanghai −0.019 (1.9)⁎ Anhui −0.044 (5.0)⁎⁎⁎ 89 city fixed effectsJiangshu −0.023 (2.9)⁎⁎⁎ Jiangxi −0.030 (3.1)⁎⁎⁎ R-squared 0.386
Appendix B. Estimates of returns to schooling by provinces
Independent variables Panel A (GMM)
Age 15–34 Age 35–65
Primary sch.or below
Middle school High sch.or above
Primary sch.or below
Middle school High sch.or above
Origin log farm land per rural resident −0.496 (1.5) −0.369 (1.5) −0.892 (4.2)⁎⁎⁎ −0.471 (1.6) −0.476 (1.6) −0.380 (1.1)Origin TVE share of rural workforce −5.443 (5.4)⁎⁎⁎ −3.429 (4.5)⁎⁎⁎ −1.535 (2.5)⁎⁎ −4.894 (5.8)⁎⁎⁎ −3.065 (3.8)⁎⁎⁎ −5.477 (6.7)⁎⁎⁎
Origin urban–rurallog per capita consumer spending differential
−3.287 (3.6)⁎⁎⁎ −0.631 (0.9) 5.450 (8.5)⁎⁎⁎ −0.451 (0.6) 1.934 (2.2)⁎⁎ 5.299 (5.7)⁎⁎⁎
Destination log housing space per person 4.444 (9.1)⁎⁎⁎ 3.873 (10)⁎⁎⁎ 2.678 (8.4)⁎⁎⁎ 4.160 (9.6)⁎⁎⁎ 3.964 (8.4)⁎⁎⁎ 3.384 (6.9)⁎⁎⁎
exp(−dij2 /100) 4.456 (20)⁎⁎⁎ 3.772 (23)⁎⁎⁎ 2.989 (19)⁎⁎⁎ 4.096 (22)⁎⁎⁎ 4.027 (19)⁎⁎⁎ 3.559 (16)⁎⁎⁎
Origin–destination differentials:Log urban wage rate 3.053 (3.9)⁎⁎⁎ 4.241 (7.1)⁎⁎⁎ 2.915 (5.6)⁎⁎⁎ 2.348 (3.5)⁎⁎⁎ 3.554 (4.6)⁎⁎⁎ 2.137 (2.6)⁎⁎⁎
Urban return to schooling −9.560 (2.6)⁎⁎⁎ −3.485 (1.2) 13.51 (4.2)⁎⁎⁎ −2.842 (0.9) 8.126 (2.3)⁎⁎ 12.074 (3.3)⁎⁎⁎
Per capita urban consumer spending −1.984 (4.8)⁎⁎⁎ −2.090 (6.2)⁎⁎⁎ −1.045 (3.5)⁎⁎⁎ −1.940 (5.2)⁎⁎⁎ −1.356 (3.3)⁎⁎⁎ −2.013 (4.8)⁎⁎⁎
Temperature severity 0.004 (0.1) −0.074 (2.8)⁎⁎⁎ −0.107 (4.0)⁎⁎⁎ −0.076 (2.6)⁎⁎⁎ −0.114 (3.3)⁎⁎⁎ −0.134 (3.6)⁎⁎⁎
Log urban workforce size 0.065 (0.6) 0.381 (5.0)⁎⁎⁎ 0.582 (8.2)⁎⁎⁎ 0.300 (3.4)⁎⁎⁎ 0.251 (2.5)⁎⁎ 0.626 (6.0)⁎⁎⁎
FDI share of fixed investment 2.499 (2.1)⁎⁎ 2.453 (2.5)⁎⁎ 5.371 (5.6)⁎⁎⁎ 1.939 (1.7)⁎ 3.106 (2.4)⁎⁎ 8.201 (5.3)⁎⁎⁎
Share of urban population with high schoolor above education
0.238 (0.2) 3.778 (3.6)⁎⁎⁎ 3.993 (4.4)⁎⁎⁎ 3.495 (3.0)⁎⁎⁎ 4.859 (3.8)⁎⁎⁎ 11.13 (8.6)⁎⁎⁎
Constant −20.72 (14)⁎⁎⁎ −20.07 (17)⁎⁎⁎ −17.63 (17)⁎⁎⁎ −22.24 (16)⁎⁎⁎ −22.57 (15)⁎⁎⁎ −21.22 (14)⁎⁎⁎
o–d fixed effectsOrigin: Coastal South 0.299 (0.8) 0.642 (2.2)⁎⁎ 1.600 (6.6)⁎⁎⁎ 0.221 (0.7) 1.233 (3.6)⁎⁎⁎ 1.634 (4.5)⁎⁎⁎
Origin: Northeast −0.043 (0.2) −0.036 (0.2) 0.356 (1.9)⁎ 0.050 (0.2) −0.300 (1.2) 0.662 (2.4)⁎⁎
Origin: Central North −0.289 (1.1) −0.229 (1.1) −0.356 (2.2)⁎⁎ −0.449 (2.0)⁎⁎ −0.693 (2.7)⁎⁎⁎ −0.684 (2.5)⁎⁎
Origin: Central South 0.563 (1.7)⁎ 0.772 (2.8)⁎⁎⁎ 0.289 (1.3) 0.377 (1.4) 0.326 (1.1) 0.095 (0.3)Origin: Southwest 0.412 (0.9) 0.940 (2.6)⁎⁎⁎ −1.042 (3.3)⁎⁎⁎ 0.796 (2.0)⁎⁎ 0.390 (0.9) 0.137 (0.3)Origin: Northwest 0.269 (0.6) 0.213 (0.6) 0.076 (0.3) 0.918 (2.3)⁎⁎ 0.406 (1.0) 0.139 (0.3)Destination: Coastal South −1.322 (4.9)⁎⁎⁎ −0.635 (3.1)⁎⁎⁎ −0.585 (3.6)⁎⁎⁎ −0.996 (4.1)⁎⁎⁎ −0.773 (3.0)⁎⁎⁎ −0.420 (1.7)⁎
Destination: Northeast −2.101 (7.3)⁎⁎⁎ −1.142 (5.1)⁎⁎⁎ −0.422 (2.3)⁎⁎ −1.577 (5.8)⁎⁎⁎ −0.925 (2.9)⁎⁎⁎ −1.539 (5.5)⁎⁎⁎
Destination: Central North −2.241 (9.0)⁎⁎⁎ −1.546 (7.3)⁎⁎⁎ −1.408 (7.7)⁎⁎⁎ −2.004 (8.8)⁎⁎⁎ −1.767 (6.7)⁎⁎⁎ −1.923 (7.3)⁎⁎⁎
Destination: Central South −2.315 (8.8)⁎⁎⁎ −1.617 (6.9)⁎⁎⁎ −1.028 (6.0)⁎⁎⁎ −2.073 (8.6)⁎⁎⁎ −1.412 (4.5)⁎⁎⁎ −1.803 (5.9)⁎⁎⁎
Destination: Southwest −2.324 (6.7)⁎⁎⁎ −1.786 (6.4)⁎⁎⁎ −0.966 (3.7)⁎⁎⁎ −1.601 (5.4)⁎⁎⁎ −1.581 (4.5)⁎⁎⁎ −1.345 (4.0)⁎⁎⁎
Destination: Northwest 0.109 (0.3) 0.457 (1.7)⁎ 0.020 (0.1) 0.497 (1.8)⁎ 0.576 (1.9)⁎ −0.009 (0.0)Adjusted R-squared 0.343 0.363 0.370 0.308 0.291 0.295
Panel B (GMM) Panel C (WLC)
Independent variablesPrimary schoolor below
Middleschool
High schoolor above
Age 35–65 Primary schoolor below
Middleschool
High schoolor above
Age 35-65
Origin log farm land per rural resident −1.297 (6.4)⁎⁎⁎ −1.549 (8.4)⁎⁎⁎ −1.635 (9.1)⁎⁎⁎ 0.545 (7.7)⁎⁎⁎ −1.109 (5.6)⁎⁎⁎ −1.357 (7.5)⁎⁎⁎ −1.414 (7.9)⁎⁎⁎ 0.282 (2.0)⁎⁎
Origin TVE share of rural workforce −4.597 (5.0)⁎⁎⁎ −4.093 (4.9)⁎⁎⁎ −2.543 (3.3)⁎⁎⁎ −0.459 (1.4) −6.342 (7.7)⁎⁎⁎ −5.010 (6.6)⁎⁎⁎ −1.784 (2.4)⁎⁎ 0.159 (0.3)Origin urban–rural log per capitaconsumer spending differential
0.356 (0.5) 3.079 (4.5)⁎⁎⁎ 4.729 (7.1)⁎⁎⁎ 1.051 (3.9)⁎⁎⁎ −0.546 (0.8) 1.195 (1.9)⁎ 3.712 (6.0)⁎⁎⁎ 1.359 (2.7)⁎⁎⁎
exp(−dij2/100) 4.299 (26)⁎⁎⁎ 3.924 (28)⁎⁎⁎ 3.830 (27)⁎⁎⁎ −0.217 (2.1)⁎⁎ 4.455 (22)⁎⁎⁎ 3.933 (22)⁎⁎⁎ 3.374 (19.7)⁎⁎⁎ −0.295 (1.6)
Origin–destination differentials:Log urban wage rate 1.585 (2.3)⁎⁎ 2.117 (3.3)⁎⁎⁎ 2.547 (3.9)⁎⁎⁎ −1.234 (4.9)⁎⁎⁎ 1.879 (2.7)⁎⁎⁎ 2.217 (3.4)⁎⁎⁎ 2.552 (4.0)⁎⁎⁎ −0.843 (1.9)⁎
Urban return to schooling 5.217 (1.3) 12.879 (3.5)⁎⁎⁎ 19.21 (5.3)⁎⁎⁎ 6.016 (3.8)⁎⁎⁎ −2.845 (0.8) 6.592 (2.1)⁎⁎ 14.921 (4.8)⁎⁎⁎ 7.084 (2.7)⁎⁎⁎
per capita urban consumer spending −1.264 (2.5)⁎⁎ −1.639 (3.5)⁎⁎⁎ −2.160 (4.7)⁎⁎⁎ 0.202 (1.4) −2.167 (4.8)⁎⁎⁎ −1.914 (4.5)⁎⁎⁎ −1.719 (4.1)⁎⁎⁎ 0.555 (2.1)⁎⁎
Temperature severity 0.016 (0.5) −0.073 (2.5)⁎⁎ −0.087 (2.9)⁎⁎⁎ −0.043 (3.7)⁎⁎⁎ 0.009 (0.3) −0.062 (2.3)⁎⁎ −0.084 (3.1)⁎⁎⁎ −0.043 (2.2)⁎⁎
Log urban workforce size −0.602 (6.2)⁎⁎⁎ −0.378 (4.4)⁎⁎⁎ −0.335 (3.8)⁎⁎⁎ −0.053 (1.3) −0.758 (8.2)⁎⁎⁎ −0.560 (6.7)⁎⁎⁎ −0.509 (6.2)⁎⁎⁎ −0.003 (0.0)
Note: The dependent variable is ln(Employment Income). The sample is from 1998 Urban Household Survey and includes 117664 individuals from 90 cities across 29 provinces.MALE is a dummy variable equal to unity for males, EXPYEAR is the number of years of working experience, and YSCH is the number of years of schooling of the individual. t-statisticsare in parentheses and ⁎⁎⁎, ⁎⁎, ⁎ denote statistical significance at 1%, 5% and 10% level respectively.
Appendix C. Robustness analysis of the directional migration odds model estimation
482 Y. Fu, S.A. Gabriel / Regional Science and Urban Economics 42 (2012) 473–484
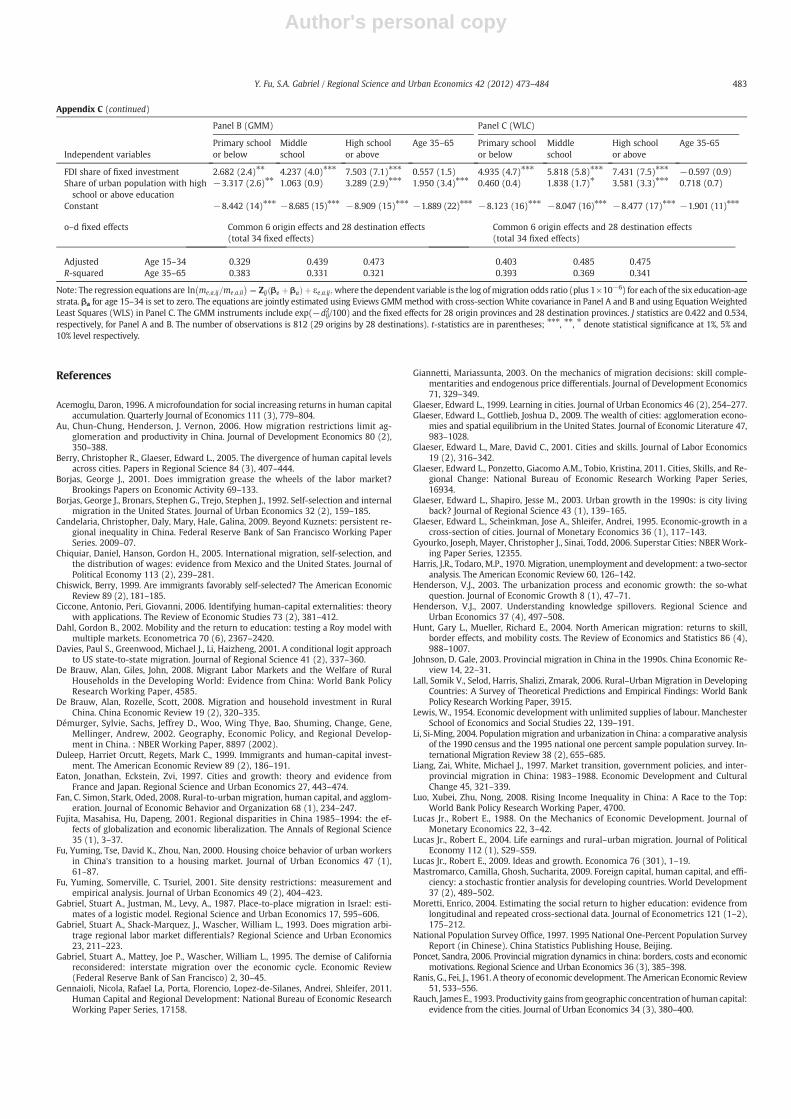
Author's personal copy
(continued)
Panel B (GMM) Panel C (WLC)
Independent variablesPrimary schoolor below
Middleschool
High schoolor above
Age 35–65 Primary schoolor below
Middleschool
High schoolor above
Age 35-65
FDI share of fixed investment 2.682 (2.4)⁎⁎ 4.237 (4.0)⁎⁎⁎ 7.503 (7.1)⁎⁎⁎ 0.557 (1.5) 4.935 (4.7)⁎⁎⁎ 5.818 (5.8)⁎⁎⁎ 7.431 (7.5)⁎⁎⁎ −0.597 (0.9)Share of urban population with highschool or above education
−3.317 (2.6)⁎⁎ 1.063 (0.9) 3.289 (2.9)⁎⁎⁎ 1.950 (3.4)⁎⁎⁎ 0.460 (0.4) 1.838 (1.7)⁎ 3.581 (3.3)⁎⁎⁎ 0.718 (0.7)
Constant −8.442 (14)⁎⁎⁎ −8.685 (15)⁎⁎⁎ −8.909 (15)⁎⁎⁎ −1.889 (22)⁎⁎⁎ −8.123 (16)⁎⁎⁎ −8.047 (16)⁎⁎⁎ −8.477 (17)⁎⁎⁎ −1.901 (11)⁎⁎⁎
o–d fixed effects Common 6 origin effects and 28 destination effects(total 34 fixed effects)
Common 6 origin effects and 28 destination effects(total 34 fixed effects)
Adjusted Age 15–34 0.329 0.439 0.473 0.403 0.485 0.475R-squared Age 35–65 0.383 0.331 0.321 0.393 0.369 0.341
Appendix C (continued)
Note: The regression equations are ln me;a;ij=me;a;ii� � ¼ Zij βe þ βað Þ þ εe;a;ij;where the dependent variable is the log ofmigration odds ratio (plus 1×10⁻⁶) for each of the six education-age
strata. βa for age 15–34 is set to zero. The equations are jointly estimated using Eviews GMMmethod with cross-section White covariance in Panel A and B and using Equation WeightedLeast Squares (WLS) in Panel C. The GMM instruments include exp(−dij
2/100) and the fixed effects for 28 origin provinces and 28 destination provinces. J statistics are 0.422 and 0.534,respectively, for Panel A and B. The number of observations is 812 (29 origins by 28 destinations). t-statistics are in parentheses; ⁎⁎⁎, ⁎⁎, ⁎ denote statistical significance at 1%, 5% and10% level respectively.
References
Acemoglu, Daron, 1996. A microfoundation for social increasing returns in human capitalaccumulation. Quarterly Journal of Economics 111 (3), 779–804.
Au, Chun-Chung, Henderson, J. Vernon, 2006. How migration restrictions limit ag-glomeration and productivity in China. Journal of Development Economics 80 (2),350–388.
Berry, Christopher R., Glaeser, Edward L., 2005. The divergence of human capital levelsacross cities. Papers in Regional Science 84 (3), 407–444.
Borjas, George J., 2001. Does immigration grease the wheels of the labor market?Brookings Papers on Economic Activity 69–133.
Borjas, George J., Bronars, Stephen G., Trejo, Stephen J., 1992. Self-selection and internalmigration in the United States. Journal of Urban Economics 32 (2), 159–185.
Candelaria, Christopher, Daly, Mary, Hale, Galina, 2009. Beyond Kuznets: persistent re-gional inequality in China. Federal Reserve Bank of San Francisco Working PaperSeries. 2009–07.
Chiquiar, Daniel, Hanson, Gordon H., 2005. International migration, self-selection, andthe distribution of wages: evidence from Mexico and the United States. Journal ofPolitical Economy 113 (2), 239–281.
Chiswick, Berry, 1999. Are immigrants favorably self-selected? The American EconomicReview 89 (2), 181–185.
Ciccone, Antonio, Peri, Giovanni, 2006. Identifying human-capital externalities: theorywith applications. The Review of Economic Studies 73 (2), 381–412.
Dahl, Gordon B., 2002. Mobility and the return to education: testing a Roy model withmultiple markets. Econometrica 70 (6), 2367–2420.
Davies, Paul S., Greenwood, Michael J., Li, Haizheng, 2001. A conditional logit approachto US state-to-state migration. Journal of Regional Science 41 (2), 337–360.
De Brauw, Alan, Giles, John, 2008. Migrant Labor Markets and the Welfare of RuralHouseholds in the Developing World: Evidence from China: World Bank PolicyResearch Working Paper, 4585.
De Brauw, Alan, Rozelle, Scott, 2008. Migration and household investment in RuralChina. China Economic Review 19 (2), 320–335.
Démurger, Sylvie, Sachs, Jeffrey D., Woo, Wing Thye, Bao, Shuming, Change, Gene,Mellinger, Andrew, 2002. Geography, Economic Policy, and Regional Develop-ment in China. : NBER Working Paper, 8897 (2002).
Duleep, Harriet Orcutt, Regets, Mark C., 1999. Immigrants and human-capital invest-ment. The American Economic Review 89 (2), 186–191.
Eaton, Jonathan, Eckstein, Zvi, 1997. Cities and growth: theory and evidence fromFrance and Japan. Regional Science and Urban Economics 27, 443–474.
Fan, C. Simon, Stark, Oded, 2008. Rural-to-urban migration, human capital, and agglom-eration. Journal of Economic Behavior and Organization 68 (1), 234–247.
Fujita, Masahisa, Hu, Dapeng, 2001. Regional disparities in China 1985–1994: the ef-fects of globalization and economic liberalization. The Annals of Regional Science35 (1), 3–37.
Fu, Yuming, Tse, David K., Zhou, Nan, 2000. Housing choice behavior of urban workersin China's transition to a housing market. Journal of Urban Economics 47 (1),61–87.
Fu, Yuming, Somerville, C. Tsuriel, 2001. Site density restrictions: measurement andempirical analysis. Journal of Urban Economics 49 (2), 404–423.
Gabriel, Stuart A., Justman, M., Levy, A., 1987. Place-to-place migration in Israel: esti-mates of a logistic model. Regional Science and Urban Economics 17, 595–606.
Gabriel, Stuart A., Shack-Marquez, J., Wascher, William L., 1993. Does migration arbi-trage regional labor market differentials? Regional Science and Urban Economics23, 211–223.
Gabriel, Stuart A., Mattey, Joe P., Wascher, William L., 1995. The demise of Californiareconsidered: interstate migration over the economic cycle. Economic Review(Federal Reserve Bank of San Francisco) 2, 30–45.
Gennaioli, Nicola, Rafael La, Porta, Florencio, Lopez-de-Silanes, Andrei, Shleifer, 2011.Human Capital and Regional Development: National Bureau of Economic ResearchWorking Paper Series, 17158.
Giannetti, Mariassunta, 2003. On the mechanics of migration decisions: skill comple-mentarities and endogenous price differentials. Journal of Development Economics71, 329–349.
Glaeser, Edward L., 1999. Learning in cities. Journal of Urban Economics 46 (2), 254–277.Glaeser, Edward L., Gottlieb, Joshua D., 2009. The wealth of cities: agglomeration econo-
mies and spatial equilibrium in the United States. Journal of Economic Literature 47,983–1028.
Glaeser, Edward L., Mare, David C., 2001. Cities and skills. Journal of Labor Economics19 (2), 316–342.
Glaeser, Edward L., Ponzetto, Giacomo A.M., Tobio, Kristina, 2011. Cities, Skills, and Re-gional Change: National Bureau of Economic Research Working Paper Series,16934.
Glaeser, Edward L., Shapiro, Jesse M., 2003. Urban growth in the 1990s: is city livingback? Journal of Regional Science 43 (1), 139–165.
Glaeser, Edward L., Scheinkman, Jose A., Shleifer, Andrei, 1995. Economic-growth in across-section of cities. Journal of Monetary Economics 36 (1), 117–143.
Gyourko, Joseph, Mayer, Christopher J., Sinai, Todd, 2006. Superstar Cities: NBERWork-ing Paper Series, 12355.
Harris, J.R., Todaro, M.P., 1970. Migration, unemployment and development: a two-sectoranalysis. The American Economic Review 60, 126–142.
Henderson, V.J., 2003. The urbanization process and economic growth: the so-whatquestion. Journal of Economic Growth 8 (1), 47–71.
Henderson, V.J., 2007. Understanding knowledge spillovers. Regional Science andUrban Economics 37 (4), 497–508.
Hunt, Gary L., Mueller, Richard E., 2004. North American migration: returns to skill,border effects, and mobility costs. The Review of Economics and Statistics 86 (4),988–1007.
Johnson, D. Gale, 2003. Provincial migration in China in the 1990s. China Economic Re-view 14, 22–31.
Lall, Somik V., Selod, Harris, Shalizi, Zmarak, 2006. Rural–Urban Migration in DevelopingCountries: A Survey of Theoretical Predictions and Empirical Findings: World BankPolicy Research Working Paper, 3915.
Lewis, W., 1954. Economic development with unlimited supplies of labour. ManchesterSchool of Economics and Social Studies 22, 139–191.
Li, Si-Ming, 2004. Populationmigration and urbanization in China: a comparative analysisof the 1990 census and the 1995 national one percent sample population survey. In-ternational Migration Review 38 (2), 655–685.
Liang, Zai, White, Michael J., 1997. Market transition, government policies, and inter-provincial migration in China: 1983–1988. Economic Development and CulturalChange 45, 321–339.
Luo, Xubei, Zhu, Nong, 2008. Rising Income Inequality in China: A Race to the Top:World Bank Policy Research Working Paper, 4700.
Lucas Jr., Robert E., 1988. On the Mechanics of Economic Development. Journal ofMonetary Economics 22, 3–42.
Lucas Jr., Robert E., 2004. Life earnings and rural–urban migration. Journal of PoliticalEconomy 112 (1), S29–S59.
Lucas Jr., Robert E., 2009. Ideas and growth. Economica 76 (301), 1–19.Mastromarco, Camilla, Ghosh, Sucharita, 2009. Foreign capital, human capital, and effi-
ciency: a stochastic frontier analysis for developing countries. World Development37 (2), 489–502.
Moretti, Enrico, 2004. Estimating the social return to higher education: evidence fromlongitudinal and repeated cross-sectional data. Journal of Econometrics 121 (1–2),175–212.
National Population Survey Office, 1997. 1995 National One-Percent Population SurveyReport (in Chinese). China Statistics Publishing House, Beijing.
Poncet, Sandra, 2006. Provincial migration dynamics in china: borders, costs and economicmotivations. Regional Science and Urban Economics 36 (3), 385–398.
Ranis, G., Fei, J., 1961. A theory of economic development. The American Economic Review51, 533–556.
Rauch, James E., 1993. Productivity gains fromgeographic concentration of human capital:evidence from the cities. Journal of Urban Economics 34 (3), 380–400.
483Y. Fu, S.A. Gabriel / Regional Science and Urban Economics 42 (2012) 473–484

Author's personal copy
Roback, Jennifer, 1982. Wages, rents, and the quality of life. Journal of Political Economy90 (6), 1257–1278.
Romer, PaulM., 1990. Endogenous technological change. The Journal of Political Economy98 (5), S71–S102.
Roy, Andrew D., 1951. Some thoughts on the distribution of earnings. Oxford EconomicPapers 3, 135–146.
Sasser, Alicia, 2010. Votingwith their feet: relative economic conditions and statemigrationpatterns. Regional Science and Urban Economics 40, 122–135.
Shapiro, Jesse M., 2006. Smart cities: quality of life, productivity, and the growth effectsof human capital. The Review of Economics and Statistics 88 (2), 324–335.
Shen, Jianfa, 2005. Counting urban population in Chinese censuses 1953–2000: changingdefinitions, problems and solutions. Population Space and Place 11 (5), 381–400.
Sjaastad, Larry A., 1962. The costs and returns of humanmigration. The Journal of PoliticalEconomy 70 (5), 80–93.
Tuan, Chyau, Ng, Linda F.Y., Zhao, Bo, 2009. China's post-economic reform growth: therole of FDI and productivity progress. Journal of Asian Economics 20, 280–293.
Villaverde, Jose, Maza, Adolfo, Ramasamy, Bala, 2010. Provincial disparities in post-reformChina. China & World Economy 18 (2), 73–95.
Wang, Feng, Zuo, Xuejin, 1999. Inside China's cities: institutional barriers and opportunitiesfor urban migrants. The American Economic Review 89 (2), 276–280.
Wei, Shang-Jin, Wu, Yi, 2001. Globalization and Inequality: Evidence from WithinChina: NBER Working Paper, 8611.
Whalley, J., Zhang, S., 2004. Inequality Change in China and (HuKou) Labor MobilityRestrictions: NBER Working Paper, 10683.
World Bank, 2009. World Development Report 2009: Reshaping Economic GeographyWashington. World Bank, DC.
Wu, Zhongmin, Yao, Shujie, 2003. Intermigration and intramigration in China: a theo-retical and empirical analysis. China Economic Review 14, 371–385.
Zhang, Kevin H., Song, Shunfeng, 2003. Rural–urbanmigration and urbanization in China:evidence from time-series and cross-section analyses. China Economic Review 14 (4),386–400.
Zhang, W.M., Li, X.R., Ye, L.Q., Xie, G., Hu, Y., 1998. An analysis of China's population migra-tion. Economic Research Intelligence (in Chinese, Jingji Yanjiu Cankao) 57, 2–18.
Zhang, Junsen, Zhao, Yaohui, Park, Albert, Song, Xiaoqing, 2005. Economic returns toschooling in urban China, 1988 to 2001. Journal of Comparative Economics 33 (4),730–752.
Zhao, Yaohui, 1999. Leaving the countryside: rural-to-urban migration decisions inChina. The American Economic Review 89 (2), 281–286.
Zhao, Yaohui, 2002. Causes and consequences of return migration: recent evidencefrom China. Journal of Comparative Economics 30, 376–394.
Zhao, Yaohui, 2003. The role of migrant networks in labor migration: the case of China.Contemporary Economic Policy 21 (4), 500–511.
484 Y. Fu, S.A. Gabriel / Regional Science and Urban Economics 42 (2012) 473–484


