Author's personal copy - disco.ethz.ch · Author's personal copy Recognition of dietary activity...
17
This article was published in an Elsevier journal. The attached copy is furnished to the author for non-commercial research and education use, including for instruction at the author’s institution, sharing with colleagues and providing to institution administration. Other uses, including reproduction and distribution, or selling or licensing copies, or posting to personal, institutional or third party websites are prohibited. In most cases authors are permitted to post their version of the article (e.g. in Word or Tex form) to their personal website or institutional repository. Authors requiring further information regarding Elsevier’s archiving and manuscript policies are encouraged to visit: http://www.elsevier.com/copyright
Transcript of Author's personal copy - disco.ethz.ch · Author's personal copy Recognition of dietary activity...
This article was published in an Elsevier journal. The attached copyis furnished to the author for non-commercial research and
education use, including for instruction at the author’s institution,sharing with colleagues and providing to institution administration.
Other uses, including reproduction and distribution, or selling orlicensing copies, or posting to personal, institutional or third party
websites are prohibited.
In most cases authors are permitted to post their version of thearticle (e.g. in Word or Tex form) to their personal website orinstitutional repository. Authors requiring further information
regarding Elsevier’s archiving and manuscript policies areencouraged to visit:
http://www.elsevier.com/copyright

Author's personal copy
Recognition of dietary activity events usingon-body sensors
Oliver Amft *, Gerhard Troster
ETH Zurich, Wearable Computing Lab., c/o Electronics Laboratory, Gloriastrasse 35,8092 Zurich, Switzerland
Received 20 November 2006; received in revised form 20 November 2007; accepted 21 November 2007
Artificial Intelligence in Medicine (2008) 42, 121—136
http://www.intl.elsevierhealth.com/journals/aiim
KEYWORDSAutomatic dietarymonitoring;On-body sensing;Activity spotting;Event detection;Classifier fusion;Behavioural analysis;Nutrition;Chewing sounds
Summary
Objective: An imbalanced diet elevates health risks for many chronic diseasesincluding obesity. Dietary monitoring could contribute vital information to lifestylecoaching and diet management, however, current monitoring solutions are notfeasible for a long-term implementation. Towards automatic dietary monitoring, thiswork targets the continuous recognition of dietary activities using on-body sensors.Methods: An on-body sensing approach was chosen, based on three core activitiesduring intake: arm movements, chewing and swallowing. In three independentevaluation studies the continuous recognition of activity events was investigatedand the precision-recall performance analysed. An event recognition procedure wasdeployed, that addresses multiple challenges of continuous activity recognition,including the dynamic adaptability for variable-length activities and flexible deploy-ment by supporting one to many independent classes. The approach uses a sensitiveactivity event search followed by a selective refinement of the detection usingdifferent information fusion schemes. The method is simple and modular in designand implementation.Results: The recognition procedure was successfully adapted to the investigateddietary activities. Four intake gesture categories from arm movements and two foodgroups from chewing cycle sounds were detected and identified with a recall of 80—90% and a precision of 50— 64%. The detection of individual swallows resulted in 68%recall and 20% precision. Sample-accurate recognition rates were 79% for movements,86% for chewing and 70% for swallowing.Conclusions: Body movements and chewing sounds can be accurately identified usingon-body sensors, demonstrating the feasibility of on-body dietary monitoring. Furtherinvestigations are needed to improve the swallowing spotting performance.# 2007 Elsevier B.V. All rights reserved.
* Corresponding author. Tel.: +41 44 632 5936; fax: +41 44 632 1210.E-mail address: [email protected] (O. Amft).
0933-3657/$ — see front matter # 2007 Elsevier B.V. All rights reserved.doi:10.1016/j.artmed.2007.11.007

Author's personal copy
1. Introduction
Daily dieting behaviour strongly influences the riskfor developing disease conditions. The most preva-lent disease associated to an imbalanced diet isobesity. Current estimations account for over onebillion of overweight and 400 million obese patientsworldwide. This still increasing trend was attributedto the rapid changes in society and behaviouralpatterns in the last decades [1]. However, obesityis not a unique diet-related disease that decreaseshealthy life-years in many populations. Rather, itsurges the risk for related diseases, including dia-betes mellitus, different types of cancer and cardio-vascular diseases. Often the diseases confound oroverlay each other, preventing accurate accounting.
Several key risk factors have been identified, thatare controlled by dieting behaviour. These includethe timing of food intake and integration into dailyschedule. For example, intermediate snacking wasfound to add a major part to the daily energy intake[2]. Another critical aspect is the food selection.High-energy food can be replaced by lower energydensities, such as fruits and vegetables. Thisimproves the diet quality and lowers body weight[3].
Minimising individual risk factors is a preventiveapproach to systematically fight the origin of diet-related diseases. It is themost promising solution forimproving quality of life in the future. Since nutri-tion is an inherent part of daily activities, theadoption of a healthy diet requires individual life-style changes. These changes need to be implemen-ted and maintained over periods of months andyears. For this purpose, a convenient long-termmonitoring of dietary behaviour could become avital tool to assess eating disorders and support dietmodifications through feedback and coaching.
1.1. Dietary behaviour monitoring
No single-sensor solution exist that could capturethe process of food intake and is simple to imple-ment for diet management. Currently, dietary activ-ities are studied manually by entering theinformation into food intake questionnaires. Mobiledevices and Internet appliances are used to supportthe information entry, e.g. by taking pictures of thefood [4] and estimating calories from entered data[5]. Further approaches to simplify data entryinclude the scanning of shopping receipts [6] as wellas bar codes or recording voice logs [7].
These manual acquisition methods require a con-siderable effort of study participants, primarily toremember entering the information into the ques-tionnaire, and study managers, to verify and analyse
the data. Typically, this method is prone to errorssuch as imprecise timing due to back-filling, missingfood item details, e.g. when using voice recordings[7] and low user compliance, especially for paper-based diaries [8].
Many dietary parameters such as the rate ofintake (in g/s) or the number of chews for a foodpiece are rarely assessed because adequate sensingfacilities are only available in laboratory settings.However, these parameters are related to palat-ability, satiety and speed of eating [9]. Behaviouralinvestigations have utilised weighting tables in con-trolled settings to measure the amount and rate offood intake during the consumption of individualmeals [10]. An oral implant sensors was developedto acquire information about these parameters [11].However, these techniques certainly influences theuser’s behaviour and are not feasible for long-termmonitoring.
All noninvasive dietary monitoring techniquessuffer from estimation errors regarding the exactamount and calories of every consumed food item.However, a rough estimation for relevant para-meters such as ratio of fluid and solid foods, foodcategory and timing information, such as eatingschedule and meal intake durations over the day,will provide a solid basis for behavioural coaching.We believe that much of this information can beextracted from on-body sensors.
1.2. Paper contributions and outline
In this work, we evaluate on-body sensing methodsto automatically monitor dietary intake behaviour.In particular, three core aspects of dietary activity(sensing domains) were investigated by on-bodysensors:
(1) Characteristic arm and trunk movements asso-ciated with the intake of foods, using inertialsensors.
(2) Chewing of foods, monitored by recording thefood breakdown sound with an ear microphone.
(3) Swallowing activity, acquired by a sensor-collarcontaining surface Electromyography (EMG)electrodes and a stethoscope microphone.
We derive pattern models for specific activityevents using the sensor data of each domain andanalyse the event recognition performance. Forexample, individual chews are considered as eventsin the domain chewing. In particular, the papermakes the following contributions:
(1) We present a flexible event spotting methodthat can be applied either to an individual sen-
122 O. Amft, G. Troster

Author's personal copy
sing modality or a combination of several. Theapproach obtains its adaptivity from a variable-length feature pattern search. Its selectivepower originates from competitive and suppor-tive fusion of event spottings with largely inde-pendent sources of errors. We summarise thedomain-specific adaptations of the procedure.The pattern description is achieved by usingtime and frequency-domain features that modelthe temporal characteristics of an event. Usingthis approach, more complex algorithms, likehidden Markov models (HMMs) were avoided.
(2) We analyse the recognition of individual armmovements as well as chewing and swallowingactivities from the intake of different fooditems. For each domain, we describe the activ-ity sensing approach, the domain-specific recog-nition constraints and the conducted casestudies to obtain naturalistic evaluation data.Since our work targets a combined detectionand classification of the activity events, wepresent quantitative results for both, indicatinga good performance and the feasibility of thesensing approaches for automatic dietary mon-itoring.
The evaluations are performed on data fromthree different studies. To analyse the recognitionperformance under realistic conditions, the datasets included other common activities, e.g. conver-sations and arbitrary movements.
2. Dietary activity domains andrelated work
Activity monitoring and recognition has attractedresearchers from many backgrounds, includingmachine vision and more recently pervasive andwearable computing. An exhaustive review of theliterature is beyond the scope of this work. Instead,we focus on systems for behaviour and automaticdietary monitoring as well as research on the threesensing domains considered in this work.
Approaches towards automatic dietary monitor-ing typically build on intelligent infrastructures.Chang et al. [12] developed a monitoring table todetect activities in a dining scenario. The table ispartitioned into several sensing sections equippedwith radio-frequency-identification (RFID) readersto identify food containers and weight sensors totrack food transport between containers and perso-nal plates. The precision of the system is bound tothe spatial resolution of table sensing sections andrequires static assignment of food containers tothese sections. The concept of load sensing on a
table surface for user activity detection was intro-duced earlier by Schmidt et al. [13]. In theirapproach, coarse object movements were esti-mated from a single sensing section.
Beigl et al. [14] equipped household objects withsensing capabilities. In the presented example, acup was chosen to identify activities carried outwith it.
For dietary monitoring applications, RFID tech-nology has great potential as a combined wearableand environmental sensing modality. Pattersonet al. [15] attached tags to 60 household objects.The detection was restricted to morning activities,recorded by an RFID reader worn at the user’s hand.The activities included, using the bathroom, pre-paring breakfast foods and eating breakfast.
The infrastructure sensing approaches providevaluable information on various user activities weresensors can be easily attached or hidden. However,the approaches generally suffer from the user iden-tification problem: while one user may prepare thefoods, several others can consume them. Wearablesensors can bridge this gap and associate the userdirectly to the activities. Moreover, since worn atthe body, the sensors can reveal more detailedinformation that otherwise would require labora-tory setups.
2.1. Movement recognition
Movements and gestures related to dietary intakecan be roughly discriminated into a preparationphase of the food or beverage items, such as unpack-ing, opening, cooking and plate or cup filling, andthe actual feeding. The feeding movements targetthe fine-cutting, loading, and manoeuvring of theprepared piece to the mouth. In the feeding phasespecific tools, such as fork and knife can be used.
Our focus is to recognise intentional arm andupper body movements during the feeding phase.These movements are a result of handling the tool inthe hand(s) and the food material properties visc-osity and size. These properties relate directly tothe food category. For example, a soup is usuallyfeed with a spoon while a glass, cup, or bottle is usedfor drinking. Hence, all relevant movement eventscan be characterised as directed gestures of the leftor right arm, supported by the upper body.
A large base of existing works addressed theproblem of classification on well-defined sequencesor previously isolated gestures, e.g. for Kung Fumoves [16] or in a worker assembly scenario [17].Works that targeted the continuous recognition usedexplicit segmentation steps or implicit segmenta-tion capabilities of algorithms, such as HMMs. Leeand Kim [18] used HMMs and introduced a threshold
Recognition of dietary activity events 123
Author's personal copy
model to eliminate detection noise. The thresholdmodel is constructed from all trained gesture mod-els. Explicit segmentation was used by Ward et al.[19] in an assembly task. Recognition was achievedby fusing classifier outputs. Lee and Yangsheng [20]used acceleration thresholds in combination withHMMs. In previous works of the authors on intakegesture recognition, HMMs were used together withan explicit data-adaptive segmentation [21].
While HMMs are helpful to model the temporalstructure of movements, they were avoided in thiswork to minimise the complexity of the searchprocedure for both training and actual search.
2.2. Chewing recognition
Chewing targets simultaneous food breakdown andlubrication to form a food bolus that can be swal-lowed. A chewing sequence starts after the foodpiece is transferred to the mouth. The food break-down is composed of arbitrary tongue movementsand cyclic opening and closing of the jaw (chewingcycle). During the material breakdown sounds areemitted that are partially audible by air-conductionin the near vicinity, but effectively transmitted bybone-conduction from teeth and jawbone to theskull and the ear canal.
The emitted sounds are related to the food mate-rial texture. Interaction of chewing with the acous-tic sensation and perception of food items has beeninvestigated to study food preferences. Typically,studio recording setups were used to analyse air-conducted chewing sounds [22] and laboratoryinstallations to assess the deformation sounds witha destruction instrument [23]. The loudness of afood item during chewing depends mainly on itsinner structure, the arrangement of cells, impuritiesand existing cracks [24]. Wet cellular materials,such as apples and lettuce, are termed wet-crispsince the cell structures contain fluids, whereas dry-crisp products, such as potato chips have air inclu-sions [25].
The food deformation in a chewing cycle is under-stood as a gradually decomposition of the materialstructure, observed as a decline of the sound level[26]. Initial attempts were made by DeBelie et al.[27] to discriminate two classes of crispness inapples by analysing principal components in thesound spectrum of the initial bite. In a followupwork DeBelie et al. [28] classified the sound emis-sions from the initial bite of different dry-crispsnacks. Both works addressed the isolated classifi-cation. In our previous work, the microphone posi-tioning and classification of four different foods wasinvestigated [29]. The ear canal provided the bestsignal (chewing) to noise (user speaking) ratio. This
sensor positioning can be comfortable and sociallyacceptable for continuous monitoring, comparableto mobile headsets or hearing aids.
In this work, following our recognition approach,the identification of individual chewing cyclesfrom food breaking sounds was targeted. The foodcategory is subsequently classified from the soundpattern of the cycle.
2.3. Swallowing recognition
Swallowing is a frequent activity during food intake.It is mostly performed unconsciously and wheninitiated, controlled by a pattern of muscle activa-tions [30]. The swallowing act is often partitionedinto (1) oral preparation phase (food in the mouth),(2) pharyngeal phase (food bolus in the throat) and(3) esophageal phase (food propulsion towards thestomach) [31]. After transforming the food to aallowable bolus in the oral phase, the swallowingreflex is initiated by the tongue, starting the phar-yngeal phase. In this phase a sequence of muscleactivations is used to transport the bolus and protectthe respiratory tract.
A number of clinical assessment methods havebeen developed to analyse the complex interactionof swallowing, phonation and respiration at thepharynx and diagnose abnormal swallowing in thepharyngeal phase. The assessment methods can bebroadly grouped as invasive methods, that require astrict laboratory or clinic setting and a variety ofnoninvasive sensing methods. In the latter category,the following main approaches were taken: sensingmuscle activations by surface EMG, e.g. [32], listen-ing to the throat sounds using a stethoscope [33] aswell as stethoscope-like acoustic transducers orsealed microphones [34].
A large share of research works targeted the basicunderstanding of the swallowing process, only fewaddressed the continuous monitoring. Danbolt et al.[35] used sensors to detect hyoid movement at thethroat. It was found that the sensor incurs heavymeasurement artifacts from neck and tongue move-ments as well as from speaking. Limdi et al. [36]tracked muscle contraction intensity based on sur-face EMG to inform the user of elevated swallowingrates. Sukthankar et al. [37] used surface EMGand vibration sensors and targeted applicationsin dysphagia rehabilitation. Both latter works didnot present a performance evaluation for theirapproaches to the continuous recognition problem.In our previous work [38], swallowing was analysedfrom surface EMG and sound for the isolated classi-fication of swallowed bolus types, e.g. solid or fluid.Moreover, an initial investigation towards the con-tinuous detection was made. The approach is taken
124 O. Amft, G. Troster
Author's personal copy
forward in the present evaluation by extending theswallowing study and evaluating the performance ofdifferent fusion methods.
3. Recognition and evaluationmethods
The envisioned system shall be continuously wornduring daily routine. In all sensing domains relevantactivity events occur only sporadically, oftenembedded into a large set of other, non-relevantactivities (NULL class). For example, stethoscope-like sound recordings intended to record swallowingsounds at the throat, inherently pick up speaking, oreven environmental noises.
A method that targets the spotting of relevantactivity events should be effective in retrievingcorrect events while omitting NULL class data. How-ever, the sensing domains considered in this workhave very few constraints, resulting in a highlyvariable NULL class. As a consequence of this diver-sity, it is not feasible to derive a model for NULL(garbage model) without integrating assumptionsabout these random activities. Moreover, trainingof the relevant event model(s) should be criticallyreviewed for its dependency on NULL.
Another challenge is the variable length of theactivities, leading to duration variances in the rele-vant events. Consider for example a intake gestureusing fork and knife where the food must be cut intoappropriate sized pieces before manoeuvring it tothe mouth. This indicates that a simple, fixed slidingwindow search would not be able to identify thegestures accurately.
Our approach to detecting and classifying dietaryactivities is based on three main steps: (1) an expli-cit segmentation of signals to define search bounds,(2) a sensitive event detection using a feature simi-larity search algorithm with an adaptive, dynami-cally defined window size, and (3) a selective fusionof detection results exploiting independent sources
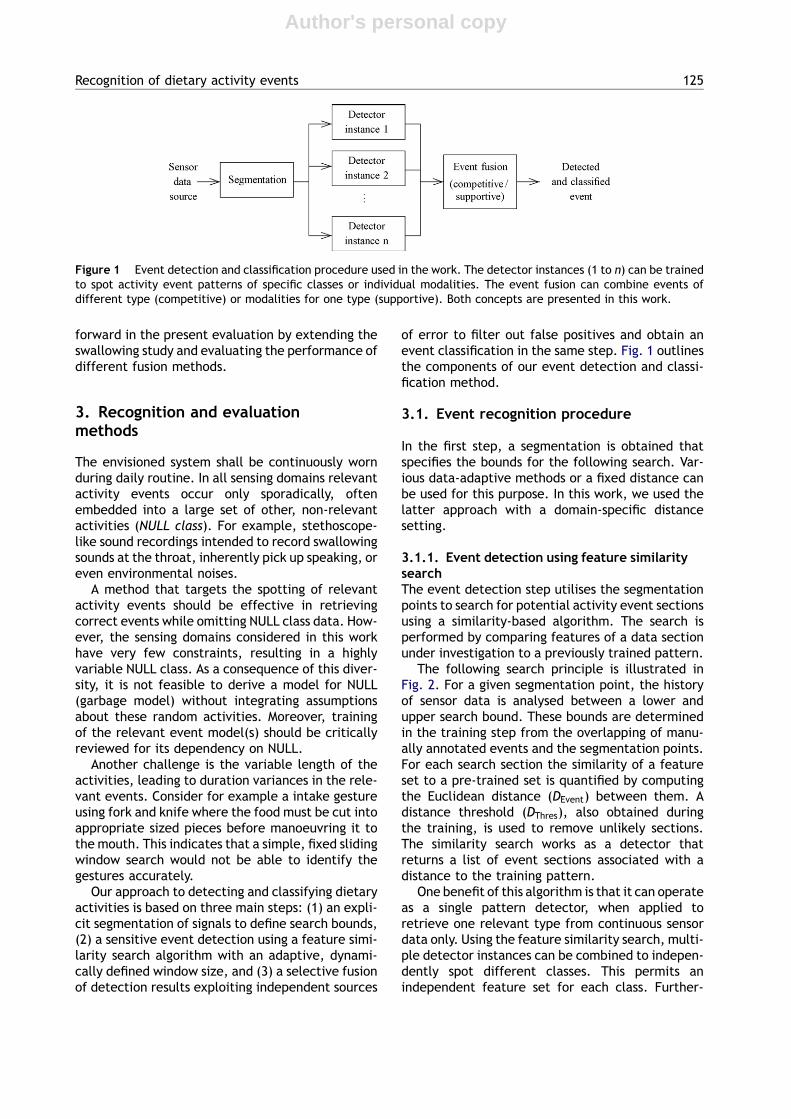
of error to filter out false positives and obtain anevent classification in the same step. Fig. 1 outlinesthe components of our event detection and classi-fication method.
3.1. Event recognition procedure
In the first step, a segmentation is obtained thatspecifies the bounds for the following search. Var-ious data-adaptive methods or a fixed distance canbe used for this purpose. In this work, we used thelatter approach with a domain-specific distancesetting.
3.1.1. Event detection using feature similaritysearchThe event detection step utilises the segmentationpoints to search for potential activity event sectionsusing a similarity-based algorithm. The search isperformed by comparing features of a data sectionunder investigation to a previously trained pattern.
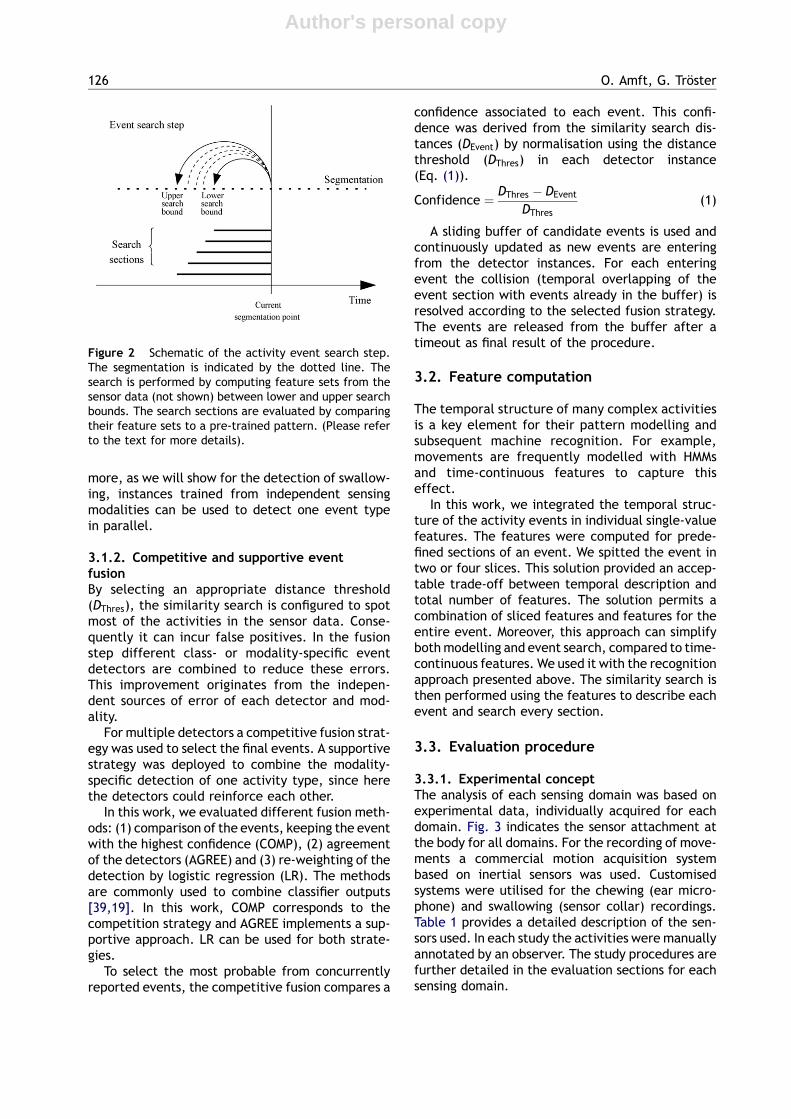
The following search principle is illustrated inFig. 2. For a given segmentation point, the historyof sensor data is analysed between a lower andupper search bound. These bounds are determinedin the training step from the overlapping of manu-ally annotated events and the segmentation points.For each search section the similarity of a featureset to a pre-trained set is quantified by computingthe Euclidean distance (DEvent) between them. Adistance threshold (DThres), also obtained duringthe training, is used to remove unlikely sections.The similarity search works as a detector thatreturns a list of event sections associated with adistance to the training pattern.
One benefit of this algorithm is that it can operateas a single pattern detector, when applied toretrieve one relevant type from continuous sensordata only. Using the feature similarity search, multi-ple detector instances can be combined to indepen-dently spot different classes. This permits anindependent feature set for each class. Further-
Recognition of dietary activity events 125
Figure 1 Event detection and classification procedure used in the work. The detector instances (1 to n) can be trainedto spot activity event patterns of specific classes or individual modalities. The event fusion can combine events ofdifferent type (competitive) or modalities for one type (supportive). Both concepts are presented in this work.
Author's personal copy
more, as we will show for the detection of swallow-ing, instances trained from independent sensingmodalities can be used to detect one event typein parallel.
3.1.2. Competitive and supportive eventfusionBy selecting an appropriate distance threshold(DThres), the similarity search is configured to spotmost of the activities in the sensor data. Conse-quently it can incur false positives. In the fusionstep different class- or modality-specific eventdetectors are combined to reduce these errors.This improvement originates from the indepen-dent sources of error of each detector and mod-ality.
For multiple detectors a competitive fusion strat-egy was used to select the final events. A supportivestrategy was deployed to combine the modality-specific detection of one activity type, since herethe detectors could reinforce each other.
In this work, we evaluated different fusion meth-ods: (1) comparison of the events, keeping the eventwith the highest confidence (COMP), (2) agreementof the detectors (AGREE) and (3) re-weighting of thedetection by logistic regression (LR). The methodsare commonly used to combine classifier outputs[39,19]. In this work, COMP corresponds to thecompetition strategy and AGREE implements a sup-portive approach. LR can be used for both strate-gies.
To select the most probable from concurrentlyreported events, the competitive fusion compares a
confidence associated to each event. This confi-dence was derived from the similarity search dis-tances (DEvent) by normalisation using the distancethreshold (DThres) in each detector instance(Eq. (1)).
Confidence ¼ DThres � DEvent
DThres(1)
A sliding buffer of candidate events is used andcontinuously updated as new events are enteringfrom the detector instances. For each enteringevent the collision (temporal overlapping of theevent section with events already in the buffer) isresolved according to the selected fusion strategy.The events are released from the buffer after atimeout as final result of the procedure.
3.2. Feature computation
The temporal structure of many complex activitiesis a key element for their pattern modelling andsubsequent machine recognition. For example,movements are frequently modelled with HMMsand time-continuous features to capture thiseffect.
In this work, we integrated the temporal struc-ture of the activity events in individual single-valuefeatures. The features were computed for prede-fined sections of an event. We spitted the event intwo or four slices. This solution provided an accep-table trade-off between temporal description andtotal number of features. The solution permits acombination of sliced features and features for theentire event. Moreover, this approach can simplifybothmodelling and event search, compared to time-continuous features. We used it with the recognitionapproach presented above. The similarity search isthen performed using the features to describe eachevent and search every section.
3.3. Evaluation procedure
3.3.1. Experimental conceptThe analysis of each sensing domain was based onexperimental data, individually acquired for eachdomain. Fig. 3 indicates the sensor attachment atthe body for all domains. For the recording of move-ments a commercial motion acquisition systembased on inertial sensors was used. Customisedsystems were utilised for the chewing (ear micro-phone) and swallowing (sensor collar) recordings.Table 1 provides a detailed description of the sen-sors used. In each study the activities were manuallyannotated by an observer. The study procedures arefurther detailed in the evaluation sections for eachsensing domain.
126 O. Amft, G. Troster
Figure 2 Schematic of the activity event search step.The segmentation is indicated by the dotted line. Thesearch is performed by computing feature sets from thesensor data (not shown) between lower and upper searchbounds. The search sections are evaluated by comparingtheir feature sets to a pre-trained pattern. (Please referto the text for more details).

Author's personal copy
3.3.2. Soft alignment procedureIn order to account an event as recognised, thedetection procedure must return a valid begin andend of an activity section and its identity (for multi-class detections). The section boundaries were com-pared to begin and end of the annotated events.However, the boundaries do not match exactly sincethe manual annotation was not accurate on thegranularity of each sample and the segmentationalgorithm can introduce a small alignment error inthe detection.
For the feasibility in the envisioned dietary mon-itoring application the exact alignment is not acritical aspect, if the event is associated to the trueactivity at all. Hence, we applied a soft alignmentmatching, following the concept of a boundaryjitter. Eq. (2) describes the accounting of correctevents.
Recognised
¼ true; if j � maxjABegin � EBeginjAEnd � ABegin
;jAEnd � EEndjAEnd � ABegin
� �
false; otherwise
8<:
(2)
The parameters ABegin and AEnd correspond to startand stop sample of the manual annotation and like-wise, EBegin andEEnd to the retrieved event. The jitterparameter j can be set, depending on the acceptablejitter for an application. The jitter j ¼ 0 correspondsto an exact matching of the boundaries and j ¼ 1would allow a jitter in size of the event duration.Moreover, this accounting procedure assures thatlarge events, covering more than the annotationsection, will be rejected as well, if their begin andend do not conform to Eq. (2). Multiple counts ofmatches and misses were especially avoided.
For the evaluation in this work a jitter of j ¼ 0:5was chosen. We believe that this is an adequateaccuracy for applications in dietary monitoring.
3.3.3. Performance measurementTo account for variations in the acquired data sets, afourfold cross-validation procedure was used to
Recognition of dietary activity events 127
Figure 3 Schematic sensor positioning at the body (seeTable 1 for a detailed description).
Table 1 List of sensors systems used in the dietary activity studies
Sensor type Sensor description Sensing domain
Inertial sensors Sensor modules containing acceleration sensors,gyroscopes (rate of turn) and compass sensors(magnetic field), each in three dimensions.The modules were attached to the user’s arms.Manufacturer: XSens, model: MTi
Movement activity
Ear microphone Electret miniature condenser microphone.The microphone was embedded into an earpad foam and worn at the ear canal.Manufacturer: Knowles Acoustics,model: TM-24546
Chewing activity
Stethoscope microphone Electret condenser microphone. The microphonewas attached with medical tape or worn in acollar below the hyoid. Manufacturer: Sony,model: ECM-C115
Swallowing activity
Electromyogram (EMG) Electromyogram electrodes and acquisitionsystem. Electrodes were directly attachedor worn in a collar at the infra-hyoid throatposition. Manufacturer: MindMedia,model: Nexus-10

Author's personal copy
determine training and testing set for the perfor-mance analysis. For training, three of four dataparts were used. Evaluation was performed on theleft-out data part. This procedure was repeateduntil all four parts were used for testing once.The partition boundaries were adapted to avoidintersecting the manually annotated event sections.The choice of four partitions reflects an empiricaltrade-off between processing effort, the need forenough training observations in all combinations ofthe partitions and the intended averaging effect forthe final results. An additional performance gaincould be achieved by higher iteration counts, poten-tially using more events for training.
To analyse the recognition performance, we usedthe metrics Precision and Recall, commonly used forinformation retrieval assessments. These metricsare derived as follows:
Recall ¼ Recognised events
Relevant events;
Precision ¼ Recognised events
Retrieved events
(3)
Relevant events corresponds to the manuallyannotated number of actually occurred eventinstances. Retrieved events represents the numberof events returned by the event recognition proce-dure. Finally, Recognised events refers to the cor-rectly returned number of events. Bothmetrics havea value range of [0,1]. A recall value of one indicatesa perfect accuracy of a method (all relevant eventsare recognised), while a precision value of oneindicates that the method does not return falsepositives (insertion errors).
4. Movement recognition
4.1. Study description
To evaluate our recognition approach for move-ments, a case series was recorded, utilising com-mercially available inertial sensors. Table 1 specifiesthe sensors used. The inertial sensors were attachedonto a jacket at the lower and upper arm as well asthe upper back. Fig. 3 illustrates the sensor posi-tions.
The movements of the arms and upper body wasrecorded with a sampling rate of 100 Hz from fourright-handed volunteers (1 female, 3 male, agedbetween 25 and 35 years). The participants wereseated in front of a table carrying the food items andtools. They were instructed to eat and drink as theywould normally do.
Intake sessions were recorded from each partici-pant on separate days. Four intake activities were
recorded for each session: (1) eating meat lasagnewith fork and knife (cutlery, CL), (2) fetching a glassand drinking from it (DK), (3) eating a soup with aspoon (SP), and (4) eating slices of bread with onehand only (HD). All meals were served at adequatetemperature for normal eating/drinking. Table 2summarises the acquired data which was inspectedand annotated.
In order to enrich diversity of the data set andavoid long periods without movements, the partici-pants were asked to conduct a set of other, non-relevant movements and gestures. Besides arbitrarymovements of the participants the following addi-tional arm gestures have been recorded and anno-tated to quantify the data set noise: scratching head(96 times), touching chin (92 times), reading andturning pages of newspaper (99 times), using tissue(89 times), glancing at the watch (92 times) andanswering a simulated mobile phone call (90 times),all total numbers of the data set.
4.2. Evaluation results
The event recognition procedure was adapted to themovement domain in the following way:
(1) A time constant of 0.5 s was used for segmenta-tion.
(2) For each of the four gesture categories an eventdetector instance was trained. Using the Eulerangles of the lower arms, features such asmean,variance and signal sum in four sliced sectionsand for the complete gesture were computed.By visually inspecting test recordings we foundthat the upper arm and the back sensors couldnot support the recognition without construct-ing a more complex body model. Hence, theywere excluded from the analysis.
(3) The event fusion using the competitive strategywas subsequently applied to the detectorinstance results and the event category withthe highest confidence was selected as finalresult. Due to variable lengths of gestures inour data set, the candidate buffer was config-ured to release events only after 30 s.
Fig. 4 shows precision-recall (PR) graphs for auser-specific evaluation of the movement event
128 O. Amft, G. Troster
Table 2 Movement study: statistics of acquired andannotated intake gestures
Number of participants 4Annotated gestures 1020Relevant event share (min) 97.44 (34.7%)Total length of data set (h) 4.68

Author's personal copy
fusion using the COMP method. The curves werecreated by evaluating the performance at variousconfidence thresholds for every class and for everyparticipant (A—D). Best performance is foundtowards the top-right corner (high precision, highrecall).
Both graphs indicate a good performance for themovement event recognition. The best result wasachieved for the category DK, while HD performedless. Since the latter gesture is very simple it wasoften confused with other movements towards thehead. In contrast, DK is more complex (fetching,drinking). The second graph shows that all partici-pants performed similarly well.
Table 3 summarises the results obtained from theevent detection and the event fusion. For the SPgestures, we observed that participants bend them-selves over the bowl, to avoid spilling and to mini-mise the movements. This affected the detectionperformance, since only lower arm features wereused in the evaluation.
Table 4 shows a confusion matrix of the eventrecognition, obtained by comparing the recognitionresults to the annotation for each sensor data sam-ple. Complementary to the soft alignment countingscheme used for the results in Table 3, this repre-
sentation shows the sample-accurate result. For allcategories and NULL a recognition rate of 75—82%was achieved. This rate was computed as class-relative accuracy (correctC/relevantC).
5. Chewing recognition
5.1. Study description
For the evaluation of chewing sounds we used an earmicrophone as indicated in Fig. 3. The miniaturemicrophone was build into a standard type ear padand kept at the ear canal by an ear hook, as it is usedfor mobile phone headsets. In a single case study thechewing sounds from different foods were recordedat 16 bit, 44 kHz from a male individual with naturaldentition (aged 29 years).
The participant was seated conveniently on achair close to a table carrying the foods. He couldstill hear normal-level conversation in the room andwas allowed to move and speak during the recordingsessions. The room was controlled for a constantnoise level of an office environment (the recordingin a sound studio was avoided). Recordings weremade in individual sessions on separate days. The
Recognition of dietary activity events 129
Figure 4 Movement study: user-specific PR analysis (confidence threshold sweep) of the event fusion results using theCOMPmethod. Best performance is found towards the top-right corner (high precision, high recall). (a) Analysis for everycategory (CL: cutlery, DK: drink, SP: spoon, HD: hand only). (b) Analysis for every study participant (A—D).
Table 3 Movement study: summary for the user-specific performance for the event detection and the fusion methodCOMP
Metric Event detection Event fusion (COMP)
CL DK SP HD CL DK SP HD Total
Relevant 276 245 266 233 276 245 266 233 1020Retrieved 347 247 284 717 278 221 263 518 1280Recognised 223 210 208 201 220 199 204 198 821Deletions 53 35 58 32 56 46 62 35 199Insertions 124 37 76 516 58 22 59 320 459
Recall 0.81 0.86 0.78 0.86 0.80 0.81 0.77 0.85 0.80Precision 0.64 0.85 0.73 0.28 0.79 0.90 0.78 0.38 0.64

Author's personal copy
participant took bites from the foods as he wished.All of the foods belonged to his normal diet. Thefood products included for the recognition analysiswere:
(1) Dry-crisp food: potato chips, approximately3 cm in diameter
(2) Wet-crisp foods: (1) mixed lettuce, containingendive, sugar loaf, frisee, raddichio, chicory,arugula, and (2) raw carrots.
(3) Soft foods: (1) cooked chicken meat and (2)pasta.
The foods evaluated in this work, contained manychewing cycles. Manual annotation of every chewingcycle was performed in a post-recording step byreviewing thewaveforms and listening to the sounds.This procedure is accurate in identifying every chew-ing cycle until the food bolus is swallowed, however,it makes the recordings very expensive.
The recordings included chewing sounds fromfurther food products (bread and chocolate), as wellas environmental conversation and speaking.Table 5 summarises the acquired data which wasinspected and annotated.
5.2. Evaluation results
The event recognition procedure was adapted to thechewing domain in the following way:
(1) A time constant of 125 ms was used for segmen-tation. This choice was made based on theaverage duration of a chewing sound (as anno-tated) of 350 ms or less, depending on the foodtype.
(2) Initially, for each of the three food categories afeature similarity instance was trained. Usingthe microphone data, spectral features such asband energy, auto-correlation and cepstralcoefficients in four sliced sections were com-puted. We observed during the evaluation, thatthe detector for soft foods worked poorly,resulting in many insertion errors. This beha-viour was attributed to the low signal to noiseratio. We omitted this model in the furtherevaluation to demonstrate the good perfor-mance of the dry and wet food detectors.
(3) The event fusion using the competitive strategywas subsequently applied to the detected chew-ing cycles and the category with the highestconfidence was selected as final result. We ana-lysed the COMP and LR methods for the fusion.
The low-amplitude chewing sounds from the softfoods (meat and pasta) created a special problemfor the detector. While a high recall was achieved,the detection was very sensitive to other sounds (asseen in the low precision in Table 6). COMP and LRfusion of the three detectors did not solve thisproblem, because the number of soft-food inser-tions was too high.
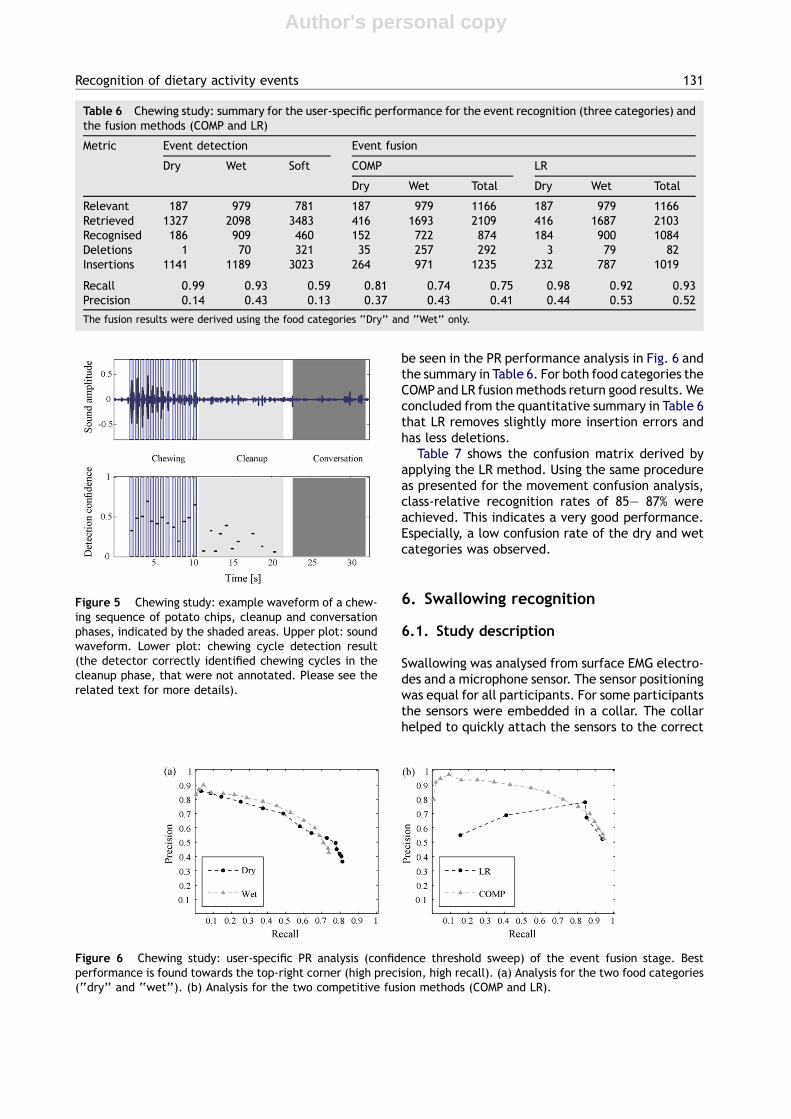
For every intake cycle all chews were annotateduntil the food bolus was swallowed and the normalmouth cleaning phase began. In this phase, chewswere hard to observe in the sound waveform. How-ever, the algorithm was still able to detect them.Fig. 5 visualises an example waveform including achewing sequence of potato chips, the cleanup anda conversation phase. For this food the chewingcycles can be seen very well in the sound waveform.The vertical bars indicate the annotation. In thelower plot, the detected chewing events are shownas horizontal bars. As the diagrams shows, addi-tional events were reported for the cleanup phase.We exemplarily verified that these chews werecorrectly retrieved.
Since the actually existing chews in the cleanupphase could not be automatically verified, theywere counted as insertion errors. The impact can
130 O. Amft, G. Troster
Table 4 Movement study: confusion matrix of the final user-specific evaluation result using COMP fusion (duration inseconds and ratios)
Predicted category
NULL CL DK SP HD
Actual categoryNULL 8869 (81%) 613 (6%) 233 (2%) 305 (3%) 982 (9%)CL 452 (17%) 2130 (82%) 0 (0%) 0 (0%) 8 (0%)DK 302 (20%) 1 (0%) 1182 (78%) 0 (0%) 34 (2%)SP 237 (22%) 19 (2%) 0 (0%) 807 (75%) 10 (1%)HD 103 (16%) 20 (3%) 0 (0%) 0 (0%) 541 (81%)
Table 5 Chewing study: statistics of acquired andannotated chewing sounds
Number of participants 1Annotated chewing cycles 1947Relevant event share (min) 10.50 (21.7%)Total length of data set (h) 0.81
Author's personal copy
be seen in the PR performance analysis in Fig. 6 andthe summary in Table 6. For both food categories theCOMPand LR fusion methods return good results. Weconcluded from the quantitative summary in Table 6that LR removes slightly more insertion errors andhas less deletions.
Table 7 shows the confusion matrix derived byapplying the LR method. Using the same procedureas presented for the movement confusion analysis,class-relative recognition rates of 85— 87% wereachieved. This indicates a very good performance.Especially, a low confusion rate of the dry and wetcategories was observed.
6. Swallowing recognition
6.1. Study description
Swallowing was analysed from surface EMG electro-des and a microphone sensor. The sensor positioningwas equal for all participants. For some participantsthe sensors were embedded in a collar. The collarhelped to quickly attach the sensors to the correct
Recognition of dietary activity events 131
Table 6 Chewing study: summary for the user-specific performance for the event recognition (three categories) andthe fusion methods (COMP and LR)
Metric Event detection Event fusion
Dry Wet Soft COMP LR
Dry Wet Total Dry Wet Total
Relevant 187 979 781 187 979 1166 187 979 1166Retrieved 1327 2098 3483 416 1693 2109 416 1687 2103Recognised 186 909 460 152 722 874 184 900 1084Deletions 1 70 321 35 257 292 3 79 82Insertions 1141 1189 3023 264 971 1235 232 787 1019
Recall 0.99 0.93 0.59 0.81 0.74 0.75 0.98 0.92 0.93Precision 0.14 0.43 0.13 0.37 0.43 0.41 0.44 0.53 0.52
The fusion results were derived using the food categories ‘‘Dry’’ and ‘‘Wet’’ only.
Figure 5 Chewing study: example waveform of a chew-ing sequence of potato chips, cleanup and conversationphases, indicated by the shaded areas. Upper plot: soundwaveform. Lower plot: chewing cycle detection result(the detector correctly identified chewing cycles in thecleanup phase, that were not annotated. Please see therelated text for more details).
Figure 6 Chewing study: user-specific PR analysis (confidence threshold sweep) of the event fusion stage. Bestperformance is found towards the top-right corner (high precision, high recall). (a) Analysis for the two food categories(‘‘dry’’ and ‘‘wet’’). (b) Analysis for the two competitive fusion methods (COMP and LR).
Author's personal copy
throat region. The location of the EMG was con-stantly verified, however, the collar supported thestable positioning at the infra-hyoid position verywell. The microphone was situated at the lower partof the throat, below the larynx. EMG was recordedat 24 bit, 2 kHz and bandpass filtered. Sound datawas recorded at 16 bit, 22 kHz. Fig. 3 and Table 1summarise positioning and setup of the sensors andthe collar.
Six volunteers (4 male, 2 female, aged 20—30years) without known swallowing abnormalitieswere instructed to eat and drink different fooditems: 5 and 15 ml of water, spoonfuls of yoghurtand pieces of bread (approximately 2 cm3). Theindividuals were seated conveniently on a chair infront of a table carrying the foods. They wereallowed to move, chew and speak normally duringthe recording sessions. The room was controlled fora normal and constant noise level of an office envir-onment. To account for physiologic variations, twointake sessions were recorded on different days. Theparticipants were asked to swallow the food items inone piece after chewing and manipulating the bolusas usual. None of the participants expressed a dislikefor any of the included foods nor problems to swal-low the selected bolus sizes. Table 8 summarises theacquired data that was inspected and annotated.
6.2. Evaluation results
The event recognition procedure was adapted to thechewing domain in the following way:
(1) A time constant of 250 ms was used for segmen-tation.
(2) Feature similarity instances were trained usingthe EMG and microphone data individually. The
foods were initially grouped regarding theirexpected bolus size into small (5 ml water,spoonfuls of yoghurt and pieces of bread) andlarge (15 ml water). This approach was dropped,since no clear discrimination of the two cate-gories was found. In the following, we targetedthe detection without further classification. Weconcluded from early tests that the EMG isdisturbed by different muscle activations, inde-pendent from swallowing. The investigatedhyoid muscle is covered by several layers ofother muscle tissue. We concentrated on a sim-ple activity detection using time domain fea-tures such as sum, maximum and peaks of thesignal. For the sound data, spectral featuressuch as band energy, auto-correlation coeffi-cients and signal energy were used. An initialtest of sliced features did not lead to animprovement in recognition.
(3) The event fusion using a supportive strategy wassubsequently applied to the detected swallow-ing events from EMG and sound data. We ana-lysed the performance of AGREE and LRmethods.
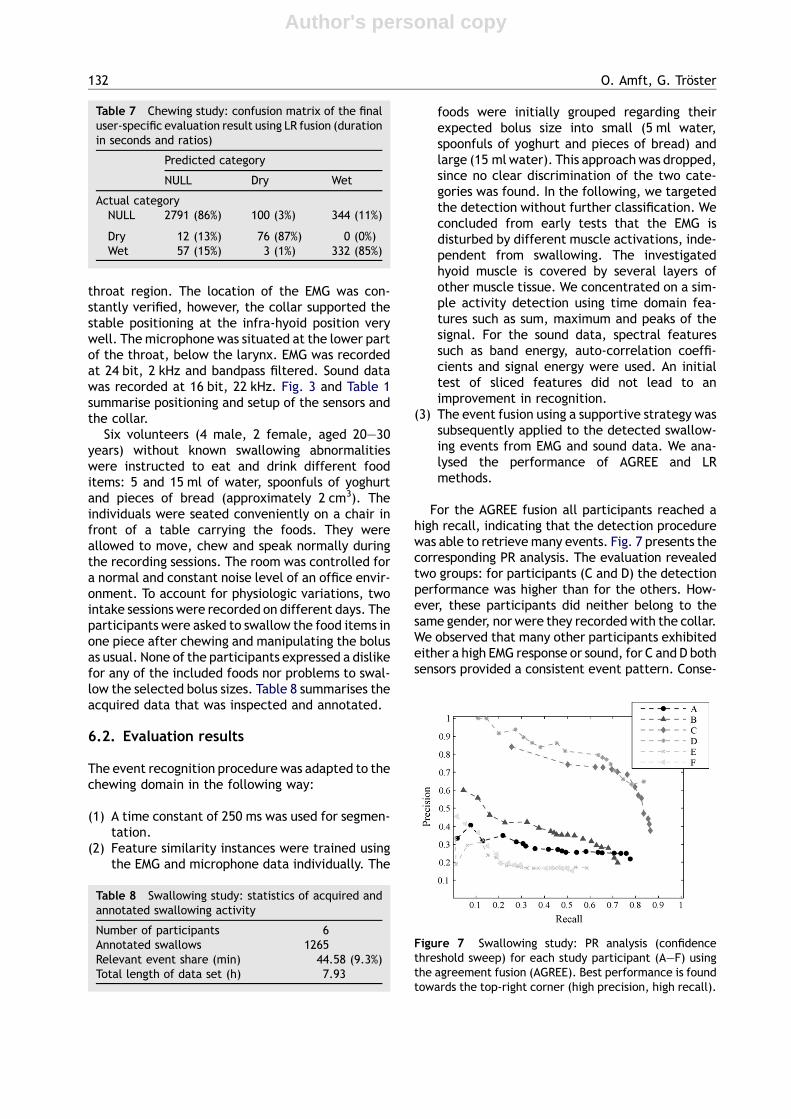
For the AGREE fusion all participants reached ahigh recall, indicating that the detection procedurewas able to retrievemany events. Fig. 7 presents thecorresponding PR analysis. The evaluation revealedtwo groups: for participants (C and D) the detectionperformance was higher than for the others. How-ever, these participants did neither belong to thesame gender, nor were they recorded with the collar.We observed that many other participants exhibitedeither a high EMG response or sound, for C and D bothsensors provided a consistent event pattern. Conse-
132 O. Amft, G. Troster
Table 7 Chewing study: confusion matrix of the finaluser-specific evaluation result using LR fusion (durationin seconds and ratios)
Predicted category
NULL Dry Wet
Actual categoryNULL 2791 (86%) 100 (3%) 344 (11%)
Dry 12 (13%) 76 (87%) 0 (0%)Wet 57 (15%) 3 (1%) 332 (85%)
Table 8 Swallowing study: statistics of acquired andannotated swallowing activity
Number of participants 6Annotated swallows 1265Relevant event share (min) 44.58 (9.3%)Total length of data set (h) 7.93
Figure 7 Swallowing study: PR analysis (confidencethreshold sweep) for each study participant (A—F) usingthe agreement fusion (AGREE). Best performance is foundtowards the top-right corner (high precision, high recall).
Author's personal copy
quently, both EMG and sound-based detection moreoften returned a correct result for them,whereas forthe remaining participants no reduction of the inser-tion errorswas achieved. Further investigation of thisissue is required.
On average for all participants, the AGREE fusionmethod improved the precision. LR did not improvethe individual spotting results. Table 9 summarisesthe results obtained from the event detectioninstances and the fusion methods.
The sample-accurate detection result was deter-mined from the AGREE fusion result. The swallowingrecognition rate was 64%, for the NULL class 75%were obtained. This indicates that the detectionprovides a sensible result.
7. Discussion
7.1. Methodology
The continuous recognition of dietary activityevents from sensor data patterns was evaluated inthis work. Spotting activity events in continuoussensor data is a vital prerequisite for the deploy-ment of activity detection in general. While thetargeted activities can be described by a domainexpert, the embedding data (NULL class) cannot bemodelled due to the degrees of freedom in thehuman activities and the cost for large training datasets. Consequently, assumptions about the embed-ding should be minimised to achieve an acceptableperformance generalisation. We believe that thecurrent work is a step towards resolving this chal-lenge, although the presented method is not com-pletely free from assumptions. The most criticalaspects in this respect include the selection offeatures and event detection thresholds.
A combination of individual single-value featuresfor activity event slices were used for the detection.
With this approach the temporal structure of theactivities was transformed into a spatial represen-tation. This is a useful concept to model activitiesfor the continuous search. In an earlier work, weapplied this principle to the recognition of gaminggestures only [40]. For each domain, features wereselected from visual inspection of the sensor wave-forms and from previous experience.We expect thatthe recognition performance could be improved by athorough feature search and selection strategy. Thiswill also help to identify sensors that can be omittedor adjusted in its placement.
We introduced the scheme of competitive andsupportive event fusion to construct a selectiverefinement step for spotted events. By design ofthe recognition system, the choice of the fusionstrategy is made. The supportive strategy wasapplied for spottings from independent sensors,describing the same event type. Using competitivefusion, we selected the most appropriate eventfrom different event type spottings. Both strategiescould be combined to more complex selectionschemes. In related works, they have been usedto combine classifier outputs mostly [19].
An advantage of our method is its ability to workon single event detection classes with individualfeature sets. For the detection of one event type,typically a supportive fusion strategy can still beused, by deploying different sensors. An applicationfor detecting single event types in dietary monitor-ing was shown in the swallowing evaluation. Furtherapplications are the detection of drinking gesturesto assess fluid consumption or using a single foodmodel to assess one category of foods in dietaryintake.
In order to describe the complexity of the eventdetection as a search problem, we listed the embed-ding size of the data sets. This size was expressed asratio of total annotated event duration over thetotal length of the data set. For the data sets inthis work, the ratio was 34.7% for the movement,21.7% for chewing and 9.3% for the swallowing study.The ratio indicates the severity of the search: thesmaller the ratio, the more difficult it is to achieve agood recognition results due to the large and poten-tially diverse embedding data. However, we believethat the high embedding size in the swallowing studyis not the unique reason for its weak precision.Section 7.4 discusses the swallowing study in detail.
We introduced a soft alignment measure toaccount for the variability in alignment betweenannotation and event detection. A boundary jitternormalised by the annotated length of the event wasdefined as threshold, below which the event iscounted as recognised. The larger the jitter, themore mismatch in alignment is allowed and an event
Recognition of dietary activity events 133
Table 9 Swallowing study: summary for the user-specific performance for the event detection usingmuscle activity (EMG), audio (SND), and the fusionmethods (LR and AGREE)
Metric Event detection Event fusion
EMG SND LR AGREEEMG+SND EMG+SND
Relevant 1265 1265 1265 1265Retrieved 6046 8093 8085 4345Recognised 955 834 824 861Deletions 310 431 441 404Insertions 5091 7259 7261 3484
Recall 0.75 0.66 0.65 0.68Precision 0.16 0.10 0.10 0.20

Author's personal copy
reporting that may otherwise be accounted as inser-tion/deletion will be accepted as correct. In itsextreme, the counting of correct events could bemade by simply checking if an overlap with theannotation exist at all. For the targeted applicationsin dietary monitoring an exact match is less criticalas long as the activity is captured at all. Therefore,we selected a jitter value that is neither too opti-mistic (by permitting large alignment errors) norpessimistic (being overly strict in the boundarymatch). The comparison with sample-accurate con-fusion matrices confirms that the soft alignment is asensible solution for event spotting performanceanalyses. For a more detailed analysis of detectionerrors, the error distribution diagrams [41] could beused.
7.2. Movement recognition
Different gesture types were defined, that occurfrequently in European and American diets, to eval-uate the recognition of food intake movements. Theresults indicate that all types could be recognisedfrom lower arm motion, most of them with goodaccuracy. To improve the recognition of certaingestures, information from inertial sensors at thesubject’s back could be added. The proposed eventfusion method is a valuable addition to the featuresimilarity search for movement detection. In arelated work of the authors, a two-stage approachbased on a similarity search and HMMs was used [21].While the HMMs proved valuable for refining thedetection result in the second stage, they add ahigh complexity in both, initial design and para-meter estimation. In comparison, the performanceachieved with the event fusion approach in thecurrent work could match the recall, but performsapproximately 10% lower in precision than the HMMson the same data set. Further refinement of fea-tures and segmentation could close this gap. More-over, we presented a rigorous evaluation frameworkusing cross-validation in this work, that was notpreviously available.
7.3. Chewing recognition
For the recognition of chewing sounds, novelachievements on a chew-accurate detection werepresented. Using the recognition procedure, indivi-dual chewing cycles were identified in two foodcategories with good performance. This result wasachieved by considering the chew as a non-station-ary event and grouping the foods with similar tex-tures. In comparison to our earlier investigation[29], the current recognition rates are approxi-mately 15% higher and a majority vote over multiple
chewing cycles could be avoided. However, for low-amplitude chewing sounds, found in soft foods suchas cooked pasta or meat, a low detection perfor-mance persists with the current approach. Thiseffect was attributed to the low signal to noise ratioof these sounds. Moreover, the chewing sequence isnot consistent over the entire intake cycle asassumed in the current approach [42]. This isobserved as a variability in the detection confi-dences and hinders fusion methods such as LR toachieve a higher performance. Consequently, foodmodels should include the sequence informationmore carefully.
7.4. Swallowing recognition
The automatic detection of swallowing using EMGand sound information was evaluated. We foundthat swallows can be retrieved from continuous dataat high recall rates using both sensing sources. Byobserving the final detection, we found that themethod is disturbed by neck movements and cough-ing. In comparison to our previous work [38], wepresented results from additional fusion methods(AGREE, LR) and an extended study. The AGREEfusion was able to remove a large share of insertionerrors. The current results confirm the previousfindings: while the detection works to some extendin controlled environments, it retrieved many falsepositives in our evaluation. These errors could notbe completely removed by the currently appliedfusion techniques.
The collar worked well to standardise and main-tain the sensor positioning. No differences in thespotting results were observed for the collar-basedswallowing data. For a subgroup of two participantsan improved performance was achieved. The differ-ence could not be explained by the available infor-mation. A larger study with more participants couldreveal, whether the subgroups persist. Furtherinvestigations are required to analyse options forfood bolus categorisation and to increase the algo-rithm precision.
8. Conclusion
We presented novel approaches to monitor dietaryactivities from body-worn sensors. Three sensingdomains were analysed, that are directly linkedto the sequence of dietary activities: intake move-ments, chewing, and swallowing. We presentedevaluation results from studies in each domain usingan event recognition procedure, that supports thedetection and identification of specific activities incontinuous sensor data.
134 O. Amft, G. Troster

Author's personal copy
The recognition of natural movements, such asfor dietary intake, is a challenging task, since it isstrongly related to personal habits. The detectionprocedure in combination with the simple compar-ison fusion yielded good recognition results for dif-ferent intake types. This is a valuable result for theintended application, since the intake movementshelp to categorise the consumed foods. Moreover,the movement recognition could be used indepen-dently. For example, the detection of drinkingmovements can be used to monitor fluid consump-tion and avoid dehydration.
Chewing is a very important part in the intakeprocess. In this work a successful continuous recog-nition of two food types was achieved. This is a vitalresult for a detailed analysis of food chewing. Basedon the presented approach, additional models canbe derived that reflect the mechanical properties offoods. Besides the identification of consumed foods,the chewing recognition permits the assessment ofdietary parameters, such as chews per food andchewing speed. Both parameters can be used asindications for too fast, or stress eating.
Swallowing concludes the intake cycle. The swal-lowing frequency depends on the food category,where foods containing fluid compartments requireelevated swallowing rates. The current detectionmethod, using sound and muscle activity at thethroat, still incurs many insertion errors. However,it does provides an indication for swallowing events.We plan to use this information in combination withthe previous sensing domains. Further works willaddress different fusion strategies and additionalsensors.
The three domains provide a comprehensive pic-ture of dietary activities and a broad amount ofinformation, that is vital for a long-term dietarycoaching and health management. This includes thefood type as well as intake timing and the overallmeal schedule.
We have shown in this work, how our recognitionprocedure to spot sporadic activity events can beslightly adapted to fulfil the requirements of verydifferent sensor modalities and activities. Webelieve that the procedure is a helpful tool forautomatic dietary monitoring and similar applica-tions in continuous activity recognition.
Acknowledgements
The authors express their gratitude to all volunteerswho participated in the studies related to this pub-lication and to all reviewers for their very helpfulcomments. This work was supported by the SwissState Secretariat for Education and Research (SER).
References
[1] WHO, Global strategy on diet, physical activity and health(WHA57.17), in: Fiftyseventh World Health Assembly, WorldHealth Organization; 2004.
[2] Sjoberg A, Hallberg L, Hoglund D, Hulthen L. Meal pattern,food choice, nutrient intake and lifestyle factors in theGoteborg Adolescence Study. Eur J Clin Nutr 2003;57(12):1569—78.
[3] Rolls BJ, Drewnowski A, Ledikwe JH. Changing the energydensity of the diet as a strategy for weight management. JAm Diet Assoc 2005;105(5 Suppl. 1):S98—103.
[4] MyFoodPhone, World’s first camera-phone & web-based-video nutrition service. Internet: accessed on August 2007(Feb 2005).
[5] Beidler J, Insogna A, Cappobianco N, Bi Y, Borja M. The PNAproject. J Comput Sci Colleges 2001;16(4):276—84.
[6] Mankoff J, Hsieh G, Hung HC, Lee S, Nitao E. Using low-costsensing to support nutritional awareness. In: Goos G, Hart-manis J, van Leeuwen J, editors. Ubicomp 2002: Proceedingsof the 4th International Conference on Ubiquitous Comput-ing, vol. 2498 of Lecture Notes in Computer Science,Springer Berlin, Heidelberg; 2002. p. 371—6.
[7] Siek KA, Connelly KH, Rogers Y, Rohwer P, Lambert D, WelchJL. When do we eat? an evaluation of food items input intoan electronic foodmonitoring application. In: Aarts E, KohnoR, Lukowicz P, Trainini JC, editors, PHC 2006: Proceedings ofthe 1st International Conference on Pervasive ComputingTechnologies for Healthcare, ICST, IEEE digital library; 2006.p. 1—10.
[8] Stone AA, Shiffman S, Schwartz JE, Broderick JE, HuffordMR. Patient non-compliance with paper diaries. Brit Med J2002;324(7347):1193—4.
[9] Westerterp-Plantenga MS. Eating behavior in humans, char-acterized by cumulative food intake curves–—a review. Neu-rosci Biobehav Rev 2000;24(2):239—48.
[10] Kissileff HR, Klingsberg G, Itallie TBV. Universal eatingmonitor for continuous recording of solid or liquid consump-tion in man. Am J Physiol 1980;238(1):R14—22.
[11] Stellar E, Shrager EE. Chews and swallows and the micro-structure of eating. Am J Clin Nutr 1985;42(5 Suppl):973—82.
[12] Chang K-H, Liu S-Y, Chu H-H, Hsu JY, Chen C, Lin T-Y, et al.The diet-aware dining table: observing dietary behaviorsover a tabletop surface. In: Fishkin K, Schiele B, Nixon P,Quigley A, editors. PERVASIVE 2006: Proceedings of the 4thInternational Conference on Pervasive Computing, vol. 3968of Lecture Notes in Computer Science, Springer Berlin,Heidelberg; 2006. p. 366—82.
[13] Schmidt A, Strohbach M, van Laerhoven K, Friday A, Gel-lersen H-W, Context acquisition based on load sensing. In:Goos G, Hartmanis J, van Leeuwen J, editors. Ubicomp 2002:Proceedings of the 4th international conference on Ubiqui-tous Computing, vol. 2498 of Lecture Notes in ComputerScience, Springer Berlin, Heidelberg; 2002. p. 333—50.
[14] Beigl M, Gellersen H-W, Schmidt A. MediaCups: experiencewith design and use of computer-augmented everyday arte-facts. Comp Network 2001;35(4):401—9 (special issue onpervasive computing).
[15] Patterson D, Fox D, Kautz H, Philipose M, Fine-grainedactivity recognition by aggregating abstract object usage.In: Rhodes B, Mase K, editors. ISWC 2005: Proceedings of theNinth IEEE International Symposium on Wearable Compu-ters, IEEE Press; 2005. p. 44—51.
[16] Chambers S, Venkatesh S, West G, Bui H. Hierarchicalrecognition of intentional human gestures for sports video
Recognition of dietary activity events 135
Author's personal copy
annotation. In: Kasturi R, Laurendeau D, Suen C, editors.Proceedings of the 16th International Conference on PatternRecognition, vol. 2, IEEE Press; 2002. p. 1082—5.
[17] Ogris G, Stiefmeier T, Junker H, Lukowicz P, Troster G. Usingultrasonic hand tracking to augment motion analysis basedrecognition of manipulative gestures. In: Rhodes B, Mase K.editors. ISWC 2005: Proceedings of the Ninth IEEE Interna-tional Symposium on Wearable Computers, IEEE Press; 2005.p. 152—9.
[18] Lee H-K, Kim JH. An HMM-based threshold model approachfor gesture recognition. IEEE Trans Pattern Anal MachineIntel 1999;21(10):961—73.
[19] Ward J, Lukowicz P, Troster G, Starner T. Activity recognitionof assembly tasks using body-worn microphones andaccelerometers. IEEE Trans Pattern Anal Machine Intel2006;28(10):1553—67.
[20] Lee C, Yangsheng X. Online, interactive learning of gesturesfor human/robot interfaces. In: Caplan N, Lee CG, editors.ICRA 1996: Proceedings of the IEEE International Conferenceon Robotics and Automation, vol. 4 of IEEE Robotics andAutomation Society, IEEE Press; 1996. p. 2982—7.
[21] Amft O, Junker H, Troster G. Detection of eating and drink-ing arm gestures using inertial body-worn sensors. In: RhodesB, Mase K. editors. ISWC 2005: IEEE Proceedings of the NinthInternational Symposium on Wearable Computers, IEEEPress; 2005. p. 160—3.
[22] Vickers ZM. The relationships of pitch, loudness and eatingtechnique to judgments of the crispness and crunchiness offood sounds. J Text Stud 1985;16(1):85—95.
[23] Dacremont C, Colas B, Sauvageot F. Contribution of air- andbone-conduction to the creation of sounds perceived duringsensory evaluation of foods. J Text Stud 1991;22(4):443—56.
[24] AlChakra W, Allaf K, Jemai A. Characterization of brittlefood products: Application of the acoustical emissionmethod. J Text Stud 1996;27(3):327—48.
[25] Edmister J, Vickers Z. Instrumental acoustical measures ofcrispness in foods. J Text Stud 1985;16(2):153—67.
[26] Drake B. Food crushing sounds. an introductory study. J FoodSci 1963;28(2):233—41.
[27] DeBelie N, De Smedt V. Principal component analysis ofchewing sounds to detect differences in apple crispness. JPostharvest Biol Technol 2000;18:109—19.
[28] DeBelie N, Sivertsvik M, DeBaerdemaeker J. Differences inchewing sounds of dry-crisp snacks by multivariate dataanalysis. J Sound Vibrat 2003;266(3):625—43.
[29] Amft O, Stager M, Lukowicz P, Troster G. Analysis of chewingsounds for dietarymonitoring. In: Beigl M, Intille S, RekimotoJ, Tokuda H. editors. UbiComp 2005: Proceedings of the 7thInternational Conference on Ubiquitous Computing., vol.3660 of Lecture Notes in Computer Science, Springer Berlin,Heidelberg; 2005. p. 56—72.
[30] Ertekin C, Aydogdu I. Neurophysiology of swallowing. ClinNeurophysiol 2003;114(12):2226—44.
[31] Denk DM, Swoboda H, Steiner E. Physiology of the larynx. DerRadiol 1998;38(2):63—70. in German.
[32] Gupta V, Reddy NP, Canilang EP. Surface EMG measurementsat the throat during dry and wet swallowing. Dysphagia1996;11(3):173—9.
[33] Logan WJ, Kavanagh JF, Wornall AW. Sonic correlates ofhuman deglutition. J Appl Physiol 1967;23(2):279—84.
[34] Cichero JAY, Murdoch BE. Detection of swallowing sounds:methodology revisited. Dysphagia 2002;17(1):40—9.
[35] Danbolt C, Hult P, Grahn LT, Ask P. Validation and character-ization of the computerized laryngeal analyzer (CLA) tech-nique. Dysphagia 1999;14(4):191—5.
[36] Limdi A, McCutcheon M, Taub E, Whitehead W, Cook I, EW,Design of a microcontroller-based device for deglutitiondetection and biofeedback. In: EMBS 1989: Proceedings ofthe Annual International Conference of the IEEE Engineeringin Engineering in Medicine and Biology Society, vol. 5, IEEEPress; 1989. p. 1393—4.
[37] Sukthankar SM, Reddy NP, Canilang EP, Stephenson L, Tho-mas R. Design and development of portable biofeedbacksystems for use in oral dysphagia rehabilitation. Med EngPhys 1994;16(5):430—5.
[38] Amft O, Troster G. Methods for detection and classificationof normal swallowing from muscle activation and sound. In:Aarts E, Kohno R, Lukowicz P, Trainini JC. editors. PHC 2006:Proceedings of the First International Conference on Perva-sive Computing Technologies for Healthcare, ICST, IEEEdigital library; 2006. p. 1—10.
[39] Ho TK, Hull J, Srihari S. Decision combination in multipleclassifier systems. IEEE Trans Pattern Anal Machine Intel1994;16(1):66—75.
[40] Bannach D, Amft O, Kunze KS, Heinz EA, Troster G, LukowiczP. Waving real hand gestures recorded by wearable motionsensors to a virtual car and driver in a mixed-reality parkinggame. In: Blair A, Cho S-B, Lucas SM. editors. CIG 2007:Proceedings of the 2nd IEEE Symposium on ComputationalIntelligence and Games, IEEE Press; 2007. p. 32—9.
[41] Ward JA, Lukowicz P, Troster G. Evaluating performance incontinuous context recognition using event-driven errorcharacterisation. In: Hazas M, Krumm J, Strang T. (Eds.),LoCA 2006: Proceedings of the Second International Work-shop on Location- and Context-Awareness, vol. 3987 ofLecture Notes in Computer Science, Springer, Berlin/Heidel-berg; 2006. p. 239—55.
[42] Amft O, Kusserow M, Troster G. Automatic identification oftemporal sequences in chewing sounds. In: Hu T, Mandoiu I,Obradovic Z. editors. BIBM2007: Proceedings of the IEEEInternational Conference on Bioinformatics and Biomedi-cine, IEEE Press, San Jose, CA, USA; 2007. p. 194—201.
136 O. Amft, G. Troster