Author's personal copyBagasse is a byproduct from sugar-cane processing. The compo-sition of bagasse...
8
This article appeared in a journal published by Elsevier. The attached copy is furnished to the author for internal non-commercial research and education use, including for instruction at the authors institution and sharing with colleagues. Other uses, including reproduction and distribution, or selling or licensing copies, or posting to personal, institutional or third party websites are prohibited. In most cases authors are permitted to post their version of the article (e.g. in Word or Tex form) to their personal website or institutional repository. Authors requiring further information regarding Elsevier’s archiving and manuscript policies are encouraged to visit: http://www.elsevier.com/copyright
Transcript of Author's personal copyBagasse is a byproduct from sugar-cane processing. The compo-sition of bagasse...
This article appeared in a journal published by Elsevier. The attachedcopy is furnished to the author for internal non-commercial researchand education use, including for instruction at the authors institution
and sharing with colleagues.
Other uses, including reproduction and distribution, or selling orlicensing copies, or posting to personal, institutional or third party
websites are prohibited.
In most cases authors are permitted to post their version of thearticle (e.g. in Word or Tex form) to their personal website orinstitutional repository. Authors requiring further information
regarding Elsevier’s archiving and manuscript policies areencouraged to visit:
http://www.elsevier.com/copyright
Author's personal copy
Creep behavior of bagasse fiber reinforced polymer composites
Yanjun Xu, Qinglin Wu *, Yong Lei, Fei YaoSchool of Renewable Natural Resources, Louisiana State University Agricultural Center, Baton Rouge, LA 70803, USA
a r t i c l e i n f o
Article history:Received 5 December 2008Received in revised form 16 December 2009Accepted 16 December 2009Available online 12 January 2010
Keywords:BagassePlastics, CompositeCreepModelingTime–temperature superposition
a b s t r a c t
The creep behavior of bagasse-based composites with virgin and recycled polyvinyl chloride (B/PVC) andhigh density polyethylene (B/HDPE) as well as a commercial wood and HDPE composite decking materialwas investigated. The instantaneous deformation and creep rate of all composites at the same loadinglevel increased at higher temperatures. At a constant load level, B/PVC composites had better creep resis-tance than B/HDPE systems at low temperatures. However, B/PVC composites showed greater tempera-ture-dependence. Several creep models (i.e., Burgers model, Findley’s power law model, and a simplertwo-parameter power law model) were used to fit the measured creep data. Time–temperature superpo-sition (TTS) was attempted for long-term creep prediction. The four-element Burgers model and the two-parameter power law model fitted creep curves of the composites well. The TTS principle more accuratelypredicted the creep response of the PVC composites compared to the HDPE composites.
� 2009 Elsevier Ltd. All rights reserved.
1. Introduction
Natural fiber/polymer composites (NFPCs) have been experi-encing dramatic growth because of their low cost, good mechanicalproperties, natural appearance, water resistance, and biodegrad-ability. NFPCs can be made from recycled plastics and bio-basedbyproducts, reducing the use of non-biodegradable plastics andefficiently using natural resources in applications such as decking,railing, and automobile components.
Bagasse is a byproduct from sugar-cane processing. The compo-sition of bagasse is approximately 50% cellulose, 25% hemicellu-lose, and 25% lignin (Pandey et al., 2000). In comparison to otheragricultural residues, bagasse is regarded as a rich natural resourcedue to its high yield and annual regeneration capacity (Pandeyet al., 2000). With increased wood costs and competition of woodresources from traditional wood sectors, developing alternative,environmentally friendly natural fiber sources for plastic compos-ites is greatly needed (Kiguchi, 2007). Currently the main use ofbagasse is for energy in the sugar-cane industry through burning,but their caloric value is relatively low compared to other fuelresources (Vazquez et al., 1999). Thus, utilization of bagasse mate-rials in NFPCs can more efficiently use this bioresource.
Using NFPCs in structural building products often requiresimproved mechanical properties, especially creep behavior.Previous study in the field shows that creep of NFPCs varies withfiller type and content, coupling treatment, and plastics matrixtypes (Sain et al., 2000; Acha et al., 2007). Various modeling tech-
niques have also been applied to analyze observed creep behav-ior of the NFPCs (Acha et al., 2007; Bledzki and Faruk, 2004;Marcovich and Villar, 2003; Park and Balatinecz, 1998). However,very limited creep study has been done in relation to bagassecomposites with different plastic matrices. Further evaluationand prediction of creep behavior of the bagasse-based compositesystems are thus of practical importance. The objectives of thisstudy were: (1) to characterize the creep properties of bagasse/plastics composites made with different plastics (i.e., virgin andrecycled polyvinyl chloride, PVC and high density polyethylene,HDPE), (2) to model the measured creep data of various compos-ite systems, and (3) to predict long-term creep behavior of thecomposites through the time–temperature superposition (TTS)principle.
2. Theoretical background
Among physical models for creep of NFPCs, the four-elementBurgers model has been often used (Acha et al., 2007; Nunezet al., 2004; Marcovich and Villar, 2003). By connecting a Maxwellunit and a Kelvin unit in series, the Burgers model divides the creepstrain of a polymer material into three parts: (1) the instantaneousdeformation (Maxwell spring), (2) viscoelastic deformation (Kelvinunit), and (3) the viscous deformation (Maxwell dash-pot). Thesecan be represented by:
eðtÞ ¼ rE1þ r
E21� exp �t
E2
g2
� �� �þ r
g1t ð1Þ
where e(t) is the creep strain, r is the stress, t is time, E1 and E2 arethe elastic moduli of the Maxwell and the Kelvin springs, and g1 and
0960-8524/$ - see front matter � 2009 Elsevier Ltd. All rights reserved.doi:10.1016/j.biortech.2009.12.072
* Corresponding author. Tel.: +1 225 578 4358; fax: +1 225 578 4251.E-mail address: [email protected] (Q. Wu).
Bioresource Technology 101 (2010) 3280–3286
Contents lists available at ScienceDirect
Bioresource Technology
journal homepage: www.elsevier .com/locate /bior tech

Author's personal copy
g2 are viscosities of the Maxwell and the Kelvin dashpots. g2/E2 isusually denoted as s, the retardation time required to generate63.2% deformation in the Kelvin unit (Yang et al., 2006).
In Eq. (1), the first term is the instantaneous creep strain, whichcan result from changes in bond lengths and angles, for instance.The second term is the early stage creep strain and is due to mech-anisms such as molecular chain relaxations and extensions. Thelast term is the long-term creep strain and is due to viscous slip-page of molecular chains, for instance. The parameters E1, E2, g1
and g2 can be obtained by fitting the equation to the experimentaldata and can be used to describe the creep behavior. Based on theBurgers model, the creep rate of viscoelastic material can be ob-tained by taking the derivative of Eq. (1):
deðtÞdt¼ r
g2exp �t
E2
g2
� �þ r
g1ð2Þ
Besides the Burgers model, several empirical mathematicalmodels have been used to simulate the creep curves of polymermaterial. For example, the Findley power law model has been usedto predict the creep behavior of reinforced wood–plastic deckboards (Jiang et al., 2007). It has the form:
eðtÞ ¼ atb þ e0 ð3Þ
where e0 is the instantaneous strain, a and b are material constants.A simpler, two-parameter power law model shown to be useful forthe creep modeling of kenaf fiber/HDPE composites (Tajvidi et al.,2005) is:
eðtÞ ¼ atb ð4Þ
Though an important property for polymer materials, it is oftenimpractical to determine experimentally their long-term creepbehavior because of the extremely long time required. Thus, pre-
dicting the creep behavior of polymers using short-term testinghas gained considerable attention. One of the most commonextrapolation techniques is time–temperature superposition(TTS). It can be used to predict long-term creep behavior of certainpolymers by shifting the curves from tests at different tempera-tures horizontally along a logarithmic time axis to generate a singlecurve known as the master curve (Ward, 1971). Thus, a long-termexperiment can be replaced by shorter tests at higher tempera-tures. The shifting distance is called shift factor. The materials forwhich TTS holds are called thermorheologically simple materialsand the rest are called thermorheologically complex materials(Tajvidi et al., 2005). The shift factors of a thermorheologicallysimple material can be related to temperature using eitherWilliams–Landel–Ferry (WLF) or Arrhenius equations. The WLFequation is:
log aT ¼�C1ðT � T0ÞC2 þ ðT � T0Þ
ð5Þ
where aT is the horizontal (or time) shift factor, C1 and C2 are con-stants, T0 is the reference temperature (K) and T is the test temper-ature (K). The Arrhenius equation is given by:
log aT ¼Ea
R1T� 1
T0
� �ð6Þ
Fig. 1. Stress–strain curves of the composites at (a) 35 �C and (b) 65 �C.Fig. 2. Creep curves of the composites at (a) 35 �C and (b) 65 �C. Symbols representexperimental data and solid lines represent Burgers model fit.
Y. Xu et al. / Bioresource Technology 101 (2010) 3280–3286 3281

Author's personal copy
where Ea is the activation energy, R is the universal gas constant, T0
is the reference temperature (K), and T is the temperature at whichthe test is performed (K). Regression analysis can be done using Eq.(6) to determine the activation energy for various materials fromthe experimental data. Time–temperature superposition, TTS, hasbeen tried to predict long-term creep deformation of NFPCs fromthe short-term experimental data at different temperature levels(Acha et al., 2007) with varying degrees of success.
3. Experimental
3.1. Materials
Polymers used in this work include recycled poly(vinyl chlo-ride) (RPVC), virgin poly(vinyl chloride) (VPVC), recycled high den-sity polyethylene (RHDPE), and virgin high density polyethylene(VHDPE). Both RPVC and RHDPE were obtained from AvangardIndustries, Ltd. (Houston, TX). The VPVC was Shintech SE-450 fromShintech, Inc. (Plaquemine, LA), with a viscosity of 0.515. VHDPEwas Petrothene LM 6007-00 with a MFI of 0.8 g/10 min (190 �Cand 2.16 kg) and a density of 960 kg/m3, from Equistar Chemicals,LP. (Houston, TX). The coupling agent used for the HDPE compos-ites was Polybond 3009 (MAPE) from Chemtura Corporation (Mid-dlebury, CT). The thermal stabilizer for PVC was Mark 1900, amixture of methyltin tris(2-ethylhexy thioglycolate and dimethyl-tin bis(2-ethylhexyl thioglycolate) from Chemtura Corporation
(Middlebury, CT), with a specific gravity of 1.18% and 19.5% tin.The lubricant for PVC composite is TPW-012 from Struktol Com-pany of America (Stow, OH), with a drop point of 122–128 �C anda specific gravity of 0.98. Block copolymer of styrene–ethylene–butylenes–styrene (SEBS) G1650M was from KRATON polymersUS LLC (Houston, TX, USA) as impact modifier.
The raw bagasse from crushed sugarcanes was obtained from alocal sugar mill in Louisiana. The material was oven-dried at 95 �Cfor 24 h to reduce the moisture content to below 2%. The driedmaterial was hammer milled to pass through a 20-mesh screen,and the prepared material was stored in sealed plastic bags priorto compounding.
A commercial wood/HDPE composite decking material (W/HDPE) was used for comparative purpose in this study. However,the details of the composite formulation and processing conditionsof the material were not known.
3.2. Composite preparation
The plastic, bagasse, and additives were compounded in a 32-mm twin screw extruder (D-TEX extruder, Davis Standard). Com-positions for the HDPE composites were 42%, 50%, 2%, and 6% byweight of HDPE, bagasse, MAPE, and lubricant, respectively. ForPVC composites, 41.2%, 50%, 2%, 6%, and 0.8% by weight of PVC, ba-gasse, SEBS, lubricant, and heat stabilizer were used, respectively.
Fig. 3. Creep strain (a) and strain rate (b) of B/RPVC at different temperatures.Symbols represent experimental data and solid lines represent Burgers model fit.
Fig. 4. Creep strain (a) and strain rate (b) of B/RHDPE at different temperatures.Symbols represent experimental data and solid lines represent Burgers model fit.
3282 Y. Xu et al. / Bioresource Technology 101 (2010) 3280–3286

Author's personal copy
The extruder was then reconfigured for profiling and the com-pounded pellets were further processed into profiles of 65 � 6.5-mm cross section. Thin sections were cross-cut from the profilesand then sanded to yield 65 � 6.5 � 3 mm specimens.
3.3. Characterization
Three different tests were performed using a TA Q800 DynamicMechanical Analysis (DMA) instrument (New Castle, DL) with adual-cantilever configuration. In each test, the sample was heatedto the desired temperature and allowed to equilibrate for 5 minprior to the test.
Strain sweep tests up to the maximum load level for theinstrument (i.e., 18 N) were performed at a frequency of 1 Hzand at temperatures of 35, 45, 55, and 65 �C. Load was appliedat the center point of the 65-mm long side of the sample throughsample thickness. Thirty-minute creep tests were performed at35 �C and at 10 �C increments up to 65 �C for PVC compositesand up to 85 �C for HDPE composites. After equilibrating at thedesired temperature, a stress of 2 MPa was applied, and thiswas held constant for 30 min while the creep strain was mea-sured. Three-day creep tests were also performed at 35 �C witha constant stress level of 2 MPa. Two replicate samples weretested for each condition.
3.4. Creep modeling
Statistical Analysis System (SAS) was employed to perform thenonlinear regression analysis on the creep curves. The Gauss–New-ton iterative method was implemented in this analysis to find theleast-square estimates for the four-element Burgers, Findley, andtwo-parameter power law models (i.e., Eqs. 1, 3, and 4). Since theDMA instrument collected the data with an increasing step-size,every data point was weighted with the time interval of collectingthat data (Xu, 2009).
4. Results and discussion
4.1. Stress–strain behavior
Fig. 1a shows the strain sweep test results for the composites at35 �C. A linear relationship was found up to 6 MPa at 35 �C, exceptfor the composite made with virgin HDPE. The bagasse/PVC com-posites (B/PVC) showed higher stiffness than the bagasse/HDPEcomposites (B/HDPE) presumably as a result of the stiffer PVC ma-trix. Moreover, the composites of recycled polymers (RPVC andRHDPE) had slightly higher moduli than the composites of virginpolymers (VPVC and VHDPE). At 35 �C, W/HDPE had a stiffness be-tween these of the bagasse/RHDPE composite (B/RHDPE) and thebagasse/VHDPE composite (B/VHDPE).
The linear viscoelastic regions were shortened to less than2 MPa when the temperature was increased to 65 �C (Fig. 1b) sug-gesting enhanced polymer mobility. For this reason, a stress of2 MPa was used in the creep tests to ensure that the creep defor-mations were within the linear viscoelastic range. The compositestiffness at 65 �C differed from those at 35 �C. W/HDPE was less af-fected by the temperature change than B/HDPE. It is difficult tospeculate on why the behavior of the two composites differs sincethe exact composition of W/HDPE is unknown. The greater sensi-tivity of the bagasse/RPVC composite (B/RPVC) compared to thebagasse/VPVC composite (B/VPVC) may be due to differences ofthe two matrices or possibly thermal degradation of the recycledPVC.
4.2. 30-min creep data
Fig. 2a shows the creep behavior of the five composites at 35 �C.At this temperature, B/PVC not only had lower instantaneousdeformation, due to the higher stiffness of PVC compared to HDPE(Fig. 1), but also showed a smaller creep rate than the HDPEcomposites. For the HDPE composites, their similar stiffness
Table 1Summary of parameters in Burgers model for 30-min creep of the composites.
Composites T (�C) E1 (MPa) E2 (MPa) g2 (Pa s) g1 (Pa s) SS*
B/RPVC 35 3484.3 25,000 2.08E+12 6.42E+13 1.45E�0845 2635.0 5586.6 1.55E+12 1.28E+13 1.20E�0755 1980.2 2528.46 9.26E+11 4.73E+12 4.10E�0765 1298.7 583.1 2.84E+11 1.45E+12 2.29E�06
B/VPVC 35 2994.0 18518.5 3.62E+12 3.28E+13 2.66E�0845 2475.2 7462. 7 1.97E+12 1.62E+13 8.10E�0855 1960.8 4338. 4 1.26E+12 6.86E+12 2.29E�0765 1398.6 1162. 8 4.69E+11 2.63E+12 1.20E�06
B/RHDPE 35 1574.8 2389.5 6.19E+11 6.44E+12 9.00E�0745 934.6 1041.7 2.45E+11 3.16E+12 4.48E�0655 680.3 833.3 1.84E+11 2.67E+12 8.20E�0665 498.8 706.7 1.37E+11 2.49E+12 1.40E�0575 367.6 632.9 1.13E+11 2.34E+12 2.20E�0585 273.6 555.6 1.00E+11 2.06E+12 3.10E�05
B/VHDPE 35 1428.6 1886.8 5.10E+11 4.92E+12 1.19E�0645 781.3 847.5 1.95E+11 2.43E+12 7.22E�0655 558.7 668.9 1.53E+11 1.91E+12 1.30E�0565 394.5 526.3 1.08E+11 1.64E+12 3.50E�0575 274.7 427.4 7.96E+10 1.37E+12 4.60E�0585 198.0 374.5 5.88E+10 7.84E+11 6.50E�05
W/HDPE 35 1639.3 3766.5 8.43E+11 1.13E+13 4.11E�0745 1282.1 2469.1 5.54E+11 7.84E+12 9.30E�0755 975.6 1869.2 3.94E+11 6.03E+12 1.90E�0665 735.3 1428.6 2.90E+11 4.95E+12 3.58E�0675 539.1 1111.1 2.19E+11 3.95E+12 6.47E�0685 372.4 787.4 1.54E+11 2.89E+12 1.30E�05
* SS: the sum of the squares for statistical analysis.
Y. Xu et al. / Bioresource Technology 101 (2010) 3280–3286 3283
Author's personal copy
(Fig. 1a) resulted in similar instantaneous deformations, but theydiffered much in creep rate, with B/VHDPE showing the highestcreep rate and W/HDPE the lowest.
Fig. 2b shows the creep behavior of the five composites at 65 �C.The creep strains of all of the composites increased at the highertemperature, but B/PVC composites were affected more than the
HDPE composites. Although B/PVC had smaller instantaneousdeformations than the HDPE composites, their creep rate wasgreater at 65 �C, especially for B/RPVC. Despite being less rigidand more prone to creep at 35 �C, the increase in temperaturehad less effect on HDPE composites compared with PVC compos-ites. This was because of the high crystalline content of HDPE com-posites in relation to the amorphous PVC. Figs. 3 and 4 show thecreep deformation and creep rate at various temperatures for B/RPVC and B/RHDPE. Comparatively, temperature had more influ-ence on the creep of B/RPVC than that of B/RHDPE.
The four-element Burgers model was used to fit the experimen-tal data. The fitted parameters are summarized in Table 1, whichwere used to generate the curves in Figs. 2–4 (solid lines). The Bur-gers model fitted the experimental data well towards the end ofthe testing period for a given creep test, However, the fitting waspoor at the beginning period of the test. Also, the Burgers modeloverestimated the long-term creep rate of the B-HDPE composites.
All four Burgers parameters decreased for all composites astemperature increased (Table 1). The decrease in E1 and E2 resultedfrom the increases in the instantaneous and the viscoelastic defor-mations as temperature increased. The decreases in g1 and g2 sug-gest an improvement in the mobility of molecular chains at highertemperature. The parameters for B/RPVC experienced the largestdecreases, especially g1, which is related to the long-term creeprate and demonstrates the large temperature-dependence of thiscomposite.
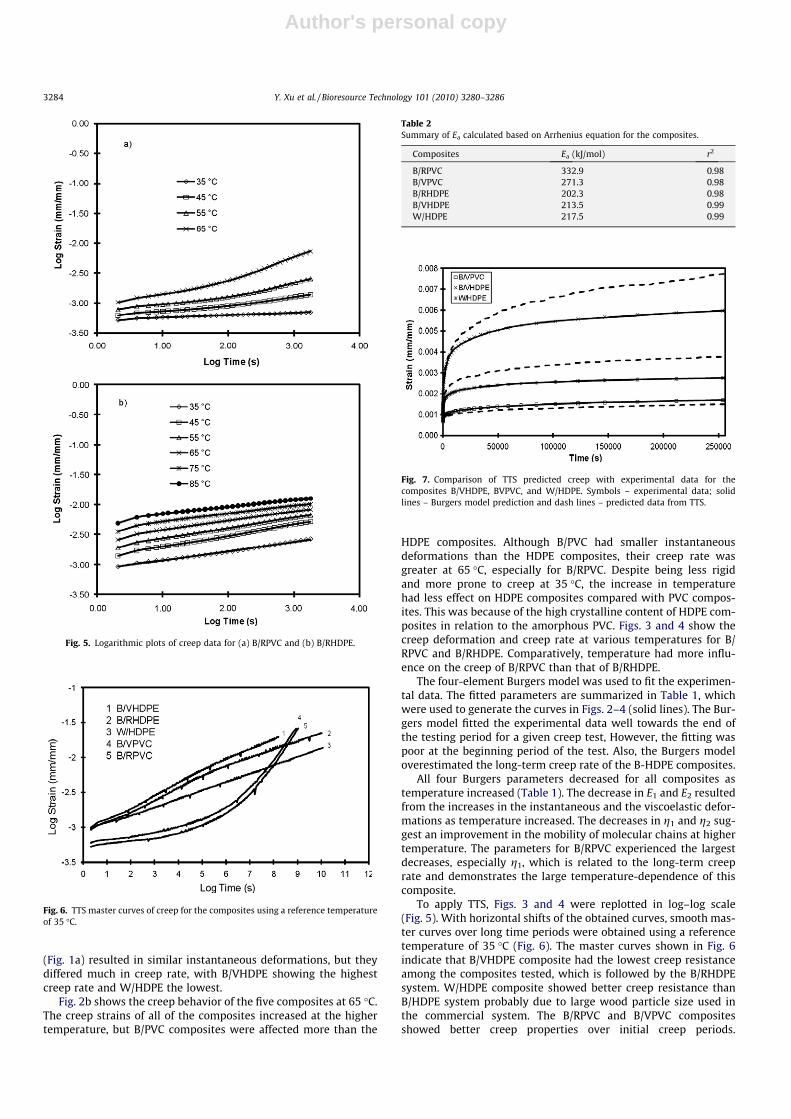
To apply TTS, Figs. 3 and 4 were replotted in log–log scale(Fig. 5). With horizontal shifts of the obtained curves, smooth mas-ter curves over long time periods were obtained using a referencetemperature of 35 �C (Fig. 6). The master curves shown in Fig. 6indicate that B/VHDPE composite had the lowest creep resistanceamong the composites tested, which is followed by the B/RHDPEsystem. W/HDPE composite showed better creep resistance thanB/HDPE system probably due to large wood particle size used inthe commercial system. The B/RPVC and B/VPVC compositesshowed better creep properties over initial creep periods.
Fig. 5. Logarithmic plots of creep data for (a) B/RPVC and (b) B/RHDPE.
Fig. 6. TTS master curves of creep for the composites using a reference temperatureof 35 �C.
Table 2Summary of Ea calculated based on Arrhenius equation for the composites.
Composites Ea (kJ/mol) r2
B/RPVC 332.9 0.98B/VPVC 271.3 0.98B/RHDPE 202.3 0.98B/VHDPE 213.5 0.99W/HDPE 217.5 0.99
Fig. 7. Comparison of TTS predicted creep with experimental data for thecomposites B/VHDPE, BVPVC, and W/HDPE. Symbols – experimental data; solidlines – Burgers model prediction and dash lines – predicted data from TTS.
3284 Y. Xu et al. / Bioresource Technology 101 (2010) 3280–3286
Author's personal copy
However, B/PVC systems had an increased creep rate as creep timeincreased and the predicted creep strains eventually surpassedthose of the HDPE composites. This behavior resulted from thehigh-temperature-dependence of creep for the PVC composites.
The shift factors used for generating the master curves weremodeled using the Arrhenius equation (Eq. (6)). The calculatedactivation energies (Ea) for the composites are summarized inTable 2 and the values are similar to the published values for NFPCsin the literature (Pooler, 2001). B/RPVC composite had the highestactivation energy value, indicating that more energy is needed tomobilize the molecular chains of this composite during creep(Yang et al., 2006). Comparatively, the HDPE composites had muchlower activation energy values than the PVC composites.
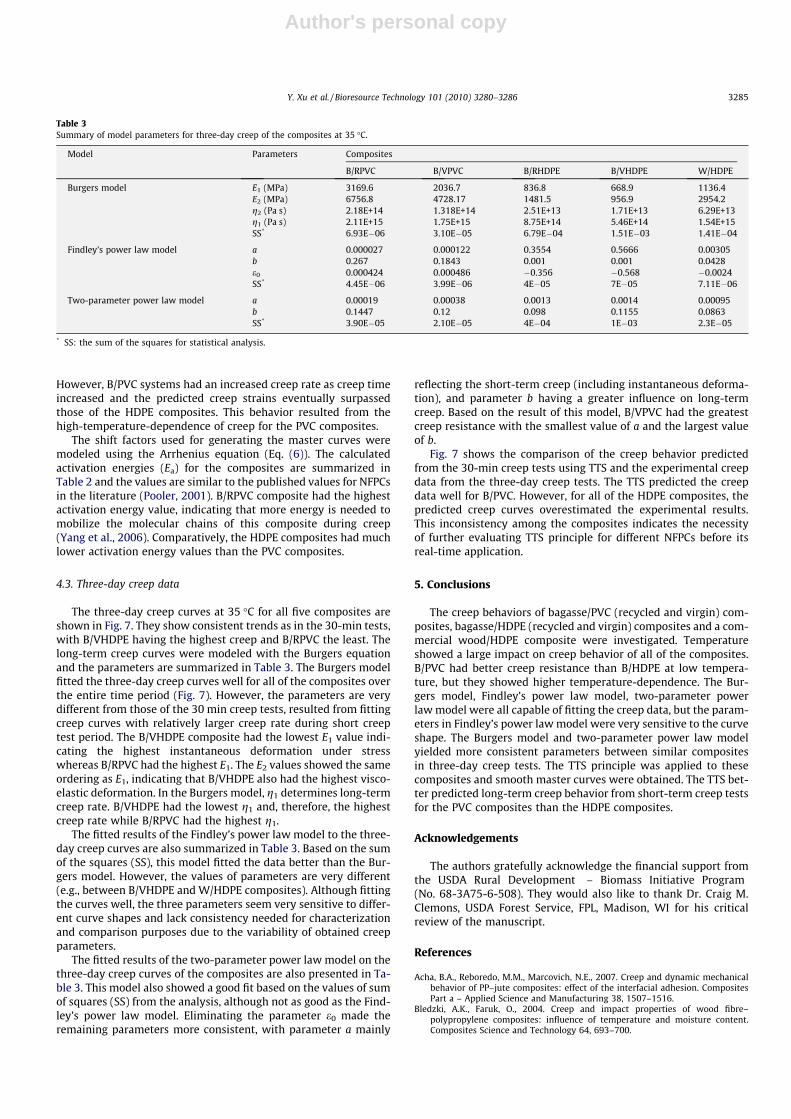
4.3. Three-day creep data
The three-day creep curves at 35 �C for all five composites areshown in Fig. 7. They show consistent trends as in the 30-min tests,with B/VHDPE having the highest creep and B/RPVC the least. Thelong-term creep curves were modeled with the Burgers equationand the parameters are summarized in Table 3. The Burgers modelfitted the three-day creep curves well for all of the composites overthe entire time period (Fig. 7). However, the parameters are verydifferent from those of the 30 min creep tests, resulted from fittingcreep curves with relatively larger creep rate during short creeptest period. The B/VHDPE composite had the lowest E1 value indi-cating the highest instantaneous deformation under stresswhereas B/RPVC had the highest E1. The E2 values showed the sameordering as E1, indicating that B/VHDPE also had the highest visco-elastic deformation. In the Burgers model, g1 determines long-termcreep rate. B/VHDPE had the lowest g1 and, therefore, the highestcreep rate while B/RPVC had the highest g1.
The fitted results of the Findley’s power law model to the three-day creep curves are also summarized in Table 3. Based on the sumof the squares (SS), this model fitted the data better than the Bur-gers model. However, the values of parameters are very different(e.g., between B/VHDPE and W/HDPE composites). Although fittingthe curves well, the three parameters seem very sensitive to differ-ent curve shapes and lack consistency needed for characterizationand comparison purposes due to the variability of obtained creepparameters.
The fitted results of the two-parameter power law model on thethree-day creep curves of the composites are also presented in Ta-ble 3. This model also showed a good fit based on the values of sumof squares (SS) from the analysis, although not as good as the Find-ley’s power law model. Eliminating the parameter e0 made theremaining parameters more consistent, with parameter a mainly
reflecting the short-term creep (including instantaneous deforma-tion), and parameter b having a greater influence on long-termcreep. Based on the result of this model, B/VPVC had the greatestcreep resistance with the smallest value of a and the largest valueof b.
Fig. 7 shows the comparison of the creep behavior predictedfrom the 30-min creep tests using TTS and the experimental creepdata from the three-day creep tests. The TTS predicted the creepdata well for B/PVC. However, for all of the HDPE composites, thepredicted creep curves overestimated the experimental results.This inconsistency among the composites indicates the necessityof further evaluating TTS principle for different NFPCs before itsreal-time application.
5. Conclusions
The creep behaviors of bagasse/PVC (recycled and virgin) com-posites, bagasse/HDPE (recycled and virgin) composites and a com-mercial wood/HDPE composite were investigated. Temperatureshowed a large impact on creep behavior of all of the composites.B/PVC had better creep resistance than B/HDPE at low tempera-ture, but they showed higher temperature-dependence. The Bur-gers model, Findley’s power law model, two-parameter powerlaw model were all capable of fitting the creep data, but the param-eters in Findley’s power law model were very sensitive to the curveshape. The Burgers model and two-parameter power law modelyielded more consistent parameters between similar compositesin three-day creep tests. The TTS principle was applied to thesecomposites and smooth master curves were obtained. The TTS bet-ter predicted long-term creep behavior from short-term creep testsfor the PVC composites than the HDPE composites.
Acknowledgements
The authors gratefully acknowledge the financial support fromthe USDA Rural Development – Biomass Initiative Program(No. 68-3A75-6-508). They would also like to thank Dr. Craig M.Clemons, USDA Forest Service, FPL, Madison, WI for his criticalreview of the manuscript.
References
Acha, B.A., Reboredo, M.M., Marcovich, N.E., 2007. Creep and dynamic mechanicalbehavior of PP–jute composites: effect of the interfacial adhesion. CompositesPart a – Applied Science and Manufacturing 38, 1507–1516.
Bledzki, A.K., Faruk, O., 2004. Creep and impact properties of wood fibre–polypropylene composites: influence of temperature and moisture content.Composites Science and Technology 64, 693–700.
Table 3Summary of model parameters for three-day creep of the composites at 35 �C.
Model Parameters Composites
B/RPVC B/VPVC B/RHDPE B/VHDPE W/HDPE
Burgers model E1 (MPa) 3169.6 2036.7 836.8 668.9 1136.4E2 (MPa) 6756.8 4728.17 1481.5 956.9 2954.2g2 (Pa s) 2.18E+14 1.318E+14 2.51E+13 1.71E+13 6.29E+13g1 (Pa s) 2.11E+15 1.75E+15 8.75E+14 5.46E+14 1.54E+15SS* 6.93E�06 3.10E�05 6.79E�04 1.51E�03 1.41E�04
Findley’s power law model a 0.000027 0.000122 0.3554 0.5666 0.00305b 0.267 0.1843 0.001 0.001 0.0428e0 0.000424 0.000486 �0.356 �0.568 �0.0024SS* 4.45E�06 3.99E�06 4E�05 7E�05 7.11E�06
Two-parameter power law model a 0.00019 0.00038 0.0013 0.0014 0.00095b 0.1447 0.12 0.098 0.1155 0.0863SS* 3.90E�05 2.10E�05 4E�04 1E�03 2.3E�05
* SS: the sum of the squares for statistical analysis.
Y. Xu et al. / Bioresource Technology 101 (2010) 3280–3286 3285

Author's personal copy
Jiang, L., Wolcott, M.P., Zhang, J.W., Englund, K., 2007. Flexural properties of surfacereinforced wood/plastic deck board. Polymer Engineering and Science 47, 281–288.
Kiguchi, M., 2007. Latest market status of wood and wood plastic composites inNorth America and Europe. In: The Second Wood and Wood Plastic CompositesSeminar in the 23rd Wood Composite Symposium, Kyoto, Japan, pp. 61–73.
Marcovich, N.E., Villar, M.A., 2003. Thermal and mechanical characterization oflinear low density polyethylene/wood flour composites. Journal of AppliedPolymer Science 90, 2775–2784.
Nunez, A.J., Marcovich, N.E., Aranguren, M.I., 2004. Analysis of the creep behavior ofpolypropylene–woodflour composites. Polymer Engineering and Science 44,1594–1603.
Pandey, A., Soccol, C.R., Nigam, P., Soccol, V.T., 2000. Biotechnological potential ofagro-industrial residues. I: sugarcane bagasse. Bioresource Technology 74, 69–80.
Park, B.D., Balatinecz, J.J., 1998. Short term flexural creep behavior of wood-fiber/polypropylene composites. Polymer Composites 19, 377–382.
Pooler, D.J., 2001. The Temperature Dependent Non-linear Response of a WoodPlastic Composite. Thesis, Washington State University, p. 52.
Sain, M.M., Balatinecz, J., Law, S., 2000. Creep fatigue in engineered wood fiber andplastic compositions. Journal of Applied Polymer Science 77, 260–268.
Tajvidi, M., Falk, R.H., Hermanson, J.C., 2005. Time–temperature superpositionprinciple applied to a kenaf-fiber/high-density polyethylene composite. Journalof Applied Polymer Science 97, 1995–2004.
Vazquez, A., Dominguez, V.A., Kenny, J.M., 1999. Bagasse fiber–polypropylene basedcomposites. Journal of Thermoplastic Composite Materials 12, 477–497.
Ward, I.M., 1971. Mechanical Properties of Solid Polymers. Wiley-Interscience.Xu, Y., 2009. Creep Behavior Of Natural Fiber Reinforced Polymer Composites. PhD
Dissertation, School of Renewable Natural Resources, Louisiana StateUniversity, 129pp.
Yang, J.L., Zhang, Z., Schlarb, A.K., Friedrich, K., 2006. On the characterization oftensile creep resistance of polyamide 66 nanocomposites. Part II: modeling andprediction of long-term performance. Polymer 47, 6745–6758.
3286 Y. Xu et al. / Bioresource Technology 101 (2010) 3280–3286