Authors: H. Li, J. Harvey, J. Asselanis, J. Zhou, I. … · Results from Visual Inspection and...
57
PREPARED FOR: California Department of Transportation Division of Research, Innovation and System Information and Materials Engineering and Testing Services, Office of Structural Materials PREPARED BY: University of California Pavement Research Center UC Davis, UC Berkeley May 2016 Research Report: UCPRC-RR-2015-07 Authors: H. Li, J. Harvey, J. Asselanis, J. Zhou, I. Guada, V. Kannekanti, and R. Wu Partnered Pavement Research Center (PPRC) Strategic Plan Project Task 3.34: Improved Screening Tests for ASR
Transcript of Authors: H. Li, J. Harvey, J. Asselanis, J. Zhou, I. … · Results from Visual Inspection and...

PREPARED FOR: California Department of Transportation Division of Research, Innovation and System Information and Materials Engineering and Testing Services, Office of
Structural Materials
PREPARED BY:
University of California Pavement Research Center
UC Davis, UC Berkeley
May 2016Research Report: UCPRC-RR-2015-07
Authors:H. Li, J. Harvey, J. Asselanis, J. Zhou, I. Guada, V. Kannekanti, and R. Wu
Partnered Pavement Research Center (PPRC) Strategic Plan Project Task 3.34: Improved Screening Tests for ASR


UCPRC-RR-2015-07 i
TECHNICAL REPORT DOCUMENTATION PAGE
1. REPORT NUMBER UCPRC-RR-2015-07
2. GOVERNMENT ASSOCIATION NUMBER
3. RECIPIENT’S CATALOG NUMBER
4. TITLE AND SUBTITLE Results from Visual Inspection and Laboratory Testing for ASR in Existing Concrete
Cores from Bridges and Pavements in California
5. REPORT PUBLICATION DATE March 2017
6. PERFORMING ORGANIZATION CODE
7. AUTHOR(S) H. Li, J. Harvey, J. Asselanis, J. Zhou, I. Guada, V. Kannekanti, and R. Wu
8. PERFORMING ORGANIZATION REPORT NO.
9. PERFORMING ORGANIZATION NAME AND ADDRESS University of California Pavement Research Center Department of Civil and Environmental Engineering, UC Davis 1 Shields Avenue Davis, CA 95616
10. WORK UNIT NUMBER
11. CONTRACT OR GRANT NUMBER 65A0542
12. SPONSORING AGENCY AND ADDRESS California Department of Transportation Division of Research, Innovation, and System Information P.O. Box 942873 Sacramento, CA 94273-0001
13. TYPE OF REPORT AND PERIOD COVERED
Research Report June 2015 – June 2016
14. SPONSORING AGENCY CODE RPMD Task ID: 2693
15. SUPPLEMENTAL NOTES
16. ABSTRACT The overall goal of this project was to evaluate with available cores the presence of alkali-silica reaction (ASR) in California bridges
and pavements, to develop procedures for evaluation of ASR by Caltrans staff, and, potentially, to investigate several locations suspected of having ASR damage. This report summarizes the creation of an inventory for cores taken from bridges and pavements in previous projects, the results of visual inspection and strength testing to identify the potential presence of ASR, and the development of a draft approach for Caltrans staff to evaluate the potential for ASR in bridges and pavements. A spreadsheet database was prepared for storing inventory data for 265 pavement cores with four inch (100 mm) diameter and 311 bridge cores with two inch (50 mm) diameter. Most of the bridge cores were from the San Francisco Bay Area, while the pavement cores were collected from across the state. Visual inspection was performed on 259 of the pavement cores (including multiple samples from some of the pavement cores) and 80 of the bridge cores (those with lengths greater than the three-inch minimum required for evaluation of ASR) using the Damage Rating Index (DRI) method. None of the cores showed the likelihood of an ASR issue, as defined by a DRI greater than 2,000, although a few cores showed a small number of ASR features. Comparison of the ages of the bridges and the ASR damage rating index for the cores showed almost no trend, and showed no apparent differences between cores from bridges built before and after 1995, approximately when Caltrans changed specifications to reduce the risk of ASR.
Most of the pavement cores tested had unconfined compressive strength (UCS) less than 8,700 psi (60 MPa) and the median of the UCS of the pavement cores was approximately 6,100 psi (42 MPa). Most of the pavement cores tested had densities less than 156 pcf (2,500 kg/m3) and the median of the UCS of the pavement cores was approximately 147 pcf (2,350 kg/m3). No significant correlation was found between the UCS and the density of the pavement cores tested, although the UCS strengths generally increased with increased density. The bridge cores were too small in diameter for strength and density testing. An integrated spreadsheet database was prepared for storing all relevant data for all cores, including test results from all tasks (DRI, UCS, and density).
A draft guideline was developed for visual inspection of concrete cores to identify signs of potential ASR-related distresses and to support decisions regarding the need for a further detailed investigation for ASR. The guideline describes step-by-step inspection procedures and selection criteria for a further detailed examination, with relevant example pictures showing different severity levels of potential ASR distresses.
17. KEY WORDS
bridge decks, concrete pavements, ASR, damage, strength, visual inspection, petrographic examination
18. DISTRIBUTION STATEMENT No restrictions. This document is available to the public through the National Technical Information Service, Springfield, VA 22161
19. SECURITY CLASSIFICATION (of this report)
Unclassified
20. NUMBER OF PAGES 57
21. PRICE None
Reproduction of completed page authorized

ii UCPRC-RR-2015-07
UCPRC ADDITIONAL INFORMATION DRAFT STAGE
Stage 6, final
PARTNERED PAVEMENT RESEARCH CENTER STRATEGIC PLAN ELEMENT NUMBER
3.34
FHWA NUMBER CA172702A
VERSION NUMBER 1
CALTRANS TECHNICAL LEAD AND REVIEWER(S) Keith Hoffman, and Vijay Jain, James Sagar, and Jacquelyn Wong
PROPOSALS FOR IMPLEMENTATION It is proposed that the Draft Test Procedures for Screening And Examining Concrete Core Samples for Alkali-Silica Reactivity included in this report be considered for use by Caltrans.
RELATED DOCUMENTS None
SIGNATURES
H. Li FIRST AUTHOR
J.T. Harvey TECHNICAL REVIEW
D. Spinner EDITOR
J.T. Harvey PRINCIPAL INVESTIGATOR
K. Hoffman CALTRANS TECH. LEAD
T. Joseph Holland CALTRANS CONTRACT MANAGER
Reproduction of completed page authorized

UCPRC-RR-2015-07 iii
DISCLAIMER STATEMENT
This document is disseminated in the interest of information exchange. The contents of this report reflect the
views of the authors who are responsible for the facts and accuracy of the data presented herein. The contents do
not necessarily reflect the official views or policies of the State of California or the Federal Highway
Administration. This publication does not constitute a standard, specification or regulation. This report does not
constitute an endorsement by the Department of any product described herein.
For individuals with sensory disabilities, this document is available in alternate formats. For information, call
(916) 654-8899, TTY 711, or write to California Department of Transportation, Division of Research,
Innovation and System Information, MS-83, P.O. Box 942873, Sacramento, CA 94273-0001.
ACKNOWLEDGMENTS
The authors would like to thank Caltrans staff, including Christopher Glasscock, Vijay Jain, Keith Hoffman,
James Sagar, Deepak Maskey, David Lim, Flor Bautista, and Jacquelyn Wong for help in developing the project
work plan, reviewing the results, and providing technical direction, and T. Joe Holland and Nick Burmas for
providing research management and direction.

iv UCPRC-RR-2015-07
PROJECT OBJECTIVES/GOALS
The overall goals of this project were to evaluate the presence of alkali-silica reaction (ASR) in California
bridges and pavements by using an already-existing collection of available pavement section and bridge cores
taken from locations around the state, to develop procedures for evaluation of ASR by Caltrans staff, and,
potentially, to investigate several locations suspected of having ASR damage. The cores, which had been taken
from bridge decks and concrete pavements throughout California, had been collected for other research studies
but they were determined to be suitable for this study’s statewide assessment of the presence of ASR in Caltrans
pavements and bridges. The primary objective of the project was to inventory and then use these cores to
provide an overall high-level assessment of the presence of ASR in the state’s pavements and bridge decks. The
project’s secondary objective was to see if there was any difference in the ASR detection rates for concrete
placed before and after Caltrans changed its ASR-mitigation practices in the 1990s. Creation of a procedure for
evaluating ASR that can be used by Caltrans staff was added as a third objective during execution of the project.
Before this study began, it was understood that the likelihood of finding ASR in any one of these samples might
be low because the cores had not been taken from bridges and pavements where ASR was suspected or where
there was visible damage from ASR. It was also understood that the sampling and laboratory practices to be
used in this study differed from those that would be used on a typical forensic investigation where ASR is
suspected because of the need to perform rapid, low-cost evaluation of a large number of cores.
This report summarizes the results of the inventory and testing of the cores made available at the beginning of
the study, which completes the three objectives of the project. Some additional sampling and testing of locations
with suspected ASR may be performed in the project.
UCPRC-RR-2015-07 v
EXECUTIVE SUMMARY
Alkali-aggregate reaction (AAR) refers to the reaction between the hydroxyl ions in the alkaline cement pore
solution in portland cement concrete (PCC) and reactive aggregates in the concrete. Alkali-silica reaction (ASR)
is the most common form of alkali-aggregate reaction found in concrete. This reaction produces a composite
called alkali-silica gel that will increase in volume and crack the aggregates and the surrounding cement paste if
the latter lacks sufficient strength to resist the expansive pressure.
Caltrans has spent significant resources over several decades attempting to mitigate the impact of ASR on
bridges and pavements. In 2000, Caltrans finalized a general specification it had developed to reduce ASR’s
impact. However, to date no study has been conducted to evaluate the service-life impact of ASR on the
California highway network or to compare the results of studies on concrete materials placed before and after
the final specifications changes.
The first indication of ASR in a pavement is a characteristic cracking pattern. Once a determination is made that
ASR is present or that further examination is desired, cores are extracted from the area where cracking occurred.
The cores are then cut into thin and/or polished sections.
The most common technique used for the identifying ASR is the examination of thin sections of concrete using
a petrographic microscope. Scanning electron microscopy (SEM) is an alternative technique; it is used to
examine polished sections of concrete. Of the two techniques, SEM gives a more definitive result about the
presence of alkali-silica gel because the process uses x-ray microanalysis to confirm the identification of ASR
reaction products.
Compressive strengths from areas suspected of having ASR can be an indicator of ASR-related microcracking,
although low compressive strengths can occur for a number of other reasons.
A survey to determine the extent of ASR on the California highway network would require extensive condition
surveying and field sampling. However, having existing concrete cores collected by three earlier Caltrans
studies provided an opportunity to initiate an ASR survey study on the cores.
More than 300 bridge deck cores had been obtained from various structures throughout the state as part of a
Caltrans Bridge Deck Preservation Committee initiative. A second set of cores was obtained from those
collected by a ground-penetrating radar (GPR) study that had been conducted to determine the existing

vi UCPRC-RR-2015-07
pavement structural cross-sections on California’s highway network. A third group of cores was obtained from
an evaluation of coefficient of thermal expansion (CTE). A total of 265 pavement cores and 311 bridge cores
were available from the three studies. Of the bridge cores, 102 had lengths greater than 75 mm (3 inches), the
minimum length required to provide sufficient cross-sectional area for ASR examination based on advice from
the petrographer subcontracted for the study and approved by the UCPRC and the Caltrans steering committee.
The preferred length was 100 mm (4 inches) to provide more cross-sectional area. Because the pavement cores
had a larger diameter and were all longer than 3 inches, all of them were potentially useable for petrographic
examination.
The overall goals of this project were to evaluate the presence of alkali-silica reaction (ASR) in California
bridges and pavements by using an already-existing collection of available pavement section cores and bridge
cores taken from locations around the state, to develop procedures for evaluation of ASR by Caltrans staff, and,
potentially, to investigate several locations suspected of having ASR damage. The primary objective of the
project was to inventory and then use these cores to provide an overall high-level assessment of the presence of
ASR in the state’s pavements and bridge decks. The project’s secondary objective was to see if there was any
difference in the ASR detection rates for concrete placed before and after Caltrans changed its ASR-mitigation
practices in the 1990s. A third objective added during the project was the creation an ASR evaluation procedure
for use by Caltrans staff.
Before this study began, it was understood that the likelihood of finding ASR in any one of these samples might
be low because the cores had not been taken from bridges and pavements where ASR was suspected or where
there was visible damage from ASR. It was also understood that the sampling and laboratory practices to be
used in this study differed from those that would be used on a typical forensic investigation where ASR is
suspected because of the need to perform rapid, low-cost evaluation of a large number of cores.
This research report summarizes the creation of an inventory of the bridge and pavement cores from the earlier
studies, lays out the criteria for visual inspection and assessment of the cores, and presents the results of strength
and density testing on the cores to identify potential issues pertaining to ASR in California roadways.
Among the results from the testing were the following:
Most of the pavement cores inspected showed Damage Rating Index (DRI) for Concrete (following
ASTM C 856-14) values of less than 1,000 (ASR not likely, according to the criteria shown in
Section 3.2), with a DRI value of roughly 200 being the approximate median. A few cores had DRI
results between 1,000 and 2,000 (ASR possible). None of the pavement cores inspected showed DRI
results larger than 2,000 (ASR probable).

UCPRC-RR-2015-07 vii
Most of the bridge cores inspected had DRI results less than 1,000 (ASR not likely, according to the
criteria listed previously), and the median DRI result was approximately 500. Very few of the bridge
cores had DRI results between 1,000 and 2,000 (ASR possible), and none of them had DRI results
greater than 2,000 (ASR probable).
As-built data for the bridge cores were obtained for 259 of the 311 bridge cores. All of the cores came
from bridges that were built before the year 2000. Comparison with the year of construction and the
DRI data showed almost no trend between the age of the cores and DRI, with bridge ages ranging from
17 to 69 years old at time of visual inspection. Even the youngest cores should have had enough time to
begin to manifest ASR if the reaction was occurring. There was no apparent difference in DRI values
for the 46 cores taken from bridges built after 1995, when changes to specifications were made,
compared with bridges built before 1995.
Approximately 90 percent of the unconfined compressive strength (UCS) results were between 4,400
and 8,800 psi (30 and 61 MPa) and the median value was approximately 6,090 psi (42 MPa). These
results were considered to be within the range of long-term strengths expected of PCC pavements by
experienced Caltrans materials engineers.
Approximately 90 percent of the density results were between 140 and 155 pcf (2,243 and 2,483 kg/m3)
and the median value was approximately 147 pcf (2,350 kg/m3). These results were considered to be
within the range of densities expected of PCC pavements by experienced Caltrans materials engineers.
There was no significant correlation found between the UCS and density of the pavements core tested,
although UCS strength generally increased with density.
A draft guideline was developed for the visual inspection of concrete cores to identify signs of potential
ASR-related distresses; this guideline can to be used in the future by Caltrans staff to determine the need
for further, more detailed examinations. The guideline describes step-by-step inspection procedures and
selection criteria for further detailed examinations, and uses photographic examples that show different
severity levels of potential ASR distresses.
An integrated spreadsheet database was prepared for storing all relevant data for all cores, including test
results from all tasks (DRI, UCS, and density).
The second objective of evaluating the effects on ASR of specification changes in the 1990s could not be
completed because of the very low detection of ASR in the cores examined, regardless of whether the concrete
was placed before or after 1995.
viii UCPRC-RR-2015-07
Based on the results of the study, which showed very low detection of ASR, it is recommended that no further
work be performed on this project, except that Caltrans may choose to select a few locations suspected of having
ASR for sampling and evaluation.

UCPRC-RR-2015-07 ix
TABLE OF CONTENTS
PROJECT OBJECTIVES/GOALS .................................................................................................................... iv EXECUTIVE SUMMARY ................................................................................................................................... v LIST OF FIGURES .............................................................................................................................................. x LIST OF ABBREVIATIONS .............................................................................................................................. xi LIST OF TEST METHODS AND STANDARDS ............................................................................................ xi CONVERSION FACTORS ................................................................................................................................ xii 1. INTRODUCTION .......................................................................................................................................... 1
1.1 Background ......................................................................................................................................... 1 1.2 Study Objective/Goal ......................................................................................................................... 2
2. COMPILATION OF INVENTORY DATA ON EXISTING CORES AND PREPARATION OF SAMPLES ....................................................................................................................................................... 5
2.1 Compiling Data on the Existing Bridge and Pavement Cores ............................................................ 5 2.2 Sample Preparation ........................................................................................................................... 10
3. VISUAL INSPECTION AND ASSESSMENT OF CORES ..................................................................... 15 3.1 Overview .......................................................................................................................................... 15 3.2 Damage Rating Index Method .......................................................................................................... 16 3.3 Results of Visual Inspection of Pavement Cores .............................................................................. 20 3.4 Results of Visual Inspection of Bridge Cores ................................................................................... 22 3.5 Comparison of Bridge Core DRI and Year of Construction ............................................................ 24 3.6 Guidelines for Visual Inspection ...................................................................................................... 25
4. COMPRESSIVE STRENGTH TESTING OF PAVEMENT CORES .................................................... 27 4.1 Overview .......................................................................................................................................... 27 4.2 Compressive Strength Testing Method ............................................................................................ 28 4.3 Results of Compressive Strength Testing ......................................................................................... 29 4.4 Results of Density Measurements .................................................................................................... 31 4.5 Compressive Strength versus Density .............................................................................................. 32
5. SUMMARY, CONCLUSIONS, AND RECOMMENDED NEXT TASKS ............................................. 33 5.1 Summary ........................................................................................................................................... 33 5.2 Conclusions ...................................................................................................................................... 33 5.3 Next Steps ......................................................................................................................................... 34
REFERENCES .................................................................................................................................................... 35 APPENDIX .......................................................................................................................................................... 36
Field Survey and Taking and Processing of Cores ..................................................................................... 36 Measuring Damage Rating Index ............................................................................................................... 36
x UCPRC-RR-2015-07
LIST OF FIGURES
Figure 2.1: Pavement cores, including 150 cores that had been soaked in lime water for CTE testing. ................ 6 Figure 2.2: Bridge cores; cores equal to or longer than 3 inches were used for ASR visual inspection. ................ 7 Figure 2.3: Inventory of bridge cores. ..................................................................................................................... 7 Figure 2.4: Inventory of pavement cores. ............................................................................................................... 8 Figure 2.5: Map showing original locations of bridge cores. .................................................................................. 9 Figure 2.6: Map showing original locations of pavement cores. .......................................................................... 10 Figure 2.7: J-slot continuous diamond blades for concrete core cutting. .............................................................. 11 Figure 2.8: Cutting plan for pavement cores. ........................................................................................................ 12 Figure 2.9: Concrete cores for visual inspection. .................................................................................................. 13 Figure 2.10: Concrete pavement cores after cutting and leveling for strength testing. ......................................... 13 Figure 3.1: Pavement and bridge cores after cutting for visual inspection. .......................................................... 15 Figure 3.2: Example of the Damage Rating Index (DRI) worksheet. ................................................................... 17 Figure 3.3: Example scans of the cut surfaces of three pavement cores. .............................................................. 18 Figure 3.4: Example scans of the cut surfaces of three bridge cores. ................................................................... 19 Figure 3.5: Project steering committee meeting on visual inspection at the UC Berkeley Richmond Field
Station on June 19, 2015. .............................................................................................................................. 20 Figure 3.6: DRI of pavement cores, by core number. ........................................................................................... 21 Figure 3.7: DRI of pavement cores, frequency chart. ........................................................................................... 21 Figure 3.8: DRI of pavement cores, cumulative distribution chart. ...................................................................... 22 Figure 3.9: DRI of bridge cores, by core number. ................................................................................................ 23 Figure 3.10: DRI of bridge cores, frequency chart. ............................................................................................... 23 Figure 3.11: DRI of bridge cores, cumulative distribution chart. ......................................................................... 24 Figure 3.12: Damage Rating Index versus year of construction for bridge cores. ................................................ 25 Figure 4.1: Pavement cores and strength testing. .................................................................................................. 27 Figure 4.2: Frequency of length-to-diameter ratio (LDR) of pavement cores. ..................................................... 28 Figure 4.3: Length-to-diameter ratio (LDR) correction factor. ............................................................................. 28 Figure 4.4: Corrected unconfined compressive strength of pavement cores, organized by core number. ............ 29 Figure 4.5: Corrected unconfined compressive strength of pavement cores, histogram chart (metric and US
units). ............................................................................................................................................................ 30 Figure 4.6: Density of pavement cores, histogram chart (metric and US units). .................................................. 31 Figure 4.7: Strength versus density of pavement cores (metric and US units). .................................................... 32 Figure A.1: Example of the procedures and decision making criteria for the petrographic examination and
Damage Index Rating. .................................................................................................................................. 40 Figure A.2: Example photos showing some of the common petrographic features of ASR. ................................ 41

UCPRC-RR-2015-07 xi
LIST OF ABBREVIATIONS
AAR Alkali-aggregate reaction
AME Applied Materials & Engineering
ASR Alkali-silica reaction
DES Division of Engineering Services
GPR Ground-penetrating radar
LDR Length-to-diameter ratio
METS Materials Engineering and Testing Services
OSM Office of Structural Materials
PLM Polarized light microscopy
PPRC Partnered Pavement Research Center
SEM Scanning electron microscopy
UCPRC University of California Pavement Research Center
UCS Unconfined compressive strength
XRD X-ray diffraction
ASTM American Society for Testing and Materials
FTIR Fourier transform infrared spectroscopy
PCC Portland cement concrete
RFS Richmond Field Station
LIST OF TEST METHODS AND STANDARDS
ASTM C39/C39M-14a Standard Test Method for Compressive Strength of Cylindrical Concrete
Specimens
ASTM C294-12 Standard Descriptive Nomenclature for Constituents of Concrete Aggregates
ASTM C642-13 Standard Test Method for Density, Absorption, and Voids in Hardened Concrete
ASTM C856-14 Standard Practice for Petrographic Examination of Hardened Concrete

xii UCPRC-RR-2015-07
CONVERSION FACTORS
SI* (MODERN METRIC) CONVERSION FACTORS APPROXIMATE CONVERSIONS TO SI UNITS
Symbol When You Know Multiply By To Find Symbol LENGTH
in inches 25.4 Millimeters mm ft feet 0.305 Meters m yd yards 0.914 Meters m mi miles 1.61 Kilometers Km
AREAin2 square inches 645.2 Square millimeters mm2 ft2 square feet 0.093 Square meters m2 yd2 square yard 0.836 Square meters m2 ac acres 0.405 Hectares ha mi2 square miles 2.59 Square kilometers km2
VOLUMEfl oz fluid ounces 29.57 Milliliters mL gal gallons 3.785 Liters L ft3 cubic feet 0.028 cubic meters m3 yd3 cubic yards 0.765 cubic meters m3
NOTE: volumes greater than 1000 L shall be shown in m3
MASSoz ounces 28.35 Grams g lb pounds 0.454 Kilograms kg T short tons (2000 lb) 0.907 megagrams (or "metric ton") Mg (or "t")
TEMPERATURE (exact degrees)°F Fahrenheit 5 (F-32)/9 Celsius °C
or (F-32)/1.8
ILLUMINATION fc foot-candles 10.76 Lux lx fl foot-Lamberts 3.426 candela/m2 cd/m2
FORCE and PRESSURE or STRESS lbf poundforce 4.45 Newtons N lbf/in2 poundforce per square inch 6.89 Kilopascals kPa
APPROXIMATE CONVERSIONS FROM SI UNITS
Symbol When You Know Multiply By To Find Symbol LENGTH
mm millimeters 0.039 Inches in m meters 3.28 Feet ft m meters 1.09 Yards yd km kilometers 0.621 Miles mi
AREAmm2 square millimeters 0.0016 square inches in2 m2 square meters 10.764 square feet ft2 m2 square meters 1.195 square yards yd2 ha Hectares 2.47 Acres ac km2 square kilometers 0.386 square miles mi2
VOLUMEmL Milliliters 0.034 fluid ounces fl oz L liters 0.264 Gallons gal m3 cubic meters 35.314 cubic feet ft3 m3 cubic meters 1.307 cubic yards yd3
MASSg grams 0.035 Ounces oz kg kilograms 2.202 Pounds lb Mg (or "t") megagrams (or "metric ton") 1.103 short tons (2000 lb) T
TEMPERATURE (exact degrees) °C Celsius 1.8C+32 Fahrenheit °F
ILLUMINATION lx lux 0.0929 foot-candles fc cd/m2 candela/m2 0.2919 foot-Lamberts fl
FORCE and PRESSURE or STRESSN newtons 0.225 Poundforce lbf kPa kilopascals 0.145 poundforce per square inch lbf/in2

UCPRC-RR-2015-07 1
1. INTRODUCTION
1.1 Background
Alkali-aggregate reaction (AAR) refers to the reaction between the hydroxyl ions in the alkaline cement pore
solution in portland cement concrete (PCC) and reactive aggregates in the concrete. Alkali-silica reaction (ASR)
is the most common form of alkali-aggregate reaction found in concrete. This reaction produces a composite
called alkali-silica gel that will increase in volume and crack the aggregates and the surrounding cement paste if
the latter lacks sufficient strength to resist the expansive pressure.
Caltrans has spent significant resources over several decades attempting to mitigate the impact of ASR on
bridges and pavements. In 2000, Caltrans finalized a general specification it had developed to reduce ASR’s
impact. However, to date no study has been conducted to evaluate the service-life impact of ASR on the
California highway network or to compare the results of studies on concrete materials placed before and after
the final specifications changes.
The first indication of ASR in a pavement is a characteristic cracking pattern. Once a determination is made that
ASR is present or that further examination is desired, cores are extracted from the area where cracking occurred.
The cores are then cut into thin and/or polished sections.
The most common technique used for the identifying ASR is the examination of thin sections of concrete using
a petrographic microscope. Scanning electron microscopy (SEM) is an alternative technique; it is used to
examine polished sections of concrete. Of the two techniques, SEM gives a more definitive result about the
presence of alkali-silica gel because the process uses x-ray microanalysis to confirm the identification of ASR
reaction products.
Compressive strengths from areas suspected of having ASR can be an indicator of ASR-related microcracking,
although low compressive strengths can occur for a number of other reasons.
A survey to determine the extent of ASR on the California highway network would require extensive condition
surveying and field sampling. However, having existing concrete cores collected by three earlier Caltrans
studies provided an opportunity to initiate an ASR survey study on the cores.
The first of these earlier studies, a Caltrans Bridge Deck Preservation Committee initiative, collected 311 bridge
deck cores from various structures throughout the state as part of quality assurance testing. The cores were
identified as being of use for ASR research and were obtained for this study from the Caltrans Transportation
Laboratory.

2 UCPRC-RR-2015-07
A second set of cores was obtained from those remaining from a ground-penetrating radar (GPR) study
completed in 2012. The goal of the study for which the cores had been collected was to develop better
information regarding the existing pavement structures on California’s state highway system. The cores, many
of which were taken from concrete pavements, had been used to calibrate the GPR. Some of the cores were from
pavements with PCC surfaces and others had been overlaid with asphalt prior to coring. Although most of the
GPR pavement cores were discarded after completion of the thickness measurements, cores from 134 sites had
been saved and were still available.
A third study, from which 131 cores were obtained, had used nondestructive testing to measure the coefficient
of thermal expansion (CTE) on concrete pavement projects. Although the cores from the CTE study had been
subjected to a brief period of soaking, it was determined that the soaking would not compromise the results of
the ASR study.
Altogether, a total of 265 pavement cores and 311 bridge cores were available from the three studies. Of the
bridge cores, 102 had lengths greater than 75 mm (3 inches), the minimum length required to provide sufficient
cross-sectional area for ASR examination based on advice from the petrographer subcontracted for the study and
approved by the UCPRC and the Caltrans steering committee (which consisted of selected staff from the Office
of Structural Materials [OSM] and members of the Pavement Program). The preferred length was 100 mm
(4 inches) to provide more cross-sectional area. Because the pavement cores had a larger diameter and were all
longer than 3 inches, all of them were potentially useable for petrographic examination.
1.2 Study Objective/Goal
The overall goals of this project were to evaluate the presence of alkali-silica reaction (ASR) in California
bridges and pavements by using an already-existing collection of available pavement section cores and bridge
cores taken from locations around the state, to develop procedures for evaluation of ASR by Caltrans staff, and,
potentially, to investigate several locations suspected of having ASR damage. The cores, which had been
removed from bridge decks and concrete pavements throughout California, had been collected for other research
studies but they were determined to be suitable for this study’s statewide assessment of the presence of ASR in
Caltrans pavements and bridges. The primary objective of the project was to inventory and then use these cores
to provide an overall high-level assessment of the presence of ASR in the state’s pavements and bridge decks.
The project’s secondary objective was to see if there was any difference in the ASR detection rates for concrete
placed before and after Caltrans changed its ASR-mitigation practices in the 1990s. Creation of a procedure for
evaluating ASR that can be used by Caltrans staff was added as a third objective during execution of the project.

UCPRC-RR-2015-07 3
Before this study began, it was understood that the likelihood of finding ASR in any one of these samples might
be low because the cores had not been taken from bridges and pavements where ASR was suspected or where
there was visible damage from ASR. It was also understood that the sampling and laboratory practices to be
used in this study differed from those that would be used on a typical forensic investigation where ASR is
suspected because of the need to perform rapid, low-cost evaluation of a large number of cores.
This report summarizes the results of the inventory and testing of the cores made available at the beginning of
the study, which completes the three objectives of the project, except that the second objective of evaluating
detection rates of ASR in concrete placed before and after specification changes in the 1990s showed no
differences because of very low detection rates across all cores.

4 UCPRC-RR-2015-07
(This page left blank)

UCPRC-RR-2015-07 5
2. COMPILATION OF INVENTORY DATA ON EXISTING CORES AND PREPARATION OF SAMPLES
The first task of the project had three parts: inventory the pavement and bridge cores, create a database from the
inventory, and prepare the cores for further evaluation and testing. Once the inventory data was collected it was
to be used for the following, if possible:
To create a final database that can be utilized by various Caltrans units in the future,
To determine the adequacy of current specifications, and
To correlate the prevalence of ASR in concrete to site conditions and service life.
2.1 Compiling Data on the Existing Bridge and Pavement Cores
All the bridge and pavement section cores were collected from Caltrans and UCPRC storage facilities and
brought to the UCPRC’s laboratory at Richmond Field Station (see Figure 2.1 and Figure 2.2). Once there,
UCPRC staff—using identification data provided by staff of the Caltrans Division of Engineering Services
(DES) Materials Engineering and Testing Services (METS)—processed and inventoried the bridge cores,
measured their dimensions, and organized all the cores for use in this study.
Spreadsheet data files (shown in Figure 2.3 for the bridge cores and in Figure 2.4 for the pavement cores) were
generated to archive the available information. Data available for the bridge cores, including bridge ID/name
and location, coring date, core size and core location on bridge, and any historical data (bridge age, mix design,
strength, stiffness, etc.), came from METS staff, while information for the pavement cores came from UCPRC
records.
Figure 2.5 and Figure 2.6 show that most of the bridge cores were from the San Francisco Bay Area and
northern California, and that the pavement cores came from across the state. Figure 2.6 also shows where cores
were taken from the surface of PCC pavements and from PCC under asphalt surfaces.

6 UCPRC-RR-2015-07
Figure 2.1: Pavement cores, including 150 cores that had been soaked in lime water for CTE testing.

UCPRC-RR-2015-07 7
Figure 2.2: Bridge cores; cores equal to or longer than 3 inches were used for ASR visual inspection.
Figure 2.3: Inventory of bridge cores.

8 UCPRC-RR-2015-07
Figure 2.4: Inventory of pavement cores.

UCPRC-RR-2015-07 9
Figure 2.5: Map showing original locations of bridge cores.

10 UCPRC-RR-2015-07
Figure 2.6: Map showing original locations of pavement cores.
2.2 Sample Preparation
The 265 pavement cores (Figure 2.1), of which 131 had been soaked briefly in lime water for the CTE testing,
and 311 bridge cores were prepared for examination for ASR. For this investigation the petrographic consultant
advised selecting bridge cores that had a minimum length of 3 inches (75 mm), so that the required amount of
surface area for the examination on each would be available, and a preferred length of 4 inches (100 mm); this
resulted in the selection of 102 cores to process before the examination (Figure 2.2). The pavement cores had
sufficient surface area for examination because of their greater width (4 inches [102 mm]) and length.
Blue: CTE Cores Green: Surface Red: Under Asphalt

UCPRC-RR-2015-07 11
After the cores were inventoried and measured, they were cut for testing and examination. As shown in
Figure 2.7, the cores were cut using J-slot continuous diamond blades, which are commonly used to cut marble
and tile.
Figure 2.7: J-slot continuous diamond blades for concrete core cutting.
All the pavement cores used for CTE testing had been cut to a length of 6 inches (152 mm), but the pavement
cores and bridge cores from the GPR study were of varying lengths. For this study, bridge cores that were equal
to or longer than 3 inches were cut vertically into two parts for the ASR visual inspection (Figure 2.8 and
Figure 2.9).
Pavement cores shorter than 6 inches (152 mm) were cut vertically, splitting them into two parts for visual
inspection for ASR. Pavement cores between 6 inches (152 mm) and 8.5 inches (22 mm) long were cut twice,
once for strength testing and once for visual inspection. First, a horizontal cut was made 4 inches (102 mm)
from the top of the core, and this 4 inch core was used for strength testing; on pavement cores that had been less
than 8.5 inches long, the remaining bottom piece of the original core (if it was not less than 2 inches long) was
then cut down the middle vertically for ASR visual inspection. On pavement cores longer than 8.5 inches
(216 mm), the bottom piece was cut horizontally again into two short cylinders not less than 2 inches (51 mm)
long; each of these was then cut vertically in half for ASR visual inspection.

12 UCPRC-RR-2015-07
Pavement core pieces cut for strength testing were ground to ensure that the top and bottom surfaces were
parallel to each other and perpendicular to the core sides (Figure 2.10). All the bridge cores were too small for
strength testing.
Pavement CTE cores already cut to 6" tall All bridge cores more than 3" tall and pavement GPR Cores less than 6" tall
Pavement GPR cores more than 8.5" tall Pavement GPR cores between 6" and 8.5" tall
Notes: Pavement CTE cores were 6 inches tall exactly, cut for previous testing. Bridge cores and pavement cores from the GPR study were separated by height to determine how to cut
them: between 3 and 6 inches, between 6 and 8.5 inches, and greater than 8.5 inches.
Figure 2.8: Cutting plan for pavement cores.
8.5" < H < 6"
A
B1 B2
B1 B2
B1 B2
B1 B2 C1 C2
H = 6"
2"
4"
4" H > 8.5"
R/2
R/2 R
A
A
3" < H < 6"

UCPRC-RR-2015-07 13
Figure 2.9: Concrete cores for visual inspection.
Figure 2.10: Concrete pavement cores after cutting and leveling for strength testing.

14 UCPRC-RR-2015-07
(This page left blank.)

UCPRC-RR-2015-07 15
3. VISUAL INSPECTION AND ASSESSMENT OF CORES
3.1 Overview
In Task 2 of this study, the cores inventoried and prepared for Task 1 were next examined visually and assessed
for traces of ASR or ASR-related distress. Photos were taken and scans were made of the cut surfaces of the
cores. The task of ASR visual inspection was contracted out to a primary petrographer (Jon Asselanis of Applied
Materials Engineering Inc., Oakland, California) and a secondary petrographer (Derek Cong of WJE Associates
Inc., Austin, Texas), both of whom the Caltrans steering committee had selected for this project based on their
qualifications and their unit prices for the inspection.
A total of 259 pavement core samples (multiple pieces for most pavement cores) and 80 bridge core samples
(Figure 3.1) were visually inspected by the primary petrographer.
Figure 3.1: Pavement and bridge cores after cutting for visual inspection.

16 UCPRC-RR-2015-07
3.2 Damage Rating Index Method
A descriptive rating method for ASR using the Damage Rating Index (DRI) for Concrete following
ASTM C856-14 (Standard Practice for the Petrographic Examination of Hardened Concrete) and
ASTM C294-12 (Standard Descriptive Nomenclature for Constituents of Concrete Aggregates) was used for the
visual inspection of the cut surfaces that were scanned. The method also considers work documented in FHWA
reports (References 1, 2, and 3). Figure 3.2 shows an example DRI rating sheet, and Figure 3.3 and Figure 3.4
show examples of the scans of cut faces of cores used for the petrographic examination. The detailed steps for
this DRI method for ASR visual inspection are presented in the appendix.
The following values were used as criteria for the extent of ASR found:
DRI = 0, No ASR
DRI < 500, ASR very unlikely
500 ≤ DRI < 1,000, ASR not likely
1,000 ≤ DRI < 2,000, ASR possible
DRI > 2,000, ASR probable

UCPRC-RR-2015-07 17
Sample Identification Sample 111 Sample 112
Petrographic Feature Weighing Factor Feature Weighed Feature Weighed
Coarse aggregate with cracks 0.25 0 0 0 0
Coarse aggregate with cracks and gel 2.00 0 0 0 0
Coarse aggregate debonded 3.00 0 0 0 0
Reaction rims around aggregate 0.50 0 0 9 4.5
Cement paste with cracks 2.00 0 0 0 0
Cement paste with cracks and gel 4.00 0 0 0 0
Air voids lined or filled with gel 0.50 0 0 0 0
Sum 0 0 9 4.5
Area (cm²) 76.3 112.7
Normalized area (cm²) 0.76 1.13
Damage Rating Index (DRI) 0 399
Area Calculations
Length (in.) 2.81 4.16
Width (in.) 4.21 4.20
Area (in.²) 11.8 17.5
Area (cm²) 76.3 112.7
Figure 3.2: Example of the Damage Rating Index (DRI) worksheet.

18 UCPRC-RR-2015-07
Figure 3.3: Example scans of the cut surfaces of three pavement cores.

UCPRC-RR-2015-07 19
Figure 3.4: Example scans of the cut surfaces of three bridge cores.
20 UCPRC-RR-2015-07
3.3 Results of Visual Inspection of Pavement Cores
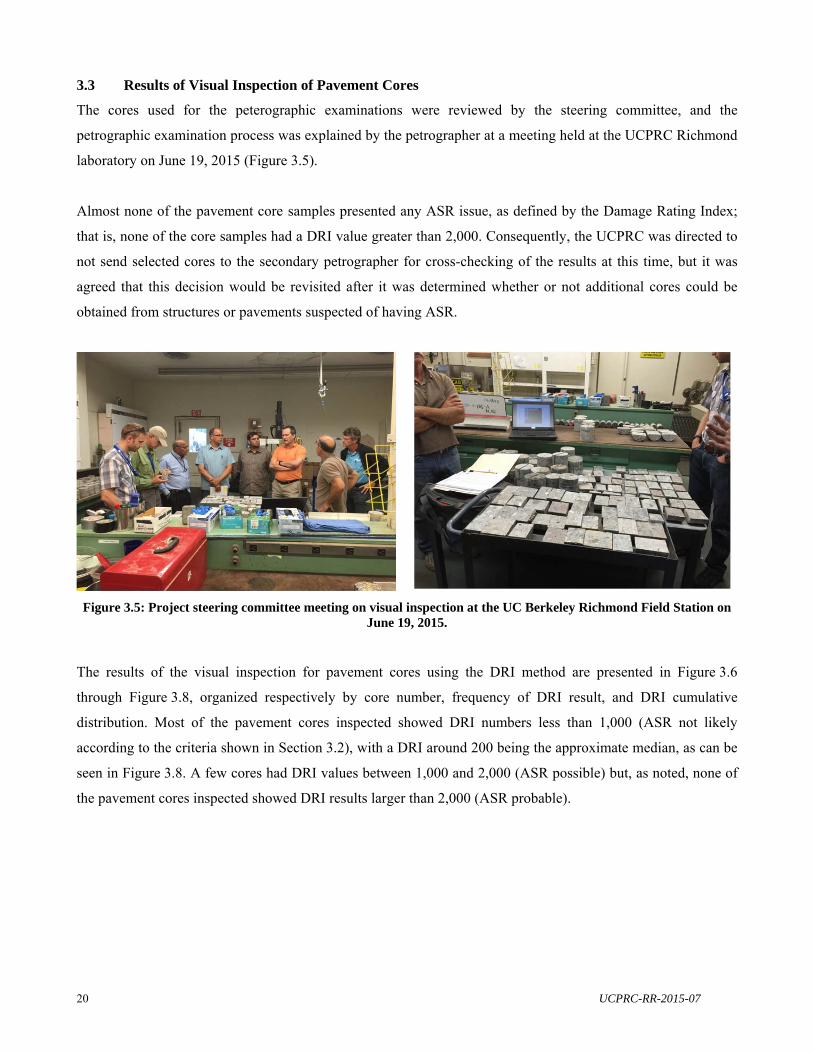
The cores used for the peterographic examinations were reviewed by the steering committee, and the
petrographic examination process was explained by the petrographer at a meeting held at the UCPRC Richmond
laboratory on June 19, 2015 (Figure 3.5).
Almost none of the pavement core samples presented any ASR issue, as defined by the Damage Rating Index;
that is, none of the core samples had a DRI value greater than 2,000. Consequently, the UCPRC was directed to
not send selected cores to the secondary petrographer for cross-checking of the results at this time, but it was
agreed that this decision would be revisited after it was determined whether or not additional cores could be
obtained from structures or pavements suspected of having ASR.
Figure 3.5: Project steering committee meeting on visual inspection at the UC Berkeley Richmond Field Station on June 19, 2015.
The results of the visual inspection for pavement cores using the DRI method are presented in Figure 3.6
through Figure 3.8, organized respectively by core number, frequency of DRI result, and DRI cumulative
distribution. Most of the pavement cores inspected showed DRI numbers less than 1,000 (ASR not likely
according to the criteria shown in Section 3.2), with a DRI around 200 being the approximate median, as can be
seen in Figure 3.8. A few cores had DRI values between 1,000 and 2,000 (ASR possible) but, as noted, none of
the pavement cores inspected showed DRI results larger than 2,000 (ASR probable).

UCPRC-RR-2015-07 21
Figure 3.6: DRI of pavement cores, by core number.
Figure 3.7: DRI of pavement cores, frequency chart.

22 UCPRC-RR-2015-07
Figure 3.8: DRI of pavement cores, cumulative distribution chart.
3.4 Results of Visual Inspection of Bridge Cores
The results of visual inspection for the bridge cores using the DRI method are presented in Figure 3.9 through
Figure 3.11, organized respectively by core number, frequency of DRI result, and DRI cumulative distribution.
As with the pavement cores, most of the bridge cores inspected had DRI results less than 1,000 (ASR not likely,
according to the established criteria), and the median DRI result was approximately 500, as shown in
Figure 3.11. Very few of the bridge cores had DRI results between 1,000 and 2,000 (ASR possible), and none of
them had DRI results greater than 2,000 (ASR probable).
0%
10%
20%
30%
40%
50%
60%
70%
80%
90%
100%
0
10
20
30
40
50
60
70
80
0
3060
90
120
150
180
210
240
270
300
330
360
390
420
450
480
510
540
570
600
630
660
690
720
750
780
810
840
870
900
930
960
990
1020
1050
1080
1110
1140
1170
1200
1230
1260
1290
1320
1350
Cumulative
Frequency
DRI
Histogram, DRI, Pavement Cores
Frequency
Cumulative

UCPRC-RR-2015-07 23
Figure 3.9: DRI of bridge cores, by core number.
Figure 3.10: DRI of bridge cores, frequency chart.

24 UCPRC-RR-2015-07
Figure 3.11: DRI of bridge cores, cumulative distribution chart.
3.5 Comparison of Bridge Core DRI and Year of Construction
The year of construction of each of the bridge cores was compared with the Damage Rating Index for each of
the 259 cores for which a construction year was found in the bridge logs, as shown in Figure 3.12. The data
indicate that there is almost no trend between the ages of the cores, which ranged from 17 to 69 years old at time
of visual inspection, and DRI. This should have been sufficient time for even the youngest cores to begin to
manifest ASR if the reaction was occurring.
There were 26 cores taken from bridges built after 1995, approximately the time when changes in specifications
to reduce the risk of ASR were implemented. There was no apparent difference in DRI values for bridges built
before and after 1995.
0%
10%
20%
30%
40%
50%
60%
70%
80%
90%
100%
0
1
1
2
2
3
3
4
4
50
49
98
147
196
245
294
343
392
441
490
539
588
637
686
735
784
833
882
931
980
1029
1078
1127
1176
1225
1274
1323
1372
1421
1470
1519
1568
1617
1666
Cumulative
Frequency
DRI
Histogram, DRI, Bridge Cores
Frequency
Cumulative %

UCPRC-RR-2015-07 25
Figure 3.12: Damage Rating Index versus year of construction for bridge cores.
3.6 Guidelines for Visual Inspection
One result of performing this visual inspection procedure was the creation of a draft guideline for evaluating
concrete pavement cores for evidence of ASR and ASR-related distresses for future use by Caltrans staff to
determine the need for further, more detailed examinations. A draft version of this guideline, which includes
both a step-by-step description of the inspection process and the selection criteria required to conduct further
detailed examinations, as well as sample photographs showing gradations of ASR distress, appears in the
appendix.
0
200
400
600
800
1,000
1,200
1,400
1,600
1,800
1940 1950 1960 1970 1980 1990 2000 2010
DRI
Year Built (yyyy)

26 UCPRC-RR-2015-07
(This page left blank)

UCPRC-RR-2015-07 27
4. COMPRESSIVE STRENGTH TESTING OF PAVEMENT CORES
4.1 Overview
In Task 3 of this project, 206 of the pavement cores were subjected to compressive strength testing (Figure 4.1)
following ASTM C39/C39M-14a (Standard Test Method for Compressive Strength of Cylindrical Concrete
Specimens) to help assess the condition of the concrete. Low strength due to microcracking is a potential
indicator of ASR damage. The density of the pavement cores used for strength testing was also measured
following ASTM C642-13 (Standard Test Method for Density, Absorption, and Voids in Hardened Concrete) to
help determine whether any low strength values were attributable to low-density aggregate or high voids
contents. The compressive strengths were also compared with those expected for concrete pavement strength
based on data provided by the Caltrans Office of Structural Materials.
Figure 4.1: Pavement cores and strength testing.
The spreadsheet database created for this current project was also updated with results from the DRI, strength,
and density testing.

28 UCPRC-RR-2015-07
4.2 Compressive Strength Testing Method
The length-to-diameter ratio (LDR) of the pavement cores in ASTM C39/C39M was used to adjust the strength
values from cores of different lengths in order to produce approximately comparable values. The LDR values
are presented in Figure 4.2. Most of the LDR values for the pavement cores ranged from 1.0 to 1.2, smaller than
the standard LDR of 2.0. The correction factor curve of LDR for the pavement cores is shown in Figure 4.3,
using a four-step linear interpretation from the LDR correction factor given in ASTM C39/C39M. The density
of the pavement cores for strength testing was measured using the total air mass and the total volume of each
core.
Figure 4.2: Frequency of length-to-diameter ratio (LDR) of pavement cores.
Figure 4.3: Length-to-diameter ratio (LDR) correction factor.

UCPRC-RR-2015-07 29
4.3 Results of Compressive Strength Testing
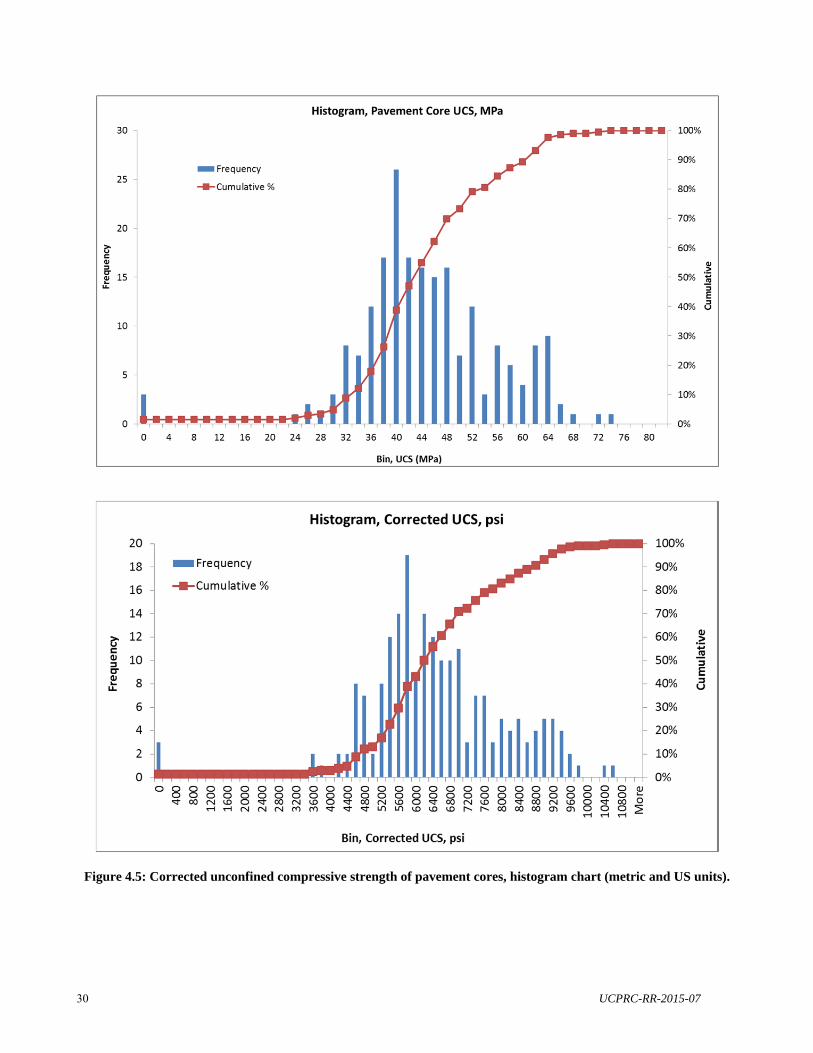
The LDR corrected unconfined compressive strengths (UCS) of the pavement cores are presented in Figure 4.4
and Figure 4.5, plotted by core number and grouped into a histogram, respectively. Most of the pavement cores
tested had UCS results less than 8,700 psi (60 MPa) while a small number had results between 8,700 and
11,600 psi (60 MPa and 80 MPa). None of the pavement cores tested had UCS results greater than 11,600 psi.
The median UCS result was approximately 6,090 psi (42 MPa). These results were considered to be within the
range of long-term strengths expected of PCC pavements by experienced Caltrans materials engineers.
Figure 4.4: Corrected unconfined compressive strength of pavement cores, organized by core number.
0
10
20
30
40
50
60
70
80
0
2000
4000
6000
8000
10000
12000
3.34‐P122‐A
3.34‐P132‐A
3.34‐P54
‐A
3.34‐P68
‐A
3.34‐P104‐A
3.34‐P109‐A
3.34‐P117‐A
3.34‐P127‐A
3.34‐P135‐A
3.34‐P139‐A
3.34‐P143‐A
3.34‐P147‐A
3.34‐P151‐A
3.34‐P155‐A
3.34‐P159‐A
3.34‐P162‐A
3.34‐P166‐A
3.34‐P170‐A
3.34‐P174‐A
3.34‐P179‐A
3.34‐P183‐A
3.34‐P187‐A
3.34‐P191‐A
3.34‐P195‐A
3.34‐P199‐A
3.34‐P203‐A
3.34‐P207‐A
3.34‐P211‐A
3.34‐P215‐A
3.34‐P220‐A
3.34‐P224‐A
3.34‐P228‐A
3.34‐P232‐A
3.34‐P236‐A
3.34‐P240‐A
3.34‐P244‐A
3.34‐P248‐A
3.34‐P252‐A
3.34‐P256‐A
3.34‐P261‐A
3.34‐ P265‐A
3.34‐P49
‐A
3.34‐P56
‐A
3.34‐P64
‐A
3.34‐P69
‐A
3.34‐P73
‐A
3.34‐P77
‐A
3.34‐P81
‐A
3.34‐P86
‐A
3.34‐P90
‐A
3.34‐P94
‐A
3.34‐P98
‐A
UCS (M
Pa)
UCS (psi)
Sample ID
Corrected Compressive Strength
30 UCPRC-RR-2015-07
Figure 4.5: Corrected unconfined compressive strength of pavement cores, histogram chart (metric and US units).

UCPRC-RR-2015-07 31
4.4 Results of Density Measurements
The densities (air mass/volume) of the pavement cores tested are presented in Figure 4.6 with histogram plots.
Most of the pavement cores tested had densities less than 156 pcf (2,500 kg/m3) and the median UCS result was
approximately 147 pcf (2,350 kg/m3). Density is primarily controlled by the density of the aggregates used in the
concrete. These results were considered to be within the range of densities expected of PCC pavements by
experienced Caltrans materials engineers.
Figure 4.6: Density of pavement cores, histogram chart (metric and US units).

32 UCPRC-RR-2015-07
4.5 Compressive Strength versus Density
Comparison of the results of the UCS and density tests for the pavement cores are presented in Figure 4.7. It can
be seen that there is no significant correlation between the UCS values and densities of the pavement cores
tested, although the UCS strengths generally increase with the density.
Figure 4.7: Strength versus density of pavement cores (metric and US units).
y = 0.04x ‐ 54.54R² = 0.09
0
10
20
30
40
50
60
70
80
2000 2100 2200 2300 2400 2500 2600
UCS (M
Pa)
Density (kg/m3)
y = 98.11x ‐ 7,909.96R² = 0.09
2000
3000
4000
5000
6000
7000
8000
9000
10000
11000
120 125 130 135 140 145 150 155 160 165
UCS (psi)
Density (pcf)
Density = Air Mass/Volume
Density = Air Mass/Volume
UCPRC-RR-2015-07 33
5. SUMMARY, CONCLUSIONS, AND RECOMMENDED NEXT TASKS
5.1 Summary
This report summarizes the creation of an inventory for cores taken from bridges and pavements as part of
previous projects, the results of visual inspection and strength testing to identify the potential presence of ASR,
and the development of a draft approach for Caltrans staff to evaluate the potential for ASR in bridges and
pavements. A spreadsheet database was prepared for storing inventory data for 265 pavement cores and 311
bridge cores. Most of the bridge cores were from the San Francisco Bay Area while the pavement cores were
collected from across the state. Visual inspection was performed on 259 of the pavement cores (including
multiple specimens cut from some of the pavement cores) and 80 bridge cores (those with lengths greater than
3 inches) using the Damage Rating Index (DRI) method.
A draft guideline for investigation of ASR for future use by Caltrans staff was prepared using the DRI method
adopted for this project.
Unconfined compressive strength (UCS) and density tests were performed on portions of 206 cores. The density
and strength test results were compared to see if there was a correlation, and the results were also compared with
values expected by experienced Caltrans materials engineers.
The second objective, to evaluate the effects on ASR of specification changes that occurred around 1995, could
not be completed because of the very low detection of ASR in all of the cores examined, regardless of whether
they were constructed before or after 1995.
5.2 Conclusions
Among the results from the testing were the following:
Most of the pavement cores inspected showed Damage Rating Index (DRI) for Concrete values of less
than 1,000 (ASR not likely, according to the criteria shown in Section 3.2), with a DRI value of roughly
200 being the approximate median. A few cores had DRI results between 1,000 and 2,000 (ASR
possible). None of the pavement cores inspected showed DRI results larger than 2,000 (ASR probable).
Most of the bridge cores inspected had DRI results less than 1,000 (ASR not likely, according to the
criteria listed previously), and the median DRI result was approximately 500. Very few of the bridge
cores had DRI results between 1,000 and 2,000 (ASR possible), and none of them had DRI results
greater than 2,000 (ASR probable).

34 UCPRC-RR-2015-07
As-built data for the bridge cores were obtained for 259 of the 311 bridge cores. All of the cores came
from bridges that were built before the year 2000. Comparison with the year of construction and the
DRI data showed almost no trend between the age of the cores and DRI, with bridge ages ranging from
17 to 69 years old at time of visual inspection. Even the youngest cores should have had enough time to
begin to manifest ASR if the reaction was occurring. There was no apparent difference in DRI values
for the 46 cores taken from bridges built after 1995, when changes to specifications were made,
compared with bridges built before 1995.
Approximately 90 percent of the unconfined compressive strength (UCS) results were between 4,400
and 8,800 psi (30 and 61 MPa) and the median value was approximately 6,090 psi (42 MPa). These
results were considered to be within the range of long-term strengths expected of PCC pavements by
experienced Caltrans materials engineers.
Approximately 90 percent of the density results were between 140 and 155 pcf (2,243 and 2,483 kg/m3)
and the median value was approximately 147 pcf (2,350 kg/m3). These results were considered to be
within the range of densities expected of PCC pavements by experienced Caltrans materials engineers.
There was no significant correlation found between the UCS and density of the pavement cores tested,
although UCS strength generally increased with density.
A draft guideline was developed for the visual inspection of concrete cores to identify signs of potential
ASR-related distresses; this guideline can to be used in the future by Caltrans staff to determine the need
for further, more detailed examinations. The guideline describes step-by-step inspection procedures and
selection criteria for further detailed examinations, and uses photographic examples that show different
severity levels of potential ASR distresses.
An integrated spreadsheet database was prepared for storing all relevant data for all cores, including test
results from all tasks (DRI, UCS, and density).
5.3 Next Steps
Based on the results of the study, which showed very low detection of ASR, it is recommended that no further
work be performed on this project, except that Caltrans may choose to select a few locations suspected of having
ASR for sampling and evaluation.

UCPRC-RR-2015-07 35
REFERENCES
1. FHWA-HIF-09-004. Fournier, B., M.-A. Berube, and K.J. Folliard. Report on the Diagnosis, Prognosis,
and Mitigation of Alkali-Silica Reaction (ASR) in Transportation Structures, Federal Highway
Administration (FHWA), January 2010.
2. FHWA-HIF-09-001. Thomas, M.D.A., B. Fournier, and K.J. Folliard. Report on Determining the
Reactivity of Concrete Aggregates and Selecting Appropriate Measures for Preventing Deleterious
Expansion in New Concrete Construction, Federal Highway Administration (FHWA), April 2008.
3. FHWA-RD-01-164. Van Dam, T.J., L.L. Sutter, K.D. Smith, M.J. Wade, and K.R. Peterson. Guidelines for
Detection, Analysis, and Treatment of Materials-related Distress in Concrete Pavements – Volume 2:
Appendix B: Laboratory Methods, Federal Highway Administration (FHWA), August 2002.

36 UCPRC-RR-2015-07
APPENDIX
A. Draft Test Procedures for Screening And Examining Concrete Core
Samples for Alkali-Silica Reactivity
Procedures for ASR Visual Inspection, Draft
The following test methods shall be used:
ASTM C856, “Standard Practice for the Petrographic Examination of Hardened Concrete,” including
descriptive rating of Alkali-Silica Reactivity (ASR) using the Damage Rating Index for Concrete (DRI)
ASTM C294, “Standard Descriptive Nomenclature for Concrete Aggregates”
The procedures used for screening and examining concrete for alkali-silica reactivity (ASR) are as follows:
Field Survey and Taking and Processing of Cores
In the field, the concrete structure or structures suspected of having alkali-silica reactivity (ASR) should be
surveyed to determine the extent of the potential damage. Surveys should include photographic documentation
of the structures and any deleterious features, such as cracking, efflorescence, and exudations. Surveys should
also include layouts of the steel reinforcement and detailed mapping of the crack pattern. Concrete cores should
be photographed in the field, examined for unusual features, cataloged, and categorized. An example of the
procedures and decision-making criteria for the petrographic examination and Damage Index Rating is shown in
Figure A.1.
Three cores with a diameter of 4 inches, or with a minimum diameter of 3 inches if 4 inches is too large, should
be taken from the structure showing possible ASR cracking and sent to a laboratory for visual examination. This
examination should be conducted on whole (uncut) cores, saw-cut longitudinally, with overlapping cross-
sectional slices. Also, any loose or water-soluble materials, either from the field before coring or from the cores
delivered to the lab, should be taken to the lab and held for later analysis. All samples (cores and other
materials) should be photographed and logged when delivered to the laboratory.
Measuring Damage Rating Index
The lapped slice faces should be measured to determine the area of examination and the area of the face should
be visually examined to determine the number of physical features typically associated with ASR. These
features include coarse aggregate with cracks, coarse aggregate with cracks filled with gel, debonded coarse
aggregate, aggregate with reaction rims, cement (cementitious) paste with cracks, paste with cracks filled with

UCPRC-RR-2015-07 37
gel, and voids lined or filled with gel. Each feature should be given a weighing factor based on its association to
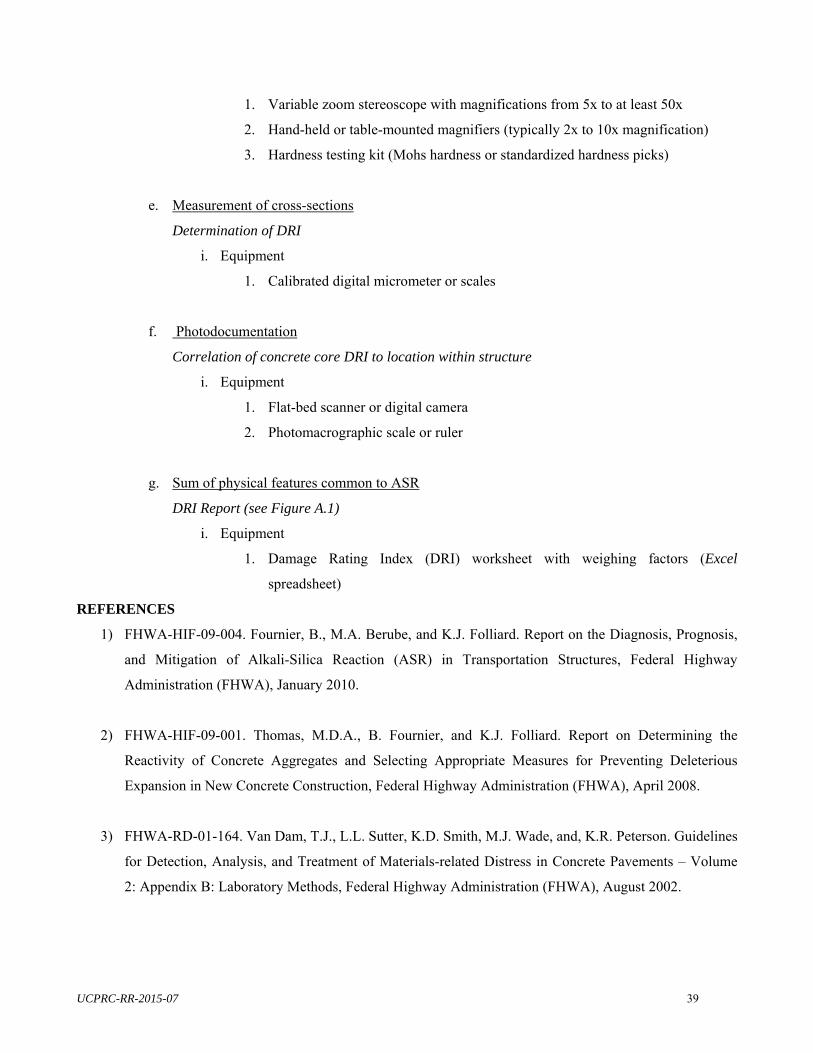
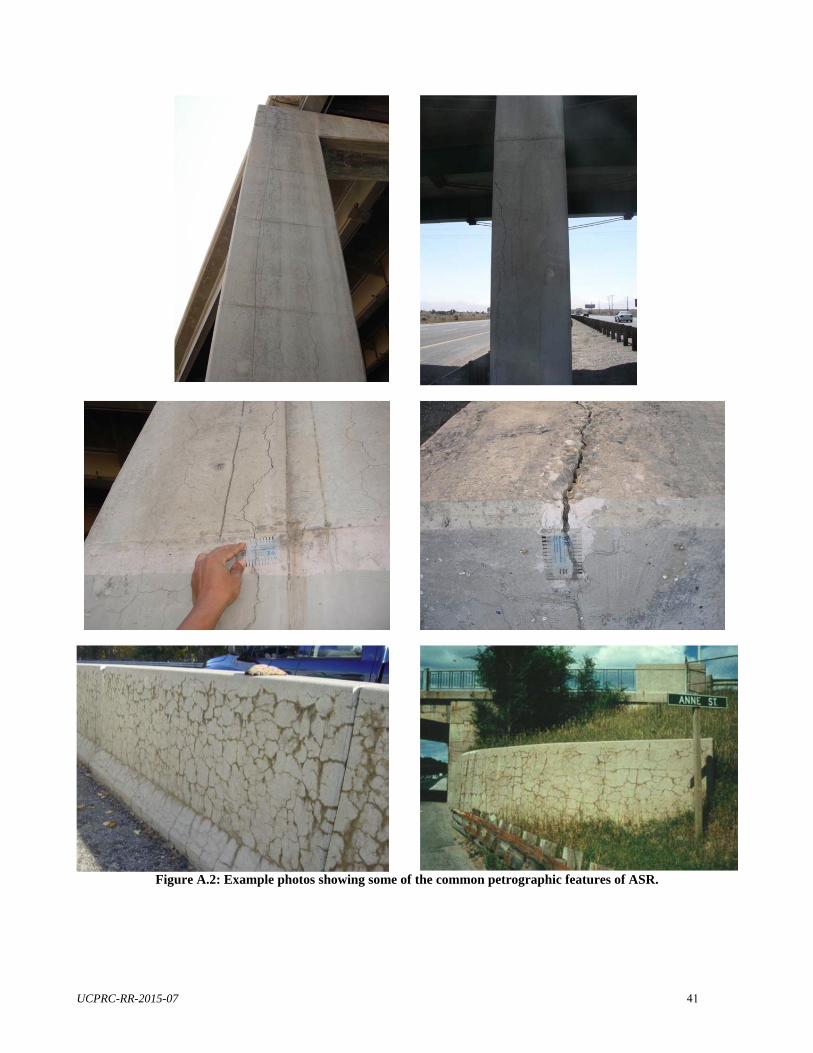
ASR. Photos in Figure A.2 show some of the common petrographic features of ASR. The weighted features
should summed and normalized to the area examined, which will give a Damage Rating Index (DRI) value for
the core slice. Additional information should be gathered regarding the presence of reacted aggregate (but not
showing signs of distress), the presence of secondary mineral deposits other than ASR gel, and the physical
characteristics of the concrete, such as consolidation and segregation.
Cores with DRI values greater than 1,500 should be separated and prepared for further examination utilizing
polarized light microscopy (PLM) techniques, including thin-section analysis, powder grain mount analysis, and
stereoscopic examinations (reflected light) at high magnifications. Analysis of accessory materials, including
efflorescence, exudations, loose aggregate and loose altered paste and mortar include thin-section analysis of
vacuum-impregnated, epoxy-mounted samples, X-Ray Diffraction (XRD) analysis, Fourier Transform Infrared
Spectroscopy (FTIR), and Scanning Electron Microscopy with Energy Dispersive X-ray Spectroscopy
(SEM/EDX).
The following is an outline of the screening and examining procedures, including specialized or recommended
equipment necessary to perform the tasks (accessory equipment and consumables are included):
1) Sampling from Structure
a. Photodocumentation and identification of structure
Location of steel reinforcement, structure geometry, crack pattern
i. Equipment
1. Digital camera
2. Tape measure, measuring wheel, or other distance measuring devices
b. Collection of accessory materials
Identification of ASR reaction products
i. Equipment
1. Collection containers
2. Picks, brushes, and various collection handtools
3. Digital camera

38 UCPRC-RR-2015-07
c. Core drilling
Recovery of concrete core samples
i. Equipment
1. Coring rig
2. Diamond-bonded coring drill bits (preferred sizes are 3 inch and 4 inch diameter)
3. Gas-powered electrical generator
2) Examination of Concrete Core Longitudinal Cross-Sections
a. Photodocumentation and logging of core samples
Correlation of core samples to location within structure(s)
i. Equipment
1. Digital camera
2. Photomacrographic scales or rulers
b. Collection of accessory materials (loose materials, mineral or mineraloid deposits, or water-
soluble deposits of question)
Identification of ASR reaction products
i. Equipment
1. Dental picks
2. Collection containers
c. Longitudinal cross sections with smooth cut and lapped surfaces
Determination of DRI
i. Equipment
1. Water-cooled concrete saw with continuous-rim diamond-bonded saw blade
(minimum 14" diameter blade)
2. Trim saw or tile saw
3. Polishing/lapping wheel (capable of lapping 4 inch by 6 inch cross section with
either loose grit or diamond-bonded pads)
d. Examination of lapped cross sections at low magnification
Determination of DRI
i. Equipment
UCPRC-RR-2015-07 39
1. Variable zoom stereoscope with magnifications from 5x to at least 50x
2. Hand-held or table-mounted magnifiers (typically 2x to 10x magnification)
3. Hardness testing kit (Mohs hardness or standardized hardness picks)
e. Measurement of cross-sections
Determination of DRI
i. Equipment
1. Calibrated digital micrometer or scales
f. Photodocumentation
Correlation of concrete core DRI to location within structure
i. Equipment
1. Flat-bed scanner or digital camera
2. Photomacrographic scale or ruler
g. Sum of physical features common to ASR
DRI Report (see Figure A.1)
i. Equipment
1. Damage Rating Index (DRI) worksheet with weighing factors (Excel
spreadsheet)
REFERENCES
1) FHWA-HIF-09-004. Fournier, B., M.A. Berube, and K.J. Folliard. Report on the Diagnosis, Prognosis,
and Mitigation of Alkali-Silica Reaction (ASR) in Transportation Structures, Federal Highway
Administration (FHWA), January 2010.
2) FHWA-HIF-09-001. Thomas, M.D.A., B. Fournier, and K.J. Folliard. Report on Determining the
Reactivity of Concrete Aggregates and Selecting Appropriate Measures for Preventing Deleterious
Expansion in New Concrete Construction, Federal Highway Administration (FHWA), April 2008.
3) FHWA-RD-01-164. Van Dam, T.J., L.L. Sutter, K.D. Smith, M.J. Wade, and, K.R. Peterson. Guidelines
for Detection, Analysis, and Treatment of Materials-related Distress in Concrete Pavements – Volume
2: Appendix B: Laboratory Methods, Federal Highway Administration (FHWA), August 2002.

40 UCPRC-RR-2015-07
Sample Identification Sample 1 Sample 2
Petrographic Feature Weighing
Factor Feature Weighed Feature Weighed
Coarse aggregate with cracks 0.25 0 0 0 0
Coarse aggregate with cracks and gel 2.00 0 0 0 0
Coarse aggregate debonded 3.00 0 0 0 0
Reaction rims around aggregate 0.50 0 0 9 4.5
Cement paste with cracks 2.00 0 0 0 0
Cement paste with cracks and gel 4.00 0 0 0 0
Air voids lined or filled with gel 0.50 0 0 0 0
Sum 0 0 9 4.5
Area (cm²) 76.3 112.7
Normalized Area (cm²) 0.76 1.13
Damage Rating Index (DRI) 0 399
Area Calculations
Length (in.) 2.81 4.16
Width (in.) 4.21 4.20
Area (in.²) 11.8 17.5
Area (cm²) 76.3 112.7
The criteria used for ASR for this study were:
DRI = 0, No ASR;
DRI < 500, ASR very unlikely;
500 ≤ DRI < 1000, ASR not likely;
1000 ≤ DRI < 2000, ASR possible;
DRI > 2000, ASR probable.
Figure A.1: Example of the procedures and decision making criteria for the petrographic examination and Damage Index Rating.
UCPRC-RR-2015-07 41
Figure A.2: Example photos showing some of the common petrographic features of ASR.

42 UCPRC-RR-2015-07
Figure A.2: Example photos showing some of the common petrographic features of ASR (cont’d).
UCPRC-RR-2015-07 43
Figure A.2. Example photos showing some of the common petrographic features of ASR (cont’d). (Some of the photos are from the reference: Thomas, M.D.A., B. Fournier, and K.J. Folliard. Alkali-aggregate
Reactivity (AAR) Facts Book. No. FHWA-HIF-13-019. 2013.)
![Constructiegedrag van door ASR aangetaste viaducten, … · 2017-10-24 · December 6, 2015 2. ASR-gel [1] uitbloeiingen ASR-gel December 6, 2015 3 Typisch scheurenpatroon ASR [1]](https://static.fdocuments.us/doc/165x107/5b317ef97f8b9a744a8bd127/constructiegedrag-van-door-asr-aangetaste-viaducten-2017-10-24-december.jpg)