Author’s Accepted Manuscript -...
29
Author’s Accepted Manuscript Direct Design Method and Design Diagrams for Reinforced Concrete Columns and Shear walls Mustafa Mahamid, Majid Houshiar PII: S2352-7102(17)30645-9 DOI: https://doi.org/10.1016/j.jobe.2018.02.015 Reference: JOBE418 To appear in: Journal of Building Engineering Received date: 23 October 2017 Revised date: 20 February 2018 Accepted date: 21 February 2018 Cite this article as: Mustafa Mahamid and Majid Houshiar, Direct Design Method and Design Diagrams for Reinforced Concrete Columns and Shear w a l l s , Journal of Building Engineering, https://doi.org/10.1016/j.jobe.2018.02.015 This is a PDF file of an unedited manuscript that has been accepted for publication. As a service to our customers we are providing this early version of the manuscript. The manuscript will undergo copyediting, typesetting, and review of the resulting galley proof before it is published in its final citable form. Please note that during the production process errors may be discovered which could affect the content, and all legal disclaimers that apply to the journal pertain. www.elsevier.com/locate/jobe
Transcript of Author’s Accepted Manuscript -...

Author’s Accepted Manuscript
Direct Design Method and Design Diagrams forReinforced Concrete Columns and Shear walls
Mustafa Mahamid, Majid Houshiar
PII: S2352-7102(17)30645-9DOI: https://doi.org/10.1016/j.jobe.2018.02.015Reference: JOBE418
To appear in: Journal of Building Engineering
Received date: 23 October 2017Revised date: 20 February 2018Accepted date: 21 February 2018
Cite this article as: Mustafa Mahamid and Majid Houshiar, Direct DesignMethod and Design Diagrams for Reinforced Concrete Columns and Shearw a l l s , Journal of Building Engineering,https://doi.org/10.1016/j.jobe.2018.02.015
This is a PDF file of an unedited manuscript that has been accepted forpublication. As a service to our customers we are providing this early version ofthe manuscript. The manuscript will undergo copyediting, typesetting, andreview of the resulting galley proof before it is published in its final citable form.Please note that during the production process errors may be discovered whichcould affect the content, and all legal disclaimers that apply to the journal pertain.
www.elsevier.com/locate/jobe

1
Direct Design Method and Design Diagrams for
Reinforced Concrete Columns and Shear walls
Mustafa Mahamid and Majid Houshiar
Mustafa Mahamid: University of Illinois at Chicago
Majid Houshiar: StructurePoint, LLC
Mustafa Mahamid ACI member, currently a Clinical Associate Professor at the University
of Illinois at Chicago and a structural Engineering consultant for multiple structural engineering
firms. He serves ACI committees 314 (Simplified Design), 441 (Columns), 352 (Joints), and 315
(Detailing) and chairs 421 (slabs). His interests are concrete design and seismic behavior of
structures. He is a Fellow of ASCE, a Fellow of SEI, licensed structural engineer (SE) and
professional engineer (PE & P.Eng.).
Majid Houshiar is a senior structural engineer at STRUCTUREPOINT, Chicago. He received
his BS from Isfahan university of technology, Iran; MS from University of Illinois at Chicago.
His interests include design of industrial and environmental structures and developing structural
engineering software.
ABSTRACT
Design of reinforced concrete columns and shear walls is an iterative process. The capacity
of an assumed section is checked using interaction diagrams and the procedure continues until a
satisfactory section is found. This study introduces a “Direct Design” method and “Design
Diagrams”. The direct design method is an analytical approach by which the required area of
reinforcement for short reinforced concrete columns or shear walls is determined directly without
using an interaction diagram. This method provides a fitted solution for a reinforced concrete
section; the capacity of the section is equal to the demand from the applied loads and moments.
For each column or shear wall, many fitted sections with different sizes and bar arrangements
could be employed. A design diagram shows all possible fitted sections for a particular column
or shear wall. This study provides an algorithm for making design diagrams.

2
Keywords: direct design; design diagram; reinforced concrete column; shear wall
INTRODUCTION
The accepted approach for design of concrete columns under combined axial load and
bending moments is using the Short Column Interaction Diagrams along principal axes of
symmetry1. Interaction diagrams for columns are generally computed by assuming a series of
strain distributions, each corresponding to a particular point on the interaction diagram, and
computing the corresponding values of P and M 2
.
The design procedure starts by assuming a column cross section and checking its capacity
using the corresponding interaction diagram. If the selected section capacity does not satisfy
applied load and moments, a new section is assumed. The procedure continues until an
appropriate section is found. The column section founded by conventional approach is not
necessarily a fitted section. Finding a fitted section, which its capacity is exactly equal to applied
load and moments requires more trial-and-error. In addition, for any set of applied axial load and
moments, it is possible to find several fitted sections with different section sizes, bar
arrangements, and bar areas. The main objective of this paper is to present a general procedure
by which all fitted solutions for a column or shear wall are found and presented on a design
diagram.
This paper also proposes the direct design method for designing concrete columns. A system
of equations is prepared based on the section shape and bar arrangement. By solving this system
of equations, the required area of reinforcement bars is determined directly without using
diagrams or tables. The resulting solution represents a fitted section since its capacity is equal to
the applied load and moments. The provided procedure is not limited to any cross section shape
or any particular stress-strain diagram for concrete and reinforcement.
RESEARCH SIGNIFICANCE
An efficient and straightforward method for designing reinforced concrete columns and shear
walls is presented in this paper. This method creates a design diagram for a short column or shear
wall based on the applied load and moments. The provided design diagram shows all possible
fitted sections for the column. Design diagram is a practical tool by which design of column

3
would be much faster, easier, and efficient, since the designers have all practical fitted solutions
in one diagram.
PREVIOUS RESEARCHES ON RC COLUMN DESIGN
The design of reinforced concrete columns has been investigated by numerous researchers.
Whitney3, introduced an equivalent compression zone. Chu and Pabarcius
4, studied the ultimate
strength of biaxially loaded reinforced concrete columns. Bresler5, developed a reciprocal
interaction equation used in ACI 318 commentary. Fleming and Werner6, developed design aids
for columns subjected to biaxial bending. Hsu and Mirza7, studied acceptable strength for biaxial
bending and compression. Marin8, developed design aids for L-Shaped reinforced concrete
columns. Hsu9, presented theoretical and experimental results for biaxially loaded L-Shaped
reinforced concrete columns. Hsu10
, proposed a design aid relationship considering the nominal
axial load and balanced axial load ratio. Hsu11
, reported T-Shaped column under biaxial bending
and axial compression.
Many of above researchers tried to develop simple design relationships or design aids.
Availability of powerful and inexpensive personal computers, changed the type and direction of
reinforced concrete column researches. Dinsmore12
, developed a program for column analysis
with a programmable calculator. Brondum-Nielsen13
and Yen14
, introduced methods for flexural
capacity of cracked arbitrary concrete sections under axial load combined with biaxial bending.
Barzegar and Erasito15
, developed interactive spreadsheets for concrete sections analysis under
biaxial bending. Zenon16
et al., introduced a method for designing reinforced concrete short-tied
columns using the optimization technique. Rodriguez and Dario Aristizabal-Ochoa17
, developed
a computer algorithm for biaxial interaction diagrams for short RC column of any cross section.
Wang-Hong18
, Used the reciprocal load method for evaluating the capacity of reinforced
concrete columns of high strength concrete. Bonet19
et al., proposed an analytical approach for
calculating failure surfaces in rectangular reinforced concrete column cross sections with
symmetrical reinforcement. Cedolin20
et al., developed an approximate analytical solution of the
failure envelope of rectangular reinforced concrete columns. Paultre21
et al., presented new
equations for design of confinement reinforcement for rectangular and circular columns.
Rodrigues22
et al., studied the behavior of reinforced concrete column under biaxial cyclic
4
loading. Lequesne-Pincheira23
, Proposed revisions to the strength reduction factor for axially
loaded members.
ACCEPTED COLUMN DESIGN PROCEDURE
The widely accepted approaches for design of RC column could be classified as follow:
Uniaxial interaction diagram
An “Interaction diagram” can be generated by plotting the design axial load strength Pn
against the corresponding design moment strength Mn; this diagram defines the “usable”
strength of a section at different eccentricities of the load24
. Any combination of loading that falls
inside the curve is satisfactory, whereas any combination falling outside the curve represents
failure, see Fig. 4.
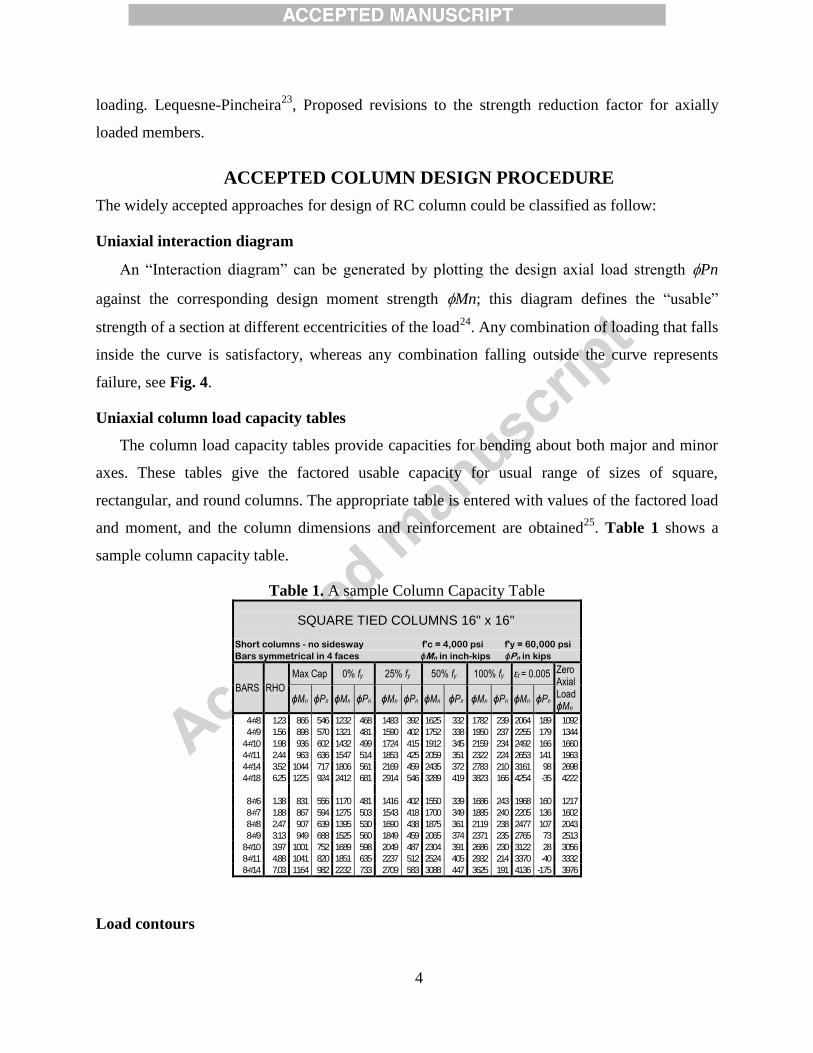
Uniaxial column load capacity tables
The column load capacity tables provide capacities for bending about both major and minor
axes. These tables give the factored usable capacity for usual range of sizes of square,
rectangular, and round columns. The appropriate table is entered with values of the factored load
and moment, and the column dimensions and reinforcement are obtained25
. Table 1 shows a
sample column capacity table.
Table 1. A sample Column Capacity Table
SQUARE TIED COLUMNS 16" x 16"
Short columns - no sidesway f'c = 4,000 psi f'y = 60,000 psi
Bars symmetrical in 4 faces ɸMn in inch-kips ɸPn in kips
BARS RHO
Max Cap 0% fy 25% fy 50% fy 100% fy εt = 0.005 Zero Axial Load ɸMn
ɸMn ɸPn ɸMn ɸPn ɸMn ɸPn ɸMn ɸPn ɸMn ɸPn ɸMn ɸPn
4-#8 1.23 866 546 1232 468 1483 392 1625 332 1782 239 2064 189 1092
4-#9 1.56 898 570 1321 481 1590 402 1752 338 1950 237 2255 179 1344
4-#10 1.98 936 602 1432 499 1724 415 1912 345 2159 234 2492 166 1660
4-#11 2.44 963 636 1547 514 1853 425 2059 351 2322 224 2653 141 1963
4-#14 3.52 1044 717 1806 561 2169 459 2435 372 2783 210 3161 98 2698
4-#18 6.25 1225 924 2412 681 2914 546 3289 419 3823 166 4254 -35 4222
8-#6 1.38 831 556 1170 481 1416 402 1550 339 1686 243 1968 160 1217
8-#7 1.88 867 594 1275 503 1543 418 1700 349 1885 240 2205 136 1602
8-#8 2.47 907 639 1395 530 1690 438 1875 361 2119 238 2477 107 2043
8-#9 3.13 949 688 1525 560 1849 459 2065 374 2371 235 2765 73 2513
8-#10 3.97 1001 752 1689 598 2049 487 2304 391 2686 230 3122 28 3056
8-#11 4.88 1041 820 1851 635 2237 512 2524 405 2932 214 3370 -40 3332
8-#14 7.03 1164 982 2232 733 2709 583 3088 447 3625 191 4136 -175 3976
Load contours

5
In this method, the failure surface is approximated by a family of curves corresponding to
constant values of Pn. These curves, may be regarded as “load contours”.
3D interaction diagram
A uniaxial interaction diagram defines the load-moment strength along a single plane of a
section under an axial load P and a uniaxial moment M. The biaxial bending resistance of an
axially loaded column can be presented schematically as a surface formed by a series of uniaxial
interaction curves drawn radially from the P axis. Fig. 1 shows a biaxial interaction surface.
Fig. 1. Biaxial Interaction Surface
Computer programs
Some of the available computer programs for research and practice are listed in this section.
spColumn (StructurePoint) is a software for the design and investigation of reinforced concrete
sections subjected to axial and flexural forces. The section can be rectangular, round or irregular,
with any reinforcement layout or pattern1. CSiCOL (CSi) is a software package used for analysis
and design of columns. The program can carry out the design of reinforced concrete, or
composite cross-section26
. Response 2000 (Bentz et al.) is a sectional analysis program that
calculates the strength and ductility of a reinforced concrete cross-section subjected to shear,
moment, and axial load based on the modified compression field theory27
. OpenSees (Fenves et
al.) the open system for earthquake engineering simulation, is an object-oriented, open source

6
software framework. It allows users to create finite element computer applications for simulating
the response of structural systems in element, section, and fiber levels28
. BIAX (Wallace et al.) is
a general-purpose computer program to evaluate uniaxial and biaxial strength and deformation of
reinforced concrete sections. The program can be used to compute strength or moment-curvature
relations for monotonic loading29
.
PROBLEM STATEMENT
Design of reinforced concrete columns and shear walls is a trial-and-error procedure. If the
factored loads and moments are known and it is necessary to select a cross section to resist them,
the procedure is referred to as design or proportioning. A design problem is solved by guessing a
section, analyzing whether it will be satisfactory, revising the section, and reanalyzing it30
. The
analysis portion of the problem for column section design is mostly carried out via interaction
diagrams. These diagrams are the result of analyzing the cross section for assumed strain
distributions. Fig. 2 shows a sample interaction diagram and some of the assumed strain
distributions used to create the interaction diagram. The corresponding point for each assumed
strain distribution is shown on the interaction diagram
Fig. 2. Sample interaction diagram
The traditional design procedure is time consuming and does not necessarily lead to a fitted
section. For example, assume that it is required to select a cross section for a short square
reinforced concrete column subjected to the following factored load and moment:
: Applied axial load.
ØP
n
ØMn1
2
3
4
5
cu
12345
Interaction diagram Strain distribution
Neu
tral
Axis
0
7
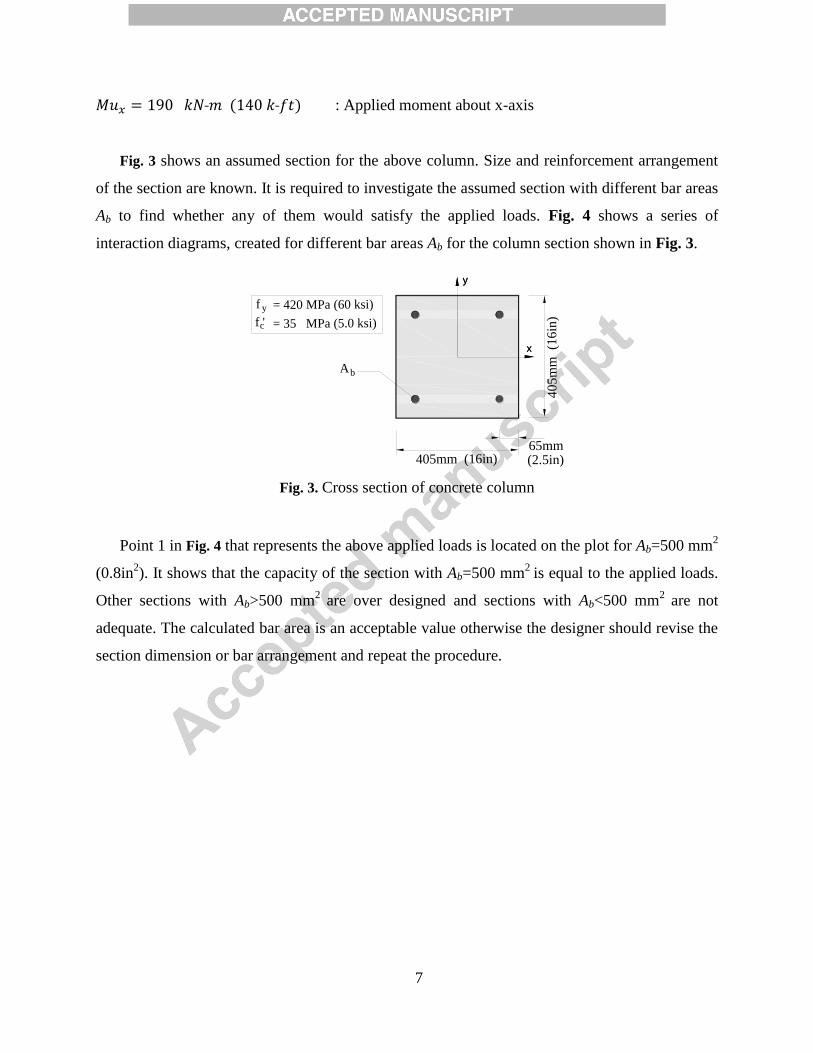
: Applied moment about x-axis
Fig. 3 shows an assumed section for the above column. Size and reinforcement arrangement
of the section are known. It is required to investigate the assumed section with different bar areas
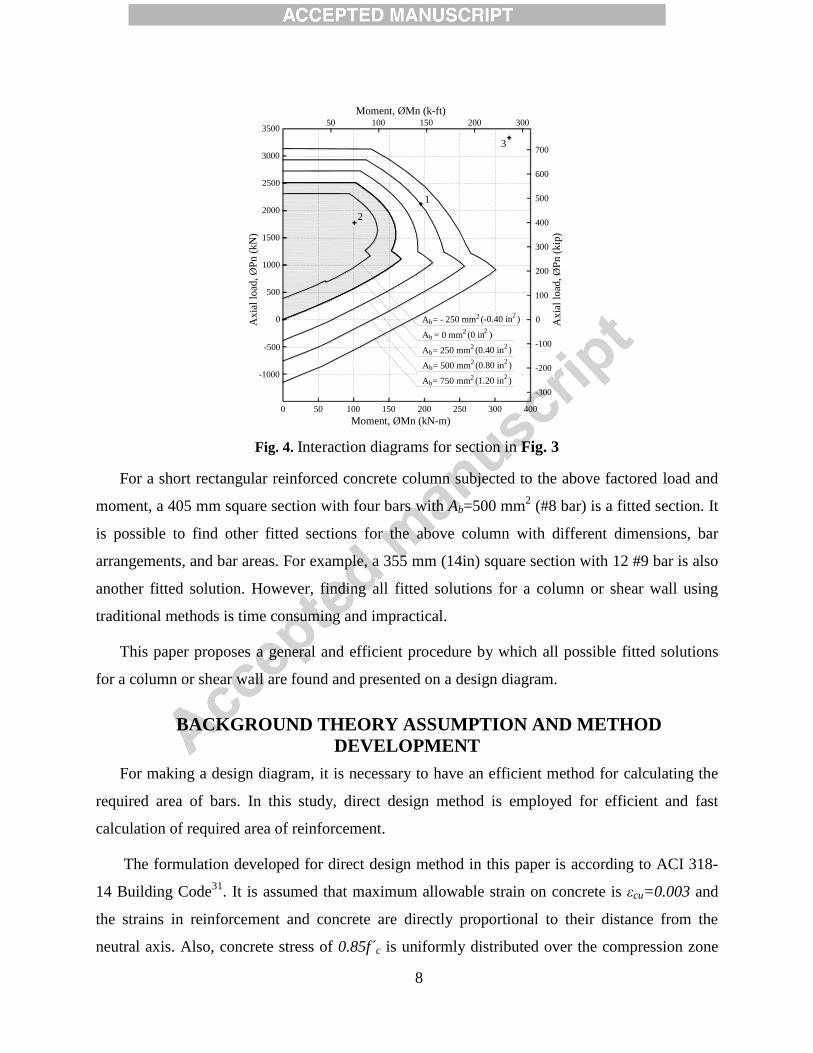
Ab to find whether any of them would satisfy the applied loads. Fig. 4 shows a series of
interaction diagrams, created for different bar areas Ab for the column section shown in Fig. 3.
Fig. 3. Cross section of concrete column
Point 1 in Fig. 4 that represents the above applied loads is located on the plot for Ab=500 mm2
(0.8in2). It shows that the capacity of the section with Ab=500 mm
2 is equal to the applied loads.
Other sections with Ab>500 mm2
are over designed and sections with Ab<500 mm2
are not
adequate. The calculated bar area is an acceptable value otherwise the designer should revise the
section dimension or bar arrangement and repeat the procedure.
f '
405mm (16in)
y
= 35 MPa (5.0 ksi)
f = 420 MPa (60 ksi)
c
(2.5in)
x
65mm
yy
x
Ab
40
5m
m
(16in
)
8
Fig. 4. Interaction diagrams for section in Fig. 3
For a short rectangular reinforced concrete column subjected to the above factored load and
moment, a 405 mm square section with four bars with Ab=500 mm2 (#8 bar) is a fitted section. It
is possible to find other fitted sections for the above column with different dimensions, bar
arrangements, and bar areas. For example, a 355 mm (14in) square section with 12 #9 bar is also
another fitted solution. However, finding all fitted solutions for a column or shear wall using
traditional methods is time consuming and impractical.
This paper proposes a general and efficient procedure by which all possible fitted solutions
for a column or shear wall are found and presented on a design diagram.
BACKGROUND THEORY ASSUMPTION AND METHOD
DEVELOPMENT
For making a design diagram, it is necessary to have an efficient method for calculating the
required area of bars. In this study, direct design method is employed for efficient and fast
calculation of required area of reinforcement.
The formulation developed for direct design method in this paper is according to ACI 318-
14 Building Code31
. It is assumed that maximum allowable strain on concrete is εcu=0.003 and
the strains in reinforcement and concrete are directly proportional to their distance from the
neutral axis. Also, concrete stress of 0.85f´c is uniformly distributed over the compression zone
1
700
600
500
400
300
200
100500
0
1000
1500
2000
2500
3000
3500
-500
-1000
0
-100
-200
50 100 150 200
50 100 150 200 250 3000 400
Ax
ial
load
, Ø
Pn
(k
N)
Moment, ØMn (kN-m)
-300
300
Ax
ial
load
, Ø
Pn
(k
ip)
Moment, ØMn (k-ft)
2
3
Ab= 750 mm (1.20 in )2 2
Ab= 500 mm (0.80 in )2 2
Ab= 250 mm (0.40 in )2 2
Ab = 0 mm (0 in )2 2
Ab= - 250 mm (-0.40 in )2 2

9
bounded by the cross section and a straight line parallel to the neutral axis at a distance a = β1c
from the fiber of maximum compressive strain, where c is distance from the neutral axis to the
fiber of maximum compressive strain (see Fig. 5). Reinforcement is assumed elastic-perfectly
plastic. However, this procedure allows the use of any stress-strain diagram for both the concrete
and the reinforcement. The allowable area of longitudinal reinforcement for non-composite
compression members is considered not less than 0.01Ag or more than 0.08Ag.
Fig. 5. Strain and stress distribution according to ACI 318
Consider the general cross section in Fig. 6. The coordinate system is referred to the centroid
of the concrete section. The location of neutral axis is defined by variables c, θ. Where θ is the
angle of neutral axis with the x-axis.
Fig. 6. A generic column cross section
Contribution of concrete
c a = ß1c
cu 0.85fc'
N.A.
= 0.003
(Strain) (Concrete stress)
Compression
Tension
x
y
c a
N.A.
X
Y
0.003
c
c
ci d i
A
Ab
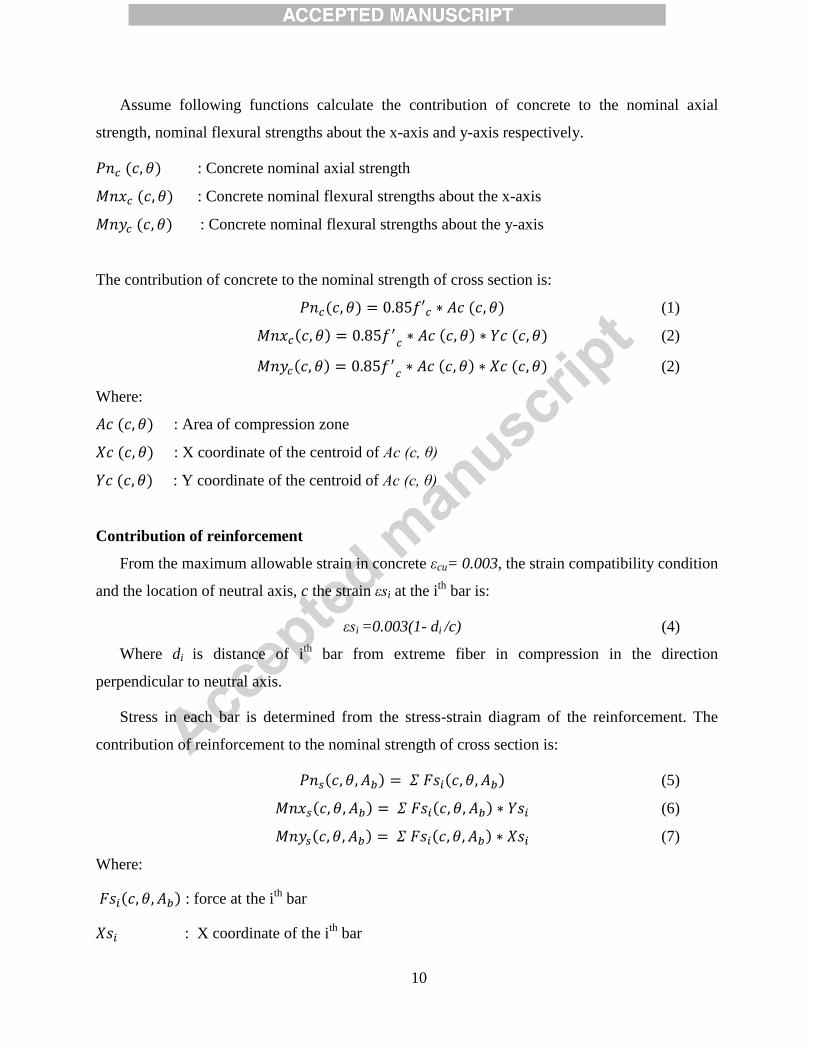
10
Assume following functions calculate the contribution of concrete to the nominal axial
strength, nominal flexural strengths about the x-axis and y-axis respectively.
: Concrete nominal axial strength
: Concrete nominal flexural strengths about the x-axis
: Concrete nominal flexural strengths about the y-axis
The contribution of concrete to the nominal strength of cross section is:
(1)
(2)
(2)
Where:
: Area of compression zone
: X coordinate of the centroid of Ac (c, θ)
: Y coordinate of the centroid of Ac (c, θ)
Contribution of reinforcement
From the maximum allowable strain in concrete εcu= 0.003, the strain compatibility condition
and the location of neutral axis, c the strain εsi at the ith
bar is:
εsi =0.003(1- di /c) (4)
Where di is distance of ith
bar from extreme fiber in compression in the direction
perpendicular to neutral axis.
Stress in each bar is determined from the stress-strain diagram of the reinforcement. The
contribution of reinforcement to the nominal strength of cross section is:
(5)
(6)
(7)
Where:
: force at the ith
bar
: X coordinate of the ith
bar
11
: Y coordinate of the ith
bar
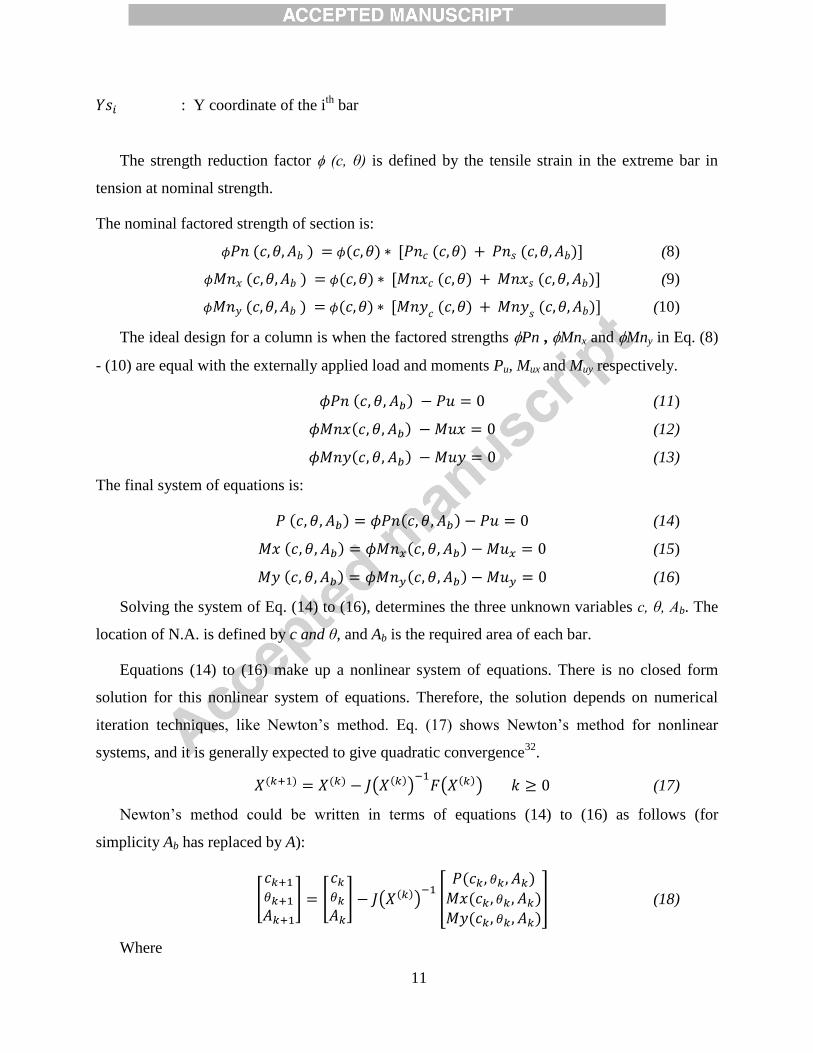
The strength reduction factor (c, θ) is defined by the tensile strain in the extreme bar in
tension at nominal strength.
The nominal factored strength of section is:
(8)
(9)
(10)
The ideal design for a column is when the factored strengths Pn , Mnx and Mny in Eq. (8)
- (10) are equal with the externally applied load and moments Pu, Mux and Muy respectively.
(11)
(12)
(13)
The final system of equations is:
(14)
(15)
(16)
Solving the system of Eq. (14) to (16), determines the three unknown variables c, θ, Ab. The
location of N.A. is defined by c and θ, and Ab is the required area of each bar.
Equations (14) to (16) make up a nonlinear system of equations. There is no closed form
solution for this nonlinear system of equations. Therefore, the solution depends on numerical
iteration techniques, like Newton’s method. Eq. (17) shows Newton’s method for nonlinear
systems, and it is generally expected to give quadratic convergence32
.
( )
( ) (17)
Newton’s method could be written in terms of equations (14) to (16) as follows (for
simplicity Ab has replaced by A):
[
] [
] ( )
[
] (18)
Where

12
( )
[
]
(19)
And
: value for unknown variables at Kth
iteration
: value for unknown variables at (K+1)th
iteration
The following steps are required for solving the non-linear system of Equations (14) to (16)
by implementing Newton’s method:
1- Assume initial value for unknown variables C, θ, Ab.
2- Calculate the Jacobean matrix J using equation (19).
3- Use equation (18) to find the new values for unknown variables C, θ, Ab.
4- Repeat the process until the calculated section capacity is close enough to the applied
load and moments.
The following guidelines could help to have appropriate initial assumption for unknown
variables.
For doubly symmetric sections 0˚ ≤ θ ≤ 90˚ and θ can be initially approximated as θ ≈
atan(Mux/ Muy).
c > 0, and for large values of c there would be no significant changes in nominal
strengths of section.
The bar area could be initially approximated as Ab = 650 mm2(1.0in
2)
The acceptable range of Ab is 200 mm2
(0.31in2) ≤ Ab ≤ 2580 mm
2 (4in
2) for bars No. 5 to
No. 18 respectively (nine bars sizes), and the total area of reinforcement is limited from
1% to 8% of the gross section of concrete.
SPECIAL CASES, REAL AND UNREAL SOLUTIONS
As mentioned earlier, in accepted approach for designing RC column the capacity of an
assumed section is checked using interaction diagrams. In practice, interaction diagrams are
generated based on real and reasonable sections.

13
In direct design method, the appropriate section is found by solving a non-linear system of
equations. In many cases, a negative (unreal) value is found for unknown variables C, θ, Ab.
1- C is distance from the neutral axis to the fiber of maximum compressive strain. A
negative value for C is not acceptable. Whenever the solution contains a negative value
for C, the iteration should start from another initial assumption.
2- θ is the angle of neutral axis with the x-axis. A negative value for θ is acceptable.
3- Ab is the required area of reinforcement. Determining the validity of a negative value for
Ab is complicated.
Acceptable Negative value for Ab
In some situations, the theoretical capacity of the column section without contribution of
reinforcement is greater than the applied load and moments. In these cases, solving the non-
linear system of equations will lead to a negative value for Ab. In fact, the negative value for Ab
indicates that a smaller section is required to satisfy the applied load and moments.
For example, consider the square column section shown in
Fig. 7. The column is subjected to the following load and moment:
: Applied axial load.
: Applied moment about x-axis.
Fig. 7. Acceptable Negative Reinforcement Area
f '
405mm (16in)
y
= 35 MPa (5.0 ksi)
f = 420 MPa (60 ksi)
c
(2.5in)
x
65mm
yy
x
Ab
405m
m (1
6in
)
0.85fc'
(Only Concrete)
N.A.
0.85fc'
N.A.
M = 115 k-ft
P = 400 kips
71.0 kips
8.3 kips
(Concrete & Bars)
A = -0.91 in2b
M = 75 k-ft
P = 400 kips
( a ) ( b )

14
Fig. 7(a) shows the stress diagram of concrete without considering reinforcement bars. The
neutral axis depth is C=11.3in. As it is shown in
Fig. 7(a), the corresponding capacity of the column section without steel contribution is:
: Applied axial load.
: Applied moment about x-axis.
It means that the capacity of concrete without steel contribution is more than the applied
load. In
Fig. 7(b) the neutral axis depth is C=13.08in, Ab= -0.91in2. The capacity of the section shown
in
Fig. 7(b) is exactly equal to applied load and moment. In other word, Negative Ab reduces the
section capacity and makes it equal to the applied loads. For calculation of factored load and
moments the strength reduction factor is considered =0.65.
In general, whenever the capacity of a column section without contribution of steel is greater
than the capacity of the section with negative reinforcement, the negative calculated value for
bars is acceptable. In this case, there is no need to start a new iteration to find another solution.
Non-Acceptable Negative value for Ab
In some cases, there are two set of solutions for the non-linear system of equations. One set
of answer with positive Ab and one set with negative Ab. For example, consider the square
column section shown in Fig. 8. The column is subjected to the following load and moment:
: Applied axial load.
: Applied moment about x-axis.
Fig. 8. Non-Acceptable Negative Reinforcement Area
f '
405mm (16in)
y
= 35 MPa (5.0 ksi)
f = 420 MPa (60 ksi)
c
(2.5in)
x
65mm
yy
x
Ab
405m
m (1
6in
)
0.85fc'
N.A.
0.85fc'
N.A.
M = 129 k-ft
P = 400 kips
7.9 kips
A = 0.18 in2b
P = 400 kips
( a ) ( b )
A = - 2.18 in2b
343.3 kips
102.5 kips
392.4 kips
M = 129 k-ft
32.4 kips
10.7 kips

15
In Fig. 8 (a) C=6.3in, Ab=-2.18in2, =0.76 and in Fig. 8 (b) C=10.8in, Ab=0.18in
2, =0.65.
Both stress distributions have the same capacity. In this case, the negative Ab is not acceptable
and the solution shown in Fig. 8 (b) is the acceptable solution.
DIRECT-DESGN PROGRAM
A computer program based on direct design method has been developed by the authors for
creating design diagrams. The program solves the system of Eq. (14) to (16) by implementing
Newton’s method. Solving a nonlinear system of equations by Newton’s method is an iterative
process and should start from an initial assumption for the unknown variables. Newton’s method
is accurate and converges to the solution very fast; however, the calculations may not converge if
the initial assumption is not close to the solution33, 34
.
The developed program uses the technique and guidelines previously explained in this paper
for solving the nonlinear system of equations by starting from appropriate initial assumption. In
addition, since the program uses the Direct Design method, it is able to calculate and show the
location of neutral axis, shape and location of compression zone, and stress in reinforcement bars
for each set of applied load and moments (see Fig. 15).
RESULT INTERPRETATION
Table 2 shows the design results for the section in Fig. 3 for four different set of applied
loads and moments. The last column displays the computed required areas for each of the
reinforcing bars. Load cases 1-3 represent points 1-3 in Fig. 4 respectively.
Table 2. Design results for section shown in Fig. 3
Input Result
Load Pu Mux Muy Ab
case kN (kip) kN-m (k-ft) kN-m (k-ft) mm2 (in
2)
1 2180 (490) 190 (140) 0 504 (0.78)
2 1780 (400) 102 (75) 0 -586 (-0.91)
3 3335 (750) 339 (250) 0 2268 (3.51)
4 2225 (500) 135 (100) 102 (75) 468 (0.73)

16
For load case 1, the computed area of reinforcement is an acceptable value. It shows that the
section dimensions and bars arrangement are appropriate. Use #8 bars, Ab = 510 mm2 (0.79 in
2)
that has the closest area to the computed value. In load case 2, the calculated area of bars is
negative. The point corresponding to load case 2 falls into the highlighted region of Fig. 4 which
bounded by the Ab = 0 diagram. Theoretically, the concrete section without contribution of
reinforcement can carry any load case that falls into this region. In this case, the designer shall
provide the minimum required reinforcement, or reduce the size of the section. In load case 3,
the calculated area of bars is so large that it exceeds #18 bars, Ab = 2580 mm2 (4.0 in
2) the largest
available bar sizes. Therefore, a larger cross section is required for the concrete strength and bar
grade assumed. In load case 4, the concrete section is subjected to axial load and biaxial
moments. The computed area of reinforcement is an acceptable value. Use #8 bars, Ab = 510
mm2 (0.79 in
2).
The direct design method is not limited to rectangular sections with simple bar arrangement.
This method could be used to calculate the required area of reinforcement for any column or
shear wall section with any arbitrary bar arrangement. In addition, designing a section using the
direct design method would provide the following information:
1- Location of neutral axis.
2- Shape and location of compression zone.
3- Stress in each reinforcement bar.
Traditional design method usually cannot provide above information.
RESULTS VALIDATIONS
Several design examples are given in Table 3 to show the validity of direct design method.
These examples are based on column capacities presented in Values in Table 3 are calculated for
405x405mm (16x16in) square tied column. Bars clear cover is considered 48mm (1.875in) and
f’c = 28 MPa (4.0 ksi), fy = 420 MPa (60 ksi).
Table 3. Validation design examples
CRSI (2008) Direct Design
Design Bars Mn Pn Ab Bar
example kN-m (k-in) kN (kip) mm
2 (in
2) size

17
1 4#8 139 (1232) 2081 (468) 509 (0.79) #8
2 4#8 168 (1483) 1744 (392) 509 (0.79) #8
3 8#7 192 (1700) 1552 (349) 387 (0.60) #7
4 8#7 213 (1885) 1067 (240) 387 (0.60) #7
4 12#10 228 (2016) 3104 (698) 819 (1.27) #10
4 12#10 314 (2782) 1966 (442) 819 (1.27) #10
DESIGN DIAGRAM – BASIS AND DEVELOPMENT
For each column or shear wall, it is possible to find many sections that their capacities are
equal to the applied load and moments. A design diagram shows all these possible practical fitted
sections for a column or shear wall.
Theory and Assumption
For making a design diagram, it is required to calculate the required area of bars for several
section dimensions and bar arrangements. It is not practical to make a design diagram using
traditional design method. So, creating a design diagram is highly dependent on the direct design
method. In this research, design diagrams are developed based on ACI318-14 provisions.
However, creating a design diagram is not limited to any structural standard.
Design Diagram development
A design diagram is created by investigating the required area of reinforcement for different
section sizes and bar arrangements. The procedure starts from minimum acceptable dimension
and minimum acceptable number of bars for the section. The number of bars increases step-by-
step and the required area of reinforcement for each step is calculated using direct design
method. By increasing the number of bars, the required area of each bar decreases and the
process continues until the calculated area for each bar is smaller than minimum available bar
size. By repeating the same approach for different section dimensions, a matrix of required bar
areas for different section sizes and bar arrangements is created, and then design diagram is made
by interpolating the points in the matrix. The lines corresponding to the bar numbers are
calculated by interpolation between the saved areas for each point in the matrix, and the

18
reinforcement percentage lines are calculated with a similar approach by interpolating between
reinforcement percentages. The procedure is shown by the flowchart in Fig. 9.
Fig. 9. Design diagram flowchart
Fig. 10 shows design diagram generated for a square reinforced concrete column, subjected
to the following applied axial load and moment. Cover to the center of bars is considered 65mm
(2.5in) and f’c = 35 MPa (5.0 ksi), fy = 420 MPa (60 ksi).
Start
Assume
A < #5b
Determine applied load
and moments
Determine section shape(rectangle, circle, ...)
Find: A ,b
material properties
Interpolate resultsDraw design diagram
Stop
increase
Number of bars.
start with:
Min. section dimension
start with:
Min. Number of bars.
No
Save: A ,
Yes
No
increase
Section dimension
using
Min. number
of bars
Yes
b
19
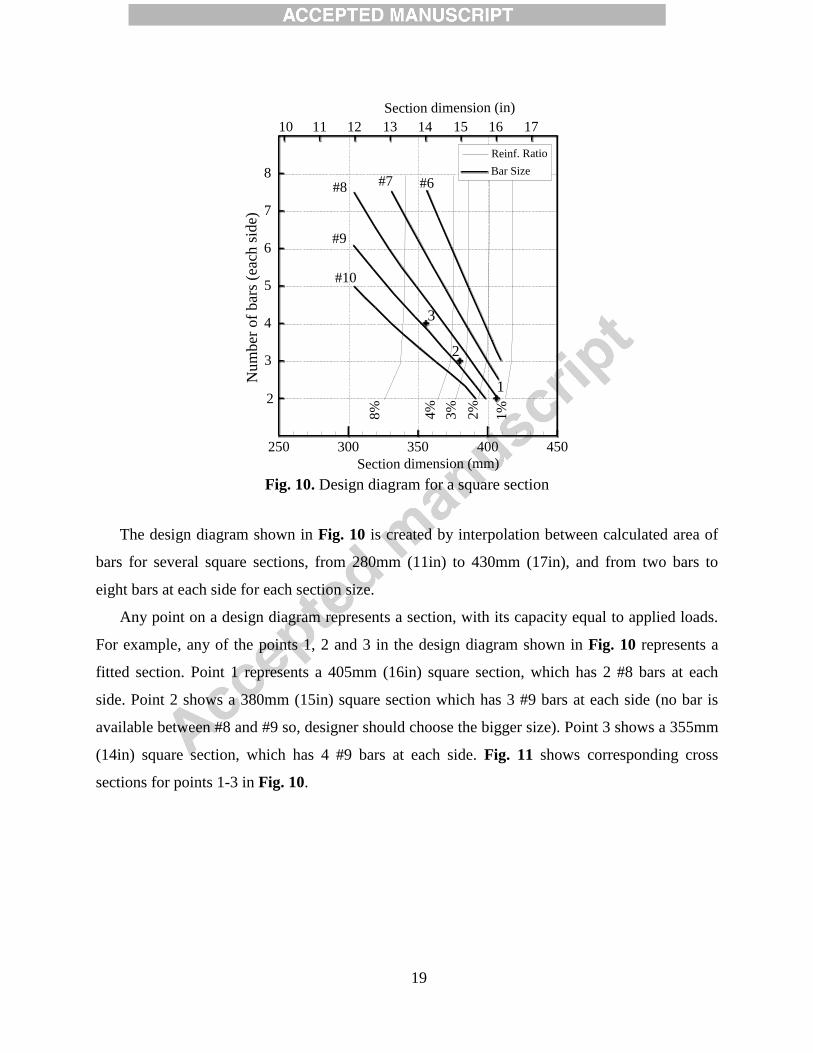
Fig. 10. Design diagram for a square section
The design diagram shown in Fig. 10 is created by interpolation between calculated area of
bars for several square sections, from 280mm (11in) to 430mm (17in), and from two bars to
eight bars at each side for each section size.
Any point on a design diagram represents a section, with its capacity equal to applied loads.
For example, any of the points 1, 2 and 3 in the design diagram shown in Fig. 10 represents a
fitted section. Point 1 represents a 405mm (16in) square section, which has 2 #8 bars at each
side. Point 2 shows a 380mm (15in) square section which has 3 #9 bars at each side (no bar is
available between #8 and #9 so, designer should choose the bigger size). Point 3 shows a 355mm
(14in) square section, which has 4 #9 bars at each side. Fig. 11 shows corresponding cross
sections for points 1-3 in Fig. 10.
300 400350 450250
10 12 14 1611 13 15 17
Section dimension (mm)
Section dimension (in)
Nu
mb
er o
f b
ars
(eac
h s
ide)
2
3
4
5
6
7
8
2%
8%
4%
3%
#8 #7
1%
#6
#10
#9
1
2
3
Reinf. Ratio
Bar Size
20
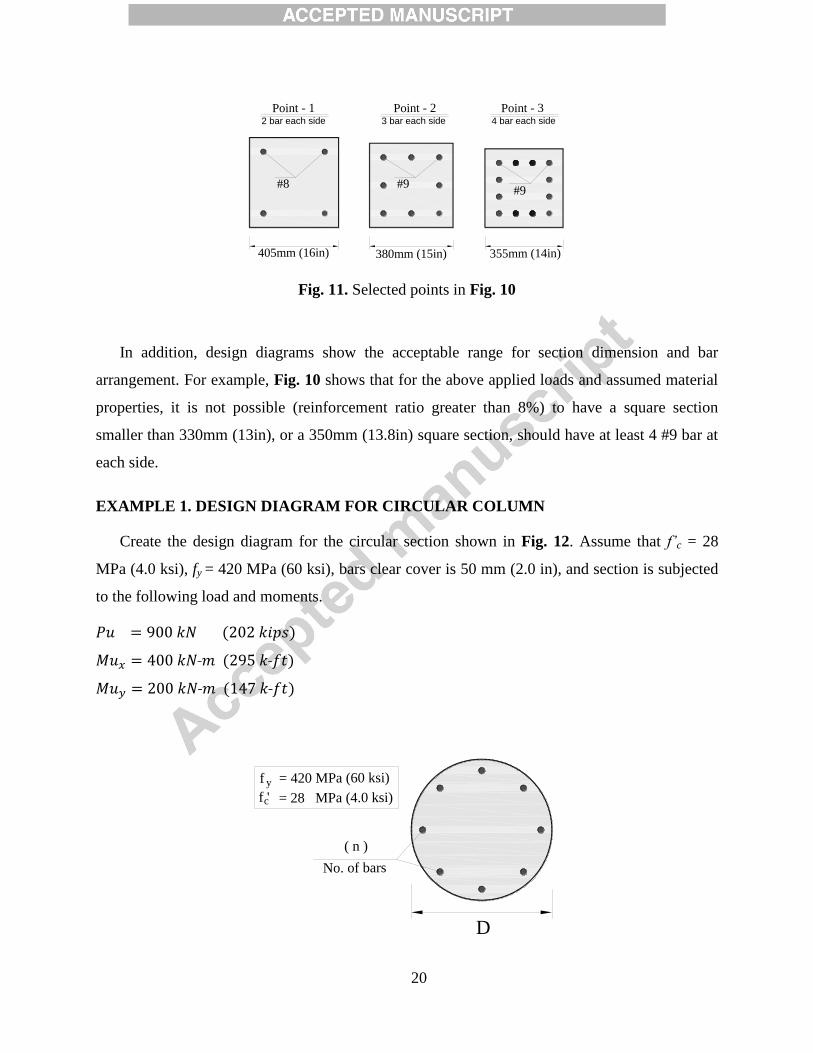
Fig. 11. Selected points in Fig. 10
In addition, design diagrams show the acceptable range for section dimension and bar
arrangement. For example, Fig. 10 shows that for the above applied loads and assumed material
properties, it is not possible (reinforcement ratio greater than 8%) to have a square section
smaller than 330mm (13in), or a 350mm (13.8in) square section, should have at least 4 #9 bar at
each side.
EXAMPLE 1. DESIGN DIAGRAM FOR CIRCULAR COLUMN
Create the design diagram for the circular section shown in Fig. 12. Assume that f’c = 28
MPa (4.0 ksi), fy = 420 MPa (60 ksi), bars clear cover is 50 mm (2.0 in), and section is subjected
to the following load and moments.
405mm (16in)
Point - 1 Point - 2 Point - 32 bar each side 3 bar each side 4 bar each side
380mm (15in) 355mm (14in)
#8#9
#9
D
f 'y
= 28 MPa (4.0 ksi)
f = 420 MPa (60 ksi)
c
No. of bars
( n )

21
Fig. 12. Circular section, Example 1
Solution
For creating the design diagram according to the flowchart given in Fig. 9, it is required to
investigate the required area of reinforcement for different section dimensions and bar
arrangements. Table 4 shows the design results for some sample points. The input data are
section diameter D, and number of bars in section n. The outputs are the angle of neutral axis
with x-axis, distance from the neutral axis to the fiber of maximum compressive strain c, and
required area of each bar Ab.
Table 4. Design results for circular section in Fig. 12
Points
Input Results
D n Angle c Ab
mm (in) - deg. mm (in) mm2 (in
2)
1 600 (23.6) 8 27.6 205 (8.0) 505 (0.78)
2 600 (23.6) 11 26.9 205 (8.0) 355 (0.55)
3 550 (21.6) 10 27.5 230 (9.1) 705 (1.09)
By repeating the sample calculation shown in Table 4 for other section diameters, and bar
arrangements a matrix for output results would be prepared. The design diagram shown in Fig.
13 is created by interpolating the above results. Points 1-3 in Fig. 13 represent the corresponding
points in Table 4.

22
Fig. 13. Design diagram for Example 1
EXAMPLE 2. DESIGN DIAGRAM FOR L-SHAPED SHEAR WALL
Create the design diagram for the L-Shaped shear wall shown in Fig. 14. Assume that f’c =
28 MPa (4.0 ksi), fy = 420 MPa (60 ksi), bars clear cover is 50 mm (2.0 in), and section is
subjected to the following load and moments.
Pu = 4,500 kN (1010 kip)
Mux = -10000 kN-m (-7375 k-ft)
Muy = 250 kN-m (185 k-ft)
550 650600 700500
21 23 25 2720 22 24 26
Section dimension (mm)
Section dimension (in)
Num
ber
of
bar
s
6
7
8
9
10
11
12
13
4% 3%
2%
1%
#10 #9 #8 #7 #6
1
2
3
Reinf. Ratio
Bar Size

23
Fig. 14. L-Shaped shear wall, Example 2
Solution
Table 5 shows design results for some sample points. The input data are wall thickness t, and
bar spacing s. The output results are similar to example 1.
Table 5. Design results for L-Shaped section in Fig. 14
Points
Input Results
t s Angle c Ab
mm (in) mm (in) deg. mm (in) mm2 (in
2)
1 350 (13.8) 100 (4.0) 128.5 780 (30.8) 330 (0.51)
2 350 (13.8) 150 (6.0) 128.7 795 (31.3) 510 (0.79)
3 300 (11.8) 150 (6.0) 130.2 895 (35.3) 720 (1.12)
Fig. 15 shows the required bar area, neutral axis, compression zone, and bar stresses for point
3 of Table 5 calculated by the direct design method. Fig. 16 shows the design diagram for the L-
Shaped shear wall. Points 1-3 in Fig. 16 represent the corresponding points in Table 5.
250
0 m
m (
98 i
n)
1500 mm (59 in)
f 'y
= 28 MPa (4.0 ksi)
f = 420 MPa (60 ksi)
c
Wall thickness
Bar spacing
t
s
t

24
Fig. 15. Design result for point 3 of Table 5
Fig. 16. Design diagram for Example 2
130.2°
c = 8
95 mm
(35.3
in)
fy
0.5 fy
0
-0.5 fy
-fy
300
300
150
150
A = 720 mmb2
(1.12 in )2
300 400 500350 450250
10 12 14 16 1811 13 15 17 19
Wall thickness (mm)
Bar
sp
acin
g (
mm
)
3%
2%
1%
#10 #9
#8
#7
#623
1
200
100
300B
ar s
pac
ing
(in
)
Wall thickness (in)
150
250
4
5
6
7
8
9
10
11
12Reinf. Ratio
Bar Size

25
CONCLUSION
Direct design method is an analytical method by which the required area of reinforcement for
short reinforced concrete columns or shear walls is directly calculated without using interaction
diagrams. Some other advantages of this method are:
It could be used for any column or shear wall section with any arbitrary bar arrangement.
It directly provides a fitted section without going through a trial-and-error procedure.
It is not limited to any particular stress-strain diagram for concrete and reinforcement.
The numerical solution of this method is very efficient, accurate, and fast in computer
calculations.
Efficiency of direct design method provides a practical way for making design diagrams. The
advantages of design diagram are:
Shows all possible fitted column or shear wall cross sections in one diagram.
Eliminates trial-and-error procedure from column design procedure.
Shows the acceptable limitation for section dimension and bar arrangement.
ACI and most of the other concrete codes, consider slenderness effect by magnifying the
applied moments. Moment magnification is highly dependent on loads, column boundary
conditions and many other factors. Considering all these additional factors in the presented
method would produce more complexity and will be incorporated in a future study.
In order to apply the direct design method to slender columns, the applied moments on the
columns should be first magnified according to ACI 318.
NOTATION Ab = area of each bar;
a = depth of compression zone at nominal flexural strength;
c = neutral axis depth at nominal flexural strength;
di = distance of ith
bar from extreme fiber in compression;
fc′ = compressive strength of concrete;
Fsi = force at ith
bar;
fy = yield stress of reinforcing steel;
Mux = applied moment about x axis;
Muy = applied moment about y axis;
Pu = applied axial load;
θ = angle between neutral axis and x-axis;

26
cu = ultimate concrete compressive strain;
si = strain in ith
bar;
= strength reduction factor;
Mnx = nominal factored flexural strength about x-axis;
Mnxc = concrete nominal factored flexural strength about x-axis;
Mnxs = reinforcement nominal factored flexural strength about x-axis;
Mny = nominal factored flexural strength about y-axis;
Mnyc = concrete nominal factored flexural strength about y-axis;
Mnys = reinforcement nominal factored flexural strength about y-axis;
Pn = nominal factored axial strength;
Pnc = concrete nominal factored axial strength;
Pns = reinforcement nominal factored axial strength;
REFERENCE
1 STRUCTUREPOINT, “spColumn user manual,” v5.50, formerly the Engineering Software
Group of the Portland Cement Association (PCA), Skokie, IL, Nov. 2016, 111 pp. 2 Wight, J. K., and MacGregor, J. G., “Reinforced Concrete Mechanics and Design,” 6
th
edition, Pearson Education, Inc., Upper Saddle River, New Jersey, 2012, 1157 pp. 3 Whitney, C. S., “Plastic Theory of Reinforced Concrete Design,” ASCE Transactions 107,
1942, 251 pp. 4 Chu, K. H., and Pabarcius, A., “Biaxially Loaded Reinforced Concrete Columns,” Journal
of Structural Division, ASCE, V. 84, No. ST8, Dec. 1958, 1-27 pp. 5 Bresler, B., “Design Criteria for Reinforced Columns under Axial Load and Biaxial
Bending,” ACI Journal Proceedings V. 57, No. 11, Nov. 1960, pp. 481-490. 6 Fleming, J. F., and Werner, S. D., “Design of Columns Subjected to Biaxial Bending,” ACI
Journal Proceedings V. 62, No. 3, Mar. 1965, pp. 327-342. 7 Hsu, C. T., and Mirza, M. S., “Structural Concrete—Biaxial Bending and Compression,”
Journal of the Structural Division, ASCE, V. 99, No. ST2, Feb. 1973, pp. 285-290. 8 Marin, J., “Design Aids for L-Shaped Reinforced Concrete Columns,” ACI Journal, Title
No. 76-49, Nov. 1979, pp. 1197-1216. 9 Hsu, C. T. T., “Biaxially Loaded L-Shaped Reinforced Concrete Columns,” Journal of
Structural Engineering, ASCE, V. 111, No. 12, Dec. 1985, pp. 2576-2595. 10
Hsu, C. T. T., “Analysis and Design of Square and Rectangular Columns by Equation of
Failure Surface,” ACI Structural Journal, V. 85, No. 2, Mar. 1988, pp. 167-179. 11
Hsu, C. T. T., “T-Shaped Reinforced Concrete Members under Biaxial Bending and Axial
Compression,” ACI Structural Journal, V. 86, No. 4, July-Aug. 1989, pp. 460-468. 12
Dinsmore, C. I., ‘‘Column analysis with a programmable calculator,’’ ACI Concrete Int.,
V. 4, No. 11, Nov. 1982, pp. 32–36.
27
13
Brondum-Nielsen, T., ‘‘Ultimate flexural capacity of partially or fully prestressed cracked
arbitrary concrete sections under axial load combined with biaxial bending,’’ ACI Concrete Int.,
V. 5, No. 1, Jan. 1983, pp. 75–78. 14
Yen, J. R., “Quasi-Newton method for reinforced concrete column analysis and design,”
Journal of Structural Engineering, ASCE, V. 117, No. 3, Mar. 1991, pp. 657–666. 15
Barzegar, F., and Erasito, T., “Concrete sections under biaxial bending: Interactive analysis
with spreadsheets,” ACI Concrete Int., V. 17, No. 12, Dec. 1995, pp. 28–33. 16
Zenon, A. Z., and Long, W., and Troitsky, M. S., “Designing Reinforced Concrete Short-
tied Columns Using the Optimization Technique,” ACI Structural Journal, V. 92, No. 5, Nov.
1995, pp. 619-626. 17
Rodriguez J. A. and Aristizabal-Ochoa J. D., “Biaxial Interaction Diagram for Short RC
Columns of any Cross Section,” Journal of Structural Engineering, ASCE, V. 125, No. 6, Jun.
1999. 18
Wang, W., and Hong, H. P., “Appraisal of reciprocal load method for reinforced concrete
columns of normal and high strength concrete.” Journal of Structural Engineering, ASCE, V.
128, No. 11, Nov. 2002, pp. 1480–1486. 19
Bonet, J. L., and Miguel, P. F., Fernandez, M. A. and Romero, M. L., “Analytical
Approach to Failure Surfaces in Reinforced Concrete Sections Subjected to Axial Loads and
Biaxial Bending,” Journal of Structural Engineering, ASCE, V. 130, No. 12, Dec. 2004. 20
Cedolin, L., and Cusatis, G., and Eccheli, S., and Roveda, M., “Biaxial Bending of
Concrete Columns: An Analytical Solution,” Studies and Researches - Politecnico di Milano -
V.26, 2006, pp. 163-192. 21
Paultre, P., and Légeron, F., “Confinement Reinforcement Design for Reinforced Concrete
Columns,” Journal of Structural Engineering, ASCE, V. 134, No. 5, May. 2008. 22
Rodrigues, H., and Varum, H., and Arêde, A., and Costa, A. G., “Behaviour of reinforced
concrete column under biaxial cyclic loading–state of the art,” International Journal of
Advanced Structural Engineering (IJASE), Jan. 2013. 23
Lequesne, R. D., and Pincheira, J. A., “Proposed Revisions to the Strength Reduction
Factor for Axially Loaded Members,” ACI Concrete Int., V. 36, No. 9, Sep. 2014, pp. 43–49. 24
PCA, “Notes on ACI 318-08,” 10th
edition, First printing, Portland Cement Association,
Skokie, IL, 2008, 1035 pp. 25
CRSI, “Design Handbook,” 10th
edition, Concrete Reinforcing Steel Institute (CRSI),
Schaumburg, IL 60173, 2008, 600 pp. 26
Computer & Structures INC., “User's Manual and Technical Reference of CSiCOl,”
Berkeley, CA, Mar. 2014, 118 pp. 27
Bentz, E., and Collins, M. P., "Response 2000 manual," v1.10, Sep. 2001, 85 pp. 28
Fenves, G. L., and McKenna, F., and Mazzoni, S., “OpenSees getting started manual,”
Pacific Earthquake Engineering Research Center University of California, Berkeley, Mar. 2010. 29
Wallace, J. W., and Ibrahim, Y. A., “User’s manual for BIAX,” Strength analysis of
reinforced concrete sections program, University of California, Berkeley, 1996.

28
30
McCormac, J., and Brown, R., “Design of Reinforced Concrete,” 10th
edition, John Wiley
& Sons, Inc., 111 River Street, Hoboken, NJ., 2015, 672 pp. 31
ACI 318-14, “Building Code Requirements for Structural Concrete and Commentary,”
American Concrete Institute, ACI committee 318, 2014, 520 pp.
32 Burden, R., and Faires, D., “Numerical Analysis,” 9
th edition, Brooks/Cole 20 Channel
Center Street Boston, MA 02210, 2010, 888 pp. 33
Chapra S., and Canale R., “Numerical Methods for Engineers,” 6th
edition, The McGraw-
Hill Companies, Inc., 1221 Avenue of the Americas, NY 10020, 2009, 960 pp. 34
Gautschi, W., “Numerical Analysis,” Second edition, Springer Science+Business Media,
LLC, 233 Spring Street, NY 10013, 2012, 588 pp.