
Author: Jeanine Hinterneder, Ph.D. - PerkinElmer · Jeanine Hinterneder, Ph.D. PerkinElmer, Inc....
7
Introduction Bcl-2 (human B-cell lymphoma 2) is the founding member of the Bcl-2 family of regulator proteins that regulate cell death. Bcl-2 protein is primarily localized to the outer mitochondrial membrane, where it plays an important role in cellular survival and inhibiting the actions of pro-apoptotic proteins such as Bax and Bak. The Bcl-2 family members interact with each other to maintain mitochondrial integrity and regulate cellular commitment to apoptosis, protecting cells from a wide range of cytotoxic insults including cytokine deprivation and chemotherapeutic drugs. Bcl-2 overexpression has been implicated in tumorigenesis in a wide variety of malignancies, including breast, prostate, skin, colon and pancreatic cancers. 1 Expression of Bcl-2 frequently correlates with Estrogen Receptor (ER) expression levels in ER+ breast cancers and has been implicated in tumorigenesis and acquired resistance to breast cancer treatment strategies. 2 LANCE ® time-resolved fluorescence resonance energy transfer (TR-FRET) technology allows for the detection of molecules of interest in a homogeneous, no-wash format. These assays utilize the unique fluorescent properties of a europium-based chelate (Eu chelate) as the donor. Eu chelates have high quantum yield, large Stokes shift, a narrow-banded emission, and a long lifetime. These properties make Eu chelates ideal energy donors in TR-FRET assays, as they are less susceptible to interference and reduce background signal. ULight ™ is a small, light-resistant acceptor dye that has a red-shifted emission maximum at 665 nm. In the LANCE Ultra Bcl-2 assay, illustrated in Figure 1, human Bcl-2 protein is bound by both a Europium-labeled- anti-Bcl-2 antibody and ULight-labeled-anti-Bcl-2 antibody bringing the Europium and ULight into close proximity of each other. Upon excitation at 320 or 340 nm, the Europium activates the ULight through fluorescence energy transfer (FRET) to emit light at 665 nm. This light emission can then be detected on a TR-FRET enabled reader. The experiments described here illustrate how LANCE technology may be used to assay Bcl-2 protein expression in different cellular models. Quantifying Bcl-2 Expression Levels in Human Cells with LANCE Ultra TR-FRET APPLICATION NOTE Author: Jeanine Hinterneder, Ph.D. PerkinElmer, Inc. Hopkinton, MA For research purposes only. Not for use in diagnostic procedures. LANCE TR-FRET
Transcript of Author: Jeanine Hinterneder, Ph.D. - PerkinElmer · Jeanine Hinterneder, Ph.D. PerkinElmer, Inc....
Introduction Bcl-2 (human B-cell lymphoma 2) is the founding member of the Bcl-2 family of regulator proteins that regulate cell death. Bcl-2 protein is primarily localized
to the outer mitochondrial membrane, where it plays an important role in cellular survival and inhibiting the actions of pro-apoptotic proteins such as Bax and Bak. The Bcl-2 family members interact with each other to maintain mitochondrial integrity and regulate cellular commitment to apoptosis, protecting cells from a wide range of cytotoxic insults including cytokine deprivation and chemotherapeutic drugs. Bcl-2 overexpression has been implicated in tumorigenesis in a wide variety of malignancies, including breast, prostate, skin, colon and pancreatic cancers.1 Expression of Bcl-2 frequently correlates with Estrogen Receptor (ER) expression levels in ER+ breast cancers and has been implicated in tumorigenesis and acquired resistance to breast cancer treatment strategies.2
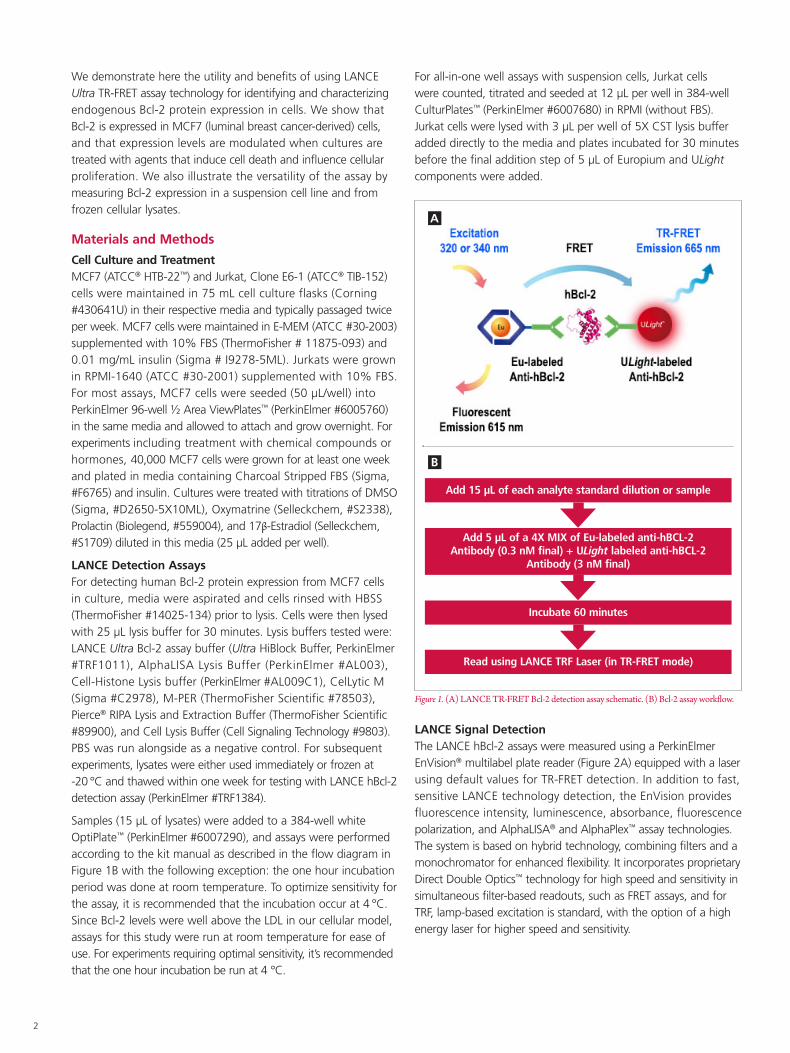
LANCE® time-resolved fluorescence resonance energy transfer (TR-FRET) technology allows for the detection of molecules of interest in a homogeneous, no-wash format. These assays utilize the unique fluorescent properties of a europium-based chelate (Eu chelate) as the donor. Eu chelates have high quantum yield, large Stokes shift, a narrow-banded emission, and a long lifetime. These properties make Eu chelates ideal energy donors in TR-FRET assays, as they are less susceptible to interference and reduce background signal. ULight™ is a small, light-resistant acceptor dye that has a red-shifted emission maximum at 665 nm. In the LANCE Ultra Bcl-2 assay, illustrated in Figure 1, human Bcl-2 protein is bound by both a Europium-labeled-anti-Bcl-2 antibody and ULight-labeled-anti-Bcl-2 antibody bringing the Europium and ULight into close proximity of each other. Upon excitation at 320 or 340 nm, the Europium activates the ULight through fluorescence energy transfer (FRET) to emit light at 665 nm. This light emission can then be detected on a TR-FRET enabled reader. The experiments described here illustrate how LANCE technology may be used to assay Bcl-2 protein expression in different cellular models.
Quantifying Bcl-2 Expression Levels in Human Cells with LANCE Ultra TR-FRET
A P P L I C A T I O N N O T E
Author:
Jeanine Hinterneder, Ph.D.
PerkinElmer, Inc. Hopkinton, MA
For research purposes only. Not for use in diagnostic procedures.
LANCE TR-FRET
2
We demonstrate here the utility and benefits of using LANCE Ultra TR-FRET assay technology for identifying and characterizing endogenous Bcl-2 protein expression in cells. We show that Bcl-2 is expressed in MCF7 (luminal breast cancer-derived) cells, and that expression levels are modulated when cultures are treated with agents that induce cell death and influence cellular proliferation. We also illustrate the versatility of the assay by measuring Bcl-2 expression in a suspension cell line and from frozen cellular lysates.
Materials and Methods
Cell Culture and TreatmentMCF7 (ATCC® HTB-22™) and Jurkat, Clone E6-1 (ATCC® TIB-152) cells were maintained in 75 mL cell culture flasks (Corning #430641U) in their respective media and typically passaged twice per week. MCF7 cells were maintained in E-MEM (ATCC #30-2003) supplemented with 10% FBS (ThermoFisher # 11875-093) and 0.01 mg/mL insulin (Sigma # I9278-5ML). Jurkats were grown in RPMI-1640 (ATCC #30-2001) supplemented with 10% FBS. For most assays, MCF7 cells were seeded (50 μL/well) into PerkinElmer 96-well ½ Area ViewPlates™ (PerkinElmer #6005760) in the same media and allowed to attach and grow overnight. For experiments including treatment with chemical compounds or hormones, 40,000 MCF7 cells were grown for at least one week and plated in media containing Charcoal Stripped FBS (Sigma, #F6765) and insulin. Cultures were treated with titrations of DMSO (Sigma, #D2650-5X10ML), Oxymatrine (Selleckchem, #S2338), Prolactin (Biolegend, #559004), and 17β-Estradiol (Selleckchem, #S1709) diluted in this media (25 μL added per well).
LANCE Detection AssaysFor detecting human Bcl-2 protein expression from MCF7 cells in culture, media were aspirated and cells rinsed with HBSS (ThermoFisher #14025-134) prior to lysis. Cells were then lysed with 25 μL lysis buffer for 30 minutes. Lysis buffers tested were: LANCE Ultra Bcl-2 assay buffer (Ultra HiBlock Buffer, PerkinElmer #TRF1011), AlphaLISA Lysis Buffer (PerkinElmer #AL003), Cell-Histone Lysis buffer (PerkinElmer #AL009C1), CelLytic M (Sigma #C2978), M-PER (ThermoFisher Scientific #78503), Pierce® RIPA Lysis and Extraction Buffer (ThermoFisher Scientific #89900), and Cell Lysis Buffer (Cell Signaling Technology #9803). PBS was run alongside as a negative control. For subsequent experiments, lysates were either used immediately or frozen at -20 °C and thawed within one week for testing with LANCE hBcl-2 detection assay (PerkinElmer #TRF1384).
Samples (15 μL of lysates) were added to a 384-well white OptiPlate™ (PerkinElmer #6007290), and assays were performed according to the kit manual as described in the flow diagram in Figure 1B with the following exception: the one hour incubation period was done at room temperature. To optimize sensitivity for the assay, it is recommended that the incubation occur at 4 °C. Since Bcl-2 levels were well above the LDL in our cellular model, assays for this study were run at room temperature for ease of use. For experiments requiring optimal sensitivity, it’s recommended that the one hour incubation be run at 4 °C.
For all-in-one well assays with suspension cells, Jurkat cells were counted, titrated and seeded at 12 μL per well in 384-well CulturPlates™ (PerkinElmer #6007680) in RPMI (without FBS). Jurkat cells were lysed with 3 μL per well of 5X CST lysis buffer added directly to the media and plates incubated for 30 minutes before the final addition step of 5 μL of Europium and ULight components were added.
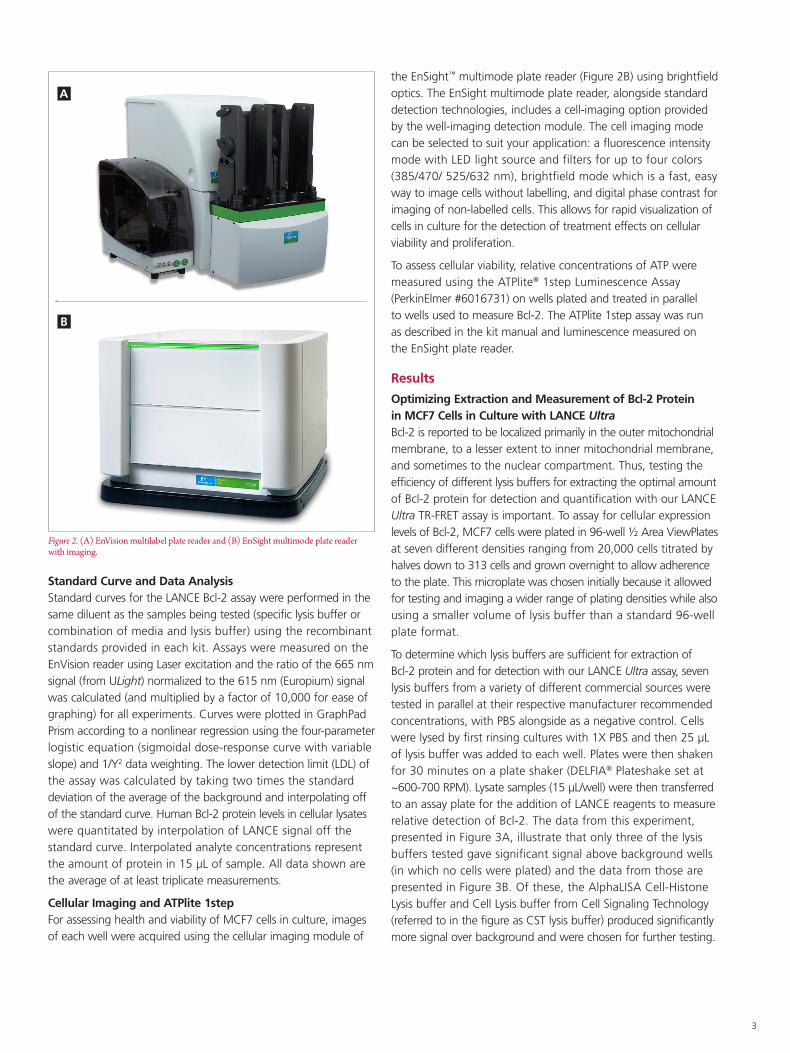
LANCE Signal DetectionThe LANCE hBcl-2 assays were measured using a PerkinElmer EnVision® multilabel plate reader (Figure 2A) equipped with a laser using default values for TR-FRET detection. In addition to fast, sensitive LANCE technology detection, the EnVision provides fluorescence intensity, luminescence, absorbance, fluorescence polarization, and AlphaLISA® and AlphaPlex™ assay technologies. The system is based on hybrid technology, combining filters and a monochromator for enhanced flexibility. It incorporates proprietary Direct Double Optics™ technology for high speed and sensitivity in simultaneous filter-based readouts, such as FRET assays, and for TRF, lamp-based excitation is standard, with the option of a high energy laser for higher speed and sensitivity.
Figure 1. (A) LANCE TR-FRET Bcl-2 detection assay schematic. (B) Bcl-2 assay workflow.
Add 15 μL of each analyte standard dilution or sample
Read using LANCE TRF Laser (in TR-FRET mode)
Incubate 60 minutes
Add 5 μL of a 4X MIX of Eu-labeled anti-hBCL-2 Antibody (0.3 nM final) + ULight labeled anti-hBCL-2
Antibody (3 nM final)
A
B
3
Figure 2. (A) EnVision multilabel plate reader and (B) EnSight multimode plate reader with imaging.
A
B
Standard Curve and Data Analysis Standard curves for the LANCE Bcl-2 assay were performed in the same diluent as the samples being tested (specific lysis buffer or combination of media and lysis buffer) using the recombinant standards provided in each kit. Assays were measured on the EnVision reader using Laser excitation and the ratio of the 665 nm signal (from ULight) normalized to the 615 nm (Europium) signal was calculated (and multiplied by a factor of 10,000 for ease of graphing) for all experiments. Curves were plotted in GraphPad Prism according to a nonlinear regression using the four-parameter logistic equation (sigmoidal dose-response curve with variable slope) and 1/Y2 data weighting. The lower detection limit (LDL) of the assay was calculated by taking two times the standard deviation of the average of the background and interpolating off of the standard curve. Human Bcl-2 protein levels in cellular lysates were quantitated by interpolation of LANCE signal off the standard curve. Interpolated analyte concentrations represent the amount of protein in 15 μL of sample. All data shown are the average of at least triplicate measurements.
Cellular Imaging and ATPlite 1step For assessing health and viability of MCF7 cells in culture, images of each well were acquired using the cellular imaging module of
the EnSight™ multimode plate reader (Figure 2B) using brightfield optics. The EnSight multimode plate reader, alongside standard detection technologies, includes a cell-imaging option provided by the well-imaging detection module. The cell imaging mode can be selected to suit your application: a fluorescence intensity mode with LED light source and filters for up to four colors (385/470/ 525/632 nm), brightfield mode which is a fast, easy way to image cells without labelling, and digital phase contrast for imaging of non-labelled cells. This allows for rapid visualization of cells in culture for the detection of treatment effects on cellular viability and proliferation.
To assess cellular viability, relative concentrations of ATP were measured using the ATPlite® 1step Luminescence Assay (PerkinElmer #6016731) on wells plated and treated in parallel to wells used to measure Bcl-2. The ATPlite 1step assay was run as described in the kit manual and luminescence measured on the EnSight plate reader.
Results
Optimizing Extraction and Measurement of Bcl-2 Protein in MCF7 Cells in Culture with LANCE Ultra Bcl-2 is reported to be localized primarily in the outer mitochondrial membrane, to a lesser extent to inner mitochondrial membrane, and sometimes to the nuclear compartment. Thus, testing the efficiency of different lysis buffers for extracting the optimal amount of Bcl-2 protein for detection and quantification with our LANCE Ultra TR-FRET assay is important. To assay for cellular expression levels of Bcl-2, MCF7 cells were plated in 96-well ½ Area ViewPlates at seven different densities ranging from 20,000 cells titrated by halves down to 313 cells and grown overnight to allow adherence to the plate. This microplate was chosen initially because it allowed for testing and imaging a wider range of plating densities while also using a smaller volume of lysis buffer than a standard 96-well plate format.
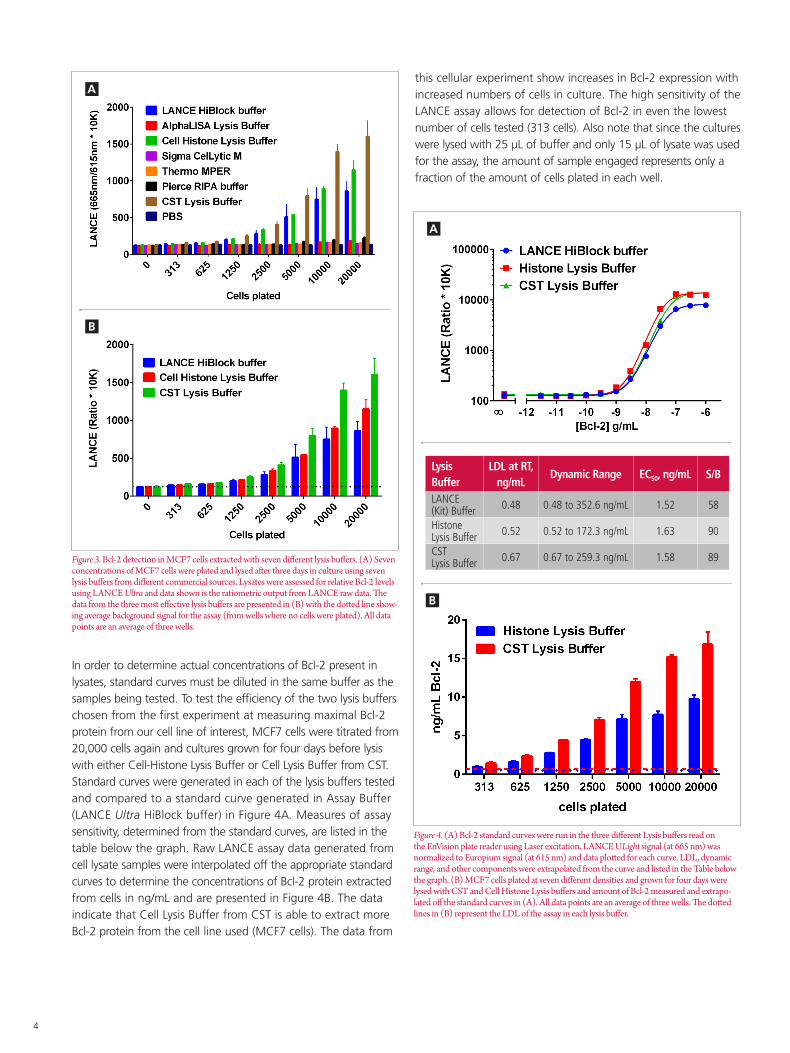
To determine which lysis buffers are sufficient for extraction of Bcl-2 protein and for detection with our LANCE Ultra assay, seven lysis buffers from a variety of different commercial sources were tested in parallel at their respective manufacturer recommended concentrations, with PBS alongside as a negative control. Cells were lysed by first rinsing cultures with 1X PBS and then 25 µL of lysis buffer was added to each well. Plates were then shaken for 30 minutes on a plate shaker (DELFIA® Plateshake set at ~600-700 RPM). Lysate samples (15 µL/well) were then transferred to an assay plate for the addition of LANCE reagents to measure relative detection of Bcl-2. The data from this experiment, presented in Figure 3A, illustrate that only three of the lysis buffers tested gave significant signal above background wells (in which no cells were plated) and the data from those are presented in Figure 3B. Of these, the AlphaLISA Cell-Histone Lysis buffer and Cell Lysis buffer from Cell Signaling Technology (referred to in the figure as CST lysis buffer) produced significantly more signal over background and were chosen for further testing.
4
Figure 3. Bcl-2 detection in MCF7 cells extracted with seven different lysis buffers. (A) Seven concentrations of MCF7 cells were plated and lysed after three days in culture using seven lysis buffers from different commercial sources. Lysates were assessed for relative Bcl-2 levels using LANCE Ultra and data shown is the ratiometric output from LANCE raw data. The data from the three most effective lysis buffers are presented in (B) with the dotted line show-ing average background signal for the assay (from wells where no cells were plated). All data points are an average of three wells.
B
A
In order to determine actual concentrations of Bcl-2 present in lysates, standard curves must be diluted in the same buffer as the samples being tested. To test the efficiency of the two lysis buffers chosen from the first experiment at measuring maximal Bcl-2 protein from our cell line of interest, MCF7 cells were titrated from 20,000 cells again and cultures grown for four days before lysis with either Cell-Histone Lysis Buffer or Cell Lysis Buffer from CST. Standard curves were generated in each of the lysis buffers tested and compared to a standard curve generated in Assay Buffer (LANCE Ultra HiBlock buffer) in Figure 4A. Measures of assay sensitivity, determined from the standard curves, are listed in the table below the graph. Raw LANCE assay data generated from cell lysate samples were interpolated off the appropriate standard curves to determine the concentrations of Bcl-2 protein extracted from cells in ng/mL and are presented in Figure 4B. The data indicate that Cell Lysis Buffer from CST is able to extract more Bcl-2 protein from the cell line used (MCF7 cells). The data from
this cellular experiment show increases in Bcl-2 expression with increased numbers of cells in culture. The high sensitivity of the LANCE assay allows for detection of Bcl-2 in even the lowest number of cells tested (313 cells). Also note that since the cultures were lysed with 25 μL of buffer and only 15 μL of lysate was used for the assay, the amount of sample engaged represents only a fraction of the amount of cells plated in each well.
Lysis Buffer
LDL at RT, ng/mL
Dynamic Range EC50, ng/mL S/B
LANCE (Kit) Buffer 0.48 0.48 to 352.6 ng/mL 1.52 58
Histone Lysis Buffer 0.52 0.52 to 172.3 ng/mL 1.63 90
CST Lysis Buffer 0.67 0.67 to 259.3 ng/mL 1.58 89
Figure 4. (A) Bcl-2 standard curves were run in the three different Lysis buffers read on the EnVision plate reader using Laser excitation. LANCE ULight signal (at 665 nm) was normalized to Europium signal (at 615 nm) and data plotted for each curve. LDL, dynamic range, and other components were extrapolated from the curve and listed in the Table below the graph. (B) MCF7 cells plated at seven different densities and grown for four days were lysed with CST and Cell Histone Lysis buffers and amount of Bcl-2 measured and extrapo-lated off the standard curves in (A). All data points are an average of three wells. The dotted lines in (B) represent the LDL of the assay in each lysis buffer.
B
A
5
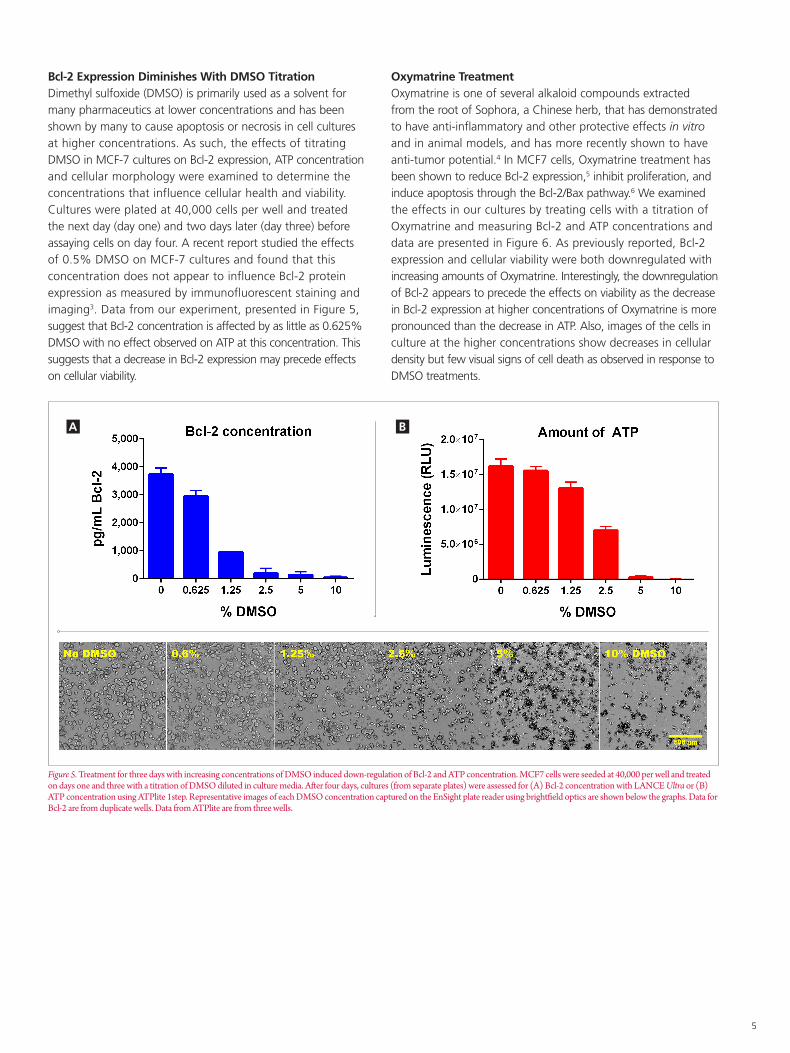
Bcl-2 Expression Diminishes With DMSO Titration Dimethyl sulfoxide (DMSO) is primarily used as a solvent for many pharmaceutics at lower concentrations and has been shown by many to cause apoptosis or necrosis in cell cultures at higher concentrations. As such, the effects of titrating DMSO in MCF-7 cultures on Bcl-2 expression, ATP concentration and cellular morphology were examined to determine the concentrations that influence cellular health and viability. Cultures were plated at 40,000 cells per well and treated the next day (day one) and two days later (day three) before assaying cells on day four. A recent report studied the effects of 0.5% DMSO on MCF-7 cultures and found that this concentration does not appear to influence Bcl-2 protein expression as measured by immunofluorescent staining and imaging3. Data from our experiment, presented in Figure 5, suggest that Bcl-2 concentration is affected by as little as 0.625% DMSO with no effect observed on ATP at this concentration. This suggests that a decrease in Bcl-2 expression may precede effects on cellular viability.
Oxymatrine TreatmentOxymatrine is one of several alkaloid compounds extracted from the root of Sophora, a Chinese herb, that has demonstrated to have anti-inflammatory and other protective effects in vitro and in animal models, and has more recently shown to have anti-tumor potential.4 In MCF7 cells, Oxymatrine treatment has been shown to reduce Bcl-2 expression,5 inhibit proliferation, and induce apoptosis through the Bcl-2/Bax pathway.6 We examined the effects in our cultures by treating cells with a titration of Oxymatrine and measuring Bcl-2 and ATP concentrations and data are presented in Figure 6. As previously reported, Bcl-2 expression and cellular viability were both downregulated with increasing amounts of Oxymatrine. Interestingly, the downregulation of Bcl-2 appears to precede the effects on viability as the decrease in Bcl-2 expression at higher concentrations of Oxymatrine is more pronounced than the decrease in ATP. Also, images of the cells in culture at the higher concentrations show decreases in cellular density but few visual signs of cell death as observed in response to DMSO treatments.
Figure 5. Treatment for three days with increasing concentrations of DMSO induced down-regulation of Bcl-2 and ATP concentration. MCF7 cells were seeded at 40,000 per well and treated on days one and three with a titration of DMSO diluted in culture media. After four days, cultures (from separate plates) were assessed for (A) Bcl-2 concentration with LANCE Ultra or (B) ATP concentration using ATPlite 1step. Representative images of each DMSO concentration captured on the EnSight plate reader using brightfield optics are shown below the graphs. Data for Bcl-2 are from duplicate wells. Data from ATPlite are from three wells.
BA

6
Figure 6. Treatment for three days with increasing concentrations of Oxymatrine. MCF7 cells were seeded at 40,000 per well and treated on days one and three with a titration of Oxymatrine diluted in culture media. After four days, cultures were assessed for (A) Bcl-2 concentration with LANCE Ultra or (B) ATP concentration using ATPlite 1step. Representative images of each Oxymatrine concentration (captured on the EnSight using brightfield optics) are shown below the graphs. Data for Bcl-2 are from duplicate wells. Data from ATPlite are from three wells.
BA
Figure 7. Time in culture increased Bcl-2 expression levels whereas hormone treatments did not. MCF7 cells were seeded at 40,000 per well into two plates and a subset of wells in each were treated with a titration of Prolactin and 17ß-Estradiol diluted in culture media (after 24 and again at 48 hours in culture). One plate was lysed after two days of treatment and the second after three days of treatment and assessed for Bcl-2 concentration. Each bar is an average of four wells.
BA
Bcl-2 Expression Increases Over Time But is Not Influenced by Estradiol and Prolactin TreatmentEstrogens and prolactin (PRL) are implicated in the pathogenesis of breast cancer and may be involved in resistance to chemotherapy through roles they play to antagonize cytotoxicity.7 In MCF7 cells in culture, it has previously been demonstrated that treating cells with either prolactin or estrogen can upregulate Bcl-2 transcription and expression.8,9 In order to examine that effect in our system, we treated 40,000 MCF7 cells with different concentrations of PRL and 17ß-Estradiol and assayed for Bcl-2 expression after two and three days of treatment (Figure 7). To reduce the potential effect of estrogens present in FBS, charcoal-stripped FBS was added to media for both maintaining flask cultures and feeding cells in these experiments.
There appeared to be no apparent effects of PRL (Figure 7A) or 17ß-Estradiol (Figure 7B) treatment at all the concentrations tested in these MCF7 cultures. One possible reason for this is that cells may already have been expressing maximal levels of Bcl-2 due to culture media containing insulin and other supportive factors. In previous reports where PRL effects were observed, cells were grown in DMEM (rather than EMEM) and no insulin was added prior. Additionally, studies that reported effects via estrogen signaling were optimized in cells prepared in DMEM containing 5% FBS without insulin for up to seven days before 17ß-estradiol treatment. Although there was no effect of treatment, there appears to be a definite effect of time grown in culture, presumably due to increases in cellular proliferation.
For a complete listing of our global offices, visit www.perkinelmer.com/ContactUs
Copyright ©2017, PerkinElmer, Inc. All rights reserved. PerkinElmer® is a registered trademark of PerkinElmer, Inc. All other trademarks are the property of their respective owners. 013765_01 PKI
PerkinElmer, Inc. 940 Winter Street Waltham, MA 02451 USA P: (800) 762-4000 or (+1) 203-925-4602www.perkinelmer.com
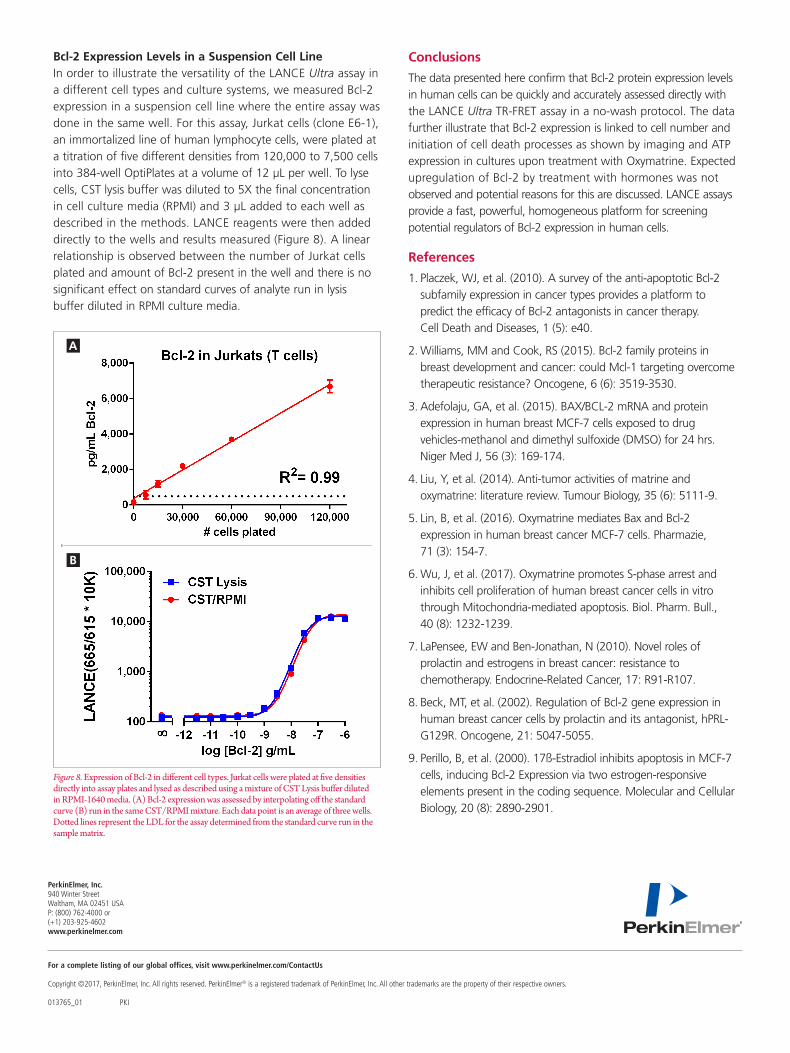
Bcl-2 Expression Levels in a Suspension Cell LineIn order to illustrate the versatility of the LANCE Ultra assay in a different cell types and culture systems, we measured Bcl-2 expression in a suspension cell line where the entire assay was done in the same well. For this assay, Jurkat cells (clone E6-1), an immortalized line of human lymphocyte cells, were plated at a titration of five different densities from 120,000 to 7,500 cells into 384-well OptiPlates at a volume of 12 µL per well. To lyse cells, CST lysis buffer was diluted to 5X the final concentration in cell culture media (RPMI) and 3 µL added to each well as described in the methods. LANCE reagents were then added directly to the wells and results measured (Figure 8). A linear relationship is observed between the number of Jurkat cells plated and amount of Bcl-2 present in the well and there is no significant effect on standard curves of analyte run in lysis buffer diluted in RPMI culture media.
Figure 8. Expression of Bcl-2 in different cell types. Jurkat cells were plated at five densities directly into assay plates and lysed as described using a mixture of CST Lysis buffer diluted in RPMI-1640 media. (A) Bcl-2 expression was assessed by interpolating off the standard curve (B) run in the same CST/RPMI mixture. Each data point is an average of three wells. Dotted lines represent the LDL for the assay determined from the standard curve run in the sample matrix.
B
A
Conclusions
The data presented here confirm that Bcl-2 protein expression levels in human cells can be quickly and accurately assessed directly with the LANCE Ultra TR-FRET assay in a no-wash protocol. The data further illustrate that Bcl-2 expression is linked to cell number and initiation of cell death processes as shown by imaging and ATP expression in cultures upon treatment with Oxymatrine. Expected upregulation of Bcl-2 by treatment with hormones was not observed and potential reasons for this are discussed. LANCE assays provide a fast, powerful, homogeneous platform for screening potential regulators of Bcl-2 expression in human cells.
References
1. Placzek, WJ, et al. (2010). A survey of the anti-apoptotic Bcl-2 subfamily expression in cancer types provides a platform to predict the efficacy of Bcl-2 antagonists in cancer therapy. Cell Death and Diseases, 1 (5): e40.
2. Williams, MM and Cook, RS (2015). Bcl-2 family proteins in breast development and cancer: could Mcl-1 targeting overcome therapeutic resistance? Oncogene, 6 (6): 3519-3530.
3. Adefolaju, GA, et al. (2015). BAX/BCL-2 mRNA and protein expression in human breast MCF-7 cells exposed to drug vehicles-methanol and dimethyl sulfoxide (DMSO) for 24 hrs. Niger Med J, 56 (3): 169-174.
4. Liu, Y, et al. (2014). Anti-tumor activities of matrine and oxymatrine: literature review. Tumour Biology, 35 (6): 5111-9.
5. Lin, B, et al. (2016). Oxymatrine mediates Bax and Bcl-2 expression in human breast cancer MCF-7 cells. Pharmazie, 71 (3): 154-7.
6. Wu, J, et al. (2017). Oxymatrine promotes S-phase arrest and inhibits cell proliferation of human breast cancer cells in vitro through Mitochondria-mediated apoptosis. Biol. Pharm. Bull., 40 (8): 1232-1239.
7. LaPensee, EW and Ben-Jonathan, N (2010). Novel roles of prolactin and estrogens in breast cancer: resistance to chemotherapy. Endocrine-Related Cancer, 17: R91-R107.
8. Beck, MT, et al. (2002). Regulation of Bcl-2 gene expression in human breast cancer cells by prolactin and its antagonist, hPRL-G129R. Oncogene, 21: 5047-5055.
9. Perillo, B, et al. (2000). 17ß-Estradiol inhibits apoptosis in MCF-7 cells, inducing Bcl-2 Expression via two estrogen-responsive elements present in the coding sequence. Molecular and Cellular Biology, 20 (8): 2890-2901.