MIFIRA Framework Lecture 1 Context of food insecurity Chris Barrett and Erin Lentz February 2012.

Cerulogy
Thought for foodA review of the interaction between biofuel consumption and food markets
Author: Dr Chris Malins
September 2017
E F

2 © 2017 Cerulogy
Thought for food
AcknowledgementsWe are grateful for the support of Transport and Environment and Birdlife Europe, who funded this report, and for advice and data shared by Hugo Valin of IIASA and Martin Persson at Chalmers University of Technology. Front cover image by Jane Robertson Design.
DisclaimerThis report was commissioned from Cerulogy by Transport and Environment and Birdlife Europe. The views expressed are those of Cerulogy. Errors and omissions excepted, the content of the report is consistent with the best understanding of Cerulogy at the time of writing, however Cerulogy makes no representations, warranties, undertakings or guarantees relating to the content of report, and accepts no liability in respect of any losses arising related to the use of any information contained or omitted from the report.
Suggested referenceMalins, C. (2017). Thought for food - A review of the interaction between biofuel consumption and food markets. Cerulogy, London.
ContactCerulogy: [email protected]

www.cerulogy.com 3
A review of the interaction between biofuel consumption and food markets
Executive summarySince the adoption of the Biofuel Directive in 2003, the conversion of food commodities into biofuel (ethanol through fermentation of grains and sugars, and biodiesel through trans-esterification of vegetable oils) has been considered an important element of EU transport decarbonisation policy. The resulting expansion of biofuel consumption in the EU has been controversial though, in part because of concerns that using food commodities for energy could increase food prices and negatively affect food security, especially in the developing world. Some stakeholders have questioned the environmental benefits of biofuel policy, and whether these are proportionate to the potential costs, in particular where those costs may be borne in part by the global poor.
It is a basic tenet of economics that an increase of demand for a good can be expected to increase the price of that good, at least in the short to medium term. It is therefore widely assumed that increased demand for food commodities as biofuel feedstock will drive increases in food commodity prices, both domestically in the regions with biofuel mandates, and (because markets are connected by trade) globally. Nevertheless, some biofuel advocates have repeatedly queried the claim that biofuel demand can be expected to cause price rises. The Secretary General of ePURE, the European ethanol producers’ association, wrote in an editorial in March of this year that, “The idea that the EU biofuels policy has had an impact on the global food supply or contributed to hunger is a myth.”1 This is a strong claim, but is it consistent with the evidence available?
In this study, we have considered an extensive literature on the interaction between biofuel demand and food prices. This literature includes over one hundred economic modelling studies of the potential impact on prices of increased biofuel demand2, and over two dozen assessments of the role biofuel demand played in the 2006-08 ‘food price crisis’. The over-whelming consensus in the literature we surveyed is that, as predicted by basic economics, biofuel demand (and hence biofuel policy) results in increased food prices. The size of the impact on prices scales with the size of biofuel demand, though not necessarily linearly, and inversely with the size of the market being affected. The U.S. maize ethanol mandate is expected to impact cereals markets much more strongly than EU ethanol demand, because U.S. demand is much higher. In contrast, EU biodiesel demand is expected to have a larger impact on vegetable oil prices than EU grain ethanol demand has on grain prices, because global vegetable oil production is much less than global grain production. These general con-clusions are consistent with research undertaken for the European Commission (e.g. Laborde, 2011a; Valin et al., 2015), as well as numerous studies by other institutions and independent researchers.
Studies of indirect land use change for the European Commission support an expectation that the increase in biofuel demand from 2010 to 2020 foreseen in the Renewable Energy Directive could be expected to increase global maize and wheat prices by of the order of 1-2%, and global vegetable oil prices by something around 10%. This magnitude of price impact is broadly consistent with the magnitude of price increases identified in extensive review of other price impact studies.
1 http://www.politico.eu/sponsored-content/five-things-you-need-to-know-about-the-food-vs-fuel-debate/
2 Including through the characterisation of the results of these studies by Persson (2014)..

4 © 2017 Cerulogy
Thought for food
There is a broad consensus that biofuel demand, in particular U.S. maize ethanol consumption, played a major role in the food price crisis of 2006-08. Rapid demand growth, much of it for biofuels, led to historically low stocks for a range of commodities in the run-up to the crisis. By contributing to reducing stocks, and by strengthening the connection of food markets to the oil market, biofuels injected additional volatility into the food market.
That said, there is little agreement about the precise fraction of the price increases that should be attributed to biofuel demand (and many studies avoid attempting a numerical characterisation). It would be reasonable to conclude from the assessments available that U.S. maize ethanol demand was responsible for a quarter to three quarters of the increase in global maize prices during the crisis, and had a significant impact on linked markets, such as soybeans and wheat. Similarly, it is reasonable to conclude that EU biodiesel demand played a significant role in increased vegetable oil prices. The EU’s contribution to raised cereals prices was undoubtedly much smaller than the U.S. contribution, partly because of the difference in consumption rates, and partly because EU ethanol demand remained policy led (and hence relatively predictable), whereas in the U.S. ethanol demand started to be led by high oil prices without the need for value from the Renewable Fuel Standard. While some analysts continue to argue that biofuel demand was the dominant factor in starting the food price crisis, the general consensus is that biofuel demand had an important impact on markets for biofuel feedstocks, but relatively little impact on other food commodities (notably rice) that also experienced price spikes at the time. An overview of conclusions from various studies on the impact of biofuels in the food price crisis is provided in Table 1.

www.cerulogy.com 5
A review of the interaction between biofuel consumption and food markets
Table 1. Summary of studies reviewing the food price crisis
Study Associated institution Role of biofuels in food price crisis*
Numerical assessment of role in food price crisis**
Peña-López, 2008 World Bank Moderate to high Not given
Rosegrant, 2008 World Bank Moderate 39% for maize, 21% for rice, 22% for wheat
Lipsky, 2008 IMF High 70% for maize, 40% for soy
Collins, 2008 Kraft Foods Global Moderate to high 25 to 60% of price rise for maize
OECD, 2008b OECD Moderate Not given
Mitchell, 2008 World Bank High to dominant
70-75% of food commodity price increases ascribed to biofuels and ‘related consequences’
Abbott, Hurt, & Tyner, 2008 Farm Foundation Moderate Not given
Timmer, 2008 Asian Development Bank Moderate to high 60-75% of grain price rises
Baier, Clements, Griffiths, & Ihrig, 2009 U.S. Federal Reserve Low to
moderate
27% price increase for maize; 21% price increase for soybean; 12% price increase for sugar
Slayton, 2009 Center for Global Development Moderate Not given
Gecan et al., 2009 U.S. Congressional Budget Office Moderate 28-47% increase in maize price
Sumner, 2009American Journal of Agricultural Economics (journal paper)
Low to moderate Not given
Pfuderer, Davies, & Mitchell, 2010
UK Department for Environment, Farming and Rural Affairs
Moderate Not given
(Wiggins, Keats, & Compton, 2010
Overseas Development Institute
High to dominant 30% of overall rise in prices

6 © 2017 Cerulogy
Thought for food
Gilbert, 2010 Università degli Studi di Trento
Low to moderate Not given
Baffes & Haniotis, 2010 World Bank Moderate Not given
Headey & Fan, 2010 IFPRI Moderate Not given
Wright, 2011Applied Economic Perspectives and Policy (journal paper)
Moderate to high Not given
National Research Council, 2011
U.S. National Research Council Moderate 20-40% increase in agricultural
commodity prices
Hochman, Rajagopal, Timilsina, & Zilberman, 2011
World Bank Low to moderate
20% of maize price increase, 7% of soy price increase, no significant impact on wheat or rice
Hausman, Auffhammer, & Berck, 2012
Environmental and Resource Economics (journal paper)
Moderate 27% of maize price increase
Hochman, Kaplan, Rajagopal, & Zilberman, 2012
Agriculture (journal paper) Moderate 25% increase in soybean and
maize price from 2001-2011.
de Gorter et al., 2013
Global Food Security (journal paper) Dominant Not given
HLPE, 2013 FAO HLPE Moderate Not given
To & Grafton, 2015 Food Security (journal paper) Moderate 38% of U.S. food price increase,
18% of global increase
Tadasse, Algieri, Kalkuhl, & von Braun, 2016
Food Price Volatility and Its Implications for Food Security and Policy (book)
Moderate to high Not given
*Impact assessed on following basis: where biofuels are identified as the most important factor, the role is identified as ‘dominant’; where biofuels are identified as having a strong impact (i.e. more than would be identified through most modelling studies, roughly consistent with driving more than a half of the price increase for maize, and a strong impact on other commodity prices), the role is described as ‘high’; where biofuels are identified as an important contributing factor (roughly consistent with causing a fifth to a half of price rises for maize) the role is described as ‘moderate’; where the role of biofuels is de-emphasised compared to other factors (roughly consistent with causing 5% to 20% of price rises for maize) the role is described as ‘low’. None of the papers reviewed argued that biofuels played no role in the crisis.
** Note that different studies use different numerical comparison points and different time periods. Percentage values may apply to percentage of price increases experienced or to percentage price increases. Some studies consider local prices, some global. We would encourage the reader to confirm interpretations against the original studies before quoting or using any values reported in this table.

www.cerulogy.com 7
A review of the interaction between biofuel consumption and food markets
At the time of writing, food commodity stocks have increased compared to the period of crisis, the oil price has dropped, and the global rate of growth of food-based biofuel production has been much reduced. It therefore seems reasonable to conclude that the contribution of biofuels to food price volatility has significantly reduced in the last ten years, and that there is not an immediate prospect of a repeat of the food price crisis. Nevertheless, as climate change increases the regularity of extreme weather events and poor harvests, biofuel demand will continue to add tension to food commodity markets.
One popular talking point for biofuel advocates is the idea that, because biofuel production results in co-products (primarily distillers’ grains and oilseed meals) being made available for use as livestock feed, biofuel policy results in the production of ‘food and fuel’. Distillers’ grains from ethanol production account for about 5% of the EU consumption of mid- to high-protein animal feeds, with about 7% more being delivered through increased rapeseed crushing to meet biodiesel demand (European Commission, 2017a). This is not a negligible contribution to meeting the needs of the EU’s livestock industry, but it is also not a large enough contribution to fundamentally affect EU dependence on protein feed imports.
While there is no doubt that co-products are an important element of the biofuel industry value proposition, returning these materials to livestock feed markets is not enough to eliminate any negative impacts on food prices. Indirect land use change studies for the European Commission already include the effect of co-products in reducing the impact of biofuel policy on feed availability, as do 95% of studies identified in a comprehensive review of the field (Persson, 2014). Studies of ILUC with the MIRAGE and GLOBIOM models (Laborde, 2011a; Valin et al., 2015) find that co-product availability prevents consumption of animal feed by livestock from being reduced due to biofuel policy, but in neither study does this prevent overall human consumption of food commodities from reducing. The price increase predictions documented in this study are all made despite an explicit recognition of the importance of co-products. It is quite simply inconsistent with the evidence available to claim that biofuels increase food security due to the role of co-products – the food security impact is reduced by co-products but not eliminated.
Based on relations derived from the results of the GLOBIOM study on indirect land use change for the European Commission, we estimate that maintaining food-based biofuel demand at 7% of transport energy to 2030 could result in global vegetable oil prices 8% higher than they would be in the case of a full phase out of food-based fuel demand, and cereal prices 0.6% higher.3 These higher prices would result in $19 billion of additional costs to other consumers of cereals and vegetable oils in 2030. Reducing the cap to 3.8% would approximately halve the price impact from the policy, and correspondingly halve the cost to food consumers. The impact of equilibrium price expectations is additional to the potential for biofuel policy to increase price volatility for food commodities.
Impact on welfarePrice rises for food commodities result in wealth transfers from food consumers to food (and biofuel) producers in the developed world. However, commodity prices for staple foods make only a small contribution to the price of a typical developed world shopping basket – most of
3 The results presented here are not based on full new model runs, and are therefore best understood as indicative of potential impacts, rather than as a precise forecast.

8 © 2017 Cerulogy
Thought for food
the cost of food at the supermarket in the developed world is processing, other more expensive ingredients and other overheads of the food distribution system. This picture is different for poorer food consumers in the developing world, where the price of food staples can represent a third or more of total household spending. Econometric analysis shows that food con-sumption of poor households in the developing world is more sensitive to food commodity prices than consumption in the developed world is, and thus these poorer households will be disproportionately affected by food price increases caused by biofuel demand. While many households in rural communities are food producers and may be able to benefit from increased prices, many other rural households are net food purchasers, as are almost all poor urban households. Many more people stand to lose out from increased food prices than stand to gain (e.g. De Hoyos & Medvedev, 2009).
Various factors (such as tariff barriers, transport costs and under-developed distribution networks) can provide a degree of insulation between world market prices and the food prices paid by poor households locally. In some parts of Africa, global food commodity prices will have only a minimal impact on local prices. However, this is not generally true, and most poor households have a significant degree of exposure to international market prices. Even if only a third of a global price change is passed through to local prices in a given area, this can represent a significant additional cost for people ill-able to afford it. In the absence of compensating actions, European biofuel policies are likely to increase global poverty counts by millions (e.g. De Hoyos & Medvedev, 2009; Wiggins & Mcdonald, 2008). Increased food prices result in food insecurity, and in reduced welfare through reduced income available for non-food needs.
There is a popular caricature that biofuel policy takes food directly from the mouths of the poor to burn in car engines. This caricature is not a fair representation of the truth. Most feedstock for biofuels comes from increasing supply, and to the extent that biofuel demand causes less food to be consumed, much of this reduction is expected to occur in the countries where the biofuel mandates are located (notably the EU and the U.S.). Not all reductions in food consumption are welfare negative; it is not hard to imagine that marginal reductions in sugar, meat and flour consumption in the western world could have a beneficial aspect. Modelling suggests that only a fraction of the feedstock required for biofuel production is delivered by reducing food consumption in the developing world. Still, while the caricature is exagger-ated, it is also not entirely unfounded. The evidence that increasing (or maintaining) demand for food-based biofuels can be expected to increase poverty and reduce food security is compelling, and the vast majority of economic modelling studies do show some reduction in developing world food consumption due to growing biofuel demand. Policy makers should give serious consideration to the balance between the environmental benefits delivered by biofuel policy and the incidental harm done through increased food prices.
ConclusionsThere is a wide consensus among academics and economists that increasing biofuel demand increases food prices, with the highest impact being felt locally in the regions of biofuel con-sumption, but significant impacts being seen at the global level. Claims by biofuel advocates that this is a ‘myth’ stand in wilful contradiction of this evidence base, and are often supported by a variety of disingenuous claims and half-truths.
The argument at the EU policy level about whether biofuels impact food prices has gone

www.cerulogy.com 9
A review of the interaction between biofuel consumption and food markets
on far too long – it is clear that they do. It would be much more productive to have an evidence-informed discussion about what the real expected impacts are, whether they are proportionate to the benefits that can be delivered through food-based biofuel consumption, and what action could be taken to mitigate negative social externalities. It is our hope that this review may help move the EU discussion a little further towards this more productive ground.

10 © 2017 Cerulogy
Thought for food
ContentsAcknowledgements 2
Executive summary 3
Impact on welfare 7
Conclusions 8
Introduction 12
Potential impacts of biofuel consumption on food commodity prices 15
Commodity prices vs. food price indices vs. retail food prices 16
Studies for the European Commission 17
MIRAGE 17
GLOBIOM 20
Renewable Energy Progress Reports 25
Other price impact results 25
Role of biofuels in the 2006-08 food price crisis 28
Role of oil price in increasing food commodity production costs 34
Does a drop in food commodity prices since 2008 disprove the ‘food vs. fuel’ hypothesis? 34
Is there a chance of a repeat of the food price crisis? 35
Conclusions on the food price crisis 37
Price volatility 38
‘Food vs. fuel’ or ‘food and fuel’? 40
Impact of co-products on food markets 40
Co-products in modelling 42
Reference to ‘Reconciling food security and bioenergy: priorities for action’ 43
Food security and welfare 46
Elasticity of food consumption to price 49

www.cerulogy.com 11
A review of the interaction between biofuel consumption and food markets
Potential impacts on food markets of EU biofuel 2030 targets 51
Conclusions 55
References 57
Annex A. Summary of assessments of the role of biofuels in the food price crisis 63

12 © 2017 Cerulogy
Thought for food
IntroductionThe substantial majority of first generation biofuel production for the EU market requires food and feed4 commodities as feedstock, as shown in Figure 1. Since the year 2000, biofuel demand has been one of the main sources of increased demand globally for food commodity crops, notably grains and vegetable oils.
Cereals
Sugars
Virgin vegetable oils
Used cooking oil
Animal fats
Other
Figure 1. Feedstock for EU biofuel, 2014 (European Commission, 2017b)
Ignoring double counting; virgin vegetable oil consists of 68% rapeseed oil, 17% palm oil, 11% soy oil, 4% sunflower oil; cereals consists of 28% wheat, 59% maize, 5% barley, 8% rye; ‘other’ includes cellulosic biomass for second generation fuels.
It is an elementary principle of economics that, all other things being equal, an increase in demand for a good will lead to an increase in the market price of that good. One might therefore expect that increasing biofuel demand would exert an upwards pressure on food prices. To many observers, it appeared that this expectation was confirmed in dramatic fashion in the period from 2006 to 2008, when the prices of commodities including rice, wheat, maize and vegetable oils more than doubled. Prices peaked again in 2011-12, and while those peaks have subsided they remain high in real terms compared to before the crisis, as shown in Table 2 and Figure 2.
4 I.e. commodities that are either used directly for human consumption (food), or that are fed to livestock to produce meat and dairy products (feed). In this report, we will generally use the term ‘food commodities’ to refer to commodities largely destined for any combination of human and livestock consumption.

www.cerulogy.com 13
A review of the interaction between biofuel consumption and food markets
0.00
0.50
1.00
1.50
2.00
2.50
3.00
Maize Palm oil Food price index
Figure 2. Variation in inflation adjusted price of maize, palm oil and a food price index, normalised to average 2005 prices
Data from World Bank Global Economic Monitor Commodities http://databank.worldbank.org/data/reports.aspx?source=global-economic-monitor-commodities
Table 2. Commodity prices remain higher in real terms than prior to the food price crisis of 2006-08
Commodity Price increase (from 2005 average to July 2017)
Maize 49%
Wheat* 32%
Soybean meal 54%
Rice* 47%
Soybean oil 43%
Palm oil 47%
Based on real (inflation adjusted) prices; data from World Bank Global Economic Monitor Commodities http://databank.worldbank.org/data/reports.aspx?source=global-economic-monitor-commodities
*Where multiple grades are given for a commodity, the average is reported.

14 © 2017 Cerulogy
Thought for food
While it is certain that biofuel demand has increased considerably since the year 2000, this coincidence between increases in prices and increases in biofuel production does not in and of itself prove that biofuel demand has been either the primary cause, nor even a contributing cause. The question of the existence and strength of a link between biofuels and food prices has been and remains controversial, and should be taken seriously.
Since 2003’s Biofuel Directive, the conversion of food (and feed) commodities into biofuels has been a significant element of European Union climate policy in transport. However, in 2015 legislation was passed (‘the ILUC Directive’) that limited the contribution of biofuels made from food commodities to meeting EU targets.5 In late 2016, the European Commission proposed a revision to the Renewable Energy Directive that would move from capping the use of food based fuels to gradually phasing it out, proposing a reduction of the share of transport energy delivered from food-based biofuels from 7% in 2020 to 3.8% in 2030 (European Commission, 2016). This shift in policy reflects a changing understanding of the land use change impacts of biofuel production, and of the risk that indirect land use change emissions could seriously undermine the sought after environmental benefits of replacing fossil fuels with biofuels. It also reflects an understanding that producing biofuels from food commodities can put pressure on food markets, increase food prices, and undermine welfare, with a potentially adverse impact on poor households in the developing world.
In this report, we present a review of the scientific evidence base on the impact of biofuels on food markets, prices and security. While the primary focus of this report is on Europe, we also consider evidence relating to the impact of U.S. biofuel demand. We review the available evidence on the impacts expected on food prices in the medium term due to increased biofuel demand, asking whether it is fair to conclude that biofuel mandates are likely to raise food prices in proportion to the size of the mandate. We investigate whether it is fair to conclude that biofuels played a role in the specific circumstance of the rapid price rises seen in the food price crisis of 2006-08. We consider whether biofuel mandates play a specific role in increasing food price volatility, independent of whether they tend to raise equilibrium prices. We review how higher food prices can affect welfare, ask whether it is fair to conclude that biofuel policy can have negative net impacts on global welfare through the impact on food prices, and consider what impact biofuel policy might be expected to have on food consumption and security in the developing world. Finally, we provide indicative estimates of the potential impact on food prices of different levels of EU biofuel consumption in 2030.
5 Cf. http://ec.europa.eu/energy/en/topics/renewable-energy/renewable-energy-directive

www.cerulogy.com 15
A review of the interaction between biofuel consumption and food markets
Potential impacts of biofuel consumption on food commodity pricesThere is an extensive economic modelling literature confirming that biofuel demand is expected to result in increases in food commodity prices, both for biofuel feedstocks themselves and for other related commodities. This conclusion is shared by work undertaken specifically for the European Commission, and a range of other academic and institutional studies.
In reviewing the relationship of biofuel demand to food markets, an obvious place to start is to consider the evidence base on the interaction between biofuel demand and the prices of food commodities, especially those used as biofuel feedstock.
One tool to investigate potential impacts of biofuels on food commodity prices is the use of general equilibrium economic models. These models have been used extensively to estimate the likely land use change implications (and associated ILUC emissions) from increasing biofuel demand, but can also be used to investigate possible price impacts. Equilibrium models work by first setting a baseline in which the modelled part of the world economy is in equilibrium – which is to say that the levels of supply, demand and commodity prices in the model are in balance in the starting baseline. The model is then ‘shocked’, by changing some quantity. In the analysis of biofuels, this generally means imposing an increase in the level of demand for biofuel. With an increase in demand for biofuel comes an increase in demand for biofuel feedstock, and therefore the model is moved out of equilibrium – if nothing else is changed, the amount of feedstock being consumed would be greater than the amount produced. The model must therefore be run iteratively to a new equilibrium. In the new equilibrium, there will have been some combination of an increase in feedstock supply and a decrease in feedstock demand from sectors other than biofuels, in order to bring the system back into balance. Price is one of the primary mechanisms for information transmission in these models. When demand for a commodity increases, price will rise, and then in turn supply will increase and demand will decrease, based on model assumptions about the responsiveness of each to changing prices. These models can either be static, considering only one point in time, or dynamic, modelling an economy developing in to the future. A static model is run to two equilibria, firstly the baseline and secondly the biofuel scenario. These are then compared, with the results representing two possible states of the economy at the same moment in time (generally these models are calibrated as closely as possible to ‘now’). A dynamic model has a current baseline set, and is then run twice, generating new results at set time intervals into the future. In one case, the future economy is assumed to have less biofuel demand, in the second case more biofuel demand. The two sets of results for some specific future time can then be compared to identify the impact of the increased biofuel demand.
The level of price change that is predicted by these models for a given demand change is dependent on how flexible the model considers supply and demand to be. If supply and demand are both very responsive to small changes in price, then the model will predict a small

16 © 2017 Cerulogy
Thought for food
price change. If supply and demand are not very responsive to even larger changes in price, the model will predict a larger price change. It is possible therefore that a model might predict a relatively small change in price, because it predicts a large reduction in food consumption (i.e. a large change in demand). One should therefore be cautious of interpreting a model result that includes only small price changes as implying that biofuel demand would have no impact on welfare. Similarly, a large price change could be consistent with a small impact on people’s food intake (although in that case the impact on their disposable income would be amplified). It is often not possible to fully identify how these different outcomes are balanced from the documentation in a given report.
In general, we should not expect that the magnitude of the price changes predicted by any given model should be consistent with price changes attributed to biofuels during the food price crisis (studies that assess this specifically are discussed later). Firstly, many of the model results discussed below are focused on biofuel demand change in only one region. The impact of one region would be expected to be less than that of all regions combined. Secondly, the results of equilibrium modelling can best be understood as medium term price expectation. They exclude very short term market responses such as those identified as being influenced by biofuel demand by de Gorter, Drabik, & Just (2013) (export bans, speculation by investors and so on), and because the models cannot predict short term price fluctuations for oil and other commodities they exclude non-linear interactions between the biofuel market and unexpected variations in other commodity markets.
Modelled price results should also not be understood as truly long term. Over periods of a decade or more, markets can adjust to new realities in unpredictable ways, through tech-nological innovation and so on. While models can include terms for some level of innovation (yield increase and so on), as timescales get longer it is increasingly difficult to construct a convincing counterfactual, or to provide a useful characterisation of likely productivity changes and production costs.
Commodity prices vs. food price indices vs. retail food pricesBefore starting the review proper, it is useful to take a moment to review what is meant when we talk about food commodity prices, food price indices, and retail food prices. Food commodity prices refers to the largescale wholesale price paid in food commodity trades, prices paid for whole shipments of grain, vegetable oil or seeds. These prices may be quoted on specific exchanges, for instance in the U.S. prices are sometimes quoted from ‘CBOT’ (the Chicago Board of Trade), or on the basis of delivery at a specific port (e.g. the Rotterdam FOB or ‘free on board’ price reflects the price of a shipment of a food commodity loaded on a ship and ready to go). In an economic model, the ‘global’ price can be precisely defined within the model, and price information is transmitted back and forth from the global market to local markets. In reality, difference between prices at different ports or exchanges may reflect transport costs, tariff barriers and different levels of local demand.
Sometimes, rather than quoting prices for a specific commodity such as maize, prices are quoted for groups of commodities (‘cereals’, ‘fats and oils’), and sometimes a ‘food price index’ may be quoted. These aggregate prices are derived by taking some sort of weighted combination of specific market prices. The FAO food price index, for instance, is based on a weighted average of the cereal price index, vegetable oil price index, dairy price index, meat price index and sugar price index. Because various different commodity prices are combined

www.cerulogy.com 17
A review of the interaction between biofuel consumption and food markets
into these index prices, they are less sensitive than single commodity price, and the quoted change in the overall food price index will always be less than the change in individual con-tributing commodity prices.
Finally, retail food prices reflect not only the price of the staple commodities being consumed, but also the costs of processing, of non-staple ingredients, of distribution, of packaging, of marketing, or preparation and so forth. A 10% increase in the price of wheat might result in a much smaller increase in the price of bread, and a much smaller increase again in the price of restaurant burgers. In the developed world in particular, changes in food commodity prices are very much diluted when experienced as retail prices by consumers.
It is important to pay attention to which type of prices are being quoted, as conflating different types of price information can be highly misleading. As an example, during the food price crisis the Chairman of the U.S. President’s Council of Economic Advisers was widely quoted as stating that maize demand for biofuel had only raised the IMF food price index by 3%. However, this reflected a 13% increase in global maize price, and over a third of the total price increase experienced by the maize market in the period considered. In some reviews, the 3% price increase quoted for the IMF food price index is quoted alongside values from other studies for the contribution of biofuel demand to price increases, creating a misleading impression that the results are much more different than they actually are. More generally, it is common for stakeholders interested in downplaying the impact of biofuels on food prices to prefer to talk about price indices or retail prices, while stakeholders interested in emphasising the impact of biofuels on food prices often prefer to talk about local price impacts for single commodities. The reader is encouraged to pay careful attention when reading any papers in this area, especially if comparing claims about price impacts from multiple sources.
Studies for the European CommissionThe European Commission has commissioned several studies into the social and environmen-tal impacts of biofuel policy, several of which include results relevant to food price impacts.
MIRAGETwo studies have been done for the Commission by IFPRI using the general equilibrium MIRAGE model, with a primary focus on indirect land use change emissions (Al-Riffai, Dimaranan, & Laborde, 2010; Laborde, 2011a). Additional results on food prices from the later study were included in the IEEP review of the impact of biofuels on food commodity prices (Kretschmer, Bowyer, & Buckwell, 2012). In Laborde (2011a), the main scenario analysed is one in which the 2020 RED target was met with an 8.4% of transport energy being supplied by food-based biofuels. Based on NREAPS, the study assumed exogenously that biodiesel would supply 72% of this energy and ethanol 28%. In that scenario, the model predicts changes to the world price of maize, wheat and sugars of around 1%, and changes to the main world vegetable oil prices of about 5-10% (Table 3). These prices changes are triggered by 15.5 million tonnes of oil equivalent of additional biofuel demand. This increase in biofuel production requires 7 million tonnes of vegetable oil, 5 million tonnes of wheat, 4 million tonnes of maize and 8 million tonnes of sugar.

18 © 2017 Cerulogy
Thought for food
Table 3. Food price changes (compared to reference scenario) predicted for key commodities due to EU 2020 biofuel demand (Laborde, 2011a)
Commodity Region Price increase
WheatEU27 1.5%
World 1.0%
MaizeEU27 1.1%
World 0.7%
Soybeans EU27 2.6%
World 2.5%
Soy oilEU27 9.8%
World 7.3%
RapeseedEU27 14.1%
World 11.3%
Rapeseed oilEU27 16.4%
World 9.2%
Palm oilEU27 4.4%
World 4.5%
As noted above, changes in food prices are only one side of the picture, the change in food consumption is also of considerable interest. Table 6 of Laborde (2011a) provides a commodity balance sheet for the main scenario, identifying changes in tonnes in demand for materials from biofuels, supply of materials, total change in demand for those materials from other sectors, and total change in demand for those materials from the livestock sector specifi-cally. The table can be difficult to interpret, in particular because the use of physical tonnes obscures some yield issues (e.g. only 10% of sugarcane is actually sugar and a quarter of palm fruit is palm oil) and because some intermediate sectors (oilseed crushing) are included in the demand change numbers6 An adjusted version of that table is shown here in Table 4, with sugarcane/beet converted to sugars, and palm fruit converted to palm oil. Even so, caution should be exercised in comparing numbers on straight mass terms (as other measures such as nutritional content or value may give a more meaningful measure of equivalence).
6 This means that an increase in demand for oilseeds is recorded as a separate sector than biofuel demand, even though that demand is entirely biofuel oriented.

www.cerulogy.com 19
A review of the interaction between biofuel consumption and food markets
Table 4. Adjusted commodity balance sheet from Laborde (2011a), all values in thousand tonnes
Biofuel demand Additional supply
Total demand displace-ment (excluding oilseed crushing)
Livestock demand displacement
Wheat 5,367 -1,596 -6,963 -6,327
Maize 4,353 -2,986 -7,339 -6,472
Sugar from sugar cane and beet 7,662 5,076 -2,586 -1
Soybeans 4,678 -1,890 -1,890
Sunflower 2,676 -344 -344
Rapeseed 7,135 -544 -544
Oil from palm fruit 3,851 5,342 -1,443 -48
Rice -102 -102 418
Other crops -766 -766 -363
Other oil seeds -395 -395 -322
Vegetables and fruits -3,372 -3,372 26
Rapeseed oil 4,457 2,474 -1,983
Soybean oil 2,064 1,271 -793
Sunflower oil 933 1,172 239
DDGS Wheat 2,107 2,107 2,107
DDGS Maize 2,262 2,262 2,262
Beet cake 1,155 1,155 1,155
Palm kernel expeller 60 60 60
Rapeseed meal 3,646 3,646 3,646
Soybean meal 5,463 5,463 5,463
Sunflower meal 703 703 703
Other food -3,139 -3,139 -115
Sum of change 28,686 12,550 (30,982*) -13,138 -586
*Number in brackets shows sum of column, main number excludes co-products from grains and oilseeds to avoid double counting supply).

20 © 2017 Cerulogy
Thought for food
Several points can be taken from the data in Table 4. Firstly, the supply response in the model appears to be comparable to the total demand displacement. Secondly, in mass units, there is very little overall change in livestock feed consumption reported – the increase in avail-ability of co-product distillers’ grains and oil meals cancels out almost exactly reductions in consumption by livestock of wheat, maize, soybeans, rapeseed and sunflower seeds. Taken together, these show that reduced food consumption by people is predicted to be a signifi-cant source of feedstock by the model. The reduced human consumption is seen primarily in cereals (1.5 million tonnes), vegetable and fruits (3.4 million tonnes) ‘other food’ (3 million tonnes), vegetable oils (1 million tonnes overall7) and sugar (2.5 million tonnes), in total about 11 million tonnes. A paper in Science (Searchinger, Edwards, Mulligan, Heimlich, & Plevin, 2015) argues that reduced crop consumption in the MIRAGE model is equivalent to a 34 gCO2e/MJ emissions credit to wheat ethanol and a 23 gCO2e/MJ emissions credit to maize ethanol.
GLOBIOMA more recent study for the Commission undertook similar modelling used the partial equilib-rium GLOBIOM model (Valin et al., 2015).
-60%
-40%
-20%
0%
20%
40%
60%
80%
100%
Whe
at
Ma
ize
Barle
y
Ma
ize si
lage
Suga
r bee
t
Suga
r can
e
Sunf
low
er o
il
Palm
oil
Rape
seed
oil
Soyb
ean
oil
Cer
eal s
traw
Pere
nnia
ls
Shor
t rot
atio
n co
ppic
e
Fore
st re
sidue
s
Star
ch
Suga
r
Veg
oil
EU 2
020
mix
EU 2
020
mix
+ 7%
cap
Ab
and
oned
land
Low
def
ores
tatio
n
V. l
ow d
efor
esta
tion
V. l
ow d
efor
est.
no p
eat
Hig
h d
efor
esta
tion
Area expansion Yield improvement Compensation by co-product
Change in other uses Change in feed Decreased food
Figure 3. Supply and demand responses to shock in various GLOBIOM scenarios
7 Within the vegetable oil market for human consumption, there is also a significant shift predicted from rapeseed oil to palm oil consumption.

www.cerulogy.com 21
A review of the interaction between biofuel consumption and food markets
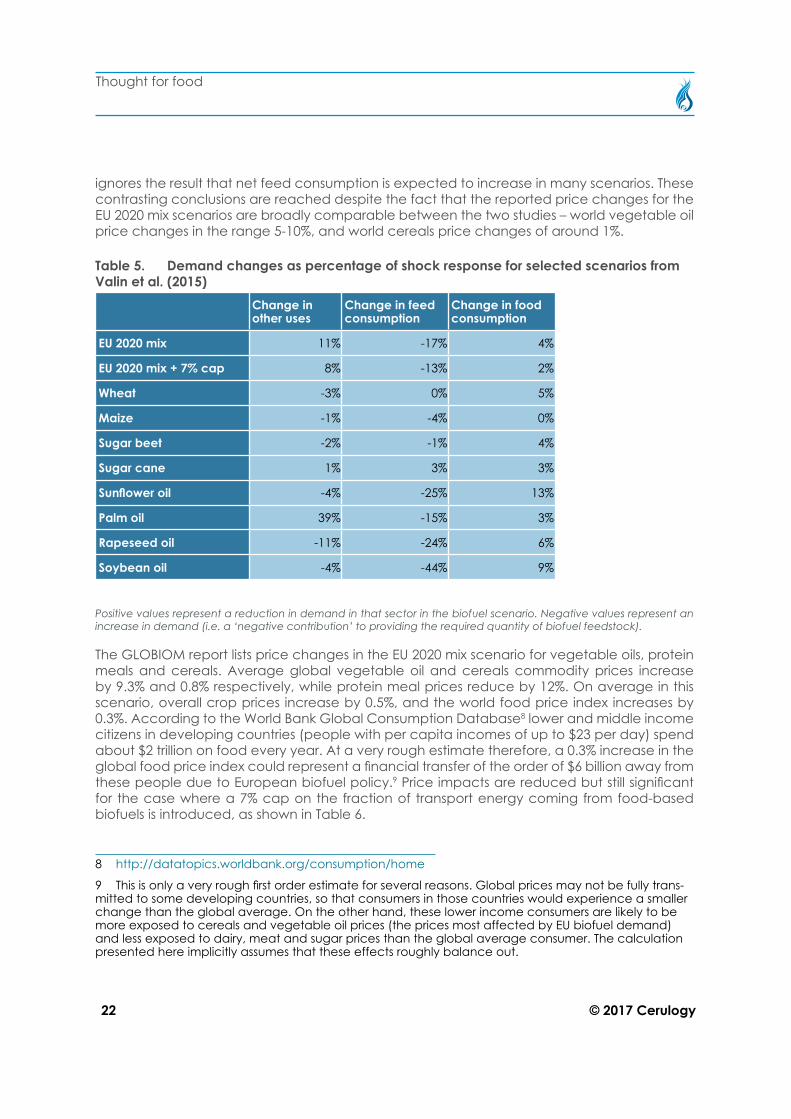
Figure 16 of the GLOBIOM report (see Figure 3 here) provides details of the extent to which changing food and feed consumption contribute to providing the feedstock needed for biofuel production, as compared to changes in supply. In the GLOBIOM report, there is an implicit double counting in these data of the co-product effect. This is because the change marked as ‘decreased feed’ in Figure 16 of the GLOBIOM report is the gross change in con-sumption of primary crop commodities as animal feed, rather than the net change in total feed consumption after co-product availability has been taken into account. In Figure 3, the numbers have been revised by adjusting the reported ‘decreased feed’ term to remove co-products. With this adjustment made, it is apparent that in many scenarios, net animal feed consumption actually increases. It should also be noted that these figures are presented in GLOBIOM in terms of tonnes of dry matter. These numbers do not therefore take into account different nutritional value of different materials, and may not scale directly to the land use impact of each contribution, given variation in yields between crops and regions. The demand change contributions, with the feed consumption change adjusted as described above, for selected scenarios are tabulated in Table 5. We see that for several scenarios, including the main EU mix 2020 scenario, there is an overall increase rather than reduction in demand for tonnes of material in non-biofuel uses once the increased availability of co-products is taken into account. For the soy oil scenario, the increase in consumption in other sectors is actually larger in tonnes than the amount of material used for biofuel production. This likely reflects the fact that co-product soy meal yield from soybeans is much higher (in tonnes) than soy oil yield.
Overall, consumption in the ‘other uses’ sector changes more than consumption in the feed sector, which changes more than consumption in the food sector. The report does not provide any detailed discussion of what is included in the ‘other uses’ sector, why consumption in this sector appears to be more elastic than food consumption, or whether ‘other uses’ could include any industrial processing that might produce food for human consumption as an output. The GLOBIOM model is calibrated to FAOstat data, which identify ‘other uses’ as the utilisation of about 60% of palm oil in 2010 (and a similar fraction for other years), with food accounting for only 30% of palm oil use. This contrasts with other estimates of disposition of palm oil, for instance WWF (Noleppa & Cartsburg, 2016) report that 68% of palm oil globally is used for food applications. FAO note that the other uses category in the food balance sheets includes data discrepancies, and an examination of the underlying data suggests strongly that some food uses are being recorded in the other uses category (for instance for the USA no usage of palm oil for food is recorded in the period 2010-2013). We therefore conclude that for palm oil at least, and potentially for other commodities included in GLOBIOM, some of the material classified as destined for ‘other uses’ is in fact used for human consumption. Indeed, for palm oil food use is probably underestimated by a factor of about two, and industrial uses overestimated by a factor of about two.
Only a fairly small fraction of biofuel feedstock is explicitly modelled in GLOBIOM as delivered by reducing human food consumption. Having said that, even for scenarios where there is a net increase in consumption in other sectors overall, the results still show a non-negligible reduction in human food consumption (in tonnes) associated with increasing biofuel demand, except for the maize scenario where there is no significant reported change in human food consumption. While these numbers are not completely comparable to the data discussed above from Laborde (2011a), it seems clear that MIRAGE expects a larger impact from biofuel demand on food consumption than does GLOBIOM. In the MIRAGE model, we saw that net demand change made a large contribution (on a tonnes basis) to meeting additional biofuel demand. In GLOBIOM, the contribution of demand change is much more modest, even if one
22 © 2017 Cerulogy
Thought for food
ignores the result that net feed consumption is expected to increase in many scenarios. These contrasting conclusions are reached despite the fact that the reported price changes for the EU 2020 mix scenarios are broadly comparable between the two studies – world vegetable oil price changes in the range 5-10%, and world cereals price changes of around 1%.
Table 5. Demand changes as percentage of shock response for selected scenarios from Valin et al. (2015)
Change in other uses
Change in feed consumption
Change in food consumption
EU 2020 mix 11% -17% 4%
EU 2020 mix + 7% cap 8% -13% 2%
Wheat -3% 0% 5%
Maize -1% -4% 0%
Sugar beet -2% -1% 4%
Sugar cane 1% 3% 3%
Sunflower oil -4% -25% 13%
Palm oil 39% -15% 3%
Rapeseed oil -11% -24% 6%
Soybean oil -4% -44% 9%
Positive values represent a reduction in demand in that sector in the biofuel scenario. Negative values represent an increase in demand (i.e. a ‘negative contribution’ to providing the required quantity of biofuel feedstock).
The GLOBIOM report lists price changes in the EU 2020 mix scenario for vegetable oils, protein meals and cereals. Average global vegetable oil and cereals commodity prices increase by 9.3% and 0.8% respectively, while protein meal prices reduce by 12%. On average in this scenario, overall crop prices increase by 0.5%, and the world food price index increases by 0.3%. According to the World Bank Global Consumption Database8 lower and middle income citizens in developing countries (people with per capita incomes of up to $23 per day) spend about $2 trillion on food every year. At a very rough estimate therefore, a 0.3% increase in the global food price index could represent a financial transfer of the order of $6 billion away from these people due to European biofuel policy.9 Price impacts are reduced but still significant for the case where a 7% cap on the fraction of transport energy coming from food-based biofuels is introduced, as shown in Table 6.
8 http://datatopics.worldbank.org/consumption/home
9 This is only a very rough first order estimate for several reasons. Global prices may not be fully trans-mitted to some developing countries, so that consumers in those countries would experience a smaller change than the global average. On the other hand, these lower income consumers are likely to be more exposed to cereals and vegetable oil prices (the prices most affected by EU biofuel demand) and less exposed to dairy, meat and sugar prices than the global average consumer. The calculation presented here implicitly assumes that these effects roughly balance out.

www.cerulogy.com 23
A review of the interaction between biofuel consumption and food markets
Table 6. Price changes by region anticipated for maize, wheat and vegetable oils in the EU mix 2020 scenario with 7% cap (Valin et al., 2015)
EU World average
Maize 3.4% 0.5%
Wheat 3.7% 0.7%
Vegetable oils 19.4% 5.1%
Protein meals -13.0% -7.5%
For many of the feedstock specific scenarios, the GLOBIOM report states that ‘food prices are unaffected’, but we note that this language is used for any food price index change below that is below 0.05% (i.e. this language includes cases where there is a non-zero impact but it is rounded to zero). Price impacts on the primary feedstock in the feedstock specific scenarios are shown in Table 7.
Table 7. Changes in feedstock prices reported for key feedstocks in GLOBIOM single-feedstock scenarios
Feedstock price local*
Feedstock price global
Wheat 12.0% 1.8%
Maize 4.0% 0.4%
Barley 18.0% 6.0%
Sugar beet 7.4% 7.4%
Sugar cane 0.8% 0.0%
Sunflower oil 16.7% 8.3%
Palm oil* 4.2% 2.1%
Rapeseed oil 28.0% 7.0%
Soybean oil 44.5% 10.8%
*Local means EU for all feedstocks except palm oil, where it means Southeast Asia.
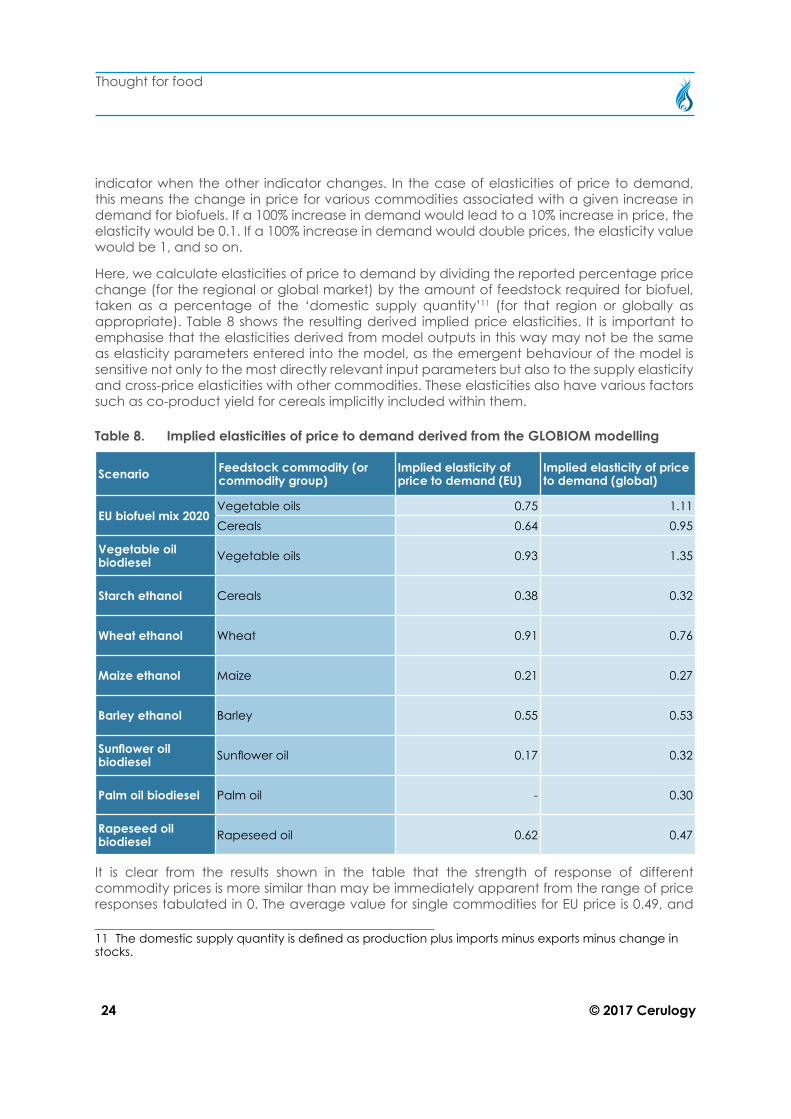
It is difficult to get a clear understanding of reported price changes without having a sense of the size of the underlying commodity markets. For example, a 10% increase in the price of wheat will have more impact on consumers than a 30% rise in the price of cocoa, because the wheat market is so much larger than the cocoa market. In order to make the reported price changes from GLOBIOM more comparable, we have combined them with data from the FAOstat Food Balance Sheets10 to derive implied ‘elasticities’ of price to demand. The elasticity of one economic indicator to another is a measure of the expected fractional change in that
10 http://www.fao.org/faostat/en/#data/FBS
24 © 2017 Cerulogy
Thought for food
indicator when the other indicator changes. In the case of elasticities of price to demand, this means the change in price for various commodities associated with a given increase in demand for biofuels. If a 100% increase in demand would lead to a 10% increase in price, the elasticity would be 0.1. If a 100% increase in demand would double prices, the elasticity value would be 1, and so on.
Here, we calculate elasticities of price to demand by dividing the reported percentage price change (for the regional or global market) by the amount of feedstock required for biofuel, taken as a percentage of the ‘domestic supply quantity’11 (for that region or globally as appropriate). Table 8 shows the resulting derived implied price elasticities. It is important to emphasise that the elasticities derived from model outputs in this way may not be the same as elasticity parameters entered into the model, as the emergent behaviour of the model is sensitive not only to the most directly relevant input parameters but also to the supply elasticity and cross-price elasticities with other commodities. These elasticities also have various factors such as co-product yield for cereals implicitly included within them.
Table 8. Implied elasticities of price to demand derived from the GLOBIOM modelling
Scenario Feedstock commodity (or commodity group)
Implied elasticity of price to demand (EU)
Implied elasticity of price to demand (global)
EU biofuel mix 2020 Vegetable oils 0.75 1.11Cereals 0.64 0.95
Vegetable oil biodiesel Vegetable oils 0.93 1.35
Starch ethanol Cereals 0.38 0.32
Wheat ethanol Wheat 0.91 0.76
Maize ethanol Maize 0.21 0.27
Barley ethanol Barley 0.55 0.53
Sunflower oil biodiesel Sunflower oil 0.17 0.32
Palm oil biodiesel Palm oil - 0.30
Rapeseed oil biodiesel Rapeseed oil 0.62 0.47
It is clear from the results shown in the table that the strength of response of different commodity prices is more similar than may be immediately apparent from the range of price responses tabulated in 0. The average value for single commodities for EU price is 0.49, and
11 The domestic supply quantity is defined as production plus imports minus exports minus change in stocks.

www.cerulogy.com 25
A review of the interaction between biofuel consumption and food markets
for world price is 0.44. The EU price elasticity and world price elasticity to demand are broadly comparable in all cases, though with significant variation. There is still a considerable range in the calculated elasticity values, from 0.17 (for EU sunflower oil in the sunflower oil biodiesel scenario) to 1.35 (for vegetable oils as a whole in the vegetable oils scenario). The reasons for these variations between feedstocks are not generally immediately obvious, but likely reflect to some extent the level of price transmission into other related commodity markets, and the degree of assumed supply elasticity for the commodities in question (with higher supply elasticity resulting in lower calculated price elasticity to demand).
Renewable Energy Progress ReportsThe question of the relationship between biofuel demand and food prices is also considered in the European Commission’s Renewable Energy Progress Reports12. This question is first considered in the 2013 progress report (European Commission, 2013), which notes that, “Commission analysis has found that grain use for bioethanol production constituted 3% of total cereal use in 2010/2011 and is estimated to have minor (1%-2%) price effect on the global cereals market,” while, “EU biodiesel consumption is greater, and the estimated price effect on food oil crops (rapeseed, soybean, palm oil) for 2008 and 2010 was 4%.” These conclusions are based on a sustainability assessment (Hamelinck et al., 2013) which included backcast modelling of the presumed impact of biofuel demand on commodity prices from 2001 to 2010. This modelling found that global increases in biofuel demand increased overall crop prices by 17.4 % in 2010 against a baseline without biofuel demand, including increases of 37.2% for coarse grains, 20.7% for wheat, and 8.1% for rice. The EU contribution to these increases was, however, relatively modest. While the 2013 Renewable Energy Progress Report (European Commission, 2013) correctly characterises the estimated impacts on cereals, it erroneously understates the modelled impact on oilseeds markets. The quoted 4% price increase actually refers not only to food oil crops, but to all ‘other food’ crops. The impact on oilseeds specifi-cally would be presumably somewhat larger than this, and the impact on vegetable oil prices somewhat larger than that. The underlying report notes that, “the role of EU-27 biodiesel use has been somewhat significant in pushing up other food prices, notably prices of oilseeds and vegetable oils.” This report also estimates that EU biofuel demand reduced consumption of cereals for food in least developed countries by about 1 million tonnes in 2010 (of an 18 million tonne reduction in cereal consumption for food associated with biofuel demand globally). This is equivalent to about 5% of feedstock for European grain ethanol production being sourced by reducing food consumption in least developed countries.
The 2017 progress report (European Commission, 2017b) emphasised reduced agricultural commodity prices over the period from 2012 to 2015, with reduced vegetable oil prices being associated to reductions in demand for vegetable oil for biodiesel. The impact of EU ethanol consumption on cereal prices is characterised as ‘negligible’, but this is based on the observa-tion that the EU accounted for only 7% of the global grain ethanol market, rather than on any more detailed analysis.
Other price impact resultsAs well as the European Commission, a wide range of analysts from other national and
12 http://ec.europa.eu/energy/en/topics/renewable-energy/progress-reports

26 © 2017 Cerulogy
Thought for food
international institutions and from academia have considered the impact of biofuel demand in the EU and/or U.S. on food commodity prices.
Chakravorty, Hubert, Moreaux, & Nøstbakken, (2017) model the impact of increasing demand from EU and US biofuel policies on weighted food prices13, predicting a 17% additional increase by 2022. Roberts & Schlenker (2010) conclude that the U.S. Renewable Fuel Standard will raise global maize prices by around 20%, at a cost of about $100 billion to maize consumers. The OECD (OECD, 2008a) report that, compared to a case with no biofuel policies, over the period 2013-2017 biofuel support policy would raise vegetable oil prices by about 35%, coarse grains prices by 10%, and wheat prices by 6%, concluding that, “Biofuels support policies have significant impacts on global commodity prices.” Laborde (2011b) summarised the existing literature on price changes due to biofuels by saying that, “Simulation models – looking at long-term equilibrium – consider that biofuels increase world prices by less than 2 percent for wheat, about 4–15 percent for corn, and 15–40 percent for vegetable oils.”
A 2012 review by the Institute for European Environmental Policy (IEEP) (Kretschmer et al., 2012) provides the characterisation of potential price impacts of EU biofuel policy (2020 targets) shown in Table 9. It is important to note, however, that there are significant differences between the models considered, and that the reported prices are not consistent – some represent EU local prices, others represent global price changes. Results from European Commission modelling with the Europe-only ESIM model (Blanco Fonseca et al., 2010) are outliers in terms of predicting strong price impacts for maize and sugar.
Table 9. Range of potential price impacts modelled for EU biofuel policy (Kretschmer et al., 2012)
Commodity (or group) Range of price effects modelled
Oilseeds 8-20%
Vegetable oils 1-36%
Cereals/maize 1-22%
Wheat 1-13%
Sugar (cane/beet) 1-21%
The IEEP conclude that, in the context of EU biofuel policy, “the impacts on biodiesel feedstock prices are more pronounced than those on ethanol feedstock.”
The most comprehensive analytical review (of which we are aware) of results regarding the impact of biofuels on food prices is provided by Persson (2014). This review identified 121 academic studies that assessed the impact of biofuel demand on commodity prices, the con-siderable majority of which were economic modelling studies. Using data from these studies, the review was able to identify the modelled impact of biofuels on one or more categories of commodity price for 433 scenarios. The review normalises these results to give what it refers to as a ‘biofuel multiplier’ for each scenario – that is, the % increase calculated for a given commodity price for every exajoules of additional modelled annual biofuel demand (“%/EJ”).
13 A weighted average by consumption of meat and cereals prices.

www.cerulogy.com 27
A review of the interaction between biofuel consumption and food markets
For U.S. maize ethanol scenarios, the average14 biofuel multiplier on the U.S. maize price is 32%/EJ. That means that for every exajoule of additional maize ethanol demand in the U.S., one would expect the U.S. maize price to increase by 32%/EJ. The biofuel multiplier from maize ethanol demand on U.S. wheat and soy prices is reported as ‘half that’, so around 16%/EJ (i.e. the prices of these commodities rise in response to maize demand; precise values are not reported). The average biofuel multiplier from U.S. maize ethanol demand on the world maize (or coarse grain) price is reported as 23%/EJ.
For EU biodiesel, a much larger average biofuel multiplier of 171% is reported for EU vegetable oil prices, with a 25% biofuel multiplier for EU oilseed prices. At the global level, increased biodiesel demand is associated with an average 38% multiplier on vegetable oil prices, and an average 8% multiplier on oilseed prices. Results for sugar and wheat ethanol scenarios are not directly reported in the text of the paper, but based on information included in Persson’s Figure 2, we estimate that the biofuel multiplier of wheat ethanol demand on the world wheat price is about 20%/EJ, and of sugar based ethanol on the world sugar price is about 40%/EJ.
In 2020, it is anticipated (Valin et al., 2015) that the Renewable Energy Directive (with a 7% cap on the percentage of transport energy delivered by food based fuels in any Member State) would require about 0.15 EJ of grain ethanol, 0.05 EJ of sugar ethanol and 0.62 EJ of biodiesel. The results reviewed by Persson (2014) would then be consistent with the world price changes for key commodities shown in Table 10. These results are comparable but a little higher than the global price increase results reported by Valin et al. (2015) for this scenario (0.8% increase in cereals prices, 9.3% increase in vegetable oil prices).
Table 10. Estimated impact on world food commodity prices due to EU biofuel demand in 2020, given a 7% cap on food-based biofuels
Commodity
World price change
Full mandateIncrease 2010-2020
Wheat 2.2% 1.6%
Maize 1.8% 1.7%
Sugar 2.2% 0.8%
Vegetable oil 23.5% 11.1%
When considering the potential price change implications of the full 2020 mandate in this way, it is again important to consider the timescale in question. European biofuel demand will have been increasing more or less steadily for 20 years by 2020, so the sort of medium term price change estimates produced in the models considered may tend to overstate the difference between full 2020 biofuel mandate compliance and a scenario where biofuels were never introduced to the energy mix. Going the other way, if biofuel support were to be phased out overnight, the sudden change in the supply-demand balance would likely cause a degree of short-term destabilisation of the food commodity markets, perhaps causing a much stronger short-term price drop. For a phase out of support policy over a period of a decade, however, these modelled price changes should provide a useful indication of potential impact.
14 We report here the value reported in Persson (2014) tas averaged across studies, rather than sce-narios. It is not explicit whether the other values we report are also averaged across studies or are aver-aged across scenarios.

28 © 2017 Cerulogy
Thought for food
Role of biofuels in the 2006-08 food price crisisThere is broad consensus that biofuel demand played a significant role in the food price crisis of 2008. The use of maize ethanol in the U.S. made a large contribution (20-70%) to increases in maize prices. EU biofuel consumption at the time was much smaller, and had a proportionately smaller impact, but likely made a significant contribution to increases in vegetable oil prices. While a small number of authors consider biofuels to have been the primary driver of the crisis, it seems likely that a number of other factors also made major contributions.
If there was a single event that propelled the food vs. fuel discussion to global prominence, it was the food price spike of 200815, and accompanying claims that biofuels had been a major driver of the phenomenon.
0
50
100
150
200
250
1990 1992 1994 1996 1998 2000 2002 2004 2006 2008 2010 2012 2014 2016
FAO
pric
e in
dic
es (d
efla
ted
, 200
2-04
= 1
00)
Food Price Index Cereals Price Index Vegetable Oils Price Index
Figure 4. Change in FAO inflation-adjusted price indices for food, cereals and vegetable oils, over the period 1990-2016
15 The food price crisis actually evolved over several years, and is often referred to as the price spike of 2006-08 or 2006-07 (or in some earlier literature as the price spike of 2006-07.
www.cerulogy.com 29
A review of the interaction between biofuel consumption and food markets
As shown in Figure 4, from the start of 2006 through to mid-2008, FAO global price indices for cereals and for vegetable oils more than doubled, while the overall food price index (based on a weighted average of a range of underlying prices) rose by more than 60% (Figure 4). Riots associated with high food prices were reported in more than 30 countries (ActionAid, 2011). The apparent synchronicity between these price rises and growing policy-driven demand for biofuel begged the question of whether biofuel policies adopted in the U.S. and Europe had contributed to the crisis. A second price spike in 2011 served to reinforce the sense for some commentators that growing biofuel demand had helped to move the world into a period of increasing food price volatility and food security risk.
On the other side of the argument, some biofuel advocates have repeatedly rejected arguments for a link between increasing biofuel demand and the food price crises, and the topic is a perennial favourite for inclusion in biofuel industry ‘myth busters’.
One relatively widely reported16 estimate from the World Bank (Mitchell, 2008) associated biofuel demand with up to 75% of the food price increases seen in the spike. The World Bank paper states that:
“The combination of higher energy prices and related increases in fertilizer prices and transport costs, and dollar weakness caused food prices to rise by about 35–40 percentage points from January 2002 until June 2008. These factors explain 25–30 percent of the total price increase, and most of the remaining 70–75 percent increase in food commodities prices was due to biofuels and the related consequences of low grain stocks, large land use shifts, speculative activity and export bans.”
Clearly, the author of this paper considered biofuel demand to be a key driver of the food price spike. On the other hand, it is also apparent from the detail of the report that the picture is more complicated than simply pinning 75% of responsibility on the biofuels industry. In this paper, several related market phenomena including commodity speculation, export bans and reductions in grain stocks are associated to biofuel demand. Other analysis treats these phenomena more independently. A good example of a paper that narratively separates these from biofuel demand is a second World Bank study, by different authors, which was published in 2010 (Baffes & Haniotis, 2010). This second study reports, “that the effect of biofuels on food prices has not been as large as originally thought, but that the use of commodities by financial investors (the so-called ‘financialization of commodities’) may have been partly responsible for the 2007/08 spike.”
The publication of the second paper was greeted by some industry lobbyists as a vindica-tion of their position that there is no impact of biofuel demand on food prices. Tom Buis of Growth Energy claimed that it, “dispelled the myths and lies perpetuated by those who tried to say there was a ‘food-versus-fuel’ issue.”17 Unfortunately this is, at best, a mischaracterisa-tion of what is concluded by the second World Bank report. The second World Bank team concluded that speculation was a major driver but that, “Biofuels played some role too, but
16 E.g. https://www.theguardian.com/environment/2008/jul/03/biofuels.renewableenergy; http://www.telegraph.co.uk/news/earth/earthnews/3346258/Biofuels-cause-75pc-increase-in-food-prices-report-says.html; http://www.globalresearch.ca/world-bank-secret-report-confirms-biofuel-cause-of-world-food-crisis/9547; https://www.theglobeandmail.com/report-on-business/rob-magazine/food-vs-fuel/article793443/;
17 http://www.growthenergy.org/news-media/press-releases/world-bank-study-debunks-food-vs-fuel-myth/
30 © 2017 Cerulogy
Thought for food
much less than initially thought.” There is a very great difference indeed between concluding that biofuels drove less than 75% of the price spike and concluding that there is no impact of biofuel demand on food markets. Indeed, Malins, Searle, & Baral (2014) concluded in an earlier review of the question that, “while the extent to which biofuels may be a driver of price spikes and volatility is controversial, there is wide consensus … that biofuels do increase price volatility and that increased food prices will be a medium-term consequence of biofuel mandates.”
A strong version of the case that biofuel demand had a dominant role in setting off the price crisis is presented in a review of the 2008 food price spike by a group of economists from Cornell (de Gorter et al., 2013). This study asserts that the definitive event that precipitated the food price crisis from 2006 to 2008 was that a combination of biofuel incentives in the United States and the phase out of MTBE as a fuel additive created a direct link between oil prices and food commodity prices (Rausser & De Gorter, 2013). This is based primarily on the observa-tion that from January 2004 to September 2006, USDA ERS data18 show that maize prices were more or less stable (falling slightly through the period) and not well correlated to ethanol prices despite a doubling of oil prices, but that beyond October 200619 maize price rose significantly was responsive to ethanol and that from September 2007 (once the markets had found a new equilibrium) maize prices and ethanol prices have been strongly correlated.
Following the formation of the price link between oil and maize, the de Gorter paper notes that Central Illinois farm maize prices rose by 88% in six months. These rapid price increases are linked to the ‘tortilla riots’ in Mexico on early 200720, and the Mexican tortilla riots are in turn identified as having precipitated government action to limit wheat exports, starting with India and Ukraine (Fouad & Gillson, 2015). The ongoing price rises that were intensified by these export bans led in turn to an Indian rice export ban, which is seen as a major contributor to subsequent increases instability in rice prices (Slayton, 2009). The de Gorter paper comments on the high correlation observed between rising maize prices and rising prices for other com-modities that:
This is expected as there are very high correlation coefficients between these crop prices (the correlation between corn and soybean prices equal that with wheat prices). Both wheat and rice compete for land with coarse grains and oilseeds in various parts of the world, while wheat can be fed to livestock and is substitutable for rice in human consumption (e.g. India), and so the high correlation of other crop prices with rice prices should not be that big of a surprise.
The de Gorter paper concludes that:
Biofuel policies ushered in a new era of high grain/oilseed prices which would have been permanent had it not been for the 2008 financial crisis that induced the most severe world economic recession since the Great Depression. But even with sluggish world economic growth post-2008, some grain and oilseed prices surpassed their 2008 peak in 2011 and again in 2012 with the US drought, the effects of which have been exacerbated by biofuel policies.
18 https://www.ers.usda.gov/data-products/feed-grains-database/feed-grains-yearbook-tables/
19 See also Enders & Holt (2012), who place the break point from one price regime to the next in Au-gust of 2006.
20 http://news.bbc.co.uk/1/hi/6319093.stm

www.cerulogy.com 31
A review of the interaction between biofuel consumption and food markets
It is relevant to note that this narrative for the formation of the food price crisis from 2006-08 is distinct from the narrative linking biofuel demand more generally to medium term food price changes. Much of the discussion and modelling of medium term price impacts hinges on the idea that biofuel demand shifts the fundamental supply-demand balance of the market, with price increasing as demand outpaces supply. The association posited by the de Gorter paper is much more specific to the market circumstances of the time, arguing that the link from the oil market to biofuels caused a food price spike because corn gained a fundamentally higher value as an energy substitute than it had in the pre-2006 price regime. The associated price rise only came into effect due to the combination of policy-led biofuel demand and high oil prices, whereas medium term assessments of the impact of policy-led biofuel demand on food prices show an impact even for the case of relatively low oil prices (although affected by them). It should also be noted that this narrative is very much specific to the U.S. maize ethanol market. It is not claimed that this same market dynamic applied to EU ethanol markets, or to biodiesel demand in general.
While the narrative presented in the de Gorter paper identified biofuel demand in the U.S. firmly as the instigator of the 2008 food price crisis, it also acknowledges that other theories have been propounded. For instance, while Enders and Holt (2012) provide statistical analysis that supports the hypothesis that that was a fundamental change in maize price dynamics in 2006, that same analysis places the break in wheat prices seven months earlier. If the start of the wheat price spike does indeed precede the maize price spike, this provides support to the hypothesis that droughts in wheat producing regions catalysed the beginning of the crisis somewhat before the oil-maize price link took off. It is also acknowledged that several studies see the rice crisis as fundamentally distinct from the maize/wheat price spikes, for instance, one paper argues that, “While the world rice crisis was undoubtedly shaped to some extent by the same broad events that contributed to price spikes in other world food markets, the world rice economy took on a dynamic of its own, especially in early 2008” (Dawe, 2010). It is also important to note that while the timeline of events and policy decisions presented by de Gorter et al. (2013) is plausible, there were many influences feeding into decision making in the countries that reacted to rising food prices in 2007 by imposing export restrictions. The rising price of maize and wheat provided context, but the actual decisions taken were also influenced by domestic political considerations and so forth (Slayton, 2009). Even if one accepts the premise that the enhanced link between oil and corn prices triggered the food price crisis, one could debate what fraction of the impact could or should be attributed to biofuels as against other contributing causes.
De Gorter et al. (2013) makes the case that biofuel demand was a primary contributor to the 2006-08 price crisis, but most other assessments of the crisis come to more moderate conclu-sions. Table 11 provides an overview of a variety of other studies that considered the role of biofuel demand in the food price crisis, including a characterisation of the role attributed to biofuel demand in driving the crisis. There is clearly a significant range in the conclusions of the studies considered, but points of relative consensus do emerge. No study considered argues that biofuel demand had no role in the price spikes. The clear majority of studies conclude that the impact of biofuel demand is felt most strongly in the prices of commodities actually used for biofuel feedstock (notably maize and vegetable oils), to a lesser extent in the most substi-tutable commodities (soybeans and wheat) and much less, if at all, in the rice market. Biofuel demand is generally understood to have contributed to prices primarily through reducing stocks and increasing demand faster than production, though a number of papers emphasise the particular role of the U.S. ethanol market in creating a direct link from oil prices to food

32 © 2017 Cerulogy
Thought for food
commodity prices. Where a quantification of impact is made, it is generally concluded that biofuels contributed at least 20% of the price increases for maize. Further discussion of these studies is included in the Annex.
Table 11. Summary of studies reviewing the food price crisis
Study Associated institution
Role of biofuels in food price crisis*
Numerical assessment of role in food price crisis**
Peña-López, 2008 World Bank Moderate to high Not given
Rosegrant, 2008 World Bank Moderate 39% for maize, 21% for rice, 22% for wheat
Lipsky, 2008 IMF High 70% for maize, 40% for soy
Collins, 2008 Kraft Foods Global Moderate to high 25 to 60% of price rise for maize
OECD, 2008b OECD Moderate Not given
Mitchell, 2008 World Bank High to dominant
70-75% of food commodity price increases ascribed to biofuels and ‘related consequences’
Abbott, Hurt, & Tyner, 2008 Farm Foundation Moderate Not given
Timmer, 2008 Asian Development Bank Moderate to high 60-75% of grain price rises
Baier, Clements, Griffiths, & Ihrig, 2009 U.S. Federal Reserve Low to
moderate
27% price increase for maize; 21% price increase for soybean; 12% price increase for sugar
Slayton, 2009 Center for Global Development Moderate Not given
Gecan et al., 2009 U.S. Congressional Budget Office Moderate 28-47% increase in maize price
Sumner, 2009American Journal of Agricultural Economics (journal paper)
Low to moderate Not given
Pfuderer, Davies, & Mitchell, 2010
UK Department for Environment, Farming and Rural Affairs
Moderate Not given

www.cerulogy.com 33
A review of the interaction between biofuel consumption and food markets
(Wiggins, Keats, & Compton, 2010
Overseas Development Institute
High to dominant 30% of overall rise in prices
Gilbert, 2010 Università degli Studi di Trento
Low to moderate Not given
Baffes & Haniotis, 2010 World Bank Moderate Not given
Headey & Fan, 2010 IFPRI Moderate Not given
Wright, 2011Applied Economic Perspectives and Policy (journal paper)
Moderate to high Not given
National Research Council, 2011
U.S. National Research Council Moderate 20-40% increase in agricultural
commodity prices
Hochman, Rajagopal, Timilsina, & Zilberman, 2011
World Bank Low to moderate
20% of maize price increase, 7% of soy price increase, no significant impact on wheat or rice
Hausman, Auffhammer, & Berck, 2012
Environmental and Resource Economics (journal paper)
Moderate 27% of maize price increase
Hochman, Kaplan, Rajagopal, & Zilberman, 2012
Agriculture (journal paper) Moderate 25% increase in soybean and
maize price from 2001-2011.
de Gorter et al., 2013
Global Food Security (journal paper) Dominant Not given
HLPE, 2013 FAO HLPE Moderate Not given
To & Grafton, 2015 Food Security (journal paper) Moderate 38% of U.S. food price increase,
18% of global increase
Tadasse, Algieri, Kalkuhl, & von Braun, 2016
Food Price Volatility and Its Implications for Food Security and Policy (book)
Moderate to high Not given
*Impact assessed on following basis: where biofuels are identified as the most important factor, the role is identified as ‘dominant’; where biofuels are identified as having a strong impact (i.e. more than would be identified through most modelling studies, roughly consistent with driving more than a half of the price increase for maize, and a strong impact on other commodity prices), the role is described as ‘high’; where biofuels are identified as an important contributing factor (roughly consistent with causing a fifth to a half of price rises for maize) the role is described as ‘moderate’; where the role of biofuels is de-emphasised compared to other factors (roughly consistent with causing 5% to 20% of price rises for maize) the role is described as ‘low’. None of the papers reviewed argued that biofuels played no role in the crisis.
** Note that different studies use different numerical comparison points and different time periods. Percentage values may apply to percentage of price increases experienced or to percentage price increases. Some studies consider local prices, some global. We would encourage the reader to confirm interpretations against the original studies before quoting or using any values reported in this table.

34 © 2017 Cerulogy
Thought for food
Role of oil price in increasing food commodity production costsWhen considering the role of biofuel markets as a connector between oil prices and food prices, it is important to recognise that there is also a direct pass through of increased energy costs to food commodity prices. This issue is considered in some detail by the International Food Policy Research Institute (IFPRI) (Headey & Fan, 2010). They note that the World Bank (Mitchell, 2008) claimed to show that the passed through contribution of increasing energy costs to food commodity (maize, wheat, soybean) production costs in the U.S. was not more than 22% in the period 2002-2007, including cost increases for transport, fertiliser, fuels, electric-ity and chemicals. IFPRI find that this may be an underestimate, and that the real production cost increase could have been 30-40%, which would represent a more substantial contribution to the price changes (perhaps 20% of the total peak price increase for maize, for instance). However, they also find that increased costs cannot have been the sole driver of rising prices, as evidenced by the increased farm profits experienced during the crisis21.
The U.S. Congressional Budget Office found that production costs rose 31% in this period for maize (Gecan et al., 2009), but that ethanol demand accounted for 28 to 47% of price increases in the same period, while (Abbott, Hurt, & Tyner, 2008) note that one could expect to see a significant lag between energy prices rising and those costs being passed through to commodity prices, and conclude that, “Crude oil’s strongest and most direct impact on food prices has been through its effect on the demand for biofuels.” The role of increased production costs in pushing up prices should not therefore be ignored, but is not adequate to explain the crisis on its own, and acknowledging the role of increased energy prices in raising production costs does not contradict the conclusion that biofuel demand also played a substantial role.
Does a drop in food commodity prices since 2008 disprove the ‘food vs. fuel’ hypothesis?Some commentators have challenged the idea of competition between food and fuel by observing that food prices have fallen since the peaks reached in 2008 and 2011, despite ongoing global increases in biofuel consumption. As shown in Figure 4, while prices remained significantly above the pre-2006 level through to 2014, in 2015 and 2016 they dropped closer to the earlier price level. This is taken by these commentators to imply that biofuels cannot be responsible for food price rises. The implied hypothesis that if biofuel demand was indeed linked to food prices then food prices would scale linearly to biofuel consumption is a straw man with a profound lack of sophistication. Firstly, average food prices are indeed still higher than before the food price crisis started. Medium term price increases are exactly consistent with the expectation from modelling studies that biofuel demand will tend to drive food prices up. Secondly, it is inevitable in a volatile market that prices will achieve peaks that are above the long term trend. No commentator we are aware of would have predicted that the extreme price increases seen up to 2008 would have been sustained indefinitely, even with continued biofuel demand. Taking 2008 prices as a comparison point for current prices has only rhetorical, rather than analytical, value. Thirdly, it is worth noting that several countries responded to the food price crisis and to simultaneously developing concerns about indirect land use change by moderating biofuel policies. Some EU countries (e.g. the UK, Ireland and
21 If costs had been the sole driver of price increases, one would expect profits to be at best stable, and potentially to decline.

www.cerulogy.com 35
A review of the interaction between biofuel consumption and food markets
the Netherlands) postponed anticipated increases in mandates, others (e.g. China, India) turned against the use of food commodities for biofuel production. In the U.S., the blend wall presented a natural limit to continued increases in corn ethanol production, and in general the level of enthusiasm for biofuel mandates evident in the period 2000-2008 waned in the subsequent decade. It would be perfectly plausible to argue that this reduction in the rate of increase of biofuel demand was a significant contributor to allowing food markets to calm down since 2011. Finally, it should be noted that very few commentators (if any) would claim that biofuel demand is the single dominant factor in setting food prices. The relevant question is not whether absolute food prices are higher or lower than they were a decade ago, but whether they are now higher or lower than they would be without biofuel demand. As documented elsewhere in this study, there is extensive evidence that the answer to that is that they are higher than they would be without biofuel demand.
Is there a chance of a repeat of the food price crisis?The causes of the 2006-08 and 2011 food price crises have been much discussed, and this will no doubt continue. It is clear that biofuel demand played a role, and therefore it is reasonable to ask whether the circumstances that led to the previous crisis are likely to be repeated. One circumstance that has changed considerably since 2011 is the drop in world oil prices. Analysts who have argued for the largest role of biofuels in the food crisis have tended to do so on the basis that the U.S. ethanol market in particular created a direct pass through from oil prices to food commodity prices, with a fundamental shift in maize price behaviour occurring in 2006. With a much lower oil price, biofuel markets in the U.S. as well as elsewhere are driven much more strongly by policy and much less by energy prices. In the current oil price regime, food commodity prices are therefore insulated from oil price changes, removing one source of volatility and perhaps making a new crisis less likely. Increases in world food commodity stock levels since the food crises are also a cause for optimism that a new food price crisis is unlikely to be imminent as the availability of stocks will dampen the price response to any short-term demand or supply shock. As shown in Figure 5, stocks of key staple foods have increased considerably since 2007/08.

36 © 2017 Cerulogy
Thought for food
0.0
50.0
100.0
150.0
200.0
250.0
300.0
2007/08 2009/10 2011/12 2013/14 2015/16 2017/18
Yea
r end
ing
stoc
ks (m
illion
tonn
es)
Wheat Coarse grains Rice
Figure 5. Changes in world cereal stocks since 2007/08
The rate of growth of markets for food-based biofuels has also reduced since the period of the food price crises. For example, in 2010 the IEA World Energy Outlook (IEA, 2010) forecast a 200% increase in global food-based22 biofuel consumption between 2009 and 2035 in its ‘New Policies Scenario’, reaching over 5 EJ per year by 2020. In contrast, in the IEA’s 2017 Tracking Clean Energy Progress report, food-based biofuel supply is less than 4 EJ in 2020, and it is assumed that food-based biofuel production would fall slightly between 2020 and 2025. Given concerns about cost, technology development, sustainability, competition with food and feedstock availability, expectations for the growth rate of biofuel demand, especially from food commodity feedstocks, have been significantly dampened. Lower biofuel production than forecast lowers pressure on food prices directly, and also reduces the perceived case for speculative investment in food commodities and land.
On the other side of the coin, while it seems fair to conclude that the food market is not currently in such a pressurised position as it was in 2007, it is perfectly possible that this could change in the coming decade. Climate change is expected to increase the risk of poor harvests (one of the factors often cited as a driver of the 2006/08 crisis), and oil prices could rise again, even though relatively few analysts are currently predicting precipitous increases. The use of food commodities for biofuels will continue to add pressure and volatility to the market, especially while policies are structured in such a way that biofuel demand is relatively inelastic to feedstock prices.
22 Specifically, this is the increase in ‘conventional’ biofuels and could include some waste-based fuels, but those volumes are likely too small to be of consequence in this projection.

www.cerulogy.com 37
A review of the interaction between biofuel consumption and food markets
Conclusions on the food price crisisThe role of biofuels in the food price crisis of 2006-08 has been extensively studied. There is general agreement that the U.S. maize ethanol mandate had a significant impact on maize prices, and most studies agree that this impact was likely transferred at least as far as the soybean market. Conclusions on the impact into the wheat market are more mixed, with some authors arguing that the wheat price spikes preceded the maize price effects and therefore cannot have been driven by maize demand, while others still identify the role of biofuels in transmitting oil prices to maize prices as the trigger for the crisis. Most studies find that export bans were the primary driver of the rice price crisis, though some studies still identify biofuel demand as contributing to the formation of those bans. EU biofuel demand was significantly below that in the U.S. in this period, and is identified as a much more minor driver of the crisis, where it is discussed at all. Several authors make a point of arguing that biofuels were only one of several contributing factors, or that the largest estimates for the role of biofuels in the crisis may have been overstated. However, we are aware of no serious analysis that claims that biofuel demand made no contribution to the price crisis. Most studies that offer an estimate for the contribution of biofuel demand to the maize price increases during the crisis put it in a range from about 20 to 70%, dominated by the role of the U.S. ethanol mandate.
The role of biofuels (and of other market disturbances) in a price spike such as seen in 2006-08 is not necessarily the same as the medium term implication of biofuel demand. In the short term, several studies emphasise that market disturbances can reinforce each other’s impact, amplifying the overall effect. In the medium term, supply and demand are more elastic, and the system can adjust to new market realities. In the next section, we consider the broader literature on longer term impacts of biofuel demand on food commodity prices.

38 © 2017 Cerulogy
Thought for food
Price volatilityBiofuel demand can add volatility to food commodity markets in three primary ways. Firstly, if biofuel demand grows quickly it can contribute to reduced stocks, making the market more vulnerable to supply shocks. Secondly, when biofuel use is mandated by policy, the level of demand may be inflexible in the face of price changes, supporting larger price increases than would otherwise be possible. Thirdly, the biofuel market can transmit volatility from oil prices to food prices. The food commodity markets have likely been more volatile for the past decade than they would have been without biofuel policies.
Several authors have argued that increased biofuel demand has contributed not only to higher food prices, but to higher volatility in food prices. For these commentators, the food price crises were notable not only for the high prices experienced, but for the dramatic temporary surge of prices above long term trends. Price volatility may present threats to welfare additional to the welfare issues associated with long term price rises – poorer households generally have at best limited cash reserves and may suffer more during periods of high prices than they benefit from low prices, and highly variable prices make it difficult for the agricultural poor to make good decisions regarding planting and investment.
Laborde (2011b) argues that because volumes of biofuel required to meet biofuel mandates are, by design, unresponsive to either oil prices or agricultural prices, mandates add a large and structurally inelastic additional demand to food markets. He argues that, “Bringing a growing inelastic component to the demand side will make the market even more rigid and exacerbate price fluctuations; thus, these policies magnify price volatility.” He further argues that, coupled to other sources of increasing food commodity demand, “biofuels have played a very important role in lowering world reserves,” and that reduced reserves have further, “amplified food price volatility.” He concludes of biofuel mandates that, “In the short run, these rigid policies, by their nature, contribute significantly to price volatility and are potentially more toxic than traditional farm support or decoupled programs.
Gilbert & Mugera (2014) argue that food price volatility increased during the first decade of the century, and investigate the role of biofuels using multivariate analysis. They argue that increased volatility in grain prices, as evidenced by the food price spike, was partly a result of a strengthened linkage between volatile oil prices and food prices, due to substitutabil-ity between gasoline and ethanol. Similarly, Dawe (2010) notes that “biofuel demand has strengthened linkages between world energy and agricultural markets. Because world energy markets are so much larger than world agricultural markets, they may drive agricultural markets in the future. And world energy markets have historically been much more volatile than world food markets, creating the possibility that world food markets will become more volatile in the future.” Beyond 2008, however, Gilbert & Mugera (2014) argue that the situation has changed, because biofuel mandates have become ‘binding’ – that is, the quantity of ethanol supplied in the U.S. is being defined almost entirely by policy requirements independent of the oil price. In this analysis, the increasing role of policy in setting biofuel supply volumes has caused a de-linking of oil and grain price, because ethanol supply is not allowed to shrink when oil prices are low, and cannot rise much (given the blend wall) when oil prices are high. They conclude that, “biofuels production partly explains the increased increase in food commodity price

www.cerulogy.com 39
A review of the interaction between biofuel consumption and food markets
volatility in the recent decade,” but that other factors must be considered to find a full and coherent explanation.
Wright (2011) argues that increases in biofuel production from the year 2000 up to the food price crises played a major role in creating a context of reduced stocks and higher price volatility. He argues that, “The major grains—wheat, rice, and corn–are highly substitutable in the global market for calories. When their aggregate supply is high, a modest reduction can be tolerated with a moderate increase in price by drawing on discretionary stocks. But when stocks decline to a minimum feasible level, a similarly modest supply reduction can cause a price spike.” Given time for the market to adjust to a new equilibrium including mandated biofuel use, Wright (2011) anticipates that, “the market will adjust to a less volatile equilibrium, on a higher price path than without biofuels.” On the other hand, if biofuel mandates were to continue to outpace yield increases, then one might expect volatility to continue.
Hertel & Beckman (2012) investigate the role of the U.S. maize ethanol market in modifying maize price volatility, and find that by 2015, “the presence of a totally inelastic demand for maize in ethanol—stemming from the combination of a blend wall and a RFS both set in the range of fifteen billion gallons per year—would boost the sensitivity of maize prices to supply- side shocks by more than 50 percent,” assuming that the RFS is binding. If, on the other hand, the RFS is not binding in the year (i.e. if fuel suppliers use more ethanol than they are required to simply because of the value of ethanol as a gasoline blendstock, even without the push from the RFS) then the maize price would be less vulnerable to supply side shocks, but more vulnerable to shocks in the oil price. Indeed, this paper concludes that the strongest pass-through of oil price volatility to maize prices occurs when there is no biofuel mandate. This is because without a biofuel mandate, ethanol demand could vary from very low in the case of low oil prices to very high in the case of high prices, rather than having a floor even when oil prices become very low. To put it another way, in the U.S. context they find two ways that ethanol demand can introduce volatility to the maize price, but these effects will likely not both happen strongly at the same time. The strong influence of the oil price on maize prices in the U.S. occurs primarily at times when the oil price is high, and therefore the cost of ethanol production is lower than the cost of an energy equivalent quantity of gasoline.
In the EU context, it is generally considered unlikely that first generation biofuels will directly become cost competitive with fossil fuels – rather, the EU market’s size will be defined by policy (the size of biofuel mandates). Based on the analysis by Hertel & Beckman (2012) (among others), we would therefore expect that EU biofuel mandates would play much less of a role in increasing exposure of food prices to oil price volatility than U.S. biofuel mandates would. The situation in the EU is much more likely to match the case in which inelastic feedstock demand for biofuel production increases somewhat the sensitivity of food prices to supply shocks (such as poor harvests).

40 © 2017 Cerulogy
Thought for food
‘Food vs. fuel’ or ‘food and fuel’?Impact of co-products on food markets
Some biofuel advocates have responded to concerns about the impact of biofuels on food markets by noting that biofuel crops produce both fuel and livestock feed, and have claimed on this basis that biofuel demand increases food security. It is true that livestock feed co-products are produced, but this production is not enough to compensate the food market for the material converted into biofuel. Biofuel co-prod-ucts make a contribution to EU protein feed supply, but growing alternate crops to biofuel feedstocks could also improve supply of protein feeds or other commodi-ties. Modelling results that show food price increases due to biofuel demand already account for coproducts before reaching those conclusions.
Most food commodity crops used as biofuel feedstock cannot readily be 100% converted into biofuel. There are therefore co-products produced alongside the biofuel production process when use of these feedstocks increases (Malins et al., 2014). For ethanol production from cereal grains, the primary co-product is distillers’ grains and solubles (DGS), the material left over after fermentable starches and sugars are removed. For biodiesel from vegetable oil, the primary co-products are meals from oilseed crushing. Both DGS and oil meals have markets as animal feed. Because much of the carbohydrate content of grains is converted to alcohol during fermentation, DGS have a higher concentration of protein and fibre than the feedstock grains. Oil meals also have high protein concentrations, with soy meal in particular having a dominant role in the global livestock protein market.
The role of co-products as animal feed has been highlighted by biofuel industry lobbyists in defence against the expectation that biofuel production will negatively impact food security. There has been a particular focus on the role of biofuel co-products as protein feed for European livestock. For instance, the ethanol industry lobby group ePURE states on its website that:
“In 2015, our companies produced 4.9 million tonnes of high-protein, GMO-free animal feed co-product - enough to feed 17% of Europe’s dairy herd. This ensures that ethanol production supports food production and increases food security.”23
Europe has a ‘protein deficit’ and imports substantial quantities of protein feed, in particular soy meal, to support its livestock industry, as shown in Figure 6. The livestock industry requires feed with a higher protein content than is available in cereals, in order to support animal growth and milk production, and therefore ‘mid- and high-protein’24 feeds are mixed with energy feeds in livestock diets. The growth of co-product availability from biofuel production has clearly not reversed this situation, but it is reasonable to expect that in the absence of biofuel co-product availability soy meal imports might have increased even more (cf. Hazzledine et al., 2011).
23 http://epure.org/about-ethanol/ethanol-benefits/food-and-fuel/
24 Identified here as feeds with a protein content of at least 15%, i.e. excluding unprocessed cereals.

www.cerulogy.com 41
A review of the interaction between biofuel consumption and food markets
-
2
4
6
8
10
12
14
16
-
5
10
15
20
25
30
35
2000 2001 2002 2003 2004 2005 2006 2007 2008 2009 2010 2011 2012 2013
Billio
n d
olla
rs
Milli
on to
nnes
Soy meal imports Value of soy meal imports
Figure 6. EU imports of soy meal (left axis), and cost of imports of soy meal (right axis), 2000-2013, data from FAOstat25
Certainly, the co-products generated alongside biofuels are an important contributor to EU feed markets. The 2017 Renewable Energy Progress report provides a characterisation of the feedstock mix for the 2014 EU biofuel supply. For ethanol, implied co-product generation in 2014 is shown in Table 12, using co-product yields from BioGrace (2017). Just under 40% (by mass) of grain used for ethanol is returned to the market as distillers’ grains, 3.6 million tonnes26 compared to 9.4 million tonnes of grain consumed. A further 0.5 million tonnes of beet pulp is also produced, but this has a much lower protein concentration.
Table 12. Feedstock use for EU ethanol in 2014, and implied co-product generation
Ethanol Feedstock mass (1,000 tonnes)
Share of ethanol production
Implied co-product generation (1,000 tonnes)
Wheat 2,798 22% 925
Maize 5,174 47% 2,161
Barley 541 4% 216
Rye 846 6% 338
Sugar Beet 9,364 20% 517
25 Note that the soy meal import volumes reported in FAOstat are somewhat larger than the volumes reported by European Commission (2017a). The FAOstat numbers may be higher due to including intra-EU trade.
26 The EU Crops Market Observatory protein balance sheet reports domestic production of distillers’ grains as 3.5 million tonnes for 2014/15.

42 © 2017 Cerulogy
Thought for food
According to the EU Crops Market Observatory protein balance sheet for 2014/15 (European Commission, 2017a), a total of 262 million tonnes of feed was fed to livestock in the year, of which 74 million tonnes was mid- and high-protein feed. Of 44 tonnes of nutrition supplied as proteins, about 60% was delivered in mid- and high-protein feeds, and the rest supplied through cereal feed. Distillers’ grains therefore account for around 2% of protein fed to EU livestock, 5% of the total supply of mid- and high-protein animal feeds.
The role of biodiesel co-products is slightly more complex. Oilseed crushing results in the production of oil meals alongside vegetable oil. We can undertake a similar calculation to the one used in Table 12 and calculate the volume of oilseed meal associated with the vegetable oil used for biodiesel. However, oilseed meals are properly a co-product of oilseed crushing, not of biodiesel transesterification. This is important, because different vegetable oils are associated with very different levels of meal production, from soybean crushing which produces nearly five tonnes of meal for every tonne of oil, to palm fruit crushing which produces only a hundred kilos of meal for every tonne of oil. The supply of meal as co-products therefore only increases due to biodiesel demand to the extent that it leads to additional crushing of rapeseed, sunflower seeds and soybeans (rather than imports of palm oil to substitute the displaced vegetable oil, or reduced vegetable oil consumption in other sectors). Laborde (2011a), for instance, finds that only 80% of rapeseed oil for biodiesel, 70% of sunflower oil and 40% of soy oil comes from additional supply of those oils. Given these values, EU consumption of rapeseed and sunflower oil biodiesel in 2014 was associated with around 5 million tonnes of additional rapeseed and sunflower meal production, accounting for about 4% of all protein fed to EU livestock, and 7% of the EU supply of mid- to high-protein feed.27
In the absence of mandates for food based fuels, it is not necessary that all of this protein feed production potential should be lost. If rapeseed continued to be cultivated to produce oil for food markets, rapeseed meal could continue to be produced, but if rapeseed production was reduced, alternative rotational protein crops such as peas, beans and lupins could be cultivated (Malins, 2013). DG Agri & Joint Research Centre (2016) anticipate that a reduction in rapeseed cultivation would lead to an increase in production of cereals, primarily wheat. Similarly, a reduction in wheat and maize demand for ethanol would create an opportu-nity for alternative crops, which could include protein feeds. Thus, while it seems likely that a reduction in biofuel demand would indeed tend to reduce EU protein feed production, the net reduction would likely not be close to the full 9 million tonnes currently being generated.
Co-products in modellingIt is well established that the co-products produced alongside biofuels have an important role in mitigating the net land requirements of biofuel policy (Laborde, 2011a; Malins et al., 2014; Searchinger et al., 2008; Valin et al., 2015). For maize and wheat, DGS return about a third (by mass) of the crop to the livestock feed industry. For soy beans, the meal is much more than half of the crop by mass, and generally more than half by value. Rapeseed and sunflowers also return a large fraction of their mass to the feed market. As noted above, due to the con-tribution of co-products, Laborde (2011a) predicts very limited net impact on livestock feed consumption, while Valin et al. (2015) actually predicts increases in livestock feed consumption
27 We assume that most additional soy crushing due to biodiesel demand would occur outside of Europe.

www.cerulogy.com 43
A review of the interaction between biofuel consumption and food markets
for many scenarios, as increased co-product availability causes reductions in the price of protein feed.
The generation of co-products is an important feature of the biofuel industry, but it is one that has been included in modelling efforts to investigate the potential impact of biofuel demand on food prices and land use changes. Both the MIRAGE and GLOBIOM models have been modified to include co-products in ILUC estimation for the European Commission, as has the World Banks’ ENVISAGE model (discussed further below), which has been used in estimates of the poverty impacts of increased biofuel demand, and 95% of all the models reviewed by Persson (2014). The role of co-products in ‘recycling’ part of biofuel feedstock crops back into livestock feed mitigates the net impact on food markets, but (as discussed above) modelling studies still consistently identify non-negligible impacts from biofuel demand on both food prices and food consumption, even with these effects taken into account. It is therefore simply not consistent with the vast majority of the available evidence to say that because of co-product generation, “ethanol production … increases food security.”
Reference to ‘Reconciling food security and bioenergy: priorities for action’A recent briefing by ePURE28 contained the statement:
“There is no ‘food vs fuel’ conflict. Fuel ethanol production contributes to food supply. The UN Food and Agriculture Organisation and the International Food Policy Research Institute confirm that biofuels and food production can be mutually supportive.29”
This statement is misleading as constructed. For one, the source for the position attributed to the International Food Policy Research Institute (Kline et al., 2017) is in fact a collaborative effort between researchers from ten institutions. The lead author is from Oak Ridge National Laboratory, and Oak Ridge is the only organisation to be represented by two authors. The International Food Policy Research Institute (IFPRI) is represented by one of the eleven co-authors. There are many other IFPRI publications that could be identified (some are referenced in this study) that would contradict the claims made by ePURE.
Secondly, the reference to the position of the UN FAO is based on a very selective reading of the referenced speech. The speech in question (by the FAO Director-General) includes the statements that biofuels, “can do good or bad,” and that, “It is well known that the use of maize and oilseeds for biofuel production helped push agricultural prices higher in the food prices spike that began in 2008.” The speaker continues,
“What we can say is that mandatory biofuel policies must have flexibility. They need to be adjusted according to the reality, the ongoing balance of production and stocks of the different products used … And above all, there must be a focus on food security and nutrition.”
While it is fair to say that the UN FAO believe that, in principle, “biofuels and food production can be mutually supportive,” the associated claim that, “There is no ‘food vs fuel’ conflict”
28 http://epure.org/media/1556/170524-epure-food-and-fuel.pdf
29 In the briefing, the first two sentences are the introductory text and the third sentence is a bullet point that follows immediately.

44 © 2017 Cerulogy
Thought for food
is clearly not supported. In short, the speech referenced is an explicit call for biofuel policy to be modified to avoid future negative impacts on food markets, and for food security to be put first ahead of biofuel goals. It is absolutely contradictory to the statement that “There is no ‘food vs fuel’ conflict”. Rather, it is a recognition of that conflict, and a call for it to be constructively managed.
By taking different reports from the FAO and IFPRI, or in the case of the FAO different lines even from within the same speech, one could make an almost opposite statement, with at least equal justification:
“A ‘food vs fuel’ conflict was demonstrated during the food price crisis of 2006-08. Fuel ethanol production from food commodities places upwards pressure on food commodity prices and volatility. The UN Food and Agriculture Organisation30 and the International Food Policy Research Institute31 confirm that there is an obvious tension between biofuels and food production that needs to be managed.”
While the reference to the FAO is clearly inconsistent with the spirit of the speech in question, the paper Reconciling food security and bioenergy: priorities for action’ (Kline et al., 2017) does indeed spend some time challenging analytical work that finds strong links between biofuel demand and reduced food security, and the authors clearly feel that competition between biofuels and food has been overstated. However, rather than presenting evidence that biofuel demand does indeed contribute to food security, the paper claims that there is a lack of convincing evidence of harm to food security. The paper presents three hypotheses for the impact of biofuels on food security (both positive and negative), and makes the claim that, “None of the hypotheses above can be endorsed because they are not supported by evidence of price transmissions to the specific populations at risk…. Models that simulate demand shocks from biofuels necessarily show price transmission and reduced consump-tion, but evidence is lacking to support either the assumed ‘shock’ or the assumed impacts on people at risk.” This paper does not directly attempt to refute studies showing negative impacts from biofuels on food prices. Instead, it asserts that, “Evidence cited in this paper refutes most assumptions underlying this hypothesis.” In fact, the arguments presented are neither clearly presented nor compelling.
The casual rejection of economic modelling as a useful tool to investigate these issues puts this paper in opposition to a wide variety of international institutions and researchers (many cited elsewhere in this review). Claims that biofuel production can aid food security are largely anecdotal, aspirational or selective. For instance, a claim is made (without citing evidence) that flexibility in maize ethanol demand prevented a food price spike in 2012/13, but the paper makes no attempt to explain why the same did not happen in the 2008 or 2011 price spikes. In several places, statements made in the paper are cited to papers that do not fully support them. For example, Zilberman, Hochman, Rajagopal, Sexton, & Timilsina (2013) is cited to justify criticism of the use of correlations between biofuel expansion and food prices to claim a causal connection, but actually conclude that, “the introduction of corn ethanol has had a significant impact on food commodity prices,” a conclusion that goes without comment by Kline et al. (2017). In another place, the paper makes the statement in relation to media stories about impacts of biofuel demand on food prices that, “Sensational news garners attention while subsequent corrections are overlooked”, and cites this statement to Flipse & Osseweijer
30 (HLPE, 2013)
31 (Headey & Fan, 2010)

www.cerulogy.com 45
A review of the interaction between biofuel consumption and food markets
(2013). One might be forgiven for assuming that the cited paper would contain examples of findings about biofuels and food security that had subsequently been retracted – in fact, the cited study refers to media coverage of GM food production, and makes no statement about biofuels whatsoever.
Aside from the weakness of some of the argumentation presented, the paper’s recommen-dations are based on the idea that, “Applying sustainability guidelines to bioenergy will help achieve near- and long-term goals to eradicate hunger.” Similarly to the speech by the FAO, the paper asserts that biofuels crops could be seen as, “one mechanism that can absorb the surplus production in normal years and provide a cushion in years of unexpected supply disruptions.” We are not aware, however, of any public support from the European biofuel industry associations for policy amendments that would make biofuel markets more flexible in years where supply disruptions occur. Rather, a consistent theme of the industry has been the (economically understandable) request for fixed long term targets that should not be adjusted. The paper concludes that one key question for policy makers is, “How can a bioenergy policy or project be designed to address the local causal risk factors and contribute to reduced food insecurity?” This is indeed a good question, but answering it effectively will not be made any easier by ideological denial of the very real evidence base that existing biofuel policies have indeed had some degree of negative impact on welfare and food security.

46 © 2017 Cerulogy
Thought for food
Food security and welfareIncreased food commodity prices result in net welfare losses for poor households in the developing world, as the majority of these households are net purchasers of food. Some rural households may benefit from high prices, but these are outnumbered by rural households with no net food surplus to sell, and urban households. Increased food prices leads to reductions in food consumption, and hence nutrition, and to reductions in income available for non-food purchases. Food commodity price increases driven by biofuel policy are likely to have driven tens of millions of people globally over the poverty line,
So far in this review, we have examined the literature on how biofuel demand affected food prices in 2006-08 and how it may affect food prices in future. Many organisations and individu-als are concerned about these impacts because of an expectation that higher food prices will have a negative impact on food security and welfare. The welfare of poor households in developing countries is much more sensitive to staple food commodity price changes than is the welfare of richer households in developed countries. Trostle (2008) provides an illustra-tion comparing the impact of staple food price increases between two typical households. For a household with a $40,000 income in a high income country, a 50% rise in staple food prices could be expected to increase retail food expenditures by 6%, increasing the share of household income spent on food from 10% to 10.6%. For a poorer household in the developing world with an $800 annual income, the same 50% increase in staple food price would increase retail food expenditure by 21%, increasing the share of income spent on food from 50% to over 60%.
The impact of international market price changes on consumers in any given country will depend to some extent on how strongly international prices are transmitted to local consumers. As noted above, De Hoyos & Medvedev (2009) found that ,most developing country domestic food commodity prices increased in the food price crisis by less than half of the increase observed at the global level. Wiggins & Mcdonald (2008) notes that, “developing countries with large populations of poor consumers and small farmers are faced with significant increases in the international prices of food staples, they take measures that restrict transmission in the short run but allow transmission to take place slowly so that domestic prices adjust to international prices over a period of time.” There may also be some cases in which poor food consumers are almost entirely insulated from international markets, in particular in cases of geographical isolation or dependence on local food staples that are not traded as commodities. In general though, food consumers in the developing world will be affected by changes in international market prices.
A 2009 working paper from the World Bank (De Hoyos & Medvedev, 2009), written in the context of analysing the food price crisis, provides a useful review of the food security implications of increased prices. The paper notes that there are two main channels for negative welfare impacts of rising food prices on poor households. Firstly, “as food prices increase, the monetary cost of achieving a fixed consumption basket increases hence reducing consumer’s welfare.” To put it another way, if food prices go up, then net food purchasers have to spend more money to buy the same amount of food, and so even if nutritional levels remain the same, there is a negative impact on disposable income. Secondly, the financial stress of increased

www.cerulogy.com 47
A review of the interaction between biofuel consumption and food markets
food prices may cause poor households to consume less food, with a consequent impact on nutrition, and potentially health. The impact of international market prices
An important caveat on the impact on household wealth is that the impact will depend on whether households are net food purchasers or sellers - De Hoyos & Medvedev (2009) notes that, “for the segment of the population whose income depends --directly or indirectly-- on agricultural markets, i.e. self-employed farmers, wage workers in the agricultural sector, and rural land owners, the rise in food prices represents an increase in their monetary income.” Across the developing world as a whole, however, most households are net food purchasers, and therefore more people are expected to lose out from increased food prices than gain. In particular, the urban poor are vulnerable to increasing food prices and have little to gain from booming agricultural markets. For instance, a study by Ivanic & Martin (2008) concluded that increased food prices harmed welfare in eight out of nine developing countries considered. It is right to recognise that some households and communities stand to benefit financially from expansion of biofuel mandates, but crucial also to recognise that there is convincing evidence that most households and communities are likely to be financially disadvantaged.
When discussing the food price crisis, and food prices more generally, it is common to talk in terms of world market prices or food price indices, but the impact of rising prices for agricultural commodities at the global level will not generally be entirely passed through to consumers in developing countries. De Hoyos & Medvedev (2009) reported that during the start of the food price crisis (January 2005 to December 2007) there was a 74% increase in world food commodity prices, but that most developing countries experienced less than half this increase in domestic food prices (although a small number of countries experienced higher increases than seen in the world market). The actual impact on poor households of increases in global prices of agricultural commodities will therefore be strongly influenced by the net food consumer/producer position of each household, the transmission of global prices to local prices, and the specific food commodities consumed in each country (e.g. most analysts expect consumers of rice to be far less sensitive to price changes driven by biofuel demand than consumers of other cereals).
For the period January 2005 to December 2007, De Hoyos & Medvedev (2009) provide estimates of changes in poverty rates by world region, based on consideration of the observed change in local prices and on characterisation of typical households and purchases. For the urban poor, they conclude that about 70 million people were moved into poverty, heavily concentrated in East Asia (excluding China). For rural poor households, the increase in poverty was calculated at about 90 million people32, again concentrated mostly in East Asia, for a total increase of 155 million people below the poverty line. Given estimates discussed above of the contribution of biofuel demand to the food price crisis, this is consistent with biofuel demand being responsible for moving millions or tens of millions of people across the poverty line in that period (perhaps hundreds of millions if you accept the hypothesis in (de Gorter et al., 2013) that biofuel had a dominant role in triggering the price crisis, including triggering increased rice prices). De Hoyos & Medvedev (2009) note however that these numbers should be understood as, “an upper bound of the real poverty impact”, because in the medium to long term households will adjust consumption patterns to reduce reliance on the commodities experiencing the highest price increases. It should also be remembered that prices fell back
32 While the absolute increase in poverty is larger for the rural than urban category, it is significantly smaller as a percentage, reflecting the more mixed outcomes among agriculturally dependent house-holds.

48 © 2017 Cerulogy
Thought for food
to lower levels following the price crisis (though not generally as low as before), and therefore analysing the prices seen in December 2007 provides an overstatement of the longer term impact of changed prices. Ivanic & Martin (2008) reported a slightly lower poverty increase of 105 million for the food crisis period, but their analysis included less than half of the overall population of the developing world. Interestingly, the analysis in De Hoyos & Medvedev (2009) suggests a particularly strong sensitivity of poverty to food price increase in Indonesia.
Other studies have assessed the potential impact on poverty of expected biofuel expansion from 2010 to 2020. Wiggins & Mcdonald (2008) consider the potential impact of 2020 U.S. and EU biofuel demand on poverty rates in five representative countries (Kenya, Malawi, India, Bangladesh and Brazil) and anticipate an overall increase in the poverty count in those countries by about 12 million. Cororaton, Timilsina, & Mevel (2010) anticipate a poverty count increase of 6 million people globally in 2020 given significant biofuel demand expansion in Europe, India and Thailand. While these are clearly significant numbers of people, these impacts reflect only modest increases in poverty rates, of the order of one percentage point, and it should be understood that many other policy interventions can have a greater impact on poverty (in either direction) than is expected due to biofuel demand.
As well as analysing the period of the food price crisis, De Hoyos & Medvedev (2009) provide analysis of the expected impact of biofuel mandates on poverty counts for a period from 2004 to 2010. The analysis is based on combining general equilibrium results from the World Bank’s ENVISAGE model (van der Mensbrugghe, 2008) with the World Bank’s Global Income Distribution Dynamics dataset (the same dataset used for the analysis of the price crisis described above). They find world price increases of 6% for wheat, 10% for other cereal grains and 15% for oilseeds as compared to a scenario without biofuel mandates. In the modelling, these price changes are well transmitted to Sub-Saharan Africa (6%, 11% and 14% respec-tively) and the price changes for these commodities in India and Indonesia in particular are significantly above the world changes. The model shows an increase in extreme poverty by 32 million people in 2010 against the scenario without biofuel demand. These net increases are observed almost entirely among non-agricultural households. It should be noted that while the modelling tools used in this assessment are all extremely credible in the field. To the best of our knowledge ENVISAGE has not been subjected to the same detailed modifications to better model biofuel markets that have been undertaken for models such as GLOBIOM, MIRAGE and GTAP.
It is fair to note that the development community has shown a degree of ambivalence on the subject of agricultural commodity prices over the last couple of decades. As noted by Swinnen & Squicciarini (2012), in 2005 Oxfam had stated that, “Low prices [on world markets make] it impossible for farmers in developing countries to compete. As a consequence, over 900 million farmers are losing their livelihoods.” Three years later, at the height of the food price crisis, Oxfam wrote that, “[higher] food prices … have pushed millions of people in developing countries further into hunger and poverty.” In fact, these apparently contradictory ideas can both be correct. Low prices available for food commodities can indeed harm the welfare of rural food producers, while high food prices can indeed harm the welfare of net food consumers. Rural development is more complex than simply deciding between getting prices as high as possible and as low as possible; stability and predictability can be valuable to farmers seeking to invest, and developing rural economies can have secondary impacts benefiting urban citizens. As detailed in this report, there is a significant weight of evidence to suggest that high food prices, especially when coupled with volatility, result in net welfare

www.cerulogy.com 49
A review of the interaction between biofuel consumption and food markets
losses in the developing world, but one should not conclude that ever-reducing real food prices would permanently solve the world’s food insecurity problems.
The UN FAO (Food and Agriculture Organization (FAO), 2008) provide estimates of the welfare loss to rural and urban households in several developing worlds countries associated with a 10% increase in staple food prices. The most negative impacts are experienced by households in the lowest wealth quintile, for both rural and urban dwellers. The associated welfare loss is up to 3%. Typical urban households are expected to lose out in all countries from food price increases, but in some countries rural households would be expected to achieve welfare gains – even those in the lowest wealth quintile, for two of the seven countries assessed. Female headed households fare worse than male headed households, according to the FAO analysis. The report concludes that, “On balance, at the global level, the immediate net effect of higher food prices on food security is likely to be negative.”
An assessment for the European Commission of the impact of biofuel production on developing countries (Diop et al. 2013) reports that there is little consensus on the contribution of biofuels to rising food prices, but that, “there seems to be a consensus that some effect on food prices exists.” The study considered links between biofuel demand and largescale land acquisitions by foreign investors in developing countries. It concludes that many companies, “have taken into consideration the EU demand for biofuels in their land investment strategies,” but finds that many other factors have informed the boom in land investment. The report notes that largescale land acquisitions by both local elites and foreign investors are often associated with acquiring control of water resources, and that many crops used for biofuel feedstock have high water requirements, arguing that, “the uses of energy in water supply and sanitation (water-energy nexus) are not sufficiently taken into consideration by the policy makers.” This study highlights the risk that investment for biofuel production could undermine land rights in the developing road, noting that:
The general idea depicting [African, Caribbean and Pacific] countries and especially Africa as an untapped reservoir of “land availability for expansion agriculture and biofuels production” fade away when confronted with the reality of limited demarca-tion level of land, incomplete land reforms and land use registration and general lack of participatory land use planning prior to assigning land for biofuels production on local level. Protection of the land users who are often not the land owners (i.e. government) is mostly inadequate in land acquisition processes and leaves much room for abuses and human right violations.
This report goes on to recommend that the European Commission should, “Consider expansion of the sustainability criteria to include social criteria, food security, access to natural resources such as land and water and principle of free, prior and informed consent for communities affected by land transaction for biofuels.” We note that coverage of these issues has in fact been reduced rather than increased in the proposed RED II.33
Elasticity of food consumption to priceAs noted above, in economics an elasticity is a measure of the extent that one indicator changes in response to a change in another indicator. Above, we discussed the elasticity
33 Cf. http://www.cerulogy.com/uncategorized/a-leap-forward-for-european-advanced-biofuel-policy/

50 © 2017 Cerulogy
Thought for food
of commodity prices to commodity demand. We can also consider what the elasticity of demand is to changes in price. In particular, we can ask how much change we might expect in food consumption in response to changes in food commodity prices. An ‘own price elasticity’ is the elasticity of consumption of a commodity to the price of that same commodity (so maize consumption might decrease when maize price increases). A ‘cross price elasticity’ is the elasticity of consumption of a commodity to changes in price of other commodities (wheat consumption may increase when maize prices go up, as consumers look for lower prices alternatives to maize).
A review of the impact of food price changes on food consumption patterns is provided by Cornelsen et al. (2014). They confirm that food consumption is most sensitive to prices in low income countries, but note that the elasticity of consumption of staples (cereals, and fats and oils) is less price sensitive in these countries than consumption of meat, fish and dairy produce. They observe that, “as calories from cereals make up approximately half of all calories available in low-income countries, an increase in cereal prices would have a bigger impact on diet relative to price increases in other foods.” For cereals, they find an own price elasticity in low income countries of -0.61, meaning that a 10% increase in cereals prices would lead to a 6% reduction in consumption. Similarly, for fats and oils they find an own price elasticity in low income countries of -0.6. They also note that they find modest positive cross-price elasticity values between cereals and other commodity groups. This implies that part of the reduction in calorific consumption due to an increase in cereals prices would be made up by increases in consumption of other foodstuffs.
The own-price elasticities for cereals and for fats and oils in middle income countries were -0.55 and -0.54 respectively, and the values for high income countries -0.43 and -0.42 respectively. All of these own-price elasticity values were found to be significant at the 1% level. This confirms that price increase can be expected to cause reductions in consumption, and shows that consumption is less responsive to prices in richer countries, but only by a modest margin. While it is correct to observe that poorer people in low income countries are likely to be more affected by a given price rise than richer people in higher income countries, it would not be correct to conclude that changes in food consumption due to biofuel policy are likely to be over-whelmingly concentrated in the developing world. To consider an example, GLOBIOM (Valin et al., 2015) modelled a 38% increase in EU vegetable oil prices for the EU mix 2020 scenario, associated with a 9.3% increase in world vegetable oil prices. In a low income country where half of that global price change was manifested in local prices, we would expect (given the elasticity estimates from Cornelsen et al., 2014) a reduction in vegetable oil consumption of about 6%. In the EU itself, even with the lower own price elasticity of consumption, we would expect a consumption reduction by about 16%. Other indirect land use change models give similar results – the largest overall reductions in food consumption are generally predicted in the regions that experience the biofuel demand shock (Malins et al., 2014).
As noted above, only part of the negative welfare impact of increased food prices comes through reduced food consumption, with the other aspect being reductions in income available to spend on non-food goods. For instance, Regmi & Seale (2010) find that a 10% increase in all food prices is associated with a 3.4% reduction in spending on medical care in low income countries, and a 2.6% reduction in spending on rent, fuel and power.

www.cerulogy.com 51
A review of the interaction between biofuel consumption and food markets
Potential impacts on food markets of EU biofuel 2030 targetsMaintaining EU demand for food-based biofuels could be expected to result in higher food prices in 2030 than would be the case if food-based biofuel demand were phased out. Maintaining demand at the ‘capped’ level of 7% of EU transport energy could be expected to result in cereals prices about 1% higher than without EU biofuel demand, and vegetable oil prices about 10% higher. These price differentials would be consistent with a $19 billion cost to global cereal and vegetable oil consumers in 2030.
In this section, we consider the potential impacts on food markets of three levels of food-based biofuel supply in the EU. Firstly, we consider a case in which 7% of 2030 transport energy comes from food-based biofuels (continuation of the existing cap on food-based fuels). Secondly, we consider a case in which the maximum contribution is reduced to 3.8% (a partial phase out of food-based fuels) – we consider two subcases here, one in which the ethanol biodiesel mix is unchanged, and a second in which ethanol use is prioritised over biodiesel. Thirdly, for comparison we consider a case in which food-based fuels are entirely eliminated from the EU fuel supply (a full phase out). For this third scenario to be actualised would imply both a removal of biofuel support policy, and for it to be uneconomic for existing biofuel production facilities to continue operating without policy support. We note that DG Agri & Joint Research Centre (2016) assume that some level for EU biofuel production would continue even without support from mandates and tax exemptions. The results presented reflect the expected difference in food commodity prices between one of the cases with some level of EU food-based biofuel mandate, and the case with no consumption of food-based biofuels.
We have investigated these scenarios by applying elasticities of food prices to demand derived from the published results of GLOBIOM modelling for the European Commission (Valin et al., 2015), as shown in Table 8. We consider only the effects on cereals and vegetable oil markets, and not those on sugar markets. For one, GLOBIOM reports very low sensitivity of sugar prices to biofuel feedstock demand (the global sugarcane price response is negligible in the sugarcane ethanol scenario, and the implied elasticity of EU sugarbeet price to demand in the sugarbeet ethanol scenario is only 0.14). Also, sugar is not a staple food, and thus changes in sugar price will have a less direct impact on food security than staple food price changes.
We assume that the 2030 feedstock mix under the scenario with a continuation of a 7% cap would be the same as the overall 2020 EU biofuel mix for a scenario with a 7% cap analysed by Valin et al., (2015). For the partial phase out to 3.8% of transport energy from food-based fuels, we consider one case with the same feedstock mix, and a second in which there is a larger fraction of ethanol (given that Member States are allowed to prioritise lower-ILUC fuels). We assume in this second case that enough food-based ethanol is supplied to deliver blending at the E10 level.34 These feedstock mixes are detailed in Table 13.
34 In reality, there would be a tension in this second case between the supply of food-based ethanol and second generation ethanol. It is possible that ethanol blend limits could be raised or sales of higher ethanol blends (such as E85) could be increased.

52 © 2017 Cerulogy
Thought for food
Table 13. Fuel mix for 2030 food-based biofuel scenarios
Maintain cap on food-based fuel Phase down, same mix Phase down, high
ethanol
Energy percentage from food-based biofuels
7% 3.80% 3.80%
Total energy from 1G fuels (Mtoe) 17.5 8.75 8.75
% in mix Mtoe of fuel % in mix Mtoe of fuel % in mix Mtoe of fuel
Wheat 5% 1.0 5% 0.5 11% 0.9
Maize 10% 1.7 10% 0.9 19% 1.7
Barley 2% 0.4 2% 0.2 4% 0.4
Sugar beet 4% 0.8 4% 0.4 8% 0.7
Sugar cane 2% 0.4 2% 0.2 4% 0.4
Sunflower oil 2% 0.4 2% 0.2 2% 0.1
Palm oil 18% 3.1 18% 1.5 12% 1.1
Rapeseed oil 38% 6.7 38% 3.4 27% 2.4
Soybean oil 18% 3.1 18% 1.5 12% 1.1
We then estimate impact on EU and global food commodity prices for aggregate cereals and aggregate vegetable oils. We use the price elasticities derived from the price changes in the EU mix scenario, as shown in Table 14.
Table 14. Elasticity of price to demand derived from GLOBIOM results for EU biofuel mix 2020
Vegetable oil Cereals
EU 0.75 0.64
Global 1.11 0.95
Based on the DG Agri medium term outlook (DG Agri & Joint Research Centre, 2016)35, we assume that domestic supply quantity for cereals in Europe rises slightly to 300 million tonnes. For vegetable oils we assume, also based on DG Agri & Joint Research Centre (2016), a domestic supply quantity in 2030 of 23 million tonnes. At the global level, based on the OECD-FAO medium term outlook (OECD & FAO, 2017) we assume a global supply quantity for non-rice cereals of 2,300 million tonnes and a global vegetable oils supply of 220 million tonnes. Also
35 WE have assumed in this section that projections from the European Commission and OECD-FAO for 2026 are an adequate proxy for expected 2030 production and price.

www.cerulogy.com 53
A review of the interaction between biofuel consumption and food markets
informed by OECD & FAO (2017), we assume an average 2030 non-rice cereals price of 215 dollars per tonne and an average vegetable oil price of 900 dollars per tonne.
Given these assumptions, the price impacts derived for 2030, against a counter-factual with a full phase out of food based biofuels, are shown in Table 15.
Table 15. Estimated price impacts in 2030 of EU 2030 biofuel consumption scenarios (compared to complete phase out of food-based biofuels)
Com
modity group
Increase of EU price vs. phase out
Increase of global price vs. phase out
Estimated increase in
global price ($/tonne)
Estimated w
ealth transfer from
EU consumers (billion
dollars)
Estimated w
ealth transfer from
global consumers in
2030 (billion dollars)
7% cap
Cereals 3.1% 0.6% 1.29 2.0 3.0
Vegetable oils 52.8% 8.2% 73.47 10.9 16.2
Total cost to consumers: 12.9 19.1
3.8% phase down, same mix
Cereals 1.5% 0.3% 0.64 0.2 1.5
Vegetable oils 26.4% 4.1% 36.73 5.5 8.1
Total cost to consumers: 5.7 9.6
3.8% phase down, priority to ethanol
Cereals 3.0% 0.6% 1.23 0.4 2.8
Vegetable oils 18.7% 2.9% 26.04 3.9 5.7
Total cost to consumers: 4.2 8.6
As can be seen in the table, the potential impact on vegetable oil prices is very much larger than the potential impact on cereals prices for the biofuel mix scenarios considered. This is because the cereals market is very much larger (around ten times the size in mass) than the vegetable oil market, and EU biodiesel demand is greater than ethanol demand in all scenarios considered, and therefore EU biofuel demand represents a larger percentage of total vegetable oil supply than of total cereals supply. It should be understood though that because the cereals market is larger than the vegetable oils market, a small price rise in cereals can still represent a large transfer of wealth away from food consumers. The estimated impact on global medium term cereals prices of maintaining demand at the 7% level vs. phasing out demand is 0.6%. This price difference would be associated with a $3 billion annual

54 © 2017 Cerulogy
Thought for food
wealth transfer from cereals consumers to cereals producers. The estimated impact on global vegetable oil prices of maintaining biofuel demand at the 7% level vs. phasing out food-based biofuels is 8.2%. This would be associated with a $16 billion global transfer from vegetable oil consumers to vegetable oil producers.
The potential impact on EU vegetable oil prices is much higher, calculated at 53% for these assumptions. In the long run, we would expect that supply would readjust so that local prices would return towards global prices. We can therefore think of the EU price change results for vegetable oils in particular as a ceiling on the medium impact, unlikely to persist at that level in the long term as supply and trade eventually adjust to a new market reality. Global price changes are likely to be more persistent as they cannot be resolved simply by shifting supply.
The results presented here can be compared to modelling for the 2016 EU Agricultural Outlook (DG Agri & Joint Research Centre, 2016), which considered the implications for EU agriculture in 2026 of a removal of EU biofuel mandates and other related policies after 2020 (compared to a case with continued biofuel supply at 2020 levels). The modelling in the outlook assumes that even without mandates, biodiesel consumption would continue at a blend of around 4% (by volume), and that ethanol use would continue at a blend of about 5% (by volume). This makes this scenario from the outlook similar but certainly not identical to our case of a partial phase out with priority for ethanol. The ‘no biofuel mandate’ case is the most similar to our partial phase out case, in terms of quantity of biofuel supplied. The outlook projects a 25% reduction in European rapeseed oil price for this scenario, an 18% reduction in average vegetable oil prices and very modest reductions in cereal prices. These outcomes are similar to those presented above from our own analysis, where the difference between continuation of food-based biofuel supply under a 7% cap and a partial phase out with priority to ethanol was a 29% reduction in EU vegetable oil prices and a 0.1% reduction in EU cereals prices.
As discussed, the results presented here are based on price impacts estimated by Valin et al. (2015). Changing price sensitivity assumptions would change the results. In principle, the simple calculation undertaken here using parameters derived from GLOBIOM results could be repeated using the full GLOBIOM model. This would certainly not result in an identical set of price outcomes to those presented here, but we would expect that the outcomes would be at least broadly comparable. The results presented here are best understood as indicative of potential impacts, rather than as a precise forecast.

www.cerulogy.com 55
A review of the interaction between biofuel consumption and food markets
ConclusionsSince at least 2007, the question of the impact that biofuel demand has on food markets, the “food vs. fuel debate”, has been one of the dominant themes of the biofuel discourse in Europe, and elsewhere. Keen to defend their industry, some biofuel advocates have repeatedly claimed that it is a ‘myth’ that biofuel policies raise food prices, or could impact food security.
Outside the biofuel discourse, however, it is generally taken for granted that biofuel demand tends to increase food prices. This assumption is standard in investor analysis of food commodity markets, follows simply from basic tenets of economics, and is well supported by a wealth of evidence, some of which we have reviewed in this paper. The Overseas Development Institute wrote following the 2006-08 price crisis that, “As far as the impact that biofuel expansion will have on prices is concerned, different models can produce considerably different projections … but no one argues that the direction of prices is anything but up” (Wiggins & Mcdonald, 2008). This remains almost accurate today. The vast majority of analysts and serious commen-tators agree that biofuel policies have exerted, and will continue to exert an upward pressure on food commodity prices.
How then should one explain the continued willingness to refer to food vs. fuel as a ‘myth’, or to contend than biofuel demand actually enhances food security? It has been popular for those commentators denying the existence of a tension between food and fuel to identify the other side as being emotional. One of the papers favoured by pro-biofuel commentators, discussed above, asserts that, “Cartoons of hungry children juxtaposed to maize being ‘fed’ to cars have generated an emotional response to biofuel policies that is difficult to overcome” (Kline et al., 2017). The truth is that the constant refusal of some stakeholders to recognise the weight of the evidence (theoretical, modelled and statistical) that biofuel demand does indeed interfere with food markets reflects an apparently emotional attachment to long-supported technologies and much sought after investment returns that is quite as fierce as any emotional response from development campaigners to the (real) risk that biofuel policy in the developed world will move millions of people across the poverty line.
It is the opinion of the author that aside from being inconsistent with the weight of evidence, claims that there is no competition between food and fuel do a disservice to the industry that these commentators are trying to support. Flat denial of the existence of competition between food and fuel sets up an argument that the biofuel industry cannot win on evidence. Far more productive for all concerned would be an evidence-based discussion about how large the impact on food security is expected to be, how this compares to a reasonable characterisation of the benefits of biofuel policy, and how biofuel support mechanisms could be reframed to reduce the pressure on food markets, especially if and when the next food crisis comes round.
This said, there is a caricature that has been used from time to time on the other side of the argument, the idea of food being directly taken ‘out of the mouths of the poor’ and into the fuel tanks of expensive SUVs – this caricature is also unhelpful. There is a statistic sometimes used in the development community that the amount of corn required to fill up the tank of an SUV once would be enough to meet a person’s calorific requirement for a year. This statistic is broadly accurate, but this discussion is not about a choice between driving cars and feeding poor people. The agricultural commodities used for biofuel feedstock do not generally come

56 © 2017 Cerulogy
Thought for food
from stocks of staple foods destined for supply to people. The largest market for the maize and wheat used for biofuel production is animal feed. Generally, most biofuel feedstock will be sourced in the regions that there is biofuel demand, and so the markets most affected by U.S. and EU biofuel policy are the U.S. and EU food and feed markets. We can be confident that there are knock on impacts in the developing world, and that these impacts have negative welfare consequences, but only a fraction of the feedstock used for biofuel production would find its way to poor food consumers if biofuel mandates were cancelled tomorrow.
When considering potential impacts of biofuel demand on food prices, we must distinguish between the short, medium and long term effects. In the short term there is the potential for large impacts due to increased price volatility. This type of effect was likely a significant part of what was seen in the food price-crises of 2006-08 and again in 2011. Reducing the level of biofuel mandates would tend to reduce the risk of repeated price crises – this might also be achieved by changing the structure so that biofuel demand could be reduced in times of increased market pressure.
In the medium term, the dominant expected impact is an increase in equilibrium commodity prices caused by increased demand. The impact of EU biofuel demand on overall food prices is likely to be modest in percentage terms given the size of EU demand, but the impact on specific commodities or commodity groups (notably vegetable oils) could still be substantial.
For both exaggerated short term impacts and for medium term price impacts, there is an extensive body of evidence that the overall impact on welfare, especially in developing countries, will be negative. That includes reduced food security, increased poverty rates, and transfers of billions of dollars from poor households in developing countries. On the other hand, these negative impacts are not nor will be the primary cause of poverty in the world. To quote Wiggins & Mcdonald (2008):
“Price rises hurt the poor, the urban poor more than the rural, net food buyers more than those farmers who are net sellers. But even for the poor, the effects are not necessarily that strong. A 10% rise in all food prices might overall raise poverty by 0.4% percentage points — not welcome, but hardly disastrous.”
In the truly long term (say 20 years or more in this context), it is much harder to predict with confidence the overall impact of current or future biofuel policy. Given a long-term stable level of European demand for first generation biofuels, the market might be expected to readjust, and the further forward you go the less difference you would expect between the biofuel scenario and the policy-free counter-factual. Some authors have argued that higher demand for agricultural commodities now could boost research and development, and actually result eventually in lower prices in the very long term. While this is not inconceivable, it is also not well evidenced and it is certainly not widely agreed that this is the most likely outcome. We would advocate extreme caution to policy makers tempted to ignore a high certainty of short-term negative impacts in pursuit of highly uncertain long-term positive impacts.

www.cerulogy.com 57
A review of the interaction between biofuel consumption and food markets
ReferencesAbbott, P. C., Hurt, C., & Tyner, W. E. (2008). What’s Driving Food Prices? Farm Foundation
Issue Report, 75(July), 82. http://doi.org/10.1016/j.gie.2008.05.046
Abbott, P. C., Hurt, C., & Tyner, W. E. (2009). What’s driving food prices? March 2009 Update. Farm Foundation Issue Report, (March), 51. Retrieved from https://www.farmfoundation.org/webcontent/Farm-Foundation-Issue-Report-Whats-Driving-Food-Prices-404.aspx
ActionAid. (2011). The human cost of biofuel is rising. London: ActionAid.
Al-Riffai, P., Dimaranan, B., & Laborde, D. (2010). Global trade and environmental impact study of the EU biofuels mandate. Energy, (March), 1–125. Retrieved from http://trade.ec.europa.eu/doclib/html/145954.htm%5Cnhttp://environmentportal.in/files/biofuelsre-portec.pdf
Baffes, J., & Haniotis, T. (2010). Placing the 2006/08 Commodity Price Boom into Perspective. World, July 2010(July), 40. Retrieved from http://papers.ssrn.com/sol3/papers.cfm?abstract_id=1646794
Baier, S., Clements, M., Griffiths, C., & Ihrig, J. (2009). Biofuels Impact on Crop and Food Prices: Using an Interactive Spreadsheet. FRB International Finance Discussion Paper, (967), 1–32.
BioGrace. (2017). BioGrace version 4d. BioGrace. Retrieved from http://www.biograce.net/content/ghgcalculationtools/recognisedtool/
Blanco Fonseca, M., Burrell, A., Gay, S. H., Henseler, M., Kavallari, A., M’Barek, R., … Tonini, A. (2010). Impacts of the EU biofuel target on agricultural markets and land use: a comparative modelling assessment. Reproduction (Vol. Canadian-J). http://doi.org/10.2791/45105
Chakravorty, U., Hubert, M.-H., Moreaux, M., & Nøstbakken, L. (2017). Long-Run Impact of Biofuels on Food Prices. The Scandinavian Journal of Economics, 119(3), 733–767. http://doi.org/10.1111/sjoe.12177
Collins, K. (2008). The Role of Biofuels and Other Factors in Increasing Farm and Food Prices: A Review of Recent Developments with a Focus on Feed Grain Markets and Market Prospects. Retrieved from http://www.globalbioenergy.org/uploads/media/0806_Keith_Collins_-_The_Role_of_Biofuels_and_Other_Factors.pdf
Cornelsen, L., Green, R., Turne, R., Dangour, A. D., Shankar, B., Mazzocchi, M., & Smit, R. D. (2014). What Happens to Patterns of Food Consumption When Food Prices Change? Evidence from a Systematic Review and Meta-Analysis of Food Price Elasticities Globally. Health Economics, 24(12), 1548–1559. http://doi.org/10.1002/hec

58 © 2017 Cerulogy
Thought for food
Cororaton, C. B., Timilsina, G., & Mevel, S. (2010). Impacts of Large Scale Expansion of Biofuels on Global Poverty and Income Distribution. World Bank, Washington D.C.
Dawe, D. (2010). The Rice Crisis: Markets, Policies and Food Security. London and Washington D.C.: The Food and Agriculture Organization of the United Nations and Earthscan. http://doi.org/10.4324/9781849776684
de Gorter, H., Drabik, D., & Just, D. R. (2013). How biofuels policies affect the level of grains and oilseed prices: Theory, models and evidence. Global Food Security, 2(2), 82–88. http://doi.org/10.1016/j.gfs.2013.04.005
De Hoyos, R. E., & Medvedev, D. (2009). Poverty Effects of Higher Food Prices. Washington D.C.: World Bank Development Prospects Group.
DG Agri, & Joint Research Centre. (2016). EU Agricultural Outlook: Prospect for the EU agri-cultural markets and income 2016-2026. Brussels: European Commission. Retrieved from https://ec.europa.eu/agriculture/markets-and-prices/medium-term-outlook_en
Enders, W., & Holt, M. T. (2012). Sharp Breaks or Smooth Shifts? an Investigation of the Evolution of Primary Commodity Prices. American Journal of Agricultural Economics, 94(3), 659–673. http://doi.org/10.1093/ajae/aar162
European Commission. (2013). Renewable energy progress report. COM(2013) 175 final. Brussels: European Commission. http://doi.org/10.1017/CBO9781107415324.004
European Commission. Proposal for a Directive of the European Parliament and of the Council on the promotion of the use of energy from renewable sources (2016). Brussels: European Commission. Retrieved from http://eur-lex.europa.eu/legal-content/EN/TXT/?uri=CELEX:52016PC0767R%2801%29
European Commission. (2017a). EU Crops Market Observatory - Oilseeds and protein crops | Agriculture and rural development. Retrieved August 29, 2017, from https://ec.europa.eu/agriculture/market-observatory/crops/oilseeds-protein-crops/balance-sheets_en
European Commission. (2017b). Renewable Energy Progress Report. COM(2017) 57. Brussels: European Commission. Retrieved from http://eur-lex.europa.eu/legal-content/EN/TXT/PDF/?uri=CELEX:52017DC0057&qid=1488449105433&from=EN
Flipse, S. M., & Osseweijer, P. (2013). Media attention to GM food cases: An innovation perspective. Public Understanding of Science, 22(2), 185–202. http://doi.org/10.1177/0963662512458631
Food and Agriculture Organization (FAO). (2008). The State of Food and Agriculture - Biofuels: prospects, risks and opportunities. Rome: Food and Agriculture Organization of the United Nations. Retrieved from http://www.fao.org/docrep/011/i0100e/i0100e00.htm
Fouad, A., & Gillson, I. (2015). Trade policy and food security: improving access to food in developing countries in the wake of high world prices. Washington D.C.: World Bank Group. Retrieved from https://openknowledge.worldbank.org/handle/10986/20537

www.cerulogy.com 59
A review of the interaction between biofuel consumption and food markets
Gecan, R., Johansson, R., FitzGerald, K., Kile, J., Moore, D., & Papenfuss, S. (2009). The Impact of Ethanol Use on Food Prices and Greenhouse-Gas Emissions, (April), 26. Retrieved from https://www.cbo.gov/sites/default/files/111th-congress-2009-2010/reports/04-08-ethanol.pdf
Gilbert, C. L. (2010). How to understand high food prices. Journal of Agricultural Economics, 61(2), 398–425.
Gilbert, C. L., & Mugera, H. K. (2014). Food Commodity Prices Volatility : The Role of Biofuels, 200–212.
Global Food Markets Group. (2010). The 2007/08 Agricultural Price Spikes: Causes and Policy Implications. London.
Hamelinck, C., Lovinfosse, I. de, Koper, M., Beestermoeller, C., Nabe, C., Kimmel, M., … Fischer, G. (2013). Renewable energy progress and biofuels sustainability. Brussels: European Commission.
Hausman, C., Auffhammer, M., & Berck, P. (2012). Farm Acreage Shocks and Crop Prices: An SVAR Approach to Understanding the Impacts of Biofuels. Environmental and Resource Economics, 53(1), 117–136. http://doi.org/10.1007/s10640-012-9550-x
Hazzledine, M., Pine, A., Mackinson, I., Ratcliffe, J., Salmon, L., Pine, A., & Mackinson, I. (2011). Estimating displacement ratios of wheat DDGS in animal feed rations in Great Britain. The International Council …. Retrieved from http://www.theicct.org/estimating-displacement-ratios-wheat-ddgs-animal-feed-rations-great-britain
Headey, D., & Fan, S. (2010). Reflections on the Global Food Crisis: How Did It Happen? How Has It Hurt? And How Can We Prevent the Next One? Research Monogram. International Food Policy Research Institute (IFPRI). (Vol. 165). International Food Policy Research Institute. http://doi.org/10.2499/9780896291782RM165
Hertel, T. W., & Beckman, J. (2012). Commodity Price Volatility in the Biofuel Era: An Examination of the Linkage between Energy and Agricultural Markets. In J. S. Graff Zivin & J. M. Perloff (Eds.), The Intended and Unintended Effects of U.S. Agricultural and Biotechnology Policies (pp. 189–221). National Bureau of Economic Research, Inc. Retrieved from http://ideas.repec.org/h/nbr/nberch/12113.html
HLPE. (2013). Biofuels and Food Security. Rome. Retrieved from http://www.fao.org/fileadmin/user_upload/hlpe/hlpe_documents/HLPE_Reports/HLPE-Report-5_Biofuels_and_food_security.pdf
Hochman, G., Kaplan, S., Rajagopal, D., & Zilberman, D. (2012). Biofuel and Food-Commodity Prices. Agriculture, 2(4), 272–281. http://doi.org/10.3390/agriculture2030272
Hochman, G., Rajagopal, D., Timilsina, G. R., & Zilberman, D. (2011). The role of inventory adjustments in quantifying factors causing food price inflation. World Bank Policy Research Working Papers, (August). http://doi.org/10.1596/1813-9450-5744

60 © 2017 Cerulogy
Thought for food
IEA. (2010). World Energy Outlook. Paris, France: International Energy Agency.
Ivanic, M., & Martin, W. (2008). Implications of higher global food prices for poverty in low-income countries. Agricultural Economics, 39(s1), 405–416. http://doi.org/10.1111/j.1574-0862.2008.00347.x
Kline, K. L., Msangi, S., Dale, V. H., Woods, J., Souza, G. M., Osseweijer, P., … Mugera, H. K. (2017). Reconciling food security and bioenergy: priorities for action. GCB Bioenergy, 9(3), 557–576. http://doi.org/10.1111/gcbb.12366
Kretschmer, B., Bowyer, C., & Buckwell, A. (2012). EU biofuel use and agricultural commodity prices: a review of the evidence base. London: Institute for European Environmental Policy (IEEP). Retrieved from https://ieep.eu/publications/biofuels-and-agricultural-commodity-prices-a-review-of-the-evidence-base
Laborde, D. (2011a). Assessing the land use change consequences of European biofuel policies. European Commission, Brussels.
Laborde, D. (2011b). Domestic Policies in a Globalized World: What You Do is What I Get. Washington, D.C.: CGIAR.
Lipsky, J. (2008). Commodity Prices and Global Inflation, Remarks by John Lipsky, First Deputy Managing Director, International Monetary Fund. New York: International Monetary Fund. Retrieved from http://www.imf.org/en/News/Articles/2015/09/28/04/53/sp050808
Malins, C. (2013). Vegetable oil markets and the EU biofuel mandate. Washington, D.C.: International Council on Clean Transportation.
Malins, C., Searle, S. Y., & Baral, A. (2014). A Guide for the Perplexed to the Indirect Effects of Biofuels Production. International Council on Clean Transportation. Retrieved from http://www.theicct.org/guide-perplexed-indirect-effects-biofuels-production
Mitchell, D. (2008). A Note on Rising Food Prices. World, World Bank, 21. http://doi.org/10.2139/ssrn.1233058
National Research Council. (2011). Renewable Fuel Standard: Potential Economic and Environmental Effects of U.S. Biofuel Policy. Washington, D.C.: National Academies Press. http://doi.org/10.17226/13105
Noleppa, S., & Cartsburg, M. (2016). Palm Oil Report Germany – Searching for Alternatives. (I. Petersen, Ed.). WWF Deutschland. Retrieved from http://wwf.panda.org/what_we_do/footprint/agriculture/palm_oil/
OECD. (2008a). Biofuel support policies: an economic assessment. Organization for Economic Co-operation and Development.
OECD. (2008b). Rising Food Prices: causes and consequences. OECD Publishing. http://doi.org/10.1126/science.180.4084.371

www.cerulogy.com 61
A review of the interaction between biofuel consumption and food markets
OECD, & FAO. (2017). OECD-FAO Agricultural Outlook 2017-2026. OECD Publishing. Retrieved from http://www.oecd-ilibrary.org/agriculture-and-food/oecd-fao-agricultural-outlook-2017-2026_agr_outlook-2017-en
Peña-López, I. (2008). Global economic prospects 2008: Technology diffusion in the developing world. Washington, D.C.: The World Bank. Retrieved from http://documents.worldbank.org/curated/en/781601468338978015/Global-economic-prospects-2008-technology-diffusion-in-the-developing-world
Persson, U. M. (2014). The Impact of Biofuel Demand on Agricultural Commodity Prices: A Systematic Review. Advances in Bioenergy: The Sustainability Challenge, 465–482. http://doi.org/10.1002/9781118957844.ch30
Pfuderer, S., Davies, G., & Mitchell, I. (2010). The role of demand for biofuel in the agricultural commodity price spikes of 2007/08. London.
Rausser, G. C., & De Gorter, H. (2013). US policy contributions to agricultural commodity price fluctuations, 2006-12. UNU-WIDER. Retrieved from http://collections.unu.edu/view/UNU:3502
Regmi, A., & Seale, J. L. (2010). Cross-Price Elasticities of Demand Across 114 Countries Visit Our Website To Learn More ! Cataloging Record : (Technical Bulletins No. 1925). Washington D.C.: USDA ERS.
Roberts, M. J., & Schlenker, W. (2010). Identifying Supply and Demand Elasticities of Agricultural Commodities: Implications for the US Ethanol Mandate. National Bureau of Economic Research Working Paper Series, No. 15921. Retrieved from http://www.nber.org/papers/w15921 http://www.nber.org/papers/w15921.pdf
Rosegrant, M. W. (2008). Biofuels and grain prices: impacts and policy responses. International Food Policy Research Institute, 1–4. Retrieved from http://www.grid.unep.ch/FP2011/step1/pdf/004_Rosegrant_2008.pdf
Searchinger, T. D., Edwards, R., Mulligan, D., Heimlich, R., & Plevin, R. (2015). Do biofuel policies seek to cut emissions by cutting food? Science, 347(6229), 1420–1422. http://doi.org/10.1126/science.1261221
Searchinger, T. D., Heimlich, R., Houghton, R. a, Dong, F., Elobeid, A., Fabiosa, J., … Yu, T.-H. (2008). Use of U.S. croplands for biofuels increases greenhouse gases through emissions from land-use change. Science (New York, N.Y.), 319(February), 1238–1240. http://doi.org/10.1126/science.1151861
Slayton, T. (2009). Rice Crisis Forensics: How Asian Governments Carelessly Set the World Rice Market on Fire. Development, (163), 43. http://doi.org/10.2139/ssrn.1392418
Sumner, D. A. (2009). Recent Commodity Prices Movements in Historical Perspective. American Journal of Agricultural Economics, 91(5), 1250–1256. http://doi.org/10.1111/j.l467-8276.2009.01292.x

62 © 2017 Cerulogy
Thought for food
Swinnen, J., & Squicciarini, P. (2012). Mixed Messages on Prices and Food Security. Science, 335(6067), 405–406. http://doi.org/10.1126/science.1210806
Tadasse, G., Algieri, B., Kalkuhl, M., & von Braun, J. (2016). Drivers and Triggers of International Food Price Spikes and Volatility. In Food Price Volatility and Its Implications for Food Security and Policy (pp. 59–82). Cham: Springer International Publishing. http://doi.org/10.1007/978-3-319-28201-5_3
Timmer, C. P. (2008). Causes of High Food Prices. Asian Development Bank Economics Working Paper Series No. 128, (128). Retrieved from http://www.adb.org/publications/causes-high-food-prices
To, H., & Grafton, R. Q. (2015). Oil prices, biofuels production and food security: past trends and future challenges. Food Security, 7(2), 323–336. http://doi.org/10.1007/s12571-015-0438-9
Trostle, R. (2008). A Report from the Economic Research Service Global Agricultural Supply and Demand : Factors Contributing to the Recent Increase in Food.
Valin, H., Peters, D., van den Berg, M., Frank, S., Havlík, P., Forsell, N., & Hamelinck, C. (2015). The land use change impact of biofuels consumed in the EU - Quantification of area and greenhouse gas impacts. European Commission. Brussels.
van der Mensbrugghe, D. (2008). The ENVironmental Impact and Sustainability Applied General Equilibrium (ENVISAGE) model. Washington, D.C.: World Bank. Retrieved from http://siteresources.worldbank.org/INTPROSPECTS/Resources/334934-1193838209522/Envisage7b.pdf
Wiggins, S., & Mcdonald, S. (2008). Review of the indirect effects of biofuels : Economic benefits and food insecurity. Nutrition, (June), 158. Retrieved from www.odi.org.uk
Wright, B. D. (2011). The economics of grain price volatility. Applied Economic Perspectives and Policy, 33(1), 32–58. http://doi.org/10.1093/aepp/ppq033
Zilberman, D., Hochman, G., Rajagopal, D., Sexton, S., & Timilsina, G. (2013). The Impact of Biofuels on Commodity Food Prices: Assessment of Findings. American Journal of Agricultural Economics, 95(2), 275–281. http://doi.org/10.1093/ajae/aas037
www.cerulogy.com 63
A review of the interaction between biofuel consumption and food markets
Annex A. Summary of assessments of the role of biofuels in the food price crisis
Below, we provide brief summaries of the conclusions on the role of biofuels in the food price spikes reported in a range of papers identified in our literature review. The review is not comprehensive, but it is extensive and we believe that we have captured a fair cross-section of the relevant literature.
A 2008 World Bank report (Peña-López, 2008) noted that biofuels, “have already had large effects on prices of commodities used as feedstocks, as well as for competing crops.” This report argues that the U.S. maize ethanol mandate was largely responsible for a 60% rise in maize prices from 2005 to 2006, and caused a sharp increase in wheat prices the following year due to maize displacing wheat production in the U.S.36, and associates biodiesel demand with 48 and 25 percent increases in a year in the price of palm oil and soybean oil respectively.
A short paper for the International Food Policy Research Institute (Rosegrant, 2008) undertook modelling that suggested that biofuel demand could explain 39 percent of maize price increase from 2000 to 2007, 21% of rice price increase and 22% of wheat price increase and concluded that, “In the short run, removal of ethanol blending mandates and subsidies and ethanol import tariffs, and in the United States—together with removal of policies in Europe promoting biofuels—would contribute to lower food prices.”
The First Deputy Managing Director of the International Monetary Fund stated in a speech in May 2008 (Lipsky, 2008) that, “IMF estimates suggest that increased demand for biofuels accounts for 70 percent of the increase in corn prices and 40 percent of the increase in soybean prices.”
A review for Kraft Foods (Collins, 2008) concluded that, “increased corn demand for ethanol could account for 25 to 50 percent of the corn price increase expected from 2006/07 to 2008/09.”
Testimony by the Chairman of the U.S. President’s Council of Economic Advisers to the Senate Foreign Relations Committee37 stated that “ethanol production is a significant contribu-tor to increases in corn prices,” with U.S. maize ethanol responsible for, “approximately 7.5 percentage points of the 37% increase in corn prices38 over the past twelve months,” with total global maize ethanol production accounting for, “about 13 percentage points of the 37% increase in corn prices, or about one-third of the increase in corn prices over the past year.” This statement noted that this increase in maize price would be associated with an increase of about 3% in the IMF food price index.39
36 We note however that FAOstat data shows an increase in harvested wheat area in the U.S. from 2006 to 2007, even alongside a 6.4 million hectare increase in maize area.
37 https://georgewbush-whitehouse.archives.gov/cea/lazear20080514.html
38 That is to say 20% of the increase in corn prices is associated with corn ethanol.
39 This 3% impact on the IMF food price index was incorrectly compared to the 75% impact on food

64 © 2017 Cerulogy
Thought for food
A 2008 review for the OECD (OECD, 2008b) of the food price crisis notes that from 2005 to 2007, “Demand for wheat and coarse grains grew almost twice as much as did production, and demand for vegetable oil increased two percentage points more than output. More than half of the increase in use of both coarse grains and vegetable oil was due to higher use in the biofuels industry.” This review argues that biofuels are a “new source of demand which is seen as one of the factors lifting prices to higher average levels in the future.”
A 2008 review for the Farm Foundation (Abbott et al., 2008) concluded that growth in production of biofuels was one of three main drivers of food commodity price increases, due primarily to the link created between oil prices and biofuel demand. It notes that stock to use ratios for a variety of commodities40 were at their lowest levels since at least 1985 by mid-2008, creating the context for price volatility. A follow up study (Abbott, Hurt, & Tyner, 2009) further noted that, “Since 2006, energy and agricultural markets became closely linked as biofuels production surged. Ethanol and biodiesel were linked as energy substitutes for gasoline and diesel, and usage of crops for these biofuels became large enough to influence world prices.”
The Asian Development Bank (Timmer, 2008) concluded that, “a combination of high and rising fuel prices coupled with legislative mandates to increase production of biofuels has established a firm link between petroleum prices and food prices,” but that price spikes were commodity specific – in particular that rice price spikes were related to export bans, wheat price spikes disease related, but that vegetable oil price spikes were an indirect result of maize demand increase. They note that, “senior and experienced commodity analysts place the share of biofuels’ contribution to the run-up in grain prices since mid-2007 at between 60% (Collins, the former chief economist for the United States Department of Agriculture, analyzing only maize) and 75% (Mitchell 2008, the senior commodity economist at the World Bank, analyzing all grain markets).” They emphasise the complexity of market relationships between food commodities, and the difficulty associated with assessing cross-price effects in models.
A paper for the U.S. Federal Reserve (Baier, Clements, Griffiths, & Ihrig, 2009) reported that, “we estimate that the increase in worldwide biofuels production pushed up corn, soybean and sugar prices by 27, 21 and 12 percentage points respectively [from June 2006 to June 2008].” This was decomposed between the major biofuel policies, “the increase in U.S. biofuels production (ethanol and biodiesel) pushed up corn prices by more than 22 percentage points and soybean prices (soybeans and soybean oil) by more than 15 percentage points, while the increase in EU biofuels production pushed corn and soybean prices up around 3 percentage points. Brazil’s increase in sugar-based ethanol production accounts for the entire rise in the price of sugar.” This paper attributed to biofuels a 12% increase to the overall IMF food price index.
A review of the global rice crisis (Slayton, 2009) argued that biofuels did not drive the rice price crisis, but were a factor in, “the ‘food crisis’ enveloping the other grains and vegetable oils.”
The U.S Congressional Budget Office (Gecan et al., 2009) assessed the impact of maize ethanol demand on food prices from April 2007-2008, and concluded that it contributed 50 to 80 cents per bushel of maize, representing a 28 to 47% increase in the maize price in this period.
commodity prices suggested by (Mitchell, 2008) – in fact, impacts on consumer food prices will always be less than impacts on underlying food commodity prices, so the comparison is either based on a misunderstanding or a misrepresentation.
40 Total grains, maize, wheat, rice, soy oil, palm oil, rapeseed oil, soy meal, rapeseed meal.

www.cerulogy.com 65
A review of the interaction between biofuel consumption and food markets
A historical comparison of the price crisis in 2008 with crises in the 1970’s (Sumner, 2009) notes that, “Government-induced demand for biofuels feedstock will contribute to holding prices above the pre-2007 equilibrium. The renewable fuels standards included in the Energy Independence and Security Act of 2007 will likely cause increasing acreage of corn over the next few years to meet the increasing and completely inelastic ethanol demand implied by biofuels mandates. Unless the mandates are moderated or U.S. import duties for imported ethanol are reduced substantially, relatively high corn prices seem likely to continue.”
A review for the UK Department for the Environment, Farming and Rural Affairs (Global Food Markets Group, 2010; Pfuderer, Davies, & Mitchell, 2010) was more cautious in ascribing responsibility for the price spike to biofuels, concluding that, “biofuels were one of the various drivers of demand in years leading up to the spike, but that many commentators are ascribing too much weight to biofuels as a trigger of the spike.” The report notes that, “here is broad agreement that biofuel demand will exert upward pressure on agricultural prices for those feedstocks used in biofuel production,” and that, “As biofuel production accelerated in 2006, it also seems fair to conclude that part of the increase in maize prices in 2008 was due to biofuels,” which, “did have some knock-on effects to soybean planting decisions and therefore the price of soybeans.” They argued that there is no convincing evidence, however, that maize demand had a strong impact on wheat prices, and therefore that biofuels were not the key driver of the price crisis more generally.
A Università degli Studi di Trento discussion paper (Gilbert, 2010) concluded that, “The demand for grains and oilseeds as biofuel feedstocks was the main cause of the price rise [from 2007 to mid-2008],” and also notes that biofuel policy has created a, “much closer link between oil prices and the prices of agricultural food commodities now than was the case in the past.” This paper explains price rises in non-biofuel-feedstock commodities as being driven “indirectly through land reallocation.”
The International Food Policy Research Institute (IFPRI) published an extensive review of the food price crisis (Headey & Fan, 2010). It finds that, “there is little doubt that biofuel demand in the United States is having a major impact on maize prices and probably on soybeans as well, while E.U. and European agricultural trends toward increased oilseed production have increasingly affected wheat markets. Moreover, the unwillingness of these governments to move away from biofuel subsidies will probably keep agricultural markets significant tighter for years to come.” They conclude that, “The challenge most relevant to the food crisis is clearly the diversion of crops from food or feed to biofuels,” and that, “In the foreseeable future, biofuels production does not look good for global food security.”
Wright (2011) in a review of the understanding of food price volatility notes that maize ethanol production in the U.S. absorbed all maize production growth from 2000 to 2010, and observed that, “It is hard to believe that, if a multi-year drought had reduced the supply of United States corn available for 2008, 2009 and 2010 to the level available in the year 2000, and corn prices had soared, that there would be any dispute that the drought was a dominant influence on the price move.” He concludes that, “In 2007/08 the aggregate stocks of major grains carried over from the previous year were at minimal levels, much less than they would have been without mandated diversions of grain and oilseeds for biofuels,” and that this draw down of stocks created the context for subsequent price volatility. On the other hand, he also states that, “supplies were sufficient to meet food demands without such great jumps in price, had exporters and importers not panicked, leading to a cascade of export bans and taxes that cut off importers from their usual suppliers.”

66 © 2017 Cerulogy
Thought for food
The U.S. National Research Council reviewed the economic and environmental impacts of U.S. biofuel policy, including the role of biofuels in the food price crisis (National Research Council, 2011). The report concluded that the impact from biofuel demand on agricultural commodity prices was likely in the range of a 20-40% increase. A review by Tufts University of the impact on Mexico of U.S. maize ethanol policy used this estimated range of the impact on commodity prices to calculate that Mexico may have had to pay $1.5 billion over the period 2006-2011 to cover increased maize import costs associated with biofuels.
A World Bank paper focused on the role of inventory adjustments in the price crisis (Hochman, Rajagopal, Timilsina, & Zilberman, 2011) concluded that biofuel demand contributed 20% to the increase in corn price in 2007 relative to 2001, and 7% to the price increase of soybeans, and assumed that biofuel demand did not impact wheat or rice prices significantly.
(Hausman, Auffhammer, & Berck, 2012) develop an econometric model of the impact on prices of land dedication to biofuel production, and find that, “For a reduction in corn area of 1 million acres, we estimate a corn price increase of $0.04 per bushel.” The paper concludes that increased maize ethanol production could explain 27% of maize price rises from 2006-2007.
A paper in the journal Agriculture (Hochman, Kaplan, Rajagopal, & Zilberman, 2012) concluded that, “The introduction of biofuels led to a 25% increase in the price of corn and soybean in 2011 relative to 2001.”
A review by the UN FAO High Level Panel of Experts (HLPE, 2013) notes that since 2007 the price of U.S. maize has been extremely close to the ‘breakeven point’ for maize ethanol (the maize price at which ethanol is competitive with gasoline, Figure 7). The review states that, “a significant part of the expansion of corn production in the US came at the expense of other major global crops, including soybeans. This was seen to have two effects: an increase in the price of corn and of its close substitutes like wheat on world markets, and a stimulation of food and feed production in other regions of the world…. Even after accounting for return of co-products to the feed market, this is a large and persistent new demand for corn that surely has induced price dynamics.”
The HLPE review also notes that, “the introduction of biofuels might have had not merely an additional, but an amplifying effect with respect to that of another factor.” This gets at the potential non-linearity of price responses to a combination of stimuli. In effect, this is saying that the sum of several market impacts may be greater than the sum of its parts. It implies for instance that a demand increase that might lead to a 10% price rise under ‘normal’ market conditions might have led to a 40% market increase in the particular conditions of 2006-08. HLPE conclude that, “In the last few years of short-term (since 2004) commodity food price increase, biofuels did play an important role,” but note that, “previously central question (“What was the responsibility of biofuels in the 2007/8 price spike at the time?”), as enlighten-ing and informative as it might be, could very well be a diversionary exercise today.”

www.cerulogy.com 67
A review of the interaction between biofuel consumption and food markets
Breakeven corn price calculated from nearby ethanol and natural gas price
Actual nearby corn price
Feb 2005 Jul 2006 Nov 2007 Mar 2009 Aug 2010 Dec 2010
US D
olla
rs p
er b
ushe
l
Figure 7. Comparison of reported maize prices with calculated breakeven maize price for ethanol production in the USA
To & Grafton (2015) in the Journal of Food Security consider the impact of biofuel production and crude oil prices on prices during the food crisis. Their model suggests that biofuel production explained 38% of the increase in US food prices during the food price crisis, and 19% of the global increase. Crude oil prices were found to explain 41 and 40% of U.S. and global food price changes, respectively. They conclude that, “At a global level, if global biofuels production were to increase by [167 billion litres] per year, the global food price would increase by 2.7 percentage points in the short run, and increase by 6.3 percentage points in the long run,” and that, “subsidies and fuel mandates of first-generation biofuels have already contributed to food insecurity and will likely do so in the future.”
A recent book chapter reviewing drivers and triggers of food price spikes (Tadasse, Algieri, Kalkuhl, & von Braun, 2016) states that, “Recent literature has identified the determinants of food price hikes as biofuel demand, speculation in commodity futures markets, and macro-economic shocks,” and that, “Studies have shown that higher biofuel demand and energy mandates have a large impact on food prices.”

© Cerulogy, 2017