Authentication of Lotus Root Powder Adulterated With Potato Starch and or Sweet Potato Starch Using...
7
Analytical Methods Authentication of lotus root powder adulterated with potato starch and/ or sweet potato starch using Fourier transform mid-infrared spectroscopy Jia Liu a , Yu Wen a , Nan Dong a , Chunli Lai a , Guohua Zhao a,b,c,⇑ a College of Food Science, Southwest University, Chongqing 400715, PR China b Key Laboratory of Food Processing and Technology of Chongqing, Chongqing 400715, PR China c Chongqing Sweet Potato Engineering and Technology Centre, Chongqing 400715, PR China article info Article history: Received 12 July 2012 Received in revised form 11 December 2012 Accepted 2 May 2013 Available online 12 June 2013 Keywords: Lotus root powder Adulteration Fourier transform mid-infrared Partial least squares abstract Fourier transform mid infrared (FT-MIR) spectroscopy combined with chemometrics techniques were developed for classification and quantification of cheaper starches (potato and sweet potato starch) in lotus root powder (LRP). By performing principal component analysis (PCA), it was possible to distinguish between adulterated and non-adulterated LRP. The coefficient of determination (R 2 ) and standard devi- ation ratio (SDR) of calibration set were found to be 0.9587–0.9898 and 3.63–10.2, depending on the pre- treatment of spectra. The external validation set gave a coefficient of determination (R 2 ) and standard deviation ratio (SDR) of 0.9810 and 5.47, respectively. Moreover, the limit of detection (1%), the limit of quantification (3%), reasonable recovery (92.3–101.5%), satisfactory intra-assay (2.9–5.5%) and inter- assay (11.0–13.5%) precision illustrated the good performance of the present method. The results obtained in this study indicate that FT-MIR spectroscopy can be used as an easy, rapid and novel tool to detect the LRP adulterated with cheaper starches. Ó 2013 Elsevier Ltd. All rights reserved. 1. Introduction With the rapid development of the Chinese economy, the qual- ity of life and demand for healthy food have improved significantly. However, this has brought with an increase in unhealthy practises in food processing. In recent years, authentication of foodstuff has posed a major challenge for regulatory agencies. Labelling of prod- ucts in which high-cost ingredients are substituted for cheaper ones is a common practise in authentication of products (Rohman & Che Man, 2011). Thus, to maintain the market order, regulatory bodies and food processors urgently need rapid methods of con- firming the authenticity of foods. Infrared (IR) spectroscopy as an emergent analytical technique has become a well-accepted method. It is environment-friendly and does not demand complicated sample preparation procedure (De Luca et al., 2011). The fingerprints of functional groups in many compounds enable IR spectroscopy to be widely used in food and pharmaceutical analysis (Bittnera et al., 2011). However, broad and overlapping absorption peaks (high dimensions and complexity) make it complicated to do quantitative analysis with MIR spectra (Liu, Chen, Dong, Ming, & Zhao, 2012). The modern multivariate statistical techniques offer greater possibilities to analysis a very high number of data obtained using different ana- lytical techniques (De Luca et al., 2011). Partial least-squares (PLS) regression, for advantages of simplicity and ease of use, is one of the most widely used calibration models, which has proved effective in improving model performance in the presence of linearity (Blanco, Coello, Iturriaga, Maspoch, & Pages, 2000; Wold, Sjostrom, & Eriksson, 2001). The combination of IR and chemometric methods in food adulteration has attracted lots of interests in recent years. It is widely used in numerous foodstuff adulteration such as adulter- ating honey with corn syrup, high fructose corn syrup and in- verted sugar (Gallardo-Velázquez, Osorio-Revilla, Zuñiga-de Loa, & Rivera-Espinoza, 2009); mango juice adulterated with sucrose (Jha & Gunasekaran, 2010); lard adulteration in cake, chocolate and chocolate products (Che Man, Syahariza, Mirghani, Jinap, & Bakar, 2005; Syahariza, Che Man, Selamat, & Bakar, 2005); soya bean meal adulterated with melamine (Haughey, Graham, Cancouët, & Elliott, 2012); virgin coconut oil adulterated with corn and sunflower oils (Rohman & Che Man, 2011); edible veg- etable oil adulterated with used frying oil (Zhang et al., 2012); extra virgin olive oil adulteration with edible and palm oils (Maggio, Cerretani, Chiavaro, Kaufman, & Bendini, 2010; Rohman and Che Man, 2010). 0308-8146/$ - see front matter Ó 2013 Elsevier Ltd. All rights reserved. http://dx.doi.org/10.1016/j.foodchem.2013.05.155 ⇑ Corresponding author. Address: College of Food Science, Southwest University, #1 Tiansheng Road, Chongqing 400715, PR China. Tel.: +86 23 68 25 19 02; fax: +86 68 25 19 47. E-mail address: [email protected] (G. Zhao). Food Chemistry 141 (2013) 3103–3109 Contents lists available at SciVerse ScienceDirect Food Chemistry journal homepage: www.elsevier.com/locate/foodchem
description
FTIR research paper
Transcript of Authentication of Lotus Root Powder Adulterated With Potato Starch and or Sweet Potato Starch Using...
Food Chemistry 141 (2013) 3103–3109
Contents lists available at SciVerse ScienceDirect
Food Chemistry
journal homepage: www.elsevier .com/locate / foodchem
Analytical Methods
Authentication of lotus root powder adulterated with potato starch and/or sweet potato starch using Fourier transform mid-infraredspectroscopy
0308-8146/$ - see front matter � 2013 Elsevier Ltd. All rights reserved.http://dx.doi.org/10.1016/j.foodchem.2013.05.155
⇑ Corresponding author. Address: College of Food Science, Southwest University,#1 Tiansheng Road, Chongqing 400715, PR China. Tel.: +86 23 68 25 19 02; fax: +8668 25 19 47.
E-mail address: [email protected] (G. Zhao).
Jia Liu a, Yu Wen a, Nan Dong a, Chunli Lai a, Guohua Zhao a,b,c,⇑a College of Food Science, Southwest University, Chongqing 400715, PR Chinab Key Laboratory of Food Processing and Technology of Chongqing, Chongqing 400715, PR Chinac Chongqing Sweet Potato Engineering and Technology Centre, Chongqing 400715, PR China
a r t i c l e i n f o a b s t r a c t
Article history:Received 12 July 2012Received in revised form 11 December 2012Accepted 2 May 2013Available online 12 June 2013
Keywords:Lotus root powderAdulterationFourier transform mid-infraredPartial least squares
Fourier transform mid infrared (FT-MIR) spectroscopy combined with chemometrics techniques weredeveloped for classification and quantification of cheaper starches (potato and sweet potato starch) inlotus root powder (LRP). By performing principal component analysis (PCA), it was possible to distinguishbetween adulterated and non-adulterated LRP. The coefficient of determination (R2) and standard devi-ation ratio (SDR) of calibration set were found to be 0.9587–0.9898 and 3.63–10.2, depending on the pre-treatment of spectra. The external validation set gave a coefficient of determination (R2) and standarddeviation ratio (SDR) of 0.9810 and 5.47, respectively. Moreover, the limit of detection (1%), the limitof quantification (3%), reasonable recovery (92.3–101.5%), satisfactory intra-assay (2.9–5.5%) and inter-assay (11.0–13.5%) precision illustrated the good performance of the present method. The resultsobtained in this study indicate that FT-MIR spectroscopy can be used as an easy, rapid and novel toolto detect the LRP adulterated with cheaper starches.
� 2013 Elsevier Ltd. All rights reserved.
1. Introduction
With the rapid development of the Chinese economy, the qual-ity of life and demand for healthy food have improved significantly.However, this has brought with an increase in unhealthy practisesin food processing. In recent years, authentication of foodstuff hasposed a major challenge for regulatory agencies. Labelling of prod-ucts in which high-cost ingredients are substituted for cheaperones is a common practise in authentication of products (Rohman& Che Man, 2011). Thus, to maintain the market order, regulatorybodies and food processors urgently need rapid methods of con-firming the authenticity of foods.
Infrared (IR) spectroscopy as an emergent analytical techniquehas become a well-accepted method. It is environment-friendlyand does not demand complicated sample preparation procedure(De Luca et al., 2011). The fingerprints of functional groups in manycompounds enable IR spectroscopy to be widely used in foodand pharmaceutical analysis (Bittnera et al., 2011). However,broad and overlapping absorption peaks (high dimensions andcomplexity) make it complicated to do quantitative analysis with
MIR spectra (Liu, Chen, Dong, Ming, & Zhao, 2012). The modernmultivariate statistical techniques offer greater possibilities toanalysis a very high number of data obtained using different ana-lytical techniques (De Luca et al., 2011). Partial least-squares(PLS) regression, for advantages of simplicity and ease of use, isone of the most widely used calibration models, which has provedeffective in improving model performance in the presence oflinearity (Blanco, Coello, Iturriaga, Maspoch, & Pages, 2000; Wold,Sjostrom, & Eriksson, 2001).
The combination of IR and chemometric methods in foodadulteration has attracted lots of interests in recent years. It iswidely used in numerous foodstuff adulteration such as adulter-ating honey with corn syrup, high fructose corn syrup and in-verted sugar (Gallardo-Velázquez, Osorio-Revilla, Zuñiga-de Loa,& Rivera-Espinoza, 2009); mango juice adulterated with sucrose(Jha & Gunasekaran, 2010); lard adulteration in cake, chocolateand chocolate products (Che Man, Syahariza, Mirghani, Jinap, &Bakar, 2005; Syahariza, Che Man, Selamat, & Bakar, 2005); soyabean meal adulterated with melamine (Haughey, Graham,Cancouët, & Elliott, 2012); virgin coconut oil adulterated withcorn and sunflower oils (Rohman & Che Man, 2011); edible veg-etable oil adulterated with used frying oil (Zhang et al., 2012);extra virgin olive oil adulteration with edible and palm oils(Maggio, Cerretani, Chiavaro, Kaufman, & Bendini, 2010; Rohmanand Che Man, 2010).
3104 J. Liu et al. / Food Chemistry 141 (2013) 3103–3109
Lotus root powder (LRP) is produced from lotus roots. It isknown for helping to improve human health (Niu, Zhao, Jia, & Li,2012). Besides its main component of starch, LRP is rich in protein,amino acids, reducing sugars, dietary fibre, minerals, beta-caro-tene, and vitamins. Nowadays, LRP is commercially available inChina and mainly consumed as breakfast and incorporated intofast food and traditional confectionery as a functional ingredient(Man et al., 2012). Costs of LRP are high, making it prone to beadulterated with cheaper starches, such as potato starch and sweetpotato starch in order to increase profits. The traditional methodsto authenticate LRP are impractical due to their dependence onsensory and microscope and cannot quantify the adulterants.Meanwhile, there is no information available on the use of IR com-bined with chemometrics for detection and quantification of adul-terants in LRP. Therefore, the aim of the present study was toinvestigate the feasibility of using Fourier transform mid-infrared(MIR) spectroscopy as an alternative for quantitative analysis ofLRP adulterated with potato starch and sweet potato starch.
2. Materials and methods
2.1. Materials and regents
Lotus root powder (Youlian Food Co., Ltd. and ChunxiangyuanFood Co., Ltd.), sweet potato starch (JiaXian Food Co., Ltd. andShuangxin Food Co., Ltd.), and potato starch (JingTian AgricultureDevelopment Co., Ltd. and JiaXian Food Co., Ltd.) were purchasedfrom a local supermarket. KBr (IR spectroscopy grade) was pur-chased from Tianjin Guangfu Fine Chemical Research Institute(Tianjin, China).
2.2. Instrumental analysis and spectral acquisition
2.2.1. Pellet preparationAll samples including lotus root powder, potato starch and
sweet potato starch were dried in an oven (DHG-9140, Qixing,Shanghai, China) at 45 �C overnight. After drying, the samples wereblended with dried KBr powder and pressed into tablets beforemeasurement. The apparatus used to get the KBr pellet was a tabletproducer (YP-2, ShanYue Scientific Instrument Ltd., Shanghai, Chi-na) attached to a disc notch model. All tablets were prepared bymixing dried KBr and sample in a 50/1 (w/w) proportion. 0.2 g ofthe prepared mixture was used for each tablet, which was thenput into the sample holder of the FT-IR instrument for spectralacquisition. Weight measurements were performed on an analyti-cal balance (BS-223S, Sartorius Instrument System Co., Ltd., Beijing,China) with a precision of ±0.001 g.
2.2.2. Instrumental analysisThe MIR spectra of samples were recorded in transmittance
mode at 4 cm�1 interval over the spectral range from 500 to4000 cm�1, using a Perkin Elmer Spectrum 2000 FT-IR Spectrome-ter with a deuterated triglycine sulphate (DTGS) detector. Spectralreadings were taken in triplicate for each sample and the mean ofthese replicates was used in subsequent data analysis. In order toreduce the noise of the instruments, the collected spectra were ra-tioned against air as background.
2.3. Chemometric software for data processing and statisticaltechniques used
Unscrambler (Version 9.5; Camo Inc., Trondheim, Norway) wasused for data processing. The chemometric procedures include thefollowing steps.
2.3.1. Calibration and prediction setsThe range of adulterated LRP was covered from 0% to 100%. For
the calibration set, the adulteration proportions were in 116 sam-ples set as 0%, 10%, 20%, 30%, 40%, 50%, 60%, 70%, 80%, 90%, 95% and100% (w/w). Each proportion in the calibration set from 10% to 95%was divided into three groups, including (1) LRP adulterated withpotato starch; (2) LRP adulterated with sweet potato starch; (3)LRP adulterated with equal amount of potato starch and sweet po-tato starch. To prepare the samples for calibration, LRP from You-lian Food Co., Ltd. was adulterated with potato starch formJingTian Agriculture Development Co., Ltd. and sweet potato starchfrom Shuangxin Food Co., Ltd. For the validation set, the adultera-tion proportions in 93 samples were set as 12%, 24%, 32%, 62%, 68%,72%, 76%, 78%, 84%, 88% and 93% (w/w). Each proportion was alsodivided into three groups as described in the calibration set. Toperform an external validation, samples for validation were pre-pared with LRP from Chunxiangyuan Food Co., Ltd. and adulteratedwith potato starch form Shuangxin Food Co., Ltd. and sweet potatostarch from Jiaxian Food Co., Ltd. Additionally, the calibration setand the external validation set were prepared by different mem-bers of laboratory personnel.
2.3.2. Principal component analysis (PCA)MIR spectra of the calibration set were exported from Spectrum
3.0 software in JCAMP DX format and imported into chemometricsoftware for analysis. PCA was carried out on the pre-treated datato cluster LRP and adulterated LRP.
2.3.3. Calibration step: cross validationIn the present study, partial least squares (PLS) analysis was
carried out to form linear models of prediction between spectraldata and the amount of adulterated starch in LRP. With the advan-tage that all of the data available can be used to determine the cal-ibration model, the leave-one-out cross-validation method wasemployed to evaluate the established models (Szydłowska-Czer-niak, 2007; Tavallaie, Talebpour, Azad, & Soudi, 2011). In the cali-bration set, the spectrum of one sample was randomly removedand the remaining spectra were used for building a PLS model.The left-out samples were then predicted by the PLS model. Thisprocedure was repeated until all the samples had been left outonce.
Once the calculation of the model was over, the leverage wascomputed. The leverage is a measure of how far from the centrean object is compared to the majority value (Shen et al., 2010). Itwas used to detect any outlying samples in the original data set.If the leverage value of the sample was are noticeably differentfrom the values of the other samples, which implies that it isnoticeably different from other samples, it must be removed (Urb-ano Cuadrado, Luque de Castro, Perez Juan, & Gomez-Nieto, 2005).The quality of calibration models were described by the root meansquare error of calibration (RMSEC), the root mean square error ofcross-validation (RMSECV) and the coefficient of determination be-tween the predicted and the measured parameters in calibration(R2
c ), and cross-validation (R2cv). In addition, the standard deviation
ratio (SDR) was also used to measure the precision of the PLS mod-el from the root mean square (Liu et al., 2012):
SDR ¼ r=RMSEP
where r is the standard deviation of the validation set. An SDR va-lue of 1 means no predictive power (equal to chance); 1.5 meansability to separate lower from higher values; 2 means an alreadyreasonable model and above 3 means an excellent model.
In order to improve the reliability, accuracy and stability ofcalibration models, it is necessary to preprocess the raw spectrabefore analysis. These pre-treatments were done as following(Gurdeniz & Ozen, 2009; Woodcock, Downey, & O’Donnell, 2009):
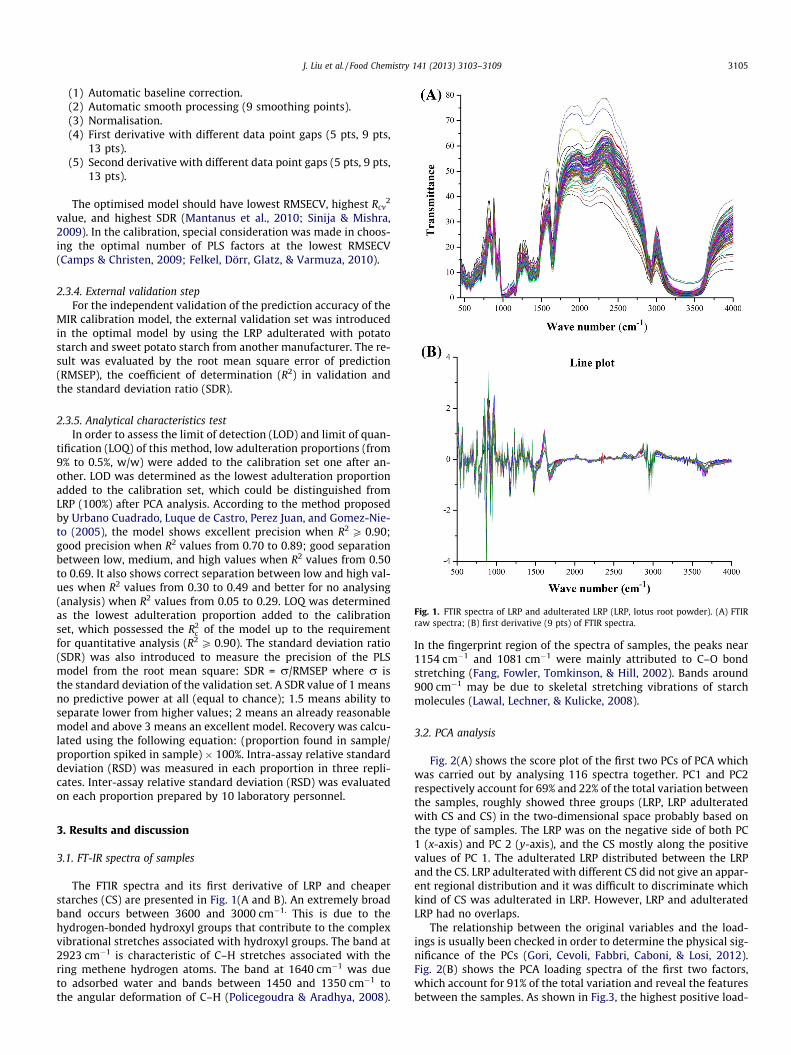
Fig. 1. FTIR spectra of LRP and adulterated LRP (LRP, lotus root powder). (A) FTIRraw spectra; (B) first derivative (9 pts) of FTIR spectra.
J. Liu et al. / Food Chemistry 141 (2013) 3103–3109 3105
(1) Automatic baseline correction.(2) Automatic smooth processing (9 smoothing points).(3) Normalisation.(4) First derivative with different data point gaps (5 pts, 9 pts,
13 pts).(5) Second derivative with different data point gaps (5 pts, 9 pts,
13 pts).
The optimised model should have lowest RMSECV, highest Rcv2
value, and highest SDR (Mantanus et al., 2010; Sinija & Mishra,2009). In the calibration, special consideration was made in choos-ing the optimal number of PLS factors at the lowest RMSECV(Camps & Christen, 2009; Felkel, Dörr, Glatz, & Varmuza, 2010).
2.3.4. External validation stepFor the independent validation of the prediction accuracy of the
MIR calibration model, the external validation set was introducedin the optimal model by using the LRP adulterated with potatostarch and sweet potato starch from another manufacturer. The re-sult was evaluated by the root mean square error of prediction(RMSEP), the coefficient of determination (R2) in validation andthe standard deviation ratio (SDR).
2.3.5. Analytical characteristics testIn order to assess the limit of detection (LOD) and limit of quan-
tification (LOQ) of this method, low adulteration proportions (from9% to 0.5%, w/w) were added to the calibration set one after an-other. LOD was determined as the lowest adulteration proportionadded to the calibration set, which could be distinguished fromLRP (100%) after PCA analysis. According to the method proposedby Urbano Cuadrado, Luque de Castro, Perez Juan, and Gomez-Nie-to (2005), the model shows excellent precision when R2 P 0.90;good precision when R2 values from 0.70 to 0.89; good separationbetween low, medium, and high values when R2 values from 0.50to 0.69. It also shows correct separation between low and high val-ues when R2 values from 0.30 to 0.49 and better for no analysing(analysis) when R2 values from 0.05 to 0.29. LOQ was determinedas the lowest adulteration proportion added to the calibrationset, which possessed the R2
c of the model up to the requirementfor quantitative analysis (R2 P 0.90). The standard deviation ratio(SDR) was also introduced to measure the precision of the PLSmodel from the root mean square: SDR = r/RMSEP where r isthe standard deviation of the validation set. A SDR value of 1 meansno predictive power at all (equal to chance); 1.5 means ability toseparate lower from higher values; 2 means an already reasonablemodel and above 3 means an excellent model. Recovery was calcu-lated using the following equation: (proportion found in sample/proportion spiked in sample) � 100%. Intra-assay relative standarddeviation (RSD) was measured in each proportion in three repli-cates. Inter-assay relative standard deviation (RSD) was evaluatedon each proportion prepared by 10 laboratory personnel.
3. Results and discussion
3.1. FT-IR spectra of samples
The FTIR spectra and its first derivative of LRP and cheaperstarches (CS) are presented in Fig. 1(A and B). An extremely broadband occurs between 3600 and 3000 cm�1. This is due to thehydrogen-bonded hydroxyl groups that contribute to the complexvibrational stretches associated with hydroxyl groups. The band at2923 cm�1 is characteristic of C–H stretches associated with thering methene hydrogen atoms. The band at 1640 cm�1 was dueto adsorbed water and bands between 1450 and 1350 cm�1 tothe angular deformation of C–H (Policegoudra & Aradhya, 2008).
In the fingerprint region of the spectra of samples, the peaks near1154 cm�1 and 1081 cm�1 were mainly attributed to C–O bondstretching (Fang, Fowler, Tomkinson, & Hill, 2002). Bands around900 cm�1 may be due to skeletal stretching vibrations of starchmolecules (Lawal, Lechner, & Kulicke, 2008).
3.2. PCA analysis
Fig. 2(A) shows the score plot of the first two PCs of PCA whichwas carried out by analysing 116 spectra together. PC1 and PC2respectively account for 69% and 22% of the total variation betweenthe samples, roughly showed three groups (LRP, LRP adulteratedwith CS and CS) in the two-dimensional space probably based onthe type of samples. The LRP was on the negative side of both PC1 (x-axis) and PC 2 (y-axis), and the CS mostly along the positivevalues of PC 1. The adulterated LRP distributed between the LRPand the CS. LRP adulterated with different CS did not give an appar-ent regional distribution and it was difficult to discriminate whichkind of CS was adulterated in LRP. However, LRP and adulteratedLRP had no overlaps.
The relationship between the original variables and the load-ings is usually been checked in order to determine the physical sig-nificance of the PCs (Gori, Cevoli, Fabbri, Caboni, & Losi, 2012).Fig. 2(B) shows the PCA loading spectra of the first two factors,which account for 91% of the total variation and reveal the featuresbetween the samples. As shown in Fig.3, the highest positive load-
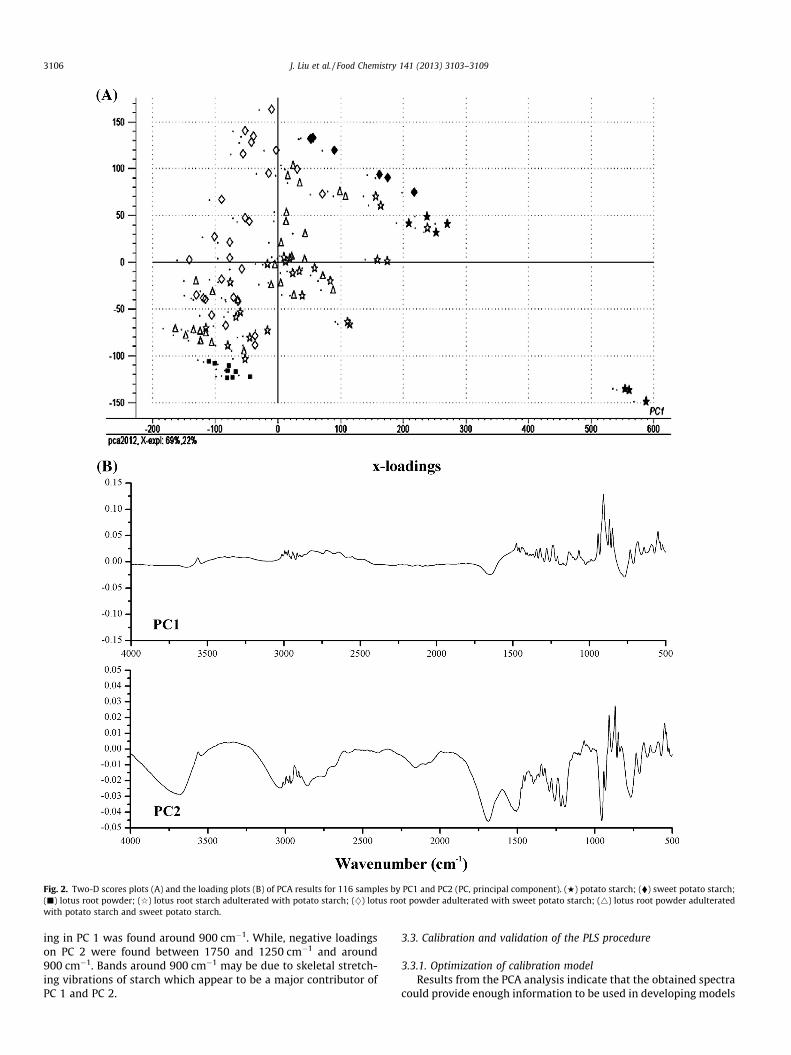
Fig. 2. Two-D scores plots (A) and the loading plots (B) of PCA results for 116 samples by PC1 and PC2 (PC, principal component). (w) potato starch; (�) sweet potato starch;(j) lotus root powder; (q) lotus root starch adulterated with potato starch; (}) lotus root powder adulterated with sweet potato starch; (4) lotus root powder adulteratedwith potato starch and sweet potato starch.
3106 J. Liu et al. / Food Chemistry 141 (2013) 3103–3109
ing in PC 1 was found around 900 cm�1. While, negative loadingson PC 2 were found between 1750 and 1250 cm�1 and around900 cm�1. Bands around 900 cm�1 may be due to skeletal stretch-ing vibrations of starch which appear to be a major contributor ofPC 1 and PC 2.
3.3. Calibration and validation of the PLS procedure
3.3.1. Optimization of calibration modelResults from the PCA analysis indicate that the obtained spectra
could provide enough information to be used in developing models
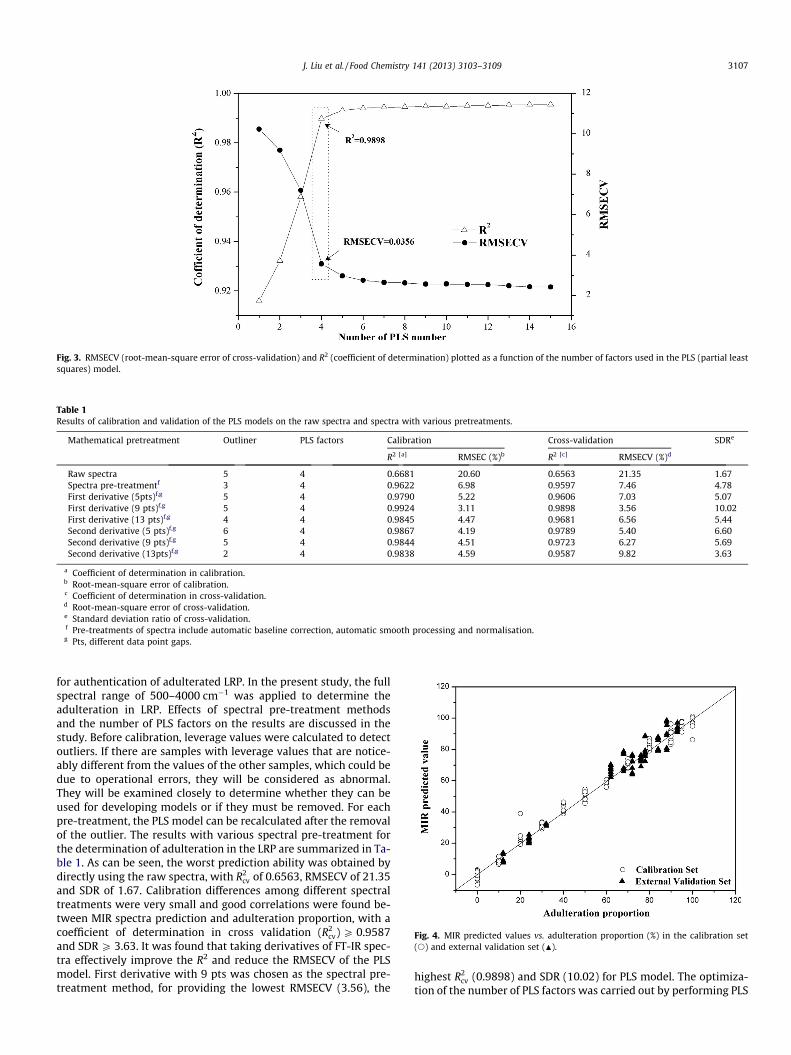
Fig. 3. RMSECV (root-mean-square error of cross-validation) and R2 (coefficient of determination) plotted as a function of the number of factors used in the PLS (partial leastsquares) model.
Table 1Results of calibration and validation of the PLS models on the raw spectra and spectra with various pretreatments.
Mathematical pretreatment Outliner PLS factors Calibration Cross-validation SDRe
R2 [a] RMSEC (%)b R2 [c] RMSECV (%)d
Raw spectra 5 4 0.6681 20.60 0.6563 21.35 1.67Spectra pre-treatmentf 3 4 0.9622 6.98 0.9597 7.46 4.78First derivative (5pts)f,g 5 4 0.9790 5.22 0.9606 7.03 5.07First derivative (9 pts)f,g 5 4 0.9924 3.11 0.9898 3.56 10.02First derivative (13 pts)f,g 4 4 0.9845 4.47 0.9681 6.56 5.44Second derivative (5 pts)f,g 6 4 0.9867 4.19 0.9789 5.40 6.60Second derivative (9 pts)f,g 5 4 0.9844 4.51 0.9723 6.27 5.69Second derivative (13pts)f,g 2 4 0.9838 4.59 0.9587 9.82 3.63
a Coefficient of determination in calibration.b Root-mean-square error of calibration.c Coefficient of determination in cross-validation.d Root-mean-square error of cross-validation.e Standard deviation ratio of cross-validation.f Pre-treatments of spectra include automatic baseline correction, automatic smooth processing and normalisation.g Pts, different data point gaps.
Fig. 4. MIR predicted values vs. adulteration proportion (%) in the calibration set(s) and external validation set (N).
J. Liu et al. / Food Chemistry 141 (2013) 3103–3109 3107
for authentication of adulterated LRP. In the present study, the fullspectral range of 500–4000 cm�1 was applied to determine theadulteration in LRP. Effects of spectral pre-treatment methodsand the number of PLS factors on the results are discussed in thestudy. Before calibration, leverage values were calculated to detectoutliers. If there are samples with leverage values that are notice-ably different from the values of the other samples, which could bedue to operational errors, they will be considered as abnormal.They will be examined closely to determine whether they can beused for developing models or if they must be removed. For eachpre-treatment, the PLS model can be recalculated after the removalof the outlier. The results with various spectral pre-treatment forthe determination of adulteration in the LRP are summarized in Ta-ble 1. As can be seen, the worst prediction ability was obtained bydirectly using the raw spectra, with R2
cv of 0.6563, RMSECV of 21.35and SDR of 1.67. Calibration differences among different spectraltreatments were very small and good correlations were found be-tween MIR spectra prediction and adulteration proportion, with acoefficient of determination in cross validation (R2
cv) P 0.9587and SDR P 3.63. It was found that taking derivatives of FT-IR spec-tra effectively improve the R2 and reduce the RMSECV of the PLSmodel. First derivative with 9 pts was chosen as the spectral pre-treatment method, for providing the lowest RMSECV (3.56), the
highest R2cv (0.9898) and SDR (10.02) for PLS model. The optimiza-
tion of the number of PLS factors was carried out by performing PLS
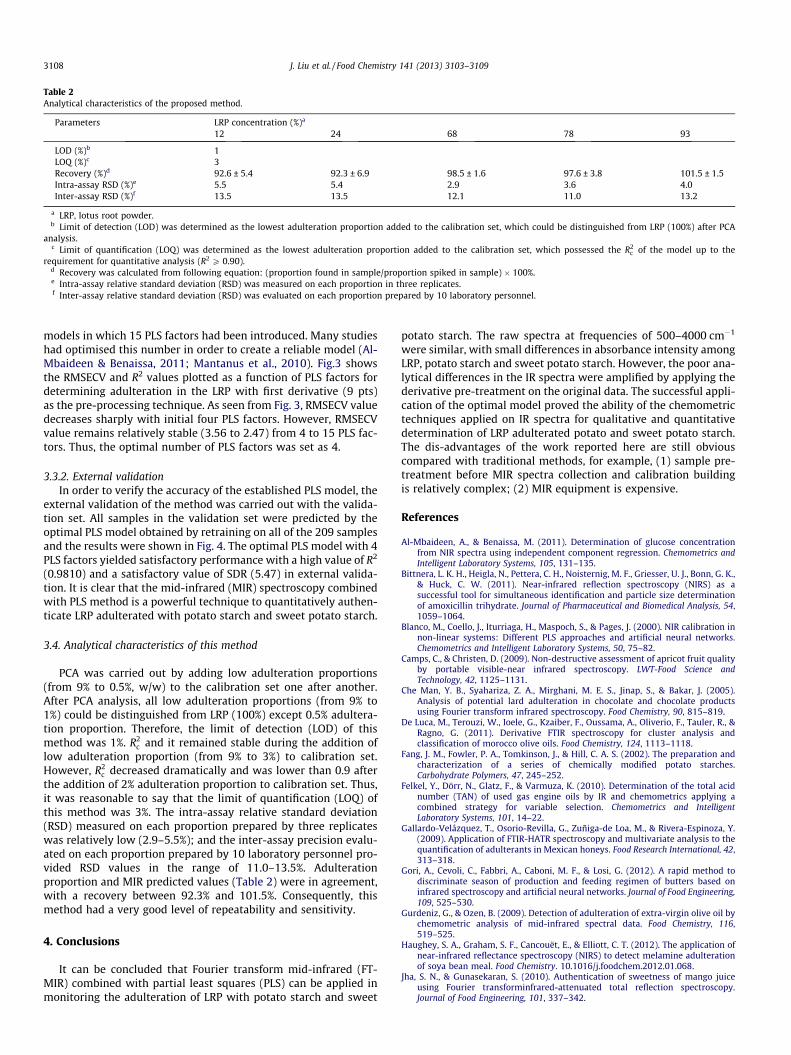
Table 2Analytical characteristics of the proposed method.
Parameters LRP concentration (%)a
12 24 68 78 93
LOD (%)b 1LOQ (%)c 3Recovery (%)d 92.6 ± 5.4 92.3 ± 6.9 98.5 ± 1.6 97.6 ± 3.8 101.5 ± 1.5Intra-assay RSD (%)e 5.5 5.4 2.9 3.6 4.0Inter-assay RSD (%)f 13.5 13.5 12.1 11.0 13.2
a LRP, lotus root powder.b Limit of detection (LOD) was determined as the lowest adulteration proportion added to the calibration set, which could be distinguished from LRP (100%) after PCA
analysis.c Limit of quantification (LOQ) was determined as the lowest adulteration proportion added to the calibration set, which possessed the R2
c of the model up to therequirement for quantitative analysis (R2 P 0.90).
d Recovery was calculated from following equation: (proportion found in sample/proportion spiked in sample) � 100%.e Intra-assay relative standard deviation (RSD) was measured on each proportion in three replicates.f Inter-assay relative standard deviation (RSD) was evaluated on each proportion prepared by 10 laboratory personnel.
3108 J. Liu et al. / Food Chemistry 141 (2013) 3103–3109
models in which 15 PLS factors had been introduced. Many studieshad optimised this number in order to create a reliable model (Al-Mbaideen & Benaissa, 2011; Mantanus et al., 2010). Fig.3 showsthe RMSECV and R2 values plotted as a function of PLS factors fordetermining adulteration in the LRP with first derivative (9 pts)as the pre-processing technique. As seen from Fig. 3, RMSECV valuedecreases sharply with initial four PLS factors. However, RMSECVvalue remains relatively stable (3.56 to 2.47) from 4 to 15 PLS fac-tors. Thus, the optimal number of PLS factors was set as 4.
3.3.2. External validationIn order to verify the accuracy of the established PLS model, the
external validation of the method was carried out with the valida-tion set. All samples in the validation set were predicted by theoptimal PLS model obtained by retraining on all of the 209 samplesand the results were shown in Fig. 4. The optimal PLS model with 4PLS factors yielded satisfactory performance with a high value of R2
(0.9810) and a satisfactory value of SDR (5.47) in external valida-tion. It is clear that the mid-infrared (MIR) spectroscopy combinedwith PLS method is a powerful technique to quantitatively authen-ticate LRP adulterated with potato starch and sweet potato starch.
3.4. Analytical characteristics of this method
PCA was carried out by adding low adulteration proportions(from 9% to 0.5%, w/w) to the calibration set one after another.After PCA analysis, all low adulteration proportions (from 9% to1%) could be distinguished from LRP (100%) except 0.5% adultera-tion proportion. Therefore, the limit of detection (LOD) of thismethod was 1%. R2
c and it remained stable during the addition oflow adulteration proportion (from 9% to 3%) to calibration set.However, R2
c decreased dramatically and was lower than 0.9 afterthe addition of 2% adulteration proportion to calibration set. Thus,it was reasonable to say that the limit of quantification (LOQ) ofthis method was 3%. The intra-assay relative standard deviation(RSD) measured on each proportion prepared by three replicateswas relatively low (2.9–5.5%); and the inter-assay precision evalu-ated on each proportion prepared by 10 laboratory personnel pro-vided RSD values in the range of 11.0–13.5%. Adulterationproportion and MIR predicted values (Table 2) were in agreement,with a recovery between 92.3% and 101.5%. Consequently, thismethod had a very good level of repeatability and sensitivity.
4. Conclusions
It can be concluded that Fourier transform mid-infrared (FT-MIR) combined with partial least squares (PLS) can be applied inmonitoring the adulteration of LRP with potato starch and sweet
potato starch. The raw spectra at frequencies of 500–4000 cm�1
were similar, with small differences in absorbance intensity amongLRP, potato starch and sweet potato starch. However, the poor ana-lytical differences in the IR spectra were amplified by applying thederivative pre-treatment on the original data. The successful appli-cation of the optimal model proved the ability of the chemometrictechniques applied on IR spectra for qualitative and quantitativedetermination of LRP adulterated potato and sweet potato starch.The dis-advantages of the work reported here are still obviouscompared with traditional methods, for example, (1) sample pre-treatment before MIR spectra collection and calibration buildingis relatively complex; (2) MIR equipment is expensive.
References
Al-Mbaideen, A., & Benaissa, M. (2011). Determination of glucose concentrationfrom NIR spectra using independent component regression. Chemometrics andIntelligent Laboratory Systems, 105, 131–135.
Bittnera, L. K. H., Heigla, N., Pettera, C. H., Noisternig, M. F., Griesser, U. J., Bonn, G. K.,& Huck, C. W. (2011). Near-infrared reflection spectroscopy (NIRS) as asuccessful tool for simultaneous identification and particle size determinationof amoxicillin trihydrate. Journal of Pharmaceutical and Biomedical Analysis, 54,1059–1064.
Blanco, M., Coello, J., Iturriaga, H., Maspoch, S., & Pages, J. (2000). NIR calibration innon-linear systems: Different PLS approaches and artificial neural networks.Chemometrics and Intelligent Laboratory Systems, 50, 75–82.
Camps, C., & Christen, D. (2009). Non-destructive assessment of apricot fruit qualityby portable visible-near infrared spectroscopy. LWT-Food Science andTechnology, 42, 1125–1131.
Che Man, Y. B., Syahariza, Z. A., Mirghani, M. E. S., Jinap, S., & Bakar, J. (2005).Analysis of potential lard adulteration in chocolate and chocolate productsusing Fourier transform infrared spectroscopy. Food Chemistry, 90, 815–819.
De Luca, M., Terouzi, W., Ioele, G., Kzaiber, F., Oussama, A., Oliverio, F., Tauler, R., &Ragno, G. (2011). Derivative FTIR spectroscopy for cluster analysis andclassification of morocco olive oils. Food Chemistry, 124, 1113–1118.
Fang, J. M., Fowler, P. A., Tomkinson, J., & Hill, C. A. S. (2002). The preparation andcharacterization of a series of chemically modified potato starches.Carbohydrate Polymers, 47, 245–252.
Felkel, Y., Dörr, N., Glatz, F., & Varmuza, K. (2010). Determination of the total acidnumber (TAN) of used gas engine oils by IR and chemometrics applying acombined strategy for variable selection. Chemometrics and IntelligentLaboratory Systems, 101, 14–22.
Gallardo-Velázquez, T., Osorio-Revilla, G., Zuñiga-de Loa, M., & Rivera-Espinoza, Y.(2009). Application of FTIR-HATR spectroscopy and multivariate analysis to thequantification of adulterants in Mexican honeys. Food Research International, 42,313–318.
Gori, A., Cevoli, C., Fabbri, A., Caboni, M. F., & Losi, G. (2012). A rapid method todiscriminate season of production and feeding regimen of butters based oninfrared spectroscopy and artificial neural networks. Journal of Food Engineering,109, 525–530.
Gurdeniz, G., & Ozen, B. (2009). Detection of adulteration of extra-virgin olive oil bychemometric analysis of mid-infrared spectral data. Food Chemistry, 116,519–525.
Haughey, S. A., Graham, S. F., Cancouët, E., & Elliott, C. T. (2012). The application ofnear-infrared reflectance spectroscopy (NIRS) to detect melamine adulterationof soya bean meal. Food Chemistry. 10.1016/j.foodchem.2012.01.068.
Jha, S. N., & Gunasekaran, S. (2010). Authentication of sweetness of mango juiceusing Fourier transforminfrared-attenuated total reflection spectroscopy.Journal of Food Engineering, 101, 337–342.
J. Liu et al. / Food Chemistry 141 (2013) 3103–3109 3109
Lawal, O. S., Lechner, M. D., & Kulicke, W. M. (2008). Single and multi-stepcarboxymethylation of water yam (Dioscorea alata) starch: Synthesis andcharacterization. International Journal of Biological Macromolecules, 42, 429–435.
Liu, J., Chen, J., Dong, N., Ming, J., & Zhao, G. H. (2012). Determination of degree ofsubstitution of carboxymethyl starch by Fourier transform mid-infraredspectroscopy coupled with partial least squares. Food Chemistry, 132,2224–2230.
Maggio, R. M., Cerretani, L., Chiavaro, E., Kaufman, T. S., & Bendini, A. (2010). A novelchemometric strategy for the estimation of extra virgin olive oil adulterationwith edible oils. Food Control, 21, 890–895.
Man, J., Cai, J., Cai, C., Xu, B., Huai, H., & Wei, C. (2012). Comparison ofphysicochemical properties of starches from seed and rhizome of lotus.Carbohydrate Polymers, 886, 676–683.
Mantanus, J., Ziemons, E., Lebrun, P., Rozet, E., Klinkenberg, R., Streel, B., Evrard, B., &Hubert, P. (2010). Active content determination of non-coated pharmaceuticalpellets by near infrared spectroscopy: Method development, validation andreliability evaluation. Talanta, 80, 1750–1757.
Niu, X. Y., Zhao, Z. L., Jia, K. J., & Li, X. T. (2012). A feasibility study on quantitativeanalysis of glucose and fructose in lotus root powder by FT-NIR spectroscopyand chemometrics. Food Chemistry, 133, 592–597.
Policegoudra, R. S., & Aradhya, S. M. (2008). Structure and biochemical properties ofstarch from an unconventional source—Mango ginger (Curcuma amada Roxb.)rhizome. Food Hydrocolloids, 22, 513–519.
Rohman, A., & Che Man, Y. B. (2010). Fourier transform infrared (FTIR) spectroscopyfor analysis of extra virgin olive oil adulterated with palm oil. Food ResearchInternational, 43, 886–892.
Rohman, A., & Che Man, Y. B. (2011). The use of Fourier transform mid infrared (FT-MIR) spectroscopy for detection and quantification of adulteration in virgincoconut oil. Food Chemistry, 129, 583–588.
Shen, F., Niu, X. Y., Yang, D. T., Ying, Y. B., Li, B. B., Zhu, G. Q., & Wu, J. (2010).Determination of amino acids in Chinese rice wine by Fourier transform near-infrared spectroscopy. Journal of Agriculture and Food Chemistry, 58, 9809–9816.
Sinija, V. R., & Mishra, H. N. (2009). FT-NIR spectroscopy for caffeine estimation ininstant green tea powder and granules. LWT-Food Science and Technology, 42,998–1002.
Syahariza, Z. A., Che Man, Y. B., Selamat, J., & Bakar, J. (2005). Detection of lardadulteration in cake formulation by Fourier transform infrared (FTIR)spectroscopy. Food Chemistry, 92, 365–371.
Szydłowska-Czerniak, A. (2007). MIR spectroscopy and partial least-squaresregression for determination of phospholipids in rapeseed oils at variousstages of technological process. Food Chemistry, 105, 1179–1187.
Tavallaie, R., Talebpour, Z., Azad, J., & Soudi, M. R. (2011). Simultaneousdetermination of pyruvate and acetate levels in xanthan biopolymer byinfrared spectroscopy: effect of spectral pre-processing for solid-stateanalysis. Food Chemistry, 124, 1124–1130.
Urbano Cuadrado, M. U., Luque de Castro, M. D., Perez Juan, P. M., & Gomez-Nieto,M. A. (2005). Comparison and joint use of near infrared spectroscopy andFourier transform mid infrared spectroscopy for the determination of wineparameters. Talanta, 66, 218–224.
Wold, S., Sjostrom, M., & Eriksson, L. (2001). PLS-regression: A basic tool ofchemometrics. Chemometrics and Intelligent Laboratory Systems, 58, 109–130.
Woodcock, T., Downey, G., & O’Donnell, C. P. (2009). Near infrared spectralfingerprinting for confirmation of claimed PDO provenance of honey. FoodChemistry, 114, 742–746.
Zhang, Q., Liu, C., Sun, Z. J., Hu, X. S., Shen, Q., & Wu, J. H. (2012). Authentication ofedible vegetable oils adulterated with used frying oil by Fourier transforminfrared spectroscopy. Food Chemistry, 132, 1607–1613.