Austria's Climate Policy
173
Report of the FORESCENE Workshop „Industry/Economy“ Part 2: Input papers of experts Vienna, 7.2.2007
-
Upload
mathieu-saurat -
Category
Documents
-
view
230 -
download
7
description
Thomas Ruddy: What could the informal economy have to do with investment in environmentally friendly biofuels and the WTO? Jan Rosvall, Nanne Engelbrektsson, Erika Johansson, Pär Meiling: Towards `sustainable conservation´ and use of materials in built environments Sebastian Gallehr: European energy economy and leapfrogging potential
Transcript of Austria's Climate Policy

Report of the
FORESCENE Workshop
„Industry/Economy“
Part 2: Input papers of experts
Vienna, 7.2.2007

FORESCENE Workshop „Industry/Economy“
Contents of Part 2:
Input papers of experts
Input papers were provided by the following experts (in alphabetical order)
Rui Frazao: Resource efficient technologies and eco-design
Sebastian Gallehr: European energy economy and leapfrogging potential
Stefan Giljum, Friedrich Hinterberger: Policy conclusions from the MOSUS project
Rene Kemp: From visions to action through transition management
Angela Köppl: Dynamics of the environmental industry: the case of Austria
Michael Lettenmeier: Resource efficient transport
Oksana Mont: Sustainable consumption perspectives: progress or digress?
Jan Rosvall, Nanne Engelbrektsson, Erika Johansson, Pär Meiling: Towards `sustainable conservation´ and use of materials in built environments
Thomas Ruddy: What could the informal economy have to do with investment in environmentally friendly biofuels and the WTO?
Karin Tschiggerl: ECOPROFIT. A public private partnership model for sustainable development
Arnold Tukker: Life-cycle environmental impacts of consumption in the EU25
Paul Weaver: Sustainability Assessment

Page 1 of 6
WORKSHOP Thematic Field: Industry/Economy Vienna, 23-24 October 2006
Resource efficient technologies and eco-design
Rui Frazão1 Introduction Resource efficient technologies and eco-design have been main areas of research activity at INETI/CENDES since the early nineties. The National Institute of Engineering, Technology and Innovation (INETI) is a research, demonstration and technological development organization, integrated within the Portuguese Ministry of the Economy, whose vocation is to strengthen the potential of innovation and quality in the business community and the national technological system, in order to foster knowledge towards sustainable economic growth. Within INETI, the Centre for Sustainable Business Development (CENDES) have evolved the focus of its R&D activities from environmental impact assessment, environmental management systems and cleaner production/eco-efficiency to areas such as resources’ productivity, life-cycle thinking/eco-design/sustainable product development, product-service systems, and social responsibility and business ethics. CENDES activities are performed having in mind questions like: ‘How do companies contribute to sustainable development?’, and ‘which tools are effective in maximizing this contribution?’ This paper is based on CENDES experience on EU and national projects performed in cooperation with industrial companies. Underlying CENDES activities is the basic idea of sustainable development “not as a fixed state of harmony but rather a process of change in which the exploitation of resources, the direction of investments, the orientation of technological development, and institutional change, are made consistent with future as well as present needs” (WCED, 1987), or in other words as a dynamic process that starts today and continues towards tomorrow, and not as a static phase somewhere in the distant future. Two related keywords are eco-efficiency, in the sense of doing more and better with less (cleaner production, products’ re-design), and eco-innovation, meaning the research of new ways (new products and services, new business models) to fulfill society’s needs and expectations.
1 Researcher at INETI/CENDES Estrada do Paço do Lumiar, 22 1649-038 Lisboa, Portugal [email protected] www.ineti.pt

Page 2 of 6
Cleaner production projects performed in Portuguese industrial companies under programs such as PML Portugal (1994-1996), PROSSET (1997-1999) and INOVE (2003-2004), produced results in line with related literature, which can be summarized as:
• 10-20% reduction on waste materials; • Reduction/substitution of toxic materials; • Better health and safety practices; • 10% reduction of energy consumption; and • Economic savings.
Main results are related to good housekeeping measures, some measures are related with manufacturing processes’ changes, but one can say that, in general, this kind of approach shows little potential to change the production system once the same products are produced in a somehow better or more efficient way (Duarte et al. 2005; CEISET/INETI 2005; SECIL/INETI 2005). Eco-design projects showed a higher potential for more significant improvements due to the overlook at the product life-cycle. However, often company goals are not in line with life-cycle major problems due to several different reasons. For instance, the life-cycle assessment of pressure cookers show that the major problem is energy consumption during use, the main goal for the company being to design an 100% recyclable pressure cooker (CRUZINOX/INETI 2006). This case shows an example where a market driven goal is chosen considering that consumers will give more importance to a recyclable product than to an energy-efficient one. More significant improvements are scheduled to the future. In another example, eco-design projects of concrete products showed that the major problem is related to the cement life-cycle. In both cases, concrete pipes and concrete roof tiles, measures to reduce the amount of cement in the concrete manufacturing were implemented (reductions of 10 to 20% were feasible). However, eco-innovation measures like the development of a product-service system to provide transportation of fluids instead of selling concrete pipes, or the development of roof tiles with incorporated solar films, were considered to pose too many risks and postponed to the future (SECIL/INETI 2005). Again, opportunities to pursue leap-frog improvements are seen as not needed at short term. Life-cycle oriented projects involving the need to dialogue with the main stakeholders show an even higher potential for improvement. The work performed under SUSPRONET project showed that product-service systems, in particular result-oriented services, have a real factor X potential, especially in the cases where new ways to fulfill needs are put into the market (for example, selling a dry in-house environment instead of a roof). Furthermore, the potential depends on a focused effort to design the system to be as sustainable as possible, preferably stimulated by the right framework conditions (Tucker and Tischner 2006). This leads us once more to the question of what goals are expected to be achieved by society. CENDES experience seems to show that resource efficient technologies and eco-design (including the development of product-service systems) provide opportunities for companies to improve and contribute to sustainable development. However, they do not constitute driving forces for innovation per se. There is the need of a convenient framework that provides guidance for companies on what goals and targets society expects to achieve in the near future. This framework can be built by European and national/regional/local sustainable development strategies setting clear goals and targets per need area, strictly linked with business voluntary initiatives under corporate social responsibility to contribute to those goals and targets.
Page 3 of 6
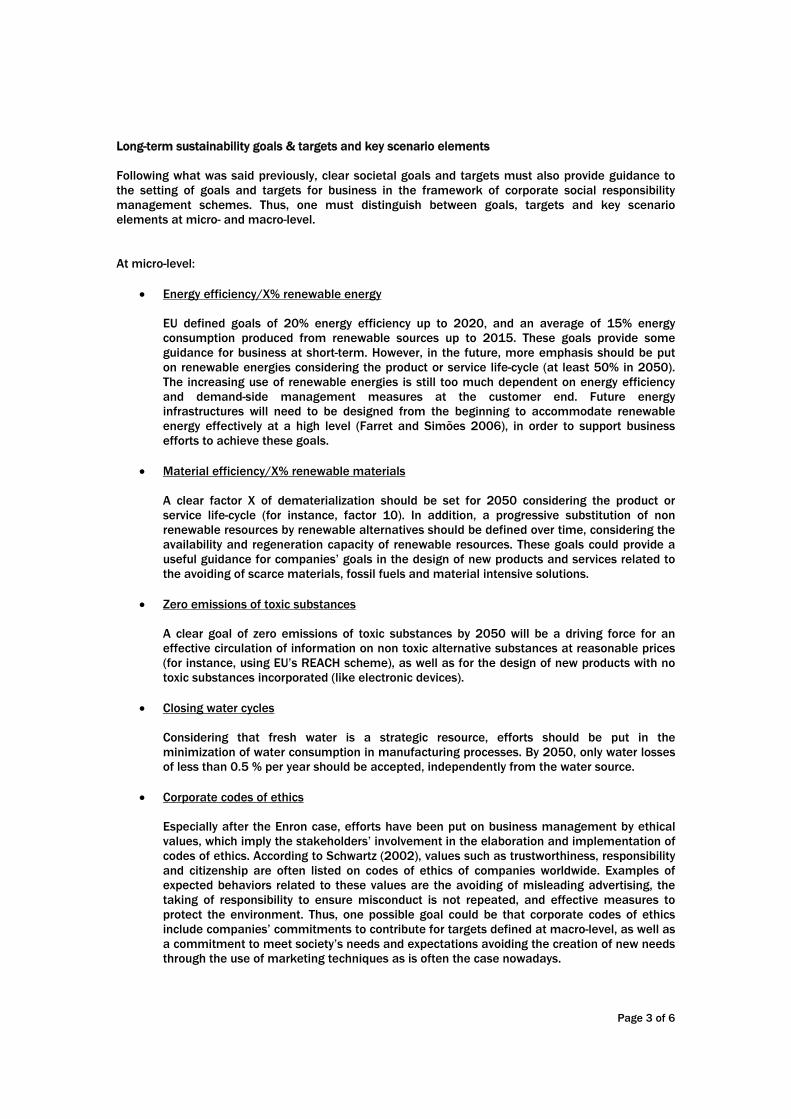
Long-term sustainability goals & targets and key scenario elements Following what was said previously, clear societal goals and targets must also provide guidance to the setting of goals and targets for business in the framework of corporate social responsibility management schemes. Thus, one must distinguish between goals, targets and key scenario elements at micro- and macro-level. At micro-level:
• Energy efficiency/X% renewable energy EU defined goals of 20% energy efficiency up to 2020, and an average of 15% energy consumption produced from renewable sources up to 2015. These goals provide some guidance for business at short-term. However, in the future, more emphasis should be put on renewable energies considering the product or service life-cycle (at least 50% in 2050). The increasing use of renewable energies is still too much dependent on energy efficiency and demand-side management measures at the customer end. Future energy infrastructures will need to be designed from the beginning to accommodate renewable energy effectively at a high level (Farret and Simões 2006), in order to support business efforts to achieve these goals.
• Material efficiency/X% renewable materials A clear factor X of dematerialization should be set for 2050 considering the product or service life-cycle (for instance, factor 10). In addition, a progressive substitution of non renewable resources by renewable alternatives should be defined over time, considering the availability and regeneration capacity of renewable resources. These goals could provide a useful guidance for companies’ goals in the design of new products and services related to the avoiding of scarce materials, fossil fuels and material intensive solutions.
• Zero emissions of toxic substances A clear goal of zero emissions of toxic substances by 2050 will be a driving force for an effective circulation of information on non toxic alternative substances at reasonable prices (for instance, using EU’s REACH scheme), as well as for the design of new products with no toxic substances incorporated (like electronic devices).
• Closing water cycles Considering that fresh water is a strategic resource, efforts should be put in the minimization of water consumption in manufacturing processes. By 2050, only water losses of less than 0.5 % per year should be accepted, independently from the water source.
• Corporate codes of ethics Especially after the Enron case, efforts have been put on business management by ethical values, which imply the stakeholders’ involvement in the elaboration and implementation of codes of ethics. According to Schwartz (2002), values such as trustworthiness, responsibility and citizenship are often listed on codes of ethics of companies worldwide. Examples of expected behaviors related to these values are the avoiding of misleading advertising, the taking of responsibility to ensure misconduct is not repeated, and effective measures to protect the environment. Thus, one possible goal could be that corporate codes of ethics include companies’ commitments to contribute for targets defined at macro-level, as well as a commitment to meet society’s needs and expectations avoiding the creation of new needs through the use of marketing techniques as is often the case nowadays.

Page 4 of 6
At macro-level:
• Quantified decoupling targets per need area The approach for the setting of decoupling targets should be per need area and not per sector like it is today. Clear targets should be defined for the consumption of material, energy and water and the emission of selected outputs (like CO2 or hazard waste), for mobility, housing/shelter, food, health, clothing, communication, education, safety, entertainment and leisure, for example, instead of transportation, construction, textiles, chemicals, agriculture or other sectors. This new approach has more potential to flood the market with new solutions oriented to fulfill the needs of consumers, thus leading to the uprising of new business models. The question of how fast do we need to change must also be addressed in a clear way by governments and international organizations.
• Targets for progressive substitution of non renewable resources by renewable ones In order to change the unsustainable patterns of production and consumption, it is clear that non renewable resources must be substituted by renewable ones. However, the market is often not aware of existing alternatives at reasonable prices because, among other reasons, stock markets today are flooded with information only on non renewable resources. Clear goals for this progressive substitution must be defined over time at global level in order to influence the global market, involving organizations such as UN, OECD and WTO. This dimension should be added to concerns linked to the discussion of alternative ways of globalization.
• Free toxic regions Following the model of the setting of nuclear free regions, an effort could be put in the definition of a model for free toxic regions, to be applied in areas committed to consume only products and services which life-cycle is totally free of toxic substances and hazardous waste. In addition, WTO regulations should be modified accordingly to allow these initiatives to influence the global market.
• Targets for sustainable management of water resources In order to prevent wars, a special effort needs to be made in the management of specific resources. The lack of fresh water is considered by many authors in the political field as a potential cause for wars in many regions of the world. Considering that safety is a necessary condition for sustainable development, a special effort must be put in a more effective sustainable management of water resources worldwide.

Page 5 of 6
Key policy instruments and measures Key possible policy) instruments and measures deemed promising to reach the identified sustainability goals are as follows:
• Lisbon strategy/EU strategy for sustainable development Lisbon strategy and the EU strategy for sustainable developed must be merged at short-term, because they do not make sense separated and the resulting document will constitute a stronger signal to the market. Also, the sustainable consumption and production action plan for EU expected to be proposed by the European Commission in 2007 under the Marrakesh Process should be integrated in this new European framework for sustainable development.
• Voluntary initiatives in the framework of social responsibility ISO (2006) defines social responsibility as “the actions of an organization to take responsibility for the impacts of its activities on society and the environment, where these actions:
− are consistent with the interests of society and sustainable development; − are based on ethical behavior, compliance with applicable law and
intergovernmental instruments; and − are integrated into the ongoing activities of the organization.”
The new standard ISO 26000, for social responsibility of organizations, is expected to be published in 2008. In the EU, sustainability goals and targets can provide guidance to the actions that organizations will perform under this framework once these actions must be integrated in the core business of organizations and be consistent with future as well as present society’s needs and expectations.
• Sustainable public procurement As major consumers EU and Member-States governmental organizations must play an exemplar role, through the implementation of sustainable public procurement practices. These practices will constitute a strong signal to the market as a commitment to meet the goals and targets defined in the EU strategy for sustainable development.
• Training and education Sustainable development themes seem to be part of post-graduation courses in universities all over Europe. However, they must become part of education curricula at all levels and in all courses. Otherwise they will continue to have an appearance of marginal themes and not of mainstream themes as they should be. This task is not easy as schools and universities seem to be still resistant to the adoption of multidisciplinary building of knowledge schemes like the ones that are needed to deal with sustainability challenges in an effective way. Long-life training courses are one trend under the Bologna process. Existing training tools for sustainable development must be widely provided to schools and universities to be more and more used in this framework as well.

Page 6 of 6
Bibliography CEISET/INETI (2005). INOVE – A sustentabilidade como motor da (eco) inovação nas empresas. CEISET, Setúbal;
INETI, Lisboa. CRUZINOX/INETI (2006). ECO-ERGO – Eco-design de uma panela de pressão. Relatório técnico. CRUZINOX,
Carregosa; INETI, Lisboa. DUARTE, A.P. et al. (2005). Sustainable Production Programme in Setúbal Region (PROSSET)—final results.
Journal of Cleaner Production, Volume 13, Issue 4, 363-372. EU (2006). European Union Sustainable Development Strategy. Council of the European Union, Brussels,
10917/06. FARRET, F.A; SIMÕES, M.G. (2006). Integration of Alternative Sources of Energy. John Wiley & Sons, Hoboken,
NJ. ISO (2006) An important landmark in the road towards ISO 26000. ISO Working Group on Social Responsibility
Newsletter, Issue #5, September 2006. SECIL/INETI (2005). Integrar progressivamente a sustentabilidade na gestão estratégica do Grupo Secil.
Relatórios técnicos. SECIL, Setúbal; INETI, Lisboa. SCHWARTZ, M.S. (2002). A Code of Ethics for Corporate Code of Ethics. Journal of Business Ethics, 41: 27-43. TUKKER, A; TISCHNER, U. (eds.) (2006). New Business for Old Europe. Product-Service Development,
Competitiveness and Sustainability. Greenleaf Publishing, Sheffield. WCED (1987). Our Common Future. World Commission on Environment and Development, United Nations, New
York.
SERI workshop industry economy energy input paper by Sebastian Gallehr, e5 1/11
European Energy Economy and leapfrogging potential
Sebastian Gallehr, November 2006
e5-European Business Council for Sustainable Energy
Summary Even if the path to a sustainable energy economy in Europe seems to be very ambitious, we could be also economically successful, if we begin walking soon. So let’s just do it. Let’s agree a common strategy together with the business sector, the researchers, policy makers and civil society.
In the area of climate change, which is the major limiting factor for the future energy strategy, the recently published Stern review1 leaded by the former Chief Economist and Senior Vice-President of the World Bank Sir Nicholas Stern, comes in the summary to a simple conclusion:
“the benefits of strong, early action considerably outweigh the costs.”
Furthermore the stern report states “Tackling climate change is the pro-growth strategy for the longer term, and it can be done in a way that does not cap the aspirations for growth of rich or poor countries. The earlier effective action is taken, the less costly it will be.”
Long Term Targets:
The main long term targets in the energy sector for 2050 are fixed: Secure access to power and heating for private and industrial use for a feasible price by not overshooting global warming by more than 2°C.
Recent situation, status quo
In the recent situation the energy sector is mainly driven by a centralised fossil fuel based supply chain. The recent economic structure in the EU25 is a oligopoly with a handful of well financed and strongly influential private and public companies.
On the other hand the European sustainable energy technologies and solutions are well established in the global markets. Small and medium sized enterprises are as well on this market as big global corporates like Siemens or Alstom.
Transition path
1 “Stern Review on the Economics of Climate Change”, published October 30th, 2006, http://www.hm-treasury.gov.uk/independent_reviews/stern_review_economics_climate_change/sternreview_index.cfm

SERI workshop industry economy energy input paper by Sebastian Gallehr, e5 2/11
If we take into account the FORSCENE constraints that solutions are not allowed which are shifting problems regionally and in time options are limited, nuclear power and clean coal technologies with carbon capturing and storage (CCS), the main bearer of hope technologies for the business as usual representatives, can not be taken into account and we have to concentrate on Renewable energy and energy efficiency options.
Policies and measures
To be efficient in the transition path, first of all we have to harmonize existing policies and measures and we have to set ambitions mandatory targets for Europe.
Main barriers
Poilitical barriers: How to overcome the strong influence of business as usual companies?
Economical barriers: The money is already there, but how to shift financing from centralized to diversified/decentralized investments?
Technological barriers: How to create an innovation environment for smart solutions?
Introduction of the energy sector and the main challenges to meet urgent sustainability requirements Europe’s energy supply system faces its next generation of power plants. Due to the long life span of energy production facilities, the investment in power plants will shape the structure of Europe´s energy industry in the next 30 - 50 years. Between 1995 and 2020, the EU will have to substitute up to 300 GW of power plant capacity.. Economic growth will increase the hunger for new energy capacities. It is estimated that the EU requires up to 300 GW new power plant capacities between 1995 and 2020. The strategies Europe will follow will strongly influence the future European energy economy. They can enable or considerably complicate the challenge of a sustainable energy future. The EU Council has confirmed that the global annual mean surface temperature increase should not exceed 2°C above pre-industrial levels. For many climate experts this implicates that the industrialised countries are obliged to reduce their greenhouse gas emission up to 80%. But for example with a new generation of fossil power plants installations it is not clear how we can fit this target.
The traditional style of energy discussion is a heritage of the 80is and have limited horizon. Although the conflict between Russia and Ukraine has showed the need for all-European perspective, the Member States continue to follow the national imperatives of energy politics. In a liberalised market shareholders have not necessary an interest for strategical reflections on a future energy system for the upcoming five decades. Also the traditional political debate is limited: on the one side are representatives of a “business-as-usual”-approach, decorating the future energy system of coal, gas and nuclear power with a renewable energy “add-on”, on the other side the dreamer of a solar age, praising a totally solar driven, cross sectoral energy supply structure in the near future. The aim has to be to identify a third way that bridges the business as usual scenario with the dream of a solar age. In Januar 2006 The European Business Council together with the European Commission has established a project to bridge these borders. The discussion process of the conference series has been leaded by a mandatory development target for the future energy structure in five decades.
SERI workshop industry economy energy input paper by Sebastian Gallehr, e5 3/11
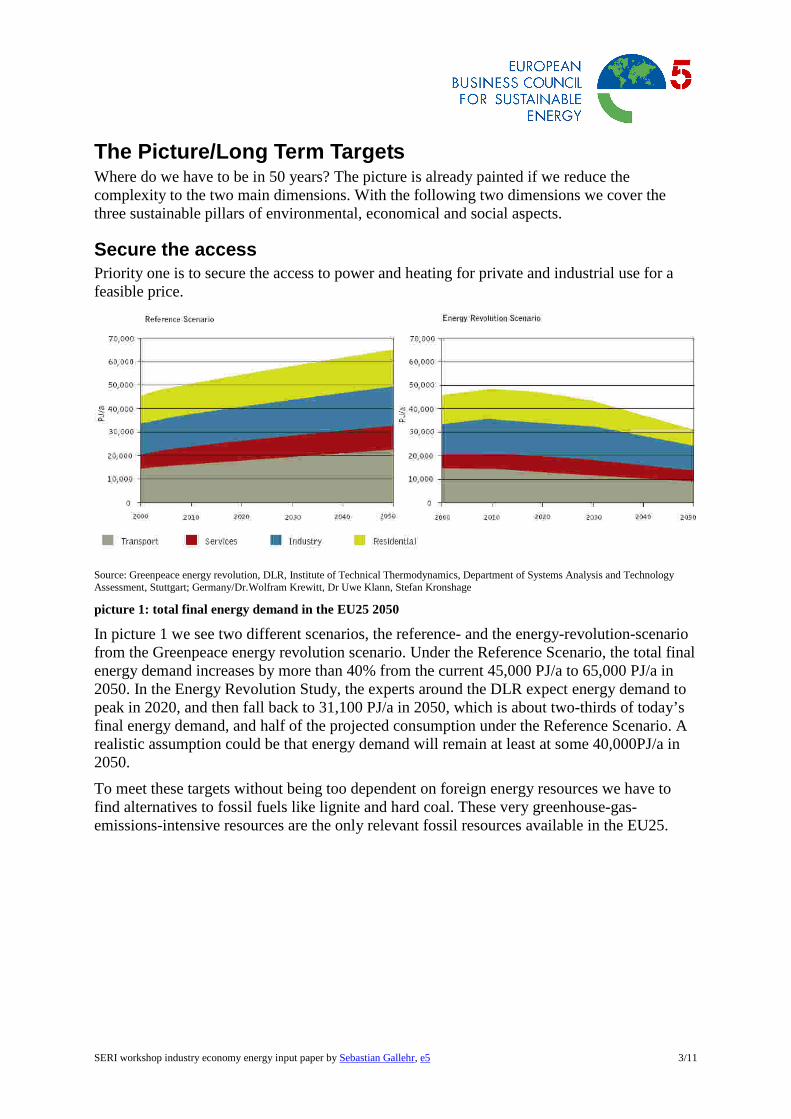
The Picture/Long Term Targets Where do we have to be in 50 years? The picture is already painted if we reduce the complexity to the two main dimensions. With the following two dimensions we cover the three sustainable pillars of environmental, economical and social aspects.
Secure the access Priority one is to secure the access to power and heating for private and industrial use for a feasible price.
Source: Greenpeace energy revolution, DLR, Institute of Technical Thermodynamics, Department of Systems Analysis and Technology Assessment, Stuttgart; Germany/Dr.Wolfram Krewitt, Dr Uwe Klann, Stefan Kronshage
picture 1: total final energy demand in the EU25 2050
In picture 1 we see two different scenarios, the reference- and the energy-revolution-scenario from the Greenpeace energy revolution scenario. Under the Reference Scenario, the total final energy demand increases by more than 40% from the current 45,000 PJ/a to 65,000 PJ/a in 2050. In the Energy Revolution Study, the experts around the DLR expect energy demand to peak in 2020, and then fall back to 31,100 PJ/a in 2050, which is about two-thirds of today’s final energy demand, and half of the projected consumption under the Reference Scenario. A realistic assumption could be that energy demand will remain at least at some 40,000PJ/a in 2050.
To meet these targets without being too dependent on foreign energy resources we have to find alternatives to fossil fuels like lignite and hard coal. These very greenhouse-gas-emissions-intensive resources are the only relevant fossil resources available in the EU25.

SERI workshop industry economy energy input paper by Sebastian Gallehr, e5 4/11
Source: green paper of energy: EU Commission Directorate-General for Energy and Transport, June 2006
picture 2: Dependency of foreign fossil sources in EU25
picture 2 shows the dependence of foreign fossil fuels for the scenarios published in the EU Greenpaper2 from March 2006. Especially the dependence on global oil resources but also the dependence on natural gas resources are showing the political and economical vulnerability of the energy future in the next 20 years. In total EU25 will increase its dependency from some 45% to nearly 70% if we will not change our energy infrastructure dramatically in the direction of a Renewable energy and energy efficiency economy.
Don’t exceed 2°C As second dimension we have to take into account dangerous climate change. The main environmental limitation will result out of the climate change issue. In the recently published Stern review3 leaded by the former Chief Economist and Senior Vice-President of the World Bank Sir Nicholas Stern we can read “The scientific evidence points to increasing risks of serious, irreversible impacts from climate change associated with business-as-usual (BAU) paths for emissions.”
2 GREEN PAPER A European Strategy for Sustainable, Competitive and Secure Energy {SEC(2006) 317} http://ec.europa.eu/energy/green-paper-energy/doc/2006_03_08_gp_document_en.pdf 3 “Stern Review on the Economics of Climate Change”, published October 30th, 2006, http://www.hm-treasury.gov.uk/independent_reviews/stern_review_economics_climate_change/sternreview_index.cfm
SERI workshop industry economy energy input paper by Sebastian Gallehr, e5 5/11
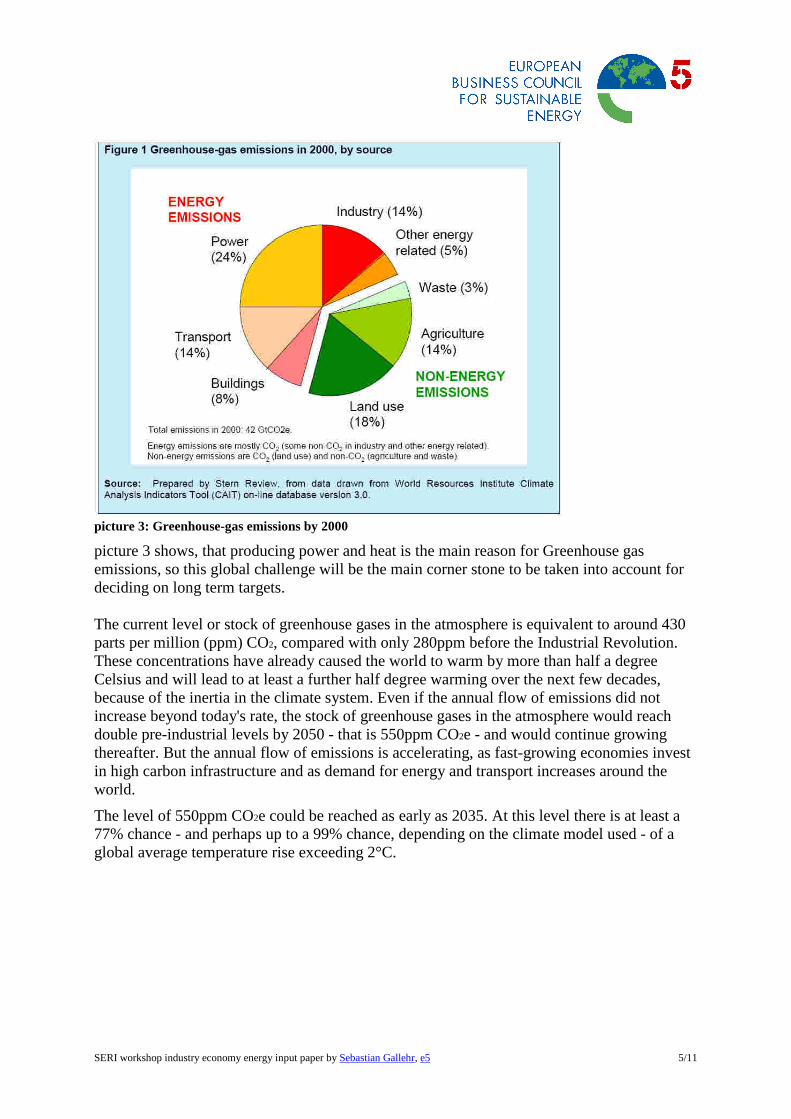
picture 3: Greenhouse-gas emissions by 2000
picture 3 shows, that producing power and heat is the main reason for Greenhouse gas emissions, so this global challenge will be the main corner stone to be taken into account for deciding on long term targets. The current level or stock of greenhouse gases in the atmosphere is equivalent to around 430 parts per million (ppm) CO2, compared with only 280ppm before the Industrial Revolution. These concentrations have already caused the world to warm by more than half a degree Celsius and will lead to at least a further half degree warming over the next few decades, because of the inertia in the climate system. Even if the annual flow of emissions did not increase beyond today's rate, the stock of greenhouse gases in the atmosphere would reach double pre-industrial levels by 2050 - that is 550ppm CO2e - and would continue growing thereafter. But the annual flow of emissions is accelerating, as fast-growing economies invest in high carbon infrastructure and as demand for energy and transport increases around the world.
The level of 550ppm CO2e could be reached as early as 2035. At this level there is at least a 77% chance - and perhaps up to a 99% chance, depending on the climate model used - of a global average temperature rise exceeding 2°C.

SERI workshop industry economy energy input paper by Sebastian Gallehr, e5 6/11
Source: Stern Review. October 2006
picture 4: Stabilisation levels and probability ranges for temperature increases
picture 4 illustrates the types of impacts that could be experienced as the world comes into equilibrium with more greenhouse gases. The top panel shows the range of temperatures projected at stabilisation levels between 400ppm and 750ppm CO2e at equilibrium. The solid horizontal lines indicate the 5 - 95% range based on climate sensitivity estimates from the IPCC 20014 and a recent Hadley Centre ensemble study5. The vertical line indicates the mean 4 Wigley, T.M.L. and S.C.B. Raper (2001): 'Interpretation of high projections for global-mean warming', Science 293:451-454 based on Intergovernmental Panel on Climate Change (2001): 'Climate change 2001: the scientific basis. Contribution of Working Group I to the Third Assessment Report of the Intergovernmental Panel on Climate Change' [Houghton JT, Ding Y, Griggs DJ, et al. (eds.)], Cambridge: Cambridge University Press.
5 Murphy, J.M., D.M.H. Sexton D.N. Barnett et al. (2004): 'Quantification of modelling uncertainties in a large ensemble of climate change simulations', Nature 430: 768 - 772

SERI workshop industry economy energy input paper by Sebastian Gallehr, e5 7/11
of the 50th percentile point. The dashed lines show the 5 - 95% range based on eleven recent studies6. The bottom panel illustrates the range of impacts expected at different levels of warming. The relationship between global average temperature changes and regional climate changes is very uncertain, especially with regard to changes in precipitation. This picture shows potential changes based on current scientific literature.
Status Quo Recent situation, status quo
In the recent situation the energy sector is mainly driven by a centralised fossil fuel based supply chain. The recent economic structure in the EU25 is a oligopoly with a handful of well financed and strongly influential private and public companies.
On the other hand the European sustainable energy technologies and solutions are well established in the global markets. Small and medium sized enterprises are as well on this market as big global corporates like Siemens or Alstom.
The global energy development is following the European solutions and technologies, so Europe has got the potential to lead the pathway to a sustainable energy future by fostering their export driven economy. The recent situation shows, that for Europe the change to a sustainable energy infrastructure could be done with an economical surplus even if there are high investments in the near future.
But investments have to be done anyway in a large scale in the next 20 years due to technological obsolescence of the European energy infrastructure. As example picture 5 shows the demand of investment for Germany for a business as usual supply scenario.
Source: Dr. Hans-Joachim Ziesing, DIW 2005
picture 5: German reduction of power plants due to technological obsolescence
6 Meinshausen, M. (2006): 'What does a 2°C target mean for greenhouse gas concentrations? A brief analysis based on multi-gas emission pathways and several climate sensitivity uncertainty estimates', Avoiding dangerous climate change, in H.J. Schellnhuber et al. (eds.), Cambridge: Cambridge University Press, pp.265 - 280.
109105
100
79
63
48
114
0
20
40
60
80
100
120
2000 2005 2010 2015 2020 2025 2030
Gig
awat
t
Sonstige
Biomasse
Wind
Wasser
Erdgas
Öl
Braunkohle
Steinkohle
Kernenergie
"VerzögerterErsatz"
26
33
54
79
99

SERI workshop industry economy energy input paper by Sebastian Gallehr, e5 8/11
Transition path
Technical Not only the long term target has to be set in a very ambitious way but also the transition path will be very ambitious if we want to meet the defined targets.
Especially if we take into account the FORSCENE constraints that solutions are not allowed which are shifting problems regionally and in time options are limited. Because of this, nuclear power and Clean coal technologies with carbon capturing and storage (CCS), the main bearer of hope technologies for the business as usual representatives, can not be taken into account.
Source: Otmar. Edenhaofer PIK/ECF 2005
picture 6: secondary energy production path to not overshoot 2°C global warming (with CCS and nuclear power)
picture 6 shows one scenario for an energy production scenario path to not overshoot 2°C global warming. There we can see, that even when we use CCS technologies and nuclear power, the renewable energy contingent has to increase up to 60% in the year 2100. Without CCS and nuclear we have to establish an intelligent technological energy infrastructure which allows us to increase the use of Renewable energy by more than 50% until 2050. Furthermore we have to work on the energy efficiency option not only in the way of saving energy on the demand side and being more efficient on the supply side but also in terms of smart energy production and use. Therefore we have to research the options of electronic communication between transmission grids, demand- and supply side and the options of integrated virtual power plants.
Policies and measures To be efficient in the transition path, first of all we have to harmonize existing policies and measures and we have to set ambitions mandatory targets for Europe.
A similar priority has to be the re-allocation of available research funding to the renewable energy, energy efficiency and integrated IT-based supply and demand side management sectors.

SERI workshop industry economy energy input paper by Sebastian Gallehr, e5 9/11
Because of the fact, that we will need a huge amount of technological and economical innovations we have to enhance the innovation potential of Europe. In this field small and medium enterprises (SME) will play a key role. In other business sectors which are highly dependant of innovations like the pharma industry, SME have special incubating and accelerating environments to work on their ideas and technologies. Similar environments have to be established with a direct link to investment capital
Society and economy To meet this ambitious challenge participation and acceptance of the society and the business sector is crucial. Only if we can convince the society to buy and use energy efficient products and only if we can show business that sustainable business models will be more lucrative than business as usual strategies we have the chance to leapfrog into the sustainable energy future.
Recent barriers
Technical barriers In generals all technologies to meet the energy demand in a sustainable climate and environmental friendly way are available. Even the cost structure of these technologies could be competitive, if we put our effort in the right direction.
Source: Stern Review. October 2006
picture 7: The costs of technologies are likely to fall over time
Historical experience of both fossil-fuel and low-carbon technologies shows that as scale increases as shown in picture 7, costs tend to fall. Economists have fitted ‘learning curves’ to costs data to estimate the size of this effect. An illustrative curve is shown in picture 7 for a new electricity-generation technology; the technology is initially much more expensive than the established alternative, but as its scale increases, the costs fall, and beyond Point A it becomes cheaper. Work by the International Energy Agency and others shows that such relationships hold for a range of different energy technologies. A number of factors explain this, including the effects of learning and economies of scale.
But the relationship is more complex than the figure suggests. Step-change improvements in a technology might accelerate progress, while constraints such as the availability of land or materials could result in increasing marginal costs.

SERI workshop industry economy energy input paper by Sebastian Gallehr, e5 10/11
Besides the lack of innovation potential to accelerate existing technology in a way that energy security is given in Europe the main technological barrier is the existing structural framework: DLR Study “Ökologisch optimierter Ausbau erneuerbarer Energien in Deutschland„ summarizes:
„stronger than the potential limits of renewable energy, the structural framework of the supply- and the demand side in the energy sector will be the limitation factor in terms of velocity and degree of realization „Stärker als die Potenziale der EE und ihre Begrenzungen bestimmen strukturelle Randbedingungen der Energieversorgung und der Verbrauchssektoren ihren die erreichbare Ausbaugeschwindigkeit und den Ausbaugrad“
To accept these structural barriers we have to overcome the recent base- mid- and peak-load or demand following supply side thinking as the main priority. Furthermore we have to turn around the common efficiency thinking. Most efficient and the cheapest has to be the use of renewable resources like renewable energy and energy efficiency (Nega-Watt) options.

SERI workshop industry economy energy input paper by Sebastian Gallehr, e5 11/11
Economical barriers The main economical barrier are the recent allocation rules of investment.
Source: Otmar. Edenhaofer PIK/ECF 2005
picture 8: comparison of investment shares BAU/450ppm stab. scenario (with CCS and nuclear power)
In picture 8 we can see that if in a time frame up to 2100 the investment shares will be re-allocated in the Renewable energy sector in comparison to the business as usual scenario not only the needed percentage of GDP will remain the same (some 2% of GDP) but also the seed investment will be on the same level (in both cases some 3,5% of GDP).
But this will only happen, if we start investing very soon in the right direction. But current investment decisions in the energy sector are following the rules of the former centralized energy century. It is much easier to get 500 million Euro for a centralized fossil fuel fired power plant than to get the same amount for a future orientated decentralized energy production or small units of Renewable energy power plants even with the foreseeable risk of stranded investment.
This results mainly out of the oligopoly corporate structure in the energy economy. Established utilities have built up their economical and political power structure very successful. Needed investment capital for the business as usual scenario is already on the accounts of the major European utilities like e.on, RWE and EDF and is waiting to be invested in centralised power plants. Only if we can convince the decision makers of the energy sector, that business will be better on a sustainable path, we will overcome this barrier.
Political barriers Resulting out of the first big energy challenge of the second half of the last century –bulding up an energy infrastructure that guarantees access to electricity and fuels for every citizen in Europe- the political influence of the existing players in the energy sector is very strong. But the existing energy sector has until now no convincing incentive to switch to a sustainable energy path.

1
Policy conclusions from the MOSUS project
Stefan Giljum, Friedrich Hinterberger
Sustainable Europe Research Institute (SERI), Vienna, Austria
Vienna, 21.9.2006

2
1. The MOSUS project: research questions and policy measures
Given the current range of processes related to sustainable development on the Member
State and EU level, the MOSUS project fell into a time of dynamic changes in and revisions
of European economic, environmental, sustainable development and energy and transport
policies. With its main objective to quantitatively assess the impacts of key environmental
policy measures on natural resource use (materials, energy, land use) on the one hand and
economic (and social) indicators on the other hand, the MOSUS project directly connected
with a number of core issues of the current policy agenda.
In light of the revisions of both the Lisbon Strategy and the EU SDS and the need for further
harmonisation of the two, most important policy questions to be answered by MOSUS are:
• To what extent can environmental policy measures oriented towards higher resource
and energy efficiency support the Lisbon goals of growth, competitiveness and
employment?
• Can win-win situation be identified, where a set of policy measures improves both the
environmental and the economic situation?
• Which (mix of) policy measures are best suited to reduce environmental pressures
with regard to energy and emissions, materials and land use?
• Are there trade-offs between the different environmental categories or are policy
measures reducing pressures across all three categories at the same time?
• What are the impacts of the implementation of environmental policy measures for
other world regions?
In Work Package 1 of the MOSUS project, trends for the baseline scenario and policy
measures for the two sustainability scenarios were identified for six separate policy fields:
socio-economic driving forces, technological change, resource use, land use management,
consumer behaviour and unemployment/social exclusion. Based on these scenario
components, story lines for the three scenarios were developed and synthesised in a matrix
of policy measures for the different issues, which were regarded as highly important by the
consortium members (see document on integrated scenarios for details).
From this matrix, the consortium selected six (groups of) policy measures, which could be
implemented in the model simulations. All these measures aim at increasing material and
energy efficiency (see Table 1).

3
Table 1: The six policy measures implemented in the low and high sustainability scenarios LOW HIGH
(1) Technical Change Assumptions taken from CISEP report
for selected sectors
(2) Higher Transport Costs +5% until 2020 +10% until 2020
Based on LSE report
(3) (a) Higher levels of material recycling 0.1% per year 0.3% per year
(b) Higher efficiency of non-metallic
minerals 0.2% per year 0.4% per year
(4) Higher material productivity in sectors 1-14
(Aachen scenario) 10% 20%
(5) (a) Higher R&D of Firms Subsidised with 1% of public consumption between
2006 and 2010
(b) Technical Progress Total factor productivity (excl. labour productivity)
increases by 0.15% per year
(6) Emission trading Target: Kyoto Target: IPCC
(a) Change of Consumption Structures Based on WIFO model
(b) Higher CO2 prices in 2020 40 €/t 120 €/t
(c) Higher Share of Biofuels in 2020 (exog.) 8-10% 15-20%
The selection of policy measures was restricted to those variables, which could be
exogenously changed in the GINFORS model. A number of key sustainability policies from
the initial matrix could therefore not be considered in the model simulations. These comprise
the following issues:
• Regional and cohesion funds: changes in the distribution of these substantial EU
budgets, subject to strategic environmental assessment and plans
• Common agricultural policy: further shift of subsidies from production levels towards
support for organic production and landscape maintenance.
• Trade policy: integration of social and environmental standards in trade agreements;
certification schemes to foster sustainable exploitation of agricultural and forestry land
and water resources in non-EU countries; special treatment for developing countries
in the WTO
• Fiscal policy & subsidies: tax reductions for renewable energies & fuels; kerosene
tax; support for recycling activities and for development of new eco-efficient
technologies and materials
• Land use management: policy measures to support nature/landscape conservation
and multi-functional landscapes and to limit urban sprawl and to promote sustainable
transport; local organic agriculture supply schemes; national support schemes to
preserve cultural heritage; promotion of non-economic forest use (tourism, protective
function, GHG sink)

4
2. Scenario results from a policy perspective
A number of important guidelines for identification of SD policies can be extracted from the
results of the MOSUS scenarios. Thus, in this section, the main results of the simulations
shall be summarised from a policy perspective.
Triple-win situations → implement the high sustainability scenario!
The scenario simulations revealed that the implementation of the above described packages
of sustainability policy measures leads to improvements of indicators in all three
sustainability dimensions.
Economic performance of the EU-25 increases, with GDP per capita in 2020 being around
4% higher in the high sustainability scenario in comparison to the baseline scenario.
Improved competitiveness of European industries increase goods exports in many Member
States, while imports show a marked decline. Government consumption and investment
declines, leading to a reduction of average share of government expenditure in GDP, while
private investment grows in the sustainability scenarios. At the same time, the environmental performance of Europe improves dramatically. CO2
emissions decrease sharply in absolute terms and both scenarios meet the EU Kyoto targets
by 2010. Growth in Total Primary Energy Supply (TPES) can be reduced by 10% in the high
scenarios compared to the baseline; however, absolute levels in 2020 are higher than in
2005 in all three scenarios. The share of renewables in TPES strongly rises to 11% in 2020.
Domestic material extraction shows an absolute reduction by around 3% in the low and 7%
in the high scenario.
Finally, unemployment in the old Member States slightly rises until 2010 and then decreases
towards the 2005 levels in 2020, with the high scenario leading to the most positive results.
Based on these findings, it can be concluded that the implementation of policies primarily
geared towards decoupling economic activity from material and energy throughput can
actually be conducive to economic growth, contrary to the popular assumption that such
policies will mainly raise costs for enterprises, decrease competitiveness and thus have an
opportunity cost in terms of reduced economic performance. MOSUS scenario results
support the view expressed in several documents by DG Environment and other institutions
(for example, European Commission, 2005a) that increasing resource and energy
productivity can actually improve the position of European industries on world markets and
thus also lead to the creation of new jobs. From this perspective, environmental policy
becomes one of the key strategies to reach the Lisbon goals. Thus, the main policy

5
recommendation to European policy makers is to implement the policy measures indicated in
the high sustainability scenario.
Considering the fact that economic growth is higher in the sustainability scenarios than in the
baseline scenario, a potential remains to implement environmental policies with even more
restrictive character and to reach more ambitious environmental targets (such as a an
absolute reduction of Total Primary Energy Supply and further reduction of domestic material
extraction) without harming economic performance compared to a baseline scenario.
Policy measures largely differ in effects
The different policy measures implemented in the two sustainability scenarios largely differ in
their effects on economic and environmental variables.
The positive economic effects mainly stem from the implementation of the so called “Aachen
scenario”, in which Member State governments introduce an information and consulting
programme to increase material efficiency in the manufacturing sector. This measure
stimulates growth through productivity gains that drive prices down and increase profit
margins. With the exception of positive returns to public R&D investment in some Member
States, the Aachen scenario is the only component of the low and high scenarios to increase
output. This growth is largely attributable to (i) increases in net exports, which are indicative
of the improvement of international competitiveness of the EU manufacturing sector, and (ii)
increases in household consumption. At the same time, however, this remarkable increase in
output deteriorates the environmental performance, as rebound effects overcompensate for
efficiency gains (see below).
The most positive environmental effects can be observed through the implementation of the
very restrictive carbon tax, which has a weak negative effect on real GDP and employment,
but strongly reduces environmental pressures with regard to CO2 emissions, energy
consumption and material extraction through a sharp increase in fossil fuel prices. Decreases
in material extraction result from the slowing down of economic growth and consequently the
economic variables, which determine material extraction.
All other measures have significantly less effect on overall results.
Materials-energy-emissions: no environmental trade-offs
Except from the Aachen scenario, all policy measures show positive environmental effects
on the cost of economic growth. Policy package 3 (higher resource efficiency of non-metallic
minerals and higher recycling of metals) is the only one, which is only effective in the
category of material extraction, but has no feedback to the economy and the energy system

6
of the model.1 All other measures reduce at the same time levels of material extraction,
energy supply and CO2 emissions, thus highlighting that there is no trade-off between
increases of material and energy efficiency.
Economic sectors: winners and losers
The environmental policy measures implemented in the two sustainability scenarios also
show very diverse effects on the development of different economic sectors. Sectors
associated with the domestic extraction and supply or production of materials and energy
(i.e. mining and quarrying, electricity, gas and water supply, oil refining) or material- and
energy-intensive production (e.g. iron and steel making) have to ‘take pain’ in the low and
high sustainability scenarios in terms of output and investment. On the other hand, the
increase in productivity and competitiveness brought about by the Aachen Scenario lets the
manufacturing sector actually increase its overall share in total gross value added in the high
scenario, overcompensating the shrinking of primary sectors.
Regional disparities: old vs. new member countries
Considerable regional disparities in the effects of the low and high scenarios can be
observed. In comparison to the baseline, the basket of policies introduced is more beneficial
to growth in the ‘old’ EU-15 than in the new Member States. However, absolute growth
remains higher in the new Member States, so the scenario is not significantly detrimental to
the convergence of EU-25 wealth (although absolute differences remain large, with ACC-10
income being less than one fourth of average EU-15 income in 2020). The positive impacts
on growth of the low and high scenarios in the new member countries is in large part a
reflection of impacts in the Czech Republic and Hungary. In these two countries, the Aachen
scenario could be simulated, as detailed input-output tables on the sectoral level were
available. Where this part of the policy basket had to be left out, the scenarios either have a
small positive or a small negative effect (e.g. in Poland). This highlights the importance of the
implementation of programmes to increase resource productivity as a growth stimulating
strategy.
Rebound effects
Considering this growth stimulating effect of policies targeted at increasing resource
productivity, the scenario simulations also revealed that these policies must be accompanied
1 This is due to the fact that the material models are not fully integrated with the economic (and
energy) system, but only receive information on economic variables, which determine the level of
material extraction.

7
by other measures, if ambitious environmental improvements should be achieved.2 In the
MOSUS scenarios, the carbon tax had the most upward pressing impact on prices. The first
order effect of a significant rise in the price for fossil fuels entailed significant second order
effects in the whole economic system, as higher fuel prices have an impact on production
costs in many branches, in particular in material and energy intensive primary sectors. These
second order effects not only reduced fossil fuel consumption, but also had a negative effect
on output growth and thus indirectly also on material extraction.
In general, it can be concluded that programmes of resource productivity increases on the
micro level do not guarantee reduction of material and energy use on the macro level, as
savings in material productivity are overcompensated by growth in production volumes due
to rebound effects. Balanced achievement of economic and environmental targets thus
demand for an additional correction of resource prices, in the form of a carbon tax, a material
input tax or other fiscal measures (see also chapter 6).
Unresolved problem areas
Although the overall results from the two sustainability scenarios are promising in terms of
positive effects for the economy as well as the environment, some important unresolved
problem areas remain, which have to be tackled by additional policies:
Sustainable production and consumption patterns
Although the implementation of the basket of policy measures resulted in a significant
improvement of the environmental performance of the European Union (in particular, with
regard to achievement of the Kyoto targets), results remained still insufficient with regard to
material and energy consumption. The transformation of the European economy towards
environmentally sustainable production and consumption patterns requires absolute
reductions in energy supply and consumption as well as higher absolute dematerialisation
than achieved through the implemented policies. This received particular urgency in light of
the ascent of the newly industrialising economies in the South (such as China, India and
Brazil), which rapidly increase their per capita levels of material and energy consumption,
thus putting rapidly growing additional pressures on the global ecosystems.
International externalisation of environmental burden
2 However, in some countries of the model system, in general small economies such as
Austria, Denmark, Finland and Greece, the Aachen scenario alone lead to both increases in growth
and improvements in the environmental indicators of material extraction, energy use and CO2
emissions.
8
Faster dematerialisation of the European economy also becomes essential, as in the model
only data for domestic extraction were available, but no physical data on imports to Europe
from other world regions could directly be included. Considering rising resource-intensive
imports in monetary terms until 2020 (see the environmental evaluation report), it can be
assumed that the overall reduction in material consumption of Europe is much less
pronounced. Further environmental policies thus must take into account Europe’s global
environmental responsibility and should be targeted at reducing negative environmental
impacts along the whole life-cycle of a product (including ecological rucksacks in other world
regions induced by European consumption).
Transport
The energy consumption of the transport sector increases significantly in all three scenarios,
thus expanding its share in total energy consumption from around 11% in 2005 to around
19% in 2020 and contributing notably to the overall growth in Total Primary Energy Supply
(TPES). Even in the high sustainability scenario, road traffic is expected to increase by 29%
between 2005 and 2020, air transport by more than 170%. As the EEA (2005) points out, de-
coupling between GDP and transport has been marginal in the past years. With regard to
passenger transport, people tend to spend a constant share of disposable income on
transport, with a shift towards more frequent and faster (air) travels. Growth in freight
transport has mainly been caused by further liberalisation of the internal market, leading to
relocation of production processes with additional transport demand. Therefore, additional
policies are required, which are specifically targeted at reducing transport demand and
supporting a shift towards more environmentally benign transport modes (see also chapter 6
below).
Unemployment
Rising unemployment is one of the core social problems in the European Union. The
scenarios of the MOSUS project revealed that the mix of (mostly) environmental policy
measures is not suitable to significantly reduce the level of unemployment.
The sustainability scenarios accelerate structural changes in the economy, which is likely to
increase the frictions in labour markets, for example by lowering the ability to match vacant
positions and unemployed people. If so, the sustainability scenarios could lead to a reduction
in wages and an increase in involuntary unemployment. Reduced wages spread to the
consumption levels also to the non working parts of the population, thereby enhancing the
risk of social exclusion. Since the sustainability scenarios do not perform better or worse than
the baseline scenario when the effect of a higher rate of structural change was not taken into
account, the effect of the sustainability scenarios on social exclusion is therefore likely to be

9
negative. However, a lower tax rate may mitigate the increase in unemployment and still
contribute to an increase in governmental expenditures. The governments may then use a
higher share of their income to support people at risk of social exclusion.
Thus, the lessons that can be read out of the past seem to be appropriate also for the future.
The question of avoiding social exclusion is, first and foremost, a political question; additional
policies are needed to attract more people into employment and modernise social protection
systems, while increasing the flexibility of labour markets and invest more in human capital
through better education and skills, as laid out in the Commissions Plan to stimulate the
Lisbon process (European Commission, 2005e).
3. Specifications of scenario measures
Several scenario measures within the two sustainability scenario packages have been
implemented without clear definition of policy instruments, which would lead to the assumed
consequences (see Table 1 above). This holds in particular true for the following scenario
components:
1. Higher de-coupling of extraction of construction minerals from economic growth
2. Higher recycling rates of metals
3. Higher share of biofuels
Therefore, in this section, links to ongoing policy initiatives on the EU level shall be
established, which could support the achievement of these scenario components.
De-coupling of extraction of construction minerals from economic growth
Resource consumption in the construction sector is vital to society’s total resource
consumption. Therefore, future developments in the construction sector will have wide-
ranging implications for total amounts of primary extraction of materials. Construction also
generates large amounts of waste.
The EU Commission recently adopted its Urban Thematic Strategy (European Commission,
2005d), where sustainable construction methods and techniques are one of the key issues.
One of the central objectives of the strategy is to integrate sustainability principles into the
practice of design, construction, maintenance and management of buildings. As the interim
document for the Strategy stated, the use of more sustainable construction materials could
have a considerable positive impact on the environment, while having direct cost reduction
implications for the end user as well as positive consequences for the health of the
inhabitants. However, more sustainable construction has an extra value, which markets
currently in general are not willing to pay for. Thus, policy intervention is needed in order to
redirect the construction sector towards increasing resource and energy productivity. While

10
the final version of the Strategy is missing any concrete suggestions for policy instruments,
this interim report states that both top-down policy measures as well as bottom-up market
initiatives are to be considered.
Suggested policy instruments include:
• Standards for sustainable construction to be fulfilled by all publicly funded
construction projects
• Funds and subsidies to support new resource-extensive solutions and the
development of new eco-efficient and renewable building materials (for example,
within the European Framework Programmes for research and technology
development)
• Public procurement to set an example in terms of more sustainable construction
• Taxes and other regulatory mechanisms at the EU, national and regional levels to
help motivate actors in the construction industry to achieve these goals (see also
below)
• Urban planning instruments to make sustainability standards a condition for
construction permits.
Several EU Member Countries (Sweden, Denmark and the UK) have recently started to
implement taxes on aggregates, such as sand and gravel. As demand for construction
minerals is rather price inelastic, at least in the short term, introduction of these taxes had a
greater fiscal effect than an environmental effect so far (Söderholm, 2004). However, in the
longer-term, investment activities should be negatively affected by such taxes on the rent in
the sense that marginal projects become uneconomical, in particular when the tax level is
continuously rising.
If the EU aims to achieve higher material and energy efficiency in the construction sector, the
above descried mix of standards and regulatory instruments, taxes and subsidies as well as
extended planning instruments have to be implemented.
Higher recycling rates of metals
In the past few years, world metal markets saw a steep rise in prices for all metals, in
particular caused to rapidly growing demand from emerging economies, in particular China.
As prices are expected to remain high, although more stable (AIECE, 2005), recycled metals
will increase their competitiveness in the future.
There exists also a range of policy options that could further enhance metal recycling. These
include (see Joint Study Group, 2003):
• Pursuing flexible approaches to formulating recycling policy that balance regulatory
measures with market based incentives appropriate to local conditions,

11
• Encourage the creation of collection and recycling infrastructure through the provision
of financial and technical assistance,
• Facilitate the sharing of experience on aspects such as materials flow management
and recycling policies,
• Facilitate trade in international recyclable materials through addressing trade
distorting policies that affect the flow of recyclables.
Higher share of biofuels
One of the main energy policy targets of the EU is to double the share of the Renewable
Energy Sources (RES) in gross inland consumption, from 5.4 % in 1997 up to 12.0% by
2010. These targets are in line with the assumptions of the high sustainability scenario in
MOSUS. Various legislative actions have been undertaken in order to facilitate this target,
the most important of which are:
• to promote the renewable electricity generation by increasing the production from 14
% in 1997 up to 21% by 2010 for EU 25 corresponded to 22.1% for EU 15 (Directive
2001/77/EC).
• to promote the biofuels for transport applications by replacing diesel and petrol up to
5.75% by 2010 (Directive 2003/30 EC) with the accompanying detaxation of biofuels
(modification of the taxation of energy products and electricity directive 2003/96/EC)
The Communication on “The share of renewable energy in the EU” (European Commission,
2004a) concluded that further efforts - in particular in the biomass sector - are needed in
order to achieve the above policy objectives. On the Member State level, policy measures
include feed-in tariffs, green certificates, market-based mechanisms and tax exemptions. On
the Community level, measures include support for energy crops within the Common
Agricultural Policy, facilitate financing of green energy projects through the European
Investment Bank, foster research on the European level (6th and 7th Framework Programme
on Research and Technology Development) and bridging the gap between successful
demonstration of innovative technologies and their effective entrance on the market to
achieve mass deployment. The EU will have to strengthen the implementation on both the
Member State and the EU level of the policy initiatives listed in its various proposals for
renewable energy strategies, if the set targets should be achieved.
4. Additional policy measures to improve results
In the different scenario components elaborated in Work Package 1 of the MOSUS project, a
large number of policy initiatives and instruments were listed as a basis for the definition of
the low and the high sustainability scenario. As mentioned above, only a small number of
instruments could actually be considered in the modelling exercises, mainly due to limitations

12
in transforming qualitative information in quantitative variables for the model and in available
data.
Therefore, the aim of this sub chapter is to revisit these scenario documents and summarise
those policy measures, which are crucial for improving the environmental situation in the
European Union as well as for supporting the broader transformation towards a more
sustainable society in Europe (and beyond). Here, these policy measures will be grouped in
separate (sectoral) policy fields, while the next sub chapter will emphasise the need to
integrate policies for the implementation of a coherent set of measures.
Energy
High energy consumption in Europe is one main driver for environmental problems in
Europe, contributing significantly to air pollution, waste generation, change of landscapes,
etc. In contrary to the trends in CO2 emissions, total primary energy supply is expected to
increase in both sustainability scenarios. More efforts are therefore required to reverse this
trend. As the instruments of fossil energy/CO2 taxes as well as support for renewable
energies are already included in the scenarios, other key aspects in energy policies must
come to the fore. A general shift of supply side policies in favour of demand side policies,
combined with the shaping of energy-saving consumption models is needed.
One key aspect are efforts to increase energy efficiency, which the EU pursues as one of its
environmental top priorities. Major driving forces behind this objective are energy security,
energy cost savings, increasing competitiveness, climate policy and job creation. To these
ends, the EU has taken many initiatives in different areas. Some are already implemented by
Member State, but most are in the status of the process of implementation and of discussion
at the Council. Hence, there is not one single energy efficiency communication or initiative or
directive, but it is rather an interlinked and multi-step-approach.
These policy programmes and directives include, among others:
• Green Paper on energy efficiency
• Framework programme "Intelligent Energy for Europe"
• Promotion of end-use efficiency & energy services
• Energy performance of buildings
• Efficiency in energy using products
• Eco-design for energy-using appliances
A number of key policy measures to support the increase of energy efficiency is mentioned in
these documents. Achievement of targets will greatly depend on the extent to which these

13
instruments are implemented both on the Member State and the Union level. We would
recommend to focus on the following measures:
• Public sector procurement: third-party financing contracts and energy performance
contracts; purchasing of low-energy products and vehicles
• Energy services: establishment of energy services as an integral part of the
distribution and/or sale of energy to clients
• Financial instruments: repealment or amendment of legislative provisions and
national regulations which hamper or restrict the use of financial instruments and
contracts for making energy savings on the energy services market
• Energy audit schemes: development of high-quality energy auditing systems aimed at
determining which measures can be taken to improve energy efficiency and which
energy services it must be possible to provide, and to prepare for their
implementation
• Transparency for end-users: ensuring that end-users are provided with competitively
priced individual metering and informative billing that reflect their actual energy
consumption
Full implementation of the Environmental Technology Action Plan (ETAP) (European
Commission, 2005b) along with the development of renewable energies as described above
could also be a key factor to ensure basic energy supply in rural areas and small towns,
oriented at small-scale energy supply systems, which are based on local or regional supply
sources and energy raw materials.
Transport
Considering the current unsustainable development trends in the transport sector (see also
above), the major transport policy objectives have to be:
1. significant decoupling of transport growth from GDP growth in order to reduce
congestion and other negative side-effects of transport, in particular through reducing
transport needs and
2. bringing about a shift in transport use from road to rail, to water (however,
environmentally risky especially in the river valleys covered by Natura 2000) and to
public passenger transport.
A number of key policy measures and instruments are mentioned in the EU White Paper on
future transport policy (European Commission, 2001b). The most important instruments are:
• Introducing a framework for transport charges (“road pricing”) to ensure that prices for
different modes of transport, including air, reflect their costs to society.
• Harmonisation of fuel taxation for commercial users, in particular in road transport.
14
• Give priority to infrastructure investment for public transport and for railways, inland
waterways, short sea shipping and intermodal operations.
• Improve transport systems by addressing missing transport links, developing open
markets and co-operation at EU level (e.g. railway liberalisation, air traffic systems).
• Building the trans-European network, with focus on removing bottle-necks in the
railway network and in the road network in frontier regions to accession countries.
Reorientation of EU transport policy towards sustainability objectives requires the
implementation of these instruments, in particular road pricing together with higher and
harmonised taxation of fossil fuels. This could realise the repeatedly claimed aim of fully
reflecting the costs of transportation activities to society and will significantly increase costs
of both passenger and freight transport. As a consequence, this could reduce private
demand for car and air transport and increase demand for alternative modes of freight
transport. Together with a strong public support for investments in infrastructure for public
transport and for railways and inland waterways, a shift in the overall structure of the
transportation system could thereby be achieved. Furthermore, growth in the service sectors
and high value added manufacturing activities in the EU economy could contribute to the
overall reduction of transport activities, as these sectors are less freight intensive than the
more traditional basic manufacturing and extraction activities. It is in the core of a new policy
for urban areas to foster the building of more compact cities.
Agriculture and forestry
Agriculture in the countries of the European Union is strongly determined by the principles
and support schemes of the Common Agricultural Policy (CAP), on which nearly half the
EU’s annual budget is allocated. The main goals of future EU agricultural policy from a
sustainability perspective are:
• Promotion of multifunctional landscapes, both for forestry and agriculture, with
farmers and foresters increasingly viewed as countryside managers, guaranteeing
preservation of landscapes for their nature conservation, aesthetic and cultural
values.
• Promotion of production of energy crops to support EU efforts for reduction of fossil
fuel dependency and consumption and foster rural job creation.
• Extensification of production systems, both in agriculture and breeding, in order to
reduce pressures on the natural environment and to ensure the efficient functioning of
life-sustaining natural systems and the preservation of biodiversity at all the four
levels: genetic, species, ecosystem and landscape.

15
• Increased quality of food products and the expansion of the share of organic products
in total production.
Achievement of these goals will require further reform of the CAP, with a focus on subsidies
to be transferred from agricultural production to environmental objectives (agro-, forest-,
water- environmental schemes) aiming at maintaining a diverse agricultural structure
(including energy crops) and supporting a shift towards aspects of food safety and landscape
maintenance.
Reductions of direct payments for bigger farms are foreseen through the mechanism of
“modulation”. It refers to the transfer of funds from farming subsidies to agri-environment and
other development schemes and is applied to farmers with annual subsidies over
5000 EURO. However envisaged reductions are relatively small and individual big farms with
large land ownerships will still receive substantial amounts of transfers. Further reductions to
these individual large farms are recommended to gain acceptance of the general public for
sustained levels of support for the agricultural sector.
Furthermore, stimulating organic agriculture will require active support through promotion
and information campaigns, ensuring traceability and organic food authenticity,
harmonisation of control procedures and accreditation and funding of research in organic
farming.
For Central and Eastern European countries, the developments towards extensification of
production systems and organic agriculture could imply that today’s relatively energy and
material-extensive production forms will be maintained, transforming the agricultural sector
towards sustainability without going through the phase of highly industrial agriculture with
high material and energy inputs.
In contrast to agricultural policies, which are primarily decided on the EU level, current forest
policies and its institutions are mostly developed and applied on a national level. The overall
objective from a sustainability point of view is towards a multifunctional management in which
nature conservation plays an equally large role as wood production. A promotion of
certification schemes, which certify that forest have been managed in a sustainable way, are
considered to enhance marketing opportunities from producing and selling an
environmentally friendly product.
The increasing relevance of international trade includes growing volumes of agricultural and
forestry commodity flows. In this way Europe’s land use is influenced indirectly by potential
external land resource uses to satisfy domestic consumption demand. Today trade volumes
in the EU25 are significant amounting to more than 40% of total agricultural and forestry
production3 and have increased over the past two decades with annual increase rates of
3 This figure includes both trade between EU25 countries and with third countries.
16
nearly 3 percent. Currently two thirds of the EU25 territory, some 260 million ha, are in use to
produce agricultural and forestry products. At the same time some 105 million hectares of
land are estimated to be used outside the EU25 territory to produce commodities for imports
into the EU25. Traded volumes are expected to grow further in the future. This calls for a
whole range of certification schemes and fair trade arrangements to avoid potential
externalization of harmful environmental impacts.
Industry
Sustainable industrial production will require higher de-coupling of material and energy use
as well as of the generation of waste and emissions from economic output than achieved in
the two MOSUS sustainability scenarios. Energy efficiency initiatives, such as described
above, along with higher taxes on fossil fuels will be one cornerstone of more sustainable
industry policies and set incentives to increased substitution of bio-resources for non-
renewable raw materials in production chains. Another key issue is the development of new
technologies, such as micro technologies, new process technologies and new high-tech
materials, which have the potential to significantly reduce the amount of raw materials
needed for manufacturing purposes. In particular EU research policy is demanded to devote
sufficient resources to these areas of technological development in the upcoming 7th
Framework Programme.
Another EU initiative playing a key role for industry is “Integrated Product Policy (IPP)”
(European Commission, 2001c), which marks an important new stage in the development of
new environmental policy approaches in the EU and is regarded as an integral part of EU’s
efforts towards a more sustainable development. IPP addresses resource use and
environmental impacts in an integrated way, taking into account all phases of a product’s life-
cycle (from the ‘cradle to the grave’), as well as the roles of the different actors involved in it.
The primary aim of IPP is to reduce the environmental impacts from products throughout
their life cycle, harnessing, where possible, a market driven approach, within which
competitiveness concerns are integrated. Although the potential of the IPP life-cycle
approach for increasing energy and resource efficiency of products is undoubted, the EU is
demanded to realise these potentials through an effective implementation of IPP-related
policy measures.
Public procurement
Public procurement, accounting to over € 1,000 billion annually or about 14% of EU’s GDP
(Gervais, 2002) is an often neglected instrument to reduce energy and material use. Such a
large sector could play a leading role to boost innovation and development and encourage
the offer/demand for environmentally friendly products and services, including eco-efficient

17
products with low energy and material input per service unit. However, EU public
procurement legislation guaranteeing fair access for suppliers sets limits on governments for
attaching environmental conditions to their purchasing contracts. Furthermore, even within
the limited scope to benefit the environment, any such criteria, at this stage, must provide
benefits to the contracting authority rather than to the wider community.
On the other hand, by stipulating precise green requirements in the contract specification,
authorities “could take into account the ‘environmental soundness’ of products or services,
for example, the consumption of natural resources, by ‘translating’ this environmental
objective into specific, product-related and economically measurable criteria by requiring a
rate of energy consumption” (European Commission, 2001a). For the assessment of the
most economically advantageous tender, the life-time costs of a product to be born by the
contracting authority may be considered. To promote the case of higher energy and resource
efficiency in public procurement, the legal framework allowing for governments to favour eco-
efficient products and services should be utilised to its full potential.
Households – Sustainable Consumption
As demanded in Agenda 21 the developed countries - and thus the EU at the regional level -
have to show leadership in changing unsustainable consumption and production patterns. To
reach this goal is not only a question of scientific or technical improvement; it is foremost a
question which values drive societal development and of political will to make the necessary
changes. This means developing a wider vision of welfare, where satisfaction of needs,
rather than consumption per se, is the aim.
Current government policy presumes that increasing levels of economic consumption are a
pre-requisite for improving the quality of life. Research does not support this presumption.
The relationship between material commodities and social well-being is much more complex
than conventional policy suggests. A shift in government policy would be justified to place
more emphasis on other contributors to quality of life, such as health, community
engagement and meaningful work. Individual choices are constrained by a variety of social,
institutional, and cultural factors. Consumers often find themselves ‘locked in’ to
unsustainable consumption. Government plays a vital role in shaping the cultural context
within which individual choice is negotiated through its influence on technology,
infrastructure, market design, institutional structures, the media, and the moral framing of
social goods (Jackson and Michaelis, 2003).
An effective government strategy for sustainable consumption will need to be developed on a
collaborative basis with stakeholders. It will incorporate a wide range of measures, many of
which have already been mentioned above. Key elements within that are:

18
• Clean and eco-effective production supported by (i) green investment; (ii) eco-
innovation; (iii) eco – design; (iv) appropriate products standards and labelling
programmes; (v) increasing market access for environmental goods and services; (vi)
environmentally sound public procurement rules and practices.
• Education for sustainable consumption and production via (i) integrating knowledge of
relevant consumption behaviour into curricula from pre-school to universities and in
the concepts of life long learning; (ii) providing data for reliable information; (iii) report
on indicators to shape consumption behaviour that can make a difference.
• Information and public participation for sustainable consumption and production
including (i) a broader right to know; (ii) involvement of stakeholders into decision
making or at least consultative structures; (iii) support and financing of participation
structures; (iv) develop and provide effective transparent and verifiable consumer
information tools relating to sustainable consumption and production.2
Most attention has to be given to the mobility, food, and housing sectors as they sum up to
over 70% of all environmental burden caused by unsustainable production and consumption
(Spangenberg and Lorek, 2002).
The requirements are similar for the European Union as well as for national policies. Thus
the key elements necessary to achieve Sustainable Consumption and Production Patterns
as outlined above have to be integrated into national sustainability strategies as well as
national sectoral policies.
Urban and rural planning
The integration of sustainable development aspects into urban space management has to
cover the whole range of economic and social processes, with the recognition that they must
be underlain by the natural environment. Focal issues are
• an active national regional policy taking into account the need for ensuring equal
development opportunities for small and medium-sized towns with respect to big
cities;
• the adoption of sustainable development in urban management, both at the level of
the vision and municipal economy, transport and construction as well as urban and
architectural planning.
Despite of relatively small shares in total land area expansion of built-up land areas are
significant from an environmental and sustainability point of view. Most countries today
acknowledge the importance of growth in built-up areas and call for a more controlled spread
of urban and infrastructure development. The European Union has included built-up area in
its list of sustainable development indicators defined as the percentage of built-up land in

19
total land area (European Commission, 2005c). However data on both current and historic
built-up areas are scarce. Therefore monitoring of built-up and associated land area
increases is considered to be an essential first step towards more controlled spread of built-
up land. This is of particular relevance for the faster growing economies of Central and
Eastern Europe.
5. Policy mix and policy integration
In order to achieve sustainable development in Europe (and beyond), a concerted action
across all economic production sectors is required as well as a reorientation towards higher
consideration of environmental (and social) aspects in private consumption and public
procurement.
One key part of a successful sustainability strategy is the definition of (where possible,
quantitative) targets. Existing policy commitments at the European level, including the
recently presented Thematic Strategies within the 6th Environmental Action Programme, are
in general too vague and to a large extent missing any measurable policy targets. Missing
targets and reliable indicators impede a proper evaluation of progress towards sustainability
in the EU. However, the implementation of such longer-term environmental policy targets is a
necessary precondition for achievement of higher decoupling of material and energy use
from growth, as investments in innovative eco-efficient technologies require predictable
future market framework conditions (EEAC, 2003).
An essential factor facilitating the implementation of sustainable development is the
monitoring and evaluation of changes underway. Therefore, it is indispensable to continue
the work on EU indicators for sustainable development (European Commission, 2005c), the
application of which should be mandatory across the EU at three levels. At the nationwide
level, allowing for comparisons to be made on the international stage and for communication
with politicians and the public. At the regional level, with substantial specificity allowing for
comparison of the degree of sustainability of the development in particular regions or on the
scale of the entire EU in respect of its natural systems (e.g. the Alps or the Caucasus) or
between regions within countries. At the local level with large specificity, in a division into
indicators typical of the entire EU and characteristic of a given type of region (e.g. tourist
regions), this would allow for comparisons within individual countries, regions in these
countries, and for comparisons among different types of regions in the entire EU.
With regard to EU policy initiatives, environmental integration and environmental impact
assessment process could be one core strategy to foster decoupling efforts at the European
level and thus contribute to the implementation of the EU SDS, as they involve a number of
key economic sectors responsible for large shares in EU natural resource and energy

20
consumption and waste and emissions generation. However, what has been starting very
promising under the term “Cardiff integration process” at the end of the 1990s, is now
missing sufficient support from European institutions and environmental impact assessment
is still not widely applied.
Sustainability requires the whole range of policy instruments
In terms of policy instruments, a continued application of the whole range of steering
mechanisms ranging from voluntary de-centralised solutions to traditional regulations through
democratically accountable nation-state institutions is required, depending on the
environmental problem to be tackled (Hey et al., 2003). This pluralistic approach becomes
particularly relevant in the light of the EU enlargement, as it will be essential to draw upon a
diverse range of policy tools to address the widening spectrum of environmental problems
associated with the enlarged EU (EEAC, 2003). Furthermore, a multi-dimensional approach
is demanded acknowledging that – apart from DG Environment – a number of other DGs in
the EU Commission (such as agriculture, transport and energy) hold competences, which
have close relation to environmental issues.
With regard to the overarching policy goal of reduced energy and material use and reduced
production of waste and emissions, and the required shift towards sustainable production
and consumption patterns, which type of instrument should be implemented for which aspect
of the problem (see also Giljum et al., 2005)?
Traditional regulation is best implemented for environmental problems, which require
reduction of specific substances with high potential for negative environmental impacts
(quality aspect of decoupling), e.g. by posing a direct and immediate threat to human health
or the natural environment (air pollution, toxic substances). In comparison to marked-based
instruments, however, these instruments are possibly economically inefficient and thus likely
bear high costs in implementation and control. Additionally, they do not provide incentives to
decrease environmental pressures beyond the agreed critical loads.
Market-based instruments provide price incentives and disincentives and allow private and
public economic actors to achieve environmental objectives in a cost-effective way, including
flexible adaptation according to people’s behaviour and self-interest. Compared to traditional
regulation, market-based instruments are drivers for technological innovation, as – within a
redisigned framework of taxes, subsidies and certificates oriented towards a reduction of
natural resource use and related emissions – investments in higher eco-efficiency are
economically rewarding, also beyond fixed limits of e.g. emissions or waste generation.
These instruments are the preferred choice for pursuing absolute decoupling of
environmental pressures and economic development, in particular if charged at the input side

21
of the economy (i.e. in energy consumption, material use and land use) (European
Commission, 2003).
Voluntary instruments can contribute towards the overall decoupling goal, as enterprises are
encouraged to take economic advantage of environmentally benign behaviour, e.g. through
cost reduction or positive marketing implications. Also information and education
instruments, such as eco-labelling, play an important role in changing consumers’ attitudes
towards a higher awareness of environmental issues (European Commission, 2004b).
However, missing of environmental policy targets (e.g. reduction of greenhouse gas
emissions or reduction of resource use) is a clear threat, if no effective monitoring processes
are in place and sanction mechanisms exist in the case of non-compliance. Thus, voluntary
and education instruments are recommended to complement legislation and market-based
instruments rather than to substitute them.
Generally, the most effective approach in environmental protection is based on the use of a
combination of the available policy options. Such a well-balanced mix should secure keeping
the basic principles of good environmental governance: making decisions at the appropriate
level, providing access to information and participation, and integration of environmental
aspects into all decisions (WRI, 2003). This requires diverse types of instruments to work
alongside: newly introduced market-based instruments together with traditional ones, with
some of them having an effect in the long run, others in the short run. It also is likely required
for such a policy-mix to change over time. The suitable mix of instruments should be the
result of a political process taking into account environmental, as well as economic and
social objectives.
Cornerstones of EU sustainable development policies
The implementation of principles and solutions for sustainable development cannot take
place without introducing new instruments and strengthening many existing ones. Many
instruments on the sectoral level have already been discussed above. Most important overall
policy goals and measures include:
• Economic development based on sustainable competitiveness, where prices
include the broadly conceived external (social and environmental) costs.
• Shift of tax burden from labour to the use of natural resources through the
introduction of an environmental fiscal reform, consisting of the reduction of
employment-related taxes, along with the increase of taxes related to the use of non-
renewable natural resources (energy taxes, material input taxes, levies on built-up
land, etc.), with neutral effects on the budget.

22
• Removal of environmentally (and socially) harmful subsidies that encourage
overuse of resources, in particular in the agricultural, fisheries, transport and energy
sectors (considering also fair trade aspects).
• Stimulating research and technology development for resource efficiency in
products and processes and implementation of best practice programs.
• Integration of resource efficiency goals into other programs like IPP, eco-labelling,
green procurement, and environmental reporting.
• Stimulation of transfer of knowledge and information instead of material goods.
• Improvement in planning processes with regard to environmental and sustainability
impact assessment.
• Fostering of voluntary environmental agreements between industries.
6. Conclusions
The scenario simulations performed in the MOSUS project revealed that the implementation
of a well-designed mix of (mostly) environmental policies can result in a win-win situation for
both the economy and the environment. In comparison to the baseline scenario, the policy
measures implemented in the two sustainability scenarios significantly improved the
environmental performance of the European economy in terms of energy and material use
and emissions of CO2, while at the same time stimulating economic efficiency, which results
in higher economic growth and increased international competitiveness of European
industries on international markets. Although a number of important issues remained
unresolved in the MOSUS scenarios (such as maintained high levels of unemployment,
rising energy demand by the transport sector and increasing externalisation of environmental
burden to other world regions via international trade), results showed that policies aiming at a
radical improvement of energy and material efficiency in the European Union can indeed
contribute to key objectives of both the EU Sustainable Development Strategy and the
Lisbon Strategy. The main policy message from MOSUS therefore is that the Commission as
well as the Member States should strive for the implementation of policies, which lead to the
development and implementation of more eco-efficient technologies and products as part of
the transformation towards more sustainable production and consumption systems in the
European Union.

23
References
AIECE. 2005. World commodity prices 2005-2006. Association of European Conjuncture Institutes, Working Group on Commodity Prices.
EEA. 2005. The European Environment. State and Outlook 2005. European Environment Agency, Copenhagen.
EEAC. 2003. European Governance for the Environment. European Environmental Advisory Councils, Working Group on Governance, Den Haag.
European Commission. 2001a. Communication on the Community law applicable to public procurement and the possibilities for integrating environmental considerations into public procurement. European Commission, Brussels.
European Commission. 2001b. European Transport Policy for 2010. Time to decide. White Paper. No. European Commission. DG Transport, Brussels.
European Commission. 2001c. Green Paper on Integrated Product Policy. COM (2001) 68 final. European Commission, Brussels.
European Commission. 2003. Towards a thematic strategy for the sustainable use of natural resources. COM(2003) 572 final. DG Environment, Brussels.
European Commission. 2004a. The share of renewable energy in the EU. COM(2004) 366 final. European Commission, Brussels.
European Commission. 2004b. Sustainable production and consumption in the European Union. European Commission, Brussels.
European Commission. 2005a. 2004 Environmental Policy Review. COM(2005) 17 final. European Commission, Brussels.
European Commission. 2005b. Report on the implementation of the Environmental Technologies Action Plan in 2004. COM(2005) 16 final. European Commission, Brussels.
European Commission. 2005c. Sustainable Development Indicators to monitor the implementation of the EU Sustainable Development Strategy. SEC(2005) 161 final. European Commission, Brussels.
European Commission. 2005d. Thematic Strategy on the Urban Environment. COM(2005) 718 final. European Commission, Brussels.
European Commission. 2005e. Working together for growth and jobs. A new start for the Lisbon strategy. Spring Report 2005. No. European Commission, Brussels.
Gervais, C. 2002. An Overview of European Waste and Resource Management Policy. Forum for the Future, London.
Giljum, S., Hak, T., Hinterberger, F., Kovanda, J. 2005. Environmental governance in the European Union: strategies and instruments for absolute decoupling. International Journal for Sustainable Development 8 (1/2), 31-46.
Hey, C., Jänicke, M., Jörgens, H. 2003. Environmental Governance in the European Union. Second ECPR Conference, Marburg.
Jackson, T., Michaelis, L. 2003. Policies for Sustainable Consumption. UK Sustainable Development Commission.
Joint Study Group. 2003. Findings of Workshop on Metal Recycling. Joint Study Groups' Workshop on metals recycling, St. Petersburg.

24
Söderholm, P. 2004. Extending the Environmental Tax Base. Prerequisites for Increased Taxation of Natural Resources and Chemical Compounds. 5416. Swedish Environment Protection Agency, Stockholm.
Spangenberg, J., Lorek, S. 2002. Environmentally sustainable household consumption: from aggregate environmental pressures to priority fields of action. Ecological Economics 43 (2-3), 127-140.
WRI. 2003. Closing the Gap: Information, Participation and Justice in Decision-making for the Environment. World Resources Institute, Washington.

1
From visions to action through transition management René Kemp ICIS, DRIFT and UNU-MERIT Email: [email protected] [email protected] and [email protected] Tel:+ 31 (0)43 350 6305 Paper for FORESENE workshop in Vienna, 23-24 Oct 2006 Abstract In this short paper I outline a model of managing long-term change offering sustainability benefits. The model, named transition management, is currently used by the Dutch government to manage the transition from the hydrocarbon-based energy system to a low-carbon energy system. It is a model of reflexive governance in terms of problem handling, strategy formulation and, implementation, that relies on the modulation of ongoing developments to sustainability goals. In this model, policy is informed by long-term goals, visions for achieving these and real experiences. Learning and institutional change are key elements of policy, which is oriented towards generating feedback cycles in strategically chosen directions. 1. Sustainable development approaches Sustainable development is a stated aspiration of governments and societies. Sustainable development represents a concern for the future in terms of the well-being and opportunities for development. Sustainable development is a kind of motherhood concept “encompassing three of the great goals of humanity, namely entitlement to health, wealth and justice in a single concept” (O’Riordan, 1996, p. 140-141). The idea of sustainable development or sustainability represented an attempt to link environment with development. This was effectively done through the report Our Common Future by the World Commission on Environment and Development (the

2
Brundtland Report) which stated that critical global environmental problems were both the result of the enormous poverty of the South and the non-sustainable patterns of consumption and production in the North. It called for a strategy that united development and the environment – described by the now-common term sustainable development, defined as “development that meets the needs of current generations without compromising the ability of future generation to meet their own needs’’ (World Commission on Environment and Development, 1987, p. 23). Following the Brundtland report, numerous attempts have been made to operationalise sustainable development. We have pillar-based approach, principle-based approaches and vision-based approaches. The most popular of the approaches is the pillar approach with the three pillars “economy”, “environment” and “social” also referred to as the 3-P concept of “people, planet, profits”.1 Figure 1. The 3 pillar approach of sustainable development
Source: http://www.sustainability-ed.org/pages/what3-1.htm The pillar-focused approaches gained great popularity, in particular in business, but they often suffered from insufficient attention to overlaps and interdependencies and a tendency to facilitate continued separation of social, economic and ecological analyses (Kemp et al., 2005). Alternative depictions stressing interconnections and consideration of institutional aspects (as in the PRISM model of Spangenberg 2002 and Spangenberg et al. 2004, Farrell et al. 2005, and the SCENE model of Grossfurth and Rotmans,2005) offer a useful way forward. Principle-based approaches are based on principles of sustainability. An example is given in Table 1. The requirements of sustainability are multiple and interconnected, making it a difficult concepts to work with for policy makers.
1 At the World Summit of Sustainable Development in Johannesburg, the 3-P concept of “people, planet, profit” was changed into “people, planet and prosperity”.

3
Table 1. Principles of Sustainability Human-ecological systems integrity: Build human-ecological relations to maintain the integrity of biophysical systems in order to maintain the irreplaceable life support functions upon which human well-being depends. Sufficiency and opportunity: Ensure that everyone has enough for a decent life and that everyone has opportunities to seek improvements in ways that do not compromise future generations' possibilities for sufficiency and opportunity. Equity: Ensure that sufficiency and effective choices for all are pursued in ways that reduce dangerous gaps in sufficiency and opportunity (and health, security, social recognition, political influence, etc.) between the rich and the poor. Efficiency and throughput reduction: Provide a larger base for ensuring sustainable livelihoods for all which reducing threats to the long term integrity of socio-economic systems by avoiding waste and reducing overall material and energy use per unit of benefit. Democracy and civility: Build our capacity to apply sustainability principles through a better informed and better integrated package of administrative, market, customary and personal decision making practices. Precaution: Respect uncertainty, avoid even poorly understood risks of serious or irreversible damage to the foundations for sustainability, design for surprise and manage for adaptation. Immediate and long-term integration: Apply all principles of sustainability at once, seeking mutually supportive benefits. Source: Gibson (2001) The third type of approach resolves around the use of visions of sustainable development. An example of a vision-based approach is the Dutch approach of transition management developed by Rotmans and Kemp and elaborated by Loorbach (Rotmans et al. (2000, 2001b), Kemp and Rotmans (2004, 2005), Kemp et al. (2006) and Kemp and Loorbach (2006). In transition management different visions and paths are explored. Not just one vision, such as dematerialization or renewable energy sources. This is important because sustainable development is about locally adapted solutions meeting local concerns besides global concerns. The visions should help define experiments and programmes for system innovation, the lessons of which should lead to a revision of the visions and to the identification of new things to do (new experiments and changes in the policy framework). This is the basic tenet of transition management, a model or perspective for policy, which I developed with Jan Rotmans 6 years ago in a project for the Dutch government, and which was further developed with Derk Loorbach.

4
2. Transition management This section describes the model of transition management that is used in the Netherlands for managing 4 transitions2:
Transition to sustainable energy Goal: to develop a system of energy supply that is reliable, efficient and emission-low.
Transition to biodiversity and sustainable use of natural resources Goal: to maintain biodiversity which is essential for food supply, fertility of soils and climate and promote the prevention, re-use and recycling of natural resources.
Transition to sustainable agriculture Goal: to realise an agricultural system with minimal impact on environment that does not impair human health, landscape qualities and animal well-being.
Transition to sustainable mobility Goal: to create a transport system that produces low emissions and little nuisance from noise whilst maintaining high levels of accessibility, safety and spatial values.
This model has been developed by the author with Jan Rotmans and others for the 4th National Environmental Policy Plan of the Netherlands (NEPP4, in Dutch: NMP4) (Rotmans et al., 2000, 2001). Transition management constitutes a deliberate attempt to work towards a transition into what is believed a more sustainable direction. There are different ways of trying to achieve a transition. One can opt for the use of economic incentives or rely on a planning and implementation approach or some combination of the two, for example, the use of market-based indicative planning based on sustainability visions. Transition management opts for a combination of the two models, using the best elements from the two approaches: the reliance on markets helps to safeguard user benefits and promotes efficiency, whereas the use of targets informed by long-term visions of sustainability helps to orient sociotechnical dynamics to sustainability goals. We thus have efficiency, flexibility, and long-term welfare benefits, all together. The basic steering philosophy is that of modulation, not dictatorship or planning-and-control. Transition management joins in with ongoing dynamics and builds on bottom-up initiatives. Ongoing developments are exploited strategically. Transition management for sustainability tries to orient dynamics to sustainability goals. The long-term goals for functional systems are chosen by society either through the political process or in a more direct way in a consultative process. The goals can be quantitative or qualitative. The goals may refer to the use of particular solution (fuel cell vehicles, road pricing or multimodal transport) but better refer to performance such as non-congested transport that is safe, accessible, and minimises nuisance. 2 See www.senternovem.nl/energietransitie/; www.senternovem.nl/energietransitie/Transitiebeleid/index.asp

5
The goals and policies to further the goals are not set into stone but constantly assessed and periodically adjusted in development rounds. Existing and possible policy actions are evaluated against two criteria: first, the immediate contribution to policy goals (for example in terms of kilotons of CO2 reduction and reduced vulnerability through climate change adaptation measures), and second, the contribution of the policies to the overall transition process. Policies thus have a content goal and a process goal. Learning, maintaining variety and institutional change are important policy aims and policy goals are used as means. The use of development rounds brings flexibility to the process, without losing a long-term focus. Transition management is oriented towards achieving structural change in a stepwise manner. A schematic view of transition management is given in Figure 2. Figure 2. Transition management versus existing policy
Source: Kemp and Rotmans (2004) Whereas existing policy for the most part is based on short-term goals, transition management is oriented towards the realisation of long-term goals using visions of sustainability. The short-term goals are based on the long-term goals and comprise learning goals. Sustainability visions are explored using small steps. Transition management is based on a two-pronged strategy. It is oriented towards both system improvement (improvement of an existing trajectory) and system innovation (representing a new trajectory of development or transformation). The role of government varies in each transition phase. For example, in the predevelopment stage there is a great need for social experimentation and for developing visions. In the breakthrough phase there is a special need for controlling the side effects of large-scale application of new technologies. Throughout the entire transition the external costs of technologies (old and new ones) should be reflected in prices. This is not
Political margins for
change
State of development of solutions
Societal goals
Sustainability visions
Transition management: oriented towards long-term sustainability goals and visions, iterative and reflexive (bifocal)
Existing policy process: short-term goals (myopic) Formatiert: Nummerierungund Aufzählungszeichen

6
easy. Taxes are disliked by any person who has to pay them. Perhaps it helps if they are introduced as part of a politically-accepted transition endeavour, and when the revenues are used to fund the development of alternatives. Transition management breaks with the old planning-and-implementation model aimed at achieving particular outcomes. It is based on a different, more process-oriented philosophy of goal-oriented modulation: the utilisation of ongoing developments for societal goals. The model is based not on insights of governance but on insights from innovation theory, especially the work on technological transitions (Freeman and Perez, 1988; Geels, 2002 & 2004) and the work on path-dependence (Arthur, 1989; David, 1985). Transition management is a new steering concept that relies on ‘darwinististic’ processes of guided variation and selection instead of planning. Collective choices are made “along the way” on the basis of (new) learning experiences at different levels. Different trajectories are explored and flexibility is maintained, which is exactly what a manager would do when faced with great uncertainty and complexity: instead of defining end states for development he sets out in a certain direction and is careful to avoid premature choices. Key elements of the transition management cycle are anticipation, learning and adaptation. The starting point is the structuring of problems. This is followed by the development of long-term visions and goals. Multiple visions of sustainable development for energy supply and other domains are being explored through transition experiments as part of programmes for system innovation that are defined in transition arenas, bringing together private and public actors. Transition management is a form of reflexive governance which governance relies on a cycle of policy development, implementation and adaptation which is depicted in Figure 3.

7
Figure 3: transition management as a cyclical process Transition management aims for generating “momentum” for sustainability transitions through processes of positive feedback. Not all actors will contribute to a transition, but once a new development takes shape, others will follow suit, including companies invested in the old system. This is already happening in the area of energy where oil companies are moving into the business of renewables. When this occurs the change process becomes a force of its own. This is a critical phase in a transition in which unwanted path dependencies occur. Society has to develop antennas (via ‘assessment tools’) for systemic effects. Transition management aims to shape processes of change into sustainable directions using the five strategies of reflexive governance, building on the heterogeneity in society in terms of knowledge, concerns, values and systems of governance. To accomplish this, some operationalisation of sustainable development is needed, in terms of key parameters and elements. This is to be done as part of the process. For energy, greenhouse gas emissions could be chosen as a key parameter. It is not a requirement that all actors share the same definition of sustainable development. Open definitions of sustainable development help communities and groups of actors to define sustainability programmes and action that befits their concern. Without such flexibility, no action may come from such interactions or only actions which meet official sustainability aspects, such as global warming (Robinson, 2004).
Source: Loorbach
Evaluating, monitoring
and learning
Developing
sustainability visions and transition-
agendas
Organizing a multi- actor network
Mobilizing actors and executing projects and
experiments

8
Transition management has elements of planning through the use of goals and programmes for system innovation but does not aim to control the future. It relies heavily on market forces and decentralized decision-making. It does not blankly rely on market forces, but is concerned with the conditions under which market forces operate, by engaging in “context control” so as to orient market dynamics towards societal goals. It consists of government acting to secure circumstances that will maximize the possibilities for progressive social movement by promoting innovation and mitigating negative effects (Meadowcroft, 1999a). Private initiative is thus not curtailed but rather reoriented towards those activities that serve not only private goals but also serve social goals. This is done through programmes for system innovation and through the use of policy goals providing guidance to societal actors. Transition management opts for iterative steps and adaptation, Transition management is different however from Lindblom’s model of incremental politics and does not opt for disjointed incrementalism as the policy analysis method. Integrated problem analysis and system analysis are part of transition management, which is also concerned with positive goals. For this reason it is better viewed as “logical incrementalism’ (Quinn, 1978 & 1980) or directed incrementalism (Grunwald, 2000). Logical incrementalism is a strategy development process where managers have a view of where they want the organisation to be in years to come and try to move towards this position in an evolutionary way, pursuing different paths, with strategies built on newly created experience. In transition management there is also a sense of where one wants to be in the future, based on collective goals for functional systems, but without specifying the means for fulfilling them. Transition management does not opt for one vision or one model of sustainable development. The exploration of multiple visions is needed because as an inherently indeterminate and contested concept (Mog, 2004), sustainability cannot be translated into a blueprint from which criteria can be derived and unambiguous decisions can be taken to get there. From a governance perspective such disagreement is an essential part of sustainable development, one that makes operationalisation and implementation difficult because:
• there are different ideas of what sustainable development amounts to for actors in various sectors (e.g., energy, transport, agriculture, food systems, waste management);
• existing solutions tend to be sustainable within these sectors rather than across the whole of society:
• new developments bring new risks that cannot be anticipated; • it is a long-term, open-ended project that precedes and supersedes limited term,
democratically elected governments; • it involves making choices on highly contested issues (Farrell et al., 2005)
Conflict however is kept within bounds as in the “compass and gyroscope” model of Lee (1993b) for combining science with politics. Governance is opened up for other people and voices. And politically there should be an agreement to explore system-innovations as part of a transition management approach, the details of which should evolve with time, in a time-honoured manner.

9
3. Transition policy for sustainable energy in the Netherlands The model of transition management is used in the Netherlands, where the national government is committed to achieving a transition to sustainable energy and using the model of transition management for this. The transition is oriented towards the following goals: (1) secure and reliable services, (2) low prices and, (3) minimal ecological damage and minimal negative impacts on society. These meta-goals are supplemented by more specific goals such as the goal to increase the annual rate of energy saving from 1.5 to 2% a year and the target of 30% for green energy sources by 2030. The goals were set by the energy transition platforms. Out of the different routes to meet these goals, 5 main routes were chosen, based on an assessment of the strengths of Dutch knowledge clusters and environmental priorities. The routes are: green gas, chain efficiency, bio-based resources, alternative motor fuels and, sustainable electricity. For these routes, 26 transition paths were selected which were believed to be attractive for Dutch business and Dutch society. For transition experiments for sustainable energy, 35 million euro is available. The experiments should learn not just about technical issues but also about acceptance, user needs and markets. Sustainability aspects are discussed but not made the topic of research or societal deliberation. The main goal is to create new energy business through innovation support. This also helps to explain why those options such as concentrating solar power in which there is not a strong competence on the part of Dutch companies are not selected. Policy innovation is officially part of transition policy. The Dutch government is committed to better policies and to partnership. Through a more open, interactive approach it hopes to achieve a better coordination of different policies (e.g., environmental policy integration). Responsibilities for the selection of transition paths have been devolved to the transition platforms in which business actors are often the key actors. The chairperson usually is from business. In terms of participation it is not the open process it was supposed to be. The transition paths have been chosen by people present in the platforms (in which the business voice is prominent). The portfolio of alternative energy technologies is very broad but this is not necessary a bad thing. It is too early to evaluate Dutch transition policies but it appears a useful model even when the transition process is dominated by regime actors (energy companies such as Shell and Gasunie). It catalyzed developments. It gave more attention to system innovations and transition paths. In the area of energy, 5 platforms have been created which selected 26 transition paths. Based on their proposals, a national transition action plan has been formulated by the “task force for the energy transition”, headed by Shell director Rein Willems. The action plan received extensive news coverage on May 8, 2006, when it was presented to the Ministers of Economic Affairs and Environment. Policy instruments are re-assessed and a mechanism is created for policy coordination, through the interdepartmental platform energy transition (IPE). So far local governments are not very much involved in it but this will change as they have an important role to play in the implementation of the paths. Transition management offers a model for many actors of society to be involved in the process: technology
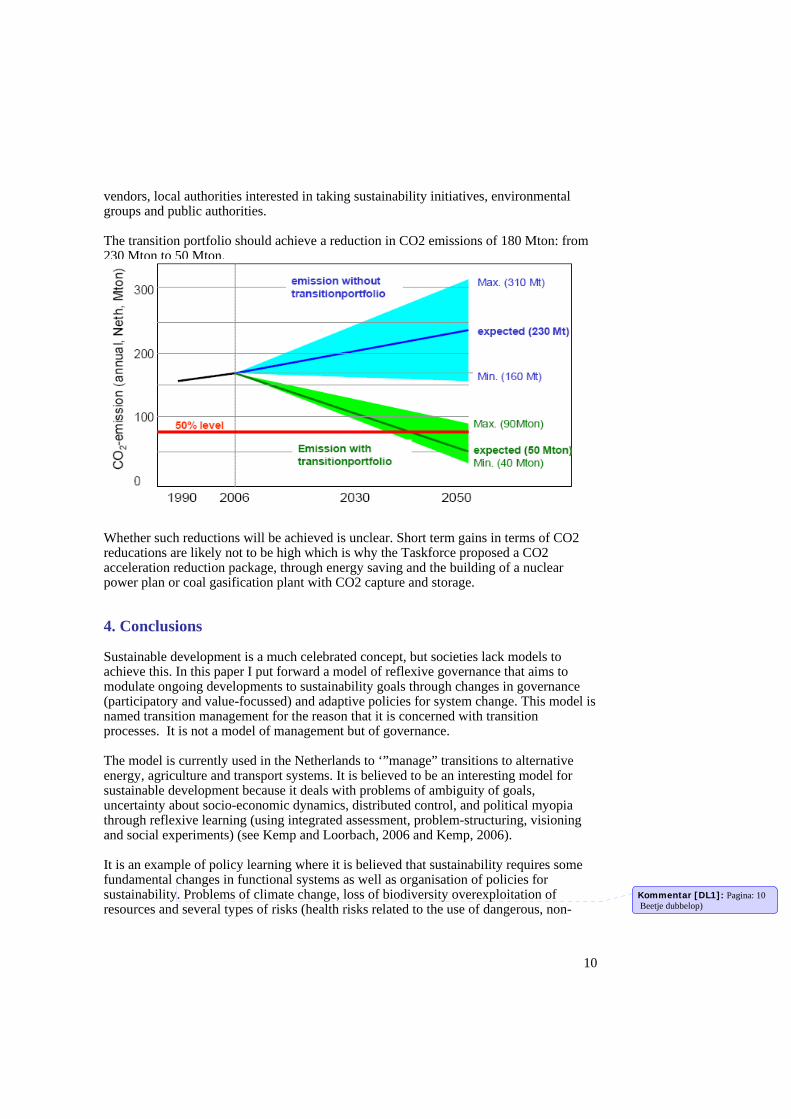
10
vendors, local authorities interested in taking sustainability initiatives, environmental groups and public authorities. The transition portfolio should achieve a reduction in CO2 emissions of 180 Mton: from 230 Mton to 50 Mton.
Whether such reductions will be achieved is unclear. Short term gains in terms of CO2 reducations are likely not to be high which is why the Taskforce proposed a CO2 acceleration reduction package, through energy saving and the building of a nuclear power plan or coal gasification plant with CO2 capture and storage. 4. Conclusions Sustainable development is a much celebrated concept, but societies lack models to achieve this. In this paper I put forward a model of reflexive governance that aims to modulate ongoing developments to sustainability goals through changes in governance (participatory and value-focussed) and adaptive policies for system change. This model is named transition management for the reason that it is concerned with transition processes. It is not a model of management but of governance. The model is currently used in the Netherlands to ‘”manage” transitions to alternative energy, agriculture and transport systems. It is believed to be an interesting model for sustainable development because it deals with problems of ambiguity of goals, uncertainty about socio-economic dynamics, distributed control, and political myopia through reflexive learning (using integrated assessment, problem-structuring, visioning and social experiments) (see Kemp and Loorbach, 2006 and Kemp, 2006). It is an example of policy learning where it is believed that sustainability requires some fundamental changes in functional systems as well as organisation of policies for sustainability. Problems of climate change, loss of biodiversity overexploitation of resources and several types of risks (health risks related to the use of dangerous, non-
Kommentar [DL1]: Pagina: 10 Beetje dubbelop)

11
natural substances and risks of explosion and accident) were viewed as system-inherent, which meant that the answer to the problems was to be found in fundamental changes in underlying systems of production and consumption. Different models of transition management are conceivable. Planned change is one possible model; a second model is to engage in context control through regulations and the use of economic incentives. The novelty of the Dutch model of transition management is that it relies on guided processes of variation and selection, the outcomes of which are stepping stones for further change. In the words of the Minister of Economic Affairs Hans Weijers in 2001:
In my opinion the government should not work from self-designed, predetermined future images that fix choices for a long time. What it should do instead is to stimulate and search for new initiatives in society that lie the basis for developments that help to go beyond existing energy policy objectives, starting from a shared concept of sustainability. The concept of transition management requires different ways of thinking and doing-things on the part of government, including the Ministry of Economic Affairs. I want to play an active part in this. I have asked people of the Department to work out the concept the coming half year (Brief Minister van Economische Zaken, 2001, P. 5, quoted in MINEZ, 2001).
In the works of the Ministry of Econmic Affaris the model of transition management differs from existing energy and climate policy in the following respects: long-term orientation, system approach, collaboration between stakeholders who jointly formulate ambitions and take concrete steps to realize these ambitions (MINEZ, 2004). Transition management was attractive because it allowed different ministries to pursue their own agenda of innovation and partnership with business and society. It is a model of reflexive governance that acknowledges that governing activities are entangled in wider societal feedback loops and are partly shaped by the (side-) effects of its own working (Voss and Kemp, 2006). The promotion of diversity certainly is “wasteful” in the short term, but in the long term it bring us closer to what we want (as a society) by not fixing outcomes beforehand. It makes use of “bottom-up” developments and long-term goals both at the national and local level. Governing processes are opened-up for interaction and feedback relations with an important role for subpolitics (Beck, 1994b) and outsiders championing system innovation. It has elements of incremental politics and planning but it is not a simple mix of incrementalism and planning because it has a set of distinctive features which are: problem structuring, visioning, second-order learning, portfolios and strategic experiments, and capacity building in government and society (von Schomberg, 2005). It inserts a strategic element in incrementalism and makes planning more adaptive (open with regard to outcomes) and participatory (open to stakeholders). Society is being taken into a transition to a broadly-defined, yet flexible destiny in a forward-looking and adaptive manner.
12
It could be combined with pillar and principle approaches of sustainable development. But this needs to be worked out. Scenario analysis is something that fits very well with transition management. The approach may benefit from the sustainability foresight methodology, developed by Bernhard Truffer, Jan Peter Voss and Kornelia Konrad, described in Truffer et al., (2006), which helps to identify opportunities for action. Visions thus play an important role. The use of multiple visions helps society to escape lock-in while avoiding new evolutionary traps. References Arthur, W.B. (1989) Competing Technologies, Increasing Returns, and Lock-in By Historical
Events, Economic Journal, 99, pp. 116-131. Beck, U. (1994) The Reinvention of Politics: Towards a Theory of Reflexive Modernization, in:
U. Beck, A. Giddens & S. Lash (Ed.) Reflexive Modernization, pp. 1-55 (Cambridge: Polity Press).
Berkhout, Frans, Adrian Smith and Andy Stirling (2004) Technological regimes, transition
contexts and the environment, in Boelie Elzen, Frank Geels and Ken Green (eds.). System Innovation and the Transition to Sustainability: Theory, Evidence and Policy, Cheltenham: Edgar Elgar, pp. 48-75 .
Checkland, P. and J. Scholes (1990). Soft Systems Methodology in Action. Toronto, John Wiley
and Sons. David P. (1985) Clio and the Economics of Qwerty, American Economic Review, 75 (2), pp.332-
337. Farrell, K., R. Kemp, F. Hinterberger, C. Rammel and R. Ziegler (2005), ‘From *for* to
Governance for Sustainable Development in Europe –what is at stake for further research’, International Journal of Sustainable Development, Vol 8 (Nos 1/2): 127-150.
Freeman, Chris, and Francisco Louçã (2001) As times goes by. From the Industrial Revolutions to
the Information Revolution, Oxford University Press. Funtowicz, S., Ravetz J. R., & M. O'Connor (1998) Challenges in the use of science for
sustainable development, International Journal of Sustainable Development, 1 (1), pp. 99-107.
Geels, F.W. (2002), ‘Technological transitions as evolutionary reconfiguration processes: A
multi-level perspective and a case-study’, Research Policy, 31(2002)8/9, pp. 1257-1274 Geels, F.W. (2005) Technological Transitions, A co-evolutionary and socio-technical analysis,
Cheltenham, Edward Elgar.

13
Gibbons, M., Limoges, C., Nowotny, H., Schwartzman, S., Scott, P., & Trow, M. 1994. The New Production of Knowledge: The Dynamics of Science and Research in Contemporary Science. Newbury Park, CA: Sage.
Gibson, R.B. (2001) ‘Specification of sustainability-based environmental assessment decision criteria and implications for determining 'significance' in environmental assessment’, Ottawa, Canadian Environmental Assessment Agency Research and Development Programme: 46.
J. Grin & Grunwald, A. (ed.’s) Vision Assessment: Shaping Technology in 21st Century Society. Towards a Repertoire for Technology Assessment, (Heidelberg: Springer Verlag).
Grunwald, A. (2000) Technology Policy between Long-term Planning Requirements and Short-
ranged Acceptance Problems. New Challenges for Technology Assessment, in: J. Grin & Grunwald, A. (ed.’s) Vision Assessment: Shaping Technology in 21st Century Society. Towards a Repertoire for Technology Assessment, pp. 99-148 (Heidelberg: Springer Verlag).
Grunwald, A. (2004) Strategic knowledge for sustainable development: the need for reflexivity
and learning at the interface between science and society, International Journal of Foresight and Innovation Policy, 1(1/2), pp. 150-167.
Grosskurth, J. & Rotmans, J. 2005. The scene model: getting grip on sustainable development in policy making. Environment, Development and Sustainability 7(1):135–151.
Gunderson and Holling, 2002 Hajer M, and S. Kesselring (1999), "Democracy in the risk society? Learning from the new
politics of mobility in Munich" Environmental Politics 8(3): 1 – 23. Hjorth, P.; Bagheri, A. (2006) Navigating towards sustainable development: A system dynamics
approach, Futures, 38(1): 74-92.
Kates, R., Clark, W., Corell, R., Hall, J., Jaeger, C., Lowe, I., McCarthy, J., Schellnhuber, H-J., Bolin, B., Dickson, N., Faucheux, S., Gallopin, G., Grubler, A., Huntley, B., Jager, J., Jodha, N., Kasperson, R., Mabogunje, A., Matson, P., & Mooney, H. 2001. Sustainability science. Science 292(5517):641–642.
Kemp, René, en Derk Loorbach, Governance for Sustainability Through Transition Management, paper for EAEPE 2003 Conference, November 7-10, 2003, Maastricht, The Netherlands.
Kemp, René, Saeed Parto and Robert B. Gibson (2005), Governance for Sustainable
Development: Moving from theory to practice, International Journal of Sustainable Development, Vol 8 (Nos 1/2): 13-30.
Kemp, R., and D. Loorbach, (2005) ‘Transition management: A Reflexive Governance
Approach’, in J-P. Voss, D. Bauknecht and R. Kemp (eds.) Reflexive Governance for Sustainable Development, Edward Elgar, Cheltenham, pp. 103-130.
Kemp, R., & Loorbach, D. (2005) Dutch Policies to Manage the Transition to Sustainable
Energy, in F. Beckenbach, U. Hampicke, C. Leipert, G. Meran, J. Minsch, H. G. Nutzinger,

14
R. Pfriem, J. Weimann, F. Wirl & U. Witt, Jahrbuch Ökologische Ökonomik 4 Innovationen und Nachhaltigkeit, pp. 123-150 (MetropolisVerlag, Marburg).
Kemp, R., D. Loorbach and J. Rotmans (2006), Transition management as a model for managing
processes of co-evolution, paper for special issue on (co)-evolutionary approach to sustainable development of The International Journal of Sustainable Development and World Ecology.
Kemp, R. (2006), Beyond Incrementalism and Planning– The Dutch model of transition
management, article for special issue Governance for Sustainable Development. Steering in contexts of ambivalence, uncertainty and distributed control”, Journal of Environmental Policy and Planning.
Korten, D.C. (1999) The Post-Corporate World: life after capitalism. West Hartford: Kumerian/San Francisco: Berrett-Koehler.
Lafferty, W.A. (ed.), (2004) Governance for Sustainable Development. The Challenge of Adapting Form to Function, Edward Elgar, Cheltenham,
Lee, K.N. (1993) Compass and Gyroscope. Integrating Science and Politics for the Environment,
Island Press, Washington D.C. Meadowcroft, J. (1999) ‘Planning for Sustainable Development: What can be learned from the
critics?’, in M. Kenny and J. Meadowcroft (editors) Planning sustainability, Routledge, London and NY, pp. 12-38.
Meadowcroft, J. (1999) ‘Co-operative management regimes: Collaborative problem solving to implement sustainable development’, International Negotiation 4: 225-54.
Mog, J.M. (2004) ‘Struggling with Sustainability – A Comparative Framework for Evaluating Sustainable Development Programs’, World Development 32(12): 2139–2160.
NMP-4 (2000), Een wereld en een wil. Werken aan duurzaamheid. (A World and a will. Working
on Sustainability), The Hague.
O’Riordan, T. (1996), Democracy and the sustainability transition, in W.A. Lafferty and J. Meadowcroft (eds.) Democracy and the environment. Problems and Prospects, Edward Elgar, Cheltenham, pp. 140-156.
Quinn, J.B. (1978) Strategic Change: ‘Logical Incrementalism’, Sloan Management Review, Fall, pp. 7-21.
Rammel, C. & van den Bergh, J. (2002) An Evolutionary Perspective on Sustainable
Development Policies: Adaptive Flexibility and Risk Minimising, Ecological Economics, 47 (2-3), pp. 121-133.
Rammel, C., Hinterberger, F., and Bechthold, U. (2004) ‘Governing sustainable development—a co-evolutionary perspective on transitions and change’, GoSD working paper 1, http://www.gosd.net/pdf/gosd-wp1.pdf
Robinson, J. (2004) "Squaring the Circle: On the Very Idea of Sustainable Development", Ecological Economics 48(4): 369-384.

15
Roe, E. (11998), Taking complexity seriously. Policy analysis, triangulation and sustainable
development, Kluwer Academic Publishers, Boston. Rosenau, J.N. (2003) ‘Globalization and governance: bleak prospects for sustainability’,
Internationale Politik und Gesellschaft, 3/2003 http://fesportal.fes.de/pls/portal30/docs/FOLDER/IPG/IPG3_2003/ARTROSENAU.HTM
Rosenhead, J. & Mingers, J. (2001) Rational Analysis for a Problematic World Revisited:
problem structuring methods for complexity, uncertainty and conflict (Wiley, Chichester).
Rotmans, J., Kemp, R., Van Asselt, M., Geels, F., Verbong, G., and Molendijk, K. (2000) Transities & transitiemanagement. De casus van een emissiearme energievoorziening. Final report of study “Transitions and transition management” for the 4th National Environmental Policy Plan (NMP-4) of the Netherlands, October 2000, ICIS & MERIT, Maastricht.
Rotmans, J., Kemp, R., and Van Asselt, M. (2001) ‘More evolution than revolution. transition management in public policy’, Foresight, Vol. 3(1), pp. 15-31.
Rotmans, J, and van Asselt, M. (2002) ‘Integrated assessment: current practices and challenges for the future’, in Hussein Abaza and Andrea Baranzini, eds., Implementing Sustainable Development: Integrated Assessment and Participatory Decision-making Processes, Edward Elgar, Cheltenham, pp. 78-116.
Sartorius, C. (2003) ‘Second-order sustainability—conditions for the development of sustainable technologies in a dynamic environment’, mimeo Sustime project, TUB, Berlin.
Smith et al. (2005)
Spangenberg, J.H., Pfahl, S., and Deller, K. (2004) ‘Development of institutional indicators’, available at: http://www.seri.at/Data/personendaten/js/instituti.pdf (accessed January 5 2004).
Von Schomberg, R., Guimarães Pereira, A., & Funtowicz, S. (2005) Deliberating Foresight-Knowledge for Policy and Foresight-Knowledge Assessment, European Commission, DG Research, ftp://ftp.cordis.lu/pub/foresight/docs/deliberatingforesight.pdf.
Voss, J-P., and R. Kemp (2005) ‘Sustainability and Reflexive Governance: Introduction’, in J-P.
Voss, D. Bauknecht and R. Kemp (eds.) Reflexive Governance for Sustainable Development, Edward Elgar, Cheltenham, pp. 3-28.
WCED (1987) Our Common Future, Oxford University Press, Oxford.

– 1 –
Dynamics of the Environmental Industry: The Case of Austria
Angela Köppl (Wifo)
FORESCENE Workshop
Vienna, October 23, 2006
Introduction
In this short paper the complex structure of the environmental industry is discussed as well as its context to changing environmental policy. Considering that the environmental technology industry is a typical cross-cutting sector, it cannot be identified in conventional economic statistics. Any estimates of its growth and employment potential are thus rather difficult to make. The market for environmental goods and services consists of enterprises with a large variety of economic activities and technological competences. Empirical evidence on the environmental industry is thus rather scarce. Especially data for country comparisons and development over time are not available in adequate quality.
For Austria the development of the environmental industry can be illustrated for a ten year period, based on three studies carried out by the Austrian Institute of Economic Research (Köppl – Pichl, 1995, Köppl 2000, 2005). In the mentioned studies the focus is laid on the supply of technologies, environmental services are therefore not covered in the mentioned analyses. The methodological approach is based on a survey with Austrian suppliers of environmental technologies. The questionnaire collects detailed data on general economic indicators but also specific information on environmental technologies.

– 2 –
Discussing environmental technologies in the context of sustainability one has to take a look at the changing focus of environmental policies. Environmental policies have been at the centre of attention in various facets for several decades. The first major environmental movement in the 1970s was characterised by its local dimension: it aimed primarily to reduce the environmental pollution (water, air, waste) that could be seen and felt. The translation into the environmental technology industry was mainly established by the development and use of end-of-pipe technologies.
By the late 1980s, the publication of the Brundtland Report (1987) and the increased acceptance of the sustainable development concept opened up a wider perspective on environmental problems. On the one hand, the focus was redirected from a national to a global perception, and on the other hand, sustainable development attempted to integrate economic, ecological and social aspects.
For both regimes the availability of environmental technologies plays a crucial role. In the early phase the evolvement of the environmental industry was closely related to domestic environmental legislation with an emphasis to end of pipe technologies. Environmental technologies were thus mainly added on to existing production processes in order to avoid that polluting substances enter the environment.
However integrated technologies that aim to avoid pollution from the outset have gained in importance. Integrated technologies involve a shift towards production processes that have a less negative impact on the environment. The challenges for the environmental industry show an ongoing dynamic in terms of a changing focus on end of pipe technologies to a larger relevance of integrated technologies.
Apart from the relevance of the environmental technologies industry with respect to solving environmental problems it can be a key economic factor in terms of employment potential, competitiveness and innovative strength.
The subject was taken up by the European Commission. Through the implementation of the Environmental Technologies Action Plan1 (ETAP), the European Union aims to support the growth potential of the environmental technology industry and to actively contribute to the development and diffusion of clean technologies. With its initiative, the European Commission intends to strengthen the environmental sector’s potential contribution to the Lisbon strategy, thereby combining environmental policy topics with broader European policy strategies. The ETAP aims to guide innovative capacity and technological change into a direction that establishes economic structures that put less pressure on the environment, while at the same time strengthening Europe’s competitiveness.
1 European Commission, 2004.

– 3 –
As mentioned before the environmental technology industry is a typical cross-cutting sector, which cannot be identified in conventional economic statistics. Any estimates of its dynamics concerning growth and employment potential as well as production structure are thus rather difficult to make. The market for environmental goods and services therefore consists of enterprises with a large variety of economic activities and technological competences. An evaluation of the success of the ETAP in terms of its contribution to a broader EU policy strategy is thus rather difficult.
Supply-Demand Interactions in the Environmental Industry
Growth opportunities for the environmental industry largely depend on economic and environmental policies and socio-political factors that are essentially beyond the producers’ control. The macroeconomic importance of the sector is thus substantially shaped by exogenous factors. A key determinant identified in international studies and the WIFO studies is legislation. This interaction between the demand and supply side is illustrated in Figure 1.
Figure 1: Interaction between supply and demand side factors
Market potential R & D
Driving forces for demand
Supply side Demand side
Diffusion
Regulatory frameworkIncentives InformationAvailability
Driving forces
Source: Wifo.
The figure points at the important role that the policy framework exerts on the growth
potential of this sector.

– 4 –
Structure of the Environmental Industry
The sheer complexity of the environmental technology industry poses a challenge to the assessment of the specificities of individual production segments.
Disaggregation is necessary both for activities (end-of-pipe technologies, clean technologies and M&C technologies) and the environmental media (air, water, waste, energy, soil, noise, traffic). The following Fig. 2 gives a graphical illustration of the structure of the environment industry. Considering that many companies produce technologies for several media and offer end-of-pipe as well as clean technologies, it would be necessary to break down the economic data by these characteristics in order to obtain an exact analysis of each sub sector. The empirical assessment of this industry is thus rather difficult.
Figure 2: Structure of the environmental industry
Environmental technologies
End-of-pipetechnologies
AirEnergyWaterWaste
.....
Cleantechnologies
AirEnergyWaterWaste
.....
Materialefficiency
Energy efficiency
Substitution of environmental
harmful substances
Recycling
M&C technologies & environmental monitoring
AirEnergyWaterWaste
.....
…..
Source: Wifo.
Evidence on the Austrian environmental industry
Fig. 3 illustrates the growth of the Austrian environmental technology industry in the period from 1993 to 2003 based on survey data from producers of environmental technologies. Due to a shortage of data, no estimates are available for exports in 1993. The figure clearly demonstrates the positive development experienced by this sector. Yet it must be pointed out that both turnover and export figures are shown on a nominal basis. Still, the rise does not just concern the turnover and export volumes;

– 5 –
employment figures similarly show a clear upward trend across time. Shifts can be found in the importance of production segments within the Austrian environmental technology industry (activities and environmental sectors), but there was overall steady growth.
Fig. 3: Development of the Austrian environmental technology industry
1993 1997 2003
Average year to year percentage change
1993 - 2003
Turnover, bn € (nominal) 1,53 2,47 3,78 +9,5
Exports, bn € (nominal) - 1,45 2,45 -
Employment figures 11.000 15.000 17.200 +4,6
Firms 248 315 331 +2,9
Source: WIFO surveys 1995, 2000, 2005, − estimate.
The absolute numbers do not indicate the position of the environmental industry within the economy. Figure 4 therefore shows the importance of the Austrian environmental technology industry relative to total manufacturing and in terms of its contribution to GDP. In the decade between 1993 and 2003, the importance of the environmental technology industry constantly increased. In 1993, its share of manufacturing turnover had reached 2.1 percent, by 1997 it had risen to 2.9 percent, and by 2003 it had added another 0.8 percentage points to reach 3.7 percent. In terms of employment, the environmental technology industry held a share of 2 percent in 1993, which it increased by almost one percentage point by 1997. By 2003, its share of manufacturing employment was 3.3 percent.
The situation is similarly positive when it comes to the environmental technology industry's contribution to GDP. Its share of nominal GDP was 1 percent in 1993, rose to 1.4 percent by 1997, and reached 1.7 percent by 2003. To summarise, it can be stated that environmental technologies are a genuine growth sector.
For 2003, turnover figures for the environmental technology industry were comparable to the NACE two-digit sectors "publishing, printing and reproduction" and "rubber and plastics products".
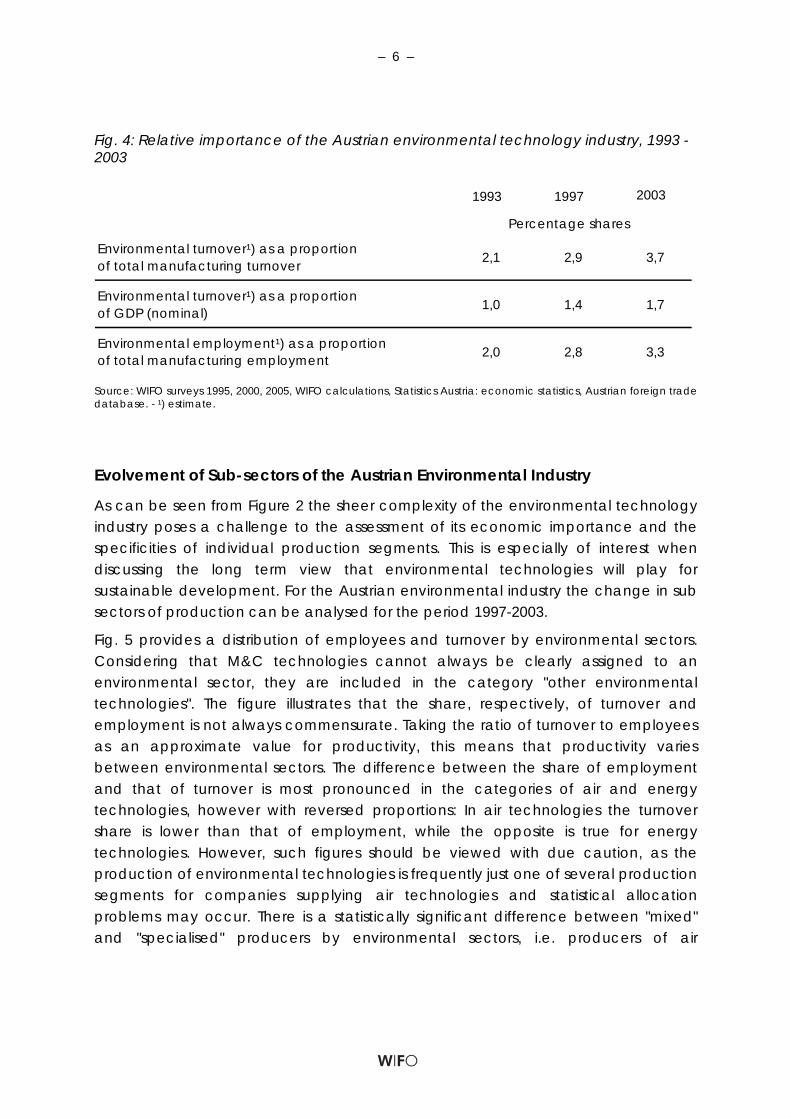
– 6 –
Fig. 4: Relative importance of the Austrian environmental technology industry, 1993 - 2003
1993 1997 2003
Environmental turnover¹) as a proportion of total manufacturing turnover
2,1 2,9 3,7
Environmental turnover¹) as a proportion of GDP (nominal)
1,0 1,4 1,7
Environmental employment¹) as a proportion of total manufacturing employment
2,0 2,8 3,3
Percentage shares
Source: WIFO surveys 1995, 2000, 2005, WIFO calculations, Statistics Austria: economic statistics, Austrian foreign trade database. - ¹) estimate.
Evolvement of Sub-sectors of the Austrian Environmental Industry
As can be seen from Figure 2 the sheer complexity of the environmental technology industry poses a challenge to the assessment of its economic importance and the specificities of individual production segments. This is especially of interest when discussing the long term view that environmental technologies will play for sustainable development. For the Austrian environmental industry the change in sub sectors of production can be analysed for the period 1997-2003.
Fig. 5 provides a distribution of employees and turnover by environmental sectors. Considering that M&C technologies cannot always be clearly assigned to an environmental sector, they are included in the category "other environmental technologies". The figure illustrates that the share, respectively, of turnover and employment is not always commensurate. Taking the ratio of turnover to employees as an approximate value for productivity, this means that productivity varies between environmental sectors. The difference between the share of employment and that of turnover is most pronounced in the categories of air and energy technologies, however with reversed proportions: In air technologies the turnover share is lower than that of employment, while the opposite is true for energy technologies. However, such figures should be viewed with due caution, as the production of environmental technologies is frequently just one of several production segments for companies supplying air technologies and statistical allocation problems may occur. There is a statistically significant difference between "mixed" and "specialised" producers by environmental sectors, i.e. producers of air
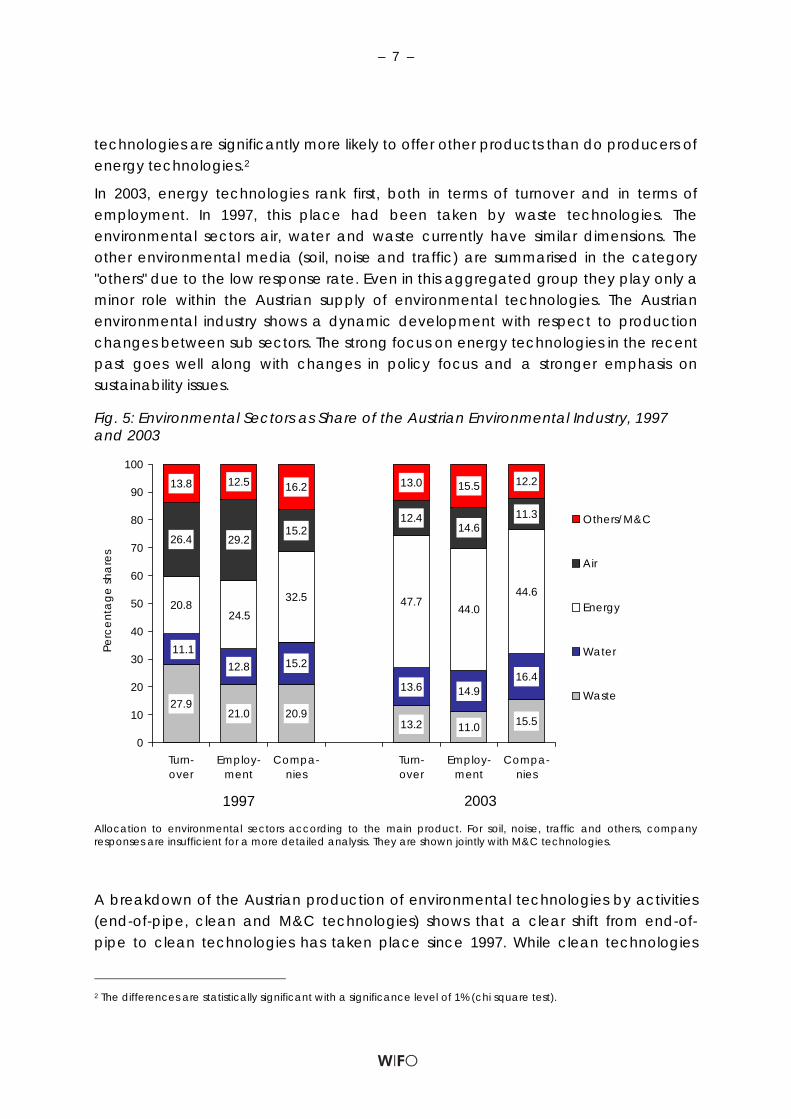
– 7 –
technologies are significantly more likely to offer other products than do producers of energy technologies.2
In 2003, energy technologies rank first, both in terms of turnover and in terms of employment. In 1997, this place had been taken by waste technologies. The environmental sectors air, water and waste currently have similar dimensions. The other environmental media (soil, noise and traffic) are summarised in the category "others" due to the low response rate. Even in this aggregated group they play only a minor role within the Austrian supply of environmental technologies. The Austrian environmental industry shows a dynamic development with respect to production changes between sub sectors. The strong focus on energy technologies in the recent past goes well along with changes in policy focus and a stronger emphasis on sustainability issues.
Fig. 5: Environmental Sectors as Share of the Austrian Environmental Industry, 1997 and 2003
27.921.0 20.9
13.2 11.0 15.5
12.8 15.2
13.6 14.916.4
32.5 47.744.0
44.6
26.4 29.215.2
12.414.6
11.3
13.8 12.5 16.2 13.0 15.5 12.2
11.1
20.824.5
0
10
20
30
40
50
60
70
80
90
100
Turn-over
Employ-ment
Compa-nies
Turn-over
Employ-ment
Compa-nies
Pe
rce
nta
ge
sh
are
s
Others/M&C
Air
Energy
Water
Waste
1997 2003 Allocation to environmental sectors according to the main product. For soil, noise, traffic and others, company responses are insufficient for a more detailed analysis. They are shown jointly with M&C technologies.
A breakdown of the Austrian production of environmental technologies by activities (end-of-pipe, clean and M&C technologies) shows that a clear shift from end-of-pipe to clean technologies has taken place since 1997. While clean technologies
2 The differences are statistically significant with a significance level of 1% (chi square test).

– 8 –
generated 48.6 percent of the turnover in 1997, this figure was up to 54.2 percent in 2003, largely due to an increase in the supply of clean energy technologies.
Integrated technologies play a prominent role within the Austrian environmental technology industry. In the integrated technologies segment, clean energy technologies are the most significant, contributing an estimated € 1.8 billion to turnover in the environmental technology industry and employing almost 7,500 people.
The largest segment is that of cogeneration plants/systems engineering which contributes slightly over 40 percent to the turnover of clean energy technologies and over a third to employment (Fig. 6). Biomass plants rank second in importance within the energy technologies sector, followed by technologies for the generation of hydropower. Solar technologies add 8 percent to the turnover of energy technologies. Interestingly, some production segments show considerable variations in their turnover and employment shares, i.e. the ratio of turnover to employment varies strongly within the energy technologies segment.
Fig. 6: Austrian Clean Energy Technology Production Segment
0
5
10
15
20
25
30
35
40
45
50
Cogenerationplants, systems
engineering(plant
optimisation)
Biomass plants Hydropower,other energytechnologies
Solartechnologies
Photovoltaics Heat pumps Biogas plants
Perc
en
tag
e s
ha
res
Turnover
Employees
Companies are assigned by their main product. Other energy technologies: wind power, bio diesel, geothermal systems − estimate.

– 9 –
Conclusions and framework for future development
Shifts in environmental issues and an increasing internationalisation and globalisation of the environmental industry changed the framework in which producers of environmental technologies act. This also is expressed in an increased competitive pressure in this sector.
The growth potential of the environmental industry is to a large extent dependent on external factors like legislation. The legal framework shapes not only the size of the environmental market but also the structure of the environmental industry. A stronger focus on sustainability issues as well as climate change and energy supply and demand fosters the demand for clean technologies.
The Austrian environmental technology industry demonstrates a shift between sectors of activities and environmental sectors. Over time, the integrated technologies sector has gained in importance compared to end-of-pipe technologies. In particular, clean energy technologies have gained considerable weight within the range of Austrian environmental technologies. The structural shift towards integrated technologies and clean energy technologies indicates that Austrian producers of environmental technologies have caught on to key topics of recent years: climate change, activities in connection with sustainable development and the aim to raise the proportion of electricity generated from renewables on both the national and EU level.
When it comes to international competitiveness in trading environmental technologies, Austria presents a differentiated picture. Rising globalisation in this sector is also increasing competition for domestic producers both abroad and at home. This requires an active strategy for internationalisation. In order to access new markets in a globalised environmental industry and identify new opportunities for exports, government assistance is of critical importance. This need was highlighted by an analysis of export barriers for Austrian producers. Young and/or small enterprises in particular find the information and transaction costs associated with developing new markets to be very high. Public sector activities to reduce such costs will improve the opportunities for domestic companies to succeed against international competition. With its export and internationalisation strategy, Austria has taken key steps forward. For a medium-term strategy it is necessary to evaluate the support measures so as to ensure their benefit for domestic technology producers.
The example of the Austrian environmental industry shows that this sector can contribute positively to overall economic goals like growth and employment. In order to be successful producers of environmental technologies need to be flexible in order to react to a changing environmental policy framework that is driving

– 10 –
demand. Integrated technologies are especially important with respect to the precautionary principle and medium and long term sustainability issues.
References
Brundtland Bericht, Gro Harlem, World Commission on Environment and Development, Our Common Future, Oxford
University Press, Oxford, 1987.
Europäische Kommission, (2004A), Environmental Technologies Action Plan (ETAP), Simulation von Technologien für nachhaltige Entwicklung: Ein Aktionsplan für Umwelttechnologie in der Europäischen Union, KOM(2004)38 endgültig, Brüssel, 2004.
Köppl, A., Österreichische Umwelttechnikindustrie, Studie des WIFO im Auftrag des Bundesministeriums für wirtschaft-liche Angelegenheiten, Wien, 2000.
Köppl, A., Österreichische Umwelttechnikindustrie, Branchenanalyse, Studie des WIFO im Auftrag des Bundesministe-riums für Land- und Forstwirtschaft, Umwelt und Wasserwirtschaft und der Wirtschaftskammer Österreich mit Unterstützung des Dachverbands Energie - Klima und des Bundesministeriums für Wirtschaft und Arbeit, Wien, 2005.
Köppl, A., Pichl, C., Wachstumsmarkt Umwelttechnologien. Österreichisches Angebotsprofil, Studie des WIFO im Auf-trag des Bundesministeriums für wirtschaftliche Angelegenheiten, Wien, 1995.
FORESCENE Workshop Thematic Field: “Industry/Economy“ Vienna 23. – 24.10.2006
Resource efficient transport Michael Lettenmeier, Finnish Association for Nature Conservation Viitailantie 11, FIN-17430 Kurhila, +358 40 54 12 876, [email protected]
1 Abstract This paper discusses targets, scenario elements and instruments for an
improvement in the resource efficiency of transport. Basis for the discussion are the results of the FIN-MIPS Transport research project that had produced data on the life cycle wide resource consumption of Finnish road, rail, air, maritime and local transport as well as the complete Finnish transport system.
There is a diference in the potential reduction of resource consumption in the different categories for material input, i.e. abiotic resources, water and air. The contribution of infrastructure to the MIPS values for abiotic resources and water consumption were significant. Thus, improvements require new approaches in the planning and use of infrastructure. Regarding the material input for air consumption (mainly combusted oxygene), a reduction of energy comsumption is most relevant.
The paper also presents case studies on the possible reduction of resource use illustrating the differences between alternative ways of transport in different categories of material input. Relevant means for decreasing the materials intensity and the resource consumption of transport are the provision of a scaled-down and resource-efficient infrastructure, a decrease in the amount of traffic, an increase in the ridership of vehicles and the choices between alternative means of transport.
2 Introduction As transport services are part of the life cycle of any product or activity,
the material intensity of transport services is one central aspect in the life cycle of any product or activity as well as in terms of the sustainability of modern societies. The need for a large dematerialisation of the whole society has been stated e.g. by Schmidt-Bleek (1993) and recently e.g. by Meadows et al. (2004). As a large dematerialisation of society (factor 10) is a prerequisite for achieving a sustainable society and way of life, the traffic system must also be dematerialised.
The FIN-MIPS Transport research project was established in order to provide material input data for MIPS calculations made by Finnish companies and other institutions. Other objectives were to study the contribution of transport to the overall natural resource use in Finland and to

2 consider potentials for increasing eco-efficiency and decreasing resource use.
In this paper, the results of the FIN-MIPS Transport project are presented and discussed in the light of the FORESCENE-project.
3 Scope and methodology of the FIN-MIPS Transport research
The research project covered the Finnish transport system, including road, rail, bicycle, air, and maritime transport. MIPS values were calculated for the consumption of abiotic resources, water and air. In the first stage, the material intensity of the different transport modes was investigated based on case studies for typical parts of the infrastructure (see Vihermaa et al., 2006; Saari et al., 2006; Nieminen et al., 2005; Lindqvist et al., 2005; Hänninen et al., 2005).
In co-operation with the infrastructure authorities and transport companies involved, the data obtained from the case studies was then generalised to average Finnish conditions by assumptions made on, e.g., the average service life of infrastructure and vehicles, the average amounts of traffic on different infrastructures, and the average ridership (Lähteenoja et al., 2006).
The MIPS values for transport include the life cycle wide material input of infrastructure and means of transport. This material input is divided by the service obtained, i.e. the amount of transport, expressed in passenger kilometres and tonne kilometres. The calculation of MIPS values for transport required the allocation of the material input of the infrastructure between passenger and goods traffic, both using the same infrastructure (see Vihermaa et al., 2006; Saari et al., 2006; Lähteenoja et al., 2006).
4 Material intensity of the Finnish transport system The average material intensity of passenger transport within Finland is
shown in Table 1. Table 2 shows the average material intensity of goods transport within Finland.
Table 1. Average MIPS values for domestic passenger transport in Finland (km / passenger kilometre).
Means of transport Abiotic Water Air Private car 1.44 12.4 0.14
Van 2.16 20.0 0.28
Bicycle 0.38 12.1 0.02
Bus 0.32 2.8 0.06
Train 1.37 29.3 0.04
Metro 0.29 29.4 0.04
Tramway 0.66 48.1 0.07
Aircraft 0.56 26.6 0.28

3
Table 2. Average MIPS values for domestic freight transport in Finland (kg / tonne kilometre).
Means of transport Abiotic Water Air Van 10.78 100.2 1.39
Light lorry 0.58 5.0 0.07
Semi trailer lorry 0.44 3.8 0.07
Full trailer lorry 0.23 1.7 0.04
Average road transport 0.52 4.4 0.09
Avg road transport without van 0.37 3.1 0.07
Train 0.54 15.3 0.02
Aircraft 5.60 266.5 2.80
According to the methodology and assumptions of the study, the Finnish
transport system consumes a total of approximately 130 million tonnes of abiotic natural resources (Table 3), 1.46 billion tonnes of water, and 16.3 million tonnes of air, per year. Per capita this amounts to 25 tonnes of abiotic natural resources (Table 3), 280 tonnes of water, and 3 tonnes of air, per year. Based on the methods used, 72% of the abiotic natural resource consumption by the transport system is attributable to passenger traffic and 28% to goods traffic.
Table 3. Average amount and division of the abiotic natural resource consumption by the Finnish transport system in one year.
Mode of transport
Infra (mill. t)
Traffic (mill. t)
Total (mill. t)
Per capita (t)
Public roads 84.52 5.70 90.22 17.3
Private roads 10.93 0.16 11.09 2.1
Municipal streets 9.18 2.78 11.96 2.3
Cycling 0.43 0.06 0.49 0.1
Rail 4.62 0.67 5.29 1.0
Air 0.91 0.34 1.24 0.2
Maritime 8.56 1.56 10.11 1.9
Total 119 11 130 25.0
A significant percentage of abiotic natural resource consumption by the
transport system comes from infrastructure provision. The abiotic natural resource consumption primarily reveals the amount of earthworks and construction undertaken on behalf of the traffic.
The abiotic natural resource consumption is equivalent to around 25% of Finland’s Total Material Requirement (TMR). This high figure is influenced by the fact that the previously constructed infrastructure is evenly applied across all the years of use. The amount of transport infrastructure construction nowadays is, however, less than one might think from the average figures calculated in this study.
The most important factors regarding water consumption are rainwater diverted from its normal route, and electricity consumption. With air consumption, approximately 90% was due to energy consumption.

4 5 Resource efficient transport – where to go?
According to Gudmundsson and Nielsen (1999), the consumption of solid (equivalent to abiotic) materials during the life cycle of passenger car transport in Denmark could at best be reduced by factor 4 by 2050 and the carbon dioxide emissions (equivalent in principle to air consumption) by factor 8. The FIN-MIPS Transport study shows that similar reductions in resource use are in principle possible also in Finland although requiring remarkable efforts. This section addresses and explaines some central targets in order to achievde a resource efficient transport system.
5.1 Infrastructure: efficiency instead of growth According to the methodology and assumptions of the study, the Finnish
transport system consumes a total of approximately 130 million tonnes of abiotic natural resources (Table 3), 1.46 billion tonnes of water, and 16.3 million tonnes of air, per year. Per capita this amounts to 25 tonnes of abiotic natural resources, 280 tonnes of water, and 3 tonnes of air, per year. Based on the methods used, 72% of the abiotic natural resource consumption by the transport system is attributable to passenger traffic and 28% to goods traffic.
The material input from infrastructure dominates abiotic resource and water consumption of domestic transport. With abiotic resource consumption, the share of infrastructure varies between 73% for air transport and 99% for private roads (see Table 3). Air transport has a limited need for infrastructure and a relatively high resource consumption during the period of use of aircraft whereas private roads form a widely spread and relatively heavy infrastructure with only small amounts of vehicles using them.
Most of the material input for infrastructure is attributable to the construction of infrastructure, which causes huge direct shifts of material. The use of material from quarrying or excavating at the construction site reduces the need for importing soil and stone materials. Another way of enhancing the eco-efficiency of infrastructure construction is to replace new building materials by waste raw materials or by surplus materials imported from elsewhere. Also imported recycled materials or by-products can decrease the material input.
Straight road and rail lines demanded by fast transport connections do not leave much chance of avoiding terrain that is unfavourable from the construction standpoint. This increases the demand for cuttings and soil stabilisation, so that abiotic resource consumption per route kilometre rises. Infrastructure planning can appreciably influence the material intensity of the infrastructure built.
The construction of new infrastructure increases the overall consumption of natural resources far more than does the maintenance of existing roads and railways. If increasing rail traffic calls for additional construction of rail infrastructure, the abiotic natural resource consumption may increase, because modern two-track lines are material intensive. If, however, road investments of equivalent capacity are avoided, lower amounts of natural resources will be consumed by the rail investment.
Rather than building new roads and railways, the capacity of existing ones should be uprated by, for example, ways of improvement having lower materials intensity. These ways could include, for instance, developing traffic arrangements at road junctions, constructing or designating overtaking lanes, diverting traffic to a parallel road, or by investing in traffic control systems.

5
In addition to an increase in the capacity use of infrastructure, an increase in the service life of the infrastructure could be seen as a major contributor to decreasing the material input per unit service in transport. In the FIN-MIPS Transport research, the service life of the infrastructure was estimated in close co-operation with the responsible authorities. On short distance flights, for instance, the reduction of the presumed service life of the airside infrastructure of airports from 100 to 50 years would increase the abiotic MIPS values of short distance flights 38 – 65% whereas the values for water and air consumption remain nearly constant (Nieminen et al., 2005). Similar observations were made when varying the service life for harbours (Lindqvist et al., 2005) and bicycle lanes (Hakkarainen et al., 2005).
Especially with abiotic resource use, an increase in the service life of the infrastructure would be necessary for cutting down the high share of the infrastructure in the MIPS values for transport.
5.2 Capacity use: large potentials The capacity use of infrastructure has a huge influence on the MIPS
values. The abiotic MIPS value for travelling by car on a motorway is lower by a factor of 3 than on a lower class connecting road, although the abiotic material input per kilometre of road exceeds the MI of the connecting road by a factor of 20. This is due to the fact that the average daily traffic on motorways is 63 times higher than on connecting roads. For water consumption, the differences between the road categories are even bigger, but for air consumption they are considerably smaller.
Similar observations can be made for other modes of transport. For bicycle travel, there is a factor 2.1 difference in abiotic MIPS and a factor 1.6 difference in water consumption between an average bicycle lane in Finland and in Helsinki, the latter having smaller values because of higher traffic density (Talja et al., 2006). Travelling on a single-tracked railway used by 50,000 passengers per year exceeds the MIPS values for a similar track used by 5 million passengers per year by factor 9 – 64, depending on the category of resources. MIPS values for air travel from Helsinki to low frequency airports at a similar distance can be even 4 times higher than for travelling to similar but higher frequency airports.
Also the capacity use of the means of transport plays a relevant role in the dematerialisation of transport. Despite its shorter distance, a transeuropean charter flight consumes less abiotic resources and air per passenger kilometre than an intercontinental flight because the aircraft’s capacity use (76% instead of 57%) is higher (Nieminen et al., 2005). Travelling in a van causes high resource consumption per passenger kilometre (Table 1) because there is usually only 1 person travelling in a van instead of an average of 1.4 persons in a car. With goods transportation, an average of only 200 kg is transported in a van whereas lorries carry an average of 7 tonnes at least, which leads to deliberately lower MIPS values (Table 2). Transporting by full trailer lorries consumes fewer resources than transporting by lighter lorries (Table 2) because full trailer lorries transport on average 2 or 3 times more freight than lighter lorries, while the difference in material input remains lower.
If two people travel to work in the same car instead of both using their own, in principle the consumption of natural resources by the journey is halved. If travelling together leads to extra driving, the savings are reduced, although they will most likely not entirely disappear altogether.

6
The results of the study were also applied to the calculation of natural resource consumption by four case consignments of TNT Finland Ltd. (Table 4). The results for the different consignments were converted to consumption per tonne kilometre. Even in long haul goods transportation, a significant proportion of natural resources are consumed at the start and end of journeys in conjunction with goods collection and delivery. Therefore, special attention should be devoted to improving the efficiency of goods collection and delivery journeys.
Table 4. Natural resource consumption of case consignments (kg/tonne km)
Route
Collection and distribution, km
Main route, km
Means of transport
Abiotic
Water
Air
Turku-Rauma 190 –– Van + Lorry 9 54 1.3
Tuusula-Nurmes 196 617 Van + Lorry 0.7 6.5 0.09 Järvenpää-Mannheim 42 2020 Van + Aircraft 1.1 49 0.5
Kotka-Bremen 172 1642 Lorry + Ferry 0.2 0.84 0.02
5.3 Factor 10 awareness as a basis for daily choices Through his or her daily choices everybody can promote a reduction in
natural resource consumption by opting for the most eco-efficient alternative among the available means of travel and by keeping the travel performance as small as possible. The following examples highlight the relevance and the limits of daily choices.
Travelling by bus uses up abiotic natural resources and water to a far less extent than rail traffic. Air consumption is, however, higher (Table 1). A commuter’s work trip within the Helsinki Metropolitan Area, with a length of approximately 18 km was examined for six modes of travel (Table 5). Between the different options, there are differences by a factor of 9 – 43 depending on the category of resources. From the standpoint of abiotic resource and air consumption the passenger car is far and away the worst alternative.
Table 5. Natural resource consumption of a work trip (Espoo-Helsinki) per person using different modes of transport (kg/journey).
Modes of transport Abiotic Water Air Passenger car 25,5 228 3,6
Bus 3,2 13 1,1
Bicycle 2,7 111 0,2
Metro 5,6 560 0,9
Bus + tram 5,4 346 1,2
Bus + metro 4,2 128 1,0
Consuming 3 to 26 kg of abiotic resources, the resource use of one work
trip may appear small. However, since the trip is made twice a day, 220 days a year, the values and their differences have to be taken seriously. Work trips made by the passenger car in the example consume 11.2 tonnes of abiotic natural resources a year. Travelling by bus uses up by a factor of 8 less. A

7 work trip of sufficient length, especially one made by passenger car, may thus well double a citizen’s total natural resource consumption.
When travelling from Helsinki to St. Petersburg, five different modes of transport can be used (Table 6). There are differences between the least and the most consuming travel modes of factors of 8 – 18 for the different categories of resources. From the overall point of view, the best option would appear to be the coach.
Table 6. Natural resource consumption per person on the Helsinki to St. Petersburg route, kg/journey
Modes of transport Abiotic Water Air Passenger car 794 7990 75
Coach 128 1116 24
Train 568 8089 10
Passenger car ferry 96 895 115
Jet 111 895 177
Based on the basic results of the FIN-MIPS Transport research it was
calculated how much transporting a letter in Finland consumes natural resources. On average, transporting a letter consumes 190 g of abiotic natural resources, 7.8 kg of water, and 34 g of air. Transporting a letter to a letterbox by passenger car over a one-way distance of 1 kilometre multiples the consumption of resources by factors of 5 – 21, depending on the category of resources.
Similar phenomena have also been observed in the energy consumption of infrastructure changes in the retail trade (Kasanen & Savolainen, 1992): drivers’ journeys by passenger car are a more significant factor than trade logistics lorries, so that the increased passenger car journeys by consumers when a shop closes down clearly exceed the energy savings made by the cooperative business by closing the shop. Consequently, ways of shopping and distribution (e.g. e-commerce and home delivery) that reduce the need to drive promote dematerialisation.
There are also limits to the consumers’ choice. For instance, a consumer cannot choose a non-existent service. For instance, on the Helsinki to St. Petersburg route the consumer cannot choose the car ferry, as this service is not offered at present. With existing services, there are usually factors other than material intensity influencing the consumers’ choice, e.g. prices, speed and service availability. The coach is a resource-efficient, but time-consuming option so that the consumer might make a choice based on other criteria.
Thus, the responsibility for the dematerialisation of transport cannot be laid solely on the consumer, but one has to consider the circumstances and structures shaping and influencing the transport system, within which the consumer has to make choices.
E.g. the distance of the service available is relevant. It is one important factor influencing the possibilities and the need for the choice of transport mode. If, for instance, schools in rural areas are closed down, the distances grow and this may affect additional transportation if walking or cycling becomes impossible. Transporting a letter to a letterbox by passenger car multiples the consumption of natural resources for sending a letter severalfold. Thus, keeping the collection network for letters sufficiently dense conserves natural resources.

8
From a sustainability point of view, it’s important to provide the possibility for sustainable choices. Thus, planners and political decision-makers are in a crucial position also in terms of daily choices. E.g. the promotion of car-free lifestyles should be the basis of city planning in order to avoid an ever-growing material intensity of the transport system.
E.g. carfree quarters can reduce infrastructure materials input in two ways. The number of streets is less than normal, since the number of roads leading to properties decreases. Roads leading directly to residential properties are lighter in construction and materials intensity, but they are numerically greater thus consuming big amount of resources (Talja et al., 2006). Secondly, devehicularisation makes the construction of narrower and lighter traffic routes than normal possible, for example within residential areas based on apartment buildings. In addition, devehicularisation may promote the use of other forms of transport to the passenger car, which consumes the most natural resources. For example, in Austria the arrangement of parking outside apartment block areas has been found to improve the profitability of public transport and to reduce traffic performance, i.e. journey length and quantity (Knoflacher 2004).
5.4 A new transport culture – slowness and sufficiency Increasing speed is usually considered desirable and useful. However,
numerous results of the FIN-MIPS Transport research indicate that speeding up traffic increases natural resource consumption in the form of energy consumption and/or infrastructure material inputs. Thus, decisions by consumers and planners to prefer lower speed transport modes would save resources.
For example, the straight road and rail lines demanded by fast transport connections do not leave much chance of avoiding terrain that is unfavourable from the construction standpoint, so that natural resource consumption per route kilometre rises. Additionally, speed easily increases travelling and/or the length of journeys and thus the traffic and its natural resource consumption as a whole.
In maritime transport the express boat consumes considerably more natural resources than the slower passenger car ferry.
In goods transport fast transportation by air is much more consumptive than other modes of transport (see Table 2). An express delivery taken from Järvenpää to Mannheim by air in one night consumed more resources per tonne kilometre than a consignment from Kotka to Bremen taken by road, mainly using a semi-trailer lorry (Table 4). The difference was a factor of 5.5 – 58, depending on the category of resources. By making the Kotka-Vantaa collecting route section more efficient the difference between air and land transportation would even increase.
In general, speed easily increases travelling and/or the length of journeys and thus the traffic and its natural resource consumption as a whole. In addition, new and faster roads also tend to increase, rather than decrease, the amount of traffic (e.g. Tapio 2002), which again raises the total use of natural resources.
From the relatively low MIPS values for busy routes, one may gain the impression that by increasing the amount of traffic, i.e. the service unit, on existing routes we could decrease the MIPS values and increase eco-efficiency. This does not, however, mean a reduction in natural resource

9 consumption as a whole. From the environmental aspect, it is the total consumption and not the relative MIPS values that is of relevance. Higher eco-efficiency, in other words a lower MIPS value, is not the same as less consumption of natural resources. This reinforces the viewpoint that in addition to eco-efficiency we must also aim for sufficiency.
Eco-efficiency is increased by e.g. the choice of vehicle based on the MIPS values, and an increase in the use of the vehicle or the infrastructure. In both cases, the natural resource consumption in relation to the performance falls. Sufficiency is promoted by endeavours to reduce the transport performance, so that the consequence is a reduction in the overall consumption.
Reducing the total consumption of natural resources by transport is only possible if the growth in traffic performances ceases. Predictions on traffic performance growth increase the pressure to construct new roads, which increases abiotic natural resource and water consumption, as well as the traffic performance when new and better roads are introduced. According to Tapio (2002), there is a self-perpetuating connection between traffic predictions and performances, which is difficult to break without effective intervention measures.
In the light of the results of the study, natural resource consumption by traffic is appreciable, for example in relation to Finland’s Total Material Requirement. Reducing the overall consumption would require a reduction in the amount of traffic performance. This can, despite the potentials observed in this study, in the present situation be regarded as a challenge, since the amount of traffic has been steadily growing for decades, almost without even a temporary decline. In Finland, for instance, passenger traffic increased more than 5-fold and goods transport nearly 4-fold from 1960 to 2005 (Finnish Road Administration, 2006).
Also air travel appears to be rather a problem of sufficiency than of efficiency. In Finland, for instance, it is not possible to leave for weekend shopping visits to Central Europe by car, but it is possible by air and this is becoming increasingly popular. Air transport increases natural resource consumption in the form of increasing performances, despite being relatively eco-efficient per person kilometre in mode of transport comparisons (see Table 1).
6 Key scenario elements Based on the results and reflections above, the following elements should
be considered relevant in terms of scenario building.
6.1 Amount and resource consumption of infrastructure The amount of and the absolute and relative resource consumption by
infrastructure is a central point in terms of resource efficient transport. With an increasing total and specific resource consumption of transport infrastructure so far, this aspect is also related to the other parts of this stage of the FORESCENE project (e.g. landscape or infrastructure).
The material intensity of the Finnish transport system cannot be considered a desirable goal for other countries. An average share of 25 % and a total amount of 25 tonnes per capita of the total material requirement cannot be considered sustainable.
10
Even if the material intensive transport system is regarded as merely the result of than the reason for an unsustainable way of life and society, the situation can be considered disturbing. Since the abiotic natural resource consumption of the community’s “support activity” is responsible for one quarter of the total consumption of abiotic resources, it may be that our society is on the way towards “The tower of Babel” (Van Dieren 2005), at which the society will suffocate and collapse in the constantly escalating need for resources called for by growth maintenance.
From this perspective, central and eastern European as well as developing counties should seek for ways of leap-frogging towards less material-intensive economies without immitating the unsustainable transport systems and other way of life of industrialised western countries.
6.2 Amount and resource consumption of traffic performance
In addition to the amount of infrastructure, also the amount of traffic performance is crucial in terms of sustainability. Reducing the total consumption of natural resources by transport is only possible if the growth in traffic performance ceases.
Increases in the relevant eco-efficiency by a, for instance, lower energy consumption will not be sufficient in terms of overall sustainability. The modal split of transport is one interesting aspect, but from the viewpoint of total resource consumption there is no single transport mode above all the other modes in all categories of natural resources (see Tables 1 and 2). Thus, for instance a general shift from road and air transport to rail and water transport cannot ensure that problems are not just shifted from one aspect to another. Hence, there should be given special attention to the overall amount and resource consumption of traffic performance.
6.3 Energy consumption Energy consumption is a central aspect of transport also on the basis of
the MIPS concept. The air consumption of different transport modes is mostly related to the fuel or electricity use of the means of transport. The reduction of the energy use by transport is thus a relevant target. However, decreasing energy, i.e. – according to the MIPS concept – air consumption, should not affect increases in other categories of resources.
E.g. the hybrid car (a combination of internal combustion engine and electric motor) saves fuel but requires fitting with an electric motor containing a lot of copper (which has a high abiotic material intensity). While it is fair to assume a decline in air consumption by this kind of engine, owing to the increased use of copper the overall abiotic natural resource consumption is unlikely to decrease.
The contribution of fuel consumption to abiotic natural resource consumption of vehicle transport as a whole is of the order of five percent (see Figure 1). By using biofuels, this proportion could be lowered. However, if the biomass for biofuels had to be cultivated for fuel use, it would also become necessary to examine this form of biotic natural resource use. The abiotic material inputs in biomass cultivation would also have to be considered.
Hence, energy use of transport should be one, but not the only aspect in terms of sustainability scenarios.

11
7 Key instruments and measures Applying the MIPS methodology to the traffic system brings a new
perspective to the discussion on the environmental impact and eco-efficiency of traffic. The most important new aspect concerns taking abiotic natural resource consumption into account. Another strongpoint of the MIPS method is its simplicity: products and services differing from each other can be made comparable on the basis of kilograms of resources.
Reducing the total consumption of natural resources by transport is only possible if the growth in traffic performances ceases. The FIN-MIPS Transport study shows that appreciable reductions in resource use are in principle possible although requiring remarkable efforts. Efforts have to be done on different levels and by different actors viz. consumers, infrastructure and municipal planners, infrastructure administration, producers of equipment, providers of services, and last but not least local and national political decision-makers.
On a general level, key instruments for changes towards a society with low infrastructure, low traffic volumes and a new transport culture, appear to be pricing, planning and awareness-rising.
7.1 Influencing prices Influencing prices e.g. by means of taxation and subsidies can influence
the daily choice between different modes of transport. However, it can also have influence on the complete transport system. Aggregate taxes can lead to less material-intensive infrastructure construction. For a stop in infrastructure construction, incentives towards decreasing traffic amounts and more efficient capacity use should be created.
Pricing can also influence the quantity and quality of fuels or other energy sources in transport. However, changes in the quality of fuels have only a relatively small impact on the overall resource consumption.
The principle aim of pricing transport should be a reduction of traffic volumes. A reduced traffic volume would also reduce the need for additional infrastructure, which has turned out relevant in terms of resource consumption. Also a road pricing differentiated on the basis of infrastructure capacity (the higher the traffic performance the higher the price) could help to reduce pressure on infrastructure. Capacity use is a basic pricing element of airlines and some railway companies. Applied and functioning with vehicular traffic it might be a relevant incentive towards sustainability as vehicular traffic covers the greatest share of traffic performance.
7.2 Planning dematerialisation Traffic and municipal planning practices should be developed in order to
actively promote dematerialisation. The basis of future infrastructure planning should be, where necessary, an
increase in the efficiency of the use of existing infrastructure instead of an increase in the amount of infrastructure.
Like with traffic planning in general, the basis of municipal planning should be the promotion of car-free lifestyles and car-free areas. As car-free lifestyles mean also less material-intensive lifestyles and car-free areas need fewer and less material-intensive infrastructure, the relevance of municipal

12 planning is huge. Changes should be initiated urgently because urban structures are long lasting, so that visible and “livable” changes will happen slowly.
7.3 Awareness rising for dematerialisation Awareness rising is crucial not only in terms of daily choices. Awareness
has to be created and increased also with politicians, planners, media and other actors especially influencing the society with its structures and activities.
Not only should the awareness on the need and the means of dematerialisation be made part of all educational activities, but it should also be spread by public campaigns etc. In terms of transport this should also include the promotion of a new traffic culture orientated to the values of proximity, slowness and sufficiency.
References Finnish Road Administration (2006). Finnish Road Statistics 2005. Edita, Helsinki, Finland Gudmundsson, H. and Nielsen, T. (1999). Extended Summary of Reduction of Environmental
Pressure From Car Transport – Case Study of Eco-efficiency in the Danish Transport Sector. In Factor 4 and Factor 10 in the Nordic Countries – The Transport Sector – The Forest Sector – The Building and Real Estate Sector – The Food Supply Chain. TemaNord 1999:528. Nordic Council of Ministers, Copenhagen, Denmark.
Hakkarainen, E., Lettenmeier, M. & Saari, A. (2005): Polkupyöräliikenteen aiheuttama luonnonvarojen kulutus Suomessa (PyöräMIPS). [Bicycle MIPS – Natural Resource Consumption in Finnish Bicycle Traffic.] Liikenne- ja viestintäministeriön julkaisuja 55/2005. Ministry of Transport and Communications, Helsinki, Finland. Available from: <http://www.mintc.fi/julkaisut>
Hänninen, S., Hellén, S., Lettenmeier, M. & Autio, S. (2005). MateriaEuro – Luonnonvarojen käyttö Helsingin katujen rakentamisessa ja ylläpidossa. [MateriaEuro –Natural Resource Use in Street Construction and Maintenance in Helsinki]. Helsingin kaupungin rakennusviraston julkaisuja 1/2005. Public Works Department, City of Helsinki, Finland. Available from: <http://www.hkr.hel.fi/julkaisut/julkaisut2005.html>
Kasanen, P. & Savolainen, M. (1992). Jakelujärjestelmän ja kuluttajan roolin muutosten vaikutus energian kulutukseen. [Influence on the energy consumption of changes in the distribution system and in the role of consumers.] Helsingin yliopiston sosiaalipsykologian laitoksen energiajulkaisuja 7/1992. University of Helsinki, Finland.
Knoflacher, H. (2004). Roles of Measures in Changing Transport and Other Behaviour. In “Communicating Environmentally Sustainable Transport. The Role of Soft Measures”. OECD Publishing, Paris, France.
Lähteenoja, S., Lettenmeier, M. & Saari. A. (2006). LiikenneMIPS. Suomen liikennejärjestelmän luonnonvarojen kulutus. [Transport MIPS. The Natural Resource Consumption of the Finnish Transport System.] Suomen ympäristö / The Finnish Environment 820 (so far in Finnish, forthcoming also in English, www.ymparisto.fi/julkaisut). Edita, Helsinki, Finland
Lindqvist, A., Lettenmeier, M., Saari, A. (2005). Meriliikenteen aiheuttama luonnonvarojen kulutus (MeriMIPS). [Natural Resource Consumption in Maritime Transport (MaritimeMIPS)]. Liikenne- ja viestintäministeriön julkaisuja 58/2005. Ministry of Transport and Communications, Helsinki, Finland. Available from: <http://www.mintc.fi/julkaisut>
Mäenpää, I. (2005). Kansantalouden ainevirtatilinpito. Laskentamenetelmät ja käsitteet. Suomen ainetaseet 1999. [ Material Flow Balance Account of the National Economy.

13
Accounting methods and terms. Finnish Material Balance 1999] Statistics Finland and Thule-institute, Helsinki, Finlans
Meadows, D., Randers, J. & Meadows, D. (2004). Limits to Growth. The 30 Years Update. Chelsea Green Publishing Company, White River Junction, USA
Nieminen, A., Lettenmeier, M. & Saari, A. (2005). Luonnonvarojen kulutus Suomen lentoliikenteessä (LentoMIPS). [Natural Resource Consumption in Finnish Air Transport (Flying MIPS)]. Liikenne- ja viestintäministeriön julkaisuja 57/2005. Ministry of Transport and Communications, Helsinki, Finland. Available from: <http://www.mintc.fi/julkaisut>
Saari, A., Lettenmeier, M., Pusenius, K. & Hakkarainen, E. (2006). Influence of vehicle type and road category on the natural resource consumption in road transport. Transportation Research Part D. In press.
Schmidt-Bleek, F. (1993). Wieviel Umwelt braucht der Mensch? MIPS - Das Maß für ökologisches Wirtschaften. Birkhäuser, Berlin, Basel, Boston. In English: Schmidt-Bleek, F. (1993). The Fossil Makers – Factor 10 and more. Available from: <www.factor10-institute.org/seitenges/Pdf-Files.htm>
Talja, S., Lettenmeier, M. & Saari, A. (2006). Luonnonvarojen kulutus paikallisessa liikenteessä – Menetelmänä MIPS [Natural Resource Consumption of Local Transport According to the MIPS Concept]. Liikenne- ja viestintäministeriön julkaisuja 14/2006. . Ministry of Transport and Communications, Helsinki, Finland. Available from: <http://www.mintc.fi/julkaisut>
Tapio, P. (2002). The Limits to Traffic Volume Growth. The Content and Procedure of Administrative Futures Studies on Finnish Transport CO2 Policy. Acta future fennica no 8. Tulevaisuuden tutkimuksen seura, Turku, Finland
Van Dieren, W. (2005). The Limits to Growth and the Tower of Babel or How arts can tell a scientific story better. Presentation. Factor 10 –Symposion 25.11.2005. House of Design, Hällefors, Sweden.
Vihermaa, L., Lettenmeier, M. & Saari, A. (2006). Natural resource consumption in rail transport: A note analysing two Finnish railway lines. Transportation Research Part D 11: 227-232.

1
Sustainable consumption perspectives: progress or digress? Oksana Mont
International Institute for Industrial Environmental Economics at Lund University
P.O Box 196, Tegnersplatsen 4, SE-221 00 Lund, Sweden
Tel: +46 46 222 0250 Fax: +46 46 222 0230, E-mail: [email protected]
23-24 October 2006
FORESCENE workshop
Vienna
1 Sustainable consumption challenge The goal of reaching more sustainable ways of living requires significant changes in both production and consumption patterns. Production related environmental impacts have been addressed since late 1970s, while strategies for dealing with consumption related environmental impacts are still at the initial stage. Sustainable consumption is generally defined as the consumption of goods and services that meet basic needs and quality of life without jeopardizing the needs of future generations (OECD 2002). This broad definition includes not only consumption by private consumers, but also by institutions (businesses and organisations); not only consumption of resources (appropriation of resources from nature), but also final consumption (OECD 1997). One of the main problems is that increasing growth in consumption is putting strains on the environment.
Studies that focus on energy use and associated carbon dioxide emissions have found that approximately 70–80% of national energy use and greenhouse gas emissions may be related either to household activities directly or to activities required to deliver goods and services to households and to manage the waste flows generated by households (Moll, Noorman et al. 2005; Tukker, Huppes et al. 2005). Furthermore, an additional 10-12% is attributable (directly or indirectly) to the provision of public sector services. In many cases, direct and indirect impacts associated with consumption take place outside Europe. Direct impacts include emissions from resource extraction, transportation, product use and final disposal, while indirect come from the well-known challenge of applying Western lifestyles in the developing countries and by European exports to those countries.
So far the main strategies directed towards reducing environmental impacts of consumption focus on provision of information to consumers and on stimulating businesses to green their products. Despite the undertaken efforts, however, and due to increasing population and levels of affluence, aggregate environmental impacts and consumption of resources continue to increase. Therefore, it is important to analyse what strategies have been employed so far by various actors, what kind of barriers exist to radically changing current consumption patterns and what kind of measures can be undertaken to address these challenges.

2
2 Sustainable consumption endeavors of main stakeholders
2.1 SC and public sector Sustainable consumption can be exercised by the public sector in two ways: through development of policies for sustainable consumption and through incorporating sustainable consumption practices into own purchasing activities.
Policies for sustainable consumption can in their turn be divided into policies that directly affect consumers and policies that set institutional and especially infrastructural conditions that enable consumers to make environmentally and socially sound or unsound decisions. Overview of consumption-oriented environmental policies indicates that there are very few strategies that specifically focus on addressing consumption (Dalhammar and Mont 2004). Policy instruments that indirectly address consumption range from the removal of environmentally harmful subsidies to the increasing use of green taxes and awareness raising campaigns to inform consumers about the environmental and social impacts of production and consumption (Mont and Plepys 2005). Among strategies that directly target consumption patterns is the EU’s Integrated Product Policy that aims at greening products along their life cycles. However, very little attention is paid in IPP specifically to sustainable (environmental and social) sourcing of products and services. Almost none of the existing approaches and polices specifically mentions the challenge to address consumption levels, i.e. the scale of goods and services produced. From international perspective a very important question is whether strategies for addressing sustainable consumption developed in industrialised countries and based on individualist’s worldview are compatible with sometimes more sustainable lifestyles of developing countries.
The sheer size of the public sector in total purchasing transactions makes its potential impact on the environment self-evident. The public sector can influence the production sector and help bring more environmentally and socially sustainable options from niches to mainstream markets by including environmental and social demands in their procurement practices and administration. Examples of such procurement programmes include those that promote the purchase of local and environmentally sound products and services, labelled products or fair trade products. Denmark, Sweden and Japan are well-known for their ambitious policies in that regard.
2.2 SC in business strategies The majority of existing business-oriented environmental management tools and concepts mostly improve production processes and product features, but leave out the question about consumption patterns and levels (Christensen 1997). However, businesses have large potential to contribute to sustainable consumption both in their role as suppliers and as customers. Examples of business strategies for sustainable consumption mainly include eco-procurement, greening of products and advertising of more sustainable consumption patterns (UNEP 2005b).
In their role as suppliers, businesses design products and services that satisfy consumer needs with fewer resources used during production or use stage. 1 Business strategies of dematerialisation and eco-efficiency are well suited for reducing resource use per unit of product
1 See examples from industry in Industriförbundet (1997). Industrin och Agenda 21: Goda Exempel. Stockholm, Industriförbundet: 43.

3
or per unit of function.2 Creating environmentally sound products is just one side of the coin, another being creation of markets for environmentally sound products and services and expansion of customer base for green products (Bleischwitz and Kanda 2004; WBCSD 2005). Businesses use various strategies and tools ranging from eco-labelling, environmental product declarations to direct advertising of eco-sound products and services. A rather recent contribution to marketing campaigns is introduction of the concept of life cycle costing to individual consumers. Electrolux can serve as an example of the company that uses life cycle cost information to facilitate purchases of its more environmentally sound products, the initial price of which is higher than similar products of other producers, but the life cycle cost is lower due to the reduced use of electricity and water (Sundström 2005). One of the most promising strategies for businesses to reduce environmental and social impacts of their activities is to green supply chains. Many examples demonstrate the possibility and importance of influencing upstream life cycle stages (Hass 1996; Wycherley 1999; van Hoek 2001). It has been demonstrated that not only large companies can do that, but that also relatively small companies find possibilities and economic and marketing rationale for doing so (see for example, (Kogg 2003).
2.3 SC in households Sustainable consumption in households can be divided into supply-oriented strategies for engaging individual consumers in consuming more environmentally sound products and services and demand-oriented collective actions of people or entire communities devising own ways of using and consuming products and services that reduce rebound effects that haunt many supply-oriented strategies.
Supply-oriented strategies can be divided into three main approaches. The first approach includes efforts of governments and businesses to design, produce and supply green products and services to the market. The second approach aims at assisting businesses in creating markets for green products by informing consumers about environmentally sound alternatives, mostly through eco-labelling. The third approach is information provision to consumers regarding their use patterns and includes various awareness raising materials, consumer campaigns and, recently, information about life cycle costs.
Collective initiatives include experiments with substituting products with services by sharing and pooling material goods, or by leasing and renting them, aiming to increase the intensity of product use and thereby reduce the material intensity of each use episode. Such collective initiatives include cottages renting and hotel sharing programmes, community-based washing centres, car sharing and pooling schemes, co-housing communities, local exchange trading schemes, etc. In addition to these examples, there are also more ideologically-oriented environmental approaches, advocating living in eco-villages and in general simpler lifestyles (Segal 2003). Unfortunately, like many other collective actions or initiatives undertaken beyond market economy, many of these grass-root attempts are temporary and need support to become institutionalised in society and embedded into everyday life of many more people, who do not see themselves only as consumers, but in the first place as individuals. The UK sustainable development strategy is one of the first documents that emphasises realisation of the vision of sustainable communities (HM Government 2005).
2 See examples in Fussler, C. (1996). Driving Eco-Innovation. London, Financial Times/Prentice Hall., von Weizsäcker, E. U., A. B. Lovins, et al. (1997). Factor Four; Doubling Wealth - Halving Resource Use. London, Earthscan Publications.

4
When it comes to addressing resource extraction phase by consumers, very little is actually happening. Due to global supply chains, consumers in the industrialised countries are becoming more and more decoupled from places where resources are extracted and where large environmental and social impacts occur (Shanahan and Carlsson-Kanyama 2005). Lack of understanding about impacts associated with consumption of consumers in industrialised countries on ecosystems and people in developing countries is one of the reasons for lack of consumer action. Examples of Shell and Nike boycotts of the late 1990s demonstrate the power and the willingness of consumers to act once they got information on practices of companies in other parts of the world. One example of informing consumers is the "fair-trade” labelling marking products produced in environmentally sound and socially responsible manner in developing countries. The goal of this type of labels is to create favourable conditions for small producers in developing countries, especially for agricultural produce, such as tea, coffee, banana, etc. Studies demonstrate fast expansion of “fair trade” labelled foods, which may serve as indicator of growing awareness of European consumers about unsustainable global food production systems (La Trobe 2001). In this way European consumers may express their willingness to contribute to more socially and environmentally sound progress in developing countries.
3 Impediments to further progress in SC As the preceding sections demonstrated, consumption issues have so far being addressed by various actors - governments, businesses and private consumers - largely through technical solutions and information tools, focusing on improving production and product design. The results of these strategies are still insufficient because impacts associated with consumption in industrialised and developing countries are on the rise. Below some of the reasons for this situation are discussed.
3.1 Consumption complexity: goods, infrastructure and happiness To start with, our understanding of the forces shaping certain consumption patterns and levels is still rather limited, largely due to the complexity of consumption processes and meanings people attach to consumption.
People purchase goods and services for their qualities and functions, as well as for their symbolic or identity value (Bauman 1990). They use products to “help create the social world and to find a credible place in it” (Douglas 1976). Surveys indicate that although people want to have financial security and live in material comfort, their deepest aspirations are non-material ones. People express a strong desire for a greater sense of balance in their lives—to bring material gains into harmony with the non-material rewards of life (Consumers International 1997). Material consumption is needed, but on its own it does not make people happy (Max-Neef 1995). A growing body of research suggests that a person’s sense of well-being is based not only on one’s own consumption, but especially on the consumption relative to a reference group – “keeping up with the Jones” (Howarth 1996). This shows that individually rational behaviour can lead to collectively suboptimal results judged from environmental point of view.
Consumption choices are not only based on individual choices, but also to a large degree depend on existing and available infrastructure and on established social norms. Even if consumers are willing to make sustainable choices, they often find themselves locked-in into unsustainable
5
practices, unsustainable infrastructures and unsustainable choices of products and services (Sanne 2002).
These two levels of factors influencing consumption choices were identified in a recent extended study on how more sustainable consumption can be motivated (Jackson 2005). It was found that behavioural change towards sustainable consumption must occur at the collective level – individual changes are clearly insufficient. This has implications for both governmental policies and for business strategies for sustainable consumption.
In addition to these two levels, there is also international dimension of consumption. Cultural embedding of consumption choices and the level of individualisation in society may both serve as entrance point for more sustainable consumption routines, or on the contrary may serve as a barrier.
3.2 Limitations of information tools Provision of information to consumers is often named as one of the main tools to raising consumer awareness and changing consumption patterns. However the problem is that even in cases when information is provided to consumers, this may not necessarily lead to changes in consumer behaviour. Furthermore, a number of consumer researchers report that even if attitudes of people are highly favourable to the environment, changes in pro-environmental behaviour can be quite minimal (Jenkinson 1997). This can be explained by cognitive limitations of people to take deliberative action and by emotional influence in purchasing situations.
So far, one of the main tools to inform consumers about environmental and social impacts of products has been eco-label. Proliferation of eco-labels or producer eco-claims can increase consumer confusion. Purchasing eco-labelled products may also legitimise increasing consumption of more environmentally sound products leading to overall increase of consumption levels (Thøgersen 2000). Another important problem is that due to practical problems, criteria of eco-labels based on life cycle thinking are not as holistic as they could be. For example, products that are labelled as produced locally may rely on supplies from far away (Shanahan and Carlsson-Kanyama 2005). In these cases consumers buying such products think that they support local production, while in fact they support global supply chains. And finally, although in some countries eco-labels reached significant market penetration in a large number of product groups (e.g. Sweden, Germany), in the majority of countries eco-labels are still a novice.
3.3 Consumption levels and rebound effects Despite the undertaken activities in improving production processes and products through eco-efficiency and dematerialisation, there is evidence that both for EU and world-wide GDP is growing at a faster rate than improvements in eco-efficiency (van der Voet, van Oers et al. 2005). Thus consumption is outpacing the gains from improvements in production and products. Increase of aggregate level of consumption can be traced back to changing consumption patterns and consumption levels. It can partially be explained by increasing population and the level of affluence: the number of people in developing countries that enter the world consumer class are also continually increasing, and have already reached 1.7 billion members (Worldwatch Institute 2004).
In addition to consumption levels, consumption patterns are also changing leading to increasing environmental and social impacts. For example, products are becoming larger (houses, cars);
6
consumers have multiple versions of products (TVs, computers) and more luxurious versions of goods (Schor 2005). In addition, due to globalisation, people in different countries consume more and more of virgin and exotic resources, including fruits, wood, and pets and travel to more and more remote areas. This increasing consumption is possible partially because products are produced in low-wage countries where salaries are kept artificially low, where working conditions are extremely poor and where no environmental or social costs are incorporated in the product price.
There is also increasing evidence of rebound effects, in which improvements in efficiency actually become an incentive for increased consumption, which offsets productivity improvements reached through eco-efficiency and dematerialisation strategies (Heiskanen, Jalas et al. 2000).
3.4 Deliberate support of unsustainable consumption One of the main problems with disseminating sustainable consumption patterns and levels are vested interests of businesses and governments in existing structures and institutions of consumption. The goal of continuous economic growth has been translated and embedded in the society as the economic growth largely based on material- and energy-intensive production and consumption. For businesses, goods of final demand are the driving forces of their activities and – assuming a never-ending growth of wants – the very source of business development and growth. Businesses are therefore in continuous search for cheap labour and resources leading to poor working conditions in developing countries, falling prices for many products, which do not allow decent salaries to workers, and increasing quantity of products consumed, sending a completely skewed message to consumers in rich countries (Schor 2005). There are cases when companies use the lacking legislation in developing countries to export or even smuggle post-consumer products for some sort of recycling or even simply for final disposal. Thus, the problem is that companies that act responsibly and proactively in European markets may act less responsibly when they operate in developing countries.
For governments, consumption is directly linked to voters and GDP, which is associated with quality of life, and therefore, consumption, is a very important parameter of a healthy economy. One of the ways to keep GDP growth is to underprice natural resources relative to social costs, which takes place because of governmental subsidies, poorly defined property rights and due to market failure to incorporate the (negative) externalities linked to the use of natural resources (Arrow, Dasgupta et al. 2004). So at least in some cases, businesses and governments deliberately stimulate material- and energy-intensive consumption. One of examples is Americanisation of North East Asian consumption patterns and the shift to unsustainable consumption, while traditional patterns of North East Asia are less energy intensive and more sustainable (Kasa 2003). In this example, the Americanisation leads to introduction of larger vehicles, less developed public transportation, reliance on processed food, high energy consumption and more consumer durables, as well as consumption of high volume of beef, which has much higher energy-intensity than traditional fish-based diet (Durning 1992). Another example is the US response to the European development programme to help small banana growers in Grenada (Schor 2005). In these cases, instead of moderating production volumes of certain goods as response to reduced demand or to improve environmental standards, US producers use US political power to impose their own, not always sustainable, products or production methods to other countries. Often,

7
international financial organisations, e.g. IMF support such measures and directly contribute to unsustainable growth (Kasa 2003).
4 Towards strengthening efforts on SC In order to strengthen efforts on sustainable consumption, the issue needs to be recognised at the highest political level. Within political actions one can distinguish the Marrakech Process as an instrument to develop and implement the long-term plan to accelerate the shift towards sustainable lifestyles that promote social and economic development across the world. The Marrakech Process launched by UNEP and UN-DESA includes regular global and regional meetings supported by informal expert Task Forces and roundtables to promote progress on the 10-year Framework Programme for Sustainable Consumption and Production. So far, eight Task Forces have been established and led by various countries; for example UK leads Task Force on sustainable products, Sweden on sustainable lifestyles, etc.
Another political instrument to promote sustainable consumption efforts is the National Strategies for Sustainable Consumption and Production. Few countries have developed National Strategies for Sustainable Consumption and Production (UK and Finland),3 and are in the process of their implementation. Some criticism have been heard that although undoubtedly progressive and useful, National strategies do not assist with practical steps towards making current consumption levels and patterns more sustainable. Another criticism is that national strategies insufficiently address effects of Western lifestyles in countries that supply resources and products.
Therefore, a recent suggestion for a more concrete action from a range of forums is the development of National Action Plans for Sustainable Consumption (UNEP 2005a). During a working meeting of the Swedish Taskforce on sustainable lifestyles it was suggested that National Action Plans for Sustainable Consumption should be coherent with regional-level developments in sustainable consumption and production, such as the EU Action Plan on SCP that is currently in preparation. The National Action Plans for Sustainable Consumption should comprise not only strategic long-term goals, but should contain short-term tactical steps. To ensure that goals and targets are being met indicators for measuring progress towards sustainable consumption and production should be developed and used. There should be minimum requirements for what National Action Plans should contain and what kind of goals they should strive for. Some governments may need help in developing the National Action Plans for Sustainable Consumption and assistance should be available from other governments with development and especially implementation of the Plans.
For companies there are also plenty of possibilities for improvement, especially in their operations and markets that are situated in less-industrialised countries. One possibility is to ensure that similar environmental and social standards are being followed in all countries where companies operate. Such standards can include rules for extraction sites, responsibility in terms of reducing impacts on the environment and responsibility to conduct remediation activities after the extraction site is closed. Other possibilities is to develop alternative ways for collecting and recycling of products that are subject to European extended producer responsibility legislation in countries where there is no EPR legislation in place and where there is lack of infrastructure for
3 See for example, DEFRA and DTI (2003). Changing patterns. UK Government Framework for Sustainable Consumption and Production. London: 50. and KULTU Committee (2005). Finland’s National Programme to Promote Sustainable Consumption and Production. Helsinki.

8
taking care of end-of-life products. Another possibility is to question the material intensity of products and services and to redesign systems of provision so that less material- and energy-intensive offers would become a more viable business solution, e.g. business models based on functional sales and product-service systems.
5 References Arrow, K., P. Dasgupta, et al. (2004). "Are We Consuming Too Much?" Journal of Economic
Perspectives 18(3): 147-173.
Bauman, Z. (1990). Thinking Sociologically. Oxford, Blackwell.
Bleischwitz, R. and Y. Kanda (2004). Symposium "Governance of Markets for Sustainability" (2003: Berlin, Germany). Munchen, Iudicium.
Christensen, P. (1997). "Different lifestyles and their impact on the environment." Sustainable Development 5(1): 30-35.
Consumers International (1997). Consumers and the Environment: Meeting Needs, Changing Lifestyles. London, Head Office of Consumers International.
Dalhammar, C. and O. Mont (2004). Integrated Product Policy and sustainable consumption: At the cross-road of environmental and consumer policies. International workshop "Driving forces of and barriers to sustainable consumption", University of Leeds, UK.
DEFRA and DTI (2003). Changing patterns. UK Government Framework for Sustainable Consumption and Production. London: 50.
Douglas, M. (1976). Relative Poverty, Relative Communication. Traditions of Social Policy. A. Halsey. Oxford, Basil Blackwell.
Durning, A. (1992). How Much is Enough? The Consumer Society and the Future of the Earth. New York, W. W. Norton & Company.
Fussler, C. (1996). Driving Eco-Innovation. London, Financial Times/Prentice Hall.
Hass, J. L. (1996). "Greening" the Supply Chain: A Case Study and the Development of the Conceptual Model. Industry and the Environment: Practical Applications of Environmental Management Approaches in Business. J. P. Ulhöi and H. Madsen. Aarhus, The Aarhus School of Business: 79-92.
Heiskanen, E., M. Jalas, et al. (2000). The Dematerialization Potential of Services and IT: Futures Studies Methods Perspectives. The Quest for the Futures seminar. Workshop on Futures Studies in Environmental Management, Turku.
HM Government (2005). Securing the Future – delivering UK sustainable development strategy. London, The UK Government: 188.
Howarth, R. B. (1996). "Status effects and environmental externalities." Ecological Economics 16(1): 25-34.
Industriförbundet (1997). Industrin och Agenda 21: Goda Exempel. Stockholm, Industriförbundet: 43.
Jackson, T. (2005). Motivating sustainable consumption. Surrey, Centre for Environmental Strategy, University of Surrey: 170.

9
Jenkinson, K. (1997). "The Consumer Interest in the Environment." European Environment 7(3): 85-91.
Kasa, S. (2003). "US Trade Policy Power and Sustainable Consumption: Beef and Cars in North East Asia." Journal of Consumer Policy 26(1): 75-100.
Kogg, B. (2003). "Greening a Cotton-textile Supply Chain: A Case Study of the Transition towards Organic Production without a Powerful Focal Company." Greener Management International(43): 53-64.
KULTU Committee (2005). Finland’s National Programme to Promote Sustainable Consumption and Production. Helsinki.
La Trobe, H. (2001). "Farmers' markets: consuming local rural produce." Journal of Consumer Studies and Home Economics 25(3): 181-192.
Max-Neef, M. (1995). "Economic Growth and Quality of Life: A Threshold Hypothesis." Ecological Economics 15: 115-118.
Moll, H. C., K. J. Noorman, et al. (2005). "Pursuing More Sustainable Consumption by Analyzing Household Metabolism in European Countries and Cities." Journal of Industrial Ecology 9(1-2): 259-276.
Mont, O. and A. Plepys (2005). Sustainable Consumption: Research and Policies. Stockholm, Swedish EPA: 98.
OECD (1997). Sustainable consumption and production. Clarifying the concepts. OECD proceedings. Paris, OECD.
OECD (2002). Towards sustainable household consumption? Trends and policies in OECD countries. Paris: 158.
Sanne, C. (2002). "Willing consumers or locked-in?" Ecological Economics 42(1-2): 273-287.
Schor, J. B. (2005). "Prices and quantities: Unsustainable consumption and the global economy." Ecological Economics 55(3): 309-320.
Segal, J. M. (2003). Graceful Simplicity. Toward A Philosophy & Politics Of Simple Living. New York, Henry Holt.
Shanahan, H. and A. Carlsson-Kanyama (2005). "Interdependence between consumption in the North and sustainable communities in the South." International Journal of Consumer Studies 29(4): 298-307.
Sundström, H. (2005). Driving Market Penetration of Energy Efficient Appliances, European Commission.
Thøgersen, J. (2000). Promoting green consumer behaviour with eco-labels. National Academy of Science/National Research Council Committee on the Human Dimensions of Global Change, Washington, DC, USA.
Tukker, A., G. Huppes, et al. (2005). Environmental Impacts of Products. Analysis of the life cycle environmental impacts related to the total final consumption of the EU25. Sevilla, ESTO/IPTS: 117.

10
UNEP (2005a). Advancing Sustainable Consumption in Asia – A Guidance Manual. Paris, UNEP: 73.
UNEP (2005b). Talk the walk: advancing sustainable lifestyles through marketing and communications. Paris, UNEP: 52.
van der Voet, E., L. van Oers, et al. (2005). Policy Review on Decoupling: Development of indicators to assess decoupling of economic development and environmental pressure in the EU-25 and AC-3 countries. Leiden, CML, Leiden University, Wuppertal Institute for Climate, Environment and Energy, CE Solutions for Environment, Economy and Technology: 159.
van Hoek, R. I. (2001). "Case studies of greening the automotive supply chain through technology and operations." Int. J. Environmental Technology and Management, 1(1/2): 140-163.
WBCSD (2005). Driving success. Marketing and sustainable development, World Business Council for Sustainable Development: 20.
von Weizsäcker, E. U., A. B. Lovins, et al. (1997). Factor Four; Doubling Wealth - Halving Resource Use. London, Earthscan Publications.
Worldwatch Institute (2004). State of the World 2004. Washington: 273.
Wycherley, I. (1999). "Greening Supply Chains: The Case of The Body Shop International." Business Strategy and the Environment 8(2): 120-127.

FORESCENE: Sustainable Use of Materials, Vienna, Austria, October 23 – 24, 2006 TOWARDS ‘SUSTAINABLE CONSERVATION’ AND USE OF
MATERIALS IN BUILT ENVIRONMENTS
Jan Rosvall (1)*; Nanne Engelbrektsson (2), Erika Johansson(1) and Pär Meiling(1)
(1) NMK Enterprising Research School GMV Centre for Environment and Sustainability
Chalmers University of Technology and Göteborg University Göteborg, Sweden
(2)Institute of Conservation Göteborg University Göteborg, Sweden
Introduction Considering on a principal level, a) the long-term global flow of materials composing the infrastructure and the urban fabric of society and b) the need to prepare for a sustainable future; two main avenues seem to be available, and preferably, to be combined: Currently attracting the main interest from the majority of stakeholders, there are still some alternative ways to approach and minimise the unsustainable use of materials and the volumes of newly planned for and/or produced materials and structures of all kinds. There is a constant need to develop more sustainable materials and to design their processes in even more effective and sustainable ways - in this context from an ‘integrated conservation and socio-environmental perspective’ – by using already existing systems and resources (traditional and modern) instead of replacing them with modern, unsustainable or more costly alternatives. One approach, far too little taken into account today in the context of urban and sustainability planning - is the incorporation of preventive measures and long-term maintenance, conservation, restoration, rehabilitation, creative and adaptive-reuse of existing structures, environments and related resources – especially with regard to “ordinary” buildings (i.e. not necessarily historic buildings) without destroying or manipulating their original fabric, various components, functions or inherent qualities – especially those structures that are well preserved or in a relatively good condition, of high quality construction and materials, that are easy to maintain, and adaptable to modern standards and requirements. This alternative approach - earlier the predominant way of handling urban planning, construction and development (i.e. the production and utilisation of both existing and planned for resources), was historically much based on the valorisation of costs of manpower, materials, traditional knowledge, techniques and low-energy modes of transportation, compared to modern circumstances. There was also a profound knowledge of “economics” in more general terms and a well-developed forecasting of future scenarios. Given the demands for a sustained Final draft, November 9, 2006 Page 1 of 32

future, it would be reasonable to assume that this knowledge and approach would have a great deal to offer also to the planning and epistemological modelling of our times. (Rosvall, J., Engelbrektsson, N. and Johansson, E, 2006). Theoretical Framework Up until today, no comprehensive efforts have been made, and principles are yet to be established for the ‘sustainable conservation’ of the built environment (see definition below)– in an inter- and transdisciplinary manner from a theoretical and global perspective – including systematic modelling and an appreciation of the inherent values of already existing structures and ambiences. It should be noted in this context that (- regardless of the relatively fast development of the sustainability and preservation movement during the last decade/-s on an international level), existing structures are still often seen as obstacles for development. It may be argued that a preventive approach, i.e. an early estimation and a meta-level understanding of the built environment and its processes; its critical loads, inherent qualities, values, threats, life cycles, production chains, recyclability and quantities etc. - would rather promote any kind of planning for a sustained future and the proper use of materials by hindering unnecessary material flows - i.e. through a preventing their unnecessary/unsympathetic production and/or use, that would minimise their negative impact on peoples lives and the environment. (Holmberg, J., 1992; Jönsson Å., 1988; Kain, J-H, 2003; Fusco Girard, L., 2006; Rosvall, J. et al. 1999, Stø, E. & Strandbakken P.,2005.)
In this context, ‘conservation’ as an ever evolving discourse may be defined in its broader transdisciplinary and global sense as the dynamic management of change, including both tangible and intangible aspects of cultural, historic and natural resources. This broader concept of ‘conservation’ embraces the notion of mixed cultural and natural environments, culture-nature relationships, spiritual and sacred values, traditions, skills, oral knowledge and material legacy, consituted by artifactual [movable] and built [immovable] heritage, environments and landscapes produced by different and diverse civilizations - both traditional and modern. This transdisciplinary, meta-level nature of conservation – which is subject to constant change and therefore need to be continuously re-assessed and defined - requires a systematic expansion and coordination of the research base in all areas and processes involved. (Johansson, E, 2004; Feilden, B., 1988; Rosvall, J., 1998; Day, C., 2002; Cassar, M. et al, 2001). Cultural heritage conservation and its processes can – i.e. as an integral part of the natural and built [cultural] environment - be seen as systems and as such, they must be dynamically stable. They must be able to evolve, change and develop over time, testing new ideas constantly, adopting new solutions but reject any intervention that destroys or disturbs the general equilibrium. ‘Sustainable conservation’ from an overall perspective and from an academic and professional point of view as applied to cultural heritage means using an interdisciplinary, focused approach; including transdisciplinary collaboration and research and a deep understanding of the cultural heritage, construction processes, their role in society and the environmental sector at large; cultural heritage science and policy; business strategies; market incentives; education research and training needs and environmental issues to develop successful tools to address critical problems. For this to happen, universities in the cultural heritage sector need to work proactively and jointly with other institutions and research teams, businesses, NGO’s, government and industry – regionally, nationally and internationally. (Johansson, E., 2006; Fusco Girard, L., 2006; Etzkowitz, H., 2002).
Final draft, November 9, 2006 Page 2 of 32

‘Sustainable conservation’ is a term most commonly used by the natural and environmental sciences, but it can be directly linked to and applied also to the urban conservation and the preservation of cultural heritage resources - both tangible and intangible. These systems must strive for balance, where inputs and outputs are in service to each other and there is no such concept as waste. Among other things this means embracing actions that maintain cultural and biological diversity and assist these systems in maintaining their own natural balance. (Johansson, E. 2006; Fusco Girard, 2006; Rosvall, J., 2006). Within the current paradigm, much of today’s mainstream construction still sustains unsustainability – i.e. through uncritically reproducing norms, by fragmenting understanding, by using unsustainable products and processes and by recognising only a narrow part of the spectrum of human ability and need, and by servicing the consumerist machine (drawing on Sterling, 2001, 14-15; from Scott and Gaugh, 2003; Johansson, 2006; Thuvander, 2000). Discussion From an industrial and policy point of view, cultural heritage conservation is often looked upon as an elite profession or a “luxurious” or expensive endeavour - requiring the allocation of specific and/or specialised resources. Today, this is more a myth, especially from a sustainability, conceptual-, and competency point of view. The discipline of conservation has evolved and changed rather dramatically during the last decades due to a) a change in worldview and cognitive processes towards more holistic and sustainable solutions for cultural heritage, b) the lack of adequate education/training and standards for cultural heritage and c) the need to manage and adapt to the current social, political and economic circumstances, such as e.g. the effects of globalisation, including increased mobility and exchange of products and services; the development of new industry-based solutions to solve conservation and environmental problems; and the need for more innovations and marketable skills, increased collaboration etc. So in this context this argument is no longer true – especially with regard to sustainable development, i.e. for two main reasons: Tourism for example, especially in Europe, is one of the main driving forces for economic and regional development, including the development of new innovative SME’s, including employment etc. – i.e. as factors measured in various ways in terms of e.g. Gross Domestic Product (GDP), compared to modern industry such as e.g. automotive production, IT industry etc., and other major sectors of society. Tourism is also, to a very large extent, relying on heritage in various respects; such as e.g. historic buildings and urban centres, indigenous knowledge and techniques, traditional gastronomy, cultural landscapes, archaeological sites and historically oriented performance arts such as theatres, concerts etc. These objects/sites etc. are also rich in both intangible and economic terms in that they exist on the condition that they are incommensurably costly, and impossible to replace. Conservation contributes to safeguard the global life support system of humans and foster intergenerational and intergenerational justice in the access to existing resources - i.e. not only natural-, but also cultural heritage resources. (ENSURE, 2006; UNESCO, 2003; de la Torre, M. 2002; de la Torre, M. & Mason, R., 2006) According to Fusco Girard (2006): “…Conservation of urban heritage can be genuinely sustainable to the extent that it revitalizes communities by creating a dynamic, growth-oriented mix of new functions that regenerate economic and social life, while at the same time reducing energy consumption and increasing the use of renewable resources”.
Final draft, November 9, 2006 Page 3 of 32
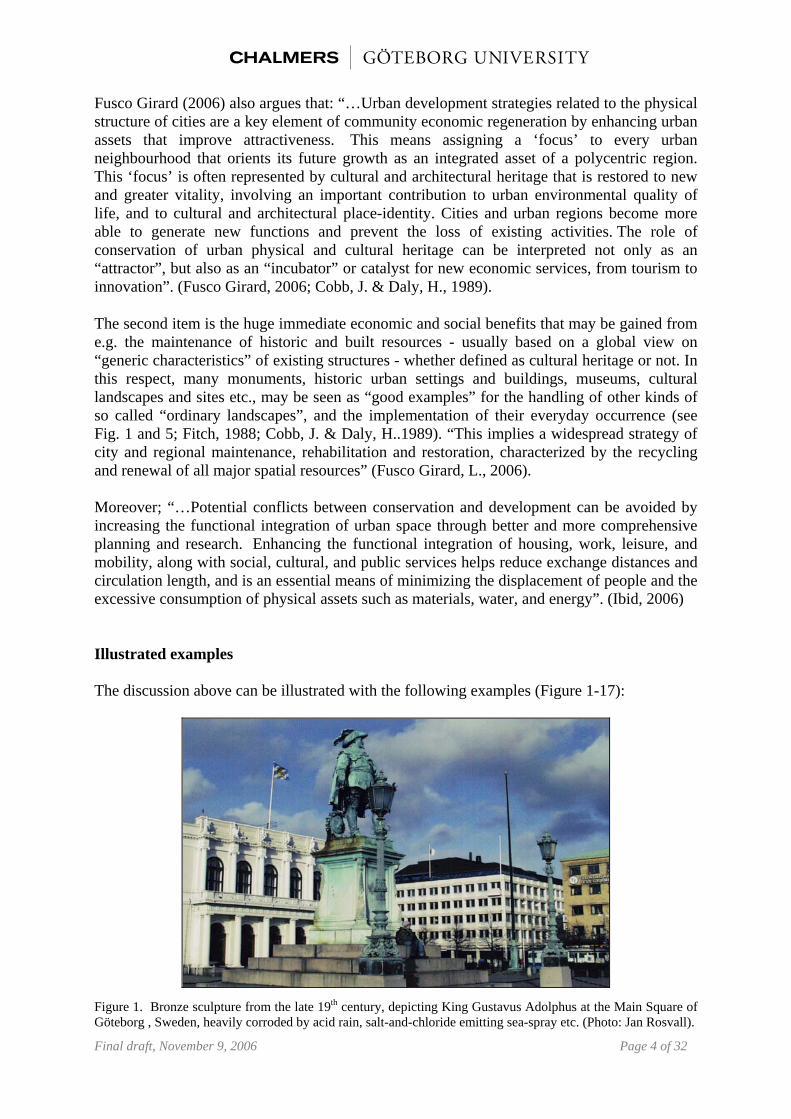
Fusco Girard (2006) also argues that: “…Urban development strategies related to the physical structure of cities are a key element of community economic regeneration by enhancing urban assets that improve attractiveness. This means assigning a ‘focus’ to every urban neighbourhood that orients its future growth as an integrated asset of a polycentric region. This ‘focus’ is often represented by cultural and architectural heritage that is restored to new and greater vitality, involving an important contribution to urban environmental quality of life, and to cultural and architectural place-identity. Cities and urban regions become more able to generate new functions and prevent the loss of existing activities. The role of conservation of urban physical and cultural heritage can be interpreted not only as an “attractor”, but also as an “incubator” or catalyst for new economic services, from tourism to innovation”. (Fusco Girard, 2006; Cobb, J. & Daly, H., 1989).
The second item is the huge immediate economic and social benefits that may be gained from e.g. the maintenance of historic and built resources - usually based on a global view on “generic characteristics” of existing structures - whether defined as cultural heritage or not. In this respect, many monuments, historic urban settings and buildings, museums, cultural landscapes and sites etc., may be seen as “good examples” for the handling of other kinds of so called “ordinary landscapes”, and the implementation of their everyday occurrence (see Fig. 1 and 5; Fitch, 1988; Cobb, J. & Daly, H..1989). “This implies a widespread strategy of city and regional maintenance, rehabilitation and restoration, characterized by the recycling and renewal of all major spatial resources” (Fusco Girard, L., 2006). Moreover; “…Potential conflicts between conservation and development can be avoided by increasing the functional integration of urban space through better and more comprehensive planning and research. Enhancing the functional integration of housing, work, leisure, and mobility, along with social, cultural, and public services helps reduce exchange distances and circulation length, and is an essential means of minimizing the displacement of people and the excessive consumption of physical assets such as materials, water, and energy”. (Ibid, 2006) Illustrated examples The discussion above can be illustrated with the following examples (Figure 1-17):
Figure 1. Bronze sculpture from the late 19th century, depicting King Gustavus Adolphus at the Main Square of Göteborg , Sweden, heavily corroded by acid rain, salt-and-chloride emitting sea-spray etc. (Photo: Jan Rosvall).
Final draft, November 9, 2006 Page 4 of 32

Figure 2. Detail of a pediment made of Italian Carrara marble, highly sensitive to physical and chemical attacks - especially acid rain, including mechanical degradation, depending on gypsum formation of acid-soluble calcarious substances in the stone itself causing volume expansion and cracks in the internal crystalline structure of the marble, especially in combination with rapid temperature changes. (Photo: Jan Rosvall).
Figure 3. This is the same type of marble as above, also imported and transported from the quarries of Carrara, Italy, a famous calcarious rock that has been used for many artistic and architectural purposes in the world since Antiquity. (Photo: Jan Rosvall).
This is an attempt to explain the non-sustainable impact of natural as well as anthropogenic emissions, e.g. air pollution attacking historic monuments, urban architecture and the built and natural environment at large. These environmental effects are likewise aggressive for any surface (especially various types of masonry, metals etc.) being attacked by e.g. SO2 and NOx or their synergic combination (see Figs 2, 3, 4; Rosvall, J., 1988). These materials (Fig. 1, 2 and 3) have been continuously weathered and are heavily deteriorated due to various kinds of emissions and excessive moisture, i.e. from acidic rain and wind containing salts and atmospheric pollution generated by combustion from cars, buses and trucks, and by carbon pollution from e.g. diesel engines of marine vessels, the heating of offices and domestic spaces etc. These natural forces are also acting in a micro-Final draft, November 9, 2006 Page 5 of 32

climate, as well as regionally by geographic transportation of emissions from countries far away. This is an attempt to illustrate the multi-parameter effects of various types of material flow in built environments and of forces acting on and within materials, i.e. in a continuing process, but also instantaneously (Fig. 4; Rosvall, 1999):
Figure 4. Diagrams showing the mechanisms and effects of air pollution on calcarious materials, as shown above (Fig. 1, 2 and 3; Lindqvist, O; Rosvall, J, et al., 1988).
When observing all kinds of natural and material objects, buildings, structures and other kinds of structures (including landscapes) and their various dimensions, it is not very easy to grasp all these resources in one comprehensive model or conceptual view. However, from a general and global perspective it is argued that it is possible to document, sort and classify such anthropogenic components, with reference to their material sources, sizes, functions, locations etc. This is demonstrated in the following ideograms (Fig. 5, 6). It should be noted that no differentiation has been made in this context between “heritage” substances vs. “ordinary” objects and landscapes, depending on the underlying discourse, fusing generic phenomena with more specific and selected heritage representations from different time periods and with different socio-cultural dimensions. This perspective is based on the theoretical framework of ‘integrated conservation’. (Engelbrektsson N & Rosvall, J., 2004). With respect to material flows and ecological capacity of the Earth to meet the needs of a sustained future, we must look at Nature itself and its conditions. But Nature, Humankind and the Community and its associated systems - tangible and intangible - together form the very basic conditions for a socially and culturally sustained future - i.e. with Nature or the environment as a basis for approach and understanding. Besides these two overall conditions, the daily life and operations of Society are depending on a complex conglomerate of “social and environmental relationships and fabric”, as demonstrated above (Fig 5). Sooner or later, these material structures comprising the entire “web” of society, are becoming historic structures or integral parts of the environment, regardless they are considered as heritage or not. With the immense growth of urban fabric and the expansion of human and related processes in the present world, however, it is a complex task to try to comprehend all the multiple factors at play with regard to sustainability - including e.g. policy, quality of life issues, economical and environmental factors and the need for a widened perspective about the care and handling of cultural resources and the environment. (Engelbrektsson, N. & Rosvall, J. 2004; Rosvall, J., 2006).
Final draft, November 9, 2006 Page 6 of 32

Figure 5. Idiogram presenting a comprehensive conceptual framework, encompassing natural and artefactual materials, structures and components of anthropogenic origin in relation to their context and every-day use, including the continuing flow of materials and recycling in a reciprocal process. It should be noted that in this chart, there is no differentiation with regard to the history of e.g. the age of a building or a site - instead there is a strong emphasis on the coherence between existing human-made fabrics and new and/or anticipated structures and/or objects. (van Gigch, J., P., Lagerqvist, B., Rosvall, J., 1996).
Figure 6. When observing reality from an integrated and holistic perspective, i.e. in the way it is presented here, it becomes immediately evident that circumstances encompassing humankind must be understood as a comprehensive system of a variety of interacting parameters and concepts. (Lagerqvist, B, 1996; van Gigch, J., 2001).
Final draft, November 9, 2006 Page 7 of 32
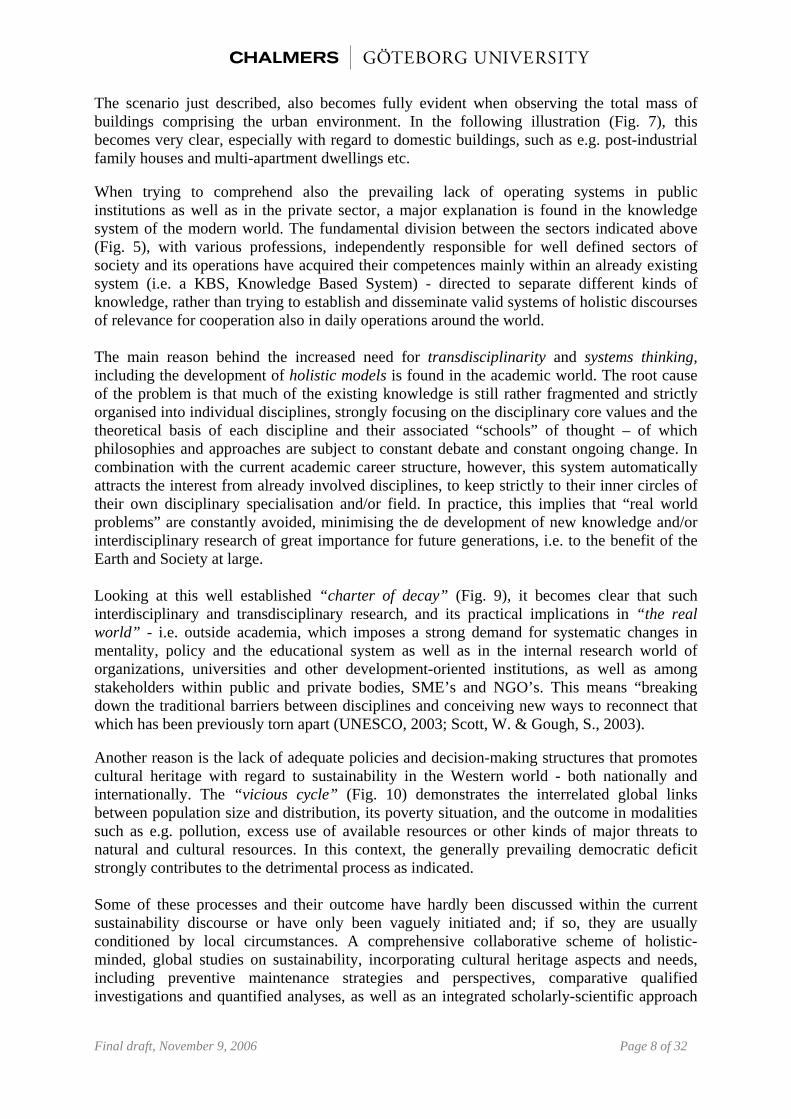
The scenario just described, also becomes fully evident when observing the total mass of buildings comprising the urban environment. In the following illustration (Fig. 7), this becomes very clear, especially with regard to domestic buildings, such as e.g. post-industrial family houses and multi-apartment dwellings etc. When trying to comprehend also the prevailing lack of operating systems in public institutions as well as in the private sector, a major explanation is found in the knowledge system of the modern world. The fundamental division between the sectors indicated above (Fig. 5), with various professions, independently responsible for well defined sectors of society and its operations have acquired their competences mainly within an already existing system (i.e. a KBS, Knowledge Based System) - directed to separate different kinds of knowledge, rather than trying to establish and disseminate valid systems of holistic discourses of relevance for cooperation also in daily operations around the world. The main reason behind the increased need for transdisciplinarity and systems thinking, including the development of holistic models is found in the academic world. The root cause of the problem is that much of the existing knowledge is still rather fragmented and strictly organised into individual disciplines, strongly focusing on the disciplinary core values and the theoretical basis of each discipline and their associated “schools” of thought – of which philosophies and approaches are subject to constant debate and constant ongoing change. In combination with the current academic career structure, however, this system automatically attracts the interest from already involved disciplines, to keep strictly to their inner circles of their own disciplinary specialisation and/or field. In practice, this implies that “real world problems” are constantly avoided, minimising the de development of new knowledge and/or interdisciplinary research of great importance for future generations, i.e. to the benefit of the Earth and Society at large. Looking at this well established “charter of decay” (Fig. 9), it becomes clear that such interdisciplinary and transdisciplinary research, and its practical implications in “the real world” - i.e. outside academia, which imposes a strong demand for systematic changes in mentality, policy and the educational system as well as in the internal research world of organizations, universities and other development-oriented institutions, as well as among stakeholders within public and private bodies, SME’s and NGO’s. This means “breaking down the traditional barriers between disciplines and conceiving new ways to reconnect that which has been previously torn apart (UNESCO, 2003; Scott, W. & Gough, S., 2003). Another reason is the lack of adequate policies and decision-making structures that promotes cultural heritage with regard to sustainability in the Western world - both nationally and internationally. The “vicious cycle” (Fig. 10) demonstrates the interrelated global links between population size and distribution, its poverty situation, and the outcome in modalities such as e.g. pollution, excess use of available resources or other kinds of major threats to natural and cultural resources. In this context, the generally prevailing democratic deficit strongly contributes to the detrimental process as indicated. Some of these processes and their outcome have hardly been discussed within the current sustainability discourse or have only been vaguely initiated and; if so, they are usually conditioned by local circumstances. A comprehensive collaborative scheme of holistic-minded, global studies on sustainability, incorporating cultural heritage aspects and needs, including preventive maintenance strategies and perspectives, comparative qualified investigations and quantified analyses, as well as an integrated scholarly-scientific approach
Final draft, November 9, 2006 Page 8 of 32

to learning and interpretation of cultural resources and its processes as placed in an economic, socio-cultural-, environmental context is proposed.
Figure 7. This graph shows the gradual increase of the domestic building stock (i.e. multi-apartment dwellings and family houses) based on a rather large but “frozen” material flow - a typical scenario in any industrialised Western country of the world today (based on statistics from the 1980’s; Holmström, I.).
Figure 8. Conceptual model of ‘Integrated Conservation’ as applied to cultural heritage. (Engelbrektsson, N., Rosvall, J., 2004).
Final draft, November 9, 2006 Page 9 of 32
Figure 9. Internal and external causes of decay. (Feilden, B., 1982; & Lagerqvist, B., 1996).
Final draft, November 9, 2006 Page 10 of 32

Figure 10. The “vicious cycle”, i.e. the interrelated global links between population size and distribution, poverty, and its related outcome. (Source: )
Figure 11. Diagrams showing the results from longitudal interdisciplinary studies on air pollution. (Rosvall, J., 1988)
Final draft, November 9, 2006 Page 11 of 32

Based on the discussion above; recent research initiatives have started to indicate some very promising results, especially with regard to the long-term effects of pollution, deterioration factors and their detrimental effects on human health, the environment and for cultural heritage and material assets of different kinds. The longitudinal studies referred to in these diagrams (above); clearly indicate the success of interdisciplinary studies with regard to cultural heritage, of value for policy making and practical operations in many social, environmental and economic situations (Brimblecombe, Johansson, E., 2004, Rosvall, J., et al. 1999).
Figure 12. Ideogram showing various types of risks (Waller, R., 2003). However, the inherent capacity of society, at various levels to forecast specific risk scenarios, appears to be rather limited so far (Fig. 12). Depending on escalating threats based on over-consumption and inadequate logistic systems etc., there is a growing concern and awareness about risks, in turn demanding input of reliable and relevant knowledge and development of associated systems. This is a promising development, but the current awareness and debate about the threats to cultural heritage and the environment should encourage decisions and investments in R&D needed for integrated and transdisciplinary studies of collaboration and mutual learning – i.e. for the safeguarding of cultural heritage and for sustainability at large. When observing the development of this trend it is evident that today’s community is concerned mainly with “catastrophic and severe” types of risks, directed to understanding of the conditions of more “rare and sporadic” threats or scenarios. As a consequence, however, “mild and gradual” types of risks that are constantly occurring (e.g. climate change, atmospheric pollution, degradation and/or neglect) seem to be continuously less considered and/or sometimes even left out, especially with regard to the built environment. The detrimental effects of this lack of awareness of the benefits of e.g. preventive maintenance and the accompanying “mis-management” of built assets can be directly linked to the degradation of cultural resources. “Risk assessment” in terms of cultural heritage and material use is still a poorly studied as an area of research with regard to the inverted flow of materials - causing enormous consequences to society and a depreciation of material, social, cultural and economic values etc. (Rosvall, J., 2006; Waller, R., 2003).
Final draft, November 9, 2006 Page 12 of 32

The process of revalorization of the built heritage (Fig. 13) is another field of research with direct applications to sustainability - hitherto only vaguely studied by the cultural heritage and sustainability sector, leaving no room to promote adequate planning- and/or decision-making.
Figure 13. The process of revalorisation. (Rosvall, J., et al, 1999) This ideogram (Fig. 13) illustrates the ideal curve of changes of values with regard to the built environment and its assets, including both heritage and domestic buildings. According to economic principles with regard to financial investments, in e.g. real estate, the issue concerns the added economic value and continued development of e.g. a region, a city, a structure or a landscape and/or site. In practice, this might come in direct conflict with intended maintenance and with adequate conservation interventions, both from a short and a long-term perspective. (Rosvall, J., et al., 1999). Unfortunately, however, the current economic system fosters a lack of understanding of the multi-facetted values of cultural heritage and the qualities of related assets (i.e. other than in economic terms) - depending on lack of intrinsic explanations of the beneficial aspects of cultural heritage conservation to sustainability with regard to quality of life and the economy - e.g. long term investments (Cassar, 2006, de la Torre, M. & Mason, R., 2006). This is according to the principles of ‘integrated cultural and environmental conservation”. (Engelbrektsson, N. & Rosvall, J., 2004). Another problem related with the conventional economic discourse, i.e. when analysing material flows from a sustainability perspective - is that the process described generates continuing preference to the demolishment of existing buildings to the benefit of new development - instead of recycling them for e.g. continuous use and adaptation. Furthermore, the values of cultural heritage and built assets may be defined in relation to various dominant modalities, besides the prevailing economic terminology and existing economic theories (Fig. 14). Obviously, from a cultural heritage point of view, the intangible, Final draft, November 9, 2006 Page 13 of 32
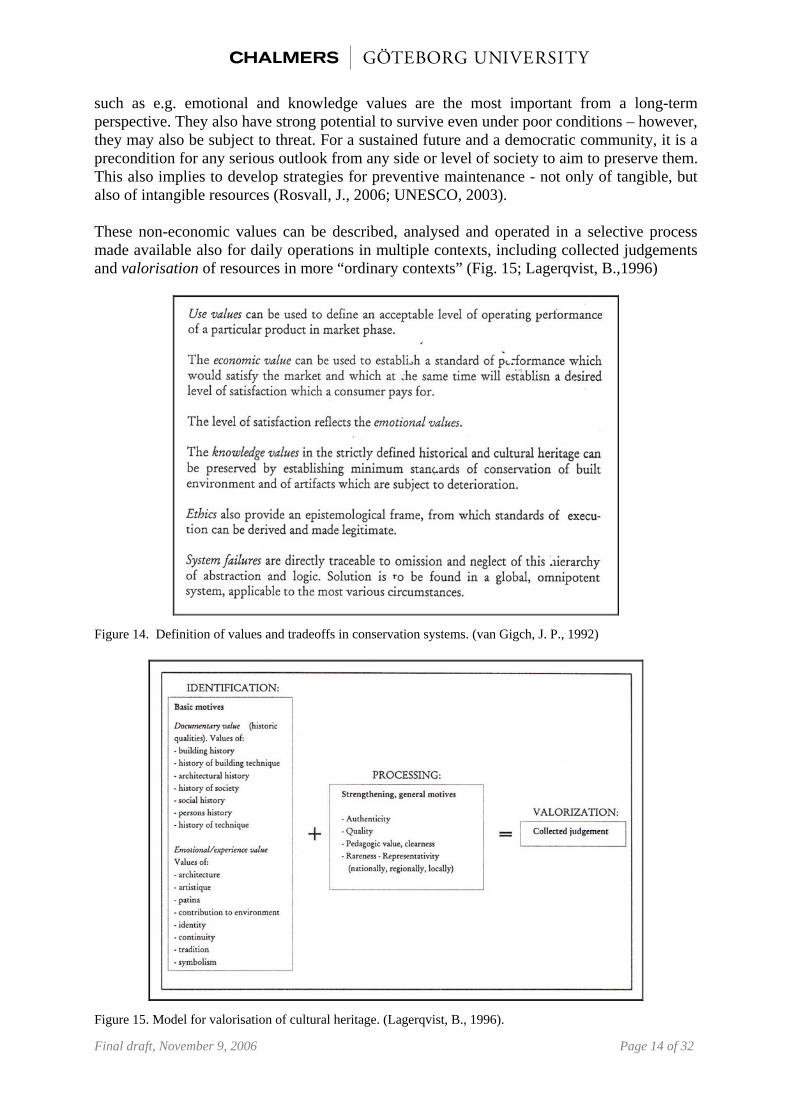
such as e.g. emotional and knowledge values are the most important from a long-term perspective. They also have strong potential to survive even under poor conditions – however, they may also be subject to threat. For a sustained future and a democratic community, it is a precondition for any serious outlook from any side or level of society to aim to preserve them. This also implies to develop strategies for preventive maintenance - not only of tangible, but also of intangible resources (Rosvall, J., 2006; UNESCO, 2003). These non-economic values can be described, analysed and operated in a selective process made available also for daily operations in multiple contexts, including collected judgements and valorisation of resources in more “ordinary contexts” (Fig. 15; Lagerqvist, B.,1996)
Figure 14. Definition of values and tradeoffs in conservation systems. (van Gigch, J. P., 1992)
Figure 15. Model for valorisation of cultural heritage. (Lagerqvist, B., 1996).
Final draft, November 9, 2006 Page 14 of 32

Figure 16. Multi-level meta-system of ethics (van Gigch & Rosvall, 1999). The operative decision-making at the “intervention level” requires a well prepared “work-package” enabling the actors at different levels of the system to be aware and competent in their roles, and be able to adjust to the conditions at each level of performance – i.e. according to this “multi-level meta-system of ethics” (Fig. 16; van Gigch, J. P. & Rosvall, J., 1999). It is suggested, however, that the problems investigated should be defined preferably by end users rather than the [scientific] tools available (Ball, D. & Watt J). The various value-systems explained above (Fig. 13, 14, 15, 16) are condensed in a conceptual model (Fig. 17), aimed at demonstrating the overlapping relations and the contradictory aspects of cultural heritage and the built environment, i.e. its values and safeguarding, and the interaction between these various components. Final draft, November 9, 2006 Page 15 of 32

Figure 17. Conceptual model of different overlapping value components (by Beckman, In: Lagerqvist; B, 1996 ).
Figure 18. Meta-model system of material flows with regard to cultural heritage. (Rosvall, J., 1999). A system of material flows of anthropogenic structures, such as e.g. buildings and related assets may be organised as a model incorporating also their intangible dimensions - i.e. to make them intelligible and apprehensible from an epistemological and meta-level point of view (Fig. 18). Naturally, these buildings are possible to view and to see with the naked eye, but this also poses a question: -“What” is actually seen? The visual appearance of a building may be separated from its physical components, and its “picture” may be distinct from the intangible dimensions of the object itself - i.e. its function as conveyor and its intrinsic message as an “image”. This conceptual framework has a direct impact on the conception of an object and consequently, its treatment and possibilities - since it is usually only the “visual” and the “physical” that are handled on an operational level (e.g. through interpretation and/or technical interventions). The intangible dimensions, however, require a totally different approach than the traditional approach – especially when regarding the various communication aspects involved, as well the theoretical and practical aspects from an operational and decision-making point of view. (UNESCO, 2003).
Final draft, November 9, 2006 Page 16 of 32

In the context of so called ‘socio-cultural environments’, the intrinsic meaning of anthropogenic structures (architecture, machinery, technical infrastructure, landscapes, urban environment etc.) from a long-term perspective is one of the major assets of society. And it is a non-renewable resource, calling for minimum intervention, environmentally friendly materials and solutions, compatible with the existing, i.e. authentic substances and their modes of application. The principles of ‘conservation’ of cultural, scientific and natural heritage are well established since long, however, their existence is not always known by other disciplines. This theoretical framework (Fig. 19, below) was established already in 1982. This definition - i.e. one of the conservation field’s most commonly referred to framework - has defined and promoted models forecasting sustainable development, environmental protection and care of historic buildings for decades - even before the now prevailing ideas of ‘environmentalism’ were established and launched (from Feilden, B, 1982; Rosvall, et al., 1999):
Figure 19. Definition of conservation by Sir Bernard Feilden. (Feilden, B., 1982).
Figure 20. ‘Definition of preventive conservation.’ (IIC Working Group on Preventive Conservation). Final draft, November 9, 2006 Page 17 of 32
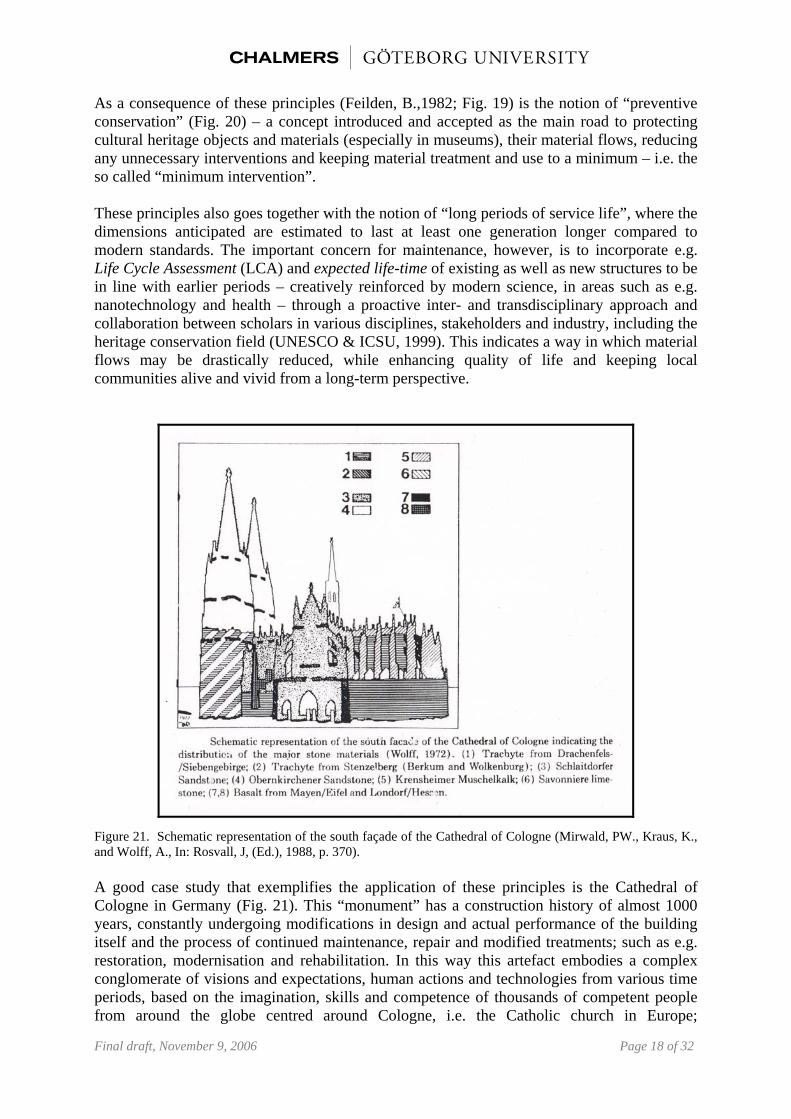
As a consequence of these principles (Feilden, B.,1982; Fig. 19) is the notion of “preventive conservation” (Fig. 20) – a concept introduced and accepted as the main road to protecting cultural heritage objects and materials (especially in museums), their material flows, reducing any unnecessary interventions and keeping material treatment and use to a minimum – i.e. the so called “minimum intervention”. These principles also goes together with the notion of “long periods of service life”, where the dimensions anticipated are estimated to last at least one generation longer compared to modern standards. The important concern for maintenance, however, is to incorporate e.g. Life Cycle Assessment (LCA) and expected life-time of existing as well as new structures to be in line with earlier periods – creatively reinforced by modern science, in areas such as e.g. nanotechnology and health – through a proactive inter- and transdisciplinary approach and collaboration between scholars in various disciplines, stakeholders and industry, including the heritage conservation field (UNESCO & ICSU, 1999). This indicates a way in which material flows may be drastically reduced, while enhancing quality of life and keeping local communities alive and vivid from a long-term perspective.
Figure 21. Schematic representation of the south façade of the Cathedral of Cologne (Mirwald, PW., Kraus, K., and Wolff, A., In: Rosvall, J, (Ed.), 1988, p. 370). A good case study that exemplifies the application of these principles is the Cathedral of Cologne in Germany (Fig. 21). This “monument” has a construction history of almost 1000 years, constantly undergoing modifications in design and actual performance of the building itself and the process of continued maintenance, repair and modified treatments; such as e.g. restoration, modernisation and rehabilitation. In this way this artefact embodies a complex conglomerate of visions and expectations, human actions and technologies from various time periods, based on the imagination, skills and competence of thousands of competent people from around the globe centred around Cologne, i.e. the Catholic church in Europe;
Final draft, November 9, 2006 Page 18 of 32
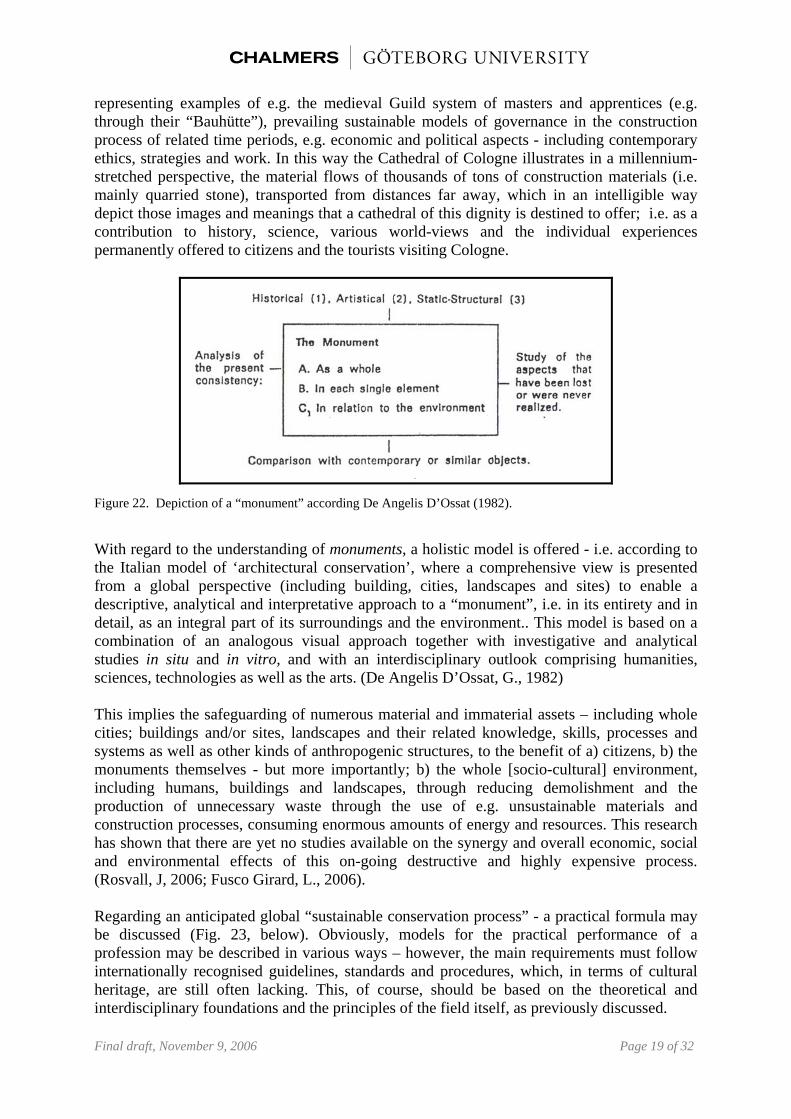
representing examples of e.g. the medieval Guild system of masters and apprentices (e.g. through their “Bauhütte”), prevailing sustainable models of governance in the construction process of related time periods, e.g. economic and political aspects - including contemporary ethics, strategies and work. In this way the Cathedral of Cologne illustrates in a millennium-stretched perspective, the material flows of thousands of tons of construction materials (i.e. mainly quarried stone), transported from distances far away, which in an intelligible way depict those images and meanings that a cathedral of this dignity is destined to offer; i.e. as a contribution to history, science, various world-views and the individual experiences permanently offered to citizens and the tourists visiting Cologne.
Figure 22. Depiction of a “monument” according De Angelis D’Ossat (1982).
With regard to the understanding of monuments, a holistic model is offered - i.e. according to the Italian model of ‘architectural conservation’, where a comprehensive view is presented from a global perspective (including building, cities, landscapes and sites) to enable a descriptive, analytical and interpretative approach to a “monument”, i.e. in its entirety and in detail, as an integral part of its surroundings and the environment.. This model is based on a combination of an analogous visual approach together with investigative and analytical studies in situ and in vitro, and with an interdisciplinary outlook comprising humanities, sciences, technologies as well as the arts. (De Angelis D’Ossat, G., 1982) This implies the safeguarding of numerous material and immaterial assets – including whole cities; buildings and/or sites, landscapes and their related knowledge, skills, processes and systems as well as other kinds of anthropogenic structures, to the benefit of a) citizens, b) the monuments themselves - but more importantly; b) the whole [socio-cultural] environment, including humans, buildings and landscapes, through reducing demolishment and the production of unnecessary waste through the use of e.g. unsustainable materials and construction processes, consuming enormous amounts of energy and resources. This research has shown that there are yet no studies available on the synergy and overall economic, social and environmental effects of this on-going destructive and highly expensive process. (Rosvall, J, 2006; Fusco Girard, L., 2006). Regarding an anticipated global “sustainable conservation process” - a practical formula may be discussed (Fig. 23, below). Obviously, models for the practical performance of a profession may be described in various ways – however, the main requirements must follow internationally recognised guidelines, standards and procedures, which, in terms of cultural heritage, are still often lacking. This, of course, should be based on the theoretical and interdisciplinary foundations and the principles of the field itself, as previously discussed.
Final draft, November 9, 2006 Page 19 of 32

Figure 23. A formula for the conservation process based on the principles of ‘integrated conservation’. (Rosvall, J, et al, 1999).
This stresses the need for a systemic approach, including national and international effort and transdisciplinary collaboration, including the development of new R&D projects to support e.g. regional development and the globally confirmed aims to minimise energy-use and waste through unnecessary interventions – e.g. by fostering a “preventive attitude” and by promoting the use of low-energy compatible and environmentally friendly substances and processes – not only for conservation purposes, but for new construction and sustainable development planning and processes at large; including social and economic planning and production, such as e.g. sustainable industrial processing of materials, construction processes, education and workforce development, urban regeneration and development to the benefit of citizens and society at large. (van Gigch, 1991; Rosvall, J., 2006; Johansson, E., 2006). After having studied a magnitude of objects, scholarly-scientific, technical, professional sources and demands on material conservation, i.e. including conservation theory and ethics, its various applications and dimensions; i.e. ranging from theoretical epistemology to professional aspects and practical interventions and sustainability - it has become a normative demand to find a reasonable conservation strategy, to be linked with the field’s immediate concern as well as with external sectors of importance. It is an imperative aim to find a common route to the diminishment of environmentally detrimental factors and risks of all kinds. Based on the above, the next logical step would be to prepare jointly for the establishment of a comprehensive system of preventive sustainable conservation measures to be applied on a global level, not only in sectors of immediate concern, such as specific conservation programs (i.e. “direct conservation”), or to the benefit of e.g. local communities in a separated manner - but rather comprehensively and on a global level, based on a collective, collaborative view and an integrated cultural heritage and sustainability perspective.
Final draft, November 9, 2006 Page 20 of 32

Figure 24. Proposed strategy for ‘integrated conservation’ systems. (Rosvall, et al. 1999). Not until these principles have been established it seems relevant to focus on the issue of so called “direct conservation” – this since all experience tells us that e.g. practical interventions in processes that have a negative impact (e.g. air pollution) will automatically gain contra-productive results. Thus, the establishment of highly qualified networks of interdisciplinary research teams and cooperation; including clusters of organisations, businesses and industrial partners, and links with adequately equipped public agencies and NGO’s are fundamental for the promotion and operation of relevant modelling in the field. The scope of the field presented above may only be developed in “real” situations, and being generally accepted and applied in daily operations in public and private organisations, when satisfying the demands to have been considered as part of a general policy of concern for most citizens, authorities and enterprises, in a long-term perspective. Having reached that level of general acceptance, conservation as a concerned activity has a huge capacity to contribute to the development for “our common future”, and for a sustained world, with profoundly required dimensions otherwise not cared for (Brundtland, G-H, 1997).
Final draft, November 9, 2006 Page 21 of 32

Figure 25. Ideogram of components related to the policy of conservation (Rosvall, J., et al, 1999)
Figure 26. Modeling and Metamodeling hierarchy (according to van Gigch, J.,1992). The epistemological approach of this presentation, and its general discourse, has been established during many years and under careful consideration of theoretical aspects and the principles of past and present scholarly-scientific research, ethics and modelling, for implementation on the intervention level in “the real world”, i.e. by means of meta-modelling (Fig. 26: van Gigch, J. P., 1991; 1992; van Gigch, J. P. & Rosvall, J., 1991). Final draft, November 9, 2006 Page 22 of 32

Figure 27. Meta-modelling as applied to science. (van Gigch, J. P., 1999) The General Systems Theory (GST) and approach to meta-modelling as applied to cultural heritage and sustainability may be used in a variety of ways (Fig. 27). The most suitable would be within the world of academics in affiliation with a network of collaborating partners, i.e. within the industrial- and/or the public sector - for example, when analysing organisations at different levels, ranging from individual and/or local to “supra-national” organisations (public as well as private). This approach is extremely helpful and has an immensely clarifying capacity, especially with regard to the understanding and explanation of the complexity of issues - their compatibility and/or contradictory relations, including the multitude of factors and scenarios involved (van Gigch, J. P., 1992). Considering the holistic discourse of the so called “Conservation Information System” (Fig. 28, below) – i.e. its epistemology and underpinning perspectives of more general concern and the modelling at various levels - including, but not limited to the conservation sector. A comprehensive flow-chart may be used to demonstrate its major characteristics and components, as outlined above (e.g. Figs 5 and 27). The “Göteborg Model” (Fig. 29) is an ideogram demonstrating the city of Göteborg, i.e. its current and anticipated situation (including education and training) and its vicinity – aiming at ‘sustainable conservation’ – i.e. an example of a “Conservation Information System” as applied to local circumstances. It is also possible to illustrate the main components of the “conservation industry” itself (Fig. 30). The four main areas of interest demonstrate an emerging academic discipline and a new paradigm for education and training as well as RTD (at various levels, within and outside academia) - to the benefit of conservation, the environment and to society at large, including public and private sectors. Besides these operative dimensions, the strategic importance and nature of this approach is indicated, in the form of a continued standards processing and establishment of a policy discourse for the field, linked to relevant research and development in other sectors. Obviously, a paradigmatic shift in the current conservation discourse is underway, that will have both theoretical and practical implications on e.g. policy, the economy, and on the future handling of cultural heritage resources and the environment at large.
Final draft, November 9, 2006 Page 23 of 32

Fig. 28. The “Conservation Information System” (CIS). (Lagerqvist, B, 1996). Final draft, November 9, 2006 Page 24 of 32

Figure 29. The “Göteborg Model” (Rosvall, J., Johansson, E. & Meiling P., 2004).
Final draft, November 9, 2006 Page 25 of 32
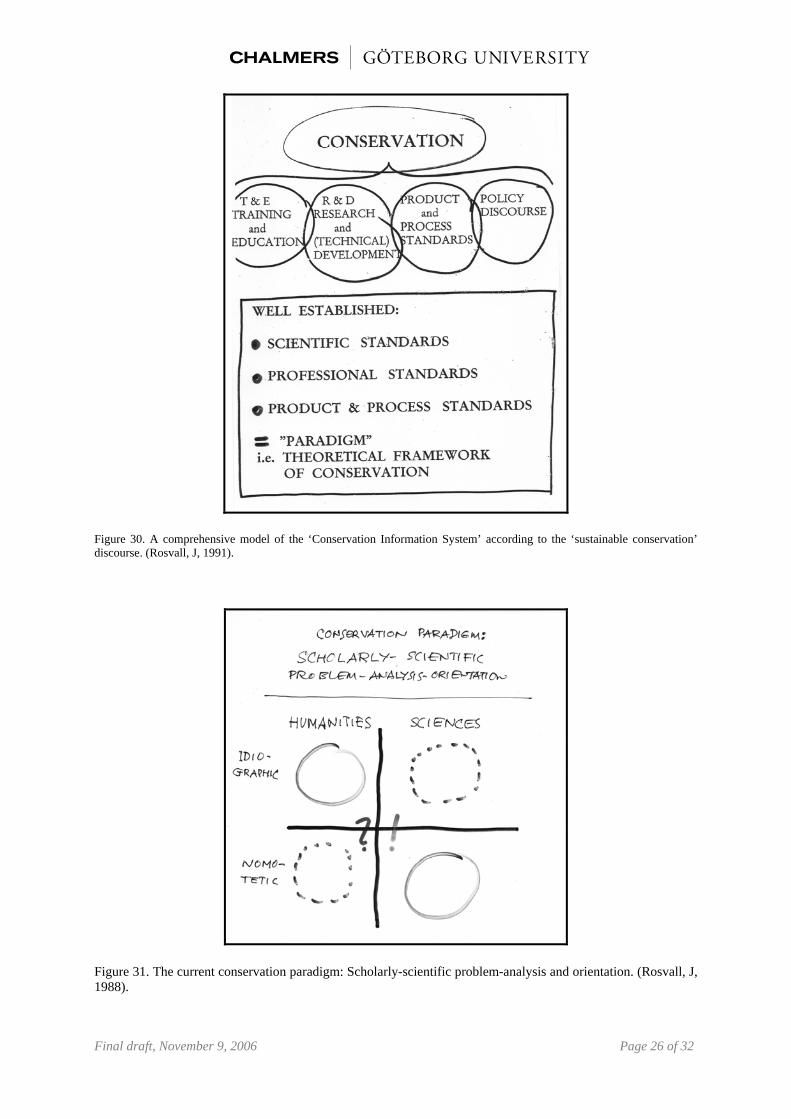
Figure 30. A comprehensive model of the ‘Conservation Information System’ according to the ‘sustainable conservation’ discourse. (Rosvall, J, 1991).
Figure 31. The current conservation paradigm: Scholarly-scientific problem-analysis and orientation. (Rosvall, J, 1988). Final draft, November 9, 2006 Page 26 of 32

The concluding ideogram (Fig. 31) represents a holistic view on the field, as a highly valid case and as representative for the fundamental need of basic and applied research, promoting a new scholarly-scholarly scientific modelling. The objective would be to over-bridge “the two cultures” of theory and practice; and to the benefit from existing relevant inter- and transdisciplinary research models, including integration between application-oriented and disciplinary theoretical research. In this case conservation may function as a catalyst and/or a ‘model’, offering highly valid “testing fields” for many other fields and/or areas of concern - especially sustainability and environmental engineering. Conclusion The need to implement and experiment with innovative approaches to sustainability and the conservation of heritage resources is more critical than ever. Up to date, sustainable development work in conservation has been suffering from fragmentation and gaps within and between scientists and different disciplines, policy-makers, business organizations, non-governmental organizations and individuals, being the most important challenge facing humanity today. “Sustainable development must be addressed by all these sectors and actors, within difference scientific fields and between the academia and the larger societal system through the philosophy of cooperation and through mutual learning”. (Johansson, E., 2006, Rosvall, et al., 1999, Cassar, M. et al. 2001). This paper argues that the nature and increasing complexity of environmental and cultural resource problems require international cross-/interdisciplinary collaboration and the use of transdisciplinary [systemic] modelling approaches that can incorporate knowledge from a broad range of scientific disciplines – including e.g. conservation, environmental and sustainability science, health, nanotechnology, environmental and structural engineering, architectural history and design, material sciences, agricultural sciences etc. in collaboration with community stakeholders, industry, SMEs, and e.g. the traditional crafts. It is recognized that ‘conservation for sustainable development’ - as an overall goal and ‘sustainable development’ as an integrated and continuous sub theme should be developed and implemented at all levels of society - i.e. in social, economic and environmental planning - both nationally and globally. (Rosvall, J., Engelbrektsson, N., & Johansson, E., 2006). It seems that only by bringing a totally different approach to the conservation of the natural and built environment, i.e. its processes and care - we can do more than pay lip service to the notion of sustainability in the broadest sense. Ultimately we need to integrate those two cultures, and educate our whole population - not only students in the philosophy and the technical skills essential to their profession - but also policy-makers, decision-makers at various levels and the general public, to imbue an understanding of a greater goal that must eventually be shared by our whole culture (e.g. according to the requirements of Education for Sustainable Development, ESD) – the fostering of a transdisciplinary attitude of importance in all segments of society. This involves such issues as e.g. equity, responsibility, ethics and philosophies that go beyond the traditional to provide guidance for an approach to a sustainable future for our society and our environmental [cultural] patrimony at large. (Johansson, 2006, Rosvall, 1999; Kain, 2003; Nicolescu, B, 2006; UNESCO). Final draft, November 9, 2006 Page 27 of 32

References ___________________________________________________________________________ Azar, C., Holmberg, J. & Karlsson, S. (2002). Decoupling. Past trends and prospects for the future. Physical Resource Theory, Chalmers University of Technology and Göteborg University. Baccini, P. and Franz O. (Eds.) (1999). Netzstadt: Transdisziplinäre Methoden zum Umbau urbaner Systeme (Web City - Transdisciplinary Methods for Reconstructing Urban Systems). Hochschulverlag AG an der ETH Zürich, Zürich. Ball, D., & Watt. Risk Management to Cultural Heritage. Middlesex University, School of Health, Biological and Environmental Sciences, London, UK. Beck, U. 1992 [1986], Risk Society. Towards a New Modernity. SAGE Publications, London. Boyd, T. & Kimmet, P. (2004). “Innovative Benchmarks for Built Assets Performance – The Triple Bottom-line Approach”, Procurement and Risk Sharing: Clients Driving Innovation Conference, School of Construction Management and Property, QUT, Brisbane, Australia. Brimblecombe, P. & Rodhe, H., (1988). Air pollution: Historical trends. In: Air Pollution and Conservation, Rosvall, J. (Ed.), Elsevier Science Publishers, B.V. Amsterdam. Brundtland, G. H. (1997). Our Common Future, World Heritage Commission, Geneva. Cassar, M. (2006). Evaluating the Benefits of Cultural Heritage Preservation: An Overview of International Initiatives, Centre for Sustainable Heritage, UK. Cassar, M. et al (2001). Technological Requirements for Solutions in the Conservation and Protection of Historic Monuments and Archaeological Remains, Final report to the European Parliament, Scientific and Technological Options Assessment Unit, (STOA project, 2000/13-Cult/04), Luxembourg. CIB (1999). Agenda 21 on Sustainable Construction. CIB Report Publication 237, Rotterdam. Cobb, J. & Daly, H. (1989). For the Common Good: Redirecting the Economy toward Community, the Environment and a Sustainable Future. Beacon Press. Day, C. (2002), Spirit & Place: Healing our Environment/Healing Environment. Architectural Press, Oxford. De Angelis D'Ossat, G., (1982). Guide to the Methodical Study of Monuments and Causes of their Deterioration. 2nd edition, Rome. de la Torre, M. & Mason, R. (2006). Economics and Heritage Conservation: Issues and Ideas on Valuing Heritage, Getty Conservation Institute, Los Angeles. de la Torre, M. (2002). Assessing the Values of Cultural Heritage, Research Report, the Getty Conservation Institute, Los Angeles. UNESCO & ICSU (1999). Draft Declaration on Science and the Use of Scientific Knowledge, World Conference on Science: “Science for the Twenty-First Century – A New Commitment”, Budapest, Hungary, 26 June – 1 July, 1999. United Nations Educational, Scientific and Cultural Organization (UNESCO) and the International Council for Science (ICSU): Engelbrektsson, N. (1987). Integrated conservation – research and students´projects in Swedish communities. In: Planning & Conservation. London 13-15 April 1987, pp 263-276. Engelbrektsson, N., Jönsson, J., Rosvall, J., (2003). Application of Integrated Conservation strategies and approaches in different kinds of built-up environments. In: Local Agenda 21 and Work. Leonardo da Vinci Program pp 995-1024.
Final draft, November 9, 2006 Page 28 of 32

Engelbrektsson, N., Rosvall, J. (2004). ”Integrated Conservation and Environmental Challenge”: Reflections on the Swedish Case of Habitat, The Human Sustainable City: Challenges and Perspectives from the Habitat Agenda, Ashgate Pub Co. ENSURE (2006). The Graz Charter on Sustainable Regional Development. The European Network for Sustainable Urban and Regional Development Research. Etzkowitz, H. (2002). The Triple Helix of University-Industry-Government: Implications for Policy Evaluation. Working paper 2002:11. Science Policy Institute. EU Expertgroup on the Urban Environment 1996, European Sustainable Cities. European Commission, DGXII. Feilden, B. M. (1982). Conservation of Historic Buildings, Butterworth Scientific, Butterworth & Co. (Publishers) Ltd., London. Fet , A.M., et al. (1996). ”A Systems Approach to Environmental Engineering – Collaboration between University, Research Center and Industry”, Paper presented at the Interdisciplinary Environmental Association (IEA, 2nd International Interdisciplinary Conference on the Environment, Newport Rhode Island, USA, June 15-20 1996. (2002). First International Conference Monumentenwacht, held on 15 and 16 September 2000, the Netherlands, Amsterdam – Amersfoort. Foundation “Federatie Monumentenwacht Nederland”, Foundation “Nationaal Contact Monumenten”. Patronised by Europa Nostra. Supported by Dutch Ministry of Education, Culture and Science (OCW). Council of Europe Campaign: “Europe a Common Heritage”, December 2002. (2004). Forskningsstrategi för hållbart samhällsbyggande. Rapportering av ett regeringsuppdrag till Formas i samarbete med Byggsektorns InnovationsCentrum (BIC). Rapport 2:2002. Fitch, J. M. (1998), Historic Preservation: Curatorial Management of the Built World, McGraw Hill Inc., Fourth Edition, University of Virginia. Fudge, C. & Rowe, J. (2000), Implementing Sustainable Futures in Sweden. Byggforskningsrådet T19:2000. Fusco Girard. L. (2006). Celebrating our Urban Heritage: Innovative Strategies for Urban Heritage Conservation, Sustainable Development, and Renewable Energy. Global Urban Development, Volume 2 Issue 1 March. Holmberg, J. (1992), Resursteoretiska principer för en bärkraftig utveckling, Chalmers University of Technology, Göteborg. Hristina, S. (2006). “Sustainable Conservation Systems for Preservation of Monuments, Sites and Their Settings”, Monuments and Sites and their Setting – Conserving Cultural Heritage in Changing Townscapes and Landscapes, Section II: Vulnerabilities within the settings of monuments and sites: understanding the threats and defining appropriate responses. (1996). ICTOP 26th Annual Conference: International Committee for the Training of Personnel, Cadernos de Sociomuseologica, Universidade Lusófona de Humanidades e Tecnologias, 6-1996. Johansson, E. (2004). “Ph.D. Research in Sweden: Expanding the Frontiers of Conservation Knowledge”, APT Communiqué, Association for Preservation Technology International (APTI), Volume 33, Number 3. Johansson E. (2006). A Systemic Approach to Education, Training, Research and Development in Conservation. Position paper 1 (Preliminary draft, October 16, 2006, unpublished). Potential collaboration within the 7th Framework Programme of the European Community, informally presented at the workshop for the Horizontal Level 1: Education, training and ethics, Focus Area on Cultural Heritage (FACH), European Construction Technology Platform (ECTP), “Conference and Brokerage Event, Construction Aspects and Built Heritage Protection: Research Needs”, Dubrovnik (Cavtat), Croatia, October 14-17, 2006. Jönsson Å. (1998). Life Cycle Assessment of Building Products. Doctoral Dissertation, Teknisk miljöplanering, Chalmers University of Technology, Göteborg.
Final draft, November 9, 2006 Page 29 of 32

Kain, J-H. (2003). Sociotechnical knowledge: An Operationlised Approach to Localised Infrastructure Planning and Sustainable Urban Development, Doctoral dissertation, Department of Built Environment & Sustainable Development, Göteborg, Sweden. Koslowski, R. (Ed.). (2003). Proceedings of the 5th European Commission Conference on Research for the Protection of Cultural Heritage: A Pan European Challenge. European Commission, Brussels. Krumbein, W. E. et al. (1994); Durability and Change: The Science, Responsibility, and Cost of Sustaining Cultural Heritage, report of the Dahlem Workshop, December 6-11, 1992. Environmental Sciences Research Report ES 15. John Wiley & Sons, Chichester. Lagerqvist, B. (1996). The Conservation Information System: Photogrammetry as a Base for Designing Documentation in Conservation and Cultural Resource Management. Doctoral Dissertation at the Institute of Conservation, Göteborg University. Göteborg Studies in Conservation, No. 4. Acta Universitatis Gothoburgensis. (2004). Learning for a New World. Report 2; Theme: Sustainable Development, Administrative Offices, School of Development Unit, City of Gothenburg. Mirwald, PW., Kraus, K. & Wolff, A. (1988). Stone Deterioration on the Cathedral of Cologne. In: Rosvall, J, (Ed.), Air Pollution and Conservation, 1988, p. 365-386. Morin, E. (1999). Seven Complex Lessons in Education for the Future. Translated from the French by Nidra Poller. United Nations Educational, Scientific and Cultural Organization (UNESCO). Muños Vinas, S. (2005). Contemporary Theory of Conservation, Elsevier Butterworth-Heinemann, Oxford. Nicolescu, B. (2006). The Transdisciplinary Evolution of Learning, Centre International de Recherches et d’Etudes Transdisciplinaires (CIRET). Nypan, T. (2003). Cultural Heritage Monuments and Historic buildings as value generators in a post-industrial economy. With emphasis on exploring the role of the sector as economic driver. Revised version. Directorate for Cultural Heritage, Norway. Regeringskansliet. (2002). An Agenda 21 for Education in the Baltic Sea Region – Baltic 21 E, Baltic 21 Series No. 2/02. Riegl, A. (1982). The Modern Cult of Monuments: Its Character and its Origin. In: Oppositions. A Journal for Ideas and Criticism in Architecture. Fall 1982:25. Rosvall, J., (1988). Air pollution and conservation, In: Air Pollution and Conservation. Safeguarding our Architectural Heritage. Ed. Rosvall J, co-ed. Aleby S. Amsterdam: Elsevier, Rosvall, J. (1999). The Heritage Restoration Facing a New Challenge: Sustained Development, paper presented at the European Historical Heritage as Employment Generating Source International Congress held at Caceres, Spain, April 28-30 1999. Rosvall, J., Engelbrektsson, N.; Lagerqvist, B., and van Gigch, P (1999). ”International Perspectives on Strategic Planning for Research and Education in Conservation”. Paper presented at Convegno internazionale di studi “Giovanni Secco Suardo”. La cultura del restauro tra tutela e conservazione dell’ opere d´arte. Bergamo 9-11, March 1995. In. Bollettino d´Arte, 1999. Rosvall, J., Johansson, E. and Meiling P. (2004). “The Göteborg Model”, in Proceedings from 4th Meeting Working Group on EU Directives and Cultural Heritage, November 25-27, 2004, Milan Italy, (pp25-53). Rosvall, J., Wenbladh, A. Conservation audits – a Systematic Approach to Environmental Preservation of Cultural Resources. Rosvall, J., (2006). Conservation of the Built Environment: Long term Protection and Dynamic Sustainable Development – Heritage at Large. Keynote presented at the Conference and Brokerage Event: Construction Aspects of Built Heritage Protection: Research Needs, Dubrovnik, Croatia, 14-17 October, 2006.
Final draft, November 9, 2006 Page 30 of 32

Sachs, W., Loske, R. & Linz, M. et al. (1996). Greening the North. A Post-industrial Blueprint for Ecology and Equity. A study by the Wuppertal Institute for Climate, Environment and Energy, Zed Books, London & New York. Scott, W., Gough, S. (2003). Sustainable Development and Learning: Framing the Issues, Taylor and Francis. Scott, W., Gough, S. (2003). Key Issues in Sustainable Development and Learning., Taylor and Francis. Singh, J. Environmental monitoring and the development of holistic sustainable conservation solutions – An Overview”, Chapter 1, In: Environmental Monitoring of our Cultural Heritage. Sustainable Conservation Solutions, published by Environmental Building Solutions Ltd, UK. Stø, E. & Strandbakken P.,m (2005). ”Social Impacts of Sustainable Innovations: A Critical Perspective. Rethinking Modern Urbanity”, Paper presented at the 10. European Roundtable on Sustainable Consumption and Production Antwerp, Belgium, October 4 – 7 2005. National Institute for Consumer Research (SIFO), Norway. (2003). The Convention for the Safeguarding of the Intangible Cultural Heritage, UNESCO, Paris. (1964) Charter of Venice, International Charter for the Conservation and Restoration of Monuments and Sites. Thuvander L. (2000). The Building Stock. A Complex System Changing over Time. Licentiate thesis, Arkitektur, Chalmers University of Technology, Göteborg. van Balen, K. From Conservation Principles to Materialization, (Or the other way around: how is materialization guided by principles?), K.U. Leuven, date unknown. van Berkel, R. (2005). “Innovation and Technology for a Sustainable Materials Future”, MATE05: Materials and Testing: Science, Technology and Applications, Fremantle, WA, 30 October – 2 November 2005, Center of Excellence for Cleaner Production, Curtin University of Technology, Perth, Australia. van Gigch, J. P. (1992); An Organizational Framework to Calculate value Tradeoffs in Conservation Systems, paper presented at the EUROCARE conference, Gothenburg, Sweden, December 1992. Institute of Conservation, University of Gothenburg and California State University, Sacramento, CA, USA. van Gigch, J. P. (1991). System Design Modeling and Metamodelling. California State University, Sacramento, California, Premium Press, New York and London. van Gigch, J., P., Lagerqvist, B., Rosvall, J. (1996). Setting a Strategic Framework for Conservation Standards. In: Standards for Preservation and Rehabilitation. Ed. by Stephen J. Kelley. ASTM, USA. pp. 64-71, ASTM publication code number (PCN): 04-012580-10 van Gigch, J., P., Rosvall J., (1991). Multilevel Ethics of Conservation. In: Human Systems Management 10, no 4, pp 287-292. (1994). Charter of Transdisciplinarity. Adopted at the First World Congress of Trandisciplinarity, Convento da Arrábida, Portugal, November 2-6, 1994. UN Decade of Education for Sustainable Development (2005-2014), United Nations Educational, Scientific and Cultural Organisation, UNESCO. UAEPME (1998). Memorandum to Develop Employment and Improve Heritage Restoration, Jobs for Tomorrow: Craft, Trades, SMEs and Restoration of National Heritage. Research action carried out in Germany Austria, Spain and Italy, in partnership with Zentralverband des Deutchen Handwerks, Wirtschaftskammer Österreich, Confederacion Espanola de Asociaciones de Jovenes Emprasiarios, Confartigianato, with support of the European Commission. European Association of Craft, Small and Medium-sized Enterprises (UAEPME). UNCED, (The United Nations Conference on Environment and Development) (1992). Agenda-21. United Nations. Rio de Janeiro.
Final draft, November 9, 2006 Page 31 of 32

Waller, R. R. (2003). “Cultural Property Risk Analysis Model. Development and Application to Preventive Conservation at the Canadian Museum of Nature”. Doctoral Dissertation at the Institute of Conservation, Göteborg University. Göteborg Studies in Conservation, No. 13. Acta Universitatis Gothoburgensis. Weaver, M. E. (1997). Conserving Buildings: An Introduction to Materials and Techniques, Preservation Press, John Wiley & Sons, Inc., New York. (2003). Wuppertal Institute for Climate and Energy: Annual Report 2003/04. Science Centre North Rhine-Westphalia, Institute of Work and Technology and Institute of Culture Studies, Wuppertal Institute for climate Environment and Energy.
Final draft, November 9, 2006 Page 32 of 32

Forescene Workshop, Vienna Industry/Economy
What could the informal economy have to do with investment in environmentally friendly biofuels and the WTO?
by Thomas Ruddy, www.wsis.ethz.ch/seri.htm
Introduction to the area of expertise trade and investment A good Sustainable Development Strategy (SDS) is not a Christmas-tree-type fulfillment of all wishes. Instead it should be a result from a societal consensus on trade-offs. How far should our society go in balancing off goals that appear to be in opposition to one another? Earlier this year the Netherlands Environmental Assessment Agency MNP investigated citizens’ world views in relation to the EU SDS. The results of the survey were plotted in relation to the two axes shown in Fig. 1 based on Ridder / Wesselink (2006). Hence each world view represented a trade-off between two pairs of opposites.
Fig. 1: Coordinates of world views of Dutch citizens
Although many harbor ambivalent feelings about globalization as the results of the survey revealed in Dutch citizens, economic globalization can be said to comprise the main paradigm of my area of expertise, trade and investment; it is the current economic integration project providing affluence. The comparable previous economic integration project was called the Belle Epoque in the British Empire from the late Nineteenth Century until World War I.
Globalization
Effici-ency
Solid-arity
Localization

2
What do we expect from globalization by the Year 2030? How much generation of world GDP per capita would suffice? What would be enough progress on convergence towards a truly equitable distribution of the gains? How fast should we be proceeding with integration in the three phases shown in Fig. 2? Where is the power vested to decide on the distribution of gains?
Fig. 2: Phases of economic integration
The governance of the phases of economic integration shown in Fig. 2 is taking place on the three levels shown in Table 1.
R&D or ideas
Trade goods
Invest capital

3
Table 1: Multilevel governance structure of phases of economic integration
Phase of economic integration
Three levels of governance
R&D ideas
Multilateral - WIPO
USA (in future China?)
National patent offices
Invest capital
Multilateral - MAI attempted at OECD in 1998
Regional - NAFTA
Bilateral – 2000 treaties
Trade goods
Multilateral level - WTO
Regional - EU
Bilateral

4
Long-range goals for my area of expertise and industry /economy
Within the EU of the 15 Trade flows in monetary terms
Fig. 3: Interregional flows of goods in the Year 2000 (simplified from Monde Diplomatique (2003): Atlas der Globalisierung)
In keeping with the phases shown in Fig. 2, the following forces should be added to the above trade in goods flows: trade in services, flows in investment and payments for the use of Intellectual Property Rights (IPRs).
Western Europe
Asia
North America
$400 bn
South Amer-ica
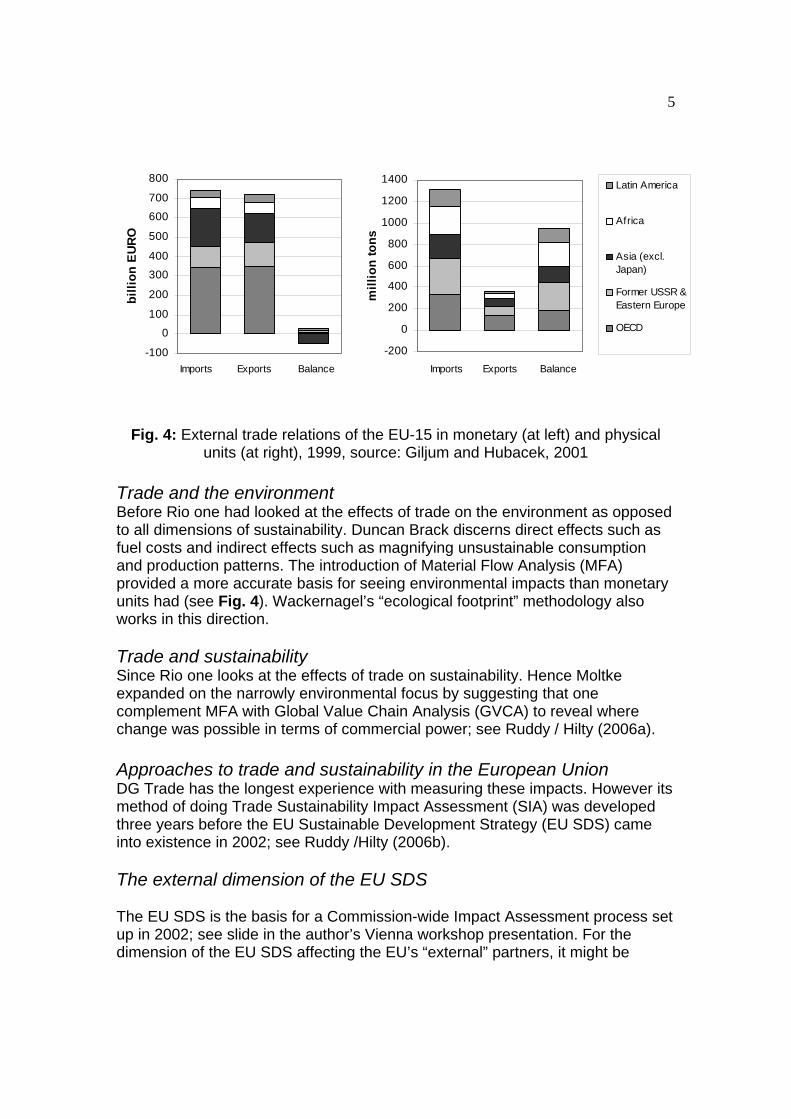
5
Trade flows in physical terms
Fig. 4: External trade relations of the EU-15 in monetary (at left) and physical units (at right), 1999, source: Giljum and Hubacek, 2001
Trade and the environment Before Rio one had looked at the effects of trade on the environment as opposed to all dimensions of sustainability. Duncan Brack discerns direct effects such as fuel costs and indirect effects such as magnifying unsustainable consumption and production patterns. The introduction of Material Flow Analysis (MFA) provided a more accurate basis for seeing environmental impacts than monetary units had (see Fig. 4). Wackernagel’s “ecological footprint” methodology also works in this direction. Trade and sustainability Since Rio one looks at the effects of trade on sustainability. Hence Moltke expanded on the narrowly environmental focus by suggesting that one complement MFA with Global Value Chain Analysis (GVCA) to reveal where change was possible in terms of commercial power; see Ruddy / Hilty (2006a). Approaches to trade and sustainability in the European Union DG Trade has the longest experience with measuring these impacts. However its method of doing Trade Sustainability Impact Assessment (SIA) was developed three years before the EU Sustainable Development Strategy (EU SDS) came into existence in 2002; see Ruddy /Hilty (2006b). The external dimension of the EU SDS The EU SDS is the basis for a Commission-wide Impact Assessment process set up in 2002; see slide in the author’s Vienna workshop presentation. For the dimension of the EU SDS affecting the EU’s “external” partners, it might be
-100
0
100
200
300
400
500
600
700
800
billi
on E
UR
O
BalanceExportsImports
-200
0
200
400
600
800
1000
1200
1400
mill
ion
tons
Latin America
Africa
Asia (excl.Japan)
Former USSR &Eastern Europe
OECD
BalanceExportsImports

6
useful to consider the similar list of eight Millennium Development Goals to be striven towards by all member states of the United Nations before 2015. The final Goal 8 calls for “Developing a global partnership for development”. That goal’s subsidiary, more specific Target 12 calls for “Developing further an open, rule-based, predictable, non-discriminatory trading and financial system.” The importance of this goal is underlined in a remark in the UNDP’s Human Development Report 2003. UNDP complains that “It is hard to imagine the poorest countries achieving Goals 1–7 without the policy changes required in rich countries to achieve Goal 8”, as pointed out by SAWTEE (2004).
Key Sustainability Scenario Elements (SSEs)
Trade
This paper proposes as key SSEs the material flows, global value chain data, capital allocation and sharing of technology alluded to above for the factors of production other than labor, plus the following items for labor.
The difficulties in “mobilizing labor”
Unlike the other factors of production, labor has difficulty becoming global; refer back to Fig. 2. Reasons can be as simple as the fact that workers do not like to relocate away from the contexts in which they are socially embedded. Therefore labor deserves the following dedicated listing of its SSEs Economic integration in combination with demographic changes is causing migration of many young earners from developing countries to the North, some temporarily. Many of the young workers are sending remittances back to their dependents in amounts that have recently begun exceeding Official Development Assistance (ODA). This topic is already causing controversy in the EU. Parallel to this global development, in China many young earners are relocating from underdeveloped areas to cities as part of a wave of urbanization. In the North meanwhile, a wave of old earners is retiring as pensioners. These massive shifts are related to changes in the relationship between Dienst nach Vorschrift, or civilization as we in the North know it, on the one hand, and the “informal economy” on the other. In the North the informal economy conceals unpaid work and gender issues; in the South it typically generates half of countries’ GDP. Another aspect of the informal economy is the production of counterfeit products. That controversial practice involves the above-mentioned global integration of R&D, as do training and the “brain drain”1. See Ruddy /Hilty (2006a). 1 The brain drain is improving: “From 1990 to 2000 …the number of expatriates from China, India, and Africa more than doubled. However, by 2000, home countries were absorbing relatively more of their highly educated citizens than in the past…, indicating that much of the world had developed an infrastructure capable of using these highly educated people productively,” from US National Science Foundation 2006

7
Investment Multi-National Enterprises (MNEs) have risen to such prominence as to see their sales now comprise 50% of world GDP (UNCTAD as cited by Gugler / Tomsik 2006, p.5). Their Foreign Direct Investment (FDI) has two different relationships to trade, both in being substituted for trade and in reinforcing trade by boosting exports from sites outside the investor’s home country. Energy investment “The [International Energy Agency, OECD, Paris] IEA estimates that a total capital investment of $8.1 trillion, equivalent to an average of $300 billion per year… is needed from 2003 to 2030 for the developing and transition economies to meet their energy needs,” writes the joint World Bank and IMF Development Committee in 2006, p.vii. Narrative: What could the informal economy have to do with investment in environmentally friendly biofuels and the WTO? Is this a causal chain? Dissatisfaction rises in the informal economy among those confronted with unemployment, marginalization, migration, urbanization and uprooting from their traditional value systems. Political unrest in countries with large informal economies holding reserves of natural resources such as oil lead to price increases over $60 per barrel. This oil price level makes alternative fuels economically attractive, and the market booms for biofuels. Biofuels and the WTO If a member state of the WTO exercises a preference for biofuels certified as environmentally friendly, that event might attract a challenger to bring the matter before the WTO as the next test case to be decided under the Technical Barriers to Trade (TBT) Agreement. In previous years the agreement permitted trade lawyers to answer the question as to whether Process and Production Methods (PPM) were product-related in the now-famous tuna/dolphin and shrimp/turtle cases. In general, governments and quasi-governmental agencies in member states of the WTO are not allowed to discriminate on the basis of non-product-related PPMs, although the private sector and NGOs of course are not hindered from doing so. Life-cycle Assessment (LCA) approaches and ecolabelling schemes rely on being allowed to distinguish products by their PPMs, only some of which qualify as adequately “product-related” under the TBT. Developing countries suspect the North of “green protectionism” and fear for the competitiveness of their exports. Duncan Brack explains these relationships in greater detail in his 2000 paper "Trade and Environment after Seattle". There are linkages here to the other project areas agriculture and land use. Biofuels compete with food production and biodiversity preservation. Infrastructure layout affects mobility needs, which are linked to energy demand.

8
Related epistemic communities Sustainability Science The SustainabilityA-Test project has developed an electronic webbook that provides access to a vast amount of information on tools that can provide support in carrying out an integrated assessment, www.sustainabilitya-test.net International Political Economy (IPE) GARNET is a Network of Excellence on Global Governance, Regionalization and Regulation: The Role of the EU, http://www.garnet-eu.org/ The regionalism and inter-regionalism described in GARNET are distinctly different from the “regionalisation” referred to in Ridder / Wesselink (2006). For that reason the original mention of “regionalisation” has been given above as “local” instead. See also Aggarwal on the rise of inter-regionalism, a trend that has accelerated after the failure of talks on a Doha Development Agenda for a new round of trade negotiations. In general, the rate of economic integration (see Fig. 2 above) slowed markedly after the September 11, 2001, attack on the World Trade Center in NY. A similar drop is to be expected from the breakdown of Doha talks. Trade liberalization could pick up again under a new US president after the elections in Nov.2008. International Law The Swiss National Science Foundation (NSF) has set up a National Centre of Competence in Research (NCCR) “International Trade Regulation - From Fragmentation to Coherence”, http://www.nccr-trade.ch/index.html?contentURL=http://www.nccr-trade.org/ip/ip.html
9
Synopsis of Thomas Ruddy’s Contribution to the FORESCENE Workshop
Introduction
The European Union has been built out of nation-states which gradually surrendered sovereignty in exchange for economic benefits. The benefits were obtained by setting up first a customs union, then a free trade area and eventually a sui generis “union” sharing several “common policies” such as commercial policy, trade policy, agricultural policy, and to some degree monetary policy. However member states proved hesitant to merge their individual interpretations of security policy.
Meanwhile outside the Union the planet-wide project of economic integration called globalization proceeded apace. The incentives for nation-states to integrate themselves more intimately into the world economy were similar in many ways to those that formed the Union. Again it was the area of trade policy that led the way, and the once-controversial multilateral institution hidden in the GATT treaty came out into the open in the form of the World Trade Organization (WTO).
The WTO was equipped with a Dispute Settlement Understanding (DSU) that gave it the power to enforce treaties undertaken by its member states. Treaties signed under the umbrella of the United Nations, on the other hand, lacked any such compliance mechanism. Hence in addition to the obvious central function of economic association to provide wellbeing to a society, one can say that the strong appeal of economic integration tends to let other policy areas be subsumed under the economic banner of trade policy.
These two pages will apply observations on trade policy to illuminate the listing of economic targets affecting sustainability, sustainability scenario elements and measures to reach the targets as part of the FORESCENE project.
Definition and description of long-term sustainability goals and targets for the activity field ”industry/economy“
o World GDP per capita is expected to continue growing on through the next benchmark Year 2015. However distribution of the gain among the people of the earth is far from equitable.
A consensus on the appropriate rate of progress on convergence towards equity has been articulated as Millennium Development Goal No. 1: “Halve, between 1990 and 2015, the proportion of people whose income is less than one dollar a day” (www.developmentgoals.org ).
o The great discrepancy between human goals and “those for maintaining life-support systems and living resources” was “the most striking result” of one major study (Parris et al. 2003). Those goals correspond roughly to world GDP and per-capita carbon emissions, respectively, as mentioned in the final slide of my presentation.
10
o Therefore the level of world GDP is subject to earth-system limits, so that the goal of increasing the indicators dependent on it, i.e. GDP per capita and the rate of improvement in distribution, which taken together comprise an economic meta-indicator for human wellbeing, eventually become a zero-sum game. Progress then requires that the elites give up some of their affluence to benefit poorer segments of the population.
o In conclusion to the FORESCENE workshop we had a break-out subgroup look at the question of how to overcome inertia and societal resistance to change. Participants recalled how history has suggested that nation-states do not agree on how to implement a major transition until there is a crisis such as a world war. The UN was set up following the last major global conflagration. Likewise, the dissatisfaction now mounting among displaced workers and economically disadvantaged cultural groups could lead to such a central crisis again, thus illustrating the fact that economic concerns are embedded in a broader policy complex called security.
Description of key scenario elements of integrated sustainability scenarios
o Like trade policy, investment is an area contributing to economic integration, as shown in Figure 2. Foreign Direct Investment (FDI) has grown in importance during globalization in the Nineties of the last century along with the role of Multi-National Corporations (MNC). MNCs have risen to such prominence as to see their sales now comprise 50% of world GDP (UNCTAD as cited by Gugler / Tomsik 2006, p.5).
o In continuation of the OECD’s involvement in attempts to regulate FDI, including the doomed Multilateral Agreement on Investment in 1998, in late 2006 the OECD unveiled a series of draft principles for international investor participation in infrastructure, now including attention to “Responsible Business Conduct”. It is holding annual forums on this new Policy Framework for Investment (OECD, 2006).
o Since the Nineties, not only nation-states but also the roles of non-state actors such as MNCs and Civil Society Organizations must be taken into consideration when envisioning sustainability scenarios.
Definition and description of key possible (policy) instruments and measures deemed promising to reach the identified sustainability goals
o An alternative to the indicator per-capita carbon emissions is per-capita total material flow (TMF). Moltke valued highly global value chain data to show where potential exists for improving TMF (Moltke as cited in Ruddy, 2005b).
o New energy investment is gigantic (World Bank and IMF Development Committee, 2006) and will play a key role in helping to abate climate change. Therefore it is vital that the restrictions on energy use -- and hence energy investment -- laid down in the Kyoto Protocol are given a more stringent extension.
o Land ownership and reconciliation of the informal with the formal economy are major issues, as emerging economies such as China and Brazil struggle with internal migration and new-found power in the global political arena. This measure comprises a key linkage between economic targets and other target areas of the FORESCENE project such as agriculture.
o Trade policy is involved both in the land use referred to above and the next area referred to below. In the first instance the level of trade in biofuels is expected to grow in response to the current surge in oil prices. Environmental concerns are likely to cause differential treatment of biofuels by importing countries on the basis of Life-Cycle Assessment (LCA). The compatibility of such a trade measure

11
with multilateral treaties may well become the next test case for a ruling by the WTO’s DSU.
o Technology and ideas must be shared better by balancing private and public interests in Intellectual Property Rights (IPRs). The technology balance of payments (TBP) is an indicator of technology flows such as those on the international level (OECD as cited in Ruddy, 2005b). An instance of potential injustice is the current TRIPS Agreement at the WTO, which should not be allowed to be implemented in such a manner as to reverse total welfare flows from the North to the South.
Bibliography Aggarwal, Vinod (2006): Political Science 126A, International Political Economy, Spring 2006, http://polisci.berkeley.edu/courses/coursepages/Spring2006/ps126/index.asp Brack, Duncan (2000): "Trade and Environment after Seattle", http://www.chathamhouse.org.uk/pdf/briefing_papers/trade_and_environment.pdf Giljum, S. and Hubacek, K. (2001): International trade, material flows and land use: developing a physical trade balance for the European Union, Interim Report, No. 01-059, IIASA, Laxenburg. Gugler, Philippe / Vladimir Tomsik (2006): International agreements on foreign investments, Swiss NSF National Centre of Competence in Research (NCCR) Working Paper No. 392 Monde Diplomatique (2003): Atlas der Globalisierung OECD (2006): www.oecd.org/daf/investment Parris, Thomas M. et al. (2003): Science and Technology for Sustainable Development, Special Feature Ecology; in: Proceedings of the National Academy of Sciences of the United States of America, July 8, vol. 100, no. 14, http://www.pnas.org/cgi/collection/sus_devo Raskin, Paul et al. (2002): Great Transition Initiative, slide show, http://www.gtinitiative.org/default.asp?action=63 Ridder, W. de / L.G. Wesselink (2006): EU SDS: Ingredients for the 2006 revision, Netherlands Environmental Assessment Agency MNP report 500096001, www.rivm.nl/bibliotheek/rapporten/500096001.pdf Ruddy, Thomas F. (2005a): “Europe’s Global Responsibility to Govern Trade and Investment Sustainably: Climate, Capital, CAP and Cotonou”. International Journal of Sustainable Development (IJSD), Volume 8 - Issue 1/2, Special Issue
12
on Governance For Sustainable Development, edited by Dr. Joachim H. Spangenberg and Dr. Stefan Giljum, http://www.wsis.ethz.ch/paperijsd.pdf Ruddy, Thomas F. (2005b): Greener Measures of Trade and Investment Flows, paper given at ERSCP, Antwerp, http://www.wsis.ethz.ch/paperantwerp.pdf Ruddy, Thomas F. (2006): “Trade and Sustainable Development”, lecture and presentation given at College of Europe, Bruges, as part of EU Policy Workshop on Trade Policy, WTO Negotiations and Globalization, http://www.wsis.ethz.ch/papercoleurop.pdf Ruddy, Thomas F. / Lorenz M. Hilty (2006a): Supply Chains Extending into Developing Countries: Limits to Socially Responsible Supply Chain Management, submitted to J.Cleaner Production Ruddy, Thomas F. / Lorenz M. Hilty (2006b): Impact Assessment and Policy Learning in the European Commission, submitted to EIAR South Asia Watch on Trade, Economics and Environment (SAWTEE) (2004): 2004 Trade & Development Monitor, January, p.9, http://fesportal.fes.de/pls/portal30/docs/FOLDER/WORLDWIDE/ASIEN/VERANSTALTUNGEN/GLOBALPARTNERSHIP_TDM_2004_KAMALESH.PDF#search=%22%22Target%2012%3A%20%22%22Develop%20further%20an%20open%2C%20rule-based%2C%22%22 US National Science Foundation (2006): Science and Engineering Indicators 2006, Overview “S&T: The Global Picture”, http://www.nsf.gov/statistics/seind06/ World Bank and IMF Development Committee (2006): Clean Energy and Development: Towards an Investment Framework, http://siteresources.worldbank.org/DEVCOMMINT/Documentation/20890696/DC2006-0002(E)-CleanEnergy.pdf

FORESCENE – Workshop 3: Industry/Economy, Vienna
1
ECOPROFIT®
by preventive environmental management
A public private partnership model for sustainable development
Karin Tschiggerl Johannes Fresner
STENUM GmbH,
Geidorfgürtel 21, A-8010 Graz, Austria www.stenum.at
ECOPROFIT® is an approach for a holistic policy of sustainability based on voluntary participation. The existing problems – poverty, waste of resources, access to clean water and energy, etc. – can only be brought to a constructive solution if all three elements of sustainability (economy – ecology – social policy) can be united in an open dialog for all. The model ECOPROFIT® with its networking among companies and municipalities can be seen as a constructive way of partnership and as an important contribution to the implementation of sustainability. A basis for understanding the approaches to sustainable development can be established by translating sustainable development into small steps relevant to the actual conditions of the companies. These steps are the application of cleaner production methods, followed by an integrated management system and optimising the supply chain relations and consequently the products. This procedure forms an effective way to start to understand sustainable development and to develop sustainable strategies in companies.
Cleaner production is an effective approach to analyse the productive processes. It aids to reducing use of chemicals and generation of waste and emissions. At the same time it helps to sensitise workforce and management for environmental problems caused by the enterprise including health and safety. Especially in small companies this means at the same time immediate and visible improvement in the situation of occupational health, quality and environmental performance. A simple step by step approach has been developed, involving interactive group training and individual consulting.

FORESCENE – Workshop 3: Industry/Economy, Vienna
2
INTRODUCTION
The reactive and curative approach to environmental protection has predominated since the 1960´s. Mostly, problems with emissions of pollutants from industrial sources were addressed by the utilisation of end-of-pipe pollution control technologies. These approaches reduced the direct release of some significantly but did not really solve the problems at the source. Additionally end-of-pipe treatment causes extra costs.
Cleaner production looks like a common sense approach: Instead of treating waste and emissions in end-of-pipe treatment plants, we try to define ways to prevent the generation of waste and pollutants. This approach includes organisational changes inside the company, motivation and training for good housekeeping as well as changes in raw materials, process technology, internal and external recycling. Experience shows, that besides improving production technology, the focus should also be on improving the organisation in relation with environmental effects and to rise awareness along the whole design and production process. This is the context in which we see the concept of Cleaner Production. The basic idea is a change of the question:
"What shall we do with our waste and emissions?"
to "Where do our waste and emissions come from
and what can we do to prevent their generation at the source?".
Starting in 1990, the so called PREPARE method was developed in Austria [1, 4]: Projects following this approach are organised in two parts: In the first phase, the project-team is formed by employees of the company and by external consultants. An input/output analysis on the analysis of purchases, accounting, and sales renders basic information about the quantities and values of raw and process materials, as well as the purchased energy. Moreover, this analysis provides data concerning process efficiency and disposed materials and their purchasing value. At the same time, the flow of information in the company and the organisation of environmental matters are analysed. Process engineering methods supply the tools to analyse the consumption of materials and energy. The early implementation of cleaner production measures usually increases the motivation of the team.
In the second phase, solutions are elaborated for priority areas. Their feasibility is studied and proposals are prepared. A working programme will be drawn up including options with a longer time frame for implementation. The projects following this approach proved the concept: waste and emissions of companies could be reduced significantly. Drawbacks included: the projects were relatively expensive due to the manpower required for
consulting the continuation of the idea inside the company was difficult as in many
cases the consultants had done most of the project work the marketing effect of these projects among industries and the perception
by the public and the authorities was relatively small
FORESCENE – Workshop 3: Industry/Economy, Vienna
3
Therefore the method for implementation of cleaner production was developed further to the so called ECOPROFIT® model.
PREVENTIVE ENVIRONMENTAL MANAGEMENT STEP BY STEP
Group based training In 1991 STENUM started to develop the ECOPROFIT® model commissioned by the City of Graz [2]. Now, 15 years later,ECOPROFIT® can be described as an outstanding success story. More than 150 companies in Graz representing different sectors of industry and hotels have participated in the programme. Micro-enterprises with 5 employees as well as large companies of the automobile industry with more than 3000 employees have already joined the ECOPROFIT® beginners’ programme - a fact which speaks for itself.
The idea of ECOPROFIT® has meanwhile spread in Austria and abroad. The cities of Vienna, Munich and Berlin are conducting similar projects, as are Gurgaon in India, Kampala in Unganda, Bucaramanga, Cucuta, and Medellin in Colombia, Pusan, Daego, and Incheon in Korea, and Panzihua in China.
The ECOPROFIT® basic programme consists of three elements:
• joint workshops,
• individual consulting, and
• the ECOPROFIT® award process.
Parallel implementation of all elements is a key factor in the success of the program.
Representatives of all participating companies, ideally 10 to 15, take part in each workshop. In general, the project manager of the ECOPROFIT® project in the company is the production or environmental manager. At first sight it may appear strange that e. g. a small paintshop and a huge brewery, are in the same seminar and together work on cleaner production options. Experience, however, showed that the combination of different sizes and industries is not problematic at all. Companies and local authorities even feel that such a mix has a very positive influence on the project because structural, organisational, and technological problems often are similar and the companies can learn from each other and help each other in finding innovative solutions. It also turned out that the companies are much more willing to accept new and innovative ideas – especially organisational changes and good housekeeping options - from a company in a different industry than from one in the same industry.
The topics of the workshops and typical interactive learning units are: An introduction to cleaner production, effective team work, material flow analysis, energy analysis, legal compliance, waste management, creativity and option finding, controlling, etc. In these workshops, the morning session always includes a “feed-back discussion”, where the progress made since the last workshop is presented and discussed. Then experts present special topics. As far as possible, industry-specific examples are used to demonstrate the practical application of the workshop contents. The afternoon has real workshop character, as interactive group work is done in which
FORESCENE – Workshop 3: Industry/Economy, Vienna
4
practical experience with the relevant is collected by the participants in exercises, discussions, and case studies.
At the end of a workshop, the participants get a clear task for their „home work“, which is the implementation of the respective subjects in their company. For this, they are supplied with a brochure summarising the presentation of the experts and working sheets which help to collect data and information, generate options for improvement and guide in the implementation.
The implementation of CP options is considerably enhanced if additional individual consulting is done. In addition, the work in the workshop can be done much more effectively if it addresses the existing problems of the participating companies.
The final act of an ECOPROFIT® project is the award that is given to the companies by a City Mayor. This award is a strong sign of the official recognition by the city that the company’s way of producing is environmental friendly. The award has to be applied for and renewed every year. For a company to receive this award, several criteria have to be fulfilled and checked by an independent commission.
The company must have:
a company specific environmental policy, a well prepared waste management system (including existing and
planned minimisation measures, input materials), a waste management plan, a legal compliance check in respect to the environmental performance, documentation of the environmental performance of the previous year, an environmental programme for the upcoming year, and an environmental review with special check lists, which analyses the
implementation of the major elements of ECOPROFIT® The ECOPROFIT® Club has been designed for companies who want to continue working together with other enterprises on their environmental performance after a successful first ECOPROFIT® year. For Club companies, further inputs on new topics or on topics that need intense attention are offered. The Club is an important value added that supports the companies by combining the improvement in the environmental situation with measurable economic profits. Basically the Club consists of the following programme elements:
workshops, workgroups and learning from the best-in-class; personalized and customized counselling; preparing and presenting the award; celebrating together in the course of so-called “Social Events”
ECOPROFIT® Clubs following the model of Graz have been implemented e. g. in Kampala in Uganda, in Gurgaon in India, and in Bucaramanga in Colombia.
Building a network Networks are to help to generate knowledge that will lead to innovations. The ECOPROFIT® network gives the participating companies, consultants, administrations and research institutes the chance of constructive networking and to

FORESCENE – Workshop 3: Industry/Economy, Vienna
5
benefit from various effects of synergy. Knowledge is generated by learning in the workshops and workgroups and by conservations and discussions among the Environmental Representatives. In order to extend the very successful cooperation between companies and municipialities, the local networks should be integrated in an international ECOPROFIT® network. Runner of this network is the Cleaner Production Center (CPC) Austria [14]. A central mission of the network is to provide assistance with the establishment and development of Public Private Partnerships. Tasks and services are
dissemination of ECOPROFIT® know-how further development of ECOPROFIT® information and communication platform for ECOPROFIT® topics international exchange of experience additional information to ECOPROFIT® (magazine, internet) establishment of local and regional networks for waste utilisation for a
resource-saving circular flow economy optimization of added value chains creation of EU and international projects
In a co-operation with the UN in the framework of UNEP (United Nations Environment Programme) and the action ‚Global Compact' the CPC Austria supports the establishment of an international network for sustainable development.
ECOPROFIT® - advantages The ECOPROFIT® model of sustainable economic development focusses on the application of preventive environmental strategies with respect to processes, products and services. One factor for the success is the special manner of cooperation between local authorities and companies as well as the networking of the companies taking part in the program. That way, effects of synergy develop and assure the ECOPROFIT® success for authorities and companies, and points out that it is a model for Public Private Partnership (PPP). Therefor also the financing of ECOPROFIT® projects is done throug cost sharing. ECOPROFIT® - advantages for companies
factor 10 between project-input and output increase in production efficiency and reduction of costs due to less
consumption of raw material and energy reduction of costs due to smaller amounts of waste and emissions transparent cost-accounting good overview on relevant laws and regulations for the company promotion of motivation and team spirit within the companies common training programs support of the project by local authorities presentation of companies and regions via international networks certification to "ECOPROFIT® company” and integration in common PR
activities

FORESCENE – Workshop 3: Industry/Economy, Vienna
6
preparation or addition to EMAS or ISO 14001 support by meeting the OECD guidelines
ECOPROFIT® - advantages for authorities
factor 10 between economy support and success of the project controlling-instrument for the implementation of sustainable structures successful companies improve infrastructure and add to job security in a
region establishment of sustainable structures due to efficient support in economy environmental relief and less expenses for bio-remediation international advantages regarding location and competition improvement of the image of a region and promotion of tourism higher quality of life for the inhabitants of cities and regions support at the realisation of Local Agenda 21 objectives to reach the Kyoto
target support to secure the OECD guidelines
ECOPROFIT® - results ECOPROFIT® companies actively drive and advance their sustainable development. They partly also do so in areas that are new for them. Succes ultimately is reflected in the ecological and economic effects of implemented measures. The ECOPROFIT® companies in the city of Graz could realize the following overall savings in the last 11 years:
Area 1994 to 2005
Electricity 122.600 MWh
Water 9,28 Mio. m3 Fuels 14,5 Mio. l
Residual waste 403.150 t
Table 1: savings in some selected areas in Graz from 1994 to 2005 Overall the cost-savings were more than 20 Mio. EUR – as annual savings through reduction of energy consumption, more advantageous waste disposal, minimized water consumption, improved production engineering and optimized chains.
Continuation to ISO 14001 A similar, workshop based approach has been developed to advance from the application of Cleaner production to the implementation of a management system which can be certified according to the standard ISO 14.001 [3, 6, 7, 8, 9, 10, 11]. This has been implemented in Austria, in India, Uganda, and Colombia. The key elements of the management system are trained in focused workshops which are combined to blocks, if required. 20 companies in Austria, four in Colombia, and eight

FORESCENE – Workshop 3: Industry/Economy, Vienna
7
in Uganda have up to now taken these steps towards fully certified management systems.
Step by step towards impressive results The overall results of this approach can be impressive. To illustrate the success a selection of case studies from the work with Ecoprofit companies which have continued to ISO 14001 certification is used:
A. Heuberger is an Austrian anodizing plan with 20 employees and a production of 100.000 m² annually of aluminium parts and profiles.
Consumption of acid and caustic solution per treated surface was decreased by around 50 %. Consumption of water was decreased by 95 %. This could be achieved by the following measures:
Better understanding of the processes in the baths Better understanding of the relevant operational sequence Better modelling and data collection Building up of know-how in the enterprise Optimisation of the degreasing tank Minimisation of the metal erosion for the achievement of the desired effects Optimisation and clear extension of the life time of process baths Optimised use of new technologies for the bath maintenance Identification of new recycling ways
Figure 1: development of water consumption in A. Heuberger anodizing (participation in ECOPROFIT since 1996, environmental management system since 1999, further
systematic steps in 2001 (www.zermeg.net))
At Uganda Fish Packers, Ngege, and Masese Fish the water consumption could be reduced from 20 to 8 m³ per ton of fish. The final success involved mainly good housekeeping measures (training of employees in hygienic and water saving

FORESCENE – Workshop 3: Industry/Economy, Vienna
8
cleaning, optimisation of water nozzles and water pressure). All three companies were certified according to ISO 14.001 in October 2004.
At Partmo, a producer of oil filters in Bucaramanga, Colombia a 33 % reduction of electricity consumption could be realized after the first year by renewing installations. The company is now continuing its efforts:
Electricity consumption
0,73
0,54
00,10,20,30,40,50,60,70,8
before participation in Ecoprofit after 1st year in Ecoprofit
KWh
/ 100
0 un
its
Figure 2: Electricity consumption of Partmo (Colombian producer of oil filters) before
and after participation in Ecoprofit
CONCLUSIONS
The translation of “sustainable development” to small steps which are readily understood and can be implemented is a challenge and a task [5]. This process can be handled with a stepwise strategy consisting of cleaner production, integrated management, influencing the supply chain and improving product and service features. Thus, a learning environment is provided, in which company personnel understand the message of sustainable development and develop appropriate solutions. The implementation of this approach has worked in Europe as well as in Latin America, Africa, and Asia.
A cleaner production project will help to motivate the management, as the results can help to reduce daily costs and improve profitability in many other ways as well. It will add a strategy of prevention to the company´s policy, which can be a powerful guideline for the employees in the design of products and processes and during operation. It will provide practical experience with problem focussed team work.
A management system focussing on team work and continuous improvement of quality, environmental aspects and health and safety can help to ensure that once a company’s leadership are committed to getting on the continuous improvement journey toward sustainable development, they are more likely to continue on that journey with their employees, suppliers, share holders, customers and other stakeholders.

FORESCENE – Workshop 3: Industry/Economy, Vienna
9
The importance of the aspects of sustainable development will be recognised, new information channels will be identified, information collected and interpreted, new questions will be raised. New solution approaches will be tested and the good ones are likely to be implemented. In this process, creative approaches should be stimulated which expand today´s system boundaries of in-company optimisation. The focus should not be on incremental improvement, but on redesign and rethinking of systems to supply services and products in the most environmentally and socially sound manner in such a way that future generations will also be able to sustain themselves as well. Typically, the potential of win-win solutions for customers, companies, suppliers, neighbours, and the authorities will be demonstrated.
REFERENCES
1. Fresner, J., Starting continuous improvement with a cleaner production assessment in an Austrian textile mill, J. Cleaner Prod. Vol. 6, pp. 85-91, 1998
2. Eder P., Fresner J., The role of cooperative cleaner production projects, IPTS-Newsletter, issue 27, September 1998
3. Fresner, J., Cleaner Production as a means for effective environmental management, J. Cleaner Prod. Vol. 6, pp. 171-179, 1998
4. Fresner, J., Options, measures, results: Ecoprofit-Styria-Prepare two years after project end, J. Cleaner Prod. Vol. 6, pp. 237-245, 1998
5. Fresner, J., Fritsch, E., Schnitzer, H., Schwarz, H. G., Wimmer, W., A strategy for research on the way from Cleaner Production to a sustainable economy, Proceedings of the 6th European Roundtable on Cleaner Production, Budapest, 29th September - 1st October, 1999
6. Fresner, J., Cleaner Productions as a means for effective environmental management, 5th International Congress on Mining and the Environment, Ostrava, VSB Ostrava, April 2000
7. Fresner, J., Wolf, P., Galli, M., Effective environmental management by cleaner production: Experiences from Austria and Hungary, Workshop “Efficiency through management of ressources: Green Productivitity programmes in SMEs” EXPO 2000 Hannover, September 2000
8. Fresner, J., Setting up effective environmental management systems based on the concept of cleaner production: Cases from small and medium sized enterprises, in R. Hillary: „ISO 14001 Case Studies and Practical Experiences“, October 2000, ISBN 1 874719276
9. J. Fresner, J. Sage, P. Wolf, A benchmarking of 50 Austrian companies from the galvanizing and painting sector: current implementation of cleaner production options and active environmental management, Proceedings of the 8th European Roundtable on Cleaner Production, Cork, October 2002
10. J. Fresner, Reinigung durch feinste Poren, in: steiermark innovation 2004, Leykam, Graz, ISBN 3-7011-7471-7
11. J. Fresner, G. Engelhardt, Experiences with integrated management systems for two small companies in Austria, Journal of Cleaner Production 12 (2004) 623-631
12. www.zermeg.net

FORESCENE – Workshop 3: Industry/Economy, Vienna
10
13. www.prepare.at
14. www.cpc.at
Links for further information: Stenum’s homepage: www.stenum.at Ökoprofit Graz: www.oekoprofit-graz.at Cleaner Production Center Austria: www.cpc.at

Paper for a FORESCENE Workshop, Vienna, 23 and 24 October 2006: Life cycle impacts of consumption
1
Life Cycle Environmental Impacts of Consumption in the
EU25 Tukker, A (TNO)*; G. Huppes, R. Heijungs, J. Guinee, L. van Oers, A. de Koning (CML); S. Suh (University of Minnesota), T. Geerken, B. Jansen, M. van Holderbeke (VITO); and P.H. Nielsen (DTU) * Corresponding Author: TNO, PO Box 49, 2600 JA Delft, Netherlands, e-mail [email protected]
Abstract Environmental effects of economic activities are ultimately driven by consumption, via impacts in the production-, use- and waste management phase of products. Integrated product policy addressing the life cycle impacts of products forms an innovative new generation of environmental policy. Yet, this policy requires insight in the final consumption expenditures and related products that have the greatest life cycle environmental impacts. This review article brings together the conclusions of 11 studies that provide such insights. The studies differed greatly in basic approach (extrapolating LCA-data to impacts of consumption categories versus environmentally extended input-output approaches), geographical region, disaggreation of final demand, data inventory, and impact assessment. Nevertheless, across all studies a limited number of priorities arose. The three main priorities Housing, Transport and Food are responsible for 70% of the impacts in most categories. At a more detailed level priorities are car- and most probably air transport within Transport, meat and dairy followed by the other food items within Food, and building structures, heating, and (electrical) energy using products within Housing. Given the very different approaches followed in each of the sources reviewed this result hence must be regarded as extremely robust. Key words: impacts of products, integrated product policy, environmental input output tables
1 Introduction Environmental effects of economic activities are ultimately driven by consumption: both directly, as effects in the use phase, or indirectly, as effects from the system producing the products consumed and from post-consumer waste management. After the focus on reducing impacts from production, addressing these life cycle impacts of products forms an innovative next generation of environmental policy. Such an integrated product policy needs a clear view on the final consumption expenditures and related products causing the greatest environmental impacts. This contribution to the Forescene Workshop gives a comparative analysis of 11 studies into priority setting of the impacts of consumption expenditures. It is based on the so-called EIPRO study that was performed by TNO, CML, DTU and VITO via the ESTO network under contract from EU DG JRC IPTS, in close co-operation with the Sustainable Consumption and Production unit of EU DG Environment (Tukker et al., 2006). This paper combines elements of two articles of a special issue of the Journal of Industrial Ecology (Tukker et al., 2006). We analyse this body of work as follows: a) Section 2 discusses in detail the differences in approach per source. b) Section 3 compares results at two levels:

Paper for a FORESCENE Workshop, Vienna, 23 and 24 October 2006: Life cycle impacts of consumption
2
1. the twelve main expenditure categories discerned in the so-called COICOP1 categorisation;
2. at sub-COICOP level. c) Section 4 ends with overall conclusions. The relevance of this body of work for creating sustainability scenarios is obvious. It is widely acknowledged that radical changes are needed to realise sustainable consumption and production patterns. Given the ongoing population growth (from 6 to about 9 billion people in the world by 2050) and the (need for) rising wealth in many parts of the world, our final consumption has to be delivered with at least a Factor 4 les impact per consumption unit (von Weiszäcker et al., 1996). The EIPRO study shows which consumption activities are priorities in this context. At the same time, EIPRO is a study that focuses on a situation analysis. It does not develop sustainability goals or targets, scenario’s, let alone policy packages to reach such goals. This work is part of the follow-up of the EIPRO study, the so-called ‘IMPRO’ studies in the field of mobility, housing and food under way with support of DG JRC IPTS.
2 Comparison of methodologies applied
2.1 Introduction
From 11 studies reviewed directly emerges a main difference in basic approach. Some studies selected a number of products as being representative for an expenditure category. They then used life-cycle assessment (LCA) data for these products followed by extrapolations to estimate the impacts related to this expenditure category. This is called the ‘bottom-up’ approach. Other studies used input-output (IO) tables with environmental extensions to calculate the impacts that have to be allocated to final expenditure categories. This is called the ‘top-down’ approach. Apart from this basic approach, studies and papers differed on the following aspects, which will be discussed further in the sections below: a) Goal and scope, functional unit and system boundaries. Studies focused on
different geographical areas, different end-use categories (consumers, governments, exports, or combinations thereof), and dealt differently with the inclusion of investments/capital goods and the use and waste stage of products.
b) Choice of expenditure/product categories, or in other terms: how the final demand is disaggregated. Many bottom-up studies in the end divided final expenditure in about 30-50 categories. Top-down studies depended on their level of disaggregation on the underlying input-output table. Such top-down studies often discerned 50-100 expenditure categories, whereas one study (Tukker et al., 2005; Huppes et al., 2006) used a detailed US IO table to reach a level of 500 expenditure categories.
c) Inventory of environmental interventions. Some studies focused on a few individual substances, others tried to be as complete as possible. Some studies assumed that imports were made with technologies similar as in the region to which was imported. used ;
1 Classification of Individual Consumption According to Purpose. This is a classification system of consumption expenditure worked out by an UN working group that is used by most national statistical bureaus to report on consumer expenditures.

Paper for a FORESCENE Workshop, Vienna, 23 and 24 October 2006: Life cycle impacts of consumption
3
d) Assessment of impacts and interpretation. Here, various types of LCIA were used (e.g. Guinee et al., 2002; Hauschild et al, 2002), or methods like the ecological footprint (Wackernagel and Rees, 1996; Wiedmann et al., 2005.
Table 2.1 reviews the methods applied in the different studies.
2.2 Implications
The former section makes clear that this review covers studies that used a very broad spectrum of approaches, assumptions, and data sources. To some extent this is of course a nuisance. Work would become much better comparable if agreements were made on e.g. expenditure/sector classifications and impact indicators. However, the diversity has also a great advantage. One of the problems of individual studies is that they always can be criticised since a different choice in functional unit, in system boundaries, disaggregation of final demand, data inventory and impact assessment could have been made. Indeed, some studies were fiercely criticised by mainly industry-endorsed reviews in this way (e.g. Collins and Nuij, 2004; Joint Platform, 2003). Yet, this review has the potential to end at least partially such discussions. The studies reflect such a diversity in approaches, that priorities showing up in all studies can – or in fact must - be considered as very robust.
3 Robust priorities: comparison per COICOP category
3.1 Introduction
We compare here the results of the papers and studies reviewed. For a meaningful comparison, impact categories and expenditure categories must be comparable. Furthermore, due to the diversity shown in section 2 it generally makes no sense to compare absolute quantities of indicator values from different studies. It is better to look at the percentage contribution of an expenditure category to the total environmental impact of a certain type caused by the total final societal expenditure considered in that particular study. This leads to the following considerations concerning:
1. Indicators: Collins et al. (2006), Dall et al. (2002), Kok et al. (2003), Palm et al and Peters and Hertwich (2006) consider a very limited number of indicators (respectively ecological footprint, (in)direct energy use and a few emissions, amongst others CO2). It is hence impossible to compare all studies on a broad set of indicator(s).
2. Categories: most studies used expenditure classifications related to COICOP (which has three levels of detail), or could be translated to this. Most studies reach just a limited extra level of detail compared to the 12 categories of COICOP level 1. Exceptions are the work of Collins et al. (2006), Nijdam and Wilting (2003), Tukker et al. (2005) and Weidema et al. (2005).
3. Percentage contribution: Weidema et al. (2005) only reported the top scoring product groups per impact category rather than a complete list; it is hence not possible to calculate percentages for e.g. a total COICOP category. The work of Moll and Acosta (2006) and to a lesser extent Palm et al. (2006 include intermediate goods for exports, which distorts any picture calculated for the contribution of final consumption expenditure.
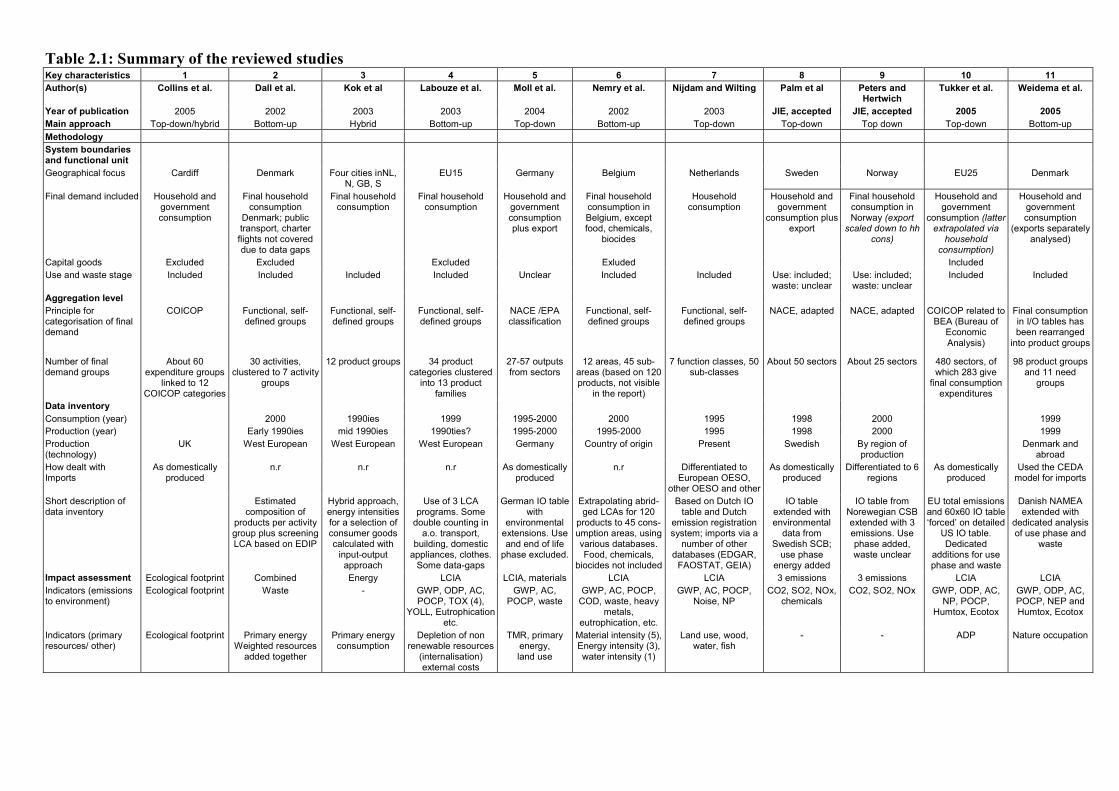
Table 2.1: Summary of the reviewed studies Key characteristics 1 2 3 4 5 6 7 8 9 10 11
Author(s) Collins et al. Dall et al. Kok et al Labouze et al. Moll et al. Nemry et al. Nijdam and Wilting Palm et al Peters and Hertwich
Tukker et al. Weidema et al.
Year of publication 2005 2002 2003 2003 2004 2002 2003 JIE, accepted JIE, accepted 2005 2005
Main approach Top-down/hybrid Bottom-up Hybrid Bottom-up Top-down Bottom-up Top-down Top-down Top down Top-down Bottom-up
Methodology
System boundaries and functional unit
Geographical focus Cardiff Denmark Four cities inNL, N, GB, S
EU15 Germany Belgium Netherlands Sweden Norway EU25 Denmark
Final demand included Household and government consumption
Final household consumption
Denmark; public transport, charter flights not covered due to data gaps
Final household consumption
Final household consumption
Household and government consumption plus export
Final household consumption in Belgium, except food, chemicals,
biocides
Household consumption
Household and government
consumption plus export
Final household consumption in Norway (export scaled down to hh
cons)
Household and government
consumption (latter extrapolated via household consumption)
Household and government consumption
(exports separately analysed)
Capital goods Excluded Excluded Excluded Exluded Included
Use and waste stage Included Included Included Included Unclear Included Included Use: included; waste: unclear
Use: included; waste: unclear
Included Included
Aggregation level
Principle for categorisation of final demand
COICOP Functional, self-defined groups
Functional, self-defined groups
Functional, self-defined groups
NACE /EPA classification
Functional, self-defined groups
Functional, self-defined groups
NACE, adapted NACE, adapted COICOP related to BEA (Bureau of
Economic Analysis)
Final consumption in I/O tables has been rearranged
into product groups
Number of final demand groups
About 60 expenditure groups
linked to 12 COICOP categories
30 activities, clustered to 7 activity
groups
12 product groups 34 product categories clustered
into 13 product families
27-57 outputs from sectors
12 areas, 45 sub-areas (based on 120 products, not visible
in the report)
7 function classes, 50 sub-classes
About 50 sectors About 25 sectors 480 sectors, of which 283 give
final consumption expenditures
98 product groups and 11 need
groups
Data inventory
Consumption (year) 2000 1990ies 1999 1995-2000 2000 1995 1998 2000 1999
Production (year) Early 1990ies mid 1990ies 1990ties? 1995-2000 1995-2000 1995 1998 2000 1999
Production (technology)
UK West European West European West European Germany Country of origin Present Swedish By region of production
Denmark and abroad
How dealt with Imports
As domestically produced
n.r n.r n.r As domestically produced
n.r Differentiated to European OESO,
other OESO and other
As domestically produced
Differentiated to 6 regions
As domestically produced
Used the CEDA model for imports
Short description of data inventory
Estimated composition of
products per activity group plus screening LCA based on EDIP
Hybrid approach, energy intensities for a selection of consumer goods calculated with input-output approach
Use of 3 LCA programs. Some double counting in a.o. transport,
building, domestic appliances, clothes. Some data-gaps
German IO table with
environmental extensions. Use and end of life phase excluded.
Extrapolating abrid-ged LCAs for 120
products to 45 cons-umption areas, using various databases. Food, chemicals,
biocides not included
Based on Dutch IO table and Dutch
emission registration system; imports via a
number of other databases (EDGAR, FAOSTAT, GEIA)
IO table extended with environmental
data from Swedish SCB; use phase
energy added
IO table from Norewegian CSB extended with 3 emissions. Use phase added, waste unclear
EU total emissions and 60x60 IO table ‘forced’ on detailed
US IO table. Dedicated
additions for use phase and waste
Danish NAMEA extended with
dedicated analysis of use phase and
waste
Impact assessment Ecological footprint Combined Energy LCIA LCIA, materials LCIA LCIA 3 emissions 3 emissions LCIA LCIA
Indicators (emissions to environment)
Ecological footprint Waste - GWP, ODP, AC, POCP, TOX (4),
YOLL, Eutrophication etc.
GWP, AC, POCP, waste
GWP, AC, POCP, COD, waste, heavy
metals, eutrophication, etc.
GWP, AC, POCP, Noise, NP
CO2, SO2, NOx, chemicals
CO2, SO2, NOx GWP, ODP, AC, NP, POCP,
Humtox, Ecotox
GWP, ODP, AC, POCP, NEP and Humtox, Ecotox
Indicators (primary resources/ other)
Ecological footprint Primary energy Weighted resources
added together
Primary energy consumption
Depletion of non renewable resources
(internalisation) external costs
TMR, primary energy, land use
Material intensity (5), Energy intensity (3), water intensity (1)
Land use, wood, water, fish
- - ADP Nature occupation

Paper for a FORESCENE Workshop, Vienna, 23 and 24 October 2006: Life cycle impacts of consumption
5
Given the above, the comparison was set up as follows.
1. Each product or expenditure group in a study was linked to a level 1 COICOP category. This proved to be relatively straightforward2.
2. After this, a comparison per impact indicator at COICOP level 1 was done: a. Only indicators that were strongly related to energy use (energy use,
GWP, CO2 emissions or ecological footprint) were compared quantitatively. Only the work of Weidema et al. (2005) and Moll et al. (2004) were not included in this exercise for the reasons mentioned above under 3 (section 3.2.1).
b. Where studies used other comparable indicators, a qualitative comparison is given summarizing the discussion in Tukker et al. (2005; section 3.2.2).
3. The relatively detailed work of Nijdam and Wilting (2003), Tukker et al. (2005) and Weidema et al. (2005) was further compared on the rankings of products discerned in these studies within each COICOP category (section 3.3).
3.2 Conclusions at COICOP Level 1
3.2.1 Energy-related indicators Table 3.1 shows the result for the indicators that are for an important part related to energy use, and hence which allow for a comparison across studies. The table shows a clear pattern. Food, housing and transport dominate in virtually all studies, with a total contribution of typically 70%. Deviations from this general pattern are usually due to methodological idiosyncrasies and hence of limited relevance:
1. Food. Food was not included in Nemry et al (2002) and under-addressed in Labouze et al (2003). The studies using energy and CO2 as indicator miss CH4 emissions from agriculture and hence a significant contribution to GWP. The somewhat lower relative contributions in these studies hence do not mean a lower priority.
2. Housing. The bottom-up studies score probably relatively high since they cover quite well direct energy use (which is mainly used in the house and for transport), but may miss in the other COICOP categories some of the indirect energy use due to cut-offs in the underlying LCAs used. The score of Peters and Hertwich will rise considerably if their category ‘household energy use’ would be largely allocated here.
3. Recreation. The work of Nijdam and Wilting (2003) gives a relatively high contribution here, since (package) holidays are included here probably including transport. In other studies transport is not so integrated and included under category 07 Transport.
4. Miscellaneous. For methodological reasons explained before, Palm et al. and Peters and Hertwich included also product outputs (for export) that usually are not used by households of governments. They were allocated to this category which hence in their case shows up high.
2 See for most studies Annex 1 to Tukker et al. (2005). Collins et al. reported data already in COICOP format; for Peters and Hertwich and Palm et al. an electronic annex can be made available

Paper for a FORESCENE Workshop, Vienna, 23 and 24 October 2006: Life cycle impacts of consumption
6
Table 3.1: Contribution per COICOP category to energy-related impact indicators in different studies
COICOP Study Collins
et al. Dall et al.
Kok et al.
Labouze et al.
Nemry et al.
Nijdam and Wilting
Palm et al.
Peters and Hertwich
CEDA EU25
Indicator Footprint Energy Energy GWP GWP GWP CO2 CO2 GWP
Main approach IO Bottom-up
Bottom-up
Bottom-up
Bottom-up
IO IO IO IO
CP01-02 Food 21.0% 26.2% 13.0% 7.0%** 3.6%** 22.1% 7.7% 13.8% 31.0%
CP03 Clothing 0.8% 1.3% 2.2% 3.3% 1.3% 6.5% 0.7% 12.5% 2.4%
CP04-05 Housing 30.8% 40.8% 54.3% 58.8% 53.5% 33.4% 26.2% 2.7% 23.6%
CP06 Health 0.3% 1.8% 0.3% 0.3% 0.5% 1.6%
CP07 Transport 22.4% 19.5% 18.3% 29.6% 32.9% 17.3% 15.5% 17.5% 18.5%
CP08 Communication 0.5% 0.0% 2.9% 0.0% 1.7% 2.4% 2.1%
CP09 Recreation 8.3% 7.2% 8.1% 0.0% 15.1% 0.5% 1.0% 6.0%
CP10 Education 0.3% 1.8% 0.7% 0.3% 0.5%
CP11 Restaurants 11.0% 2.8% 1.8% 1.2% 9.1%
CP12 Miscellaneous 4.5% 5.1% 0.4% 1.3% 5.4% 1.8% 10.1%*** 21.7%*** 5.2%
Other Refined petroleum products / Direct household energy*
35.0% 27.2%
TOTAL 99.9% 100.0% 100.0% 100.0% 100.0% 100.0% 100.0% 100.0% 100.0%
* To be distributed over housing and transport ** Nemry et al. (2002) did not include food in their study; this value is related to packaging for food. Labouze et al. (2003) under-addressed food for a variety of reasons in their work. *** Unlike other studies, Palm et al. (2006) and Peters and Hertwich (2006) had products produced for export included in their IO table. We allocated such items to CP12 ‘Miscellaneous’, which explains the relatively high score.

Paper for a FORESCENE Workshop, Vienna, 23 and 24 October 2006: Life cycle impacts of consumption
7
Only for the rather high relevance of clothing in Peters and Hertwich no clear explanation exists. It may be that their better modelling of imports made a justified difference – or not.
3.2.2 Other indicators Tukker et al. (2005) made qualitative comparisons on other indicators as far as they were included in the different studies. Space does not allow for a full reproduction of the analysis; we limit ourselves to the main conclusions per (group of) indicators:
1. Resources. This impact has been covered in two ways: via the LCA based indicator of ‘resource depletion potential’ and different types of total material requirement. Despite the enormous variety of scope and methods, the studies covering this impact category give priority to housing (buildings), transport and in some cases food.
2. Land use. The studies considering this impact category lead, despite applying rather different methodologies, to food and housing as priorities.
3. Water use. A comparison is not possible, since the two studies covering this impact category did so in fully different ways. Nemry et al (2002) only considered tap water (with as logical priority sanitary use) where Nijdam and Wilting (2003) considered total water use (leading to dominance of food and at a distance clothes);
4. Acidification. The studies covering this impact category agree that transport/cars, building structures and heating, and food are priorities.
5. Eutrophication. The studies covering this impact category agree that food dominates all other product and expenditure categories.
6. Photochemical smog formation. The studies covering this impact category agree that transport/cars, building structures, and food are priorities.
7. Waste. Results differ strongly among studies considering waste volume as an impact category, mainly because they define waste in different ways.
3.2.3 Conclusions The conclusion of the comparison at the highest COICOP level is straightforward. On the most common indicators used, food, transport, housing (the building and energy use) always show up as the highest contributors. The quantitative analysis on energy-related indicators shows that in nine studies the total contribution of expenditures on these COICOP categories is 70% or more, where these COICOP categories are just some 55% of the total household and government expenditure in the EU25 (Huppes et al., 2006). Given the very different approaches followed in each study this result hence must be regarded as very robust.
3.3 Conclusions at sub-COICOP level
3.3.1 Introduction The EIPRO study also made a comparison of impacts of studies that reached resolution of 60 expenditure categories or more: Nijdam and Wilting, 2003; Weidema et al., 2005; and CEDA EU25. We present the results of this comparison (for GWP) in Table 3.2. The EIPRO report gives also comparisons on other common environmental themes, such as acidification, eutrophication and POCP. However, these give roughly the same results (except that on Eutrophication food products dominate.

Paper for a FORESCENE Workshop, Vienna, 23 and 24 October 2006: Life cycle impacts of consumption
8
Table 3.2: Detailed comparison of four studies, % contribution on GWP or ecological footprint
CEDA EU25 (Chapter 5) Nijdam and Wilting (2003) Weidema et al. (2005)
CP01-02 [A52] Meat packing plants 5,5% # Meat and meatware 4,24% Meat purchase in DK, private consumption 1,70%
(Food etc.) [A54] Poultry slaughtering and processing 3,9% # Milk, cheese, butter 3,87% Fruit and vegetables in DK, except potatoes, private consump. 1,50%
[A53] Sausages and other prepared meat products 2,5% # Cereals 3,84%
[A59] Fluid milk 2,4% # Potatoes, Groceries, Fruits 3,12%
[A56] Natural, processed, and imitation cheese 2,1% # Feeding - Other 1,55%
[A93] Edible fats and oils, n.e.c. 1,3% # Jam, sweets 1,44%
[A86] Bottled and canned soft drinks 0,9% # Non-alcoholic beverages 1,08%
[A75] Bread, cake, and related products 0,9% # Fish and fish products 1,01%
[A66] Frozen fruits, fruit juices, and vegetables 0,7% # Coffee, Tea, Cacao 0,80%
[A98] Cigarettes 0,7% # Alcoholic beverages 0,73%
[A12] Vegetables 0,7% # Fat and oil 0,44%
[A92] Roasted coffee 0,7%
[A65] Prepared fresh or frozen fish and seafoods 0,6%
[A84] Wines, brandy, and brandy spirits 0,6%
[A57] Dry, condensed, and evaporated dairy products 0,6%
[A96] Potato chips and similar snacks 0,5%
[A10] Fruits 0,5%
[A81] Candy and other confectionery products 0,5%
[A69] Cereal breakfast foods 0,5%
[A2] Poultry and eggs 0,5%
30 Other categories, total: 4,4%
Subtotal 31,0% Subtotal 22,12%
CP03 [A115] Apparel made from purchased materials 1,6% # Clothes 4,2% Clothing purchase and washing in DK, private consumption 2,10%
(Clothing etc.) [A426] Laundry, cleaning, garment services, and shoe repair0,3% # Shoes 1,2%
[A206] Shoes, except rubber 0,2% # Accessoires 0,9%
[A112] Women's hosiery, except socks 0,1% # Clothing - Other 0,2%
[A199] Rubber and plastics footwear 0,1%
[A113] Hosiery, n.e.c. 0,1%
9 Other categories: total 0,1%
Subtotal 2,4% 6,5%
CP04-05 [A257] (Household heating with) heating equipment, except electric and warm a furnaces4,7% # Heating 9,20% Dwellings and heating in DK, private consumption 7,70%
(Housing etc.) [A31] New residential 1 unit structures, nonfarm 3,2% # Feeding - Direct energy (gas, electricity)3,50% Personal hygiene in DK, private consumption 1,90%
[A333] (Washing with) household laundry equipment 2,4% # Rent and mortgage 3,16% Retirement homes, day-care etc. in DK, public consumption 0,80%
[A33] New additions & alterations, nonfarm, construction1,8% # Energy, hot water 3,06%
[A332] (use of) Household refrigerators and freezers 1,8% # Electricity 2,38%
[A337] (use of) Electric lamp bulbs and tubes 1,2% # Furniture 1,93%
[A331] (use of) Household cooking equipment 1,0% # Kitchen appliances etc. 1,53%
[A42] Maintenance and repair of farm and nonfarm residential structures0,7% # Shelter - Other 1,38%
[A413] Water supply and sewerage systems 0,7% # Washing, drying, ironing 0,97%
[A34] New residential garden and high-rise apartments construction0,7% # Taxes 0,81%
[A393] Non-durable household goods 0,5% # Flowers and plants (in house) 0,78%
[A106] Carpets and rugs 0,3% # Maintenance 0,52%
[A139] Wood household furniture, except upholstered 0,3% # Mattresses, linen 0,52%
[A149] Partitions and fixtures, except wood 0,3% # Personal care - Water 0,51%
[A201] Miscellaneous plastics products, n.e.c. 0,3% # Living - Other 0,50%
[A437] Miscellaneous equipment rental and leasing 0,2% # 'Soft' flooring 0,41%
[A117] Housefurnishings, n.e.c. 0,2% # Lighting 0,34%
[A439] Other business services 0,2% # 'Versiering' 0,33%
[A335] (use of) Household vacuum cleaners 0,2% # Painting 0,31%
[A142] Upholstered household furniture 0,2% # Curtains etc. 0,30%
[A334] (use of) Electric housewares and fans 0,2% # Electrical appliances 0,30%
[A17] Forestry products 0,2% # Cleaning attributions 0,22%
[A25] Crude petroleum and natural gas 0,2% # Resilient flooring 0,19%
[A429] Electrical repair shops 0,1% # Sun protection and 'horren' 0,18%
[A144] Mattresses and bedsprings 0,1% # Services 0,08%
[A430] Watch, clock, jewelry, and furniture repair 0,1% # Washing, drying, ironing 0,00%
[A123] Fabricated textile products, n.e.c. 0,1%
[A148] Wood partitions and fixtures 0,1%
[A121] Automotive and apparel trimmings 0,1%
63 Other categories, total: 1,4%
Subtotal 23,6% Subtotal 33,41%

Paper for a FORESCENE Workshop, Vienna, 23 and 24 October 2006: Life cycle impacts of consumption
9
Table 3.2: Detailed comparison of three studies, % contribution on GWP or ecological footprint (continued)
CEDA EU25 (Chapter 5) Nijdam and Wilting (2003) Weidema et al. (2005)
CP06 [A187] Drugs 0,7% # Self medication 0,29% Hospital services in DK, public consumption 0,80%
(Healthcare) [A458] Doctors and dentists 0,4%
[A459] Hospitals 0,2%
[A461] Other medical and health services 0,1%
[A378] Ophthalmic goods 0,1%
Subtotal 1,6% Subtotal 0,3%
CP07 [A354] (Driving with) motor vehicles and passenger car bodies15,0% # Mobility for leisure 8,10% Car purchase and driving in DK, private consumption 6,00%
(Transport) [A448] Automotive repair shops and services 1,2% # Commuting, private transport 8,03% Transport services in DK, private consumption 1,50%
[A447] Automotive rental and leasing, without drivers 0,6% # Commuting, public transport 0,38% Car driving as fringe benefit and car related services 1,50%
[A399] Local and suburban transit and interurban highway passenger transportation0,4% # Mobility for 'living' 0,38%
[A403] Air transportation 0,3% # Transport (clothing 1) 0,21%
[A398] Railroads and related services 0,3% # Transport (clothing 2) 0,17%
13 Other categories totalling 0,7%
Subtotal 18,5% Subtotal 17,3%
CP08 [A407] Telephone, telgraph communications, and communications services n.e.c.1,3%
(Communication) [A475] Postal Service 0,6%
[A343] (use of) Communication equipment 0,1%
[A342] (use of) Telephone and telegraph apparatus 0,1%
Subtotal 2,1%
CP09 [A340] (use of) Household audio and video equipment 1,2% # Holidays 4,77% Tourist expenditures by Danes travelling abroad, private cons. 3,70%
(Recreation etc.) [A457] Other amusement and recreation services 0,9% # TV, radio ('Brown goods'/Electronics) 1,92% Television, computer etc. in DK, incl. use, private consumption 1,50%
[A176] (Household use of) pesticides and agricultural chemicals, n.e.c.0,4% # Garden, excluding furniture 1,23%
[A71] Dog and cat food 0,4% # Electricity 1,27%
[A428] Portrait photographic studios, and other miscellaneous personal services0,3% # Newspapers, periodicals, books 1,16%
[A317] (use of) Electronic computers 0,2% # Games and toys 0,70%
[A408] Cable and other pay television services 0,2% # Telephone 0,68%
[A164] Book publishing 0,2% # Sports 0,65%
[A163] Periodicals 0,2% # Other 0,56%
[A318] (use of) Computer peripheral equipment 0,2% # Leisure - Other 0,56%
[A162] Newspapers 0,2% # Smoking 0,46%
[A456] Physical fitness facilities and membership sports and recreation clubs0,1% # Pets 0,45%
[A175] Nitrogenous and phosphatic fertilizers 0,1% # CDs etc 0,40%
51 Other categories, total: 1,3% # Film and photo 0,32%
Subtotal 6,0% Subtotal 15,1%
CP10 [A465] Colleges, universities, and professional schools 0,3% # Books and educational tools 0,24% Education and research, DK public consumption 1,50%
(Education) [A464] Elementary and secondary schools 0,1% # Educational fees 0,23%
[A466] Private libraries, vocational schools, and educational services, n.e.c.0,1% # Child care / 'Kindergarten' 0,22%
[A471] Job training and related services 0,0% # Work - Other 0,02%
Subtotal 0,5% Subtotal 0,7%
CP11 [A446] Eating and drinking places 8,1% # Restaurant, pub, etc. 2,77% Catering, DK private consumption 1,50%
(Restaurants, [A424] Hotels 0,6%
hotels) [A425] Other lodging places 0,4%
Subtotal 9,1% Subtotal 2,8%
CP12 [A431] Beauty and barber shops 1,2% # Personal care - Other 0,45% General public services, public order and safety affairs in DK 1,50%
(Miscellaneous) [A419] Insurance carriers 1,1% # Toiletries 0,41% Economic affairs and services, DK public consumption 1,50%
[A336] (use of) Household appliances, n.e.c. 1,0% # Cosmetics and perfume 0,31%
[A422] Real estate agents, managers, operators, and lessors0,4% # Hair care products 0,23%
[A191] Toilet preparations 0,3% # Barber and beauty services 0,22%
[A154] Sanitary paper products 0,3% # Hygienic paper 0,14%
[A188] Soap and other detergents 0,2%
23 Other categories, total 0,7%
Subtotal 5,2% Subtotal 1,8%
Note: Weidema only reported the top-15 perimpact category

Paper for a FORESCENE Workshop, Vienna, 23 and 24 October 2006: Life cycle impacts of consumption
10
3.3.2 Results of the comparison The comparison at sub-COICOP level indicated that the following product groups have the most important contributions to most environmental impact categories (such as GWP, POCP, Eutrophication, Acidification, total material and resource use, etc.):
1. Food (COICOP Category 01, 02 and 11), with as most dominant contributors: a. Meat and meat products (including poultry) b. Milk, cheese, and related products c. Other non animal food products d. Expenditures in restaurants (as far as not covered under a-c)
2. Housing and related energy use (COICOP category 04, 05 and part 09), with as most dominant contributors:
a. Heating equipment, cooking equipment and warm water generation equipment (particularly due to their energy use)
b. (Electrical) energy using products c. The housing construction as such
3. Transport (COICOP Category 07 and 10), with as most dominant contributors: a. Cars for private car transport (highly dominant) b. Air transport services c. Train transport services d. Transport related to package holidays (as far as not covered under a-c)
3.3.3 Other relevant results Finally, particularly the CEDA EU-25 model that was developed as a part of the EIPRO study gave two other results that are relevant for IPP. First, when the product or expenditure categories are ranked by impact, and the cumulative totals are shown, there appears to be an 80-20 rule. Some 20% of the products cause 80% of the impacts. Figure 3.1 gives GWP as an example, but this figure is also valid for other environmental impact categories. Second, when the products are ranked on impact per Euro and the (% of) total expenditure is put on the other axis, a figure results as given in Figure 3.2. This figure gives two types of insight:
a) the total impact per category (which is the surface determined by impact per Euro multiplied by Euro spent)
b) the scope for reducing societal impacts (which is the total surface of the figure) by diverting expenditures to low-impact categories.,
The figure shows that in fact the latter option has its limits. First, the difference in impact per Euro is just a factor 4 (neglecting the top and bottom 10%). Second, there are limitations in the extent to which shifts are possible. For instance, many of the high impact per Euro categories consist of food, but mankind can not stop eating. Here, only shifts are possible to categories such as restaurants or from animal based food to vegetables.

Paper for a FORESCENE Workshop, Vienna, 23 and 24 October 2006: Life cycle impacts of consumption
11
Figure 3.1: Cumulative impacts, expenditure groups ranked by total impact
global warming
0.00
0.20
0.40
0.60
0.80
1.00
product
fraction of total problem EU25
Figure 3.2: Impact per Euro versus total expenditure
3
0.0E+00
4.0E-13
8.0E-13
1.2E-12
1.6E-12
0 20 40 60 80 100
Cumulative household expenditure [%]
aggregated environmental im
pact per euro [euro
-1]
milk
doctors and dentist
insurance carriers
meat
cheese poultry
car driving
miscellaneous crops (topped)
apparel
eating and drinking places
new residential unit
meat products
household heating
telecommunications
auto services
residential renovation
beauty &
barber shops
bread laundry
cooling
bottled drinks
edible fats
3 For this figure, the different impact categories were aggregated to a single score. See Tukker et al. (2005) for the weighting procedure applied.

Paper for a FORESCENE Workshop, Vienna, 23 and 24 October 2006: Life cycle impacts of consumption
12
4 Discussion Due to the large variety of approaches used in the eleven studies underlying the conclusions this paper, it is extremely unlikely that the product groupings or consumption categories that show up as important in all studies are false positives. This is because a great variety of data sources and impact assessment methods have been used. The priority list from this paper and the underlying study should not be regarded as the ultimate limited overview. False negatives are still possible. The main reasons are that i. specific product groups that are often used in combination with other products (e.g.
packaging) are not defined as such and hence not visible in all studies; ii. the methodologies to make good inventories of particularly slow, diffuse emissions
(from e.g. landfills) and the related assessment of toxic impacts are relatively weak (relevant for e.g. products containing heavy metals such as lead, chromium VI, and persistent chemicals such as brominated flame retardants)
iii. studies at macro level are not well suited to deal with impacts at micro level (e.g. chemicals used in consumer products that may cause risks due to direct exposure; or the use of water resources, which if depletion problems are caused, usually occur at a local or regional level)
iv. certain impact categories are still relatively difficult to handle by impact assessment methods, and are hence not included in all studies reviewed, or at least not included in a comparable way (e.g. fish products and tropical wood products that only show up as relevant in an individual study (Nijdam and Wilting, 2003), but which are likely to be relevant in any study that would cover the biotic depletion of fish and wood resources and biodiversity).
And though not totally at the centre of the EIPRO study, it contributed to a better understanding of what the relative contribution of policy strategies can be to decoupling of environmental impacts from economic growth. In the book that was the result of SusProNet (Tukker and Tischner, eds., 2006), five key intervention mechanisms have been identified, which roughly can be characterised as
1) improving emission factors (‘end of pipe’); 2) improving production efficiency (‘cleaner production and products’); 3) intensifying the use of products (‘product service systems or PSS’); 4) creating immaterial economic value (‘spending on immaterial value); and 5) improving quality of life at the same expenditure level.
End of pipe and cleaner production are well known strategies. They can realise major achievements in decoupling, but only in case of small mass flow emissions (end of pipe), or in case of radical technical change (cleaner production). The other three options are more challenging in that sense, that they deal with the consumption side of the production-consumption system. As shown amongst others by Mont (2004) and Meijkamp (2000), intensifying the use of products via implementing PSS probably may only give a factor 2 decoupling. And the EIPRO study showed with Figure 3.2 that the

Paper for a FORESCENE Workshop, Vienna, 23 and 24 October 2006: Life cycle impacts of consumption
13
much-loved strategy of ‘realising growth by spending on immaterial value’ has clear limits. Even with a massive shift of expenditure from left to right in the figure, one could reduce the surface (which equal impact) of the figure maybe with a factor 2. And one has to acknowledge that many shifts are impossible. The high impact per Euro categories are all foodstuffs, and mankind cannot stop eating4 That report also identified the typical reduction values that each strategy can give (table 1). The last three of these strategies deal with the consumption part of our economy and appear to have a great potential for decoupling. Yet, policy is hardly addressing these elements yet. Indeed, one could argue that intervention mechanisms 3-5 – the ones dealing with consumption rather than production patterns – are essential to reach far reaching goals such as reaching a factor 4 or 10 decoupling of quality of life from resource use. But as suggested by figure 2, incremental improvement of production and products is still dominant – other decoupling strategies are at best applied as niche-policies. Table 4.1: Decoupling potential per intervention mechanism
Intervention mechanism Potential reductions of impact per unit Quality of Life (excluding rebounds)
1. Enhancing impact efficiency of production (‘end of pipe’)
- Small mass flows: several factors by end of pipe or cleaner technology
- Large mass flows: Limited
2. Enhancing (product) efficiency output of production (‘cleaner production’)
- Limited to intermediate, in case of incremental improvements and re-design
- Factor X in case of system innovation
3. Enhancing the intensity of use of products (‘product services’)
- Factor 2 or more, depending on the sharing, pooling or function combination system
4. Reducing the product composition of expenditure (‘spending on immaterial value’)
- Factor 2 (if limited to changes within existing product and service categories)
5. Enhancing the ratio Quality of life and consumer expenditure
- Several factors?
5 Conclusions Our work shows that environmental policy that puts consumption, products and services in the centre stage is not the impossible task it is sometimes cracked up to be. The number of consumption expenditure items causing the majority of the life cycle environmental impacts of societal final expenditure is limited. Transport, Food, and House-related energy use make up 70% of most of the environmental impact types. In total, a few dozen product groupings cause for most impact categories 80% of the life 4 The final point in Table 4.1 relates to an issue not at all discussed in EIPRO, but in studies such as the Happy Planet Index of the new economics foundation (Marks et al, 2006). Such studies find it particularly mind-boggling that it is taken for granted that economic growth will improve quality of life, where studies consistently show that the factor 3-5 wealth rise in US, Europe and Japan in the last 50 years lead to not any significant improvement. In sum, there is a great need for research and policy directed at understanding and improving the relation between quality of life and material product flows (see also Tukker and Tischner, 2006).
Paper for a FORESCENE Workshop, Vienna, 23 and 24 October 2006: Life cycle impacts of consumption
14
cycle impacts in the EU. This result comes consistently from about a dozen of studies that have followed very different approaches to defining product groupings, data inventory and impact assessment, and hence has to be regarded as very robust. Acknowledgements: Most of the information given in this paper was funded as the study Environmental Impacts of Products (EIPRO), by the European Science and Technology Observatory (ESTO) upon request of the EU’s Institute for Prospective Technological Studies in Sevilla (IPTS). The active contribution of Peter Eder of IPTS to the study is greatly acknowledged. Findings will be published in a more expanded form in the Journal of Industrial Ecology, Spring 2006. The information in this special issue may or may not reflect the official position of these organisations.
References
Collins, A., A. Flynn, and A. Netherwood (2005). Reducing Cardiff’s Ecological Footprint. WWF Cymru (WWF Wales), Cardiff, Wales
Collins, A., A Flynn, T. Wiedmann and J. Barrett (2006). The Environmental Impacts of Consumption at a Sub-National Level: The Ecological Footprint of Cardiff. Journal of Industrial Ecology, 10.xx
Collins, M and R. Nuij (2004) Review of the Belgian Product Study, for The Alliance for Beverage Cartons and the Environment. ERM, London, UK
Dall. O., J. Toft, and T.T. Andersen. (2002). Danske husholdningers miljøbelastning. København: Miljøstyrelsen. (Arbejdsrappport 13). http://www.mst.dk/udgiv/ Publikationer/2002/87-7972-094-3/pdf/87-7972-095-1.PDF
Guinée, J.B., Ed (2002) Handbook on Life Cycle Assessment – Operational guide to the ISO standards. Kluwer Academic Publishers/Springer, Dordrecht, Netherlands.
EEA (2004). Analysis of greenhouse gas emission trends and projections in Europe. Draft Technical report No 7/2004, Final draft version, 30 November. Data: http://reports.eea.eu.int/technical_report_2004_7/en/tab_content_RLR
Hauschild, M., H. Wenzel and L. Alting, H. (2000). Environmental Assessment of Products. Vol. 1, Springer, Dordrecht/London.
Heijungs R. (1997). Economic drama and the environmental stage. Ph.D. Thesis, Leiden University, CML, Leiden, Netherlands
Hertwich, E. (2005). Feasibility and Scope of Life cycle Approaches to Sustainable Consumption (FESCOLA). D5: Recommendations. NTNU, Industrial Ecology Program, Trondheim, Norway
Huppes, G., A. de Koning, S. Suh, R. Heijungs, L. van Oers, P. Nielsen, J.B. Guinée (2006). Environmental Impacts Of Consumption In The European Union Using Detailed Input-Output Analysis. Journal of Industrial Ecology 10.xxx
Jansen, B. and K. Thollier (2006). Bottom-up LCA Methodology for the Evaluation of Environmental Impacts of Product Consumption in Belgium. Journal of Industrial Ecology 10.xxx
Joint Platform ‘European and International Environmental Policy’ (2003), Position Integrated Product Policy, Comments on the methodology used in the Belgian study, September 2003 (Members of Joint Platform are industry federations FEB, UWE, UEB, VEV)

Paper for a FORESCENE Workshop, Vienna, 23 and 24 October 2006: Life cycle impacts of consumption
15
Kok, R., H.J. Falkena, R. Benders, H.C. Moll and K.J. Noorman (2003): Household metabolism in European countries and cities. Comparing and evaluating the results of the cities Fredrikstad (Norway), Groningen (The Netherlands), Guildford (UK), and Stockholm (Sweden). Toolsust Deliverable No. 9; Center for Energy and Environmental Studies, University of Groningen, Netherlands. Available from. http://www.toolsust.org/documents/Toolsust-IntegrationWP2deliverable9final.pdf
Labouze, E., V. Monier, Y. Le Guern and J.-B. Puyou. (2003), Study on external environmental effects related to the lifecycle of products and services – Final Report Version 2, European Commission, Directorate General Environment, Directorate A – Sustainable Development and Policy support, BIO Intelligence Service/O2 France, Paris, France
Marks, N., A. Simms, S. Thompson and S. Abdallah (2006). The Happy Planet Index. new economic foundation and Friends of the Earth, London, UK
Meijkamp, R. (2000). Changing consumer behaviour through eco-efficient services; an empirical study on car sharing in the Netherlands. Ph.D. Thesis, Delft University of Technology, Faculty of Industrial Design Engineering, Netherlands
Moll, S., J. Acosta, and A. Villanueva (2004). Environmental implications of resource use – insights from input-output analyses, prepared by the European Topic Centre on Waste and Material flows (ETC WMF), Copenhagen, Denmark
Moll, S. and J. Acosta (2006). Environmental Implications of Resource Use – NAMEA based environmental Input-Output analyses for Germany. Journal of Industrial Ecology 10.3
Mont, O. (2004). Product-service systems: Panacea or myth? International Institute for Industrial Environmental Economics, Lund University, Sweden
Nemry, F., K. Thollier, B. Jansen, J. Theunis. (2002), Identifying key products for the federal product & environment policy – Final report, for Federal Services of Environment Department on Product Policy, Institut Wallon de Développement Économique et Social et d’Aménagement du Territoire ASBL/Vlaamse Instelling voor Technologisch Onderzoek, Namur/Mol, Belgium.
Nijdam D S, Wilting H. (2003). Milieudruk consumptie in beeld [A view on environmental pressure on consumption] Bilthoven: RIVM. (RIVM rapport 7714040004).
Palm, V., A. Wadeskog and G. Finnveden (2006). Swedish experiences of using environmental accounts data for integrated product policy (IPP) issues. Journal of Industrial Ecology 10.xxx
Peters, G.P. and E.G. Hertwich (2006). Measuring Household Environmental Impacts: The Case of Norway. Journal of Industrial Ecology 10.xxx
Tukker, A., G. Huppes, S. Suh, R. Heijungs, J. Guinee, A. de Koning, T. Geerken, B. Jansen, M. van Holderbeke and P Nielsen (2005). Environmental Impacts of Products. ESTO/IPTS, Sevilla.
Tukker, A., P. Eder and S. Suh (2006). Environmental impacts of products: Policy implications and Outlook. Journal of Industrial Ecology, 10.3
Tukker, A. and U. Tischner (2006). New Business for Old Europe. Product Service Development, Sustainability and Competitiveness. Greenleaf Publishing, Sheffield, UK.

Paper for a FORESCENE Workshop, Vienna, 23 and 24 October 2006: Life cycle impacts of consumption
16
Wackernagel, M., Rees, W.E. (1996) Our Ecological Footprint. Reducing Human Impact on the Earth (New Society Publishers, Gabriola Island BC).
Wiedmann, T., Minx, J., Barrett, J., and Wackernagel, M., forthcoming. Allocating Ecological Footprints to Household Consumption Activities by Using Input-Output Analysis. Accepted for publication in Ecological Economics.
Weidema, B.P., A.M. Nielsen, K. Christiansen, G. Norris, P. Notten, S. Suh, and J. Madsen (2005): Prioritisation within the integrated product policy. 2.-0 LCA Consultants for Danish EPA, Copenhagen, Denmark

FORESCENE WORKSHOP
VIENNA, 23-24 October
Sustainability Assessment Paul M. Weaver
Introduction The Forescene workshop is concerned with the future of Industry/Economy in Europe and how that future might be made ‘sustainable’. The two central questions we seek to address are: i) Where shall we go? and ii) How do we get there? Sustainable development defies a simple, universal definition. There is, nonetheless an emerging consensus on some of its central features: i) the holistic nature of the concept, which encompasses multiple domains and emphasises the links between and across socio-economic and biophysical systems, scale levels, space and time; ii) the need to recognise and respect limits and interdependence among these; iii) the broad overall goal of supporting current and future well-being; and, iv) respect for uncertainty. There is also consensus emerging that in order to produce operational interpretations of sustainable development appropriate for specific contexts, these central features need to be elaborated in context. We already know a good deal about the unsustainability of current economic arrangements. There are two essential sustainability concerns that we can identify among a large number of other, more peripheral, concerns. The first relates to biophysical degradation; the second to social justice. Our current economic and industrial arrangements are unsustainable because our use of resources and generation of waste is degrading the biophysical basis for the sustenance of human welfare, and because the already-wide gap between rich and poor is widening, not narrowing. These threaten our future and current well-being. Despite the calls and claims to sustainable development, policy-making to date has not addressed either concern sufficiently because it fails to take key links into account, such as the links between objectives and the links between interdependent constraints. This reflects the traditional and still dominant approach in science, policy making and economic management of breaking the real-world down into constituent parts and treating each as if it were separate from the other parts to which it is systemically and functionally related. For a long time ‘development’ has been equated with economic development and economic development has been equated with economic growth. Through this process of conflation the role of economic activity in development has been miscast. Economic activity should serve development goals, not be a goal of development itself. Any transition to a new and more sustainable paradigm must therefore draw upon the essential feature of sustainable development as an ‘integrating’ concept. The challenge of sustainable development is therefore one of ‘reframing’ and ‘contextualising’ development using integrated approaches to define problems, set goals, recognise constraints, design

2
solutions and develop policy instruments. For this, we need concepts that are domain, structure, scale, space and time transcending, like stocks and flows, and we need to focus on agents and actors who have the capacity to influence the development path. From our various disciplinary perspectives, we can provide insights about how the problems might be solved. However, there are significant scientific uncertainties about some aspects that are central to the development of solutions. For example, we cannot be precise (in the scientific sense of the word) about the relationship between resource use and environmental degradation or about the limits on resource use that we need to respect. The questions posed above relate to systems of interest and reference – the socio-economic system and the biosphere – that are complex. The system dynamics and the relationships underlying these are uncertain. The questions are also normative and value-laden, and the challenge to which they refer – of establishing the future role of the economy and its relation to wider development objectives – is essentially prescriptive. These aspects imply that there are no ‘right’ or ‘wrong’ answers to the central questions of the workshop. Rather, as scientists and experts we can play two roles. First, we can provide our own insights, knowledge and perspectives on the problem as experts, while acknowledging that there are many things we do not or cannot know. Secondly, we can design processes through which socially-robust answers to these questions might be obtained and help implement these processes by acting as facilitators and coordinators and by providing models and technical support to address the ‘what-if’ questions that such processes raise. The legitimacy of the process by which answers to these questions emerge is critical. We therefore need a process that is participatory and involves stakeholders, those with responsibility for setting policy and those with agency to deliver change, as well as technical ‘experts’. We also need a process capable of supporting sustainability learning and social learning and that will provide for ‘negotiated solutions’ to emerge. My input today focuses especially on sustainability assessment. In particular, I want to provide insights from the MATISSE project, which is developing and testing concepts, methods and tools for integrated sustainability assessment that are designed specifically to address such questions.
Interpreting sustainability in the economy/industry domain Past economic development is a response to past contexts and past problems. At the dawn of the industrial revolution, natural resources were abundant, the level of economic output was relatively low and there was material poverty. The solution was therefore to focus on producing goods and services to provide for basic needs. The technologies of the day were relatively primitive and needed a high labour input. Production required labour, so the wage relation could work as a means to distribute GDP. However, the context has changed and so have the problems we face. We now live in materially rich societies. There is no longer a production problem per se. In principle, we produce more than enough to meet all our basic needs and to provide for many other wants to be met, albeit that the benefits of abundance are not necessarily distributed in relation to need. However, in the process, the status of our capital stock has changed fundamentally. We have run down the stocks of environmental capital, built infrastructures that provide for mass production and consumption, and developed new technologies that have reduced the role of physical labour in the production process. The context and the problems we face have therefore changed; but there has been no commensurate change in our economic development paradigm. Our markets and economic relations are still structured around the idea that economic activity is a goal in itself, that

3
natural resources are unlimited and that the environmental system is not capacitated. There is therefore inertia in making the corresponding institutional adjustments to the new reality. Which features of the economy contribute to unsustainability, Against this backdrop and with the caveat that what follows is only one perspective on the issue, it is useful to identify features of current economic arrangements that contribute to unsustainability:
i. Government revenues (and therefore level of public services) are tied to the level of economic activity and to levels of employment;
ii. Access to social benefits, healthcare, pension etc. depends on employment iii. Products are used as surrogates in transactions to represent exchange value iv. Producer responsibility is limited in time and to only a part of the material cycle v. Competitiveness drives innovation, profitability and survival, but is played out on a
globalised playing field that isn’t level (currency pegging, different levels of environmental and social protection, etc.)
vi. The costs of energy, materials, water, transport, waste disposal and long-term risk have been kept artificially low or are externalised
vii. The wage relation and a means-tested benefit system are used to distribute entitlement to GDP
viii. Performance of key decision makers (politicians, CEOs, etc.) is assessed in the short term
These lead to a focus in economic management on
i. GNP growth ii. Economies of scale (while disregarding diseconomies of scale)
iii. Individual ownership iv. Outsourcing to countries with lower social and environmental protections (problem
shifting) v. Shedding labour to cut costs (private sector)
vi. Artificial job creation or support (public sector) vii. Maximising throughput
viii. Maximising speed and rates of change ix. Substitution of materials, energy and transport for labour x. Innovation that leads to rapid product and infrastructure obsolescence
xi. Innovation that focuses on product development, not on feedstock substitution xii. Externalising costs and risks (because scope for this is large)
xiii. Short-termism These foci in turn give rise to the unsustainability of our economy:
i. High resource use and resource dependency ii. High levels of pollution, waste and risk
iii. Avoidable health problems related to stress, pollution, diet, accidents iv. High transport dependency v. Supply chain insecurity
vi. Insecure and stressful jobs vii. Artificial jobs
viii. Dysfunctional work patterns (many worthwhile jobs not done, because they are not backed by money demand; unfair distribution of work)
ix. Dysfunctional patterns of space and time use x. Degradation of family and social life

4
xi. Materialism xii. Dysfunctional investment
xiii. Premature write-down of capital xiv. Fragile public finances At issue is whether the relationships that are embedded in present day economic activities are necessary or whether they are artefacts that have become institutionalised, but could be relaxed and replaced by new relationships. On what does progress toward sustainable development depend? We need a much more differentiated approach to economic development that distinguishes between activities that are sustainable and are to be encouraged and activities that are unsustainable and need to be discouraged. However, even as we seek to change to a new development paradigm, the old development paradigm imposes institutional constraints that are very powerful in terms of goal setting, incentives, attitudes and behaviours that restrict the option set that appears open to us. When we set our goals for sustainability, there is a tendency to carry forward the baggage of the existing paradigm and set goals (like production, jobs and competitiveness) that are surrogates for what we want to achieve. The danger of these lies in their ambiguity. The contribution of output, jobs and competitiveness to sustainable development depends on their qualitative attributes. We therefore need a screening method to differentiate positive from negative contributions. The basis question we need to ask about any economic activity is whether it contributes to or detracts from sustainability? A useful starting point is to set out what we need to build or sustain in order for development to be sustainable. The following list, provided by Gibson (Gibson 2005, 2006), proposes that progress toward sustainable development depends on maintaining or building:
i. socio-ecological system integrity (which implies protecting the irreplaceable life support functions upon which human- as well as ecological- well-being depends)
ii. livelihood sufficiency and opportunity (which implies ensuring that everyone and every community has enough for a decent life and opportunities to seek improvements in ways that do not compromise future generations’ possibilities for sufficiency and opportunity)
iii. intragenerational equity (which implies that sufficiency and opportunity are pursued in ways that reduce dangerous gaps in these between the rich and poor)
iv. intergenerational equity (which implies favouring options and actions most likely to preserve or enhance opportunities and capabilities for future generations to live sustainably
v. resources and efficient resource use (as the basis for securing sustainable livelihoods for all while reducing long-term threats to socio-ecological systems by increasing eco-efficiency)
vi. socio-ecological civility and democratic governance (including the capacity, motivation and habit to apply sustainability requirements through more open and better informed deliberations and decision making practices)
vii. precaution and adaptation (which implies respecting uncertainty, avoiding risks of serious or irreversible damage to the foundations of sustainability, designing for surprise and managing for adaptation)

5
At issue is that to contribute to sustainability, an economic activity should simultaneously contribute to progress on all of the above, which implies applying all these principles at once in an integrated fashion and seeking mutually supporting benefits and multiple gains. Strategies and instruments There are several strategies that could be used to deliver a more sustainable economy:
i. shifts in the structure of production and consumption away from resource-, waste- and risk- intensive activities in favour of less environmentally damaging activities;
ii. shifts to cleaner and more abundant resources (resource switching/substitution) iii. shifts to leaner and cleaner production iv. shifts in the utilisation rates of products; v. shifts from selling products to selling services;
vi. shifts from individual to collective provision; vii. shifts from economies of scale to economies of scope;
viii. shifts from paid employment as the means for allocating GDP to altwernatives (citizens’ income, individual tradable resource permits);
ix. shifts to more flexible working arrangements x. shifs in patterns of time and space use;
xi. shifts toward greater local and regional self-sufficiency; xii. shifts in the use of capital (for example, to restore and augment ecological capital and
resource stocks) Equally, there are many potential measures and policy instruments whose use could be explored. Many have been proposed already:
i. revision of the methods for calculating GNP; ii. revision of the terms of trade:
iii. ecological tax reform; iv. full-cost pricing; v. tradable permits for carbon, key materials and water;
vi. individual resource and/or pollution budgets; vii. subsidy reform;
viii. extended producer responsibility; ix. re-orientation of R&D.
Individual tradable resource or pollution permits tied to consumption are important instruments because of their potential in addressing simultaneously virtually all of the concerns expressed in this paper. It may be some time before individual tradable permits are introduced and they may need to be accompanied by many flanking measures, but their potential makes them very suitable candidates for exploration through integrated sustainability assessment.
Sustainability assessment ‘state of the art’ Sustainability assessment is a generic term that covers a broad spectrum of actual and potential assessment methods.1 This said all types of sustainability assessment share common characteristics. To be considered a ‘sustainability assessment’, the scope of an assessment must be broad enough to cover at least the economic, environmental and social dimensions 1 The ‘genre’ has developed rapidly. In a recent paper, Gibson points out that an internet search this summer brought up 26 million sites mentioning the term and revealed thousands of distinct initiatives (Gibson 2006). This is indeed a rapid development, since the term ‘sustainability assessment’ was coined for the first time only 7 years ago (Devuyst 1999).
6
and the relevant subsystems of sustainable development. All sustainability assessments are information gathering, generating and synthesising processes. All are ‘tests’ to ensure the consistency of initiatives (ex ante) or developments (ex post) with the intention and interpretation of sustainability in the relevant application context. Sustainability assessment is, therefore, “a sustainability defining and applying process.” (Varey 2004) and the definition or interpretation of sustainability is central to the overall endeavour of assessment. In principle, to implement sustainable development there must be both sustainability criteria and principles for making trade-offs between sustainability values. This implies that there must be either/both:
a) Generic values and principles that could transcend jurisdictions, scales and application domains, including decision-making rules for handling trade-offs between sustainability values, that can guide implementation at the level of specific decisions about prospective interventions; and/or
b) Generic principles defining how to put in place mechanisms and processes to produce values and trade-offs in individual cases in a way that is as consistent as possible with the notion of sustainable development as defined by the variously competing interests involved/affected.
After a debate that has been ongoing now for around 20 years, a consensus has, at least, emerged that rather than continue searching for a universal definition that we now know cannot be found, it is better to develop a jurisdiction- or context-specific interpretation of sustainability that is acceptable to a wide range of stakeholders within a particular application domain. In this, we can combine a few core requirements for progress toward sustainability that are common even among contested definitions with context-specific elements that reflect the particular features of local ecosystems, institutional capacities and stakeholder values. Producing an operational basis for decision making requires a process of dialogue with and among stakeholders in the specific application domain in order to develop sustainability criteria and trade-off rules that are acceptable to stakeholders. Key issues are:
• What should be included in the definition of sustainability in order to make this an operational basis for decision making?
• Through what processes and mechanisms might an operational definition be derived? • To which extent should sustainability definition be endogenous to the sustainability
assessment process and to which extent should exogenously-specified (quasi-generic) elements be included in the definition?
• How should sustainability values and principles be integrated into the conduct of a sustainability assessment and into governance structures and processes?
Different types of sustainability assessments are distinguished from each other essentially by their purpose and premise. Sustainability assessments all use similar tools and methods. How the tools and methods are used and for which purpose distinguishes one type of assessment from another. This has the implication that sustainability assessments cannot be evaluated in abstract, but must be evaluated in context and in relation to their intended purpose according to ‘fitness for purpose’ criteria. In MATISSE, we differentiate ‘pragmatic’ from ‘strategic’ sustainability assessment. Pragmatic sustainability assessments are used for screening initiatives or for evaluating actual developments as part of routine, institutionalised processes for ensuring that initiatives/developments are consistent with each other and with the intent and interpretation of sustainable development within the relevant context or jurisdiction.

7
Pragmatic sustainability assessment is a ‘paradigm-applying’ process, since its purpose is to ensure that initiatives are consistent with the prevailing policy paradigm and its interpretation of sustainable development. By contrast, we can propose a more strategic and longer-term form of sustainability assessment that is not yet well developed, whose purpose is to explore solutions to persistent problems of unsustainable development, their acceptability to stakeholders, and the policy paradigms within which these might be viable and consistent. This latter type of sustainability assessment, which we term Integrated Sustainability Assessment (ISA), is more deliberately sustainability-oriented, constructive and explorative. The purpose of ISA is to explore the problem-solving potential of alternative policy paradigms to those now in place. ISA seeks simultaneously to define acceptable solutions to problems and the policy paradigm with which these would be consistent and within which they could be implemented feasibly. Our purpose in MATISSE is to define, design and test a sustainability assessment process from first principles that has the capacity to perform this more strategic, paradigm-exploring role. Against this backdrop, the following ISA definition has been proposed in the MATISSE project:
“ISA is a cyclical, participatory process of scoping, envisioning, experimenting and learning/evaluation through which a shared interpretation of sustainability for a specific context is developed and applied in an integrated manner in order to explore solutions to persistent problems of unsustainable development.”
This description of a cyclical, participative ISA-process is depicted in Figure 1. The four stages are described briefly below in terms of the different activities and tasks they involve. Figure 1: ISA as cyclical process
PUBLIC
SCIENCEPOLICY
SCOPING ENVISIONING
Cycle 1
Cycle 2
EXPERIMENTINGLEARNING
Problem definition and contextualisation
Arriving at shared understanding, common goals
Conduct experiments, analyse trade-offs
ISA
Policy evaluation, mutual learning
A Cyclical ISA Process
8
• The scoping stage of the ISA-process involves a thorough definition of the persistent problem(s) in question. This requires an integrated systems analysis, where ‘thought-tools’ are used to perform a cross-cutting analysis of the problematique from multiple perspectives. A stakeholder analysis is used to explore the current- and potential- actor and stakeholder configurations. The extent to which a shared problem perception among stakeholders is already available or can be generated is explored.
• The envisioning stage involves the development of a vision of a sustainable future for
the system of interest. This requires a transformation of the unsustainability problem into a sustainability challenge. The sustainability vision is not meant to be a blueprint with a high predictive value, but rather as an evolutionary vision with evolving long-term targets, and multiple pathways (scenarios, including policy options) onto these sustainability targets.
• The experimenting stage uses ISA-tools and methods to test the sustainability visions
and policy proposals in terms of consistency, adequacy, robustness and feasibility. In particular, transition pathways (scenarios) from drivers to sustainability goals are tested. The sustainability impact of policy proposals is tested.
• In the learning, evaluating and monitoring stage, learning experiences and lessons
during the ISA-process are made explicit. Learning forms the basis and input for the next ISA-cycle, eventually leading to a possible reframing of the shared problem perception, an adjustment of the sustainability vision and related pathways, and reformulation of the experiments to be conducted. Monitoring the different stages of the ISA-process is important generally, but especially for the reframing process in terms of how the perception of stakeholders might have changed and to which extent the visions, pathways and experiments are adjusted.
An adequate and robust ISA involves one iteration at least of these four stages, and, preferably, further iterations. On the basis of the evaluation in stage 4 and the results of the other stages, a further round of stakeholder involvement in each stage could include new stakeholders, while others may be left out of the ISA-process. It could also lead to adjusted or new sustainability visions, pathways, ISA-tools, methods, assumptions and policy proposals. Finally, the mode of stakeholder engagement might change. As well as on the strength and completeness of integration of the process, the ultimate quality (robustness) of an ISA depends on the consistency and coherence of the assessment process itself, on the quality of the analytical rigor in terms of the ISA-methods used, and the consistency and transparency of the process with its underlying principles. Against this backdrop, we can identify at least two roles for sustainability assessment in support of policy making, which require different design criteria to be used in order that assessments designed for each role are ‘fit for purpose’. One role concerns ensuring adherence to the policy frame of reference at all levels within the policy hierarchy, which includes adherence to the reference conceptualisation of sustainable development. The other role is concerned with establishing one or another of the possible conceptualisations of sustainable development as the preferred policy frame of reference. The analysis of persistent problems in full consciousness that solutions will require regime/paradigm change calls for an approach to sustainability assessment that we have termed ISA. Unlike (S)IA, ISA requires

9
modulation between scales and levels within a single sustainability assessment process and is therefore different in design from (S)IA. (S)IA is a nested set of assessment processes whose coherence is assured by having a single overarching policy frame as common reference, which is developed at the highest policy levels and cascaded to lower levels. The concern of (S)IA is to ensure consistency and coherence of initiatives with the policy frame. Ideally, the same (S)IA design guidelines are therefore used consistently at all levels of policy making. By contrast, ISA is an assessment process that seeks to address persistent problems that cannot be solved within the prevailing policy paradigm. ISA seeks simultaneously to define acceptable solutions to persistent problems and the paradigmatic conditions within which these could be implemented feasibly. ISA is therefore a longer-term, explorative and strategic process that is concerned with challenging prevailing paradigms and making possible the implementation of better alternatives. ISA is concerned with the process of transition and with how phenomena such as path-dependence, lock-in, and power might be analysed and addressed. It must be concerned with the behaviours of actors and institutions, their capacities for social learning and the possibilities for transformation, empowerment and regime change. This involves modulation between levels and scales within the same ISA process. These key differences between (S)IA and ISA and their implications for appropriate design criteria for the two different forms of assessment are summarised in Table 1. Table 1 Comparison of integrated sustainability assessment and (sustainability)
or (regulatory) impact assessment
ISA (S or R) IA Goal searching, exploring Goal led – goals set by prevailing paradigm Locates the domain in the wider system Takes domain stand alone Relationship focused Impact focused Impacts unknown Impacts known Paradigm: restructuring Paradigm: incrementalist Scope: broader (sustainability ) Scope: smaller Object: holistic Object partial Cyclical (spiral), reflective One time Stakeholders: niche Stakeholders: regime Multi-level Single level Power: innovative (empowering) Power: structural (reinforcing) Constraint challenging Constraint ignoring Goal searching, exploring Goal set by prevailing paradigm Against this backdrop, we can consider the role and purpose of sustainability assessment in the policy process, both as assessment is used now and as assessment might be developed and used in the future. In principle, (S)IA as it is now practiced is intended to serve as an ex ante impact analysis of prospective policies to ensure that these are consistent with the policy regime and its priorities. The key problem for (S)IA in everyday practice within the EU, however, is that sustainable development has been one of several overarching policy objectives (alongside competitiveness and governance), which operate on different time horizons and have different levels of influence in different areas of policy making. Hence, policy making at the sectoral level – even though this is now required to be tested ex ante for its compatibility with sustainability through the (S)IA procedures – may be tested against different and entirely

10
incompatible references for sustainability, involving different kinds of objectives, different approaches to the inevitability or otherwise of trade-offs and different decision rules concerning how trade-offs are to be made. Inconsistent application of the (S)IA guidelines follows from not having a single hegemonic policy paradigm that represents a common understanding of what sustainable development is and how important it is vis-à-vis other possible and conflicting policy references. Furthermore there is no universal acceptance of any single conceptualisation of the economy-ecology-society link within the Commission. To the contrary, there are several different conceptualisations. We consider four variants here for illustrative purposes in relation to how different objectives are conceptualised and handled:
i) Economic Growth/Competitiveness: acknowledges economic, social and environmental objectives, regards these as incompatible and asserts the precedence of economic objectives while recognising the need to mitigate unwanted social and environmental impacts (objectives separate, unequally weighted, economic objectives dominate).
ii) Balanced Growth: acknowledges economic, social and environmental objectives, regards these as incompatible and seeks to ‘balance’ these on an ‘overall net benefit’ principle (objectives separate, equally weighted).
iii) Environmentally- and Socially-Compatible Growth: develops integrated objectives (such as eco-efficiency, livelihood security) that reflect interdependencies between subsystems, seeks synergistic initiatives and rules out any that imply significant losses on any dimension if this is considered to be critical for sustainable development (objectives integrated, variably weighted with safeguards).
iv) Stewardship and Sharing: Accepts that the scale and structure of economic activity may need to respect systemic constraints and that the objective of economic growth may need to be refined to allow for sufficiency solutions alongside efficiency solutions (objectives integrated, variably weighted, social and environmental objectives may override economic objectives).
The lack of a single policy paradigm within the EU structure transgresses a basic principle of ‘tiering’, which requires that in a multi-level governance structure, policy making at a higher level should provide a consistent reference framework for policy making at lower levels. There are three implications of the tiering principle. First, in order to deliver on the intent of using (S)IA to support consistency and coherence in the policy process, there needs to be a single, consistent policy frame to provide the reference for assessment. Secondly, there is need to apply (S)IA at all levels in the policy hierarchy. Thirdly, assessment should start at the highest strategic level, not at the policy level. Thus, there is a need for a full (complete) and consistent set of (S)IAs, each dealing with one level of the policy hierarchy from strategic to sectoral. There is no particular need for each individual (S)IA to be multi-scalar. However, this does not mean that single-level (S)IAs do not need to be linked in some way. The key linkage is that the higher-level (S)IAs establish reference frames for lower level (S)IAs. Especially, this suggests the need for any systemic constraints and overarching objectives to be established at the highest, strategic levels of policy making and cascaded down the (S)IA hierarchy for use at lower levels. Some feedback from lower levels to higher is also needed in order to inform higher level policy making about barriers and constraints encountered at lower levels whose removal would require actions at higher levels and for providing information about systemic links that are revealed through cross-sectoral scrutiny of initiatives.

11
The existing (S)IA guidelines used within the Commission could provide for this to happen if they were carried out according to the textbook and took place within a clear policy paradigm. Indeed, they constitute a near ‘state-of-the-art’ representation of sustainability assessment knowledge and understanding, combining lessons learned from experience with earlier forms of assessment (EIA, SEA, etc.) with normative principles, such as the Bellagio Principles. The fundamental issue, however, is that there is no single, overarching policy frame of reference for sustainable development within the Commission. There is confusion between the different interpretations of the links between the economic, environmental and societal subsystems. At least three of the four conceptualisations of sustainable development presented above – (i), (ii) and (iii) – are reflected to some degree within the EU in overarching policy objectives and high-level statements which, as a result, necessarily conflict. This conflict serves to confuse (S)IA at the sectoral policy-levels where it is now applied. Thus, (S)IA cannot currently be effective, since it is not embedded within a single, consistent, referential policy paradigm.2 The question over which conceptualisation of development or sustainable development will lead to better outcomes is of crucial importance. ISA is a potentially useful tool for the future development of the newly revised EU SDS and any supporting Thematic Strategies or Framework Directives, since it could be used to help clarify which problems would be amenable to solution within which interpretations and policy paradigms of sustainable development. Furthermore, the question of exploring potentially better policy paradigms has wider implications, since there is a need not only for consistency within the policy process, but also for consistency between the policy process and market-mediated decision making. Thus, as conceptualised here, ISA is of potential value in exploring major policy shifts, such as tax and subsidy reform, full cost pricing, pollution and resource ceilings, individual tradable pollution permits or resource quotas, new forms of employment, training and contracts, new patterns of time and space use, etc. and for exploring how sustainable development is relevant to the overwhelming will amongst EU citizens to have a better quality of life and wellbeing.
Concluding remarks To design an economic transition we need to: re-think our goals for economic development, specify them with greater precision and look for links among them; re-introduce environmental and resource constraints as framing conditions for economic management paying attention to the interdependence of these; stimulate innovation that reduces the constraining effects of biophysical limits; re-emphasise the need for social justice so that the burden of living in a resource constrained world doesn’t impact most on those least able to adapt to the changes; and re-structure the market using instruments that provide incentives to meet multiple development goals simultaneously. An important framing consideration is that the opportunities for resource substitution at the scale of the economy as a whole may be less than is acknowledged typically owing to interdependence among resource constraints. This implies that sufficiency will be needed alongside efficiency and that informal economic activities may have a more important role in the future than they have now. The central issue, 2 The existing EU guidelines make provision for (S)IA to be applied at all levels. At present, however, empirical evidence (WP2) suggests that (S)IA is mostly practiced at the sectoral and operational levels of policy making, and that applications of (S)IA at higher levels, such as at the level of the Thematic Strategies or Framework Directives, cannot be as thorough as would be needed given the influence that policies developed at these levels have upon lower levels of policy making and that this failing arises in part because assessment at these levels is also compromised by the lack of a consistent policy frame of reference.

12
however, is that for progress to be made there needs to be political will and socially robust visions of where we are headed and of paths that will take us there. The two go hand-in-hand, since political decision makers cannot act in the absence of supportive constituencies and the cooperation of those with agency in delivering solutions.
References Devuyst, D. (1999) Sustainability Assessment: the Application of a Methodological
Framework. In Proceedings of the 19th Annual Meeting of the International Association for Impact Assessment. Glasgow, 15-20 June 1999.
Gibson, R. B., Hassan, S., Holtz, S., Tansey, J. and Whitelaw, G. (2005) Sustainability
Assessment: Criteria, Processes and Applications, pp254, Earthscan Gibson, R (2006) Sustainability assessment. Impact Assessment and Project Appraisal Vol.
24, number 3, September 2006, pp170-182 Turnpenny J., Weaver P. M., Rotmans J., Haxeltine A. and Jordan A. (2006 - in press)
Methods and Tools for Integrated Sustainability Assessment, Chapter 9, In: George C. and Kirkpatrick C. (Eds.) Impact Assessment for a New Europe and Beyond, Edward Elgar Publishing: Cheltenham, UK
Varey, W. (2004), Integrated Approaches to Sustainability Assessment: An Alignment of
Ends and Means. Available at: www.emrgnc.com.au Weaver P.M. and Rotmans J. Integrated Sustainability Assessment: What? Why? How? (2007
- in press) International Journal of Innovation and Sustainable Development