Australian Trachoma Surveillance Report 2015 · Web viewAustralian Trachoma Surveillance Report...
111
Australian Trachoma Surveillance Report 2015 The Kirby Institute, UNSW Australia June 2016 Prepared by the National Trachoma Surveillance and Reporting Unit The Kirby Institute, UNSW Australia On behalf of Australian organisations involved in trachoma control activities, under a funding agreement with the Australian Commonwealth Government. 1
Transcript of Australian Trachoma Surveillance Report 2015 · Web viewAustralian Trachoma Surveillance Report...
Australian Trachoma Surveillance Report 2015
The Kirby Institute, UNSW AustraliaJune 2016
Prepared by the National Trachoma Surveillance and Reporting Unit
The Kirby Institute, UNSW Australia
On behalf of Australian organisations involved in trachoma control activities, under a funding agreement with the Australian Commonwealth Government.
1
Preface
Welcome to the tenth Annual Surveillance Report on trachoma control in Australia. Like its predecessors, this report has been compiled to document the activities and progress of health departments and other organisations working towards the elimination of blinding trachoma in Australia. Information in the report has been obtained under procedures developed and overseen by a national reference group that brings together a range of stakeholders, including program managers and technical experts. With four years remaining before the 2020 target date set by the World Health Organization (WHO) for global elimination of trachoma, Australia has made excellent progress in many communities that previously had endemic trachoma; however there remain areas of ongoing infection, demonstrating the need for sustained efforts. Sydney was the location for the WHO’s annual Summit for the Global Elimination of Trachoma by 2020 (GET2020) in April 2016. The Summit provided an opportunity for Australian stakeholders to learn from trachoma program leaders internationally and focus Australia’s attention on what Australia needs to do to eliminate trachoma by 2020.
2
ContentsAustralian Trachoma Surveillance Report 2015.....................................................................................1
Preface.......................................................................................................................................2
List of Figures.............................................................................................................................3
List of Tables...............................................................................................................................5
Acknowledgments......................................................................................................................7
Technical terms and definitions..................................................................................................9
Abbreviations...........................................................................................................................10
Executive summary...................................................................................................................11
Background..............................................................................................................................14
Methodology............................................................................................................................15
National results 2015................................................................................................................20
Figure 1.8 Proportion of communities with zero prevalence of trachoma by jurisdiction, 2007-2015.............................................................................................................................................24
Figure 1.9 Proportion of communities with endemic (>5%) levels of trachoma by jurisdiction, 2007-2015....................................................................................................................................25
Northern Territory results.........................................................................................................33
South Australia results..........................................................................................................49
Figure 3.7 Number of at-risk communities according to level of trachoma prevalence in 5-9-year-old children by region, South Australia 2015.......................................................................54
Table 3.1 Trachoma control delivery by region, South Australia 2015........................................56
Western Australia results..............................................................................................................63
New South Wales Results.........................................................................................................78
Discussion..............................................................................................................................82
Reference List...........................................................................................................................85
Appendix 1………………………………………………………………………………………………………………………………Appendix 2……………………………………………………………………………………………………………………………Apendix 3……………………………………………………………………………………………………………………………….
3

List of FiguresFigure 1.1 Trachoma prevalence in children aged 5-9 years in at-risk communities by region, Australia 2015Figure 1.2 Number of at-risk communities by jurisdiction, Australia 2007 – 2015Figure 1.3 Number of at-risk communities according to trachoma control strategy implemented by jurisdiction, Australia 2015Figure 1.4 Population screening coverage in children aged 5-9 years in communities that were screened for trachoma by jurisdiction, Australia 2015Figure 1.5 Proportion of screened children aged 5-9 years who had a clean face by jurisdiction, Australia 2007-2015Figure 1.6a Active trachoma prevalence among screened children aged 5-9 years by jurisdiction, Australia 2007-2015Figure 1.6b Active trachoma prevalence among children aged 5-9 years by jurisdiction, Australia 2007-2015Figure 1.7 Number of at-risk communities according to level of trachoma prevalence in children aged 5-9 years by jurisdiction, Australia 2015Figure 1.8 Proportion of communities with zero prevalence of trachoma by jurisdiction, 2007-2015Figure 1.9 Proportion of communities with endemic (>5%) levels of trachoma by jurisdiction, 2007-2015Figure 1.10 Number of communities according to number of years of trachoma prevalence under 5% by jurisdiction, Australia 2015Figure 1.11 Number of doses of azithromycin administered for the treatment of trachoma by jurisdiction, Australia 2007-2015Figure 2.1 Number of at-risk communities screened, treated or both for trachoma and trachoma prevalence in children aged 5-9 years, Northern Territory 2015Figure 2.2 Number of communities at risk by region, Northern Territory 2007-2015Figure 2.3 Number of at-risk communities according to trachoma control strategy implemented by region, Northern Territory 2015Figure 2.4 Population screening coverage of children aged 5-9 years in communities that required screening for trachoma by region, Northern Territory 2015Figure 2.5 Proportion of screened children aged 5-9 years who had a clean face by region, Northern Territory 2007-2015Figure 2.6a Trachoma prevalence among children aged 5-9 years in communities that were screened by region, Northern Territory 2007-2015Figure 2.6b Trachoma prevalence among children aged 5-9 years in all at-risk communities by region, Northern Territory 2007-2015Figure 2.7 Number of at-risk communities according to level of trachoma prevalence in children aged 5-9 years by region, Northern Territory 2015Figure 2.8 Communities according to number of years of trachoma prevalence under 5% by region, Northern Territory 2015Figure 2.9 Number of doses of azithromycin administered for the treatment of trachoma by region, Northern Territory 2007-2015
4
Figure 3.1 Number of at-risk communities, screened, treated or both for trachoma and trachoma prevalence in children aged 5-9 years, South Australia 2015Figure 3.2 Number of communities at risk by region, South Australia 2007-2015Figure 3.3 Number of at-risk communities according to trachoma control strategy implemented by region, South Australia 2015Figure 3.4 Population screening coverage of children aged 5-9 years in at-risk communities that required screening for trachoma by region, South Australia 2015Figure 3.5 Proportion of screened children aged 5-9 years who had a clean face by region, South Australia 2007-2015Figure 3.6 Trachoma prevalence among children aged 5-9 years in at-risk communities by region, South Australia 2007-2015Figure 3.7 Number of at-risk communities according to level of trachoma prevalence in children aged 5-9 years by region, South Australia 2015Figure 3.8 At-risk communities according to number of years of trachoma prevalence under 5% by region, South Australia 2015Figure 3.9 Number of doses of azithromycin administered for the treatment of trachoma by region, South Australia 2007-2015Figure 4.1 Number of at-risk communities screened, treated or both for trachoma and trachoma prevalence in children aged 5-9 years, Western Australia 2015Figure 4.2 Number of communities at risk by region, Western Australia 2007-2015Figure 4.3 Number of at-risk communities according to trachoma control strategy implemented by region, Western Australia 2015Figure 4.4 Population screening coverage in children aged 5-9 years in communities that required screening for trachoma by region, Western Australia 2015Figure 4.5 Proportion of screened children aged 5-9 years who had a clean face by region, Western Australia 2007-2015Figure 4.6a Trachoma prevalence among children aged 5-9 years in communities that were screened by region, Western Australia 2007-2015Figure 4.6b Trachoma prevalence among children aged 5-9 years in all at-risk communities by region, Western Australia 2007-2015Figure 4.7 Number of at-risk communities according to level of trachoma prevalence in children aged 5-9 years by region, Western Australia 2015Figure 4.8 At-risk communities according to number of years of trachoma prevalence under 5% by region, Western Australia 2015Figure 4.9 Number of doses of azithromycin administered for the treatment of trachoma by region, Western Australia 2007-2015Figure 5.1 Number of at-risk communities screened, treated or both for trachoma and trachoma prevalence in children aged 5-9 years, New South Wales 2015
List of TablesTable 1.1 Trachoma control delivery, Australia 2015Table 1.2 Trachoma screening coverage, trachoma prevalence and clean face prevalence, Australia 2015
5
Table 1.3 Number and proportion of at-risk communities according to level of trachoma prevalence in children aged 5-9 years, Australia 2007-2015Table 1.4 Treatment strategies by jurisdiction, Australia 2015Table 1.5 Trachoma treatment coverage, Australia 2015Table 1.6 Trichiasis screening coverage, prevalence and treatment among Aboriginal adults, Australia 2015Table 2.1 Trachoma control delivery by region, Northern Territory 2015Table 2.2 Trachoma screening coverage, trachoma prevalence and clean face prevalence by region, Northern Territory 2015Table 2.3 Number and proportion of at-risk communities according to level of trachoma prevalence in children aged 5-9 years, Northern Territory 2007-2015Table 2.4 Treatment strategies by region, Northern Territory 2015Table 2.5 Trachoma treatment coverage by region, Northern Territory 2015Table 2.6 Trichiasis screening coverage, prevalence and treatment among Aboriginal adults by region, Northern Territory 2015Table 2.7 Health promotion activities by region, Northern Territory 2015Table 3.1 Trachoma control delivery by region, South Australia 2015Table 3.2 Trachoma screening coverage, trachoma prevalence and clean face prevalence by region, South Australia 2015Table 3.3 Number and proportion of at-risk communities according to level of trachoma prevalence in children aged 5-9 years, South Australia 2007-2015Table 3.4 Treatment strategies by region, South Australia 2015Table 3.5 Trachoma treatment coverage by region, South Australia 2015Table 3.6 Trichiasis screening coverage, prevalence and treatment among Aboriginal adults by region, South Australia 2015Table 3.7 Health promotion activities by region, South Australia 2015Table 4.1 Trachoma control delivery by region, Western Australia 2015Table 4.2 Trachoma screening coverage, trachoma prevalence and clean face prevalence by region, Western Australia 2015Table 4.3 Number and proportion of at-risk communities according to level of trachoma prevalence in children aged 5-9 years, Western Australia 2007-2015Table 4.4 Treatment strategies by region, Western Australia 2015Table 4.5 Trachoma treatment coverage by region, Western Australia 2015Table 4.6 Trichiasis screening coverage, prevalence and treatment among Aboriginal adults by region, Western Australia 2015Table 4.7 Health promotion activities by region, Western Australia 2015Table 5.1 Trachoma screening coverage, trachoma prevalence and clean face prevalence in children aged 5-9 years, New South Wales 2015Table 5.2 Number and proportion of at-risk communities according to level of trachoma prevalence in children aged 5-9 years, New South Wales 2013-2015
6
Acknowledgments
The National Trachoma Surveillance and Control Reference Group Ms Meredeth Taylor (Chair), Programme, Services and Access Support Branch, Indigenous
Health Division, Department of Health Ms Rhonda Stilling, Targeted Access Section, Indigenous Health Division, Department of
Health Mr Daniel Suggit, National Aboriginal Community Controlled Health Organisation Dr David Johnson, Primary Health Medical Officer , Aboriginal Health Council of South
Australia Prof Hugh Taylor, Harold Mitchell Chair of Indigenous Eye Health, Melbourne School of
Population and Global Health, University of Melbourne Prof Donna Mak, Population and Preventive Health, University of Notre Dame, Fremantle Dr Vicki Krause, Centre for Disease Control, Northern Territory Department of Health Dr Stephen Lambert, Communicable Diseases Branch, Prevention Division, Queensland
Health Ms Sue Turcato, Population Health Unit, New South Wales Ministry of Health Ms Paula Wines, Centre for Disease Control, Northern Territory Department of Health Ms Lucy Angley, Aboriginal Health, Country Health SA Local Health Network, SA Health Dr Clare Huppatz, WA Country Health Service Mr Matthew Lester, Environmental Health Directorate WA; Working Group on Aboriginal
and Torres Strait Islander Environmental Health Representative Prof John Kaldor, Public Health Interventions Research Group, The Kirby Institute, UNSW
Australia Ms Carleigh Cowling, Aboriginal and Torres Strait Islander Health Program, The Kirby
Institute, UNSW Australia
National Trachoma Surveillance and Reporting Unit Prof John Kaldor, Public Health Interventions Research Group, The Kirby Institute, UNSW
Australia Dr Marlene Kong, Aboriginal and Torres Strait Islander Health Program, The Kirby Institute,
UNSW Australia Dr Bette Liu, School of Public Health and Community Medicine, UNSW Australia Dr Tom Snelling, Princess Margaret Hospital, Telethon Institute for Child Health Research,
UWA Centre for Child Health Research Ms Carleigh Cowling, Aboriginal and Torres Strait Islander Health Program, The Kirby
Institute, UNSW Australia
Jurisdictional contributors to trachoma data collectionNorthern Territory
• Aboriginal Community Controlled Health Services• Aboriginal Medical Services Alliance Northern Territory• Centre for Disease Control, Northern Territory Department of Health• Primary Health Care (Outreach/Remote), Northern Territory Department of Health
7
South Australia• Aboriginal Community Controlled Health Services• Aboriginal Health Council of South Australia• Country Health SA Local Health Network, SA Health
Western Australia WA State Trachoma Reference Group Aboriginal Community Controlled Health Services Communicable Disease Control Directorate, Department of Health, Western Australia Goldfields Population Health Unit Kimberley Population Health Unit Midwest Population Health Unit Pilbara Population Health Unit
New South Wales• Population Health Unit, Western NSW Local Health District
8
Technical terms and definitionsDefinitions are based on the Communicable Diseases Network Australia’s 2014 CDNA Guidelines for the public health management of trachoma in Australia.1 Active trachoma: The presence of chronic inflammation of the conjunctiva caused by infection with Chlamydia trachomatis; includes World Health Organization simplified grading: trachomatous inflammation - follicular (TF) and trachomatous inflammation - intense (TI).At-risk communities: Communities classified by jurisdictions as being at higher risk of trachoma based on 1) no recent data, but historical evidence of endemicity; 2) data of active trachoma prevalence ≥ 5% in children aged 5-9 years in the last 5 years; or 3) data < 5% active trachoma prevalence but with a recorded prevalence of active trachoma ≥ 5% in the past 5 years.Clean face: Absence of nasal and ocular discharge on the face.Community-wide treatment: The antibiotic treatment of all people in the community who weigh > 3 kg living in houses with children under 15 years of age.Contacts: Anyone who is living and sleeping in the same house as a child with trachoma. If the child lives or sleeps in multiple households, then all members of each household are regarded as contacts.Endemic trachoma: Prevalence of active trachoma of 5% or more in children aged 1-9 years or a prevalence of trichiasis of at least 0.1% in the adult population. Hyperendemic trachoma: Prevalence of active trachoma of 20% or more in children aged 1-9 years.Prevalence of active trachoma: Proportion of people found in a screening program to have active trachoma.Screening coverage: Proportion of Aboriginal and Torres Strait Islander children aged 5-9 years in a community who were screened for trachoma at the time of community screening. Trachomatous inflammation - follicular (TF): Presence of five or more follicles in the central part of the upper tarsal conjunctiva, each at least 0.5 mm in diameter, as observed through a loupe. Trachomatous inflammation - intense (TI): Pronounced inflammatory thickening of the upper tarsal conjunctiva that obscures more than half of the normal deep tarsal vessels. Trachomatous trichiasis (TT): Evidence of the recent removal of in-turned eyelashes or at least one eyelash rubbing on the eyeball.Treatment coverage: Proportion of Aboriginal and Torres Strait Islander people in a community who weigh > 3 kg and live in a house with one or more children aged below 15 years and who were treated for trachoma during each episode of community-wide treatment.
9
AbbreviationsABS Australian Bureau of StatisticsAPY Anangu Pitjantjatjara YankunytjatjaraACCHS Aboriginal Community Controlled Health Service AHCSA Aboriginal Health Council of South Australia CDC Centre for Disease Control, NT Department of HealthCDNA Communicable Diseases Network Australia EH&CDSSP Eye Health and Chronic Disease Specialist Support ProgramMBS Medicare Benefits ScheduleNSW New South WalesNT Northern TerritoryNTSRU National Trachoma Surveillance and Reporting Unit PCR Polymerase Chain ReactionSA South AustraliaSAFE Surgery, Antibiotics, Facial cleanliness and EnvironmentTSCRG Trachoma Surveillance and Control Reference GroupWA Western AustraliaWACHS WA Country Health ServiceWHO World Health Organization
10
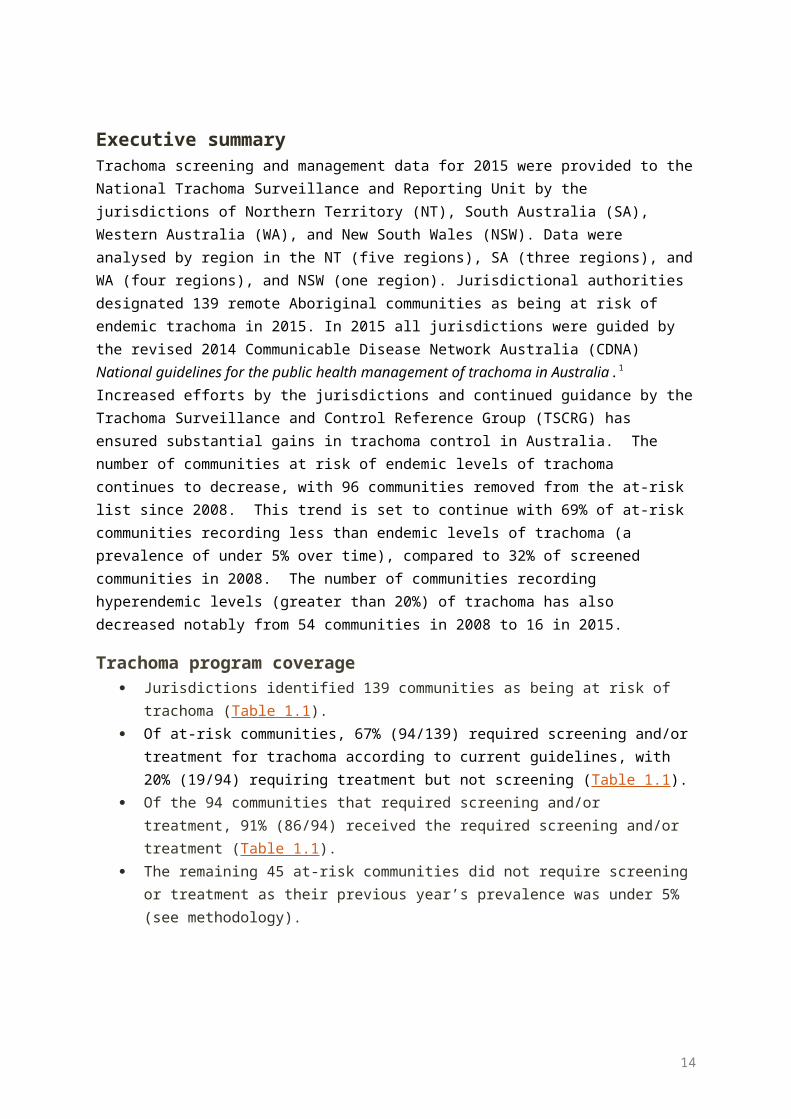
Executive summaryTrachoma screening and management data for 2015 were provided to the National Trachoma Surveillance and Reporting Unit by the jurisdictions of Northern Territory (NT), South Australia (SA), Western Australia (WA), and New South Wales (NSW). Data were analysed by region in the NT (five regions), SA (three regions), and WA (four regions), and NSW (one region). Jurisdictional authorities designated 139 remote Aboriginal communities as being at risk of endemic trachoma in 2015. In 2015 all jurisdictions were guided by the revised 2014 Communicable Disease Network Australia (CDNA) National guidelines for the public health management of trachoma in Australia.1 Increased efforts by the jurisdictions and continued guidance by the Trachoma Surveillance and Control Reference Group (TSCRG) has ensured substantial gains in trachoma control in Australia. The number of communities at risk of endemic levels of trachoma continues to decrease, with 96 communities removed from the at-risk list since 2008. This trend is set to continue with 69% of at-risk communities recording less than endemic levels of trachoma (a prevalence of under 5% over time), compared to 32% of screened communities in 2008. The number of communities recording hyperendemic levels (greater than 20%) of trachoma has also decreased notably from 54 communities in 2008 to 16 in 2015.
Trachoma program coverage Jurisdictions identified 139 communities as being at risk of trachoma (Table 1.1). Of at-risk communities, 67% (94/139) required screening and/or treatment for trachoma
according to current guidelines, with 20% (19/94) requiring treatment but not screening (Table 1.1).
Of the 94 communities that required screening and/or treatment, 91% (86/94) received the required screening and/or treatment (Table 1.1).
The remaining 45 at-risk communities did not require screening or treatment as their previous year’s prevalence was under 5% (see methodology).
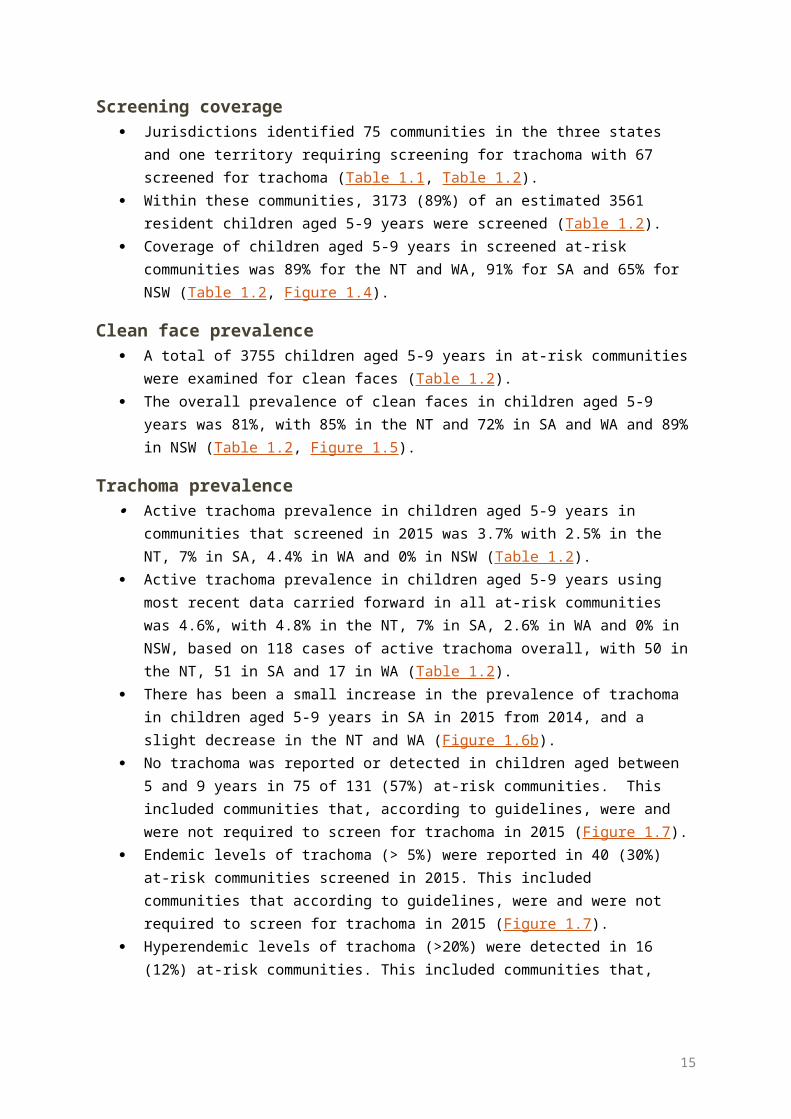
Screening coverage Jurisdictions identified 75 communities in the three states and one territory requiring
screening for trachoma with 67 screened for trachoma (Table 1.1, Table 1.2). Within these communities, 3173 (89%) of an estimated 3561 resident children aged 5-9
years were screened (Table 1.2). Coverage of children aged 5-9 years in screened at-risk communities was 89% for the NT and
WA, 91% for SA and 65% for NSW (Table 1.2, Figure 1.4).
Clean face prevalence A total of 3755 children aged 5-9 years in at-risk communities were examined for clean faces
(Table 1.2). The overall prevalence of clean faces in children aged 5-9 years was 81%, with 85% in the NT
and 72% in SA and WA and 89% in NSW (Table 1.2, Figure 1.5).
Trachoma prevalence Active trachoma prevalence in children aged 5-9 years in communities that screened in 2015
was 3.7% with 2.5% in the NT, 7% in SA, 4.4% in WA and 0% in NSW (Table 1.2).
11
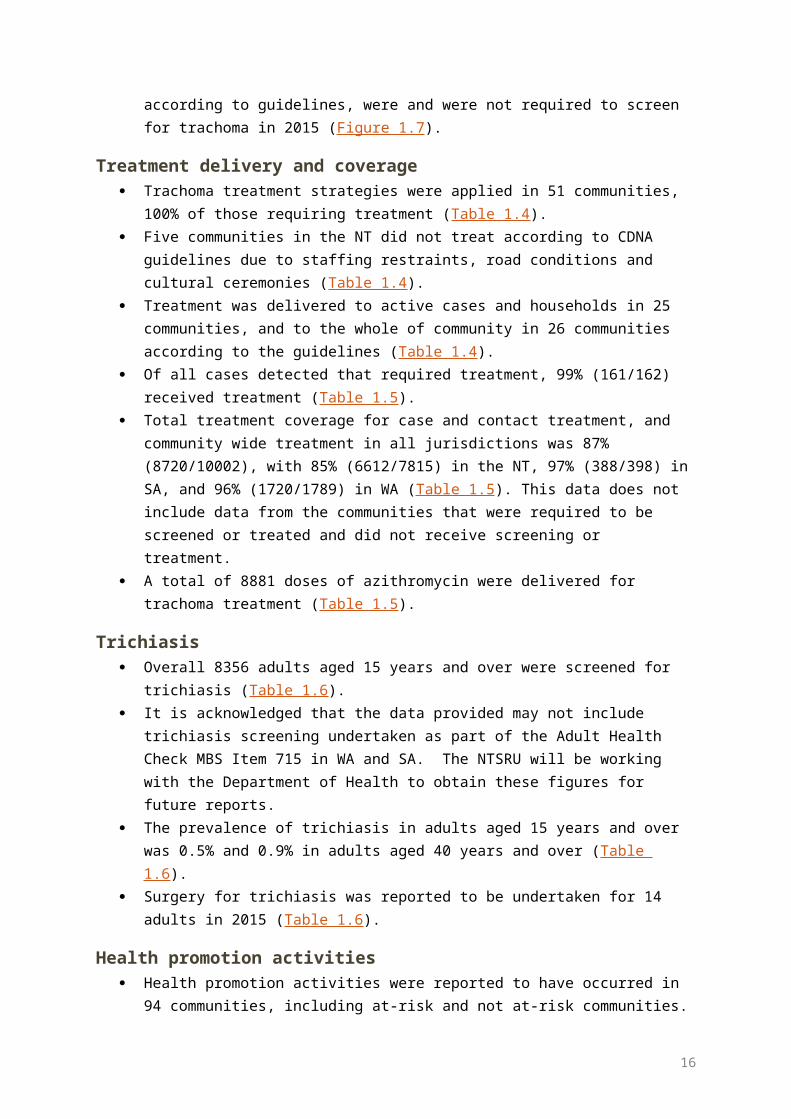
Active trachoma prevalence in children aged 5-9 years using most recent data carried forward in all at-risk communities was 4.6%, with 4.8% in the NT, 7% in SA, 2.6% in WA and 0% in NSW, based on 118 cases of active trachoma overall, with 50 in the NT, 51 in SA and 17 in WA (Table 1.2).
There has been a small increase in the prevalence of trachoma in children aged 5-9 years in SA in 2015 from 2014, and a slight decrease in the NT and WA (Figure 1.6b).
No trachoma was reported or detected in children aged between 5 and 9 years in 75 of 131 (57%) at-risk communities. This included communities that, according to guidelines, were and were not required to screen for trachoma in 2015 (Figure 1.7).
Endemic levels of trachoma (> 5%) were reported in 40 (30%) at-risk communities screened in 2015. This included communities that according to guidelines, were and were not required to screen for trachoma in 2015 (Figure 1.7).
Hyperendemic levels of trachoma (>20%) were detected in 16 (12%) at-risk communities. This included communities that, according to guidelines, were and were not required to screen for trachoma in 2015 (Figure 1.7).
Treatment delivery and coverage Trachoma treatment strategies were applied in 51 communities, 100% of those requiring
treatment (Table 1.4). Five communities in the NT did not treat according to CDNA guidelines due to staffing
restraints, road conditions and cultural ceremonies (Table 1.4). Treatment was delivered to active cases and households in 25 communities, and to the
whole of community in 26 communities according to the guidelines (Table 1.4). Of all cases detected that required treatment, 99% (161/162) received treatment (Table 1.5). Total treatment coverage for case and contact treatment, and community wide treatment in
all jurisdictions was 87% (8720/10002), with 85% (6612/7815) in the NT, 97% (388/398) in SA, and 96% (1720/1789) in WA (Table 1.5). This data does not include data from the communities that were required to be screened or treated and did not receive screening or treatment.
A total of 8881 doses of azithromycin were delivered for trachoma treatment (Table 1.5).
Trichiasis Overall 8356 adults aged 15 years and over were screened for trichiasis (Table 1.6). It is acknowledged that the data provided may not include trichiasis screening undertaken as
part of the Adult Health Check MBS Item 715 in WA and SA. The NTSRU will be working with the Department of Health to obtain these figures for future reports.
The prevalence of trichiasis in adults aged 15 years and over was 0.5% and 0.9% in adults aged 40 years and over (Table 1.6).
Surgery for trichiasis was reported to be undertaken for 14 adults in 2015 (Table 1.6).
Health promotion activities Health promotion activities were reported to have occurred in 94 communities, including at-
risk and not at-risk communities.
12
BackgroundTrachoma, an eye infection caused by the bacteria Chlamydia trachomatis serotypes A, B, Ba and C., continues to be the world’s leading cause of infectious, preventable blindness and the fifth leading cause of blindness. Endemic to more than 50 countries globally, it is estimated more than 21 million people are infected with active trachoma. Transmission of the disease occurs through close facial contact, hand-to-eye contact, via fomites (towels, clothing and bedding) or by flies. Trachoma generally occurs in dry, dusty environments and is linked to poor living conditions and personal hygiene behaviours. Overcrowding of households, limited water supply for bathing and general hygiene, poor waste disposal systems and high numbers of flies have all been associated with trachoma. Children commonly have the highest prevalence of trachoma and are believed to be the main reservoirs of infection, because the infection in children has a longer duration than in adults. 2,
3,4
Infection with the relevant C. trachomatis serotype causes inflammation of the conjunctiva. Diagnosis of trachoma is by visual inspection, and the detection of follicles (white spots) and papillae (red spots) on the inner upper eyelid. Repeated infections with C. trachomatis, especially during childhood, may lead to scarring with contraction and distortion of the eyelid, which may in turn cause the eyelashes to rub against the cornea; this condition is known as trichiasis which leads to gradual vision loss and blindness. 1,6,7 Scarring of the cornea due to trichiasis is irreversible. However, if early signs of in-turned eyelashes are found, then surgery is usually effective in preventing further damage to the cornea. The Alliance for the Global Elimination of Blinding Trachoma by 2020 (GET 2020) initiative, supported by the World Health Organization (WHO), advocates for the implementation of the SAFE strategy, with its key components of Surgery (to correct trichiasis), Antibiotic treatment, Facial cleanliness and Environmental improvements. This strategy is ideally implemented through a primary care model within a community framework, ensuring consistency and continuity in screening, control measures, data collection and reporting, as well as the building of community capacity. 8,9,10
WHO guidelines recommend that trachoma is treated by a single dose of the antibiotic azithromycin repeated on an annual basis according to trachoma prevalence. Best public health practice involves treatment of all members of the household in which a person with trachoma resides, whether or not they have evidence of trachoma. In endemic communities, it is recommended that treatment is also extended to all members of the community over 3 kg in weight who live in a household with a child under 15 years of age. 5,11
Trachoma control in AustraliaAustralia is the only high-income country where trachoma is still endemic. It occurs primarily in remote and very remote Aboriginal communities in the Northern Territory (NT), South Australia (SA) and Western Australia (WA). In 2008, cases were also found in New South Wales (NSW) and Queensland (Qld), states where trachoma was believed to have been eliminated. However, cases of trachomatous scarring are believed to be present in all jurisdictions and sub-jurisdictional regions of Australia. 5,12 In 2009, the Australian Government invested in the Closing the Gap - Improving Eye and Ear Health Services for Indigenous Australians measure which included committing $16 million over a four-year period towards eliminating trachoma in Australia. In 2013, the Australian Government committed a further $16.5 million to continue, improve and expand trachoma control
13
initiatives in jurisdictions with known endemic levels of trachoma. Funding was also provided to jurisdictions with a previous history of trachoma for screening activities to ascertain if control programs were also required. These funds were also committed to establishing a strong framework for monitoring and evaluation. 13 The surveillance and management of trachoma in 2015 in all jurisdictions was guided by the CDNA 2014 National guidelines for the public health management of trachoma in Australia.1 Compared to the 2006 Guidelines 14, one of the main changes was the option of not screening all endemic communities every year, enabling jurisdictions to use resources for antibiotic distribution and health promotion activities. The guidelines were developed in the context of the WHO SAFE strategy and make recommendations for improving data collection, collation and reporting systems in relation to trachoma control in Australia.
The National Trachoma Surveillance and Reporting Unit The National Trachoma Surveillance and Reporting Unit (NTSRU) is responsible for data collation, analysis and reporting related to the ongoing evaluation of trachoma control strategies in Australia. From late 2010, the NTSRU has been managed by The Kirby Institute, UNSW Australia.15-17For previous reports from 2006 to 2008, the NTSRU was managed by The Centre for Eye Research Australia18-20 and the 2009 report was managed by the Centre for Molecular, Environmental, Genetic and Analytic Epidemiology, the University of Melbourne.21 The NTSRU operates under contract with the Australian Government Department of Health.
MethodologyEach jurisdiction undertook screening and treatment for trachoma under the guidance of the 2014 CDNA National guidelines for the public health management of trachoma in Australia that recommend specific treatment strategies depending on the prevalence of trachoma detected through screening.1
In 2006, when the National Trachoma Management Program was initiated, each jurisdiction identified at-risk communities from historical prevalence data and other knowledge. Over time, additional communities have been reclassified as being at-risk or removed from the at-risk category. Screening for trachoma focuses on the at-risk communities, but a small number of other communities designated as not at risk have also been screened, generally if there is anecdotal information suggesting the presence of active trachoma, or close proximity or close family ties to endemic communities. The WHO trachoma grading criteria (Appendix 1) were used to diagnose and classify individual cases of trachoma in all jurisdictions. Data collection forms for data collection at the community level were developed by the NTSRU, based on the CDNA guidelines (Appendix 2). Completed forms were forwarded from the jurisdictional coordinators to the NTSRU for checking and analysis. Information provided to the NTSRU at the community level for each calendar year included:• Number of Aboriginal children aged 1-14 years screened for clean faces and the number
with clean faces, by age group• Number of Aboriginal children aged 1-14 years screened for trachoma and the number with
trachoma, by age group• Number of episodes of treatment for active trachoma, household contacts and other
community members, by age group
14
• Number of Aboriginal adults screened for trichiasis, number with trichiasis, and the number who had surgery for trichiasis
• Community-level implementation of health promotion activitiesThe focus group in all regions is Aboriginal children aged 5-9 years as required by jurisdictional Project Agreements. Data may also be collected and reported on the 1-4 and 10-14 year age groups, however due to low coverage in these age groups trachoma prevalence results may not be representative of the actual prevalence in regions.
Northern TerritoryFrom 2013 the NT followed the screening and treatment schedule recommended in the 2014 CDNA National guidelines for the public health management of trachoma in Australia. Trachoma screening and management in the NT was undertaken through collaboration between the Department of Health [Centre for Disease Control and Primary Health Care (Outreach/Remote)]; Department of Education (Remote Schools) and Aboriginal Community Controlled Health Services (ACCHS). Trachoma screening was often incorporated into the Healthy School-Age Kids program annual check and was conducted by the trachoma team and program partners supported by either local primary health-care centres or community controlled services. However a large proportion of screening is undertaken as a stand-alone exercise by the trachoma team and program partners. The NT uses school enrolment lists, electronic health records and local knowledge to best determine the number of children aged 5-9 years present in the community at the time of screening. Following screening, treatment was undertaken by the trachoma team and program partners with support from primary health-care services.In 2015, screening for trichiasis was undertaken primarily by clinic staff during adult health checks, or by optometrists or ophthalmologists from the Regional Eye Health Service based in Alice Springs, utilising a convenience sampling methodology.
South AustraliaIn South Australia, Country Health SA works collaboratively with Aboriginal Community Controlled Organisations, community health services and the Aboriginal Health Council of South Australia (AHCSA) to ensure that trachoma screening and treatment is undertaken in all at-risk communities. An interagency State Trachoma Reference Group provides guidance to the project. Country Health SA enters into contracts with services for the provision of both trachoma and trichiasis screening and treatment services. In 2014 and 2015 Anangu Pitjantjatjara Yankunytjatjara (APY) Lands aggregated all nine previously distinct communities into one single community for the purpose of trachoma surveillance because of the small populations of each community and kinship links resulting in frequent mobility between these communities. This definition alters trends presented in reports from 2013 to 2015. Additional trichiasis screening activities were undertaken by the Eye Health and Chronic Disease Specialist Support Program (EH&CDSSP), coordinated by the Aboriginal Health Council of South Australia. This program provides regular visits to SA remote Aboriginal communities by optometrists and ophthalmologists. Trichiasis screening was undertaken opportunistically for adults by the contracted trachoma screening service providers, the EH&CDSSP team and also routinely as part of the Adult Annual Health Checks. In 2015 there was extra focus on the promotion of the clean faces health message in the at-risk communities. With the support from the University of Melbourne Indigenous Eye Health Unit the Imparja television characters Yamba and Milpa undertook a successful Health Promotion road show visiting five schools on the APY Lands
15
emphasising the importance of clean faces. The Country Health SA Trachoma Control team engaged in ongoing conversations with stakeholders with regard to the delivery of healthy housing. It is believed that overcrowding and inadequate maintenance of hardware in housing remains a concern in some communities.
Western AustraliaTrachoma screening and management in WA is the responsibility of the WA Country Health Service (WACHS) Population Health Units in the Kimberley, Goldfields, Pilbara and Midwest health regions. An interagency State Trachoma Reference Group has been established to provide program oversight. The WA State Trachoma Reference Group has established a set of principles which guide the program and provide consistent practice across the four endemic regions.In collaboration with the local primary health care providers, the Population Health Units screened communities in each region within a two-week period, in August and September. People identified with active trachoma were treated at the time of screening. In 2015 each region determined the screening denominator based on the school register, which was updated by removing names of children known to be out of the community at the time of the screen and by adding names of children who were present in the community at the time of the screen.In WA, trichiasis screening was undertaken opportunistically in conjunction with adult influenza vaccinations. Screening of the target population also occurs with the Visiting Optometrist Scheme (VOS) in the Kimberley region. The Goldfields region also undertook additional trichiasis screening during the trachoma screening period, where in some communities, trichiasis screening is offered to all people over the age of 40 years. In addition, screening likely occurs as part of the adult health checks provided through the Medicare Benefits Scheme (MBS). The total volume of screening is not able to be determined at this time as the level of data is not available through the MBS information system. In 2011, 2014 and 2015, WA Health aggregated 10 previously distinct communities into one single community for the purpose of trachoma surveillance because of the small populations of each community and kinship links resulting in frequent mobility between these communities. This definition alters trends presented in reports from 2010-2015.
New South WalesIn 2014, NSW Health expanded the trachoma screening project to include a further nine potentially at-risk communities in north western and far western NSW. Repeat screening was also undertaken in the affected community that was identified in 2013. Screening was conducted by the Bathurst Population Health Unit with support from NSW Ministry of Health. No trichiasis screening was undertaken in NSW.
QueenslandIn 2012, Queensland Health was funded to undertake a baseline screening of remote communities to establish whether trachoma was a public health concern in Queensland. Findings from this exercise were reported in the 2012 annual report. In one community in the Torres Strait, follicles were observed in eight children. Polymerase Chain Reaction (PCR) swabs were taken from the eight children and household contacts. Results from the PCR test were all negative for C. trachomatis. Azithromycin was administered to the eight children and household contacts before the results of
16

the PCR test were available. Planning for future screening in this community and a limited number of neighbouring communities in the Torres Strait is underway.
Data analysisFor the purpose of this report, a community is defined as a specific location where people reside and where there is at least one school. Community coverage is defined as the number of at-risk communities screened for trachoma as a proportion of those that were identified as possibly having trachoma. Individual screening coverage is the proportion of children in the target age group in a region that were actually screened. In 2015, population data for trachoma screening coverage were provided by each jurisdiction by utilising population lists from schools, health clinics and local advice. The population for communities in years 2007 to 2011 was derived from projected data from the 2006 Australian census using Australian Bureau of Statistics (ABS) standard estimates of population increase (1.6%, 1.8% and 2.1% in the NT, WA and SA, respectively). Population estimates based on ABS census data do not account for population movements within communities, regions and jurisdictions. Therefore, since 2012, the population denominator has been estimated by the jurisdictions. Prevalence of active trachoma was calculated using the number of children screened as the denominator. Trachoma data were analysed in the age groups 1-4, 5-9 and 10-14 years. Comparisons over time were limited to the group aged 5-9 years, which is the target age group for the trachoma screening programs in all regions. Data from 2006 were excluded from assessment of time trends as collection methods in this first year differed from those subsequently adopted.
Calculations for trachoma prevalenceIn 2015 all jurisdictions undertook trachoma control activities according to the revised 2014 CDNA National guidelines for the public health management of trachoma in Australia.1 Under these guidelines not all at-risk communities were required to undertake screening for trachoma in 2015. For reporting purposes, the NTSRU has carried the most recent prevalence data forward in those communities that did not screen in the 2015 calendar year as a direct program decision, providing what is believed to be an over-estimate of the upper-bound on average levels of trachoma. This principle applies to all tables and figures relating to trachoma prevalence data except where otherwise specified as only including data from 2015. This method of projecting data was approved by the Trachoma Surveillance and Control Reference Group on 26 November 2013.
17
National results 2015Figure1.1 Trachoma prevalence in children aged 5-9 years in all at-risk communities by region, Australia 2015*
* Most recent estimates carried forward in communities that did not screen in 2015.
18
Figure1.2 Number of at-risk communities by jurisdiction, Australia 2007 – 2015
* In 2013 & 2014 NSW communities have been designated as “potentially at-risk” for the purposes of a mapping exercise†Since 2014 10 communities in WA and 9 in SA have been amalgamated into one community reporting purposes
Figure1.3 Number of at-risk communities according to trachoma control strategy implemented by jurisdiction, Australia 2015
19
Figure1.4 Population screening coverage in children aged 5-9 years in communities that were screened for trachoma by jurisdiction, Australia 2015
Figure1.5 Proportion of screened children aged 5-9 years who had a clean face by jurisdiction, Australia 2007-2015
20
Figure 1.6 a Active trachoma prevalence among screened children aged 5-9 years by jurisdiction, Australia 2007-2015
Figure 1.6 b Active trachoma prevalence among children aged 5-9 years by jurisdiction, Australia* 2007-2015
* Most recent estimates carried forward in communities that did not screen in 2015.
21
Figure 1.1 Number of at-risk communities* according to level of trachoma prevalence in children aged 5-9 years by jurisdiction, Australia 2015
* Including communities that screened in 2015 and those that were not required to screen in 2015, in accordance with guideline instructions.
22
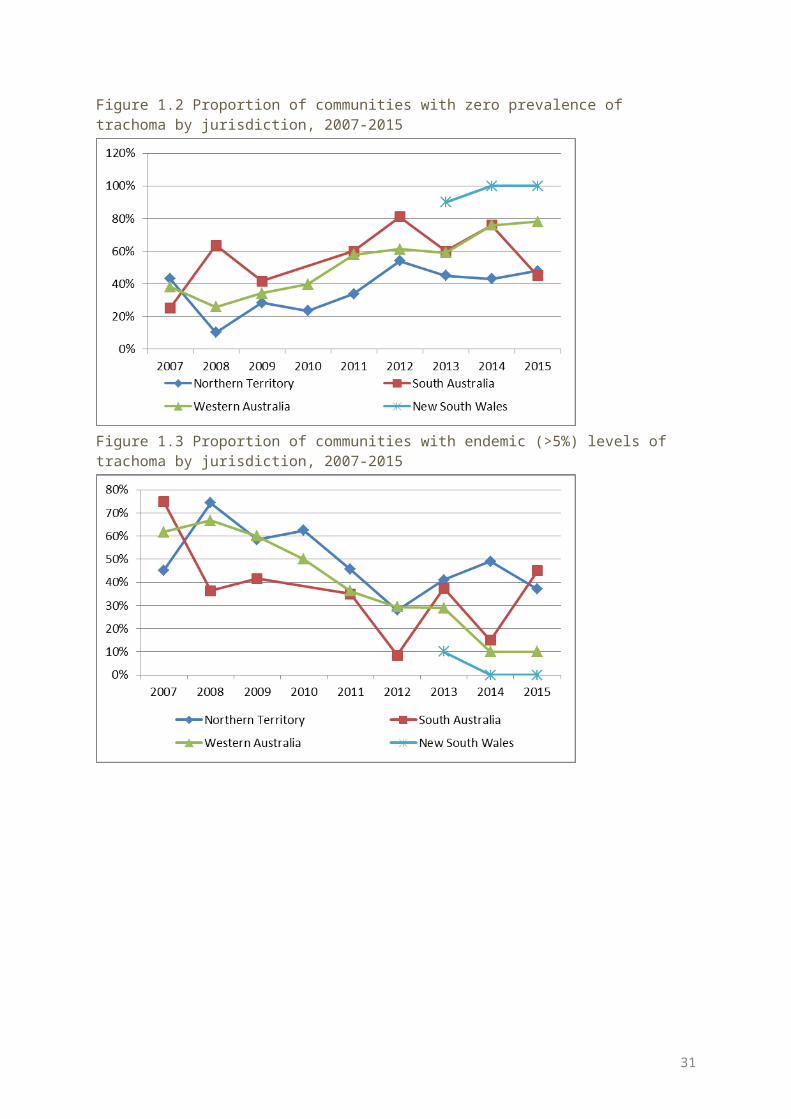
Figure 1.2 Proportion of communities with zero prevalence of trachoma by jurisdiction, 2007-2015
Figure 1.3 Proportion of communities with endemic (>5%) levels of trachoma by jurisdiction, 2007-2015
23
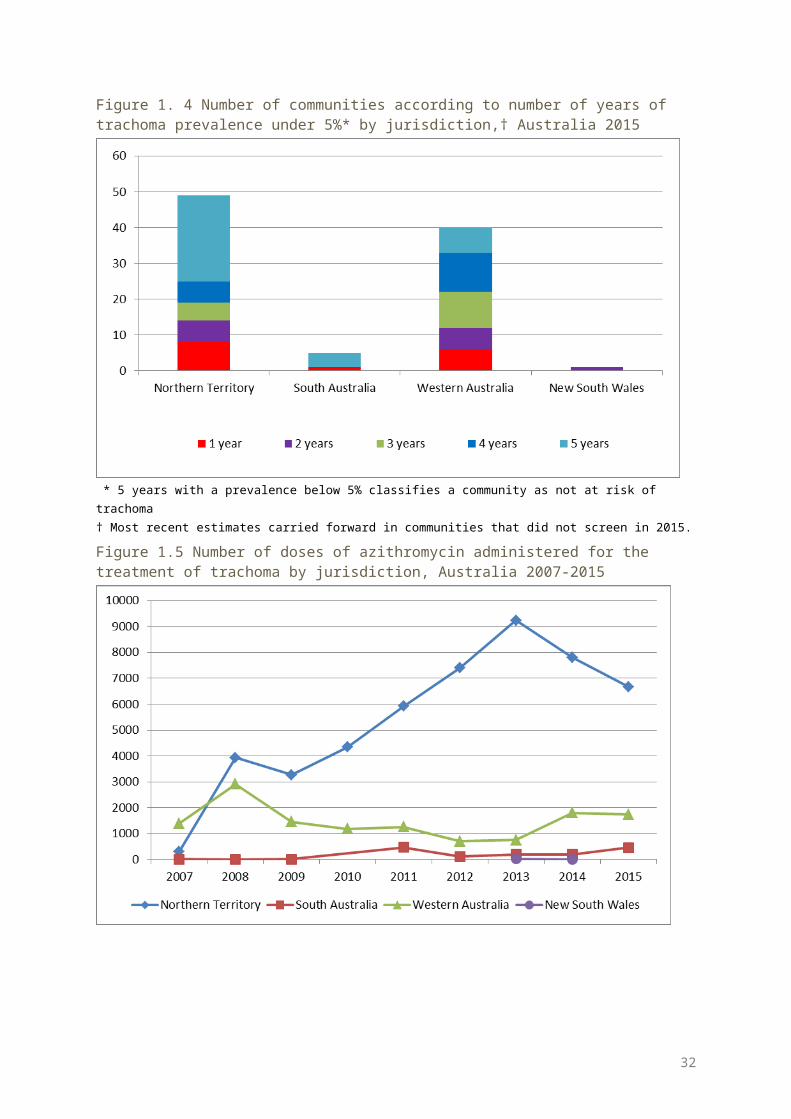
Figure 1. 4 Number of communities according to number of years of trachoma prevalence under 5%* by jurisdiction,† Australia 2015
* 5 years with a prevalence below 5% classifies a community as not at risk of trachoma† Most recent estimates carried forward in communities that did not screen in 2015.
Figure 1.5 Number of doses of azithromycin administered for the treatment of trachoma by jurisdiction, Australia 2007-2015
24
Table 1.1 Trachoma control delivery, Australia 2015
Number of communities Northern Territory South Australia Western
Australia NSW Total
At risk (A) 78 11 49 1 139
Requiring screening for trachoma (B) 48 11 15 1 75
Screened for trachoma (C) 40 11 15 1 67
Requiring treatment only (D) 16 0 3 0 19
Treated * (E) 16 0 3 0 19
Screened and/or treated for trachoma (F = C+E) 56 11 18 1 86
Requiring neither screening or treatment for trachoma (G=A-B-D)
14 0 31 0 45
* Communities treated without screening in 2015 as per revised guideline instructions
25
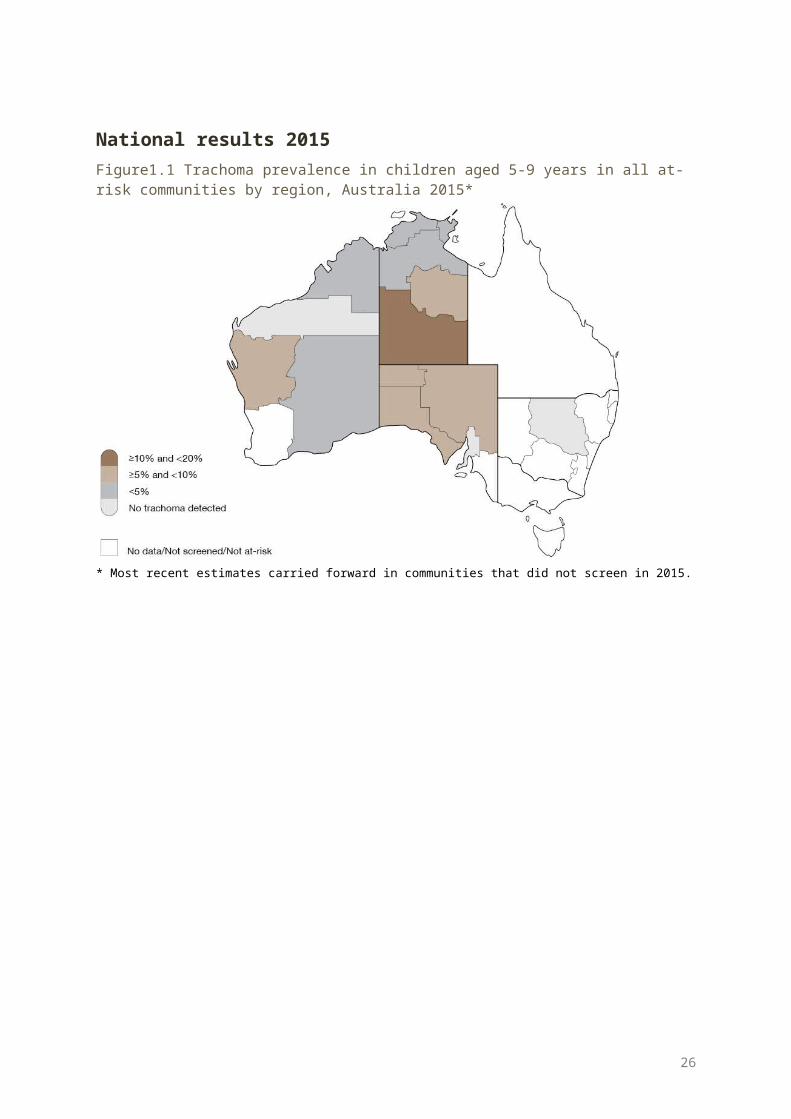
Table 1.2 Trachoma screening coverage, trachoma prevalence and clean face prevalence, Australia 2015
Northern Territory South Australia Western
Australia NSW Total
Number of communities screened 40 11 15 1 67
Age group (years) 5-9 5-9 5-9 5-9 5-9
Children examined for clean face 2612 729 387 27 3755
Children with clean face 2218 528 277 24 3047
Clean face prevalence (%) 85 72 72 89 81Estimated number* of Aboriginal children in communities† 2285 803 433 40 3561
Children screened for trachoma 2031 729 387 26 3173
Trachoma screening coverage (%) 89 91 89 65 89
Children with active trachoma 50 51 17 0 118
Active trachoma prevalence (%) 2.5 7.0 4.4 0.0 3.7
Active trachoma prevalence using mostrecent data carried forward (%)‡ 4.8 7.0 2.6 0.0 4.6
* Jurisdictional estimate† In communities that were screened for trachoma‡ Most recent data carried forward from 30 communities in the NT and 34 communities in WA
26
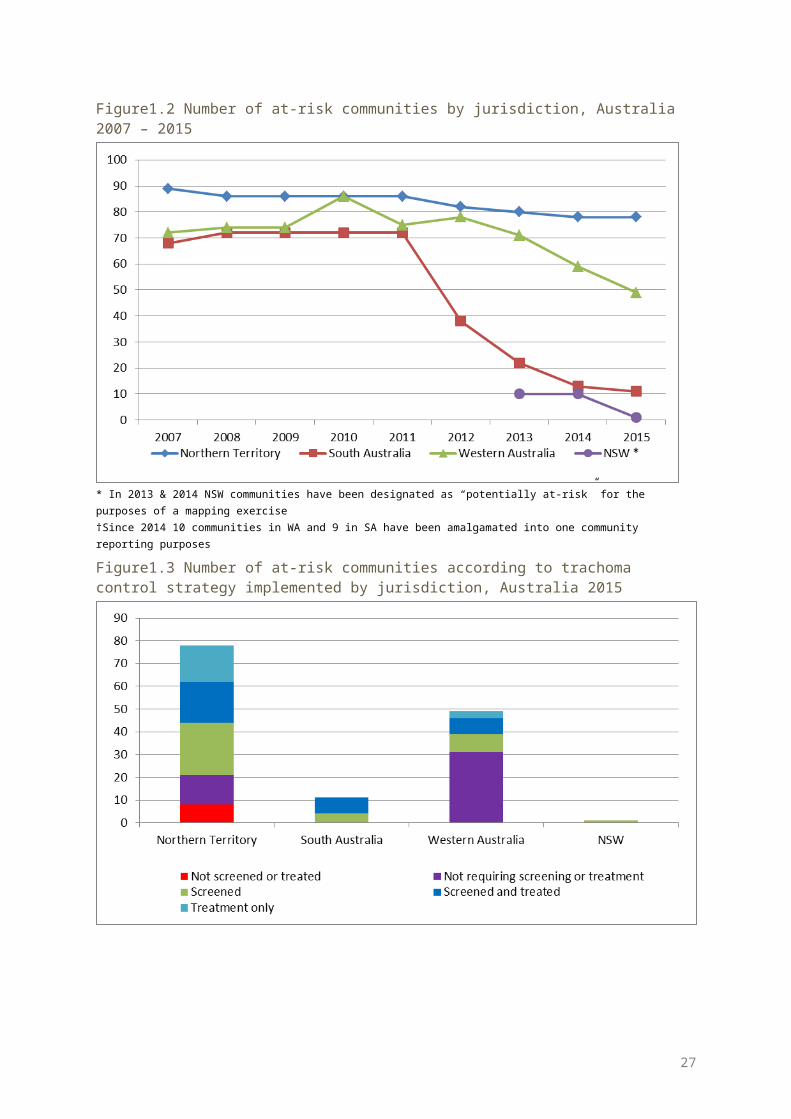
Table 1.3 Number and proportion * of at-risk communities according to level of trachoma prevalence in children aged 5-9 years, Australia 2007-2015
2007 2008 2009 2010 2011 2012 2013 2014|| 2015
Communities at-risk † 229 233 232 244 203 196 183 160 139
Communities not screened ‡ 102 107 116 89 53 9 20 0 8
Number of communities § 123 121 116 152 152 187 163 160 131
Number of communities No. % No. % No
. % No. % No. % No. % No
. % No. % No. %
Trachoma Prevalence ≥20% 32 26% 54 45% 26 22% 44 29% 21 14% 15 8% 14 9% 17 11% 16 12%
Trachoma Prevalence ≥10% but <20% 22 18% 14 12% 13 11% 23 15% 20 13% 13 7% 20 12% 19 12% 16 12%
Trachoma Prevalence ≥5% but <10% 11 9% 14 12% 12 10% 15 10% 20 13% 20 11% 21 13% 12 8% 8 6%
Trachoma Prevalence >0% but <5% 7 6% 12 10% 24 21% 16 11% 19 13% 24 13% 17 10% 13 8% 16 12%
Trachoma Prevalence = 0% 51 41% 27 22% 41 35% 54 36% 72 47% 11
5 61% 91 56% 99 62% 75 57%
* Based on current year or most recent year† As defined annually by each jurisdictions‡ Or treated as per guideline instructions§ Screened or receiving ongoing annual treatment|| Since 2014 10 communities in WA and 9 in SA have been amalgamated into one community reporting purposes
27
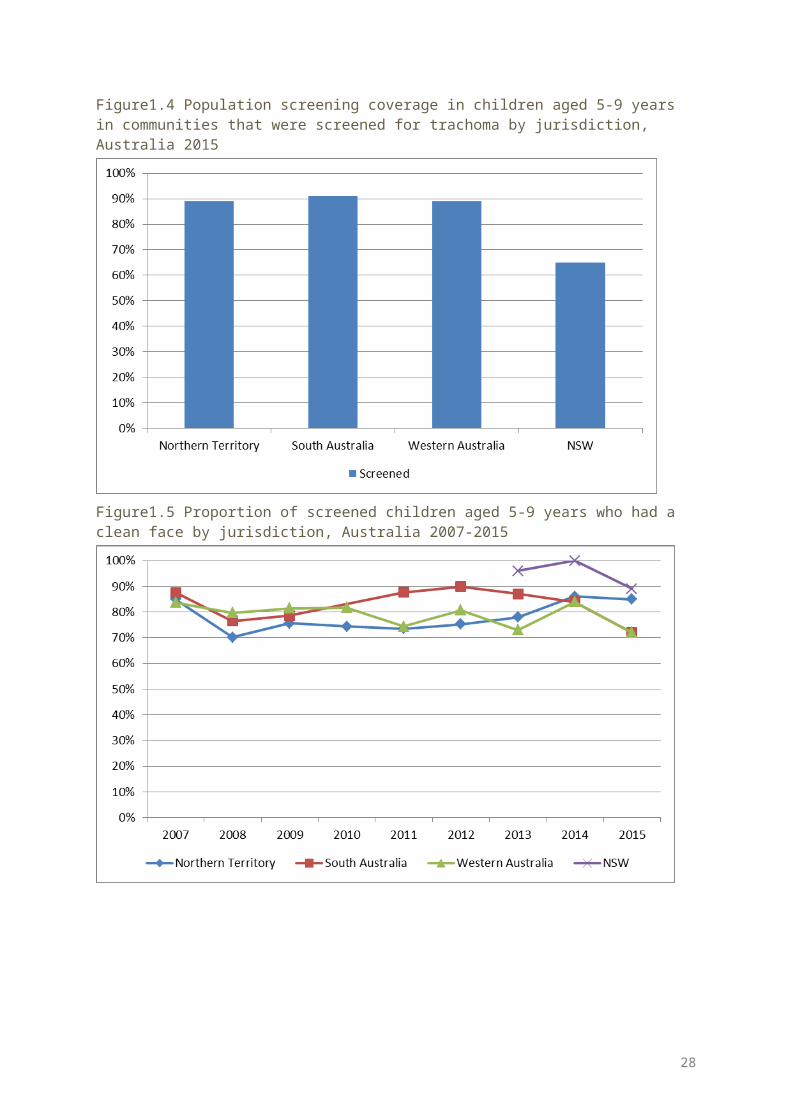
Table 1.4 Treatment strategies by jurisdiction, Australia 2015
Number of communities Northern Territory South Australia Western Australia Total
Required treatment for trachoma 34 7 10 51
Treated for trachoma 34 7 10 51
Screened and treated 18 7 7 32
Received treatment only 16 0 3 19
Received six-monthly treatment 4 0 1 5
Did not require treatment 41 4 31 76
Treated active cases and households 13 7 5 25
Treated the whole of community 21 0 5 26
Not treated according to CDNA guidelines 5 * 0 0 5
* Details in NT section
28
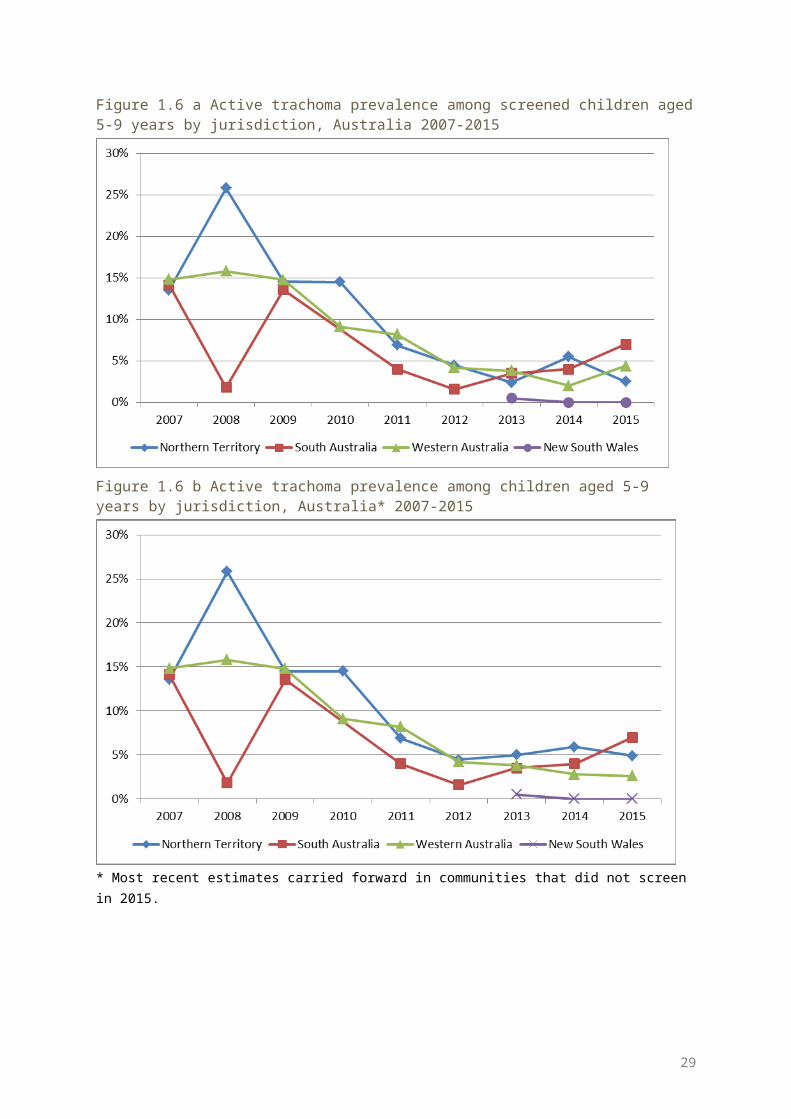
Table 1.5 Trachoma treatment coverage, Australia 2015
Northern Territory South Australia Western Australia Total
Age group (years) 0-4
5-9
10-
1415+ All 0-
45-9
10-
1415+ All 0-
45-9
10-
1415+ All 0-
45-9
10-
1415+ All
Active cases requiring treatment 3 50 9 0 63 15 51 9 75 1 18 5 24 19 119 23 162
Active cases who received treatment 3 50 8 0 62 15 51 9 75 1 18 5 24 19 119 22 161
Active cases who received treatment (%)
100 100 89 0 98 10
0100
100
100
100
100
100 100 100 100 96 99
Estimated community members requiring treatment
902
1058
949
4906
7815 34 68 49 24
7398
152
292
224
1121
1789
1088
1418
1222
6274
10002
Number of community members who received treatment
798 960 77
24082
6612 34 67 48 23
9388
147
284
210
1079
1720 979 131
11030
5400
8720
Estimated community members who received treatment (%)
88 91 81 83 85 100 99 98 97 97 97 97 94 96 96 90 92 84 86 87
Estimated overall treatment coverage (%)
89 91 81 83 85 100 99 98 97 98 97 97 94 96 96 90 93 84 86 87
Doses administered in communities that were treated without screening*
650 754 602 3301 5307 0 0 0 0 0 123 205 158 881 1367 773 959 760 4182 6674
Doses administered six-monthly* 273 325 230 1522 2350 0 0 0 0 0 0 0 0 0 0 273 325 230 1522 2350
Total number of doses of azithromycin delivered
801
1010
780
4082
6674 49 11
8 57 239
463
148
302
215
1079
1744 998 143
01052
5400
8881
* As per guidelines
29
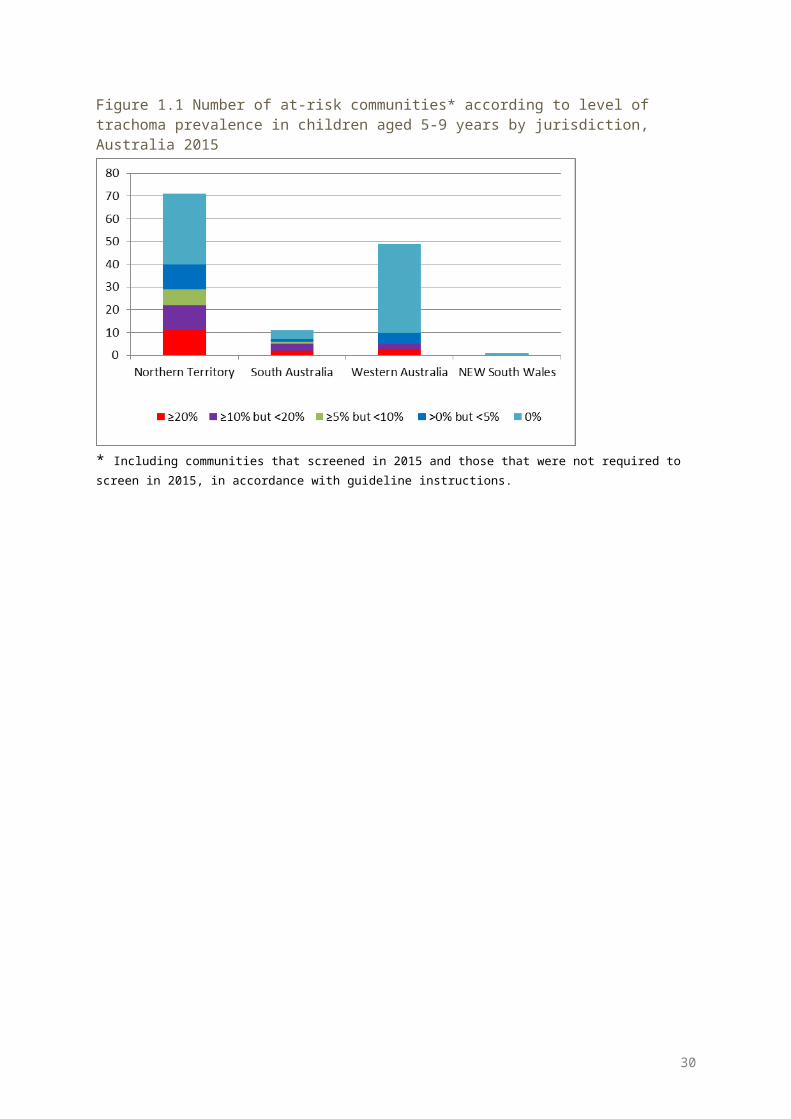
Table 1.6 Trichiasis screening coverage, prevalence and treatment among Aboriginal adults, Australia 2015
Northern Territory South Australia Western Australia Total
Number of communities screened for trichiasis 67 11 25 103
Age groups 15-39 40 + 15-39 40 + 15-39 40 + 15-39 40 + 15+
Estimated population in region* 14310 8108 2895 2000 6057 3586 23262 13694 36956
Adults examined† 2638 2470 700 1264 474 810 3812 4544 8356
With trichiasis (% of adults examined)
4 (0.15%) 25 (1%) 3 (0.4%) 9 (0.7%) 0 7 (0.9%) 7
(0.18%)41
(0.9%)48
(0.57%)
Offered ophthalmic consultation 0 8 3 9 0 8 3 25 28
Declined ophthalmic consultation 0 6 0 0 0 2 0 8 8
Surgery in past 12 months 0 6 3 1 0 6 3 13 16
* Population estimate limited to trachoma endemic regions and does not take into account changing endemic regions over time and transiency between regions† Number of adults examined limited to numbers reported. This number may not account for adults who have been examined in routine adult health checks, and may also include multiple screening
30
Northern Territory results
Trachoma program coverage In 2015, the NT identified 78 communities in five regions as being at risk of trachoma (Table
2.1, Figure 2.1). Of these at-risk communities 82% (64/78) required screening and/or treatment for trachoma
according to current guidelines, with 16/64 requiring treatment but not screening (Table 2.1, Figure 2.3).
Of the 64 communities that required screening and/or treatment 87% (56/64) received the required service (Table 2.1).
The remaining 14 at-risk communities did not require screening or treatment as their previous year’s prevalence was under 5% (see methodology) (Table 2.1, Figure 2.3).
Screening coverage In 2015, the NT identified 48 communities in the five regions requiring screening for
trachoma with 40 of those screened (Table 2.1). Eight at-risk communities were not screened due to staffing restraints, road conditions and
cultural ceremonies (Table 2.3, Figure 2.3) The proportion of children aged 5-9 years screened in the 40 communities was 89%, ranging
from 84% in Darwin Rural and East Arnhem regions to 95% in Barkly and Katherine regions (Table 2.2, Figure 2.4).
Clean face prevalence Clean face prevalence was assessed in all communities that were screened and also in most
that only received treatment. The overall prevalence of clean faces among children aged 5-9 years in the communities
assessed was 85%, ranging from 68% in Alice Springs Remote region, to 98% in the East Arnhem region (Table 2.2, Figure 2.5).
Trachoma prevalence Active trachoma prevalence in those aged 5-9 years in 40 communities that were screened
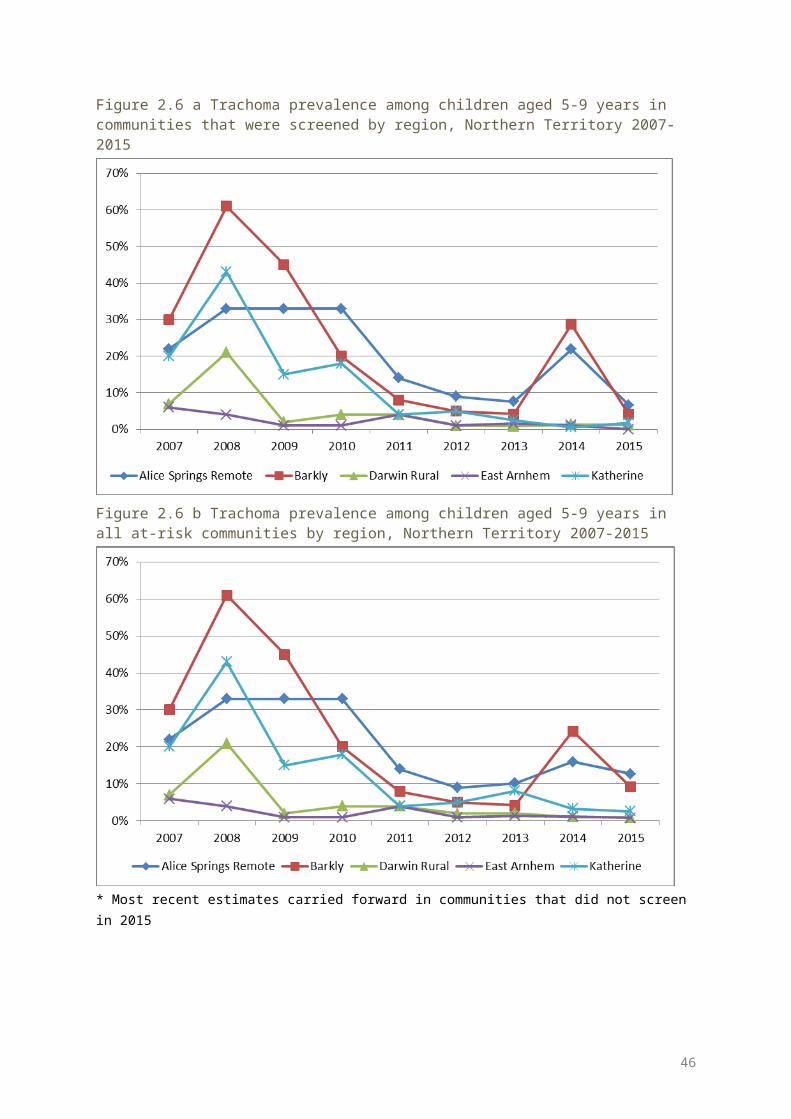
in 2015 was 2.5%. Prevalence ranged from 0% in East Arnhem region to 6.6% in Alice Springs Remote region (Table 2.2, Figure 2.6a).
Active trachoma prevalence using most recent data carried forward in all 78 at-risk communities was 4.8%, ranging from 0.8 % in East Arnhem region to 12.7% in Alice Springs Remote region (Table 2.2, Figure 2.6b).
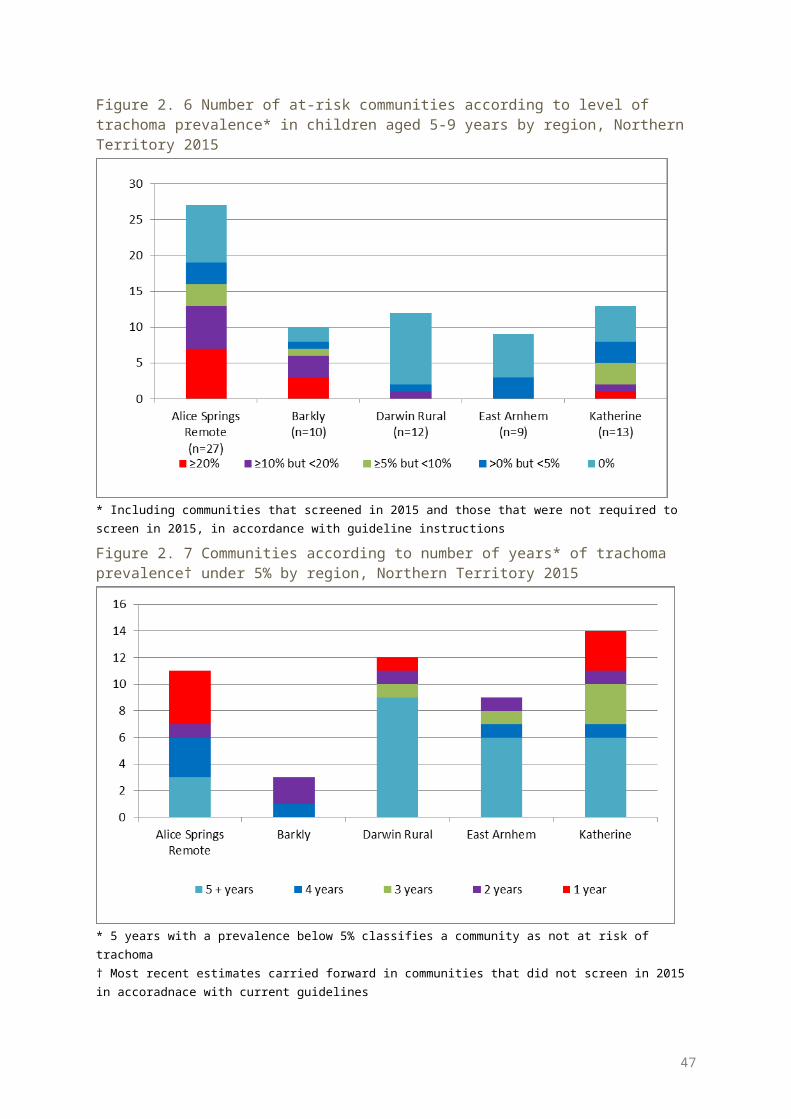
No trachoma was reported in 31 communities. This includes communities that according to guidelines were and were not required to screen for trachoma in 2015 (Figure 2.7, Table 2.3).
Endemic levels of trachoma (>5%) were reported in 29 communities in 2015 including communities that, according to guidelines, were and were not required to screen for trachoma (Figure 2.7, Table 2.3).
Hyperendemic levels of trachoma (>20%) were reported in 11 communities in 2015 including communities that, according to guidelines, were and were not required to screen for trachoma (Figure 2.7, Table 2.3).
31
Non-endemic levels of trachoma have been reported for 24 communities over a period of five years which may reclassify these communities as being not at risk for trachoma (Figure 2.8).
Treatment delivery and coverage Trachoma treatment strategies were applied in 34 communities (Figure 2.3). Treatment was delivered to active cases and households in 13 communities, and to the
whole of community in 21 communities as per guidelines (Table 2.4). Five communities were not treated according to CDNA guidelines due to staffing restraints,
road conditions and cultural ceremonies (Table 2.4). Total treatment coverage for case and contact treatment, and community wide treatment in
all regions requiring treatment was 85% with 6674 doses of azithromycin delivered (Table 2.5, Figure 2.9).
Trichiasis Reporting for trichiasis screening was available for 67 communities (Table 2.6). Overall 5108 adults aged 15 years and older were reported to be screened (Table 2.6). The prevalence of trichiasis in adults aged 15 years and over was 0.6%, and 1% in adults
aged 40 years and over (Table 2.6). Surgery for trichiasis was reported to be undertaken for six adults, with remaining cases
awaiting further review (Table 2.6).
Health promotion Health promotion activities were reported to have occurred in 34 communities in the Alice
Springs Remote, Barkly, Darwin Rural, East Arnhem, and Katherine regions (Table 2.7). A total of 89 health promotion activities were reported (Table 2.7). The majority of the health promotion activities were delivered to children,
caregivers/parents, teachers and childcare or preschool staff members (Table 2.7)
32
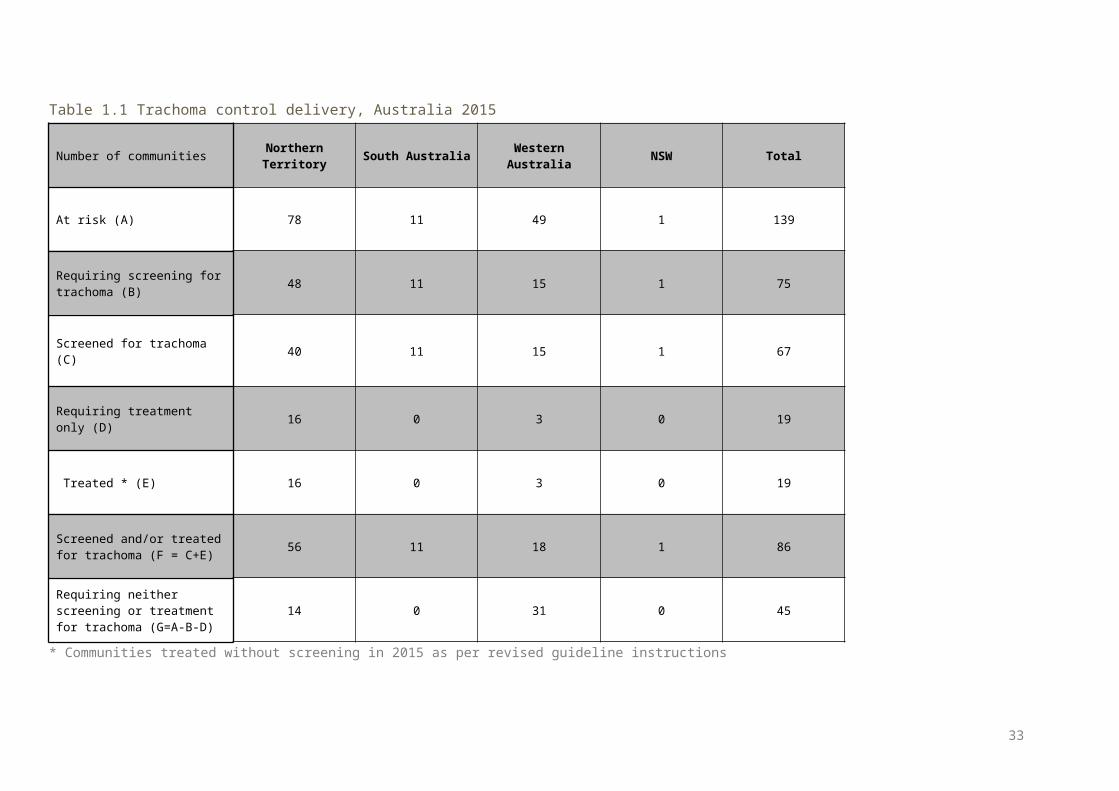
Figure 2.1 Number of at-risk communities screened, treated or both for trachoma and trachoma prevalence in children aged 5-9 years in the Northern Territory, 2015
33
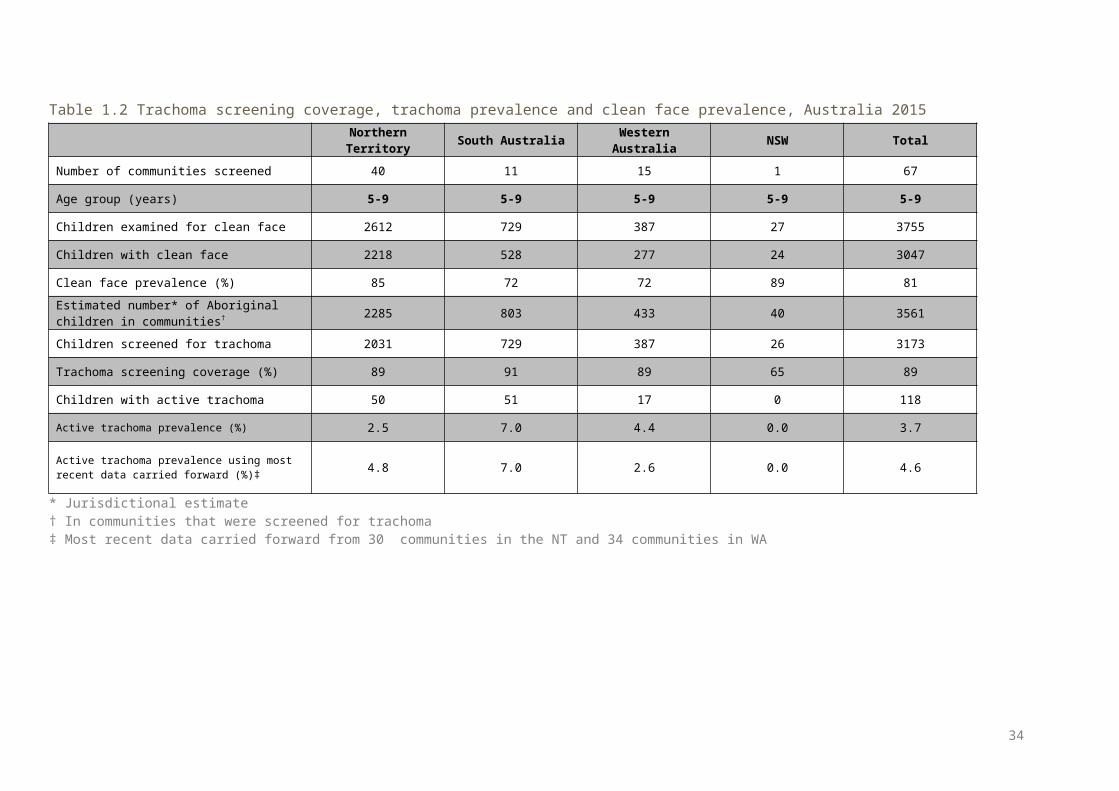
Figure 2. 2 Number of communities at risk by region, Northern Territory 2007-2015
Figure 2. 3 Number of at-risk communities according to trachoma control strategy implemented by region, Northern Territory 2015
34
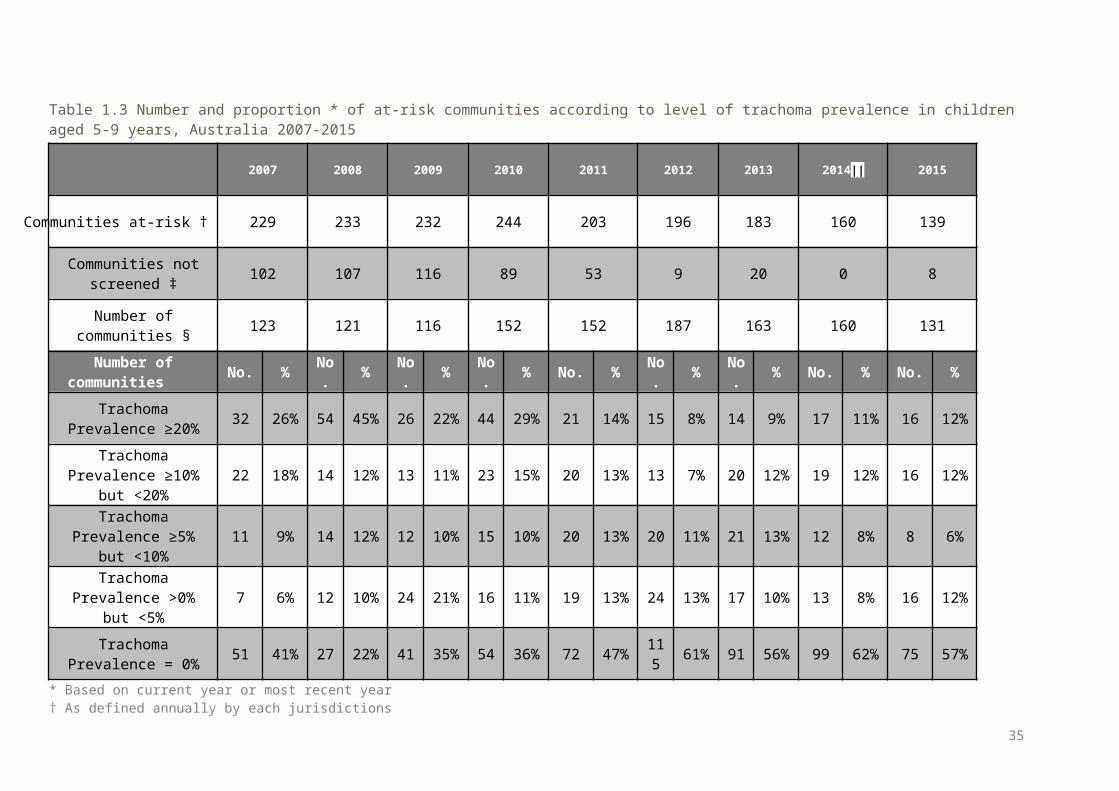
Figure 2. 4 Population screening coverage of children aged 5-9 years in communities that required screening for trachoma by region, Northern Territory 2015
Figure 2. 5 Proportion of screened children aged 5-9 years who had a clean face by region, Northern Territory 2007-2015
35
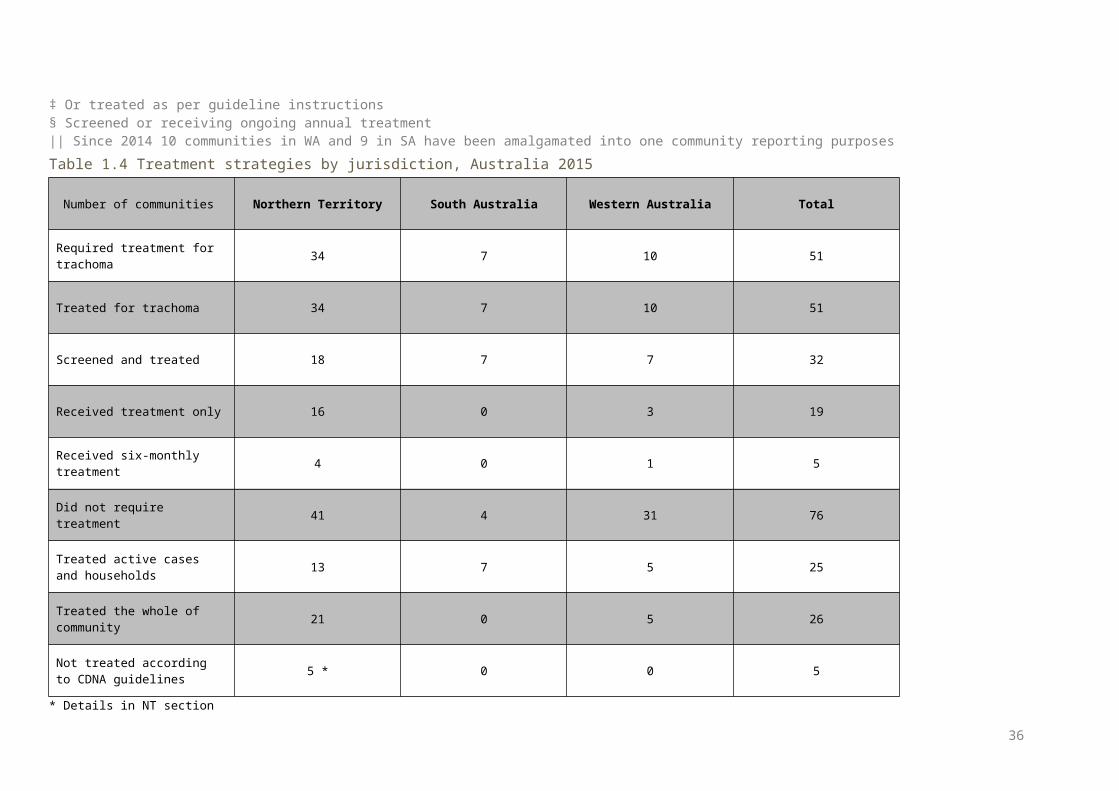
Figure 2.6 a Trachoma prevalence among children aged 5-9 years in communities that were screened by region, Northern Territory 2007-2015
Figure 2.6 b Trachoma prevalence among children aged 5-9 years in all at-risk communities by region, Northern Territory 2007-2015
* Most recent estimates carried forward in communities that did not screen in 2015
36
Figure 2. 6 Number of at-risk communities according to level of trachoma prevalence* in children aged 5-9 years by region, Northern Territory 2015
* Including communities that screened in 2015 and those that were not required to screen in 2015, in accordance with guideline instructions
Figure 2. 7 Communities according to number of years* of trachoma prevalence† under 5% by region, Northern Territory 2015
* 5 years with a prevalence below 5% classifies a community as not at risk of trachoma† Most recent estimates carried forward in communities that did not screen in 2015 in accoradnace with current guidelines
37
Figure 2. 8 Number of doses of azithromycin administered for the treatment of trachoma by region, Northern Territory 2007-2015
38
Table 2.1 Trachoma control delivery by region, Northern Territory 2015
Number of communities
Alice Springs Remote Barkly Darwin Rural East Arnhem Katherine Total
At risk (A) 27 11 12 9 19 78
Requiring screening for trachoma (B) 16 5 8 5 14 48
Screened for trachoma (C) 16 4 8 4* 8* 40
Requiring treatment only (D) 9 5 0 0 2 16
Treated † (E) 9 5 0 0 2 16
Screened and/or treated for trachoma (F = C+E)
25 9 8 4 10 56
Requiring neither screening or treatment for trachoma (G=A-B-D)
2 1 4 4 3 14
* Some at-risk communities not screened due to competing requirements within the region. All communities will be screened in 2016† Communities requiring &/ treated without screening in 2015 in accordance with guideline instructions. Other communities have received treatment in 2015 in response from screening activities undertaken in 2015, as detailed in Table 2.4.
39
Table 2. 2 Trachoma screening coverage, trachoma prevalence and clean face prevalence by region, Northern Territory 2015
Alice Springs Remote Barkly Darwin Rural East Arnhem Katherine Total
Number of communities screened
16 5 8 4 8 41
Age group (years) 0-4 5-9 10-14
0-14 0-4 5-9 10-
140-14 0-4 5-9 10-
140-14 0-4 5-9 10-
140-14 0-4 5-9 10-
140-14 0-4 5-9 10-
140-14
Children examined for clean face
329 662 190 1181 129 427 300 856 106 807 232 114
5 36 246 137 419 167 470 236 873 767 2612
1095
4474
Children with clean face 124 452 175 751 91 380 296 767 77 715 225 101
7 35 240 137 412 128 431 224 783 455 2218
1057
3730
Clean face prevalence (%) 38 68 92 64 71 89 99 90 73 89 97 89 97 98 100 98 77 92 95 90 59 85 97 83
Estimated number* of Aboriginal children in communities†
277 336 310 923 57 330 212 599 901 932 1031
2864 201 286 390 877 759 401 448 160
82195
2285
2391
6871
Children examined for trachoma
18 316 94 428 16 314 185 515 90 780 232 1102 30 240 142 412 105 381 152 638 259 203
1 805 3095
Trachoma screening coverage (%)
6 94 30 46 28 95 87 86 10 84 23 38 15 84 36 47 14 95 34 40 12 89 34 45
Children with active trachoma 1 21 5 27 0 13 2 15 1 9 0 10 0 0 0 0 1 7 2 10 3 50 9 62
Active trachoma prevalence (%) 5.6 6.6 5.3 6.3 0.0 4.1 1.1 2.9 1.1 1.2 0.0 0.9 0.0 0.0 0.0 0.0 1.0 1.8 1.3 1.6 1.2 2.5 1.1 2.0
Active trachoma prevalence using mostrecent data carried forward (%)
12.7%
9.2%
1.0%
0.8%
2.6%
4.8%
* Jurisdiction provides estimate for children aged 5-9 years only; number of children in communities aged 0-4 and 10-14 years are based on convenience sampling† In communities that were screened for trachoma
40
Table 2. 3 Number and proportion of at-risk communities according to level of trachoma prevalence* in children aged 5-9 years, Northern Territory2007-2015
2007 2008 2009 2010 2011 2012 2013 2014 2015
Communities at-risk † 89 87 86 86 86 82 80 78 78
Communities not screened ‡ 25 25 33 21 19 4 12 0 8
Number of communities § 60 43 53 64 65 76 68 78 70
Number of communities No. % No. % No. % No. % No. % No. % No. % No. % No. %
Trachoma Prevalence ≥20% 12 20% 25 58% 19 36% 27 42% 9 14% 5 7% 5 7% 14 18% 11 16%
Trachoma Prevalence ≥10% but <20% 8 13% 6 14% 8 15% 4 6% 9 14% 9 12% 14 21% 14 18% 11 16%
Trachoma Prevalence ≥5% but <10% 4 7% 4 9% 3 6% 9 14% 11 17% 9 12% 9 13% 10 13% 7 10%
Trachoma Prevalence >0% but <5% 7 12% 4 9% 9 17% 9 14% 14 22% 13 17% 9 13% 6 8% 10 14%
Trachoma Prevalence = 0% 29 48% 4 9% 14 26% 15 23% 22 34% 40 53% 31 46% 34 44% 31 44%
* Based on current or most recent year† As defined annually by each jurisdictions‡ Or treated as per guideline instructions§ Screened or receiving ongoing annual treatment
41
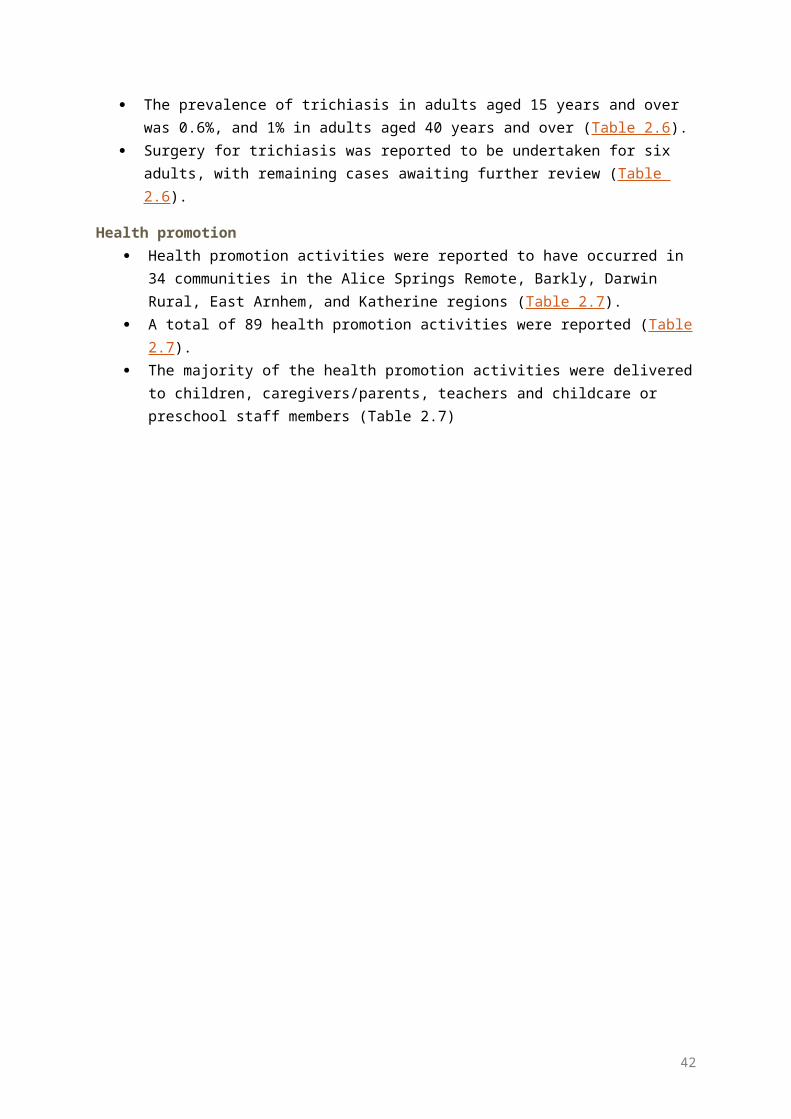
Table 2. 4 Treatment strategies by region, Northern Territory 2015
Number of communities Alice Springs Remote Barkly Darwin Rural East Arnhem Katherine Total
Required treatment for trachoma * 18 8 1 0 7 34
Treated for trachoma * 18 8 1 0 7 34
Screened and treated 9 3 1 0 5 18
Received treatment only 9 5 0 0 2 16
Received 6-monthly treatment 4 0 0 0 0 4
Did not require treatment 9 3 10 9 10 41
Treated active cases and households 5 3 1 0 4 13
Treated the whole of community 13 5 0 0 3 21
Not treated according to CDNA guidelines 1* 4† 0 0 0 5
* Required MDA, however community declined due to cultural ceremony. Case and household contacts treated.† Three communities received one of two required 6-monthly treatments due to staffing constraints, road conditions and cultural ceremonies. One community required 6-monthly MDA; however community requested rescreening and results required active case and household contact treatment only.
42
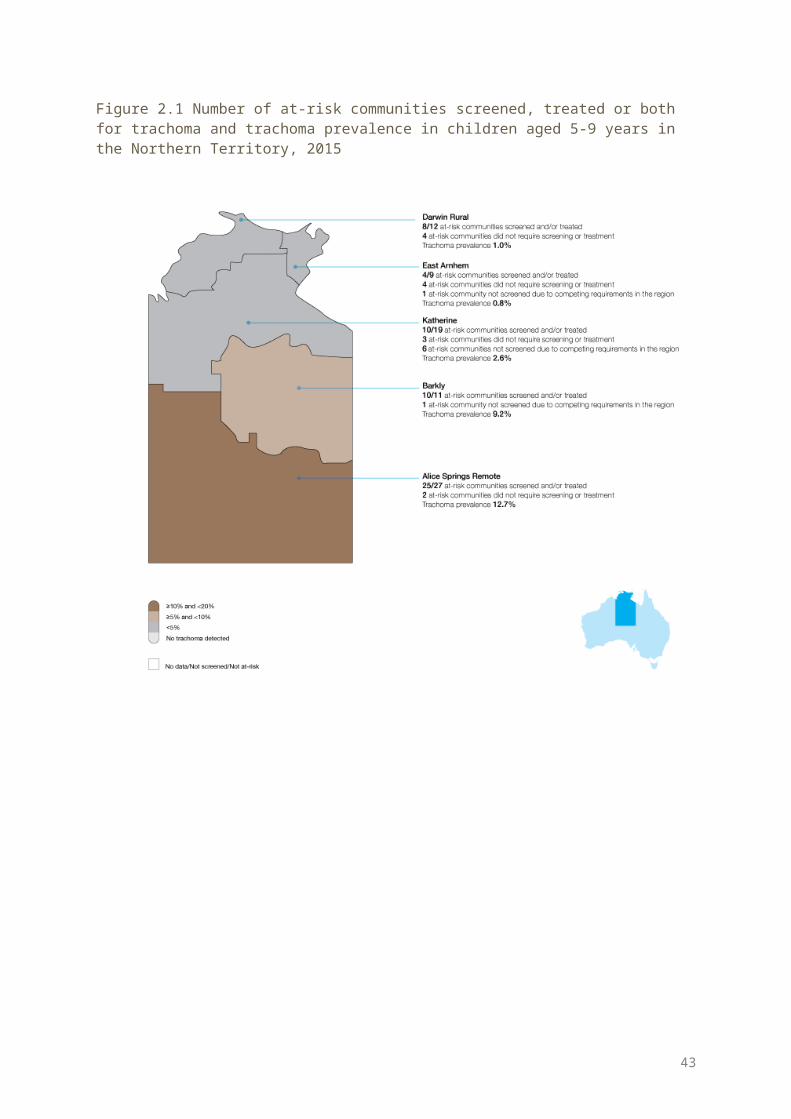
Table 2. 5 Trachoma treatment coverage by region*, Northern Territory 2015
Alice Springs Remote Barkly Darwin Rural Katherine Total
Age group (years) 0-4 5-9 10-
14 15+ All 0-4 5-9 10-14 15+ All 0-4 5-9 10-
14 15+ All 0-4 5-9 10-14 15+ All 0-4 5-9 10-
14 15+ All
Active cases requiring treatment
1 21 5 27 0 13 2 15 1 9 0 10 1 7 2 11 3 50 9 63
Active cases who received treatment
1 21 4 26 0 13 2 15 1 9 0 10 1 7 2 11 3 50 8 62
Active cases who received treatment (%)
100 100 80 96 0 100 100 100 100 100 0 100 100 100 100 100 100 100 89 98
Estimated community members requiring treatment
659 726 587 3660 5632 159 199 244 753 1355 14 14 13 41 82 70 119 105 452 746 902 1058 949 4906 7815
Number of community members who received treatment*
576 652 468 2971 4667 149 182 193 681 1205 14 14 13 41 82 59 112 98 389 658 798 960 772 4082 6612
Estimated community members who received treatment † (%)
87 90 80 81 83 94 91 79 90 89 100 100 100 100 100 84 94 93 86 88 88 91 81 83 85
Total number of doses of azithromycin delivered
577 673 472 2971 4693 149 195 195 681 1220 15 23 13 41 92 60 119 100 389 669 801 1010 780 4082 6674
Estimated overall treatment coverage (%)
87 90 80 81 83 94 92 79 90 89 100 100 100 100 100 85 94 93 86 88 89 91 81 83 85
* All East Arnhem communities did not require treatment.† Includes household contacts and community members requiring/receiving MDA
43
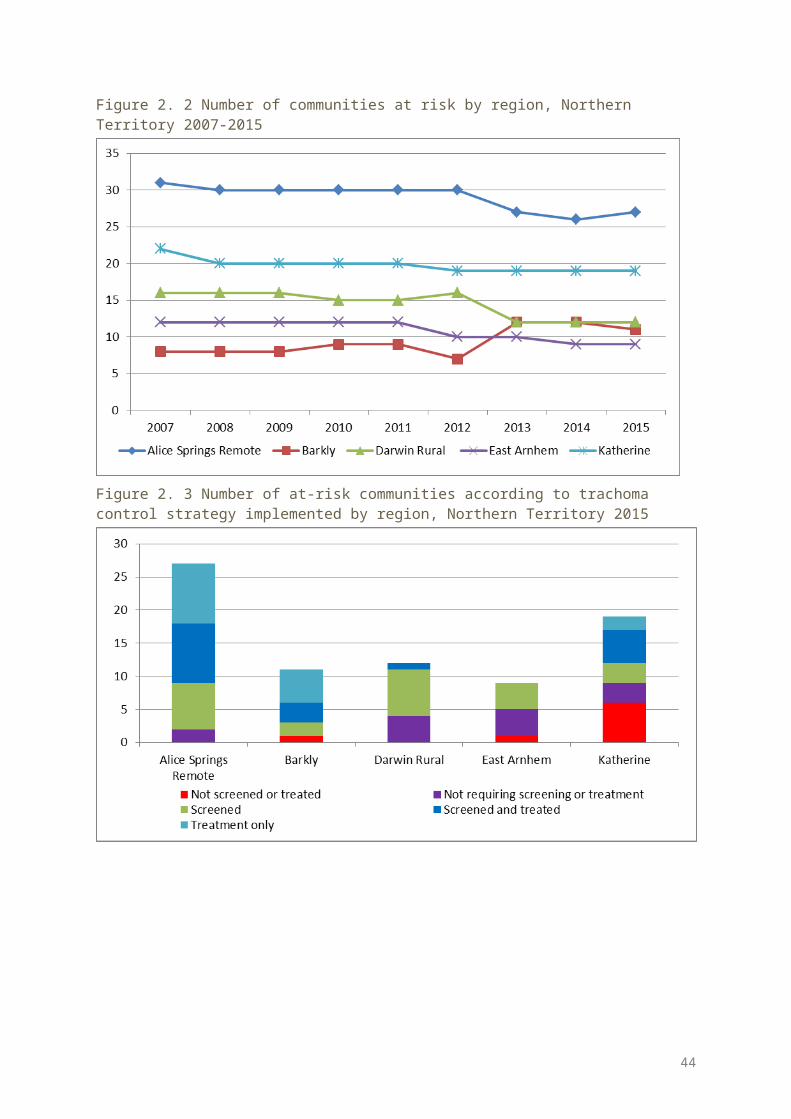
Table 2. 6 Trichiasis screening coverage, prevalence and treatment among Aboriginal adults by region, Northern Territory 2015Alice
Springs Remote
Barkly Darwin Rural East Arnhem Katherine Total
Number of communities screened for trichiasis 21 9 16 6 15 67
Age group (years) 15-39 40+ 15-39 40+ 15-39 40+ 15-39 40+ 15-39 40+ 15-39 40+ 15+
Estimated population in region* 2221 1234 1918 1168 4971 2699 2789 1596 2411 1411 14310 8108 22418
Adults examined 527 446 328 160 859 964 458 360 466 540 2638 2470 5108
With trichiasis (% of adults examined)
3 (0.6%
)
20 (4.5%
)0
1 (0.6%
)2
(2%) 0 01
(0.3%)
1 (0.2%
)
1 (0.2%
)6(0.2%)
23 (1%)
29 (0.6%)
Offered ophthalmic consultation 0 7 0 0 0 0 0 0 0 1 0 8 8
Declined ophthalmic consultation 0 5 0 0 0 0 0 0 0 1 0 6 6
Surgery in past 12 months ‡ 0 5 0 1 0 0 0 0 0 0 0 6 6
* Population estimate limited to trachoma endemic regions and does not take into account changing endemic regions over time and transiency between regions† Number of adults examined limited to numbers reported. This number may not account for all adults who may be examined in routine adult health checks, and may also include multiple screening‡ Surgery cases may include cases identified in previous years.
44
Table 2. 7 Health promotion activities by region, Northern Territory 2015
Alice Springs Remote
Barkly Darwin Rural
East Arnhem Katherine Total
Number of communities at risk 27 11 12 9 19 78Number of communities that reported health promotion activities
17 10 3 2 2 34
Total number of programs reported 64 10 3 2 10 89
Methods of health promotion
One-on-one discussion 33 9 3 1 8 54
Presentation to group 20 5 1 1 2 29
Interactive group session 17 2 0 0 4 23
Social marketing 4 0 0 0 4
Print material/mass media 23 3 0 0 8 34
Sporting/community events 0 0 0 0 0
Other 0 1 0 0 10 11
Target audience
Health professionals/staff 16 4 0 1 6 27
Children 21 9 3 0 10 43
Youth 10 6 0 0 4 20Teachers/childcare/preschool staff 13 7 0 0 8 28
Caregivers/parents 12 8 1 1 8 30
Community members 13 7 1 0 6 27Community educators/health promoters 6 1 0 0 2 9
Interagency members 4 0 0 0 8 12Frequency of health promotion activitiesOnce 12 5 1 0 10 28
2-4 times per year 52 0 2 2 0 56
5-12 times per year 0 0 0 0 0 0
Ongoing/routine 0 5 0 0 0 5
45
Northern Territory Trachoma Health Promotion in 2015In 2015, trachoma health promotion in the Northern Territory continued to focus on broad, hygiene-related messages relevant to the prevention of multiple hygiene related illness such as skin, ear and respiratory illness. Health Education sessions using these broad hygiene messages were delivered at schools, Families as First Teachers facilities and child care facilities. Health education was also given to individuals and family groups during screening and treatment. Information sessions were provided to teachers, clinic staff, local authority committees and other service providers working in communities.In 2015, the 4-Step Hygiene poster first developed in 2013 which depicts nose blowing, hand washing, face washing and drying either with paper towels or air drying was further developed to include teeth brushing. The poster was also printed onto A5 cards with the trachoma myths on the back, these were distributed widely to community members and service providers during screening and treatment visits.The Melbourne Football Club made two visits to the Northern Territory in 2015. The trip to Central Australia allowed for trachoma health promotion at a football clinic in one of the communities. Both visits resulted in media coverage for the trachoma program and Milpa the trachoma goanna, was present at all events. The Yamba and Milpa roadshow travelled to several Central Australian communities and was very well received by the community.Work continued on a poster that provides visual information regarding treatment cycles. It was found most useful when presented to groups rather than individuals. This poster has been translated into Walpri and has had good responses from Walpri-speaking communities. Several information brochures have been developed which are made available at the clinic, store and council office during screening and treatment trips. These are also distributed to individuals. Work will continue in 2016 to have information translated into relevant local languages.
46
South Australia results
Trachoma program coverage In 2015 SA identified 11 communities in three regions as being at risk of trachoma (Table 3.1, Figure 3.1). Due to no evidence of active trachoma, Yorke and Mid North Region are no longer considered at risk of
trachoma. All 11 at-risk communities were screened for trachoma (Table 3.1, Figure 3.1). In 2014 and 2015 the Anangu Pitjantjatjara Yankunytjatjara (APY) Lands aggregated nine communities into
one single community to simplify surveillance due to small population size of communities and high mobility between communities.
Screening coverage Trachoma screening coverage of children aged 5-9 years in the 11 at-risk communities screened was 91%,
ranging from 90% in the Far North region to 93% in the APY Lands (Table 3.2, Figure 3.4).
Clean face prevalence Clean face prevalence was assessed in all communities that were screened. The overall prevalence of clean faces among children aged 5-9 years in the screened communities was 72%,
ranging from 51% in the APY Lands, to 87% in the Far North region (Table 3.2, Figure 3.5).
Trachoma prevalence The active trachoma prevalence in children aged 5-9 years screened was 7%. Prevalence ranged from 6.7% in
the Far North region to 7.8% in Eyre and Western region (Table 3.2, Figure 3.6). No trachoma was reported in four communities (Table 3.3, Figure 3.7). Endemic levels of trachoma (5% or more) were reported in six communities (Table 3.3, Figure 3.7). Non endemic levels of trachoma have been reported for four communities over a period of five years which
may reclassify these communities as being not at risk for trachoma (Figure 3.8).
Treatment delivery and coverage Trachoma treatment strategies were applied in seven communities (Table 3.4). Treatment was delivered to active cases and households in all seven communities (Table 3.4). Total treatment coverage for case and contact treatment, and community wide treatment in all regions
requiring treatment was 98% with 463 doses of azithromycin delivered (Table 3.5).
Trichiasis Screening for trichiasis was undertaken in 11 communities (Table 3.6). Overall 1964 adults aged 15 years and over were screened (Table 3.6). The prevalence of trichiasis in adults aged 15 years and over was 0.6%, and 0.7% in adults aged 40 years and
over (Table 3.6). Surgery for trichiasis was reported to be undertaken for four adults (Table 3.6).
Health promotion Health promotion activities were reported to have occurred in 11 communities in the APY Lands, Eyre and
Western, and Far North regions (Table 3.7). A total of 25 health promotion activities were reported in SA (Table 3.7). The majority of the health promotion activities were delivered to children, teachers and childcare or
preschool staff members, caregivers/parents, and youth (Table 3.7).
47
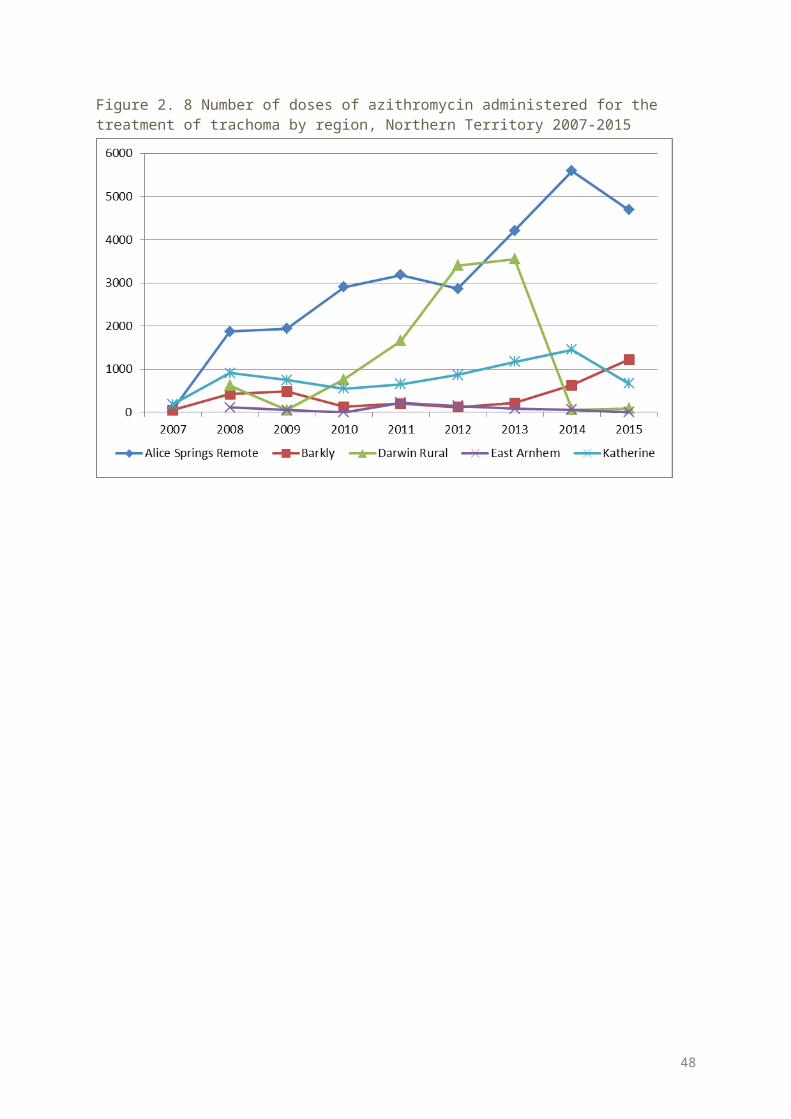
Figure 3. 1 Number of at-risk communities, screened, treated or both for trachoma and trachoma prevalence in children aged 5-9 years, South Australia 2015
48
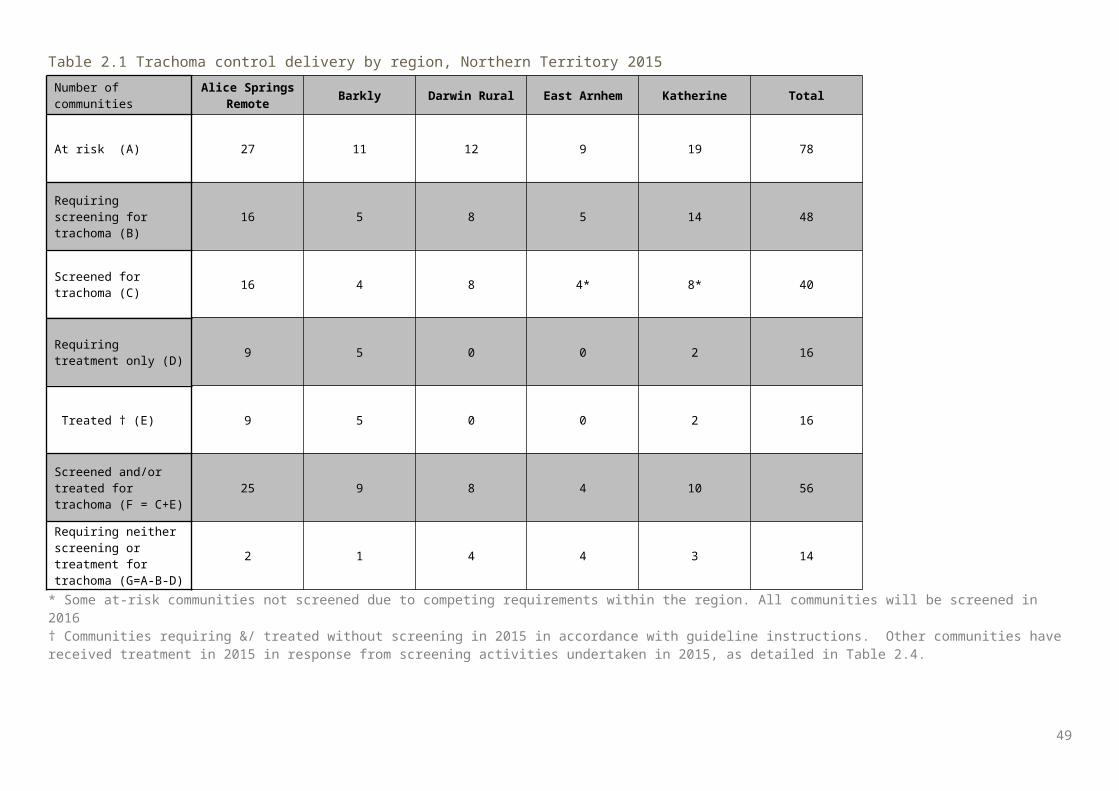
Figure 3. 2 Number of communities at risk by region, South Australia 2007-2015
* Since 2014 APY Lands aggregated 9 communities into one community for presentation of data APY: Anangu Pitjantjatjara Yankunytjatjara
Figure 3. 3 Number of at-risk communities according to trachoma control strategy implemented by region, South Australia 2015
* APY: Anangu Pitjantjatjara Yankunytjatjara
49
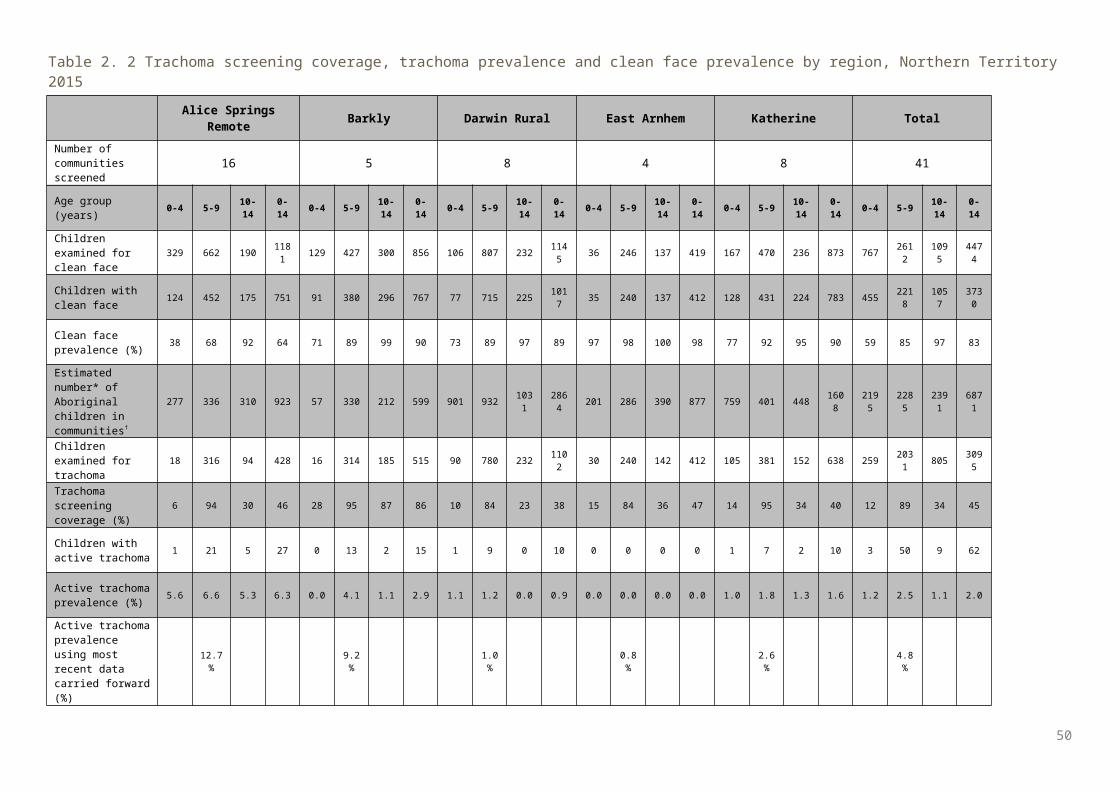
Figure 3. 4 Population screening coverage of children aged 5-9 years in at-risk communities that required screening for trachoma by region, South Australia 2015
APY: Anangu Pitjantjatjara Yankunytjatjara
Figure 3. 5 Proportion of screened children* aged 5-9 years who had a clean face by region, South Australia 2007-2015
* In at-risk communitiesAPY: Anangu Pitjantjatjara Yankunytjatjara
50
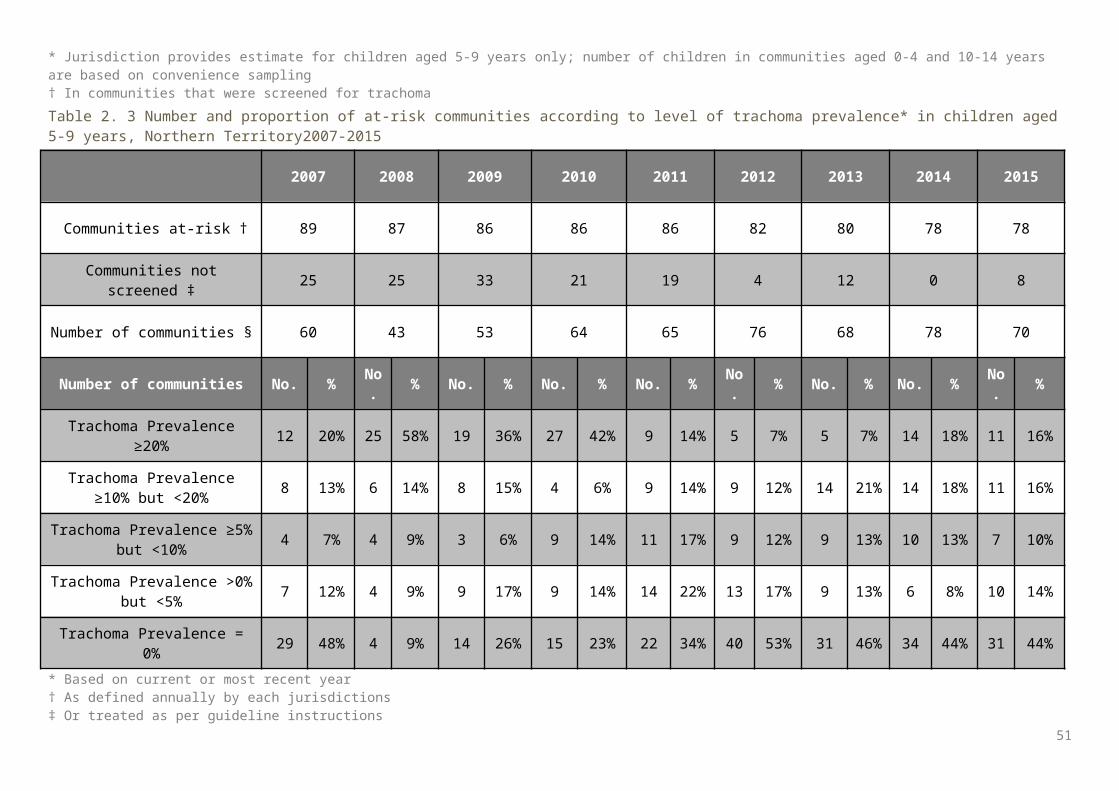
Figure 3. 6 Trachoma prevalence among children aged 5-9 years in at-risk communities by region*, South Australia 2007-2015
* Population sizes in all regions are small; therefore fluctuations in rates should be interpreted cautiously APY: Anangu Pitjantjatjara Yankunytjatjara
Figure 3. 7 Number of at-risk communities according to level of trachoma prevalence in children aged 5-9 years by region, South Australia 2015
*APY: Anangu Pitjantjatjara Yankunytjatjara
51
Figure 3. 8 At-risk communities according to number of years* of trachoma prevalence under 5% by region, South Australia 2015
* 5 years with a prevalence below 5% classifies a community as not at risk of trachoma
Figure 3. 9 Number of doses of azithromycin administered for the treatment of trachoma by region, South Australia 2007-2015
APY: Anangu Pitjantjatjara Yankunytjatjara
52
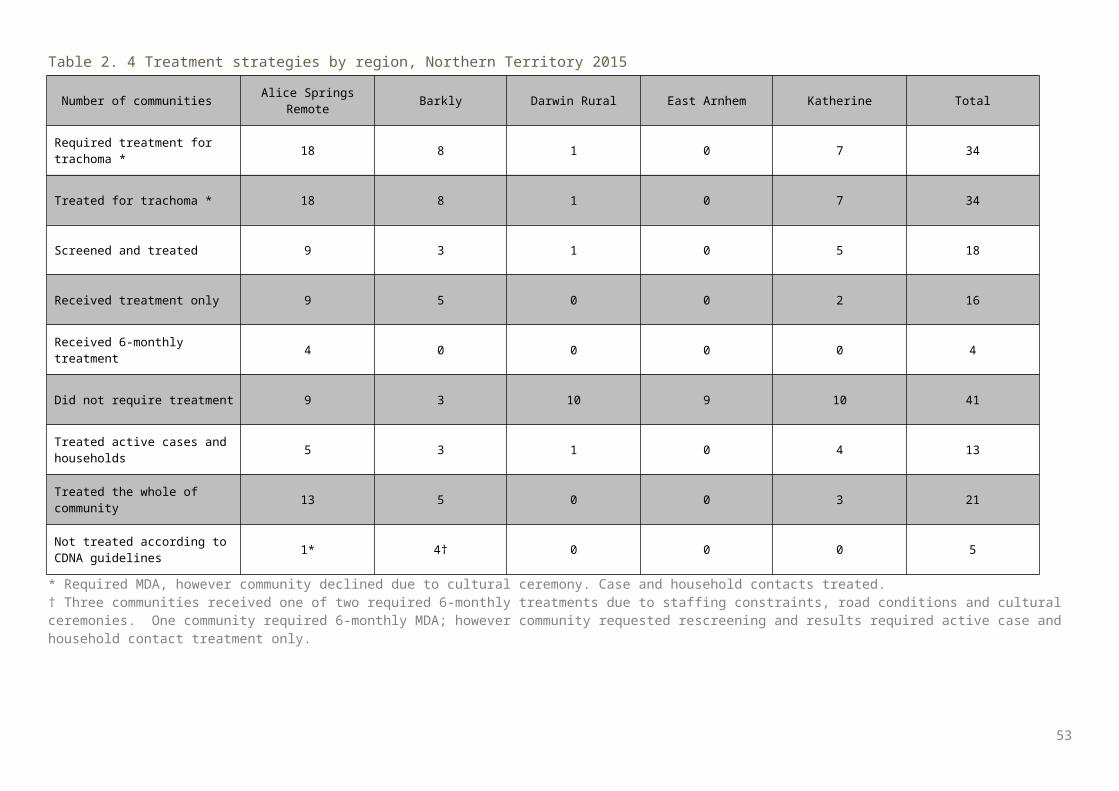
Table 3. 1 Trachoma control delivery by region, South Australia 2015
Number of communities APY Lands Eyre and Western Far North Total
At risk* (A) 1* 4 6 11
Requiring screening for trachoma (B)
1 4 6 11
Screened for trachoma (C) 1 4 6 11
Requiring treatment only (D)
0 0 0 0
Treated † (E) 0 0 0 0
Screened and/or treated for trachoma (F = C+E)
1 4 6 11
Requiring neither screening or treatment for trachoma (G=A-B-D)
0 0 0 0
* In 2015 APY Lands aggregated 9 communities into one community for presentation of data† Communities treated without screening in 2015 as per guideline instructionsAPY: Anangu Pitjantjatjara Yankunytjatjara
53
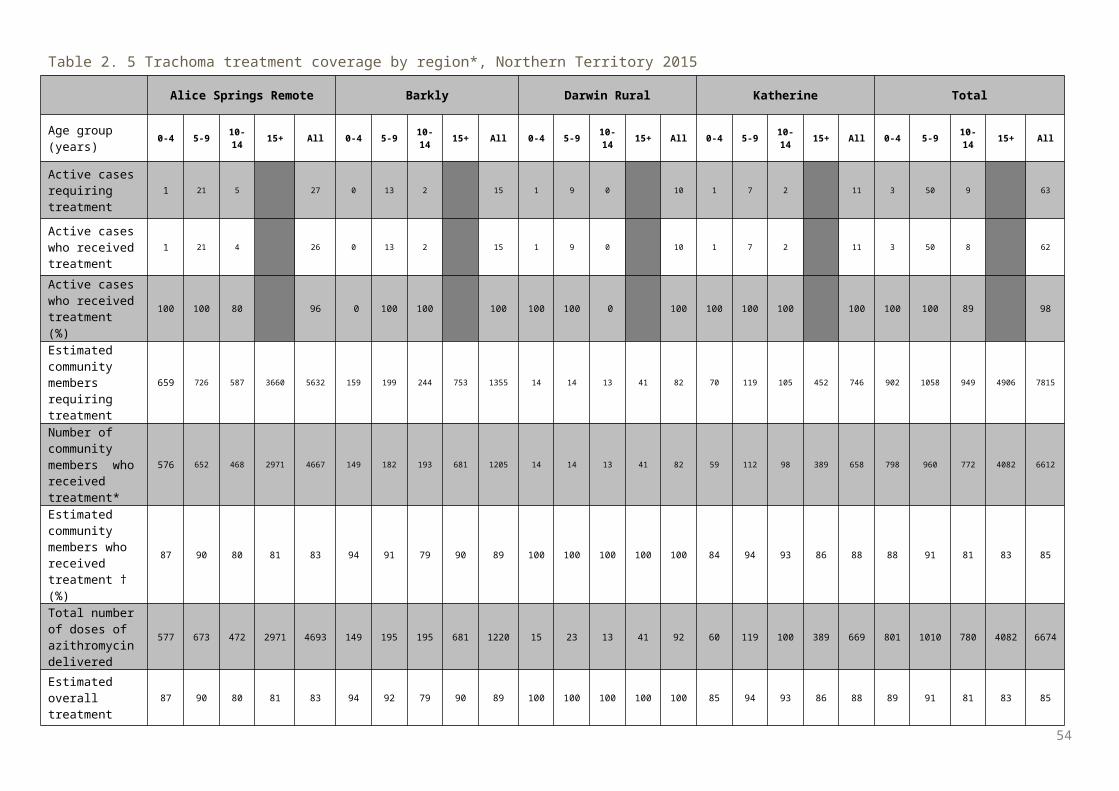
Table 3. 2 Trachoma screening coverage, trachoma prevalence and clean face prevalence by region, South Australia 2015
APY Lands Eyre and Western Far North Total
Number of communities screened 1* 4 6 11
Age group (years) 0-4 5-9 10-14
0-14 0-4 5-9 10-
140-14 0-4 5-9 10-
140-14 0-4 5-9 10-
140-14
Children examined for clean face 160 249 240 649 88 154 124 366 145 326 202 673 393 729 566 168
8
Children with clean face 68 127 214 409 60 119 102 281 113 282 176 571 241 528 492 126
1
Clean face prevalence (%) 43 51 89 63 68 77 82 77 78 87 87 85 61 72 87 75
Estimated number* of Aboriginal children in communities†
255 269 254 778 146 170 158 474 330 364 339 1033 731 803 751 228
5
Children examined for trachoma 160 249 240 649 88 154 124 366 145 326 202 673 393 729 566 168
8
Trachoma screening coverage (%) 63 93 94 83 60 91 78 77 44 90 60 65 54 91 75 74
Children with active trachoma 12 17 5 34 1 12 0 13 2 22 4 28 15 51 9 75
Active trachoma prevalence (%) 7.5 6.8 2.1 5.2 1.1 7.8 0.0 3.6 1.4 6.7 2.0 4.2 3.8 7.0 1.6 4.4
* In 2015 APY Lands aggregated 9 communities into one community for presentation of data † ABS estimateAPY: Anangu Pitjantjatjara Yankunytjatjara
54
Table 3. 3 Number and proportion of at-risk communities according to level of trachoma prevalence in children aged 5-9 years, South Australia 2007-2015
2007 2008 2009 2010 2011 2012 2013 2014|| 2015
Communities at-risk † 68 72 72 72 46 38 22 13 11
Communities not screened ‡ 60 61 60 60 27 2 6 0 0
Number of communities § 8 11 12 11 19 36 16 13 11
Number of communities No. % No. % No. % No. % No. % No. % No. % No. % No. %
Trachoma Prevalence ≥20% 2 25% 0 0% 3 25% 3 27% 2 11% 1 3% 2 13% 1 8% 2 18%
Trachoma Prevalence ≥10% but <20% 2 25% 1 9% 2 17% 1 9% 3 16% 1 3% 3 19% 1 8% 3 27%
Trachoma Prevalence ≥5% but <10% 2 25% 2 18% 1 8% 0 0% 2 11% 1 3% 1 6% 0 0% 1 9%
Trachoma Prevalence >0% but <5% 0 0% 1 9% 1 8% 0 0% 1 5% 4 11% 0 0% 1 8% 1 9%
Trachoma Prevalence = 0% 2 25% 7 64% 5 42% 7 64% 11 58% 29 81% 10 63% 10 77% 4 36%
* Based on current year or most recent year† As defined annually by each jurisdictions‡ Or treated as per guideline instructions§ Screened or receiving ongoing annual treatment|| Since 2014, 9 communities from the Anangu Pitjantjatjara Yankunytjatjara have been amalgamated into one community for reporting purposes
55
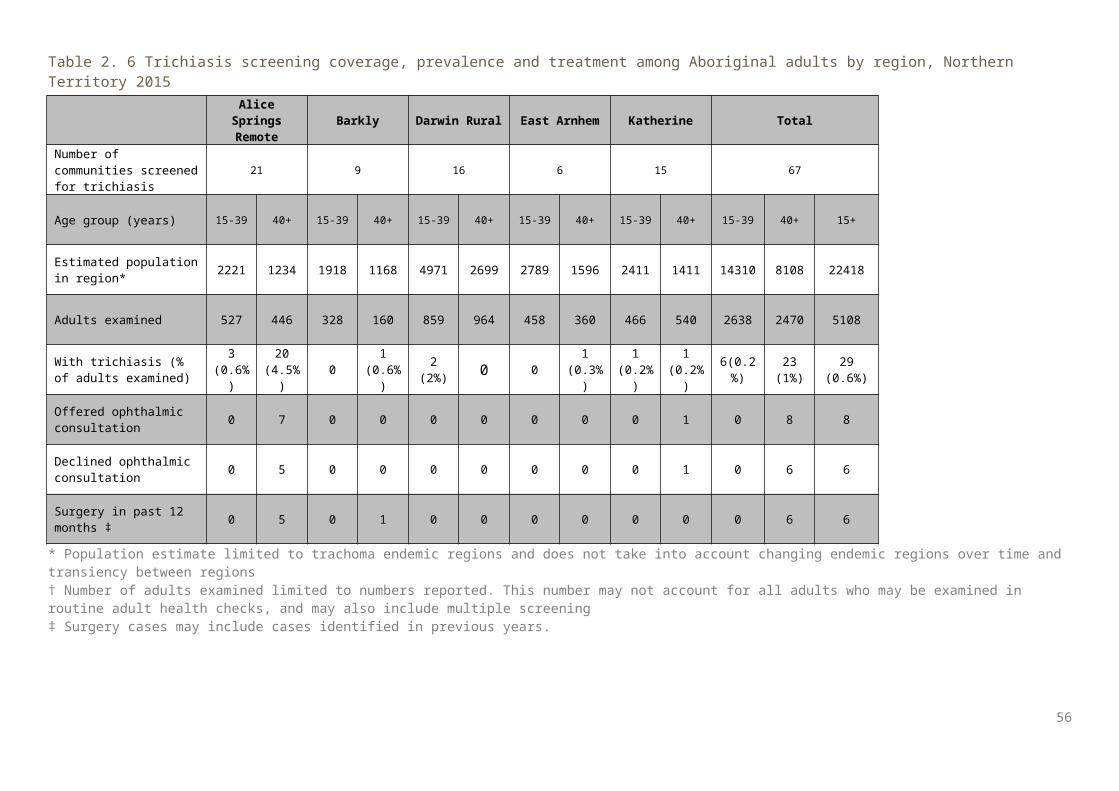
Table 3. 4 Treatment strategies by region, South Australia 2015
Number of communities APY Lands Eyre and
Western Far North Total *
Required treatment for trachoma 1* 2 4 7
Treated for trachoma 1 2 4 7
Screened and treated 1 2 4 7
Received treatment only 0 0 0 0
Received six-monthly treatment 0 0 0 0
Did not require treatment 0 2 2 4
Treated active cases and households 1 2 4 7
Treated the whole of community 0 0 0 0
Not treated according to CDNA guidelines
0 0 0 0
* In 2015 APY Lands aggregated 9 communities into one community for presentation of data, details of the specific number of communities requiring treatment or treated were not supplied.APY: Anangu Pitjantjatjara Yankunytjatjara
56
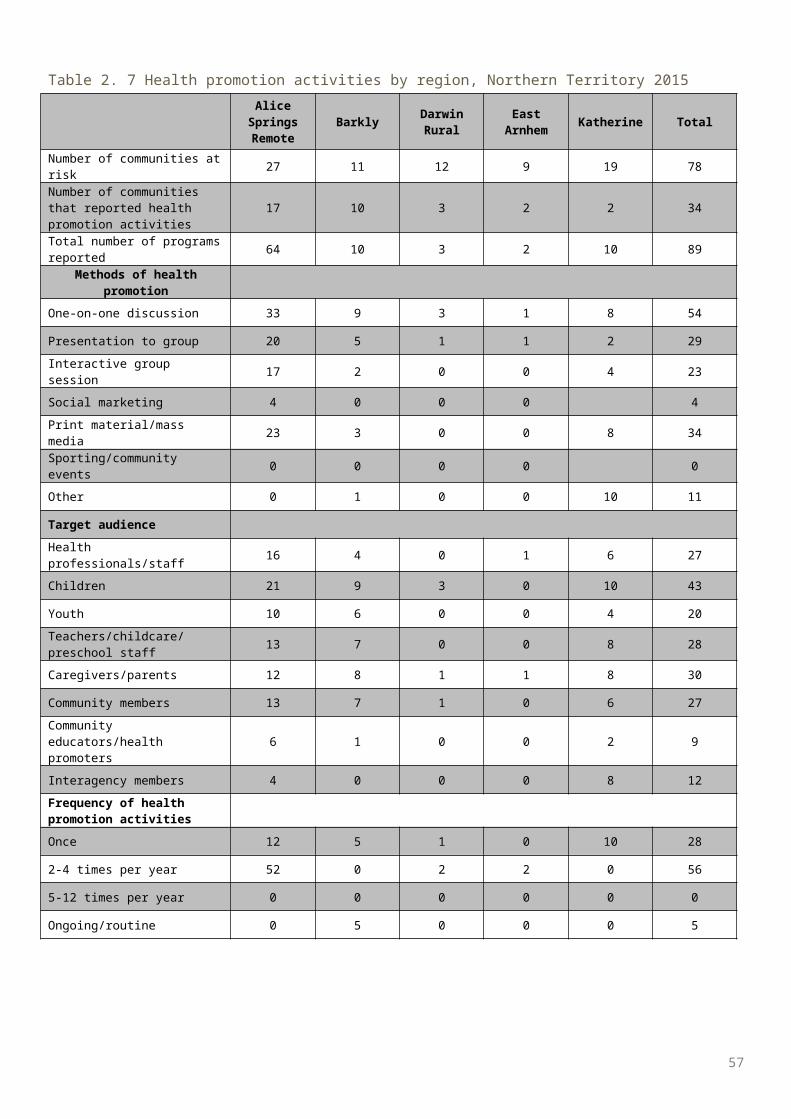
Table 3. 5 Trachoma treatment coverage by region, South Australia 2015
APY Lands Eyre and Western Far North Total
Age group (years) 0-4 5-9 10-14
15+ All 0-4 5-9 10-
1415+ All 0-4 5-9 10-
1415+ All 0-4 5-9 10-
1415+ All
Active cases requiring treatment 12 17 5 34 1 12 0 13 2 22 4 28 15 51 9 75
Active cases who received treatment 12 17 5 34 1 12 0 13 2 22 4 28 15 51 9 75
Active cases who received treatment (%)
100 100 100 100 100 100 0 100 100 100 100 100 100 100 100 100
Estimated community members requiring treatment
26 29 31 213 299 5 17 10 14 46 3 22 8 20 53 34 68 49 247 398
Number of community members who received treatment
26 28 31 209 294 5 17 9 13 44 3 22 8 17 50 34 67 48 239 388
Estimated community members who received treatment (%)
100 97 100 98 98 100 100 90 93 96 100 100 100 85 94 100 99 98 97 97
Total number of doses of azithromycin delivered
38 45 36 209 328 6 29 9 13 57 5 44 12 17 78 49 118 57 239 463
Estimated overall treatment coverage (%)
100 98 100 98 98 100 100 90 93 97 100 100 100 85 96 100 99 98 97 98
APY: Anangu Pitjantjatjara Yankunytjatjara
57
Table 3. 6 Trichiasis screening coverage, prevalence and treatment among Aboriginal adults by region, South Australia 2015
APY Lands Eyre and Western Far North Total
Number of communities screened for trichiasis
1* 4 6 11
Age group (years) 15-39 40+ 15-39 40+ 15-39 40+ 15-39 40+ 15+
Estimated population* 1124 611 498 433 1273 956 2895 2000 4895
Adults examined 533 411 20 290 147 563 700 1264 1964
With trichiasis (% of adults examined) 1 (0.2%) 8 (1.9%) 0 0 2 (1.4%) 1 (1.8%) 3 (0.4%) 9 (0.7%) 12
(0.6%)
Offered ophthalmic consultation 1 8 0 0 2 1 3 9 12
Declined ophthalmic consultation 0 0 0 0 0 0 0 0 0
Surgery in past 12 months 1 0 0 0 2 1 3 1 4
* In 2015 APY Lands aggregated 9 communities into one community for presentation of data† Population estimate limited to trachoma endemic regions and does not take into account changing endemic regions over time and transiency between regions‡ Number of adults examined limited to numbers reported. This number may not account for adults who may be examined in routine adult health checks, and may also include multiple screening
58
Table 3. 7 Health promotion activities by region, South Australia 2015
APY Lands Eyre and Western Far North Total
Number of communities at-risk 1 4 6 11Number of communities that reported health promotion activities
1 4 6 11
Total number of programs reported 6 8 11 25Methods of health promotionOne-on-one discussion 3 8 11 22
Presentation to group 3 4 2 9
Interactive group session 3 6 2 11
Social marketing 0 1 5 6
Print material/mass media 0 7 10 17
Sporting/community events 1 8 2 11
Other 0 2 1 3
Target audience
Health professionals/staff 1 4 7 12
Children 3 8 11 22
Youth 1 8 10 19Teachers/childcare/preschool staff 1 8 11 20
Caregivers/parents 2 6 11 19
Community members 1 6 10 17Community educators/health promoters 0 6 7 13
Interagency members 0 6 2 8Frequency of health promotion activitiesOnce 0 0 0 0
2-4 times per year 5 5 11 21
5-12 times per year 0 3 0 3
Ongoing/routine 1 0 0 1
59
Western Australia results
Trachoma program coverage In 2015 WA identified 49 communities in four regions as being at risk of trachoma (Table 4.1, Figure 4.1). Of the 49 at-risk communities, 37% (18/49) required screening and/or treatment for trachoma according to
current guidelines (Table 4.1) Three communities required treatment only and 15 communities required and were screened for trachoma
(Table 4.1) All 18 communities that required screening and/or treatment, received the screening and/or treatment
required (Table 4.1). In 2014 and 2015 WA aggregated ten communities in the Goldfields region into one community due to small
population size of communities and high mobility between communities. In 2015 all at-risk communities in the Pilbara region were not required to screen or treat for trachoma under
guideline recommendations. In all, 31 at-risk communities did not require screening or treatment as their previous year’s prevalence was
under 5% (see methodology) (Table 4.1, Figure 4.3).
Screening coverage Population screening coverage of children aged 5-9 years in the 15 at-risk communities that required
screening was 89%, ranging from 88% in the Kimberley region to 93% in the Midwest region (Table 4.2).
Clean face prevalence Clean face prevalence was assessed in all communities that were screened and in communities that required
treatment only. The overall prevalence of clean faces among children aged 5-9 years was 72%, ranging from 64% in the
Midwest region to 76% in the Kimberley region (Table 4.2, Figure 4.5).
Trachoma prevalence The active trachoma prevalence in children aged 5-9 years in 15 communities that screened in 2015 was
4.4%. Prevalence ranged from 0% in the Kimberley region to 15.2% in the Midwest region (Table 4.2, Figure 4.6a).
Active trachoma prevalence using most recent data carried forward in all 49 at-risk communities was 2.6%, ranging from 0% in the Pilbara region (carried forward from 2014) to 9.2% in the Midwest region (Table 4.2, Figure 4.6b).
No trachoma was reported in 39 at-risk communities including communities that did and did not screen in 2015 (Figure 4.7).
Endemic levels of trachoma (5% or more) were reported in five communities. (Figure 4.7).
Treatment delivery and coverage Trachoma treatment strategies were required in ten communities (Table 4.4). Treatment was delivered to active cases and households in five communities, and to the whole of
community in a further five communities as per guidelines (Table 4.4). Total treatment coverage for case and contact treatment, and community wide treatment in all regions
requiring treatment was 96% with 1744 doses of azithromycin delivered (Table 4.5, Figure 4.8).
Trichiasis Overall, 1284 adults 15 years and over were reported to be screened, with seven cases of trichiasis reported
(Table 4.6).
60
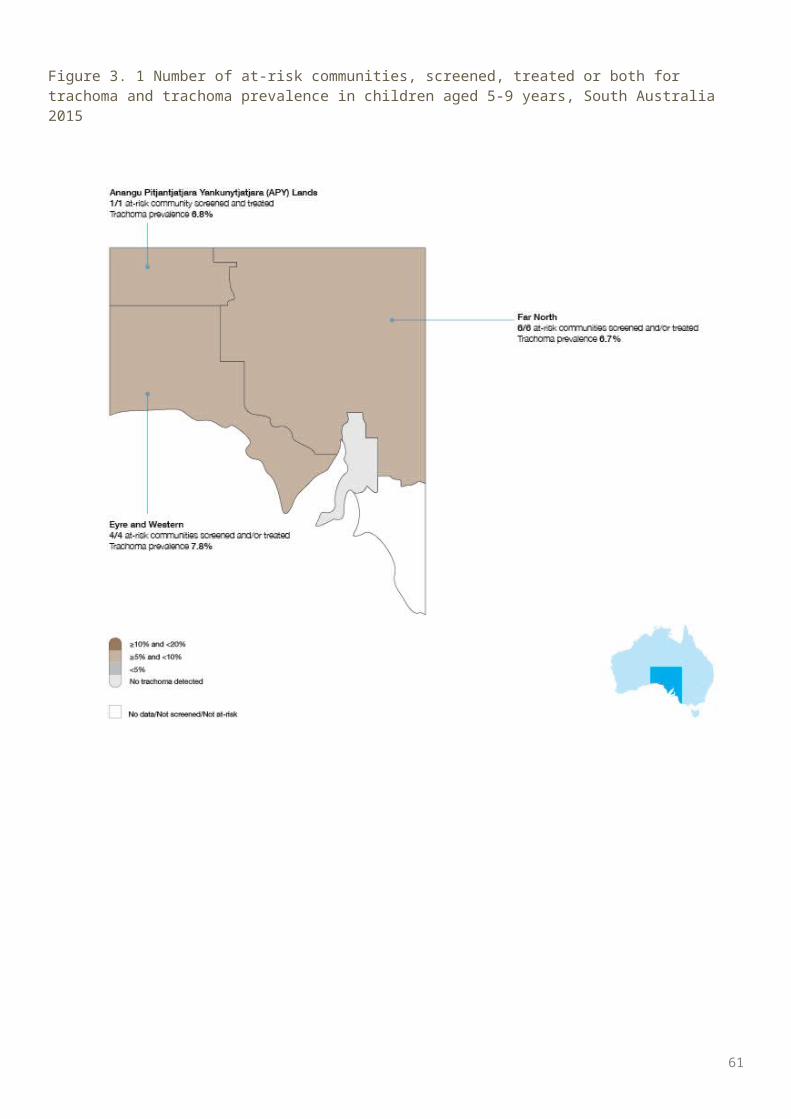
A large volume of trichiasis screening in WA is likely to be undertaken within the Medicare Health Assessment for Aboriginal and Torres Strait Islander People (MBS Item 715). These data are not made available to the NTSRU.
Health promotion Health promotion activities were reported to have occurred in 49 communities in the Goldfields, Kimberley,
Midwest, and Pilbara regions, including two communities no longer considered at risk of trachoma. (Table 4.7).
A total of 136 health promotion activities were reported in WA as part of the WA Trachoma Program (Table 4.7).
The majority of the health promotion activities were delivered to children (Table 4.7).
61
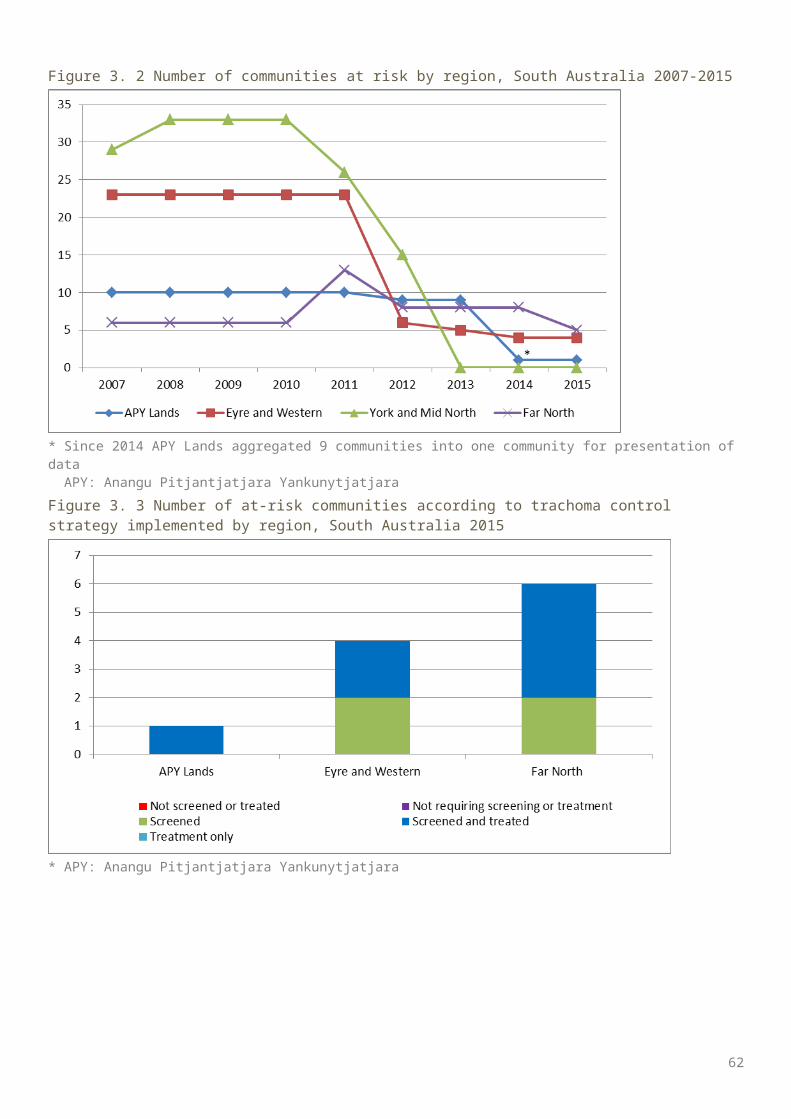
Figure 4. 1 Number of at-risk communities screened, treated or both for trachoma and trachoma prevalence in children aged 5-9 years, Western Australia 2015
62
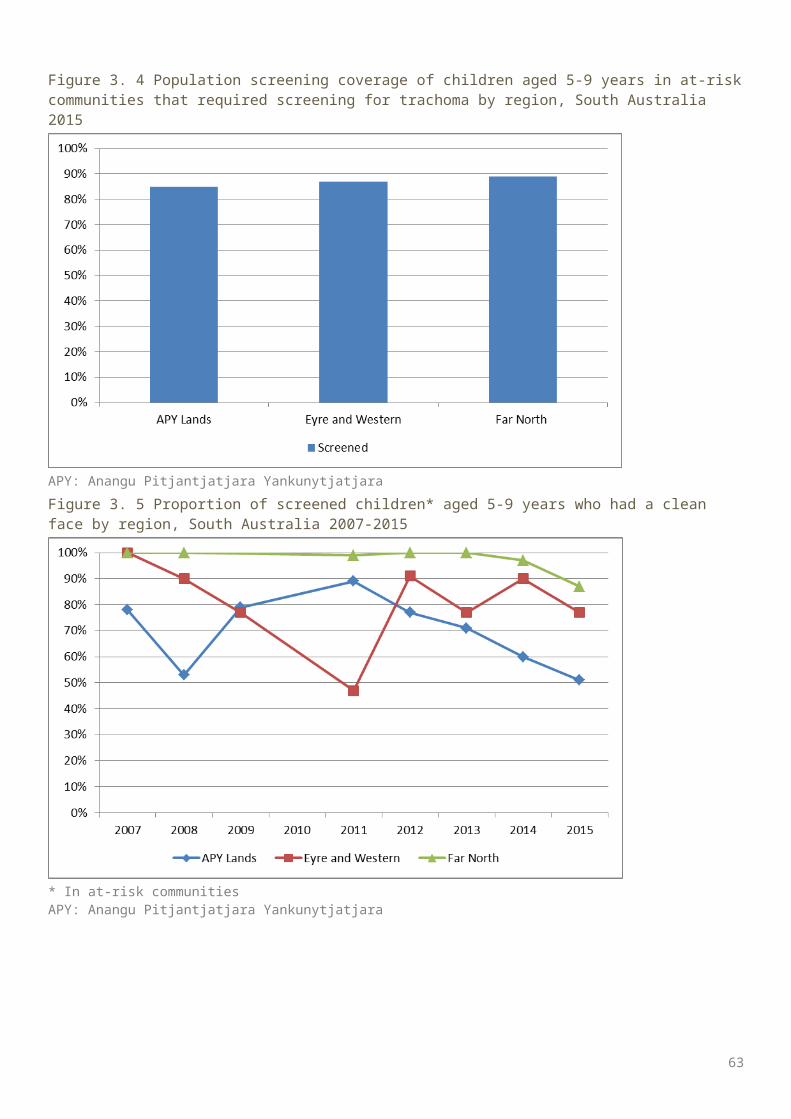
Figure 4. 2 Number of communities at risk by region, Western Australia 2007-2015
* Since 2014 10 communities in the Goldfields region have been amalgamated into one community
Figure 4. 3 Number of at-risk communities according to trachoma control strategy implemented by region, Western Australia 2015
63
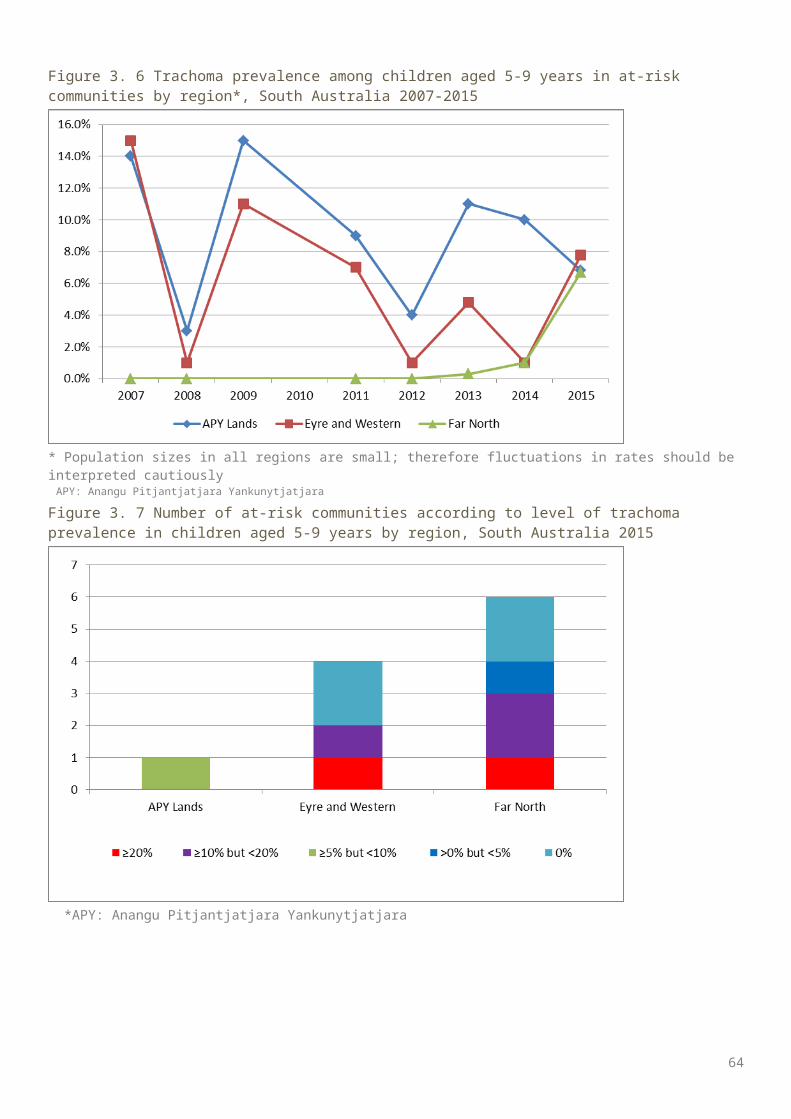
Figure 4. 4 Population screening coverage in children aged 5-9 years in communities that required screening for trachoma by region, Western Australia 2015
Figure 4. 5 Proportion of screened children aged 5-9 years who had a clean face by region, Western Australia 2007-2015
64
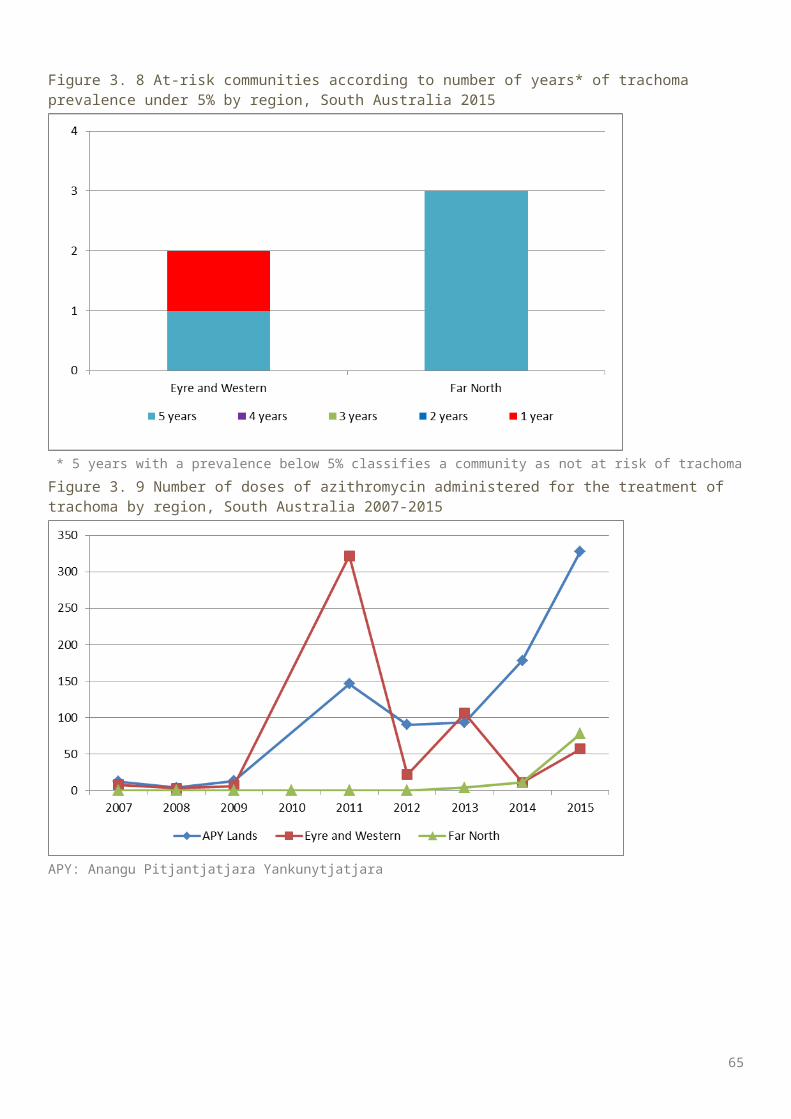
Figure 4.6 a Trachoma prevalence among children aged 5-9 years in communities that were screened by region, Western Australia 2007-2015
Figure 4.6 b Trachoma prevalence* among children aged 5-9 years in all at-risk communities by region, Western Australia 2007-2015
* Most recent estimates carried forward in communities that did not screen in 2015
65
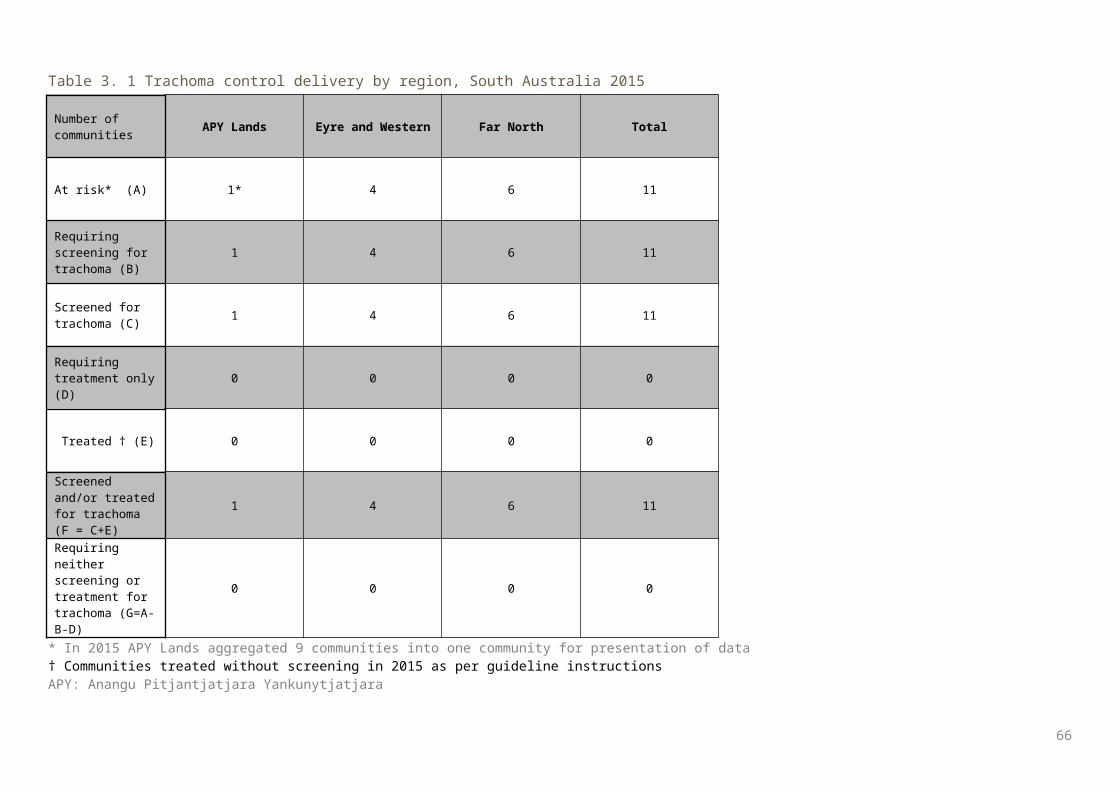
Figure 4. 6 Number of at-risk communities* according to level of trachoma prevalence in children aged 5-9 years by region, Western Australia 2015
* Including communities that screened in 2015 and those that were not required to screen in 2015, in accordance with guideline instructions (see methodology)
Figure 4. 7 At-risk communities according to number of years* of trachoma prevalence under 5% by region, Western Australia 2015
66
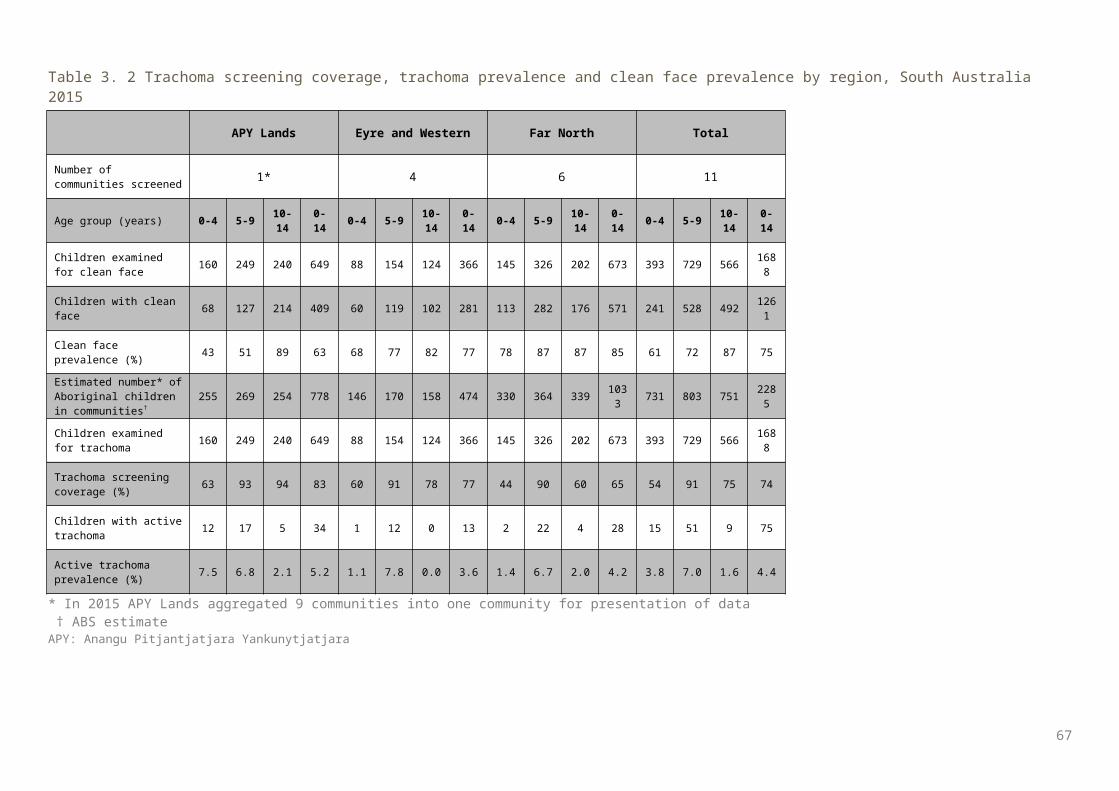
Figure 4. 8 Number of doses of azithromycin administered for the treatment of trachoma by region, Western Australia 2007-2015
*Treatments administered in the Kimberley in 2007 are likely to have been under-reported, as treatment data were not received from several communities †In the Kimberley in 2008, 17 communities were reported to have received ‘community-based treatment’, compared with only seven in 2009
67
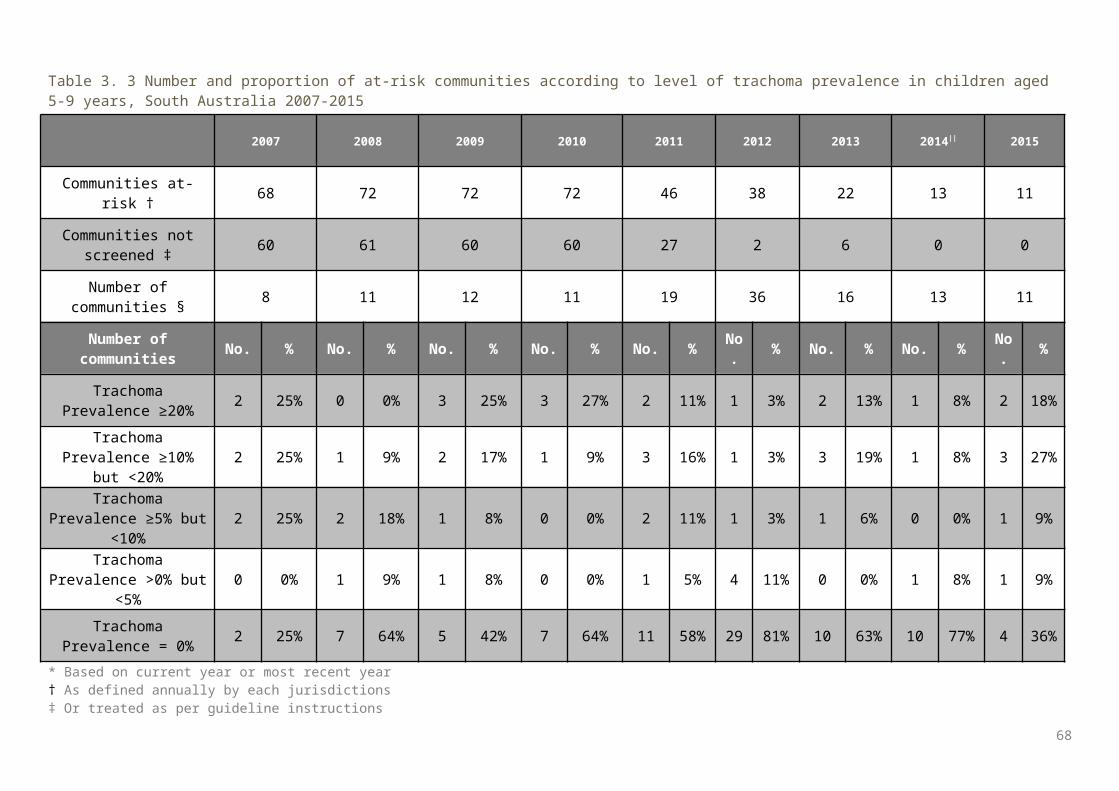
Table 4. 1 Trachoma control delivery by region, Western Australia 2015
Number of communities Goldfields* Kimberley Midwest Pilbara Total
At risk* (A) 10 24 8 7 49
Requiring screening for trachoma (B)
3 7 5 0 15
Screened for trachoma (C) 3 7 5 0 15
Requiring treatment only (D) 1 1 1 0 3
Treated † (E) 1 1 1 0 3
Screened and/or treated for trachoma (F = C+E)
4 8 6 0 18
Requiring neither screening or treatment for trachoma (G=A-B-D)
6 16 2 7 31
* WA aggregated 10 communities in the Goldfields region into one community†Communities treated without screening in 2015 as per guideline instructions
68
Table 4. 2 Trachoma screening coverage, trachoma prevalence and clean face prevalence by region, Western Australia 2015
Goldfields Kimberley Midwest TotalNumber of communities screened 3 7 5 15
Age group (years) 0-4 5-9 10-14 0-14 0-4 5-9 10-14 0-14 0-4 5-9 10-14 0-14 0-4 5-9 10-14 0-14
Children examined for clean face 5 46 31 82 18 249 106 373 18 92 34 144 41 387 171 599
Children with clean face 3 30 25 58 11 188 88 287 15 59 32 106 29 277 145 451
Clean face prevalence (%) 60 65 81 71 61 76 83 77 83 64 94 74 71 72 85 75
Estimated number* of Aboriginal children in communities†
8 50 33 91 30 284 186 500 22 99 43 164 60 433 262 755
Children examined for trachoma 5 46 31 82 18 249 106 373 14 92 33 139 37 387 170 594
Trachoma screening coverage (%) 63 92 94 90 60 88 57 75 64 93 77 85 62 89 65 79
Children with active trachoma 0 3 1 4 0 0 2 2 0 14 2 16 0 17 5 22
Active trachoma prevalence (%) 0.0 6.5 3.2 4.4 0.0 0.0 1.9 0.5 0.0 15.2 6.1 11.5 0.0 4.4 2.9 3.7
Active trachoma prevalence using most recent data carried forward (%)
4.9 0.3 9.2 2.6
* Jurisdiction provides estimate for children aged 5-9 years only; number of children in communities aged 0-4 and 10-14 years are based on convenience sampling† In communities that were screened for trachomaTable 4. 3 Number and proportion of at-risk communities* according to level of trachoma prevalence in children aged 5-9 years, Western Australia 2007-2015
2007 2008 2009 2010 2011 2012 2013 2014 || 2015
69
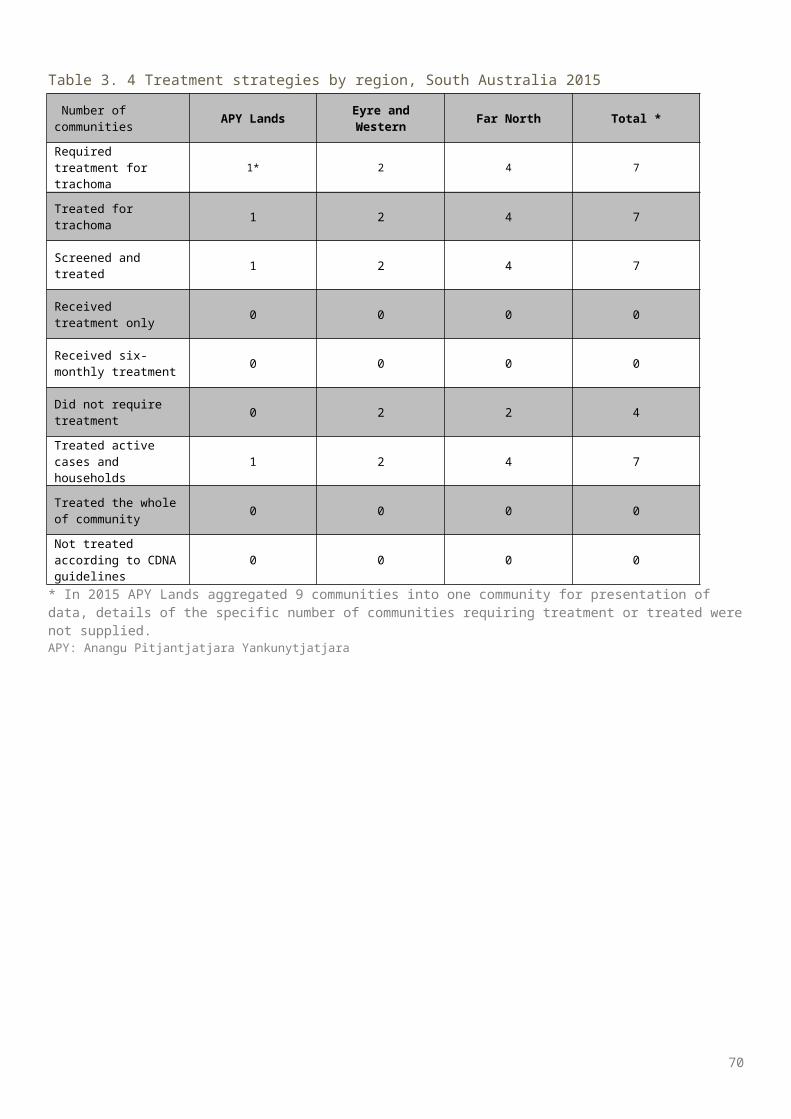
Communities at-risk † 72 74 74 86 75 78 71 59 49
Communities not screened ‡ 17 7 5 8 7 3 2 0 0
Number of communities § 55 67 69 78 68 75 69 59 49
Number of communities No. % No. % No. % No. % No. % No. % No. % No. % No. %
Trachoma Prevalence ≥20% 18 33% 29 43% 22 32% 14 18% 10 15% 9 12% 7 10% 2 3% 3 6%
Trachoma Prevalence ≥10% but <20% 12 22% 7 10% 3 4% 18 23% 8 12% 3 4% 3 4% 4 7% 2 4%
Trachoma Prevalence ≥5% but <10% 5 9% 8 12% 8 12% 7 9% 7 10% 10 13% 10 14% 2 3% 0 0%
Trachoma Prevalence >0% but <5% 0 0% 7 10% 14 20% 7 9% 4 6% 7 9% 8 12% 6 10% 5 11%
Trachoma Prevalence = 0% 20 36% 16 24% 22 32% 32 41% 39 57% 46 61% 41 59% 45 76% 39 79%
* Based on current year or most recent year† As defined annually by each jurisdictions‡ Or treated as per guideline instructions§ Screened or receiving ongoing annual treatment|| Since 2014, 10 communities in WA have been amalgamated into one community reporting purposes
70
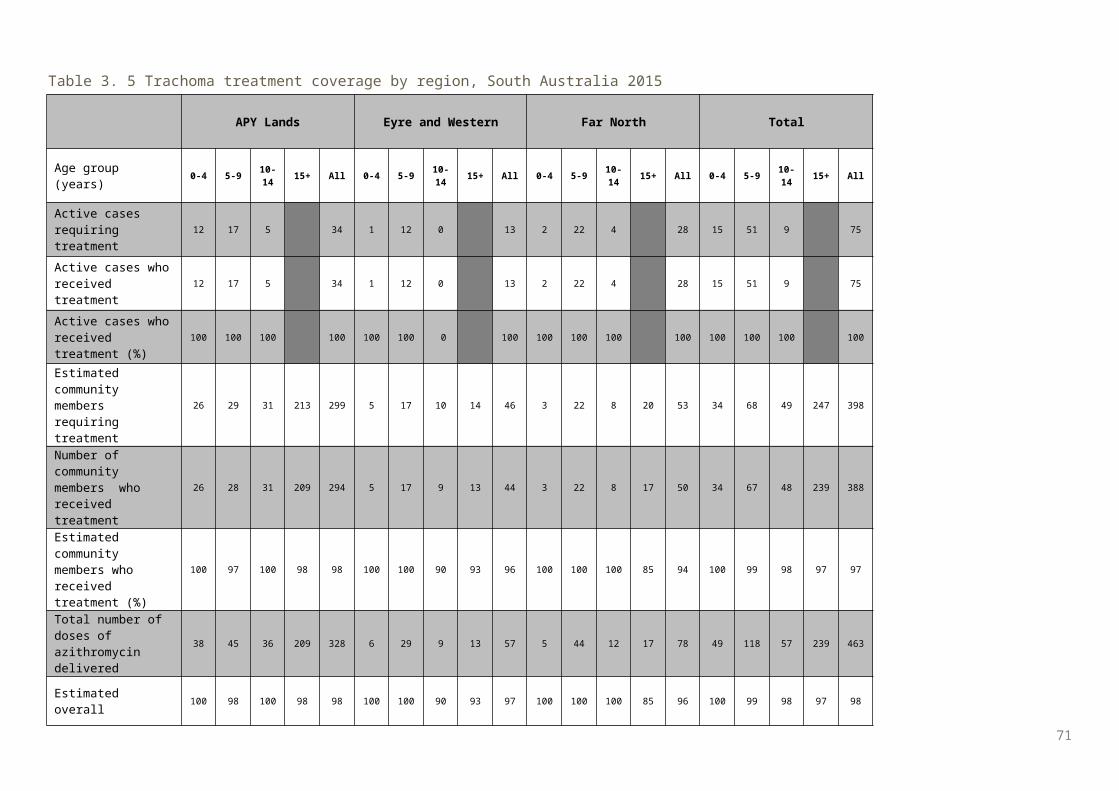
Table 4. 4 Treatment strategies by region*, Western Australia 2015
Number of communities Goldfields Kimberley Midwest Total
Required treatment for trachoma 3 3 4 10
Treated for trachoma 3 3 4 10
Screened and treated 2 2 3 7
Received treatment only 1 1 1 3
Received six-monthly treatment 0 0 1 1
Did not require treatment 6 21 4 31
Treated active cases and households 1 2 2 5
Treated the whole of community 2 1 2 5
Not treated according to CDNA guidelines 0 0 0 0
* All 7communities in the Pilbara region did not require treatment.
71
Table 4. 5 Trachoma treatment coverage by region, Western Australia 2015
Goldfields Kimberley Midwest Total
Age group (years) 0-4 5-9 10-14 15+ All 0-4 5-9 10-
14 15+ All 0-4 5-9 10-14 15+ All 0-4 5-9 10-
14 15+ All
Active cases requiring treatment 0 4 1 5 0 0 2 2 1 14 2 17 1 18 5 24
Active cases who received treatment 0 4 1 5 0 0 2 2 1 14 2 17 1 18 5 24
Active cases who received treatment (%) 0 100 100 100 0 0 100 100 100 100 100 100 100 100 100 100
Estimated community members* requiring treatment
83 120 101 639 943 39 49 52 247 387 30 123 71 235 459 152 292 224 1121 1789
Number of community members * who received treatment
82 115 94 608 899 37 46 52 247 382 28 123 64 224 439 147 284 210 1079 1720
Estimated contacts who received treatment (%) 99 96 93 95 95 95 94 100 100 99 93 100 90 95 96 97 97 94 96 96
Total number of doses of azithromycin delivered 82 119 95 608 904 37 46 54 247 384 29 137 66 224 456 148 302 215 1079 1744
Estimated overall treatment coverage (%) 99 96 93 95 95 95 94 100 100 99 94 100 90 95 96 97 97 94 96 96
* Includes household contacts and community members requiring/receiving MDA
72
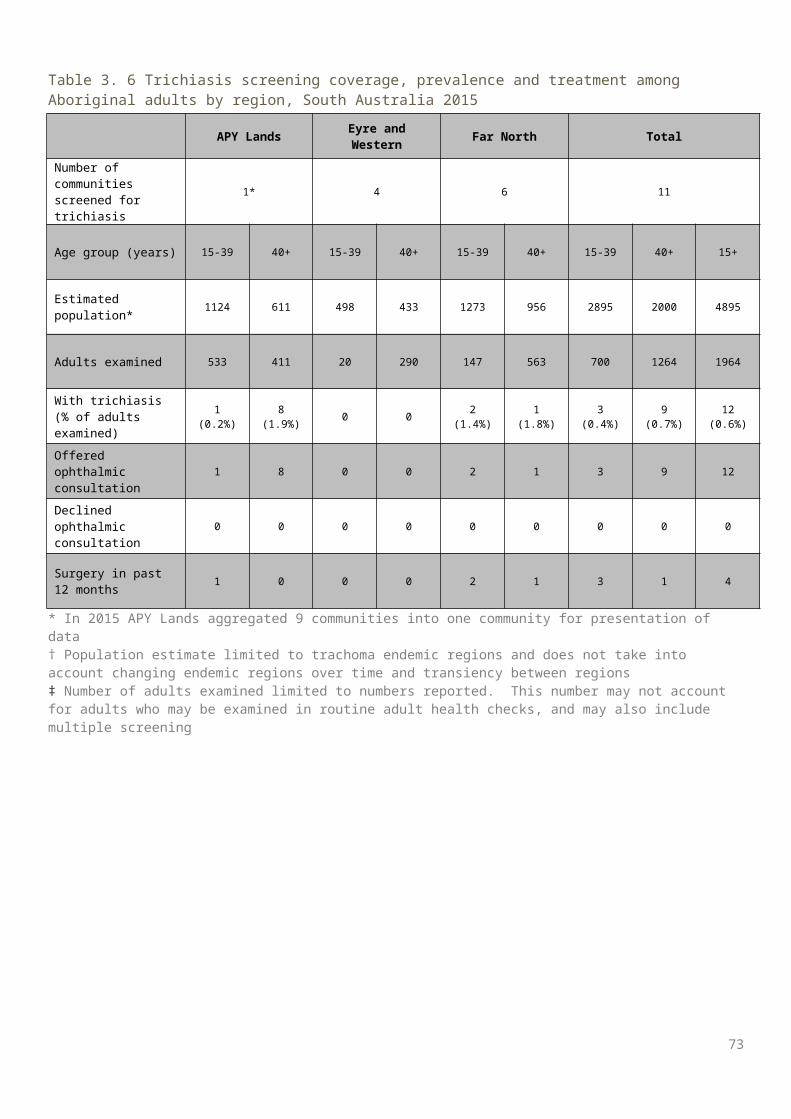
Table 4. 6 Trichiasis screening coverage, prevalence and treatment among Aboriginal adults by region, Western Australia 2015
Goldfields Kimberley Midwest Pilbara Total
Number of communities screened for trichiasis 7 4 8 6 25
Age groups 15-39 40+ 15-39 40+ 15-39 40+ 15-39 40+ 15-39 40+ 15+
Estimated population in region * 1265 818 3011 1729 363 279 1418 760 6057 3586 9643
Adults examined 260 371 61 143 43 159 110 137 474 810 1284
With trichiasis (% of adults examined) † 0 0 0 6 (4%) 0 1 (0.6%) 0 0 0 7 (0.9%) 7 (0.5%)
Offered ophthalmic consultation 0 0 0 6 0 2 0 0 0 8 0
Declined ophthalmic consultation 0 0 0 0 0 2 0 0 0 2 0
Surgery in past 12 months 0 0 0 6 0 0 0 0 0 6 0
* Population estimate limited to trachoma endemic regions and does not take into account changing endemic regions over time and transiency between regions† Number of adults examined limited to numbers reported. This number may not account for adults who may be examined in routine adult health checks, and may also include multiple screening
73
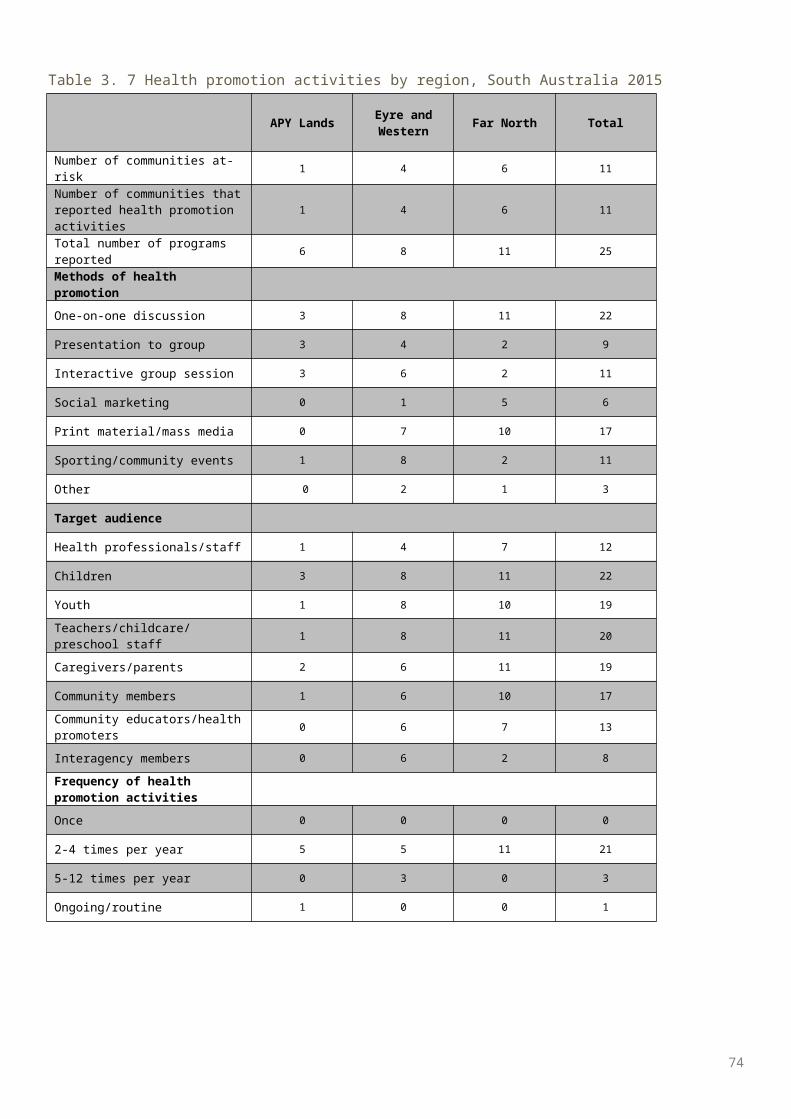
Table 4. 7 Health promotion activities by region, Western Australia 2015
Goldfields Kimberley Midwest Pilbara TotalNumber of communities at-risk 10 24 8 7 49Number of communities that reported health promotion activities
9 24 8 8 49
Total number of programs reported 36 30 36 34 136
Methods of health promotionOne-on-one discussion 2 10 0 3 15
Presentation to group 2 19 36 4 62
Interactive group session 6 1 14 58
Social marketing 0 0 0 0 0
Print material/mass media 16 4 36 4 61
Sporting/community events 6 0 0 6 12
Other 14 1 0 6 21
Target audience
Health professionals/staff 2 0 0 1 3
Children 35 26 36 34 131
Youth 7 0 0 6 13
Teachers/childcare/preschool staff 0 17 36 11 64
Caregivers/parents 16 2 0 5 23
Community members 2 5 0 4 11
Community educators/health promoters
0 0 0 0 0
Interagency members 0 0 0 0 0
Frequency of health promotion activitiesOnce 0 21 0 0 21
2-4 times per year 36 9 36 34 115
5-12 times per year 0 0 0 0 0
Ongoing/routine 0 0 0 0 0
74
New South Wales Results
Trachoma program coverage NSW undertook follow-up screening in one community in the Western region NSW (Table 5.1, Table 5.2,
Figure 5.1).
Screening coverage Population screening coverage for trachoma in children aged 5-9 years was 65% (Table 5.1).
Clean face prevalence The overall prevalence of clean faces among children aged 5-9 years in the screened community was 89%
(Table 5.1).
Trachoma prevalence The prevalence of trachoma in children aged 5-9 years screened was 0% (Table 5.1).
Treatment delivery and coverage No treatment was required in 2015.
Trichiasis Trichiasis screening was not required to be undertaken in 2015.
Health Promotion Health promotion activities were not provided in 2015 as part of the NSW trachoma mapping exercise.
75
Figure 5. 1 Number of at-risk communities screened, treated or both for trachoma and trachoma prevalence in children aged 5-9 years, New South Wales 2015
76
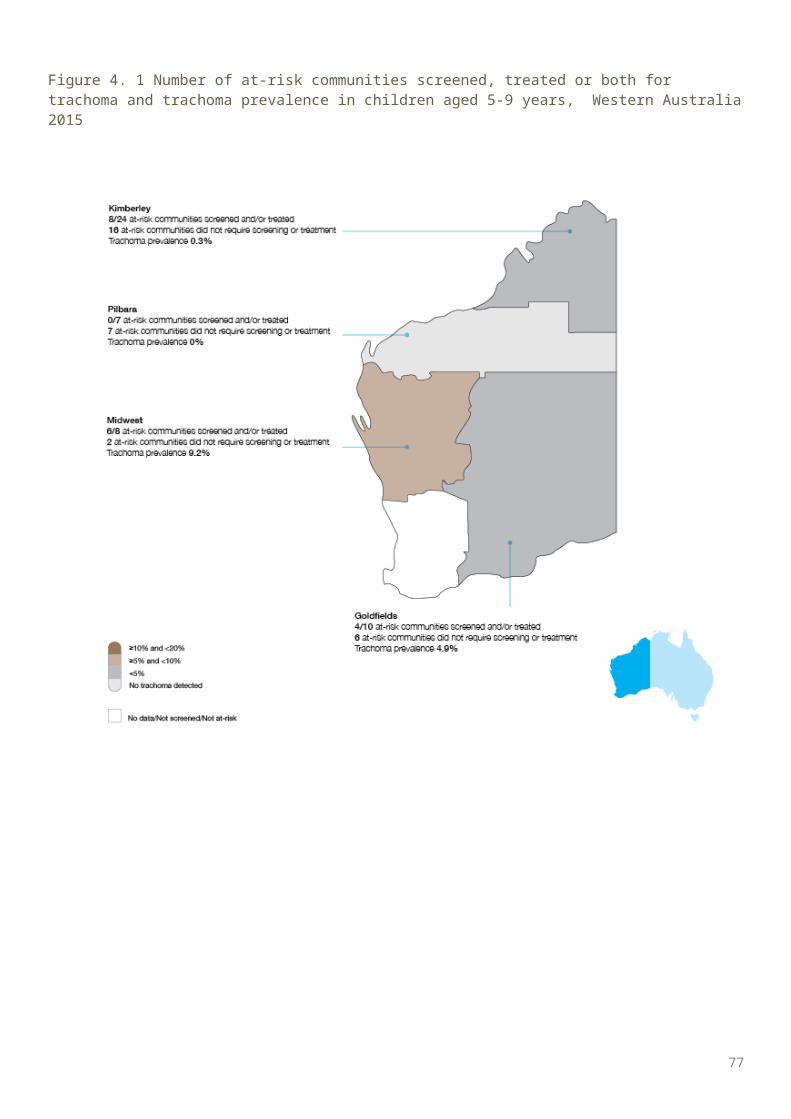
Table 5. 1 Trachoma screening coverage, trachoma prevalence and clean face prevalence in children aged 5-9 years, Western New South Wales 2015
Western NSW
Number of communities screened
1
Age group (years) 5-9
Children examined for clean face 27
Children with clean face 24
Clean face prevalence (%) 89
Estimated number* of Aboriginal children in communities
40
Children examined for trachoma 26
Trachoma screening coverage (%)
65
Children with active trachoma 0
Active trachoma prevalence (%) 0
77
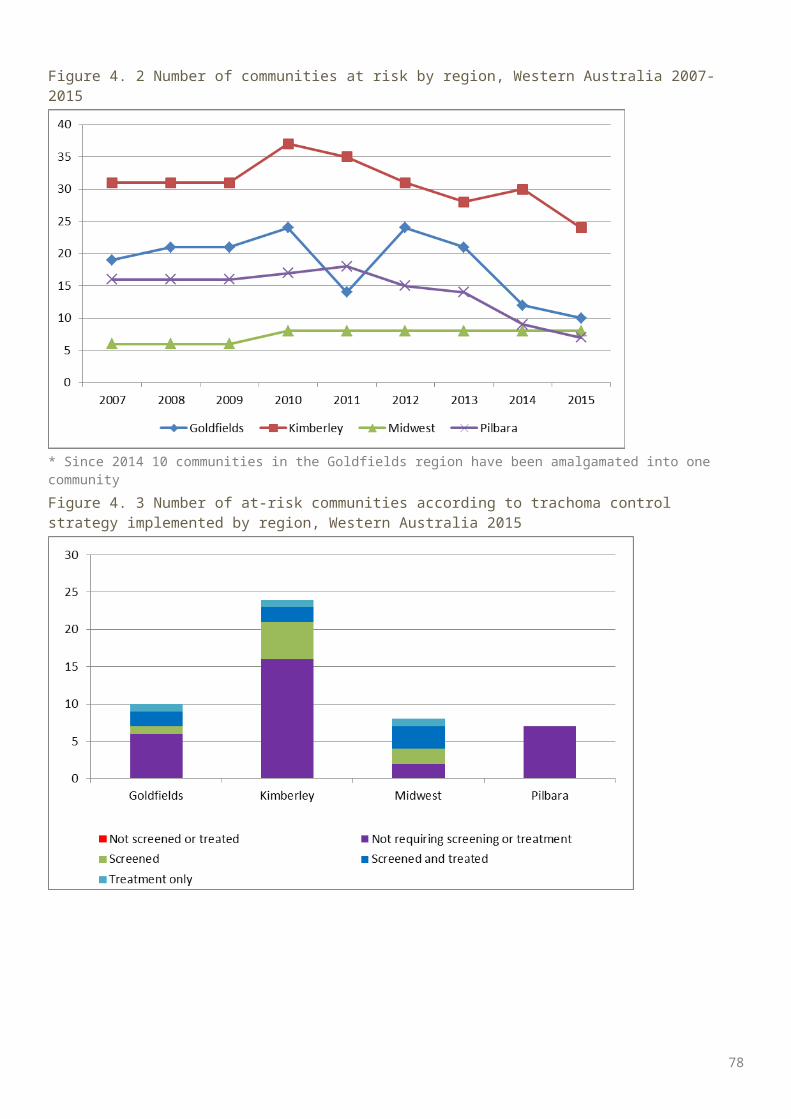
Table 5. 2 Number and proportion of at-risk communities according to level of trachoma prevalence in children aged 5-9 years, New South Wales 2013-2015
2013 2014 2015
Total number of communities screened 10 10 1
Number of communities No. % No. % No. %
Trachoma Prevalence ≥20% 0 0% 0 0% 0 0%
Trachoma Prevalence ≥10% but <20% 0 0% 0 0% 0 0%
Trachoma Prevalence ≥5% but <10% 1 10% 0 0% 0 0%
Trachoma Prevalence >0% but <5% 0 0% 0 0% 0 0%
Trachoma Prevalence = 0% 9 90% 10 100% 1 100%
78
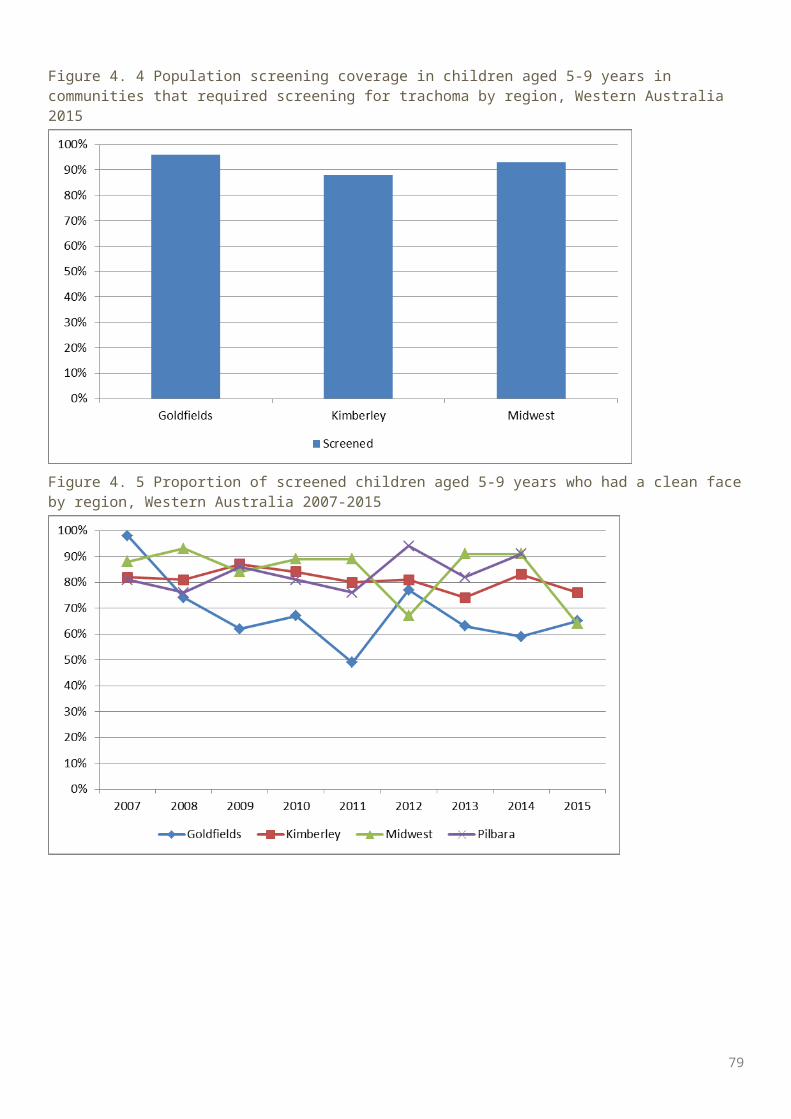
Discussion
Screening coverageScreening coverage was measured as both the proportion of at-risk communities screened and the proportion of children aged 5-9 years screened in at-risk communities. A higher screening coverage provides confidence that those screened are representative of the community at risk therefore providing a more accurate reflection of the prevalence of disease within the community. The revised 2014 National guidelines for the public health management of trachoma in Australia 1 directs communities to focus resources on treatment without annual screening where trachoma prevalence is already well established. Communities with non-endemic levels of trachoma are not required to screen annually, unless resources are available to do so. In response to the 2014 revised guidelines, the annual report has shifted focus from screening coverage to the extent of implementation of the guidelines with respect to screening, treatment and health promotion activities. For communities that undertake screening for trachoma, the guidelines recommend screening coverage of 85%. Screening for trachoma is predominantly undertaken through primary school-based initiatives where the focus is on those aged 5-9 years. Screening of older (10-14 years) and younger (0-4 years) children also takes place, but less consistently and treatment strategies are informed by the prevalence in children aged 5-9 years. In 2015, population estimates provided by jurisdictions were used to calculate proportions. In 2015, 89% of communities in all regions that required screening for trachoma received screening, with SA and WA screening all required communities. All regions except East Arnhem and Darwin Rural achieved 85% or over screening coverage with a national coverage level of 90%. This figure however does not include population numbers from communities that were required to be screened but were not screened in 2015.The number of communities at risk of trachoma has decreased marginally in the NT and SA, and more substantially in WA in 2015. Since 2008, 80 communities have been removed from the at-risk register. This figure does not include communities that have been amalgamated in the WA and SA. Figure 1.8 illustrates more than 25 communities have reached the threshold for being considered no longer at risk for trachoma. Jurisdictions will assess other factors including known mobility patterns of the population with areas that are hyperendemic, to establish if these communities should be removed from the at-risk register. It is expected that this decreasing trend will continue in future years. The Trachoma Surveillance and Control Reference Group (TSCRG) will formulate advice on the ongoing monitoring of communities that were previously at risk.
Trachoma prevalenceEndemic trachoma is defined by the WHO as a prevalence of active trachoma of 5% or greater in children aged 1-9 years. Previously the National Trachoma Surveillance and Reporting Unit (NTSRU) had been able to estimate the prevalence using population weights. Due to the limited screening coverage of the children aged 1-4 years, it was considered that the results reported were not representative of that age group.Across all three jurisdictions, the prevalence of trachoma in all at-risk communities in children aged 5-9 years was 4.6%, a slight decrease from 4.7% in 2014. At a regional level in 2015, the prevalence of trachoma in children aged 5-9 years ranged from 0 % in the Pilbara in the WA (carried forward from 2014) to 12.7% in the Alice Springs Remote region in the NT. The observed trachoma prevalence in communities that were screened in 2015 was 3.8%.Trachoma prevalence in 2015 has slightly increased in SA and decreased marginally in the NT and WA. At the regional level, notable increases in prevalence were recorded in the Eyre and Western (SA), Far North (SA), and Midwest (WA) regions. In interpreting these changes it is important to keep in mind that many of the communities have small populations that are highly mobile. Therefore, fluctuations in rates at the community level can occur for statistical reasons or for mobility reasons. Anecdotal evidence from SA suggests the unexpected increase in trachoma prevalence in the Far North region occurred directly due to population movement between communities in the NT and SA. The continued need for health promotion programs that focus on facial cleanliness and environmental improvements may also be a contributing factor, including in communities that have high contact
79
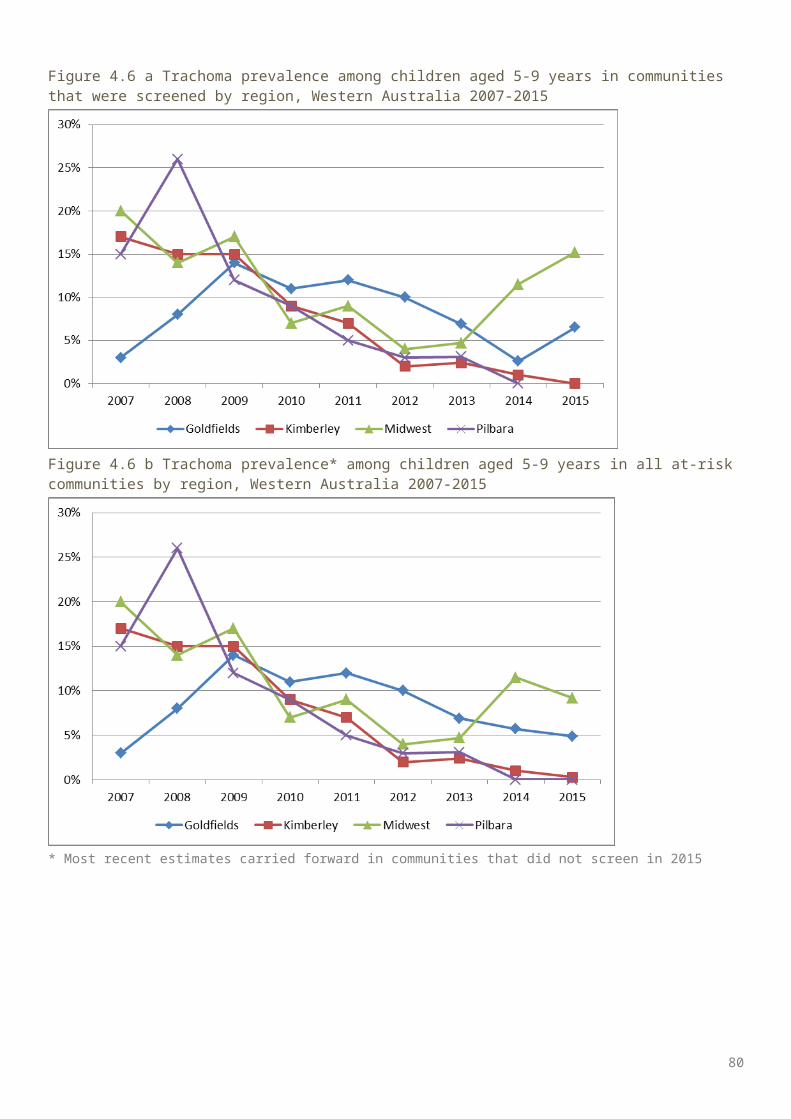
with other communities that are endemic, or communities previously at risk of trachoma. The TSCRG will continue to monitor changes in trachoma prevalence and consider the impact of possible variables. Nevertheless, the ongoing presence of trachoma in many communities is a timely reminder of the need for all jurisdictions to maintain their commitment to national control strategies in all of their aspects. Given the potential for re-infection to occur through movement between communities, the TSCRG will decide on strategic measures to implement for targeting the impact of mobility between communities and regions, which may include regional groupings of communities. The NSTRU and TSCRG will also endeavour to determine the most appropriate manner in which to monitor environmental conditions and improvements.Australia has seen great gains in the increasing number of communities recording less than endemic rates of trachoma (a prevalence of under 5% over time). In 200819, 27 of the 121 communities screened recorded a prevalence of less than 5%, and in 2015 this number increase to 97 communities of the 139 at-risk communities. Conversely the number of communities recording hyperendemic levels (greater than 20%) of trachoma has also decreased notably from 54 communities in 200819 to 16 in 2015.
Trachoma treatmentThe 2014 CDNA guidelines recommend the treatment of active cases and their household contacts when trachoma prevalence is under 5% (non-endemic levels). When prevalence is greater than 5% in children aged 5-9 years and cases are not clustered within a few households, community-wide treatment is recommended. This approach includes treatment to all people living in households with children younger than 15 years of age annually for a period of three years. The guidelines also recommend six-monthly treatments over a period of three years for all people living in households with children younger than 15 years of age in hyperendemic communities (prevalence of at least 20% in children aged 5-9 years).
TrichiasisPrevious annual trachoma reports have described trichiasis screening coverage. The previous at-risk population was estimated using the current year’s trachoma at-risk community adult population; however this does not account for changing endemic areas that have occurred over time, and transiency into non-endemic regions. It was therefore decided that estimating an at-risk population for trichiasis is not feasible as it cannot capture the actual potential risk for trichiasis. The number of adults aged 40 years and older reported to be screened for trichiasis decreased in 2015, with 4544 reported in 2015 and 5151 screened in 2014. Screening for trichiasis is believed to be greatly under-reported. Of the adults aged 40 years and older who were screened, 0.9% (39/4544) prevalence levels of trichiasis were reported. In 2015, 16 cases of trichiasis surgery were reported in Australia, with six in the NT, four in SA and six in WA. These cases may have been identified from previous years’ screening activities. The reporting of trichiasis data regarding referral and surgery undertaken is limited due to incomplete data collection and compilation.
Facial cleanlinessPromoting facial cleanliness is a component of the SAFE strategy, recognising that the presence of nasal and ocular discharge is significantly associated with the risk for acquiring, transmitting and potential presence of trachoma. The proportion of screened children aged 5-9 years who had clean faces increased marginally in the NT and decreased in SA and WA. For sustainable trachoma control greater focus and efforts are required in environmental condition improvements and health promotion to increase facial cleanliness and decrease the risk of transmission of disease.
Program delivery and monitoringImprovements in program delivery have been reported in 2015 with all jurisdictions committing to the updated guidelines, which have strengthened the trachoma control program planning in all jurisdictions by reducing ambiguity experienced in previous guidelines and providing clear guidance on screening and treatment methods. The impact of the new strategies - in particular treatment and screening schedules -, may not be evident for several years.
80
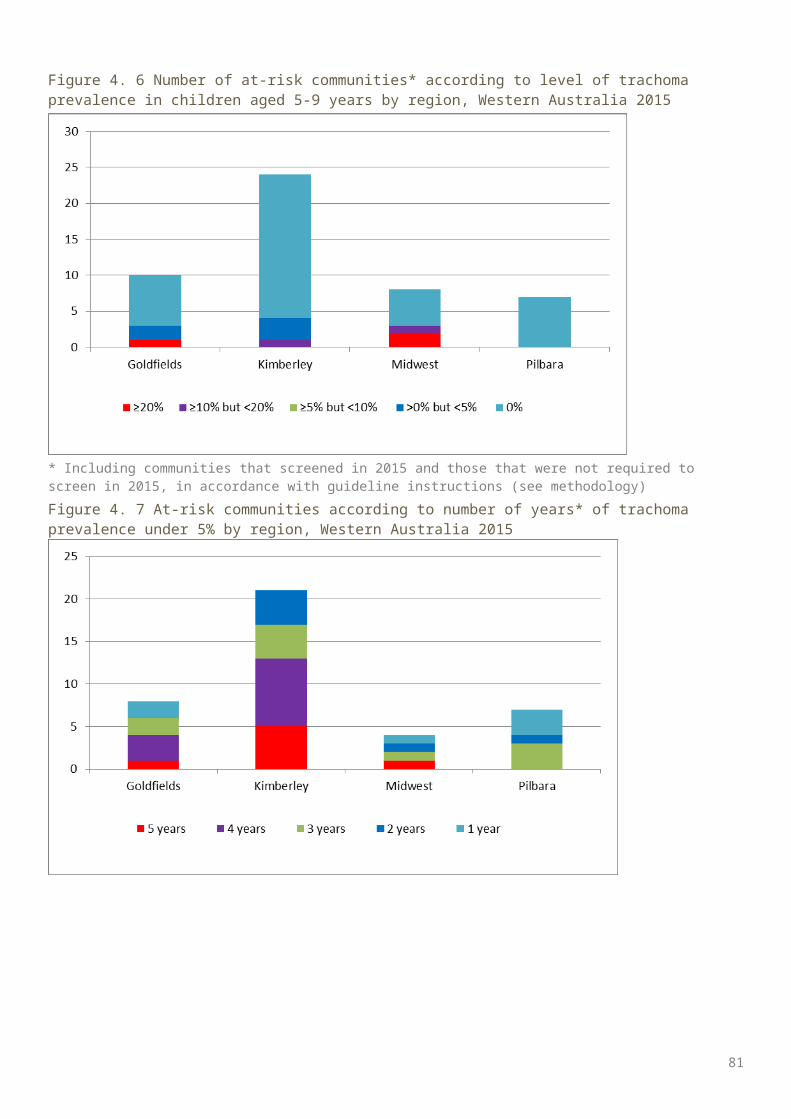
Progress towards Australia’s elimination targetIn April 2016, the annual global meeting of the partnership known as GET 2020 (the World Health Organization Alliance of the Global Elimination of Blinding Trachoma by the Year 2020) took place in Sydney, occurring for the first time in the Southern Hemisphere. The meeting reminded participants that trachoma is a disease of poverty and there is a strong expectation that Australia, as a high-income country, will ensure that trachoma is eliminated from affected communities.The Australian Government’s commitment to elimination of trachoma continues, with funding provided to jurisdictions to deliver rigorous trachoma screening and treatment programs and to evaluate the outcomes of these programs.. Australia has made significant progress and is on track to meet the WHO goal of eliminating trachoma by 2020. The current focus on screening and treatment will need to continue to ensure that trachoma remains controlled and prevalence rates continue to decrease. In addition, the NTSCRG has highlighted the need to increase activity in the areas of health hygiene promotion and environmental improvements to address the Facial Cleanliness and Environmental improvements elements of the SAFE strategy. These key activities are essential to achieve elimination of trachoma by 2020 and receive WHO validation. The NTSCRG will continue to provide guidance on the next phase of trachoma control activity to ensure that efforts are focussed where they are needed and will have maximum impact. The NTSRU will continue to work with service providers in affected jurisdictions to monitor the impact of trachoma control activity and progress toward elimination.
81
Appendix
Appendix 1. WHO trachoma grading card
82
83
Appendix 2. Trachoma surveillance summary forms
TI: Trachomatous inflammation - intense TF: Trachomatous inflammation - follicular TS: Trachomatous scarring
84
85

86
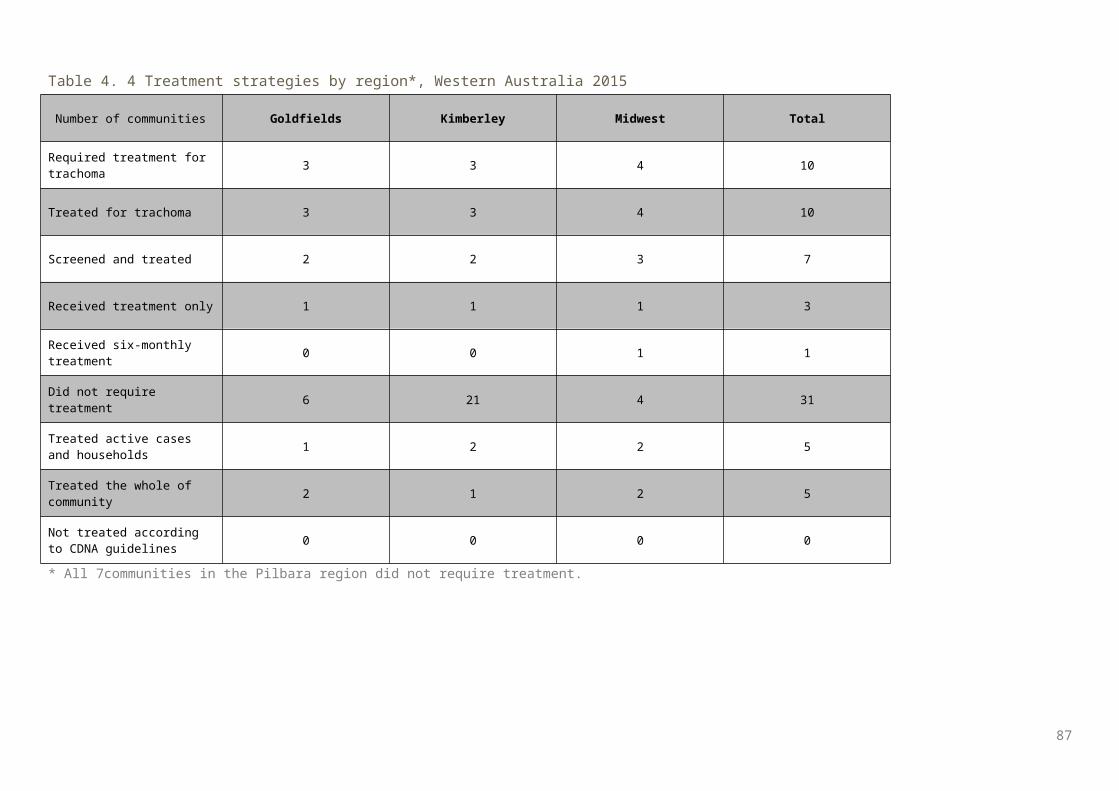
87
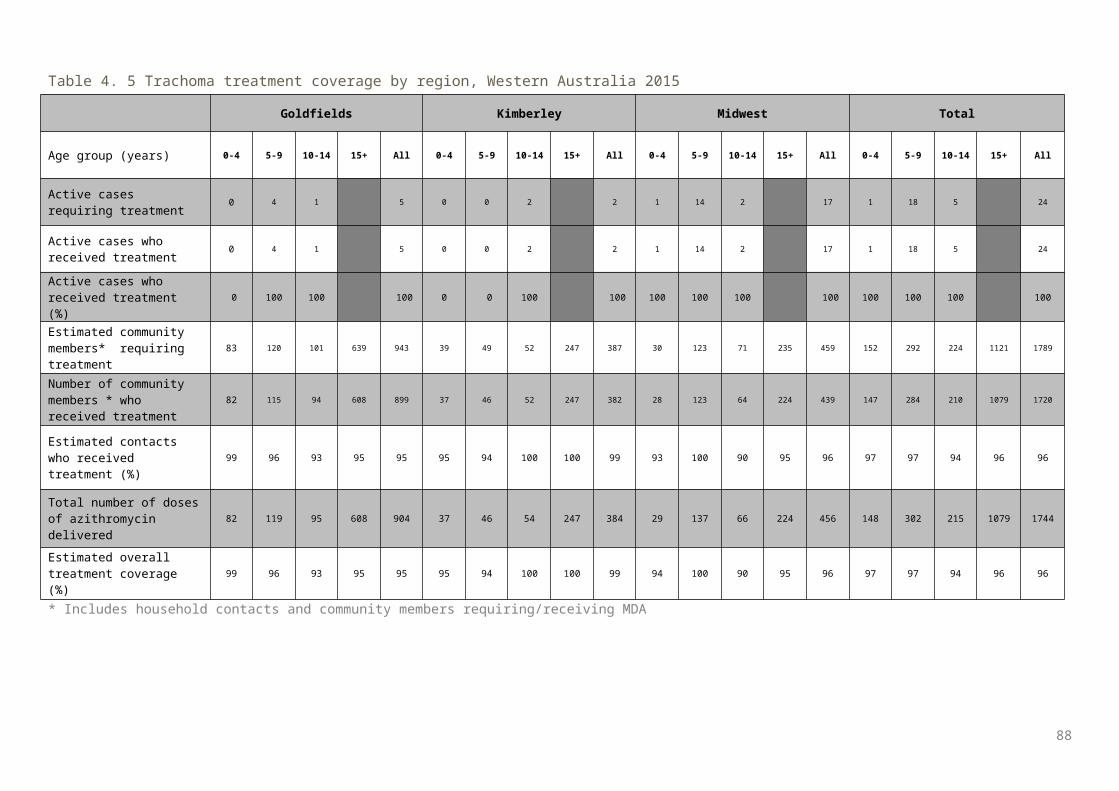
Appendix 3. De-identified community trachoma prevalence trends by regions, Australia, 2007-2015
Figure A. 1 Trachoma prevalence of screened children aged 5-9 years by year and de-identified community * in North Alice Springs Remote region, Northern Territory, 2007-2015
* Where more than 5 children were screened
Figure A. 2 Trachoma prevalence of screened children aged 5-9 years by year and de-identified community * in South Alice Springs Remote region, Northern Territory, 2007-2015
* Where more than 5 children were screened
88
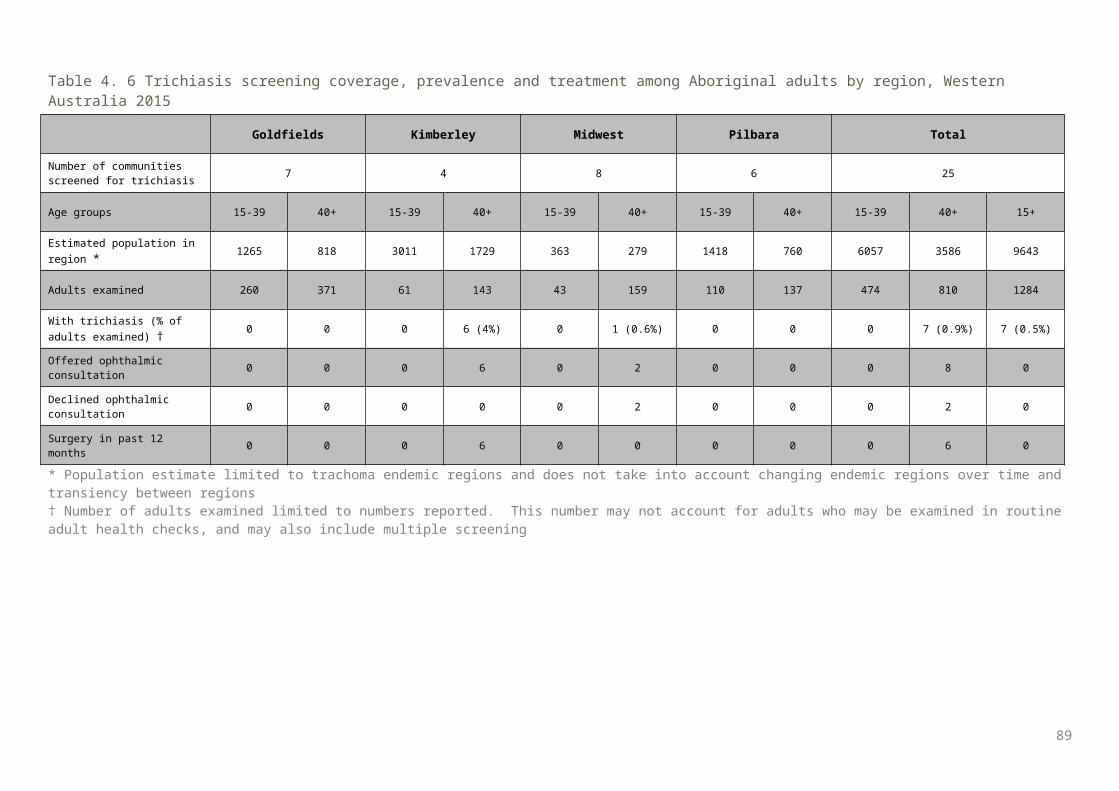
Figure A. 3 Trachoma prevalence of screened children aged 5-9 years by year and de-identified community* in Barkly region, Northern Territory, 2007-2015
* Where more than 5 children were screened
Figure A. 4 Trachoma prevalence of screened children aged 5-9 years by year and de-identified community* in Darwin Rural region, Northern Territory, 2007-2015
* Where more than 5 children were screened
89
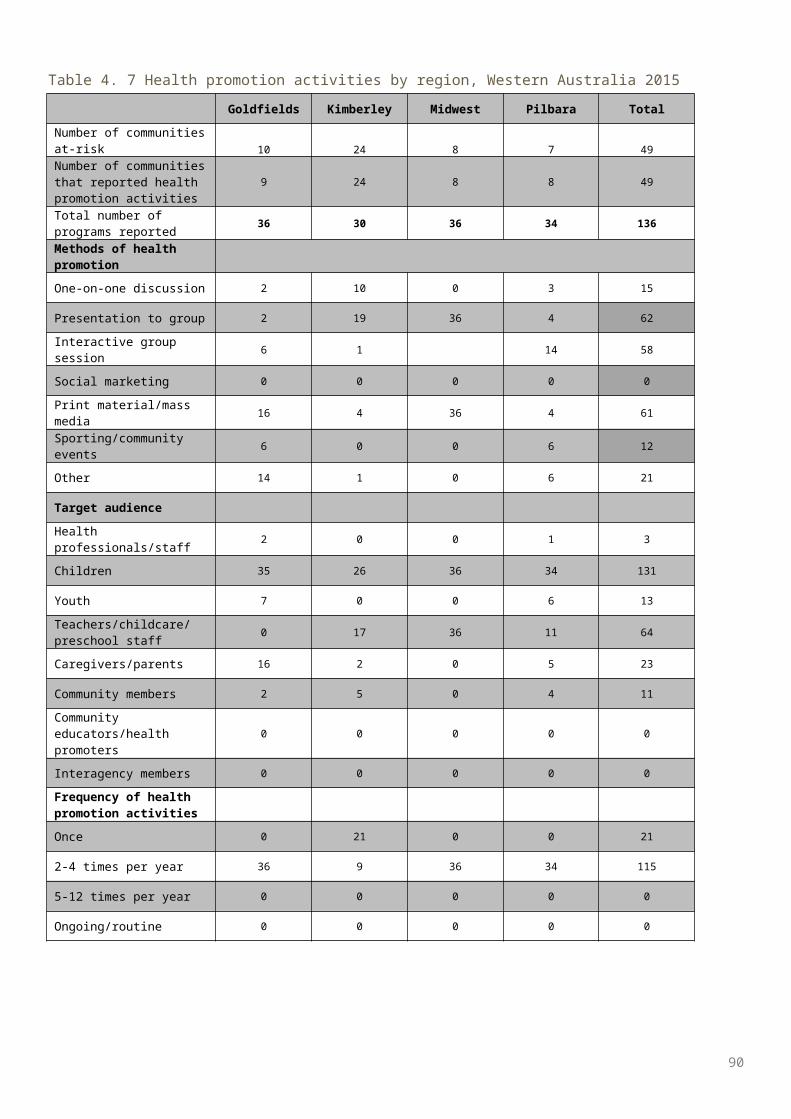
Figure A. 5 Trachoma prevalence of screened children aged 5-9 years by year and de-identified community* in East Arnhem region, Northern Territory, 2007-2015
* Where more than 5 children were screened
Figure A. 6 Trachoma prevalence of screened children aged 5-9 years by year and de-identified community* in Katherine region, Northern Territory, 2007-2015
* Where more than 5 children were screened
90
Figure A. 7 Trachoma prevalence of screened children aged 5-9 years by year and de-identified community* in APY Lands region, South Australia, 2007-2015
* Where more than 5 children were screened
Figure A. 8 Trachoma prevalence of screened children aged 5-9 years by year and de-identified community* in Eyre and Western region, South Australia, 2007-2015
* Where more than 5 children were screen
91
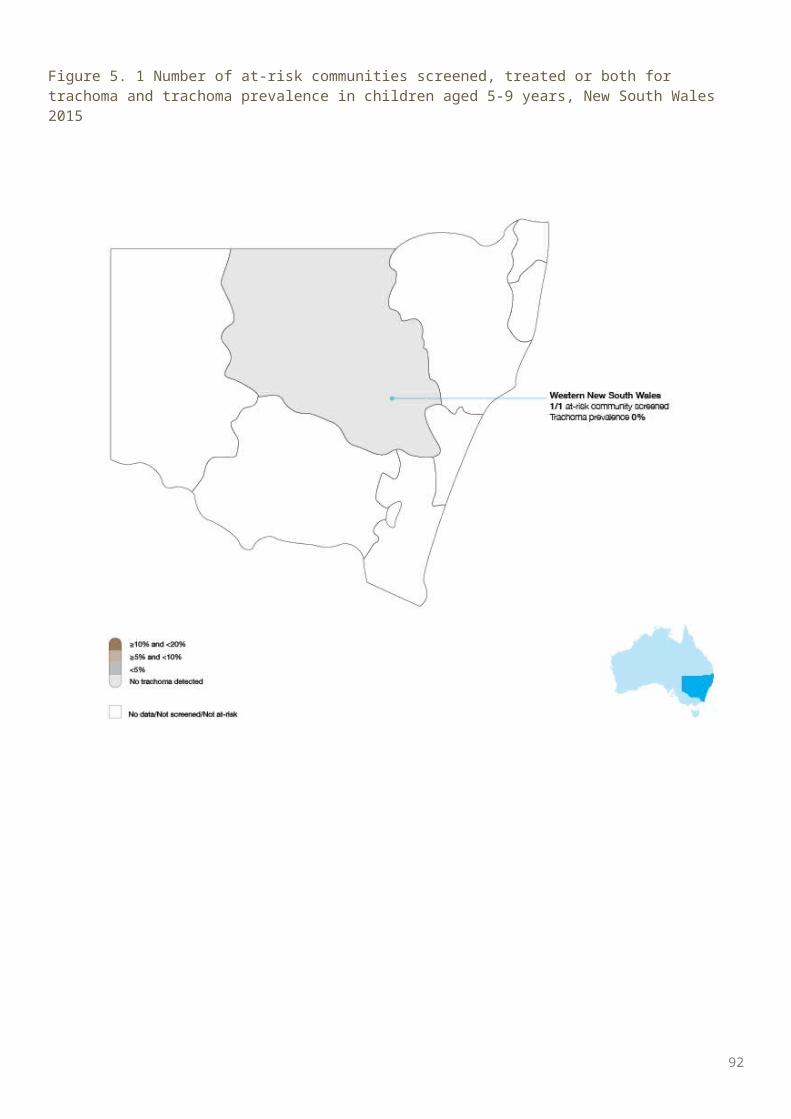
Reference List
92
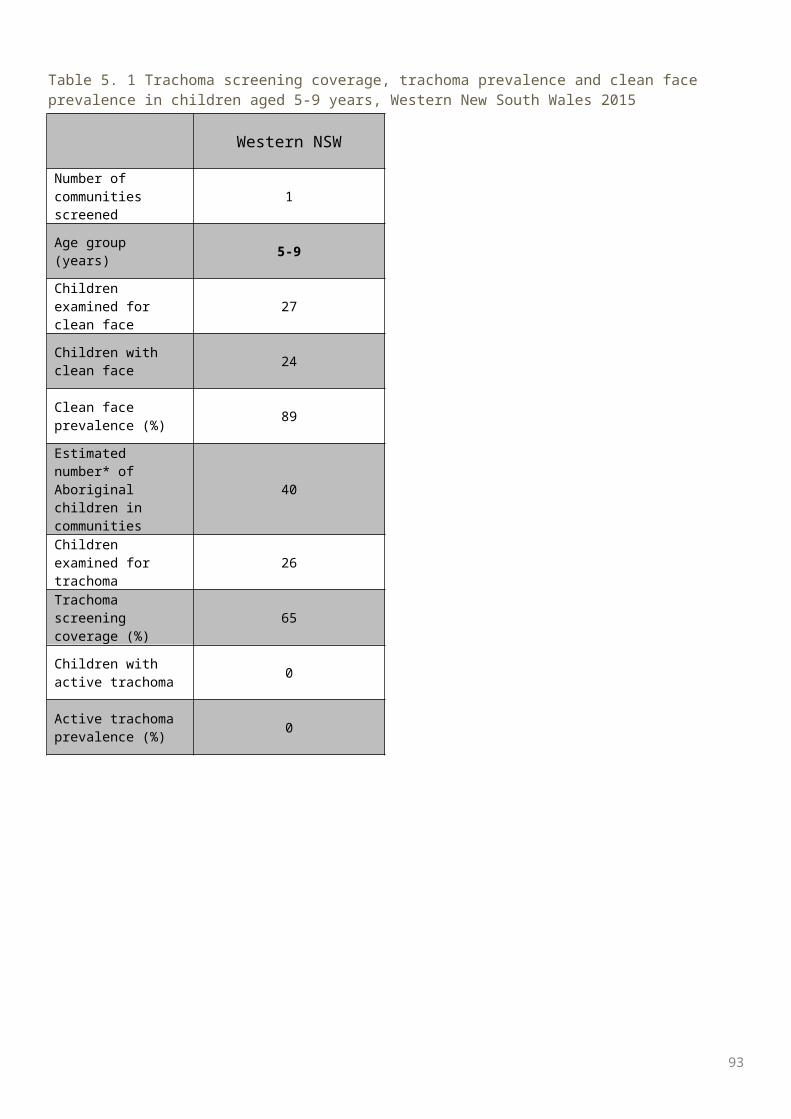
11. Communicable Diseases Network Australia. National guidelines for the public health management of trachoma in Australia. January 2014. Canberra: Commonwealth of Australia; 2014. Available at: http://www.health.gov.au/internet/main/publishing.nsf/Content/cdna-song-trachoma.htm (last accessed 17 June 2015).2. World Health Organization. Global WHO Alliance for the Elimination of Blinding Trachoma by 2020. Wkly Epidemiol Rec 2012;87(17):161-8.3. West SK and Courtright P. Trachoma Control: 14 Years Later. Ophthalmic Epidemiology 2015, 22:3, 145-147.4 Burki T. The broad benefits of trachoma elimination. The Lancet Volume 16, Issue 5, May 2016, 530–5315. Taylor HR. Trachoma: a blinding scourge from the Bronze Age to the Twenty First Century. Melbourne: Centre for Eye Research Australia; 2008.6. Polack S, Brooker S, Kuper K, Mariotti S, Mabey D, Foster A. Mapping the global distribution of trachoma. Bull World Health Organization 2005;80(12):913-9.7.. World Health Organization. Trichiasis surgery for trachoma. Geneva: WHO; 2013. Available at: http://apps.who.int/iris/bitstream/10665/101430/1/9789241548670_eng.pdf (last accessed 3 August 2014).8.. World Health Organization. Future approaches to trachoma control – report of a global scientific meeting. 17-20 June 1996. Geneva: WHO; 1997.9. Mariotti SP, Pararajasegaram R, Resnikoff S. Trachoma: looking forward to global elimination of trachoma by 2020 (GET 2020). Am J Trop Med Hyg 2003;69(5 Suppl):33-5.10. World Health Organization. Report of the 2nd global scientific meeting on trachoma. 25‐27 August 2003. Geneva: WHO; 2003.11. World Health Organization. Trachoma control: a guide for programme managers. Geneva: WHO; 2008.12. Taylor HR, Fox SS, Xie J, Dunn RA, Arnold AL, Keeffe JE. The prevalence of trachoma in Australia: the National Indigenous Eye Health Survey. Med J Aust 2010;192(5):248-53.13. Australian Government. Budget 2013-14. Budget Paper No. 3 [Internet]. Canberra: Commonwealth of Australia; 2013. Available at: http://www.budget.gov.au/2013-14/content/bp3/html/bp3_03_part_2b.htm (last accessed 17 June 2015).14. Communicable Diseases Network Australia. Guidelines for the public health management of trachoma in Australia. March 2006. Canberra: Commonwealth of Australia; 2006.15. Cowling CS, Liu BC, Ward JS, Snelling TL, Kaldor JM, Wilson DP for the National Trachoma Surveillance and Reporting Unit. Australian Trachoma Surveillance Report 2011. Sydney: The Kirby Institute, UNSW Australia; 2012.16. Cowling CS, Liu BC, Snelling TL, Ward JS, Kaldor JM, Wilson DP for the National Trachoma Surveillance and Reporting Unit. Australian Trachoma Surveillance Report 2012. Sydney: The Kirby Institute, UNSW Australia; 2013.17. Cowling CS, Liu BC, Snelling TL, Ward JS, Kaldor JM, Wilson DP for the National Trachoma Surveillance and Reporting Unit. Australian Trachoma Surveillance Report 2013. Sydney: The Kirby Institute, UNSW Australia; 2014. Available at: http://www.health.gov.au/internet/main/publishing.nsf/Content/health-oatsih-pubs-trachreport (last accessed 18 June 2015).18. Tellis B, Dunn R, Keeffe JE for the National Trachoma Surveillance and Reporting Unit: Trachoma Surveillance Report 2006. Commun Dis Intell 2007;31:366–74.19. Tellis B, Dunn R, Keeffe JE, Taylor HR for the National Trachoma Surveillance and Reporting Unit. Trachoma Surveillance Annual Report, 2007. Commun Dis Intell 2008;32:388–99.
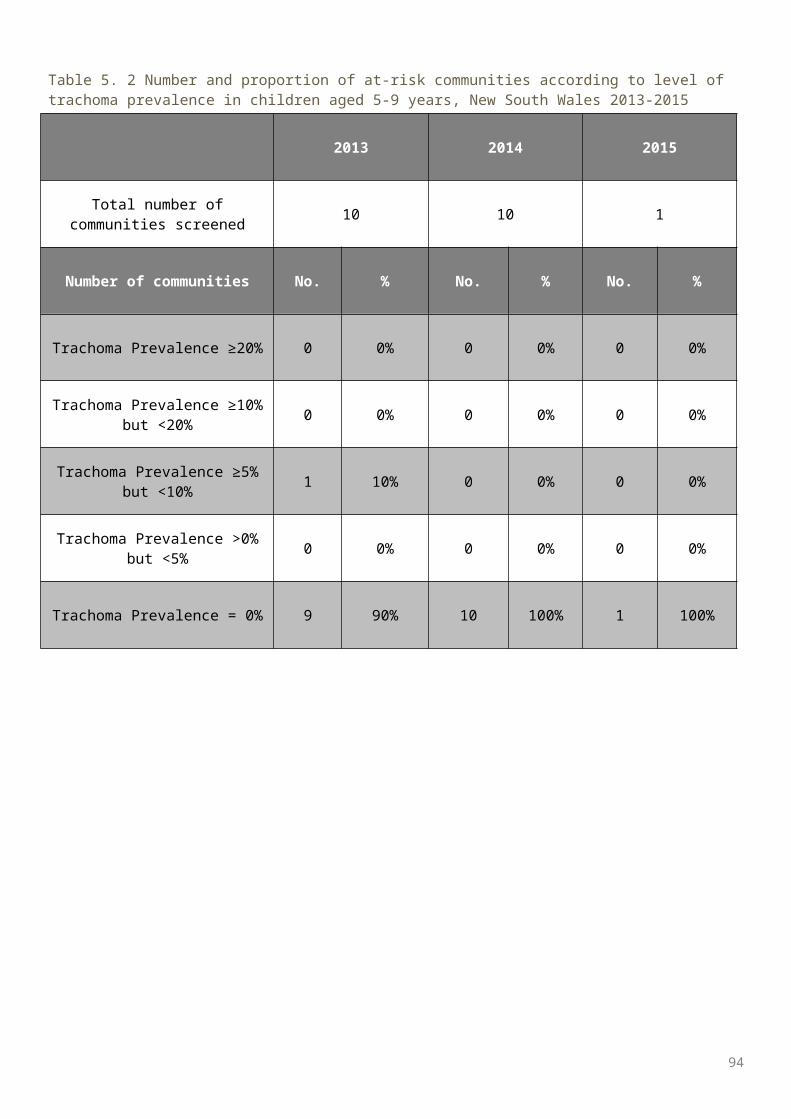
20. Tellis B, Fotis K, Dunn R, Keeffe JE, Taylor HR for the National Trachoma Surveillance and Reporting Unit. Trachoma Surveillance Report 2008. Melbourne: Centre for Eye Research Australia; 2009.21. Adams K, Burgess J, Dharmage S for the National Trachoma Surveillance and Reporting Unit. National Trachoma Surveillance Report 2009. Melbourne: Centre for Molecular, Environmental, Genetic and Analytic Epidemiology, University of Melbourne; 2010.