Australian Trachoma Surveillance Report 2014 › ... › $File ›...
84
Australian Trachoma Surveillance Report 2014 Edited by National Trachoma Surveillance and Reporting Unit
Transcript of Australian Trachoma Surveillance Report 2014 › ... › $File ›...
Australian Trachoma Surveillance Report
2014
Edited by National Trachoma Surveillance and Reporting Unit
www.health.gov.au
1131
7 N
ovem
ber 2
015
All information in this publication is correct as at November 2015
Australian Trachoma Surveillance Report 2014
ISSN 1839-2210
Suggested citation:Australian Trachoma Surveillance Report 2014. The Kirby Institute, UNSW Australia, Sydney NSW 2052.
© Commonwealth of Australia 2015
This report has been produced by the National Trachoma Surveillance Unit of The Kirby Institute for infection and immunity in society, UNSW Australia for the Australian Government Department of Health.
This work is copyright. You may reproduce the whole or part of this work in unaltered form for your own personal use or, if you are part of an organisation, for internal use within your organisation, but only if you or your organisation do not use the reproduction for any commercial purpose and retain this copyright notice and all disclaimer notices as part of that reproduction. Apart from rights to use as permitted by the Copyright Act 1968 or allowed by this copyright notice, all other rights are reserved and you are not allowed to reproduce the whole or any part of this work in any way (electronic or otherwise) without first being given the specific written permission from the Commonwealth to do so. Requests and inquiries concerning reproduction and rights are to be sent to the Communication Branch, Department of Health, GPO Box 9848, Canberra ACT 2601, or via e-mail to [email protected].
This publication is available at Internet address http://www.kirby.unsw.edu.au/trachoma
The Kirby Institute Wallace Wurth Building, UNSW Australia, Sydney NSW 2052
Telephone: 02 9385 0900 Facsimile: 02 9385 0920 International prefix: 61 2 Email: [email protected]
Australian Trachoma Surveillance Report 2014
The Kirby Institute, UNSW Australia June 2015
Prepared by the National Trachoma Surveillance and Reporting Unit, The Kirby Institute, UNSW Australia.
List of Tables 3
List of Figures 4
Acknowledgements 6
Technical terms and definitions 8
Abbreviations 9
Executive summary 10
Background 12
Methodology 14
Results 17
National results 2014 17
Northern Territory results 2014 26
South Australia results 2014 39
Western Australia results 2014 49
New South Wales results 2014 60
Discussion 64
Reference list 66
Appendix 1: World Health Organization trachoma grading card 68
Appendix 2: Trachoma surveillance summary forms 70
Appendix 3: De‑identified community trachoma prevalence trends by regions, Australia, 2007 – 2014 74
Contents
National Trachoma Surveillance Report 2014 3
Table 1.1 Trachoma control delivery, Australia, 2014 22
Table 1.2 Trachoma screening coverage, trachoma prevalence and clean face prevalence, Australia, 2014 23
Table 1.3 Treatment strategies, by jurisdiction, Australia, 2014 23
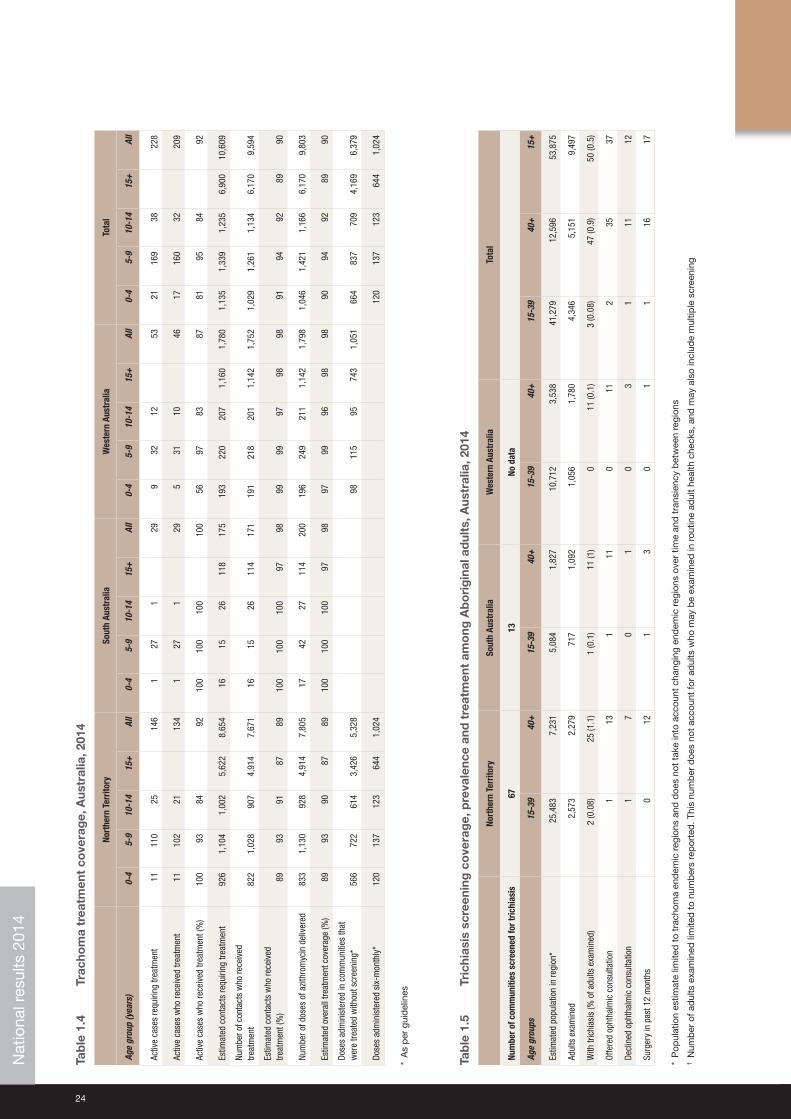
Table 1.4 Trachoma treatment coverage, Australia, 2014 24
Table 1.5 Trichiasis screening coverage, prevalence and treatment among Aboriginal adults, Australia, 2014 24
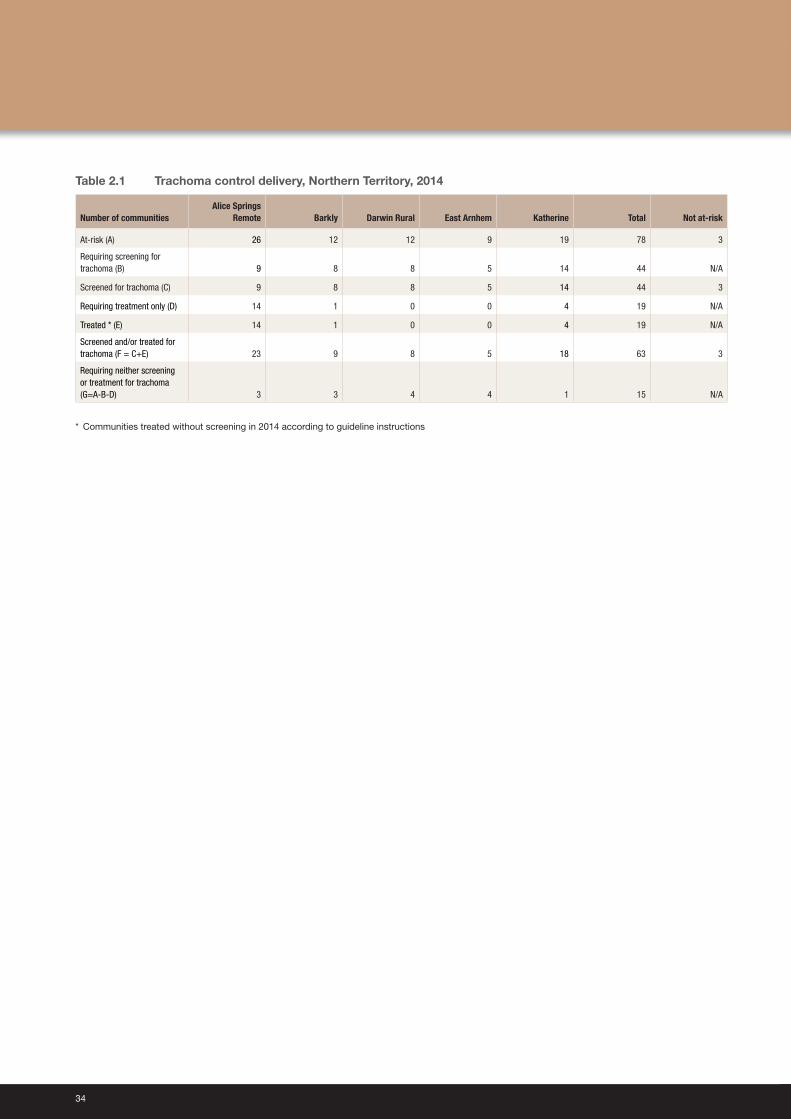
Table 2.1 Trachoma control delivery, Northern Territory, 2014 34
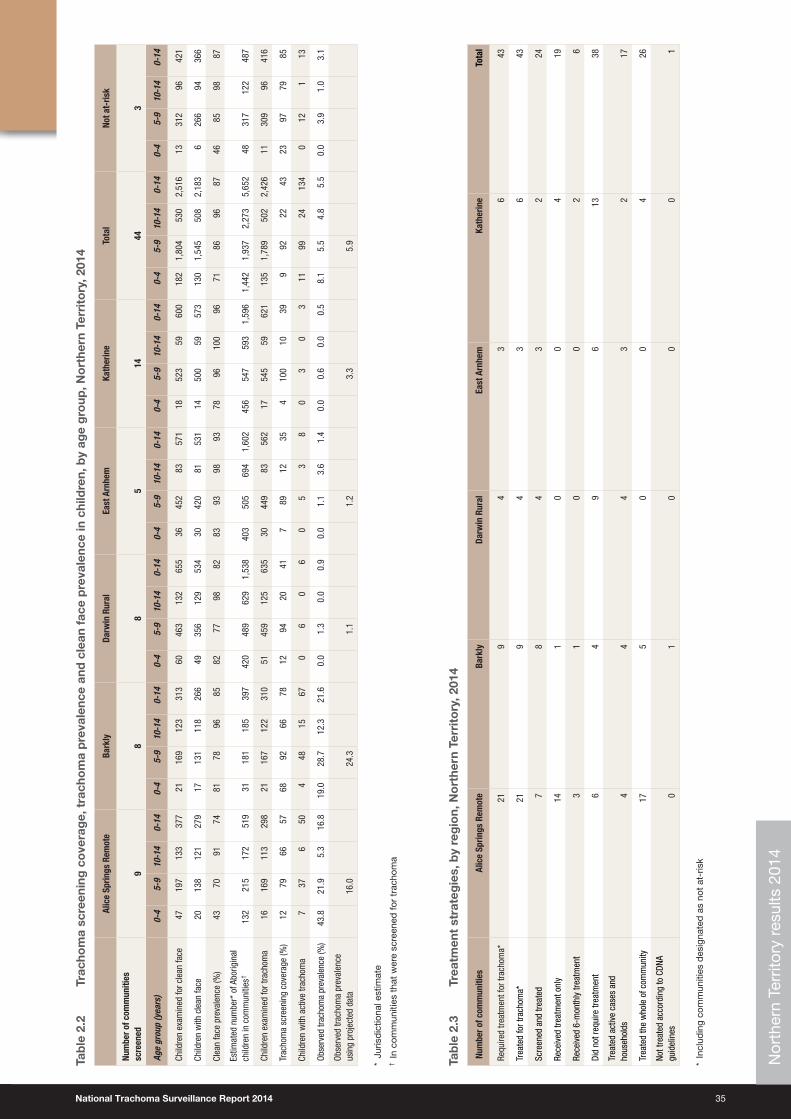
Table 2.2 Trachoma screening coverage, trachoma prevalence and clean face prevalence in children, by age group, Northern Territory, 2014 35
Table 2.3 Treatment strategies, by region, Northern Territory, 2014 35
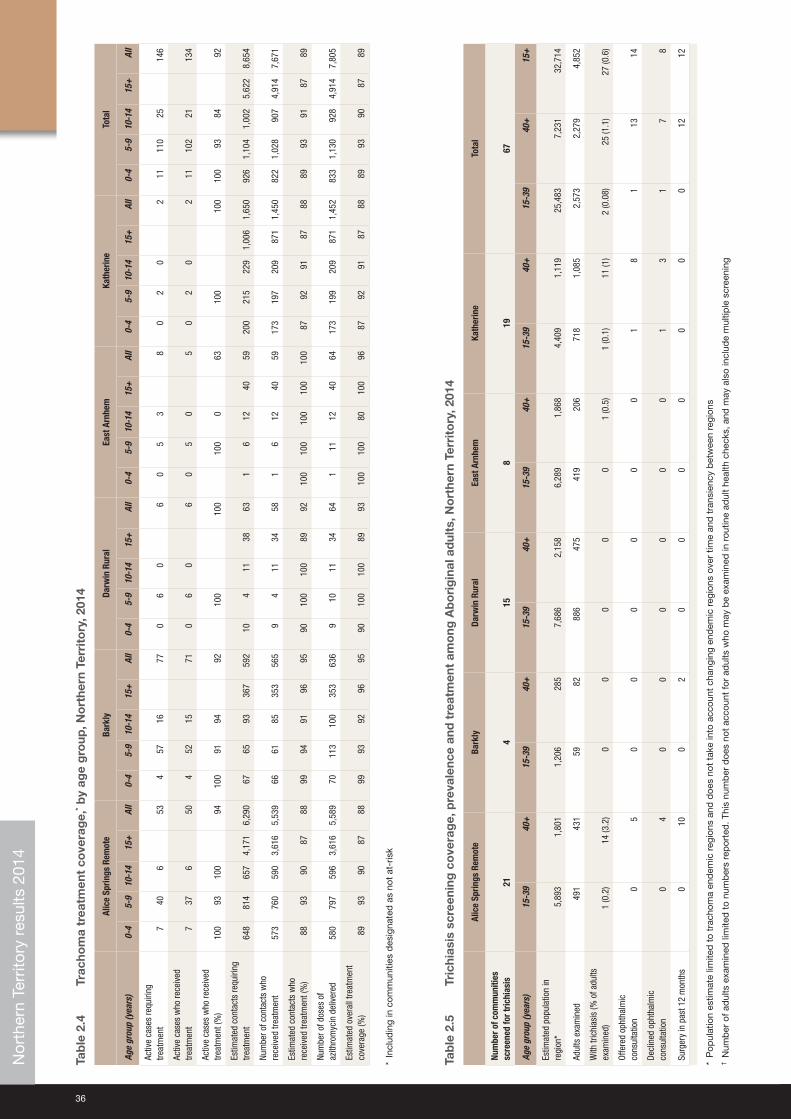
Table 2.4 Trachoma treatment coverage, by age group, Northern Territory, 2014 36
Table 2.5 Trichiasis screening coverage, prevalence and treatment among Aboriginal adults, Northern Territory, 2014 36
Table 2.6 Health promotion activities, by region, Northern Territory, 2014 37
Table 3.1 Trachoma control delivery, South Australia, 2014 45
Table 3.2 Trachoma screening coverage, trachoma prevalence and clean face prevalence in children, by age group, by region, South Australia, 2014 46
Table 3.3 Treatment strategies, by region, South Australia, 2014 46
Table 3.4 Trachoma treatment coverage, by region, South Australia, 2014 47
Table 3.5 Trichiasis screening coverage, prevalence and treatment among Aboriginal adults, by region, South Australia, 2014 47
Table 3.6 Health promotion activities, by region, South Australia, 2014 48
Table 4.1 Trachoma control delivery, Western Australia, 2014 55
Table 4.2 Trachoma screening coverage, trachoma prevalence and clean face prevalence in children, by age group, by region, Western Australia, 2014 56
Table 4.3 Treatment strategies, by region, Western Australia, 2014 56
Table 4.4 Trachoma treatment coverage, by region, Western Australia, 2014 57
Table 4.5 Trichiasis screening coverage, prevalence and treatment among Aboriginal adults, by region, Western Australia, 2014 57
Table 4.6 Health promotion activities, by region, Western Australia, 2014 58
Table 5.1 Trachoma screening coverage, trachoma prevalence and clean face prevalence in children (5‑14 years old), Western New South Wales, 2014 62
List of Tables
4
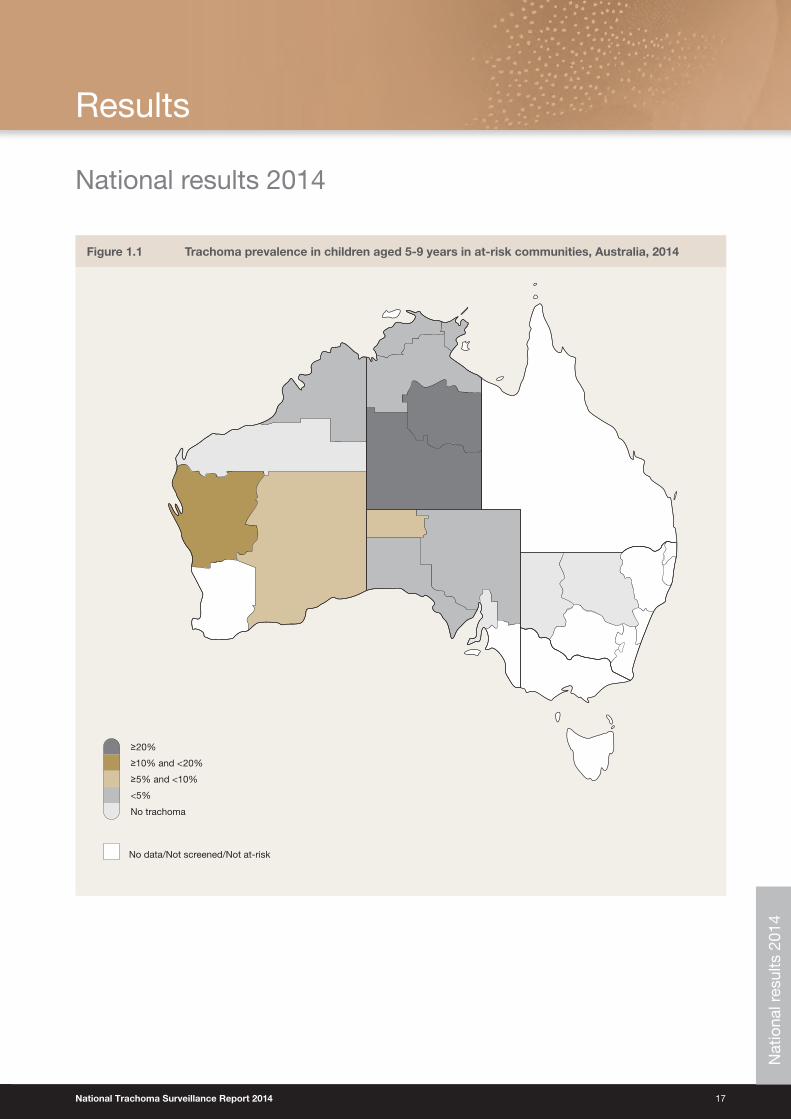
Figure 1.1 Trachoma prevalence in children aged 5‑9 years in at‑risk communities, Australia, 2014 17
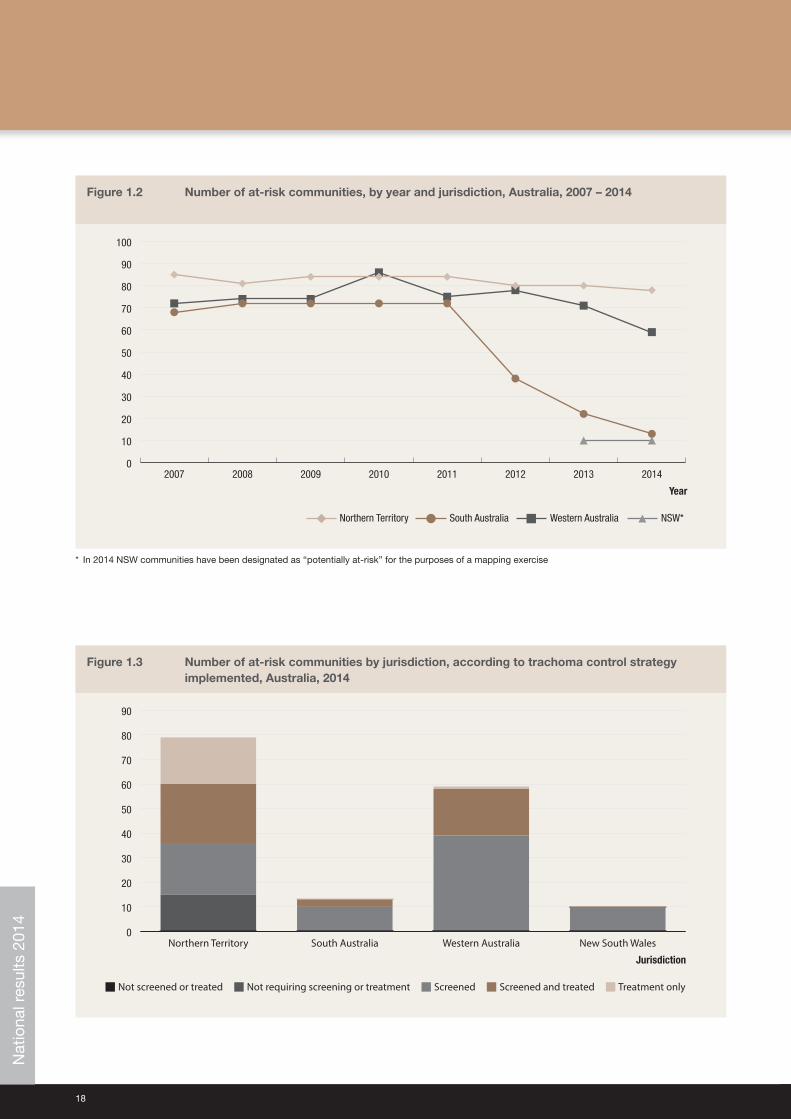
Figure 1.2 Number of at‑risk communities, by year and jurisdiction, Australia, 2007 – 2014 18
Figure 1.3 Number of at‑risk communities by jurisdiction, according to trachoma control strategy implemented, Australia, 2014 18
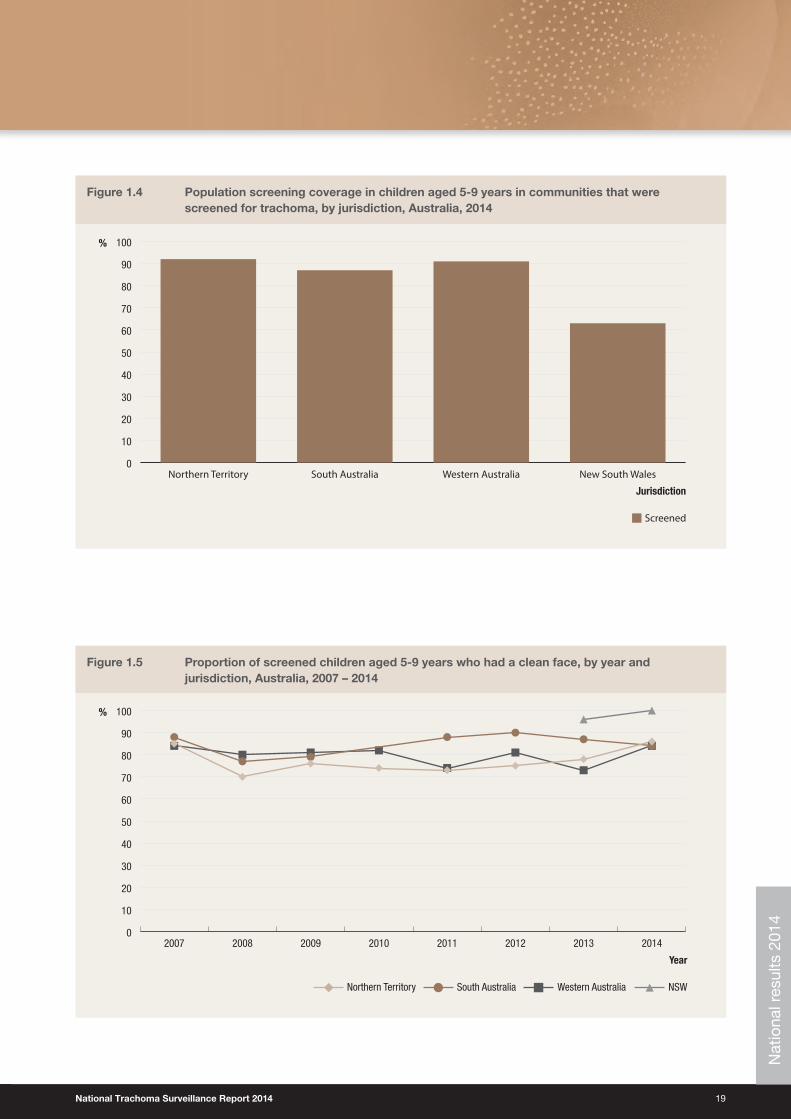
Figure 1.4 Population screening coverage in children aged 5‑9 years in communities that were screened for trachoma, by jurisdiction, Australia, 2014 19
Figure 1.5 Proportion of screened children aged 5‑9 years who had a clean face, by year and jurisdiction, Australia, 2007 – 2014 19
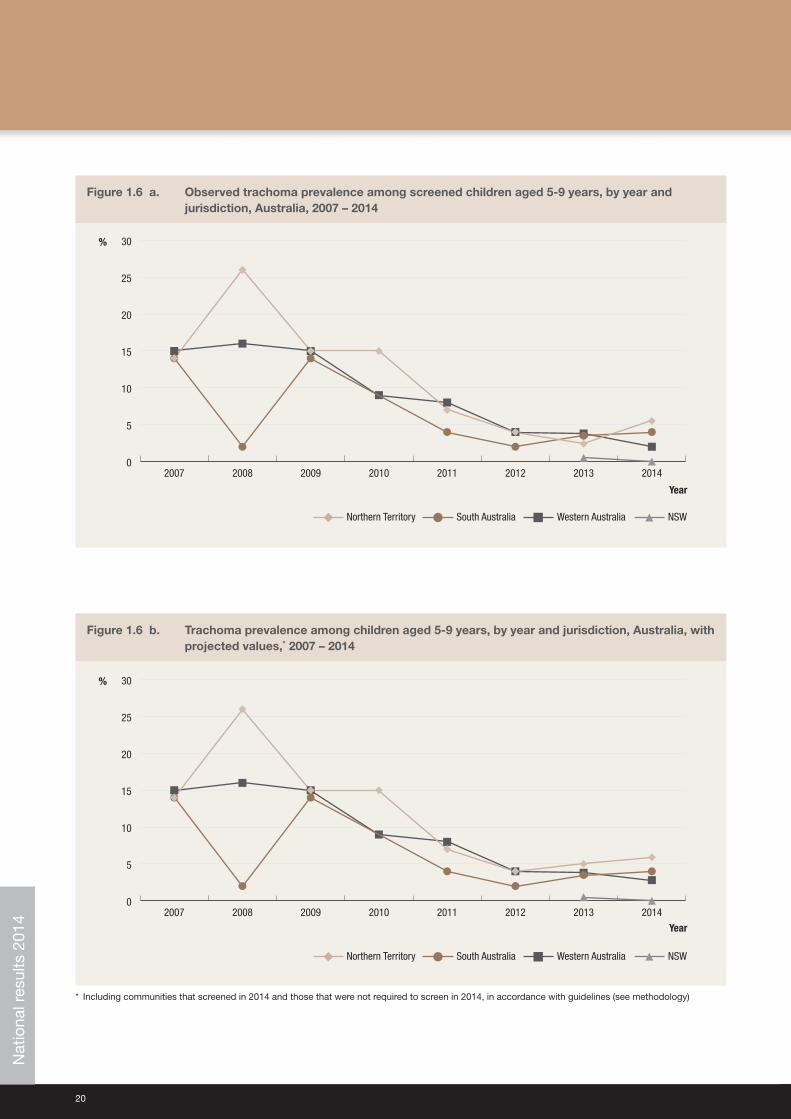
Figure 1.6 a. Observed trachoma prevalence among screened children aged 5‑9 years, by year and jurisdiction, Australia, 2007 – 2014 20
Figure 1.6 b. Trachoma prevalence among children aged 5‑9 years, by year and jurisdiction, Australia, with projected values, 2007 – 2014 20
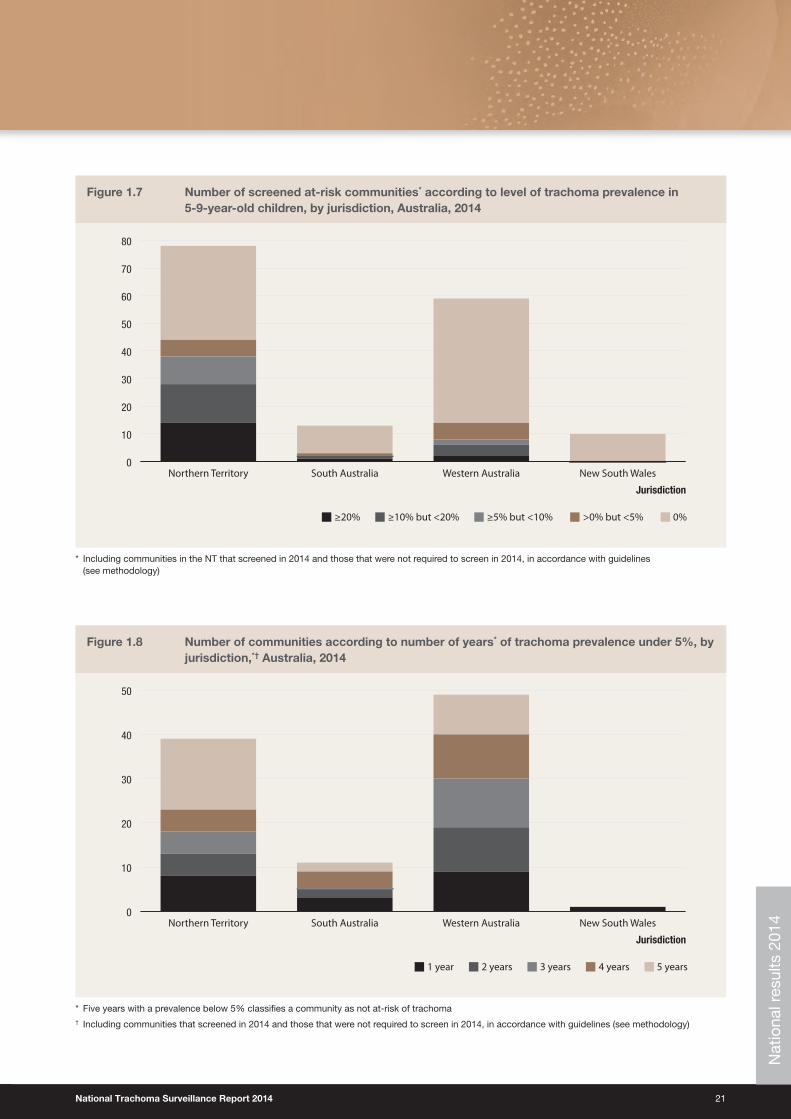
Figure 1.7 Number of screened at‑risk communities according to level of trachoma prevalence in 5‑9‑year‑old children, by jurisdiction, Australia, 2014 21
Figure 1.8 Number of communities according to number of years of trachoma prevalence under 5%, by jurisdiction, Australia, 2014 21
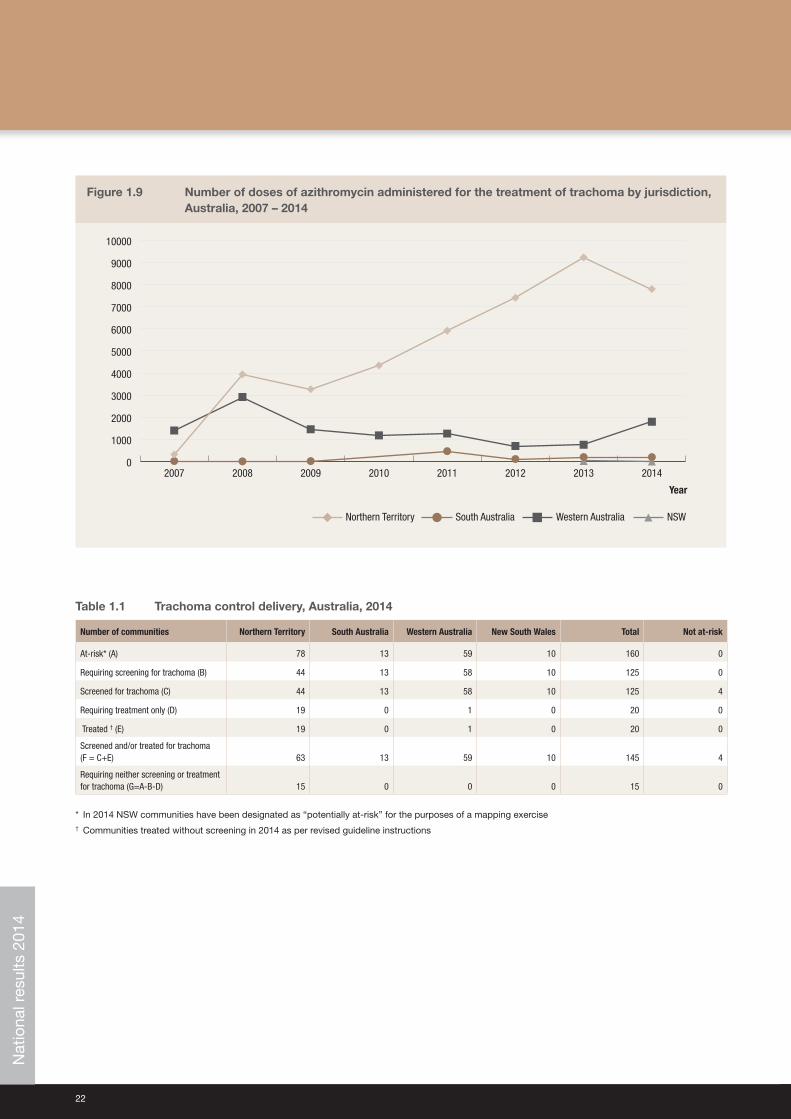
Figure 1.9 Number of doses of azithromycin administered for the treatment of trachoma by jurisdiction, Australia, 2007 – 2014 22
Figure 2.1 Trachoma prevalence in children aged 5‑9 years, number of communities that were screened, treated or both for trachoma and number of at‑risk communities, Northern Territory, 2014 28
Figure 2.2 Number of at‑risk communities, by region, Northern Territory, 2007 – 2014 29
Figure 2.3 Number of at‑risk communities by region, according to trachoma control strategy implemented, Northern Territory, 2014 29
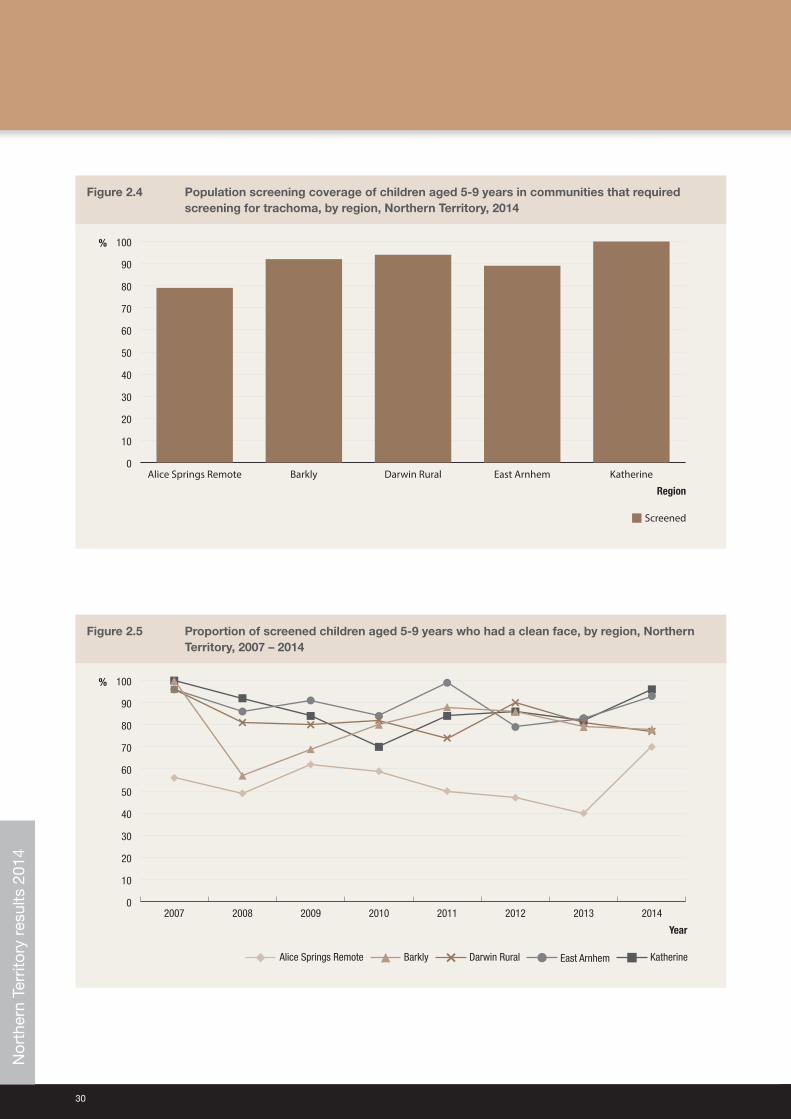
Figure 2.4 Population screening coverage of children aged 5‑9 years in communities that required screening for trachoma, by region, Northern Territory, 2014 30
Figure 2.5 Proportion of screened children aged 5‑9 years who had a clean face, by region, Northern Territory, 2007 – 2014 30
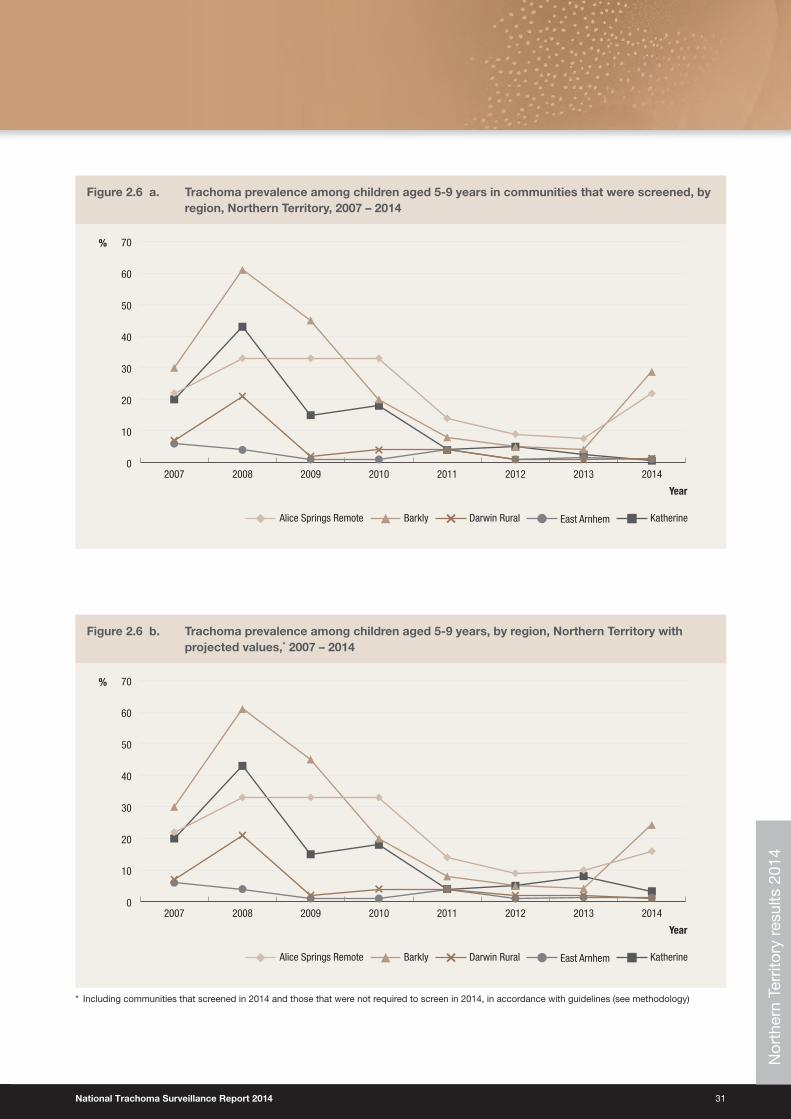
Figure 2.6 a. Trachoma prevalence among children aged 5‑9 years in communities that were screened, by region, Northern Territory, 2007 – 2014 31
Figure 2.6 b. Trachoma prevalence among children aged 5‑9 years, by region, Northern Territory with projected values, 2007 – 2014 31
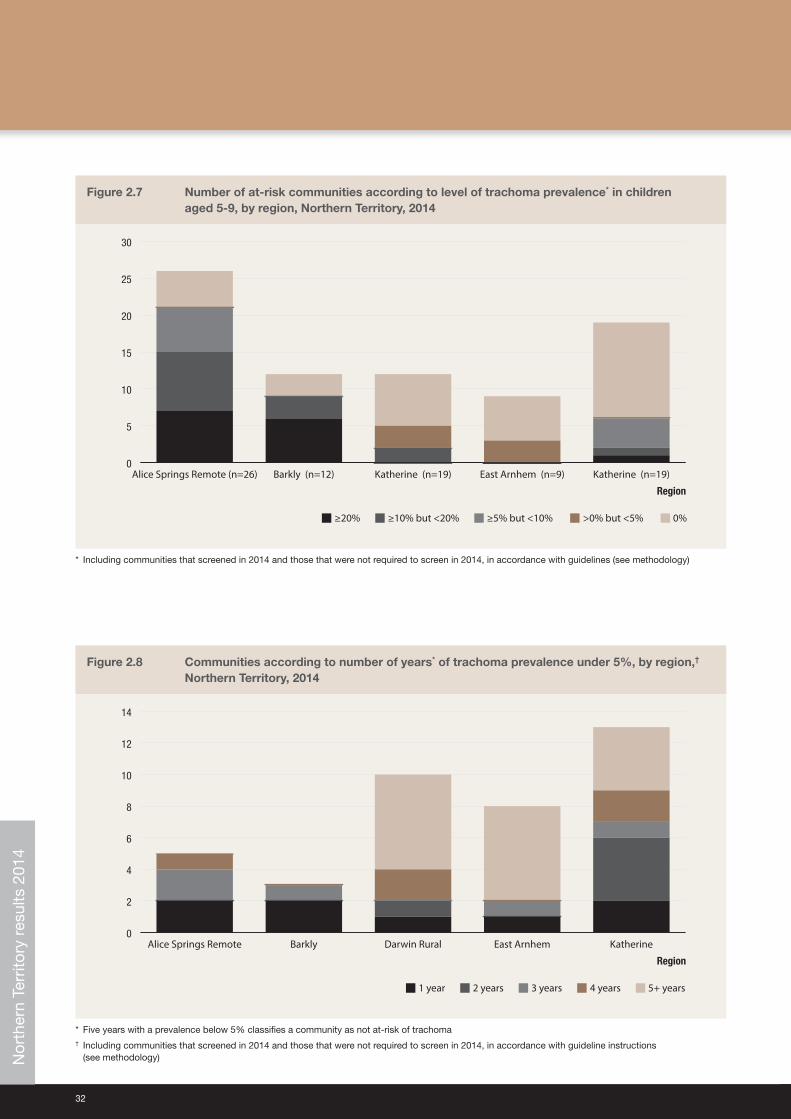
Figure 2.7 Number of at‑risk communities according to level of trachoma prevalence in children aged 5‑9, by region, Northern Territory, 2014 32
Figure 2.8 Communities according to number of years of trachoma prevalence under 5%, by region, Northern Territory, 2014 32
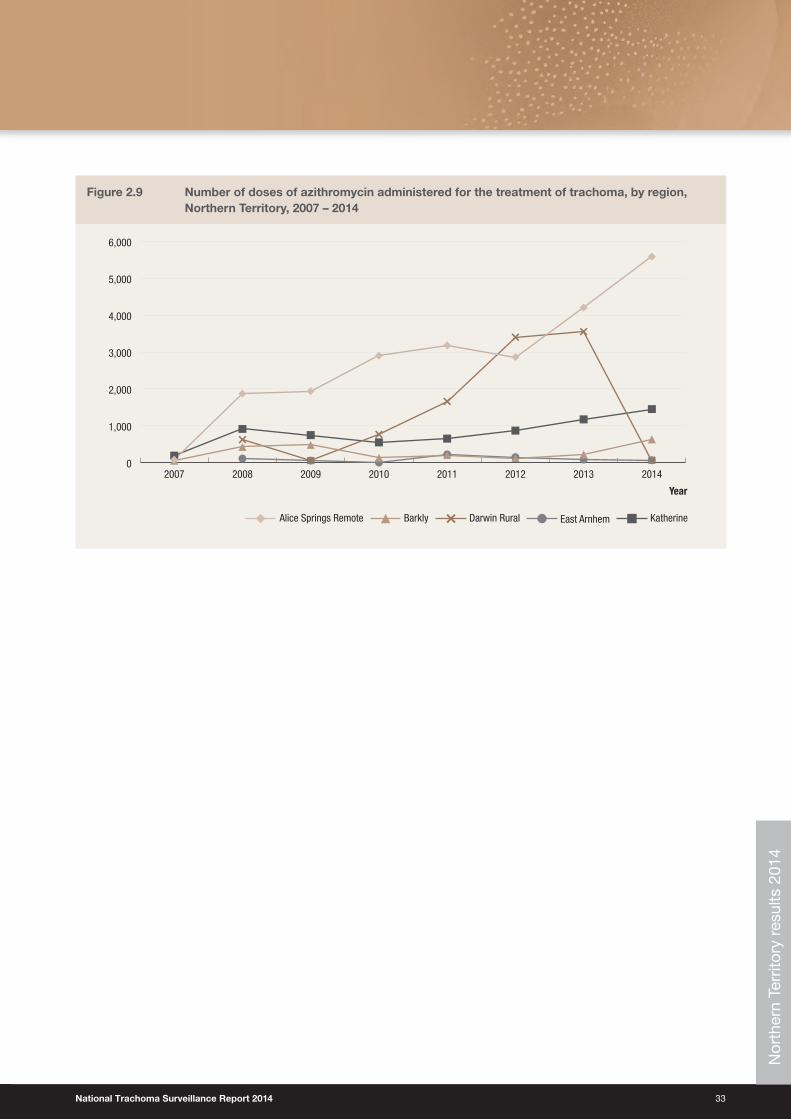
Figure 2.9 Number of doses of azithromycin administered for the treatment of trachoma, by region, Northern Territory, 2007 – 2014 33
Figure 3.1 Trachoma prevalence in children aged 5‑9 years, number of communities that were screened, treated or both for trachoma and number of at‑risk communities, South Australia, 2014 40
Figure 3.2 Number of at‑risk communities, by region, South Australia, 2007 – 2014 41
Figure 3.3 Number of at‑risk communities, by region, according to trachoma control strategy implemented, South Australia, 2014 41
Figure 3.4 Population screening coverage of children aged 5‑9 years in at‑risk communities that required screening for trachoma, by region, South Australia, 2014 42
Figure 3.5 Proportion of screened children aged 5‑9 years who had a clean face, by region, South Australia, 2007 – 2014 42
Figure 3.6 Trachoma prevalence among children aged 5‑9 years in at‑risk communities that were screened, by region, South Australia, 2007 – 2014 43
Figure 3.7 Number of at‑risk communities according to level of trachoma prevalence in children aged 5‑9, by region, South Australia, 2014 43
List of Figures
National Trachoma Surveillance Report 2014 5
Figure 3.8 At‑risk communities according to number of years of trachoma prevalence under 5%, by region, South Australia, 2014 44
Figure 3.9 Number of doses of azithromycin administered for the treatment of trachoma, by region, South Australia, 2007 – 2014 44
Figure 4.1 Trachoma prevalence in children aged 5‑9 years, number of communities that were screened, treated or both for trachoma and number of at‑risk communities, Western Australia, 2014 50
Figure 4.2 Number of at‑risk communities, by region, Western Australia, 2007 – 2014 51
Figure 4.3 Number of at‑risk communities, by region, according to trachoma control strategy implemented, Western Australia, 2014 51
Figure 4.4 Population screening coverage in children aged 5‑9 years in communities that required screening for trachoma, by region, Western Australia, 2014 52
Figure 4.5 Prevalence of screened children aged 5‑9 years who had a clean face, by region, Western Australia, 2007 – 2014 52
Figure 4.6 a. Trachoma prevalence among children aged 5‑9 years in communities that were screened, by region, Western Australia, 2007 – 2014 53
Figure 4.6 b. Trachoma prevalence among children aged 5‑9 years, by region, Western Australia with projected values, 2007 – 2014 53
Figure 4.7 Number of at‑risk communities according to level of trachoma prevalence in children aged 5‑9, by region, Western Australia, 2014 54
Figure 4.8 Communities according to number of years of trachoma prevalence under 5%, by region, Western Australia, 2014 54
Figure 4.9 Number of doses of azithromycin administered for the treatment of trachoma, by region, Western Australia, 2007 – 2014 55
Figure 5.1 Trachoma prevalence in children aged 5‑9 years, number of communities that were screened, treated or both for trachoma and number of potentially at‑risk communities, New South Wales, 2014 61
Figure A.1 Trachoma prevalence of screened children aged 5‑9 years by year and de‑identified community in North Alice Springs Remote region, Northern Territory, 2007 – 2014 74
Figure A.2 Trachoma prevalence of screened children aged 5‑9 years by year and de‑identified community in South Alice Springs Remote region, Northern Territory, 2007 – 2014 74
Figure A.3 Trachoma prevalence of screened children aged 5‑9 years by year and de‑identified community in Barkly region, Northern Territory, 2007 – 2014 75
Figure A.4 Trachoma prevalence of screened children aged 5‑9 years by year and de‑identified community in Darwin Rural region, Northern Territory, 2007 – 2014 75
Figure A.5 Trachoma prevalence of screened children aged 5‑9 years by year and de‑identified community in East Arnhem region, Northern Territory, 2007 – 2014 76
Figure A.6 Trachoma prevalence of screened children aged 5‑9 years by year and de‑identified community in Katherine region, Northern Territory, 2007 – 2014 76
Figure A.7 Trachoma prevalence of screened children aged 5‑9 years by year and de‑identified community in APY Lands region, South Australia, 2007 – 2014 77
Figure A.8 Trachoma prevalence of screened children aged 5‑9 years by year and de‑identified community in Eyre and Western region, South Australia, 2007 – 2014 77
Figure A.9 Trachoma prevalence of screened children aged 5‑9 years by year and de‑identified community in Goldfields region, Western Australia, 2014 78
Figure A.10 Trachoma prevalence of screened children aged 5‑9 years by year and de‑identified community in West Kimberly region, Western Australia, 2014 78
Figure A.11 Trachoma prevalence of screened children aged 5‑9 years by year and de‑identified community in East Kimberly region, Western Australia, 2014 79
Figure A.12 Trachoma prevalence of screened children aged 5‑9 years by year and de‑identified community in Midwest region, Western Australia, 2014 79
Figure A.13 Trachoma prevalence of screened children aged 5‑9 years by year and de‑identified community in Pilbara region, Western Australia, 2007 – 2014 80
6
The National Trachoma Surveillance and Control Reference Group
Name Position Committee role
Meredeth Taylor Assistant SecretaryRural, Remote and Indigenous Access Branch Indigenous and Rural Health Division, Department of Health
ChairAustralian Government Department of Health Representative
Rhonda Stilling DirectorBetter Access SectionIndigenous and Rural Health DivisionDepartment of Health
Australian Government Department of Health Representative
Alex Hope Public Health Medical OfficerAboriginal Medical Services Alliance Northern Territory
National Aboriginal Community Controlled Health Organisation Representative
Daniel Suggit Eye Health Program OfficerNational Aboriginal Community Controlled Health Organisation
National Aboriginal CommunityControlled Health Organisation Representative
Hugh Taylor Harold Mitchell Chair of Indigenous Eye HealthMelbourne School of Population and Global HealthUniversity of Melbourne
Expert
Donna Mak Professor and Head, Population and Preventive HealthUniversity of Notre Dame, Fremantle
Expert
Vicki Krause Director, Centre for Disease ControlNorthern Territory Department of Health
Communicable Diseases Network Australia Representative
Stephen Lambert Senior Medical OfficerCommunicable Diseases UnitChief Health Officer BranchQueensland Health
Queensland Health Representative
Sue Turcato Population Health UnitNew South Wales Ministry of Health
New South Wales Ministry of Health Representative
Gabrielle Watt Trachoma Program CoordinatorCentre for Disease ControlNorthern Territory Department of Health
Northern Territory Department of Health Representative
Lucy Angley Principal Project Manager Aboriginal HealthCountry Health SA Local Health NetworkSA Health
South Australia Department of Health and Ageing Representative
Clare Huppatz Chair, WA State Trachoma Reference GroupPublic Health PhysicianWA Country Health Service
Western Australia Department of Health and WA Country Health Service Representative
Matthew Lester Environmental Health Directorate WA Working Group on Aboriginal and Torres Strait Islander Environmental Health Representative
John Kaldor Professor of Epidemiology, Public Health Interventions Research GroupThe Kirby InstituteUNSW Australia
National Trachoma Surveillance and Reporting Unit Representative
Carleigh Cowling Senior Surveillance OfficerThe Kirby InstituteUNSW Australia
National Trachoma Surveillance and Reporting Unit Representative
Acknowledgements
National Trachoma Surveillance Report 2014 7
National Trachoma Surveillance and Reporting Unit
Name Position Project role
John Kaldor Professor of Epidemiology, Public Health Interventions Research GroupThe Kirby InstituteUNSW Australia
Chief Investigator
David Wilson Associate Professor and Head Disease Modelling and Financing ProgramThe Kirby InstituteUNSW Australia
Surveillance Expert
Marlene Kong Program HeadAboriginal and Torres Strait Islander Health ProgramThe Kirby InstituteUNSW Australia
Indigenous Expert
Bette Liu Senior Lecturer, School of Public Health and Community MedicineUNSW AustraliaScientific Head of Research AssetsThe Sax Institute
Epidemiology Expert
Tom Snelling Princess Margaret HospitalTelethon Institute for Child Health ResearchUWA Centre for Child Health Research
Paediatric Infectious Diseases Expert
Carleigh Cowling Senior Surveillance OfficerThe Kirby InstituteUNSW Australia
Surveillance Officer
Jurisdictional contributors to trachoma data collection
Northern Territory• Aboriginal Community Controlled Health Services• Aboriginal Medical Services Alliance Northern Territory• Centre for Disease Control, Northern Territory Department of Health• Healthy School‑Age Kids Program: Top End and Central Australia
South Australia• Aboriginal Community Controlled Health Services• Aboriginal Health Council of South Australia• Country Health SA Local Health Network, SA Health
Western Australia• WA State Trachoma Reference Group• Aboriginal Community Controlled Health Services• Communicable Disease Control Directorate, WA Health• Goldfields Population Health Unit• Kimberley Population Health Unit• Midwest Population Health Unit• Pilbara Population Health Unit
New South Wales• Population Health Unit, Western NSW Local Health District
8
Definitions are based on the Communicable Diseases Network Australia’s 2014 National Guidelines for the public health management of trachoma in Australia.1
Active trachoma: The presence of chronic inflammation of the conjunctiva caused by infection with Chlamydia trachomatis; includes World Health Organization simplified grading: trachomatous inflammation – follicular (TF) and trachomatous inflammation ‑ intense (TI).
At‑risk communities: Communities classified by jurisdictions as being at higher risk of trachoma based on 1) no recent data, but historical evidence of endemicity; 2) data of active trachoma prevalence ≥ 5% in children aged 5‑9 years in the last five years; or 3) data < 5% active trachoma prevalence but with a recorded prevalence of active trachoma ≥ 5% in the past five years.
Clean face: Absence of dirt, dust and crusting (nasal and ocular discharge) on cheeks and forehead.
Community‑screening coverage: The number of communities screened for trachoma as a proportion of communities designated by jurisdictions to be at‑risk of trachoma.
Community‑wide treatment: The antibiotic treatment of all people in the community who weigh > 3 kg living in houses with children under 15 years of age.
Contacts: Anyone who is living and sleeping in the same house as a child with trachoma. If the child lives or sleeps in multiple households, then all members of each household are regarded as contacts.
Endemic trachoma: Prevalence of active trachoma of 5% or more in children aged 1‑9 years or a prevalence of trichiasis of at least 0.1% in the adult population.
Hyperendemic trachoma: Prevalence of active trachoma of 20% or more in children aged 1‑9 years.
Prevalence of active trachoma: Proportion of people found in a screening program to have active trachoma.
Screening coverage: Defined as the proportion of Aboriginal and Torres Strait Islander children aged 5‑9 years in a community who were screened for trachoma at the time of community screening.
Trachomatous inflammation ‑ follicular (TF): Presence of five or more follicles in the central part of the upper tarsal conjunctiva, each at least 0.5 mm in diameter, as observed through a loupe.
Trachomatous inflammation ‑ intense (TI): Pronounced inflammatory thickening of the upper tarsal conjunctiva that obscures more than half of the normal deep tarsal vessels.
Trachomatous trichiasis (TT): Evidence of the recent removal of in‑turned eyelashes or at least one eyelash rubbing on the eyeball.
Treatment coverage: The proportion of Aboriginal and Torres Strait Islander people in a community who weigh > 3 kg and live in a house with one or more children aged below 15 years and who were treated for trachoma during each episode of community‑wide treatment.
Technical terms and definitions
National Trachoma Surveillance Report 2014 9
ABS Australian Bureau of Statistics
ACCHS Aboriginal Community Controlled Health Service
AHCSA Aboriginal Health Council of South Australia
CDC Centre for Disease Control, NT Department of Health
CDNA Communicable Diseases Network Australia
EH&CDSSP Eye Health and Chronic Disease Specialist Support Program
NSW New South Wales
NT Northern Territory
NTSRU National Trachoma Surveillance and Reporting Unit
SA South Australia
SAFE Surgery, antibiotics, facial cleanliness and environment
TSCRG Trachoma Surveillance and Control Reference Group
TF Trachomatous inflammation – follicular
TI Trachomatous inflammation – intense
TS Trachomatous scarring
TT Trachomatous trichiasis
WA Western Australia
WACHS WA Country Health Service
WHO World Health Organization
Abbreviations
10
Trachoma screening and management data for 2014 were provided to the National Trachoma Surveillance and Reporting Unit by the Northern Territory (NT), South Australia (SA), Western Australia (WA) and New South Wales (NSW). Data were analysed by region in the NT (5 regions), SA (4 regions), WA (4 regions) and NSW (2 regions). Jurisdictional authorities designated 160 remote Aboriginal communities as being at‑risk or potentially at‑risk of endemic trachoma in 2014. In 2014 all jurisdictions were guided by the revised 2014 CDNA National guidelines for the public health management of trachoma in Australia.1
Trachoma program coverage• Jurisdictions identified 160 communities as being at‑risk or potentially at‑risk of trachoma (Table 1.1).
• The number of communities designated as being at‑risk has decreased marginally in the NT, and substantially decreased in SA and WA since 2012 (Figure 1.2).
• Of 160 at‑risk or potentially at‑risk communities, 125 communities were determined to require screening for trachoma, a further 20 were identified to require treatment without screening (see methodology), leading to 145 communities that were determined to require screening, treatment or both screening and treatment for trachoma (Table 1.1).
• Of these 145 communities, all received screening, treatment or both screening and treatment (Table 1.1).
• The remaining 15 at‑risk communities did not require screening or treatment as their previous year’s prevalence was under 5% (see methodology).
• Four communities deemed not at‑risk were screened for trachoma in 2014 (Table 1.1).
• In WA 10 previously distinct communities were aggregated as one community for the presentation of data due to small population sizes and frequent mobility between communities.
• In SA 9 previously distinct communities were aggregated as one community for the presentation of data due to small population sizes and frequent mobility between communities
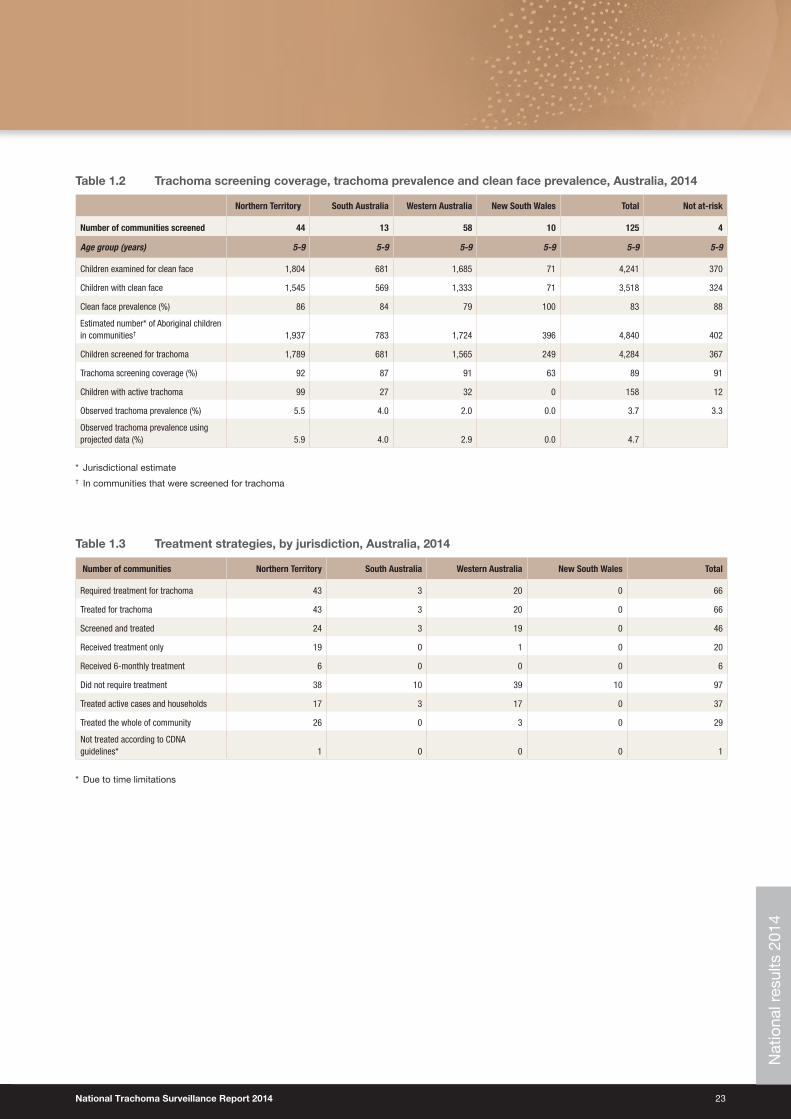
Screening coverage• Jurisdictions identified 125 communities in the four states or territory requiring screening for trachoma in 2014 and all
125 were screened for trachoma in 2014 (Table 1.1, Table 1.2).
• Within these communities, 4,284 (89%) of an estimated 4,840 resident children aged 5‑9 years were screened (Table 1.2).
• Screening coverage in children aged 5‑9 years in at‑risk communities was 92% for the NT, 87% for SA, 91% for WA and 63% for NSW (Table 1.2, Figure 1.4).
Clean face prevalence• A total of 4,241 children aged 5‑9 years in 125 at‑risk communities were assessed for clean faces during 2014 (Table 1.2).
• The overall proportion of clean faces in children aged 5‑9 years was 83%, with 86% in the NT, 84% in SA , 79% in WA, and 100% NSW (Table 1.2, Figure 1.5).
Executive summary
National Trachoma Surveillance Report 2014 11
Trachoma prevalence• The overall prevalence of active trachoma among children aged 5‑9 years in screened communities (using projected
data, see methodology) was 4.7%, with 5.9% in the NT, 4% in SA, 2.9% in WA and 0% in NSW (Table 1.2).
• The observed trachoma prevalence in communities that screened in 2014 was 5.5% in the NT, 4% in SA, 2% in WA and 0% in NSW (Table 1.2).
• There has been a small increase in the prevalence of trachoma in children aged 5‑9 years in the NT and SA in 2014 after a decreasing trend in all jurisdictions since 2009 (Figure 1.6a, Figure 1.6b).
• From 2013 to 2014 the prevalence of trachoma in children aged 5‑9 years decreased in WA and NSW (Figure 1.6a, Figure 1.6b).
• No trachoma was reported or detected in children aged 5‑9 years in 99 (62%) communities in 2014, including communities that screened for trachoma in children aged 5‑9 years and communities that were not required to screen, in accordance with the guidelines (Figure 1.7).
• Endemic levels of trachoma (> 5%) were reported in 48 (30%) communities in 2014 including communities that screened for trachoma in children aged 5‑9 years and communities that were not required to screen, in accordance with the guidelines (Figure 1.7).
• The small increase in trachoma prevalence in Australia from 2013 to 2014, after a number of years of decrease, must be interpreted cautiously, due to the nature of the mechanism of the surveillance procedures. The communities surveyed differ from year to year, and the assessment of trachoma is subject to error, as with any clinical technique. The continued need for improvements in promotion of facial cleanliness and environmental improvements may also be contributing factors. Nevertheless, the increase serves as a timely reminder of the need for all jurisdictions to maintain their commitment to the full implementation of the national guidelines for trachoma control.
Treatment delivery and coverage• Trachoma treatment strategies were applied in 66 communities, 100% of those requiring treatment, including
communities designated as not at‑risk of endemic trachoma (Table 1.3).
• One community in the NT did not treat according to CDNA guidelines due to resource limitations (Table 1.3).
• Of all cases detected that required treatment, 92% received treatment (Table 1.4).
• Treatment was delivered to active cases and households in 37 communities, and to the whole of community in 26 communities according to the guidelines (Table 1.3).
• Treatment coverage in all jurisdictions was 90%, with 89% in the NT and 98% in SA and WA (Table 1.4).
• A total of 9,803 doses of azithromycin were delivered for trachoma treatment (Table 1.4).
Trichiasis• Overall 9,497 adults aged over 15 years were screened (Table 1.5).
• It is acknowledged that the data provided do not include trichiasis screening undertaken as part of the Adult Health Check MBS Item 715. These data are not available to the National Trachoma Surveillance and Reporting Unit.
• The prevalence of trichiasis in adults aged 15 years and over was 0.05% and 0.9% in adults aged 40 years and over (Table 1.5).
• Surgery for trichiasis was reported to be undertaken for 17 adults in 2014 (Table 1.5).
Health promotion activities• Health promotion activities were reported to have occurred in 123 communities, including at‑risk and not at‑risk
communities.
12
Trachoma is one of the major causes of preventable blindness globally. 2 It is an eye infection caused by the bacteria Chlamydia trachomatis serotypes A, B, Ba and C. The infection can be transmitted through close facial contact, hand‑to‑eye contact, via fomites (towels, clothing and bedding) or by flies. Trachoma generally occurs in dry, dusty environments and is linked to poor living conditions. Overcrowding of households, limited water supply for bathing and general hygiene, poor waste disposal systems and high numbers of flies have all been associated with trachoma. Children generally have the highest prevalence of trachoma and are believed to be the main reservoirs of infection, because the infection in children has a longer duration than in adults. 3
Infection with the relevant C. trachomatis serotype causes inflammation of the conjunctiva. Diagnosis of trachoma is by visual inspection, and the detection of follicles (white spots) and papillae (red spots) on the inner upper eyelid. Repeated infections with C. trachomatis, especially during childhood, may lead to scarring with contraction and distortion of the eyelid, which may in turn cause the eyelashes to rub against the cornea; this condition is known as trichiasis which leads to gradual vision loss and blindness. 1,4,5 Scarring of the cornea due to trichiasis is irreversible. However, if early signs of in‑turned eyelashes are found, then surgery is usually effective in preventing further damage to the cornea.
The Alliance for the Global Elimination of Blinding Trachoma by 2020 (GET 2020) initiative, supported by the World Health Organization (WHO), advocates the implementation of the SAFE strategy, with its key components of Surgery (to correct trichiasis), Antibiotic treatment, Facial cleanliness and Environmental improvements. This strategy is ideally implemented through a primary care model within a community framework, ensuring consistency and continuity in screening, control measures, data collection and reporting, as well as the building of community capacity. 6,7,8
WHO guidelines recommend that trachoma is treated by a single dose of the antibiotic azithromycin repeated on an annual basis according to trachoma prevalence. Best public health practice involves treatment of all members of the household in which a person with trachoma resides, whether or not they have evidence of trachoma. In hyperendemic communities, it is recommended that treatment is also extended to all to all members of the community over 3 kg in weight. 3,9
Trachoma control in AustraliaAustralia is the only high‑income country where trachoma is endemic. It occurs primarily in remote and very remote Aboriginal communities in the Northern Territory (NT), South Australia (SA) and Western Australia (WA). In 2008, cases were also found in New South Wales (NSW) and Queensland (Qld), states where trachoma was believed to have been eliminated. However, cases of trachomatous scarring are believed to be present in all jurisdictions and sub‑jurisdictional regions of Australia. 3,10 In 2009, the Australian Government invested in the Closing the Gap ‑ Improving Eye and Ear Health Services for Indigenous Australians measure which included committing $16 million over a 4‑year period towards eliminating trachoma in Australia. In 2013, the Australian Government committed a further $16.5 million to continue, improve and expand trachoma control initiatives in jurisdictions with known endemic levels of trachoma. Funding was also provided to jurisdictions with a previous history of trachoma for screening activities to ascertain whether control programs were also required. These funds were also committed to establishing a strong framework for monitoring and evaluation. 11
The surveillance and management of trachoma in 2014 in all jurisdictions was guided by the Communicable Disease Network Australia (CDNA) 2014 National guidelines for the public health management of trachoma in Australia.1 The guidelines underwent review in 2013 and were revised in 2014. One of the main changes to the guidelines was the option of not screening all endemic communities every year, enabling jurisdictions to use resources for antibiotic distribution and health promotion activities. The guidelines were developed in the context of the WHO SAFE strategy and make recommendations for improving data collection, collation and reporting systems in relation to trachoma control in Australia.
The National Trachoma Surveillance and Reporting UnitThe National Trachoma Surveillance and Reporting Unit (NTSRU) is responsible for data collation, analysis and reporting related to the ongoing evaluation of trachoma control strategies in Australia. From the end of 2010, the NTSRU has been managed by the Kirby Institute, UNSW Australia.12‑14 For previous reports from 2006 to 2008, the NTSRU was managed by The Centre for Eye Research Australia15‑17 and the 2009 report was managed by the Centre for Molecular, Environmental, Genetic and Analytic Epidemiology, the University of Melbourne.18
Background
National Trachoma Surveillance Report 2014 13
The NTSRU operates under contract with the Australian Government Department of Health. The primary focus of reporting by the NTSRU from 2006 – 2011 was on trachoma levels and trends in the three jurisdictions (NT, SA and WA) funded by the Australian Government to undertake trachoma control activities.
In 2013 and 2014, the NSW Ministry of Health was funded to undertake a baseline screening of selected remote communities to establish whether trachoma was a public health concern in NSW. These data are included in the 2013 and 2014 reports along with NT, SA and WA data.
14
Each jurisdiction undertook screening and treatment for trachoma according to its respective protocols, and in the context of the 2014 CDNA National guidelines for the public health management of trachoma in Australia that recommend specific treatment strategies depending on the prevalence of trachoma detected through screening.1
In 2006, when the National Trachoma Management Program was initiated, each jurisdiction identified at‑risk communities from historical prevalence data and other knowledge. Over time, additional communities have been reclassified as being at‑risk or removed from the at‑risk category. Screening for trachoma focuses on the at‑risk communities, but a small number of other communities designated as not at‑risk have also been screened, generally if there is anecdotal information suggesting the presence of active trachoma.
The WHO trachoma grading criteria (Appendix 1) were used to diagnose and classify individual cases of trachoma in all jurisdictions. Data collection forms for data collection at the community level were developed by the National Trachoma Surveillance and Control Reference Group, based on the CDNA guidelines (Appendix 2). Completed forms were forwarded from the jurisdictional coordinators to the NTSRU for checking and analysis. Information provided to the NTSRU at the community level for each calendar year included:
• Number of Aboriginal children aged 1‑14 years screened for clean faces and the number with clean faces, by age group
• Number of Aboriginal children aged 1‑14 years screened for trachoma and the number with trachoma, by age group
• Number of episodes of treatment for active trachoma, household contacts and other community members, by age group
• Number of Aboriginal adults screened for trichiasis, number with trichiasis, and the number who had surgery for trichiasis
• Community‑level implementation of WHO SAFE strategies.
While data may be collected for Aboriginal children aged 0‑14 years, the focus age group in all regions is the 5‑9‑year age group as required by jurisdictional Project Agreements.
Northern TerritoryIn 2013 and 2014, the NT followed the screening and treatment schedule recommended in the 2014 CDNA National guidelines for the public health management of trachoma in Australia. Trachoma screening and management in the NT was undertaken through collaboration between the Department of Health (Centre for Disease Control (CDC) and Health Development) and Aboriginal Community Controlled Health Services (ACCHS). Trachoma screening was incorporated into the Healthy School‑Age Kids program annual check and conducted by either local primary health‑care services or community‑controlled services, with support from the CDC trachoma team. The NT uses school enrolment lists, electronic health records and local knowledge to best determine the number of children aged 5‑9 in the community that were present at the time of screening. Following screening, treatment was generally undertaken by primary health‑care services with support from the CDC trachoma team, particularly where community‑wide treatments were required.
In 2014, screening for trichiasis was undertaken primarily by clinic staff during adult health checks, or by optometrists or ophthalmologists from the Regional Eye Health Service based in Alice Springs.
South AustraliaIn South Australia, Country Health SA works collaboratively with Aboriginal Community Controlled Organisations, community health services and the Aboriginal Health Council of South Australia (AHCSA) to ensure that trachoma screening and treatment is undertaken in all at‑risk communities. An interagency State Trachoma Reference Group provides guidance to the project. Country Health SA enters into contracts with services for the provision of both trachoma and trichiasis screening and treatment services. In 2014 Anangu Pitjantjatjara Yankunytjatjara (APY) Lands aggregated all nine previously distinct communities into one single community for the purpose of trachoma surveillance because of the small populations of each community and kinship links resulting in frequent mobility between these communities. This definition alters trends presented in reports from 2013 and 2014. Additional trichiasis screening activities were undertaken by the Eye Health and Chronic Disease Specialist Support Program (EH&CDSSP), coordinated by the Aboriginal Health Council of South Australia. This program provides regular visits to SA remote Aboriginal communities by optometrists and ophthalmologists. Trichiasis screening was undertaken opportunistically for adults
Methodology
National Trachoma Surveillance Report 2014 15
by the contracted trachoma screening service providers, the EH&CDSSP team and also routinely as part of the Adult Annual Health Checks. In 2014 there was extra focus on the promotion of the clean faces health message in the at‑risk communities. With the support from the University of Melbourne Indigenous Eye Health Unit the Imparja television characters Yamba and Milpa undertook a successful Health Promotion road show visiting five schools on the APY Lands emphasising the importance of clean faces. The Country Health SA Trachoma Control team engaged in ongoing conversations with stakeholders with regard to the delivery of healthy housing. It is believed that overcrowding and adequate maintenance of hardware in housing remain a concern in some communities.
Western AustraliaTrachoma screening and management in WA is the responsibility of the WA Country Health Service (WACHS) Population Health Units in the Kimberley, Goldfields, Pilbara and Midwest health regions. An interagency State Trachoma Reference Group has been established to provide program oversight. The WA State Trachoma Reference Group has established a set of principles which guide the program and provide consistent practice across the four endemic regions.
In collaboration with the local primary health‑care providers, the Population Health Units screened communities in each region within a two‑week period, in August and September. People identified with active trachoma were treated at the time of screening. In 2014 each region determined the screening denominator based on the school register, which was updated by removing names of children known to be out of the community at the time of the screen and by adding names of children who were present in the community at the time of the screen.
In WA, trichiasis screening was undertaken in conjunction with adult influenza vaccinations. Screening of the target population also occurs with the Visiting Optometrist Scheme (VOS) in the Kimberley region. The Goldfields region also undertook additional trichiasis screening during the trachoma screening period. In addition, screening occurs as part of the adult health checks provided through the Medicare Benefits Scheme. The total volume of screening is not able to be determined at this time as the level of data is not available through the MBS information system.
In 2011 and 2014, WA Health aggregated several previously distinct communities into one single community for the purpose of trachoma surveillance because of the small populations of each community and kinship links resulting in frequent mobility between these communities. This definition alters trends presented in reports from 2010 – 2014.
New South WalesIn 2014, NSW Health expanded the trachoma screening project to include a further nine potentially at‑risk communities in North Western and Far Western NSW. Repeat screening was also undertaken in the affected community that was identified in 2013. Screening was conducted by the Bathurst Population Health Unit with support from NSW Ministry of Health. No trichiasis screening was undertaken in NSW.
QueenslandIn 2012, Queensland Health was funded to undertake a baseline screening of remote communities to establish whether trachoma was a public health concern in Queensland. Findings from this exercise were reported in the Australian Trachoma Surveillance report 2012. In one community in the Torres Strait, follicles were observed in eight children. PCR swabs were taken from the eight children and household contacts. Results from the PCR test were all negative for C. trachomatis. Azithromycin was administered to the eight children and household contacts before the results of the PCR test were available. Planning for future screening in this community and a limited number of neighbouring communities in the Torres Strait is underway.
16
Data analysisFor the purpose of this report, a community is defined as a specific location where people reside and where there is at least one school. Community coverage is defined as the number of at‑risk communities screened for trachoma as a proportion of those that were identified as possibly having trachoma. Individual screening coverage is the proportion of children in the target age group in a region that was actually screened.
In 2014, population data for trachoma screening coverage were provided by each jurisdiction. The population for communities in years 2007 to 2011 was derived from projected data from the 2006 Australian census using Australian Bureau of Statistics (ABS) standard estimates of population increase (1.6%, 1.8% and 2.1% in the NT, WA and SA, respectively). Population estimates based on ABS census data do not account for population movements within communities, regions and jurisdictions. Prevalence of active trachoma was calculated using the number of children screened as the denominator.
Trachoma data were analysed in the age groups 0‑4, 5‑9 and 10‑14 years. Comparisons over time were limited to those children aged 5‑9, which is the target age group for the trachoma screening programs in all regions. Data from 2006 were excluded from assessment of time trends as collection methods in this first year differed from those subsequently adopted.
Projected data for trachoma prevalenceIn 2014 all jurisdictions undertook trachoma control activities according to the revised 2014 CDNA National guidelines for the public health management of trachoma in Australia.1 Under these guidelines not all at‑risk communities were required to undertake screening for trachoma in 2014. For reporting purposes, the NTSRU has carried the most recent prevalence data forward in those communities that did not screen in the 2014 calendar year as a direct program decision, providing what is believed to be a conservative upper‑bound on average levels of trachoma. This principle applies to all tables and figures relating to trachoma prevalence data. This method of projecting data was approved by the Trachoma Surveillance and Control Reference Group on 26 November 2013.
National Trachoma Surveillance Report 2014 17
Results
National results 2014
Figure 1.1 Trachoma prevalence in children aged 5‑9 years in at‑risk communities, Australia, 2014
No data/Not screened/Not at-risk
<5%
No trachoma
≥5% and <10%
≥10% and <20%
≥20%
Nat
iona
l res
ults
201
4
18
Figure 1.2 Number of at‑risk communities, by year and jurisdiction, Australia, 2007 – 2014
0
10
20
30
40
50
60
70
80
90
100
20142013201220112010200920082007
Year
Western AustraliaSouth AustraliaNorthern Territory NSW*
* In 2014 NSW communities have been designated as “potentially at‑risk” for the purposes of a mapping exercise
Figure 1.3 Number of at‑risk communities by jurisdiction, according to trachoma control strategy implemented, Australia, 2014
ScreenedNot requiring screening or treatmentNot screened or treated Screened and treated Treatment only
Jurisdiction
0
10
20
30
40
50
60
70
80
90
New South WalesWestern AustraliaSouth AustraliaNorthern Territory
Nat
iona
l res
ults
201
4
National Trachoma Surveillance Report 2014 19
Figure 1.4 Population screening coverage in children aged 5‑9 years in communities that were screened for trachoma, by jurisdiction, Australia, 2014
0
10
20
30
40
50
60
70
80
90
100
New South WalesWestern AustraliaSouth AustraliaNorthern Territory
%
Screened
Jurisdiction
Figure 1.5 Proportion of screened children aged 5‑9 years who had a clean face, by year and jurisdiction, Australia, 2007 – 2014
0
10
20
30
40
50
60
70
80
90
100
20142013201220112010200920082007
%
Western AustraliaSouth AustraliaNorthern Territory NSW
Year
Nat
iona
l res
ults
201
4
20
Figure 1.6 a. Observed trachoma prevalence among screened children aged 5‑9 years, by year and jurisdiction, Australia, 2007 – 2014
0
5
10
15
20
25
30
20142013201220112010200920082007
Western AustraliaSouth AustraliaNorthern Territory
%
NSW
Year
Figure 1.6 b. Trachoma prevalence among children aged 5‑9 years, by year and jurisdiction, Australia, with projected values,* 2007 – 2014
Western AustraliaSouth AustraliaNorthern Territory
%
NSW
0
5
10
15
20
25
30
20142013201220112010200920082007
Year
* Including communities that screened in 2014 and those that were not required to screen in 2014, in accordance with guidelines (see methodology)
Nat
iona
l res
ults
201
4
National Trachoma Surveillance Report 2014 21
Figure 1.7 Number of screened at‑risk communities* according to level of trachoma prevalence in 5‑9‑year‑old children, by jurisdiction, Australia, 2014
≥5% but <10% ≥10% but <20%≥20% >0% but <5% 0%
Jurisdiction
0
10
20
30
40
50
60
70
80
New South WalesWestern AustraliaSouth AustraliaNorthern Territory
* Including communities in the NT that screened in 2014 and those that were not required to screen in 2014, in accordance with guidelines (see methodology)
Figure 1.8 Number of communities according to number of years* of trachoma prevalence under 5%, by jurisdiction,*† Australia, 2014
3 years2 years1 year 4 years 5 years
Jurisdiction
0
10
20
30
40
50
New South WalesWestern AustraliaSouth AustraliaNorthern Territory
* Five years with a prevalence below 5% classifies a community as not at‑risk of trachoma† Including communities that screened in 2014 and those that were not required to screen in 2014, in accordance with guidelines (see methodology)
Nat
iona
l res
ults
201
4
22
Figure 1.9 Number of doses of azithromycin administered for the treatment of trachoma by jurisdiction, Australia, 2007 – 2014
0
1000
2000
3000
4000
5000
6000
7000
8000
9000
10000
20142013201220112010200920082007
Western AustraliaSouth AustraliaNorthern Territory NSW
Year
Table 1.1 Trachoma control delivery, Australia, 2014
Number of communities Northern Territory South Australia Western Australia New South Wales Total Not at-risk
At-risk* (A) 78 13 59 10 160 0
Requiring screening for trachoma (B) 44 13 58 10 125 0
Screened for trachoma (C) 44 13 58 10 125 4
Requiring treatment only (D) 19 0 1 0 20 0
Treated † (E) 19 0 1 0 20 0
Screened and/or treated for trachoma (F = C+E) 63 13 59 10 145 4
Requiring neither screening or treatment for trachoma (G=A-B-D) 15 0 0 0 15 0
* In 2014 NSW communities have been designated as “potentially at‑risk” for the purposes of a mapping exercise† Communities treated without screening in 2014 as per revised guideline instructions
Nat
iona
l res
ults
201
4
National Trachoma Surveillance Report 2014 23
Table 1.2 Trachoma screening coverage, trachoma prevalence and clean face prevalence, Australia, 2014
Northern Territory South Australia Western Australia New South Wales Total Not at-risk
Number of communities screened 44 13 58 10 125 4
Age group (years) 5‑9 5‑9 5‑9 5‑9 5‑9 5‑9
Children examined for clean face 1,804 681 1,685 71 4,241 370
Children with clean face 1,545 569 1,333 71 3,518 324
Clean face prevalence (%) 86 84 79 100 83 88
Estimated number* of Aboriginal children in communities† 1,937 783 1,724 396 4,840 402
Children screened for trachoma 1,789 681 1,565 249 4,284 367
Trachoma screening coverage (%) 92 87 91 63 89 91
Children with active trachoma 99 27 32 0 158 12
Observed trachoma prevalence (%) 5.5 4.0 2.0 0.0 3.7 3.3
Observed trachoma prevalence using projected data (%) 5.9 4.0 2.9 0.0 4.7
* Jurisdictional estimate† In communities that were screened for trachoma
Table 1.3 Treatment strategies, by jurisdiction, Australia, 2014
Number of communities Northern Territory South Australia Western Australia New South Wales Total
Required treatment for trachoma 43 3 20 0 66
Treated for trachoma 43 3 20 0 66
Screened and treated 24 3 19 0 46
Received treatment only 19 0 1 0 20
Received 6-monthly treatment 6 0 0 0 6
Did not require treatment 38 10 39 10 97
Treated active cases and households 17 3 17 0 37
Treated the whole of community 26 0 3 0 29
Not treated according to CDNA guidelines* 1 0 0 0 1
* Due to time limitationsN
atio
nal r
esul
ts 2
014
24
Tab
le 1
.4
Trac
hom
a tr
eatm
ent
cove
rag
e, A
ustr
alia
, 201
4
Nort
hern
Ter
ritor
ySo
uth
Aust
ralia
Wes
tern
Aus
tral
iaTo
tal
Age
grou
p (y
ears
)0‑
45‑
910
‑14
15+
All
0‑4
5‑9
10‑1
415
+Al
l0‑
45‑
910
‑14
15+
All
0‑4
5‑9
10‑1
415
+Al
l
Activ
e ca
ses
requ
iring
trea
tmen
t11
110
2514
61
271
299
3212
5321
169
3822
8
Activ
e ca
ses
who
rece
ived
trea
tmen
t11
102
2113
41
271
295
3110
4617
160
3220
9
Activ
e ca
ses
who
rece
ived
trea
tmen
t (%
)10
093
8492
100
100
100
100
5697
8387
8195
8492
Estim
ated
con
tact
s re
quiri
ng tr
eatm
ent
926
1,10
41,
002
5,62
28,
654
1615
2611
817
519
322
020
71,
160
1,78
01,
135
1,33
91,
235
6,90
010
,609
Num
ber o
f con
tact
s w
ho re
ceiv
ed
treat
men
t82
21,
028
907
4,91
47,
671
1615
2611
417
119
121
820
11,
142
1,75
21,
029
1,26
11,
134
6,17
09,
594
Estim
ated
con
tact
s w
ho re
ceiv
ed
treat
men
t (%
)89
9391
8789
100
100
100
9798
9999
9798
9891
9492
8990
Num
ber o
f dos
es o
f azi
thro
myc
in d
eliv
ered
833
1,13
092
84,
914
7,80
517
4227
114
200
196
249
211
1,14
21,
798
1,04
61,
421
1,16
66,
170
9,80
3
Estim
ated
ove
rall
treat
men
t cov
erag
e (%
)89
9390
8789
100
100
100
9798
9799
9698
9890
9492
8990
Dose
s ad
min
iste
red
in c
omm
uniti
es th
at
wer
e tre
ated
with
out s
cree
ning
*56
672
261
43,
426
5,32
898
115
9574
31,
051
664
837
709
4,16
96,
379
Dose
s ad
min
iste
red
six-
mon
thly
*12
013
712
364
41,
024
120
137
123
644
1,02
4
* A
s p
er g
uid
elin
es
Tab
le 1
.5
Tric
hias
is s
cree
ning
co
vera
ge,
pre
vale
nce
and
tre
atm
ent
amo
ng A
bo
rig
inal
ad
ults
, Aus
tral
ia, 2
014
Nort
hern
Ter
ritor
ySo
uth
Aust
ralia
Wes
tern
Aus
tral
iaTo
tal
Num
ber o
f com
mun
ities
scr
eene
d fo
r tric
hias
is67
13No
dat
a
Age
grou
ps15
‑39
40+
15‑3
940
+15
‑39
40+
15‑3
940
+15
+
Estim
ated
pop
ulat
ion
in re
gion
*25
,483
7,23
15,
084
1,82
710
,712
3,53
841
,279
12,5
9653
,875
Adul
ts e
xam
ined
2,57
32,
279
717
1,09
21,
056
1,78
04,
346
5,15
19,
497
With
tric
hias
is (%
of a
dults
exa
min
ed)
2 (0
.08)
25 (1
.1)
1 (0
.1)
11 (1
)0
11 (0
.1)
3 (0
.08)
47 (0
.9)
50 (0
.5)
Offe
red
opht
halm
ic c
onsu
ltatio
n1
131
110
112
3537
Decl
ined
oph
thal
mic
con
sulta
tion
17
01
03
111
12
Surg
ery
in p
ast 1
2 m
onth
s0
121
30
11
1617
* P
opul
atio
n es
timat
e lim
ited
to
trac
hom
a en
dem
ic r
egio
ns a
nd d
oes
not
take
into
acc
ount
cha
ngin
g en
dem
ic r
egio
ns o
ver
time
and
tra
nsie
ncy
bet
wee
n re
gion
s†
Num
ber
of a
dul
ts e
xam
ined
lim
ited
to
num
ber
s re
por
ted
. Thi
s nu
mb
er d
oes
not
acco
unt
for
adul
ts w
ho m
ay b
e ex
amin
ed in
rou
tine
adul
t he
alth
che
cks,
and
may
als
o in
clud
e m
ultip
le s
cree
ning
Nat
iona
l res
ults
201
4
National Trachoma Surveillance Report 2014 25
This page left blank intentionally
Nat
iona
l res
ults
201
4
26
Northern Territory results 2014
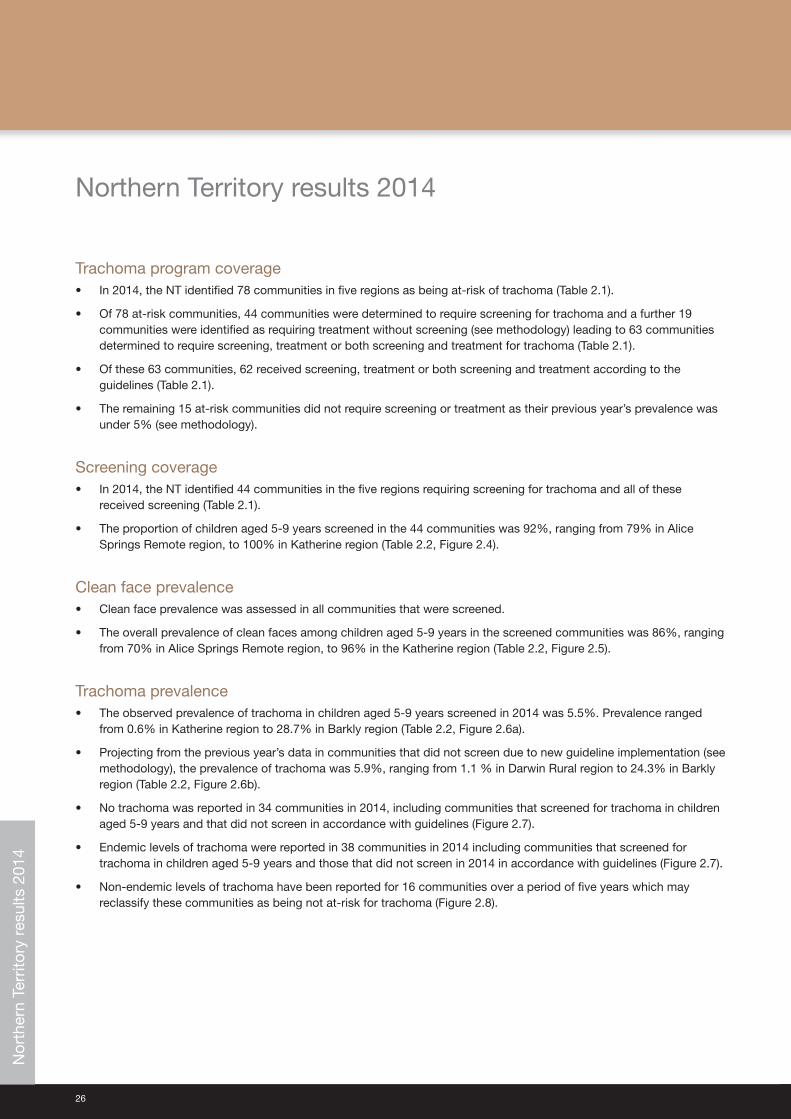
Trachoma program coverage• In 2014, the NT identified 78 communities in five regions as being at‑risk of trachoma (Table 2.1).
• Of 78 at‑risk communities, 44 communities were determined to require screening for trachoma and a further 19 communities were identified as requiring treatment without screening (see methodology) leading to 63 communities determined to require screening, treatment or both screening and treatment for trachoma (Table 2.1).
• Of these 63 communities, 62 received screening, treatment or both screening and treatment according to the guidelines (Table 2.1).
• The remaining 15 at‑risk communities did not require screening or treatment as their previous year’s prevalence was under 5% (see methodology).
Screening coverage• In 2014, the NT identified 44 communities in the five regions requiring screening for trachoma and all of these
received screening (Table 2.1).
• The proportion of children aged 5‑9 years screened in the 44 communities was 92%, ranging from 79% in Alice Springs Remote region, to 100% in Katherine region (Table 2.2, Figure 2.4).
Clean face prevalence• Clean face prevalence was assessed in all communities that were screened.
• The overall prevalence of clean faces among children aged 5‑9 years in the screened communities was 86%, ranging from 70% in Alice Springs Remote region, to 96% in the Katherine region (Table 2.2, Figure 2.5).
Trachoma prevalence• The observed prevalence of trachoma in children aged 5‑9 years screened in 2014 was 5.5%. Prevalence ranged
from 0.6% in Katherine region to 28.7% in Barkly region (Table 2.2, Figure 2.6a).
• Projecting from the previous year’s data in communities that did not screen due to new guideline implementation (see methodology), the prevalence of trachoma was 5.9%, ranging from 1.1 % in Darwin Rural region to 24.3% in Barkly region (Table 2.2, Figure 2.6b).
• No trachoma was reported in 34 communities in 2014, including communities that screened for trachoma in children aged 5‑9 years and that did not screen in accordance with guidelines (Figure 2.7).
• Endemic levels of trachoma were reported in 38 communities in 2014 including communities that screened for trachoma in children aged 5‑9 years and those that did not screen in 2014 in accordance with guidelines (Figure 2.7).
• Non‑endemic levels of trachoma have been reported for 16 communities over a period of five years which may reclassify these communities as being not at‑risk for trachoma (Figure 2.8).
Nor
ther
n Te
rrito
ry r
esul
ts 2
014
National Trachoma Surveillance Report 2014 27
Treatment delivery and coverage• Trachoma treatment strategies were applied in 43 communities (Table 2.3).
• Treatment was delivered to active cases and households in 17 communities, and to the whole of community in 26 communities as per guidelines (Table 2.3).
• The overall treatment coverage in all regions was 89% with 7,805 doses of azithromycin delivered (Table 2.4).
• One community did not treat according to CDNA guidelines. This community treated active cases and household contacts when whole of community treatment was required, due to resource limitations (Table 2.3).
Trichiasis• Reporting for trichiasis screening was available for 67 communities (Table 2.5).
• Overall 4,852 adults aged over 15 years were reported to be screened (Table 2.5).
• The prevalence of trichiasis in adults aged 15 years and over was 0.6%, and 1.1% in adults aged 40 years and over.
• Surgery for trichiasis was reported to be undertaken for 12 adults in 2014 (Table 2.5).
Health promotion• Health promotion activities were reported to have occurred in 50 communities in the Alice Springs Remote, Barkly,
Darwin Rural, East Arnhem and Katherine regions (Table 2.6).
• A total of 123 health promotion activities were reported (Table 2.6).
• The majority of the health promotion activities were delivered to children, teachers and childcare or preschool staff members (Table 2.6).
Nor
ther
n Te
rrito
ry r
esul
ts 2
014
28
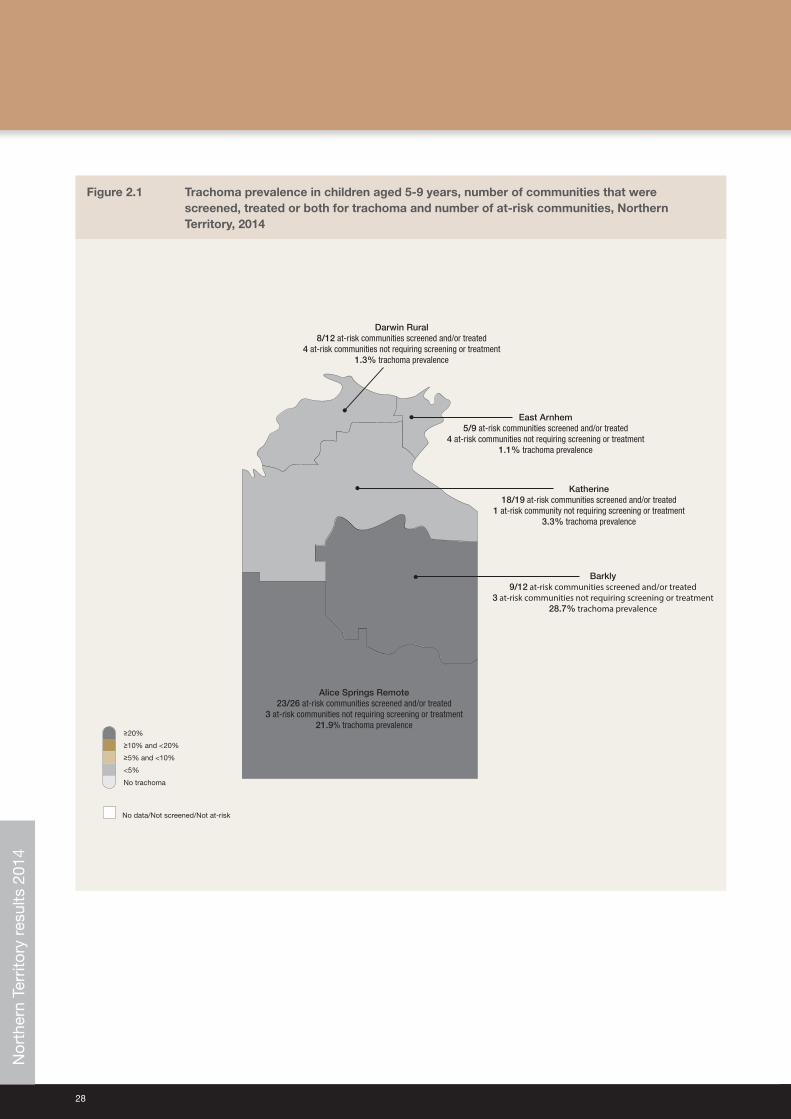
Figure 2.1 Trachoma prevalence in children aged 5‑9 years, number of communities that were screened, treated or both for trachoma and number of at‑risk communities, Northern Territory, 2014
No data/Not screened/Not at-risk
<5%
No trachoma
≥5% and <10%
≥10% and <20%
≥20%
Darwin Rural8/12 at-risk communities screened and/or treated
4 at-risk communities not requiring screening or treatment1.3% trachoma prevalence
East Arnhem5/9 at-risk communities screened and/or treated
4 at-risk communities not requiring screening or treatment1.1% trachoma prevalence
Katherine18/19 at-risk communities screened and/or treated
1 at-risk community not requiring screening or treatment3.3% trachoma prevalence
Barkly9/12 at-risk communities screened and/or treated
3 at-risk communities not requiring screening or treatment28.7% trachoma prevalence
Alice Springs Remote23/26 at-risk communities screened and/or treated
3 at-risk communities not requiring screening or treatment21.9% trachoma prevalence
Nor
ther
n Te
rrito
ry r
esul
ts 2
014
National Trachoma Surveillance Report 2014 29
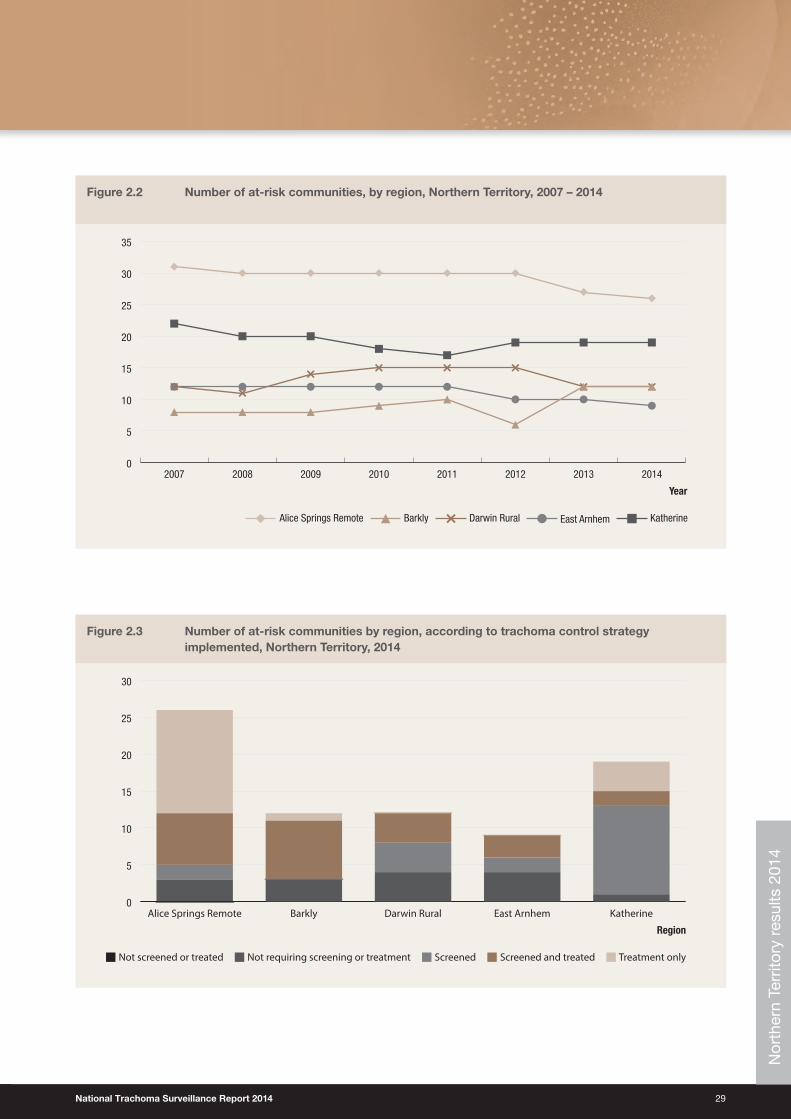
Figure 2.2 Number of at‑risk communities, by region, Northern Territory, 2007 – 2014
0
5
10
15
20
25
30
35
20142013201220112010200920082007
KatherineEast ArnhemDarwin RuralBarklyAlice Springs Remote
Year
Figure 2.3 Number of at‑risk communities by region, according to trachoma control strategy implemented, Northern Territory, 2014
ScreenedNot requiring screening or treatmentNot screened or treated Screened and treated Treatment only
Region
0
5
10
15
20
25
30
KatherineEast ArnhemDarwin RuralBarklyAlice Springs Remote
Nor
ther
n Te
rrito
ry r
esul
ts 2
014
30
Figure 2.4 Population screening coverage of children aged 5‑9 years in communities that required screening for trachoma, by region, Northern Territory, 2014
Screened
%
0
10
20
30
40
50
60
70
80
90
100
KatherineEast ArnhemDarwin RuralBarklyAlice Springs Remote
Region
Figure 2.5 Proportion of screened children aged 5‑9 years who had a clean face, by region, Northern Territory, 2007 – 2014
0
10
20
30
40
50
60
70
80
90
100
20142013201220112010200920082007
KatherineEast ArnhemDarwin RuralBarklyAlice Springs Remote
%
Year
Nor
ther
n Te
rrito
ry r
esul
ts 2
014
National Trachoma Surveillance Report 2014 31
Figure 2.6 a. Trachoma prevalence among children aged 5‑9 years in communities that were screened, by region, Northern Territory, 2007 – 2014
0
10
20
30
40
50
60
70
20142013201220112010200920082007
KatherineEast ArnhemDarwin RuralBarklyAlice Springs Remote
%
Year
Figure 2.6 b. Trachoma prevalence among children aged 5‑9 years, by region, Northern Territory with projected values,* 2007 – 2014
0
10
20
30
40
50
60
70
20142013201220112010200920082007
KatherineEast ArnhemDarwin RuralBarklyAlice Springs Remote
%
Year
* Including communities that screened in 2014 and those that were not required to screen in 2014, in accordance with guidelines (see methodology)
Nor
ther
n Te
rrito
ry r
esul
ts 2
014
32
Figure 2.7 Number of at‑risk communities according to level of trachoma prevalence* in children aged 5‑9, by region, Northern Territory, 2014
≥5% but <10% ≥10% but <20%≥20% >0% but <5% 0%
0
5
10
15
20
25
30
Region
Katherine (n=19)East Arnhem (n=9)Katherine (n=19)Barkly (n=12)Alice Springs Remote (n=26)
* Including communities that screened in 2014 and those that were not required to screen in 2014, in accordance with guidelines (see methodology)
Figure 2.8 Communities according to number of years* of trachoma prevalence under 5%, by region,† Northern Territory, 2014
3 years2 years1 year 4 years 5+ years
0
2
4
6
8
10
12
Region
14
KatherineEast ArnhemDarwin RuralBarklyAlice Springs Remote
* Five years with a prevalence below 5% classifies a community as not at‑risk of trachoma† Including communities that screened in 2014 and those that were not required to screen in 2014, in accordance with guideline instructions
(see methodology)Nor
ther
n Te
rrito
ry r
esul
ts 2
014
National Trachoma Surveillance Report 2014 33
Figure 2.9 Number of doses of azithromycin administered for the treatment of trachoma, by region, Northern Territory, 2007 – 2014
0
1,000
2,000
3,000
4,000
5,000
6,000
20142013201220112010200920082007
KatherineEast ArnhemDarwin RuralBarklyAlice Springs Remote
Year
Nor
ther
n Te
rrito
ry r
esul
ts 2
014
34
Table 2.1 Trachoma control delivery, Northern Territory, 2014
Number of communitiesAlice Springs
Remote Barkly Darwin Rural East Arnhem Katherine Total Not at‑risk
At-risk (A) 26 12 12 9 19 78 3
Requiring screening for trachoma (B) 9 8 8 5 14 44 N/A
Screened for trachoma (C) 9 8 8 5 14 44 3
Requiring treatment only (D) 14 1 0 0 4 19 N/A
Treated * (E) 14 1 0 0 4 19 N/A
Screened and/or treated for trachoma (F = C+E) 23 9 8 5 18 63 3
Requiring neither screening or treatment for trachoma (G=A-B-D) 3 3 4 4 1 15 N/A
* Communities treated without screening in 2014 according to guideline instructions
National Trachoma Surveillance Report 2014 35
Tab
le 2
.2
Trac
hom
a sc
reen
ing
co
vera
ge,
tra
cho
ma
pre
vale
nce
and
cle
an f
ace
pre
vale
nce
in c
hild
ren,
by
age
gro
up, N
ort
hern
Ter
rito
ry, 2
014
Alic
e Sp
rings
Rem
ote
Bark
lyDa
rwin
Rur
alEa
st A
rnhe
mKa
ther
ine
Tota
lNo
t at‑
risk
Num
ber o
f com
mun
ities
sc
reen
ed9
88
514
443
Age
grou
p (y
ears
)0‑
45‑
910
‑14
0‑14
0‑4
5‑9
10‑1
40‑
140‑
45‑
910
‑14
0‑14
0‑4
5‑9
10‑1
40‑
140‑
45‑
910
‑14
0‑14
0‑4
5‑9
10‑1
40‑
140‑
45‑
910
‑14
0‑14
Child
ren
exam
ined
for c
lean
face
4719
713
337
721
169
123
313
6046
313
265
536
452
8357
118
523
5960
018
21,
804
530
2,51
613
312
9642
1
Child
ren
with
cle
an fa
ce20
138
121
279
1713
111
826
649
356
129
534
3042
081
531
1450
059
573
130
1,54
550
82,
183
626
694
366
Clea
n fa
ce p
reva
lenc
e (%
)43
7091
7481
7896
8582
7798
8283
9398
9378
9610
096
7186
9687
4685
9887
Estim
ated
num
ber*
of A
borig
inal
ch
ildre
n in
com
mun
ities
†13
221
517
251
931
181
185
397
420
489
629
1,53
840
350
569
41,
602
456
547
593
1,59
61,
442
1,93
72,
273
5,65
248
317
122
487
Child
ren
exam
ined
for t
rach
oma
1616
911
329
821
167
122
310
5145
912
563
530
449
8356
217
545
5962
113
51,
789
502
2,42
611
309
9641
6
Trac
hom
a sc
reen
ing
cove
rage
(%)
1279
6657
6892
6678
1294
2041
789
1235
410
010
399
9222
4323
9779
85
Child
ren
with
act
ive
trach
oma
737
650
448
1567
06
06
05
38
03
03
1199
2413
40
121
13
Obse
rved
trac
hom
a pr
eval
ence
(%)
43.8
21.9
5.3
16.8
19.0
28.7
12.3
21.6
0.0
1.3
0.0
0.9
0.0
1.1
3.6
1.4
0.0
0.6
0.0
0.5
8.1
5.5
4.8
5.5
0.0
3.9
1.0
3.1
Obse
rved
trac
hom
a pr
eval
ence
us
ing
proj
ecte
d da
ta16
.024
.31.
11.
23.
35.
9
* Ju
risd
ictio
nal e
stim
ate
† In
com
mun
ities
tha
t w
ere
scre
ened
for
trac
hom
a
Tab
le 2
.3
Trea
tmen
t st
rate
gie
s, b
y re
gio
n, N
ort
hern
Ter
rito
ry, 2
014
Num
ber o
f com
mun
ities
Alic
e Sp
rings
Rem
ote
Bark
lyDa
rwin
Rur
alEa
st A
rnhe
mKa
ther
ine
Tota
l
Requ
ired
treat
men
t for
trac
hom
a*21
94
36
43
Trea
ted
for t
rach
oma*
219
43
643
Scre
ened
and
trea
ted
78
43
224
Rece
ived
trea
tmen
t onl
y14
10
04
19
Rece
ived
6-m
onth
ly tr
eatm
ent
31
00
26
Did
not r
equi
re tr
eatm
ent
64
96
1338
Trea
ted
activ
e ca
ses
and
hous
ehol
ds4
44
32
17
Trea
ted
the
who
le o
f com
mun
ity17
50
04
26
Not t
reat
ed a
ccor
ding
to C
DNA
guid
elin
es0
10
00
1
* In
clud
ing
com
mun
ities
des
igna
ted
as
not
at‑r
isk
Nor
ther
n Te
rrito
ry r
esul
ts 2
014
36
Tab
le 2
.4
Trac
hom
a tr
eatm
ent
cove
rag
e,* b
y ag
e g
roup
, No
rthe
rn T
erri
tory
, 201
4
Alic
e Sp
rings
Rem
ote
Bark
lyDa
rwin
Rur
alEa
st A
rnhe
mKa
ther
ine
Tota
l
Age
grou
p (y
ears
)0‑
45‑
910
‑14
15+
All
0‑4
5‑9
10‑1
415
+Al
l0‑
45‑
910
‑14
15+
All
0‑4
5‑9
10‑1
415
+Al
l0‑
45‑
910
‑14
15+
All
0‑4
5‑9
10‑1
415
+Al
l
Activ
e ca
ses
requ
iring
tre
atm
ent
740
653
457
1677
06
06
05
38
02
02
1111
025
146
Activ
e ca
ses
who
rece
ived
tre
atm
ent
737
650
452
1571
06
06
05
05
02
02
1110
221
134
Activ
e ca
ses
who
rece
ived
tre
atm
ent (
%)
100
9310
094
100
9194
9210
010
010
00
6310
010
010
093
8492
Estim
ated
con
tact
s re
quiri
ng
treat
men
t64
881
465
74,
171
6,29
067
6593
367
592
104
1138
631
612
4059
200
215
229
1,00
61,
650
926
1,10
41,
002
5,62
28,
654
Num
ber o
f con
tact
s w
ho
rece
ived
trea
tmen
t57
376
059
03,
616
5,53
966
6185
353
565
94
1134
581
612
4059
173
197
209
871
1,45
082
21,
028
907
4,91
47,
671
Estim
ated
con
tact
s w
ho
rece
ived
trea
tmen
t (%
)88
9390
8788
9994
9196
9590
100
100
8992
100
100
100
100
100
8792
9187
8889
9391
8789
Num
ber o
f dos
es o
f az
ithro
myc
in d
eliv
ered
580
797
596
3,61
65,
589
7011
310
035
363
69
1011
3464
111
1240
6417
319
920
987
11,
452
833
1,13
092
84,
914
7,80
5
Estim
ated
ove
rall
treat
men
t co
vera
ge (%
)89
9390
8788
9993
9296
9590
100
100
8993
100
100
8010
096
8792
9187
8889
9390
8789
* In
clud
ing
in c
omm
uniti
es d
esig
nate
d a
s no
t at
‑ris
k
Tab
le 2
.5
Tric
hias
is s
cree
ning
co
vera
ge,
pre
vale
nce
and
tre
atm
ent
amo
ng A
bo
rig
inal
ad
ults
, No
rthe
rn T
erri
tory
, 201
4
Alic
e Sp
rings
Rem
ote
Bark
lyDa
rwin
Rur
alEa
st A
rnhe
mKa
ther
ine
Tota
l
Num
ber o
f com
mun
ities
sc
reen
ed fo
r tric
hias
is21
415
819
67
Age
grou
p (y
ears
)15
‑39
40+
15‑3
940
+15
‑39
40+
15‑3
940
+15
‑39
40+
15‑3
940
+15
+
Estim
ated
pop
ulat
ion
in
regi
on*
5,89
31,
801
1,20
628
57,
686
2,15
86,
289
1,86
84,
409
1,11
925
,483
7,23
132
,714
Adul
ts e
xam
ined
491
431
5982
886
475
419
206
718
1,08
52,
573
2,27
94,
852
With
tric
hias
is (%
of a
dults
ex
amin
ed)
1 (0
.2)
14 (3
.2)
00
00
01
(0.5
)1
(0.1
)11
(1)
2 (0
.08)
25 (1
.1)
27 (0
.6)
Offe
red
opht
halm
ic
cons
ulta
tion
05
00
00
00
18
113
14
Decl
ined
oph
thal
mic
co
nsul
tatio
n0
40
00
00
01
31
78
Surg
ery
in p
ast 1
2 m
onth
s0
100
20
00
00
00
1212
* P
opul
atio
n es
timat
e lim
ited
to
trac
hom
a en
dem
ic r
egio
ns a
nd d
oes
not
take
into
acc
ount
cha
ngin
g en
dem
ic r
egio
ns o
ver
time
and
tra
nsie
ncy
bet
wee
n re
gion
s†
Num
ber
of a
dul
ts e
xam
ined
lim
ited
to
num
ber
s re
por
ted
. Thi
s nu
mb
er d
oes
not
acco
unt
for
adul
ts w
ho m
ay b
e ex
amin
ed in
rou
tine
adul
t he
alth
che
cks,
and
may
als
o in
clud
e m
ultip
le s
cree
ning
Nor
ther
n Te
rrito
ry r
esul
ts 2
014
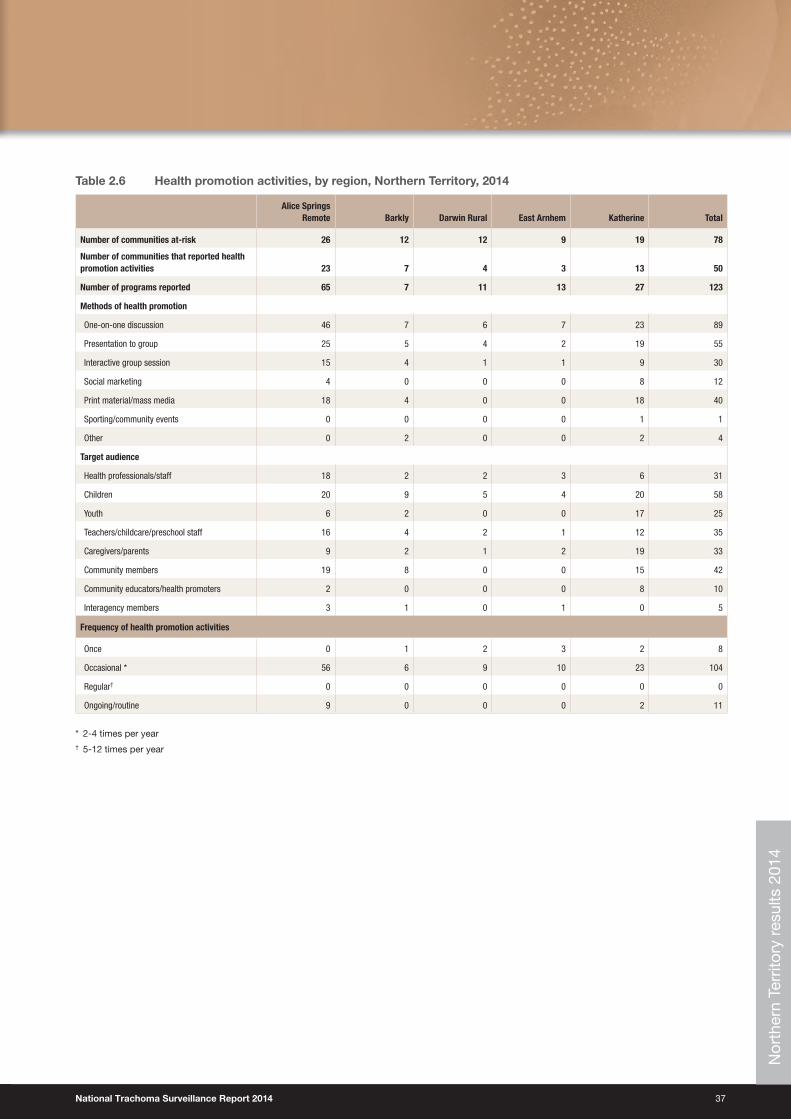
National Trachoma Surveillance Report 2014 37
Table 2.6 Health promotion activities, by region, Northern Territory, 2014
Alice Springs Remote Barkly Darwin Rural East Arnhem Katherine Total
Number of communities at‑risk 26 12 12 9 19 78
Number of communities that reported health promotion activities 23 7 4 3 13 50
Number of programs reported 65 7 11 13 27 123
Methods of health promotion
One-on-one discussion 46 7 6 7 23 89
Presentation to group 25 5 4 2 19 55
Interactive group session 15 4 1 1 9 30
Social marketing 4 0 0 0 8 12
Print material/mass media 18 4 0 0 18 40
Sporting/community events 0 0 0 0 1 1
Other 0 2 0 0 2 4
Target audience
Health professionals/staff 18 2 2 3 6 31
Children 20 9 5 4 20 58
Youth 6 2 0 0 17 25
Teachers/childcare/preschool staff 16 4 2 1 12 35
Caregivers/parents 9 2 1 2 19 33
Community members 19 8 0 0 15 42
Community educators/health promoters 2 0 0 0 8 10
Interagency members 3 1 0 1 0 5
Frequency of health promotion activities
Once 0 1 2 3 2 8
Occasional * 56 6 9 10 23 104
Regular† 0 0 0 0 0 0
Ongoing/routine 9 0 0 0 2 11
* 2‑4 times per year† 5‑12 times per year
Nor
ther
n Te
rrito
ry r
esul
ts 2
014
38
Health promotion summaryIn 2014, trachoma health promotion in the Northern Territory focused on broad, hygiene‑related messages. Working with partners on messages that were relevant to all hygiene‑related illnesses (such as skin, ear and respiratory illnesses) allowed the trachoma program greater reach in spreading the ‘clean faces’ message. As in previous years, strong support for trachoma health promotion was provided by the Indigenous Eye Health Unit based at the University of Melbourne, the Fred Hollows Foundation and Central Australian Aboriginal Congress.
A new ‘No Germs on Me’ campaign was launched by the Environmental Health Branch, in 2014. The new campaign included animated facial germs (nasal discharge) in its advertisements, in conjunction with hand germs. This inclusion of facial germs ties in very closely with the ‘Clean Faces, Strong Eyes’ focus of the Northern Territory trachoma program.
A ‘4 Step Hygiene’ poster was developed in 2014. This poster depicts nose blowing, hand washing, face washing and drying either with paper towels or air drying. The poster has been very well received by communities in 2014, with requests for additional posters and print material to be made available to schools and early childhood settings. Early childhood settings have reported the visual prompts that incorporate all aspects of daily hygiene as beneficial in promoting hygiene practices in children.
The Melbourne Football Club made two visits to the Northern Territory in 2014. Both visits allowed an opportunity for trachoma health promotion at football clinics, and resulted in media coverage for the trachoma program and Milpa, the trachoma goanna, who was present at all events. Television advertising and radio community service announcements focusing on trachoma elimination messages were also conducted in 2014.
Community members who received screening or treatment for trachoma were also given individual education regarding trachoma at the time of screening or treatment. Although resource intensive, anecdotally this approach leads to a greater understanding of trachoma awareness and education. Communities receiving community‑wide treatments have requested further information to help them understand the treatment cycles. Work on a poster to provide visual information regarding treatment cycles has begun in 2014, and will continue to be refined in 2015.
National Trachoma Surveillance Report 2014 39
South Australia results 2014
Trachoma program coverage• In 2014 SA identified 13 communities in three regions as being at‑risk of trachoma (Table 3.1).
• All 13 at‑risk communities were screened for trachoma (Table 3.1).
• In 2014 the Anangu Pitjantjatjara Yankunytjatjara (APY) Lands aggregated nine communities into one single community to simplify surveillance due to small population size of communities and high mobility between communities.
• SA also screened one not at‑risk community in the Yorke and Mid North region.
Screening coverage• Population screening coverage of children aged 5‑9 years in the 13 at‑risk communities screened was 87%, ranging
from 85% in the APY Lands to 89% in the Far North region (Table 3.2, Figure 3.4)
Clean face prevalence• Clean face prevalence was assessed in all communities that were screened.
• The overall proportion of clean faces among children aged 5‑9 years in the screened communities was 84%, ranging from 60% in the APY Lands, to 100% in the Yorke and Mid North region (Table 3.2, Figure 3.5).
Trachoma prevalence• The prevalence of trachoma in children aged 5‑9 years screened was 4%. Prevalence ranged from 0% in the Yorke
and Mid North region to 9.6% in the APY Lands (Table 3.2, Figure 3.6).
• No trachoma was reported in 10 communities (Figure 3.7).
• Endemic levels of trachoma were reported in two communities (Figure 3.7).
• Non‑endemic levels of trachoma have been reported for two communities over a period of five years which may reclassify these communities as being not at‑risk for trachoma (Figure 3.8).
Treatment delivery and coverage• Trachoma treatment strategies were applied in three communities (Table 3.3).
• Treatment was delivered to active cases and households in three communities (Table 3.3).
• The overall treatment coverage in all regions was 98% with 200 doses of azithromycin delivered (Table 3.4).
Trichiasis• Screening for trichiasis was undertaken in 13 communities (Table 3.5).
• Overall 1,809 adults aged 15 years and over were screened (Table 3.5).
• The prevalence of trichiasis in adults aged 15 years and over was 0.7%, and 1% in adults aged 40 years and over (Table 3.5).
• Surgery for trichiasis was reported to be undertaken for 4 adults (Table 3.5).
Health promotion• Health promotion activities were reported to have occurred in 14 communities in APY Lands, Eyre and Western, Far
North and Yorke and Mid North regions of SA (Table 3.6).
• A total of 30 health promotion activities were reported (Table 3.6).
• The majority of the health promotion activities were delivered to children, teachers, childcare or preschool staff members and care givers (Table 3.6). S
outh
Aus
tral
ia r
esul
ts 2
014
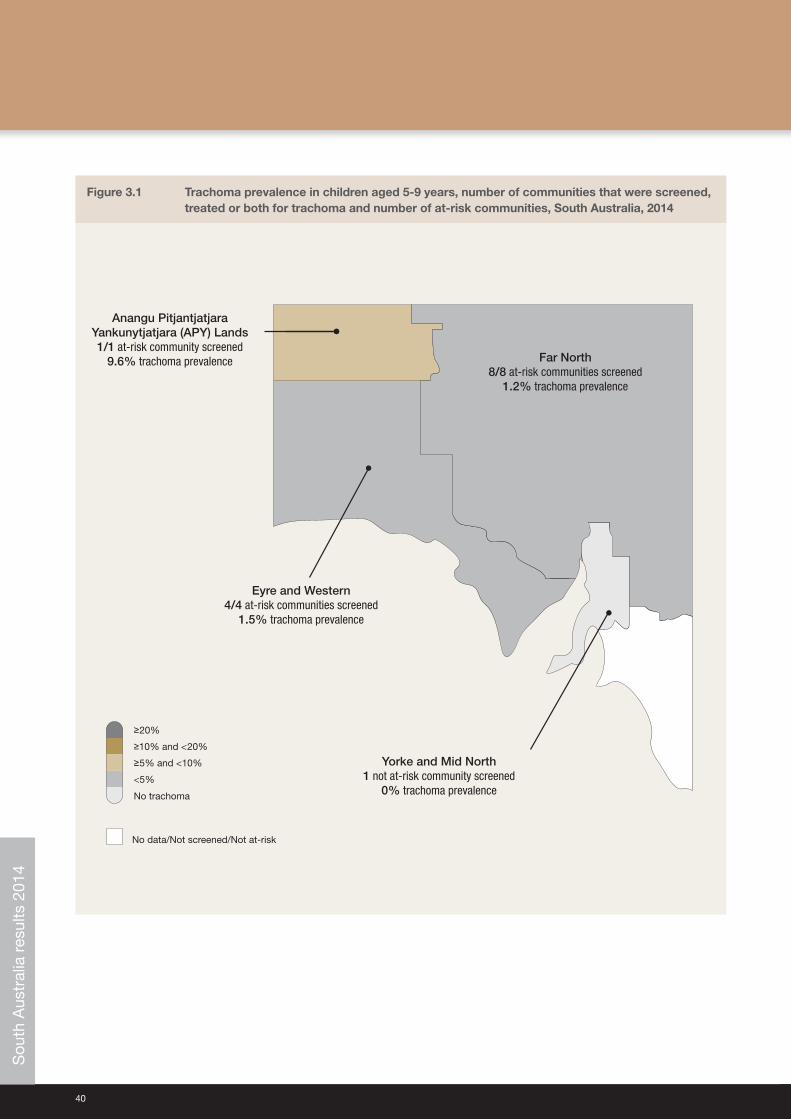
40
Figure 3.1 Trachoma prevalence in children aged 5‑9 years, number of communities that were screened, treated or both for trachoma and number of at‑risk communities, South Australia, 2014
No data/Not screened/Not at-risk
<5%
No trachoma
≥5% and <10%
≥10% and <20%
≥20%
Far North8/8 at-risk communities screened
1.2% trachoma prevalence
Eyre and Western4/4 at-risk communities screened
1.5% trachoma prevalence
Anangu PitjantjatjaraYankunytjatjara (APY) Lands1/1 at-risk community screened
9.6% trachoma prevalence
Yorke and Mid North 1 not at-risk community screened
0% trachoma prevalence
Sou
th A
ustr
alia
res
ults
201
4
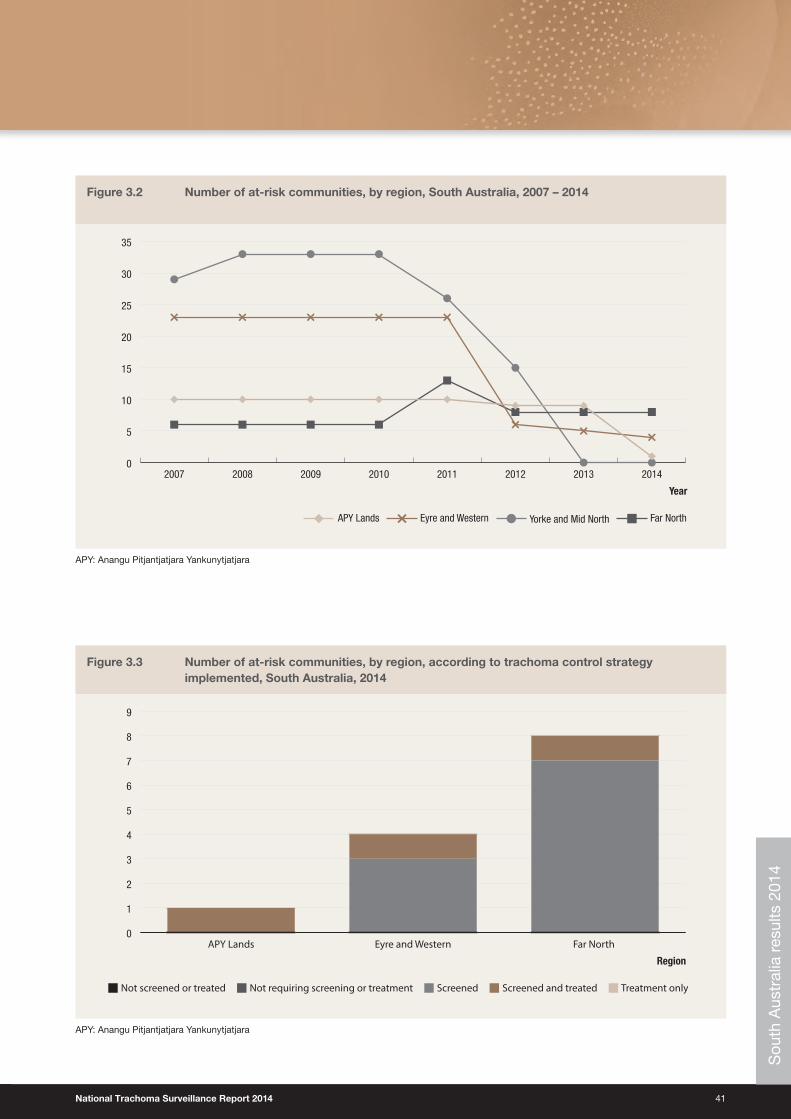
National Trachoma Surveillance Report 2014 41
Figure 3.2 Number of at‑risk communities, by region, South Australia, 2007 – 2014
0
5
10
15
20
25
30
35
20142013201220112010200920082007
Year
Far NorthYorke and Mid NorthAPY Lands Eyre and Western
APY: Anangu Pitjantjatjara Yankunytjatjara
Figure 3.3 Number of at‑risk communities, by region, according to trachoma control strategy implemented, South Australia, 2014
ScreenedNot requiring screening or treatmentNot screened or treated Screened and treated Treatment only
Region
0
1
2
3
4
5
6
7
8
9
Far North Eyre and WesternAPY Lands
APY: Anangu Pitjantjatjara Yankunytjatjara
Sou
th A
ustr
alia
res
ults
201
4
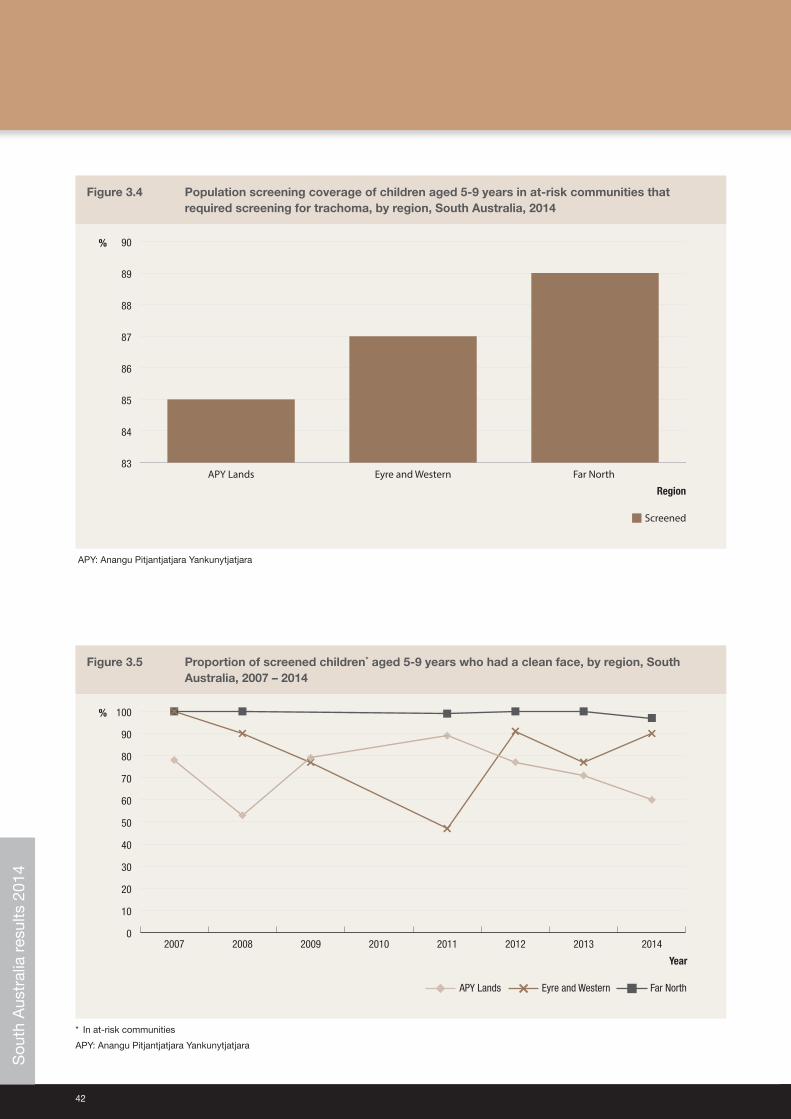
42
Figure 3.4 Population screening coverage of children aged 5‑9 years in at‑risk communities that required screening for trachoma, by region, South Australia, 2014
%
Screened
83
84
85
86
87
88
89
90
Far North Eyre and WesternAPY Lands
Region
APY: Anangu Pitjantjatjara Yankunytjatjara
Figure 3.5 Proportion of screened children* aged 5‑9 years who had a clean face, by region, South Australia, 2007 – 2014
Year
0
10
20
30
40
50
60
70
80
90
100
20142013201220112010200920082007
Far NorthAPY Lands Eyre and Western
%
* In at‑risk communities
APY: Anangu Pitjantjatjara Yankunytjatjara
Sou
th A
ustr
alia
res
ults
201
4
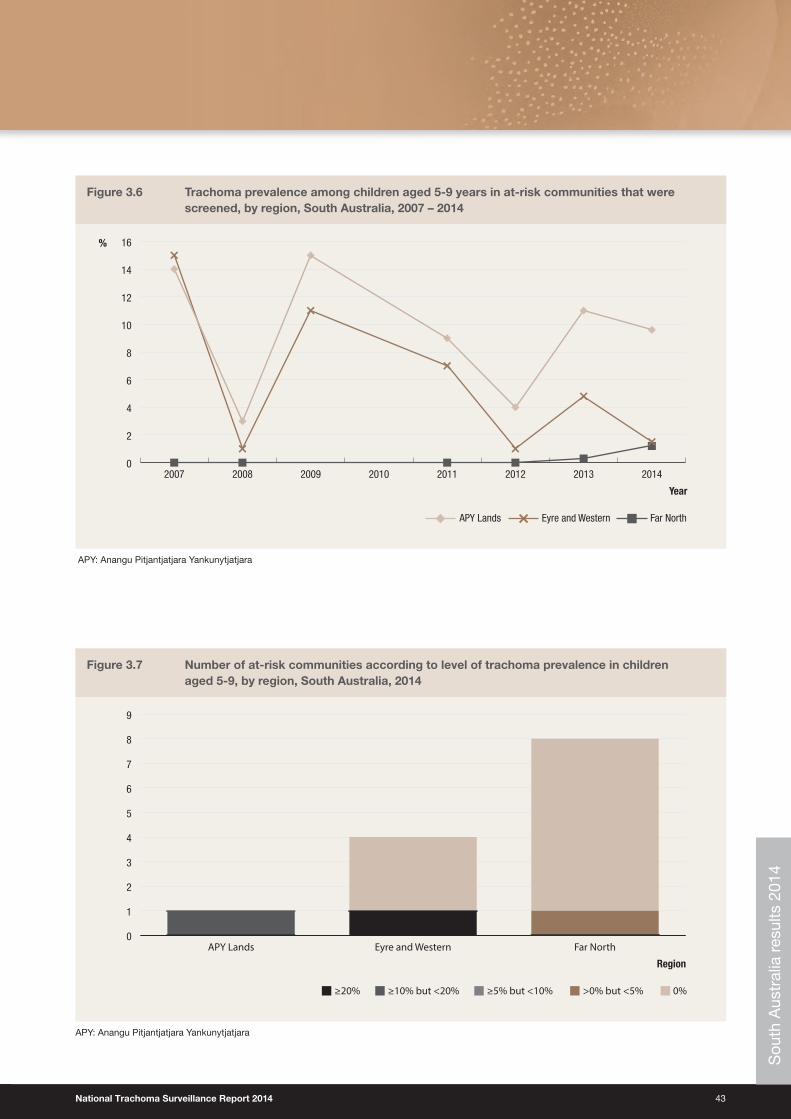
National Trachoma Surveillance Report 2014 43
Figure 3.6 Trachoma prevalence among children aged 5‑9 years in at‑risk communities that were screened, by region, South Australia, 2007 – 2014
0
2
4
6
8
10
12
14
16
20142013201220112010200920082007
Far NorthAPY Lands Eyre and Western
%
Year
APY: Anangu Pitjantjatjara Yankunytjatjara
Figure 3.7 Number of at‑risk communities according to level of trachoma prevalence in children aged 5‑9, by region, South Australia, 2014
≥5% but <10% ≥10% but <20%≥20% >0% but <5% 0%
0
1
2
3
4
5
6
7
8
9
Far NorthEyre and WesternAPY Lands
Region
APY: Anangu Pitjantjatjara Yankunytjatjara
Sou
th A
ustr
alia
res
ults
201
4
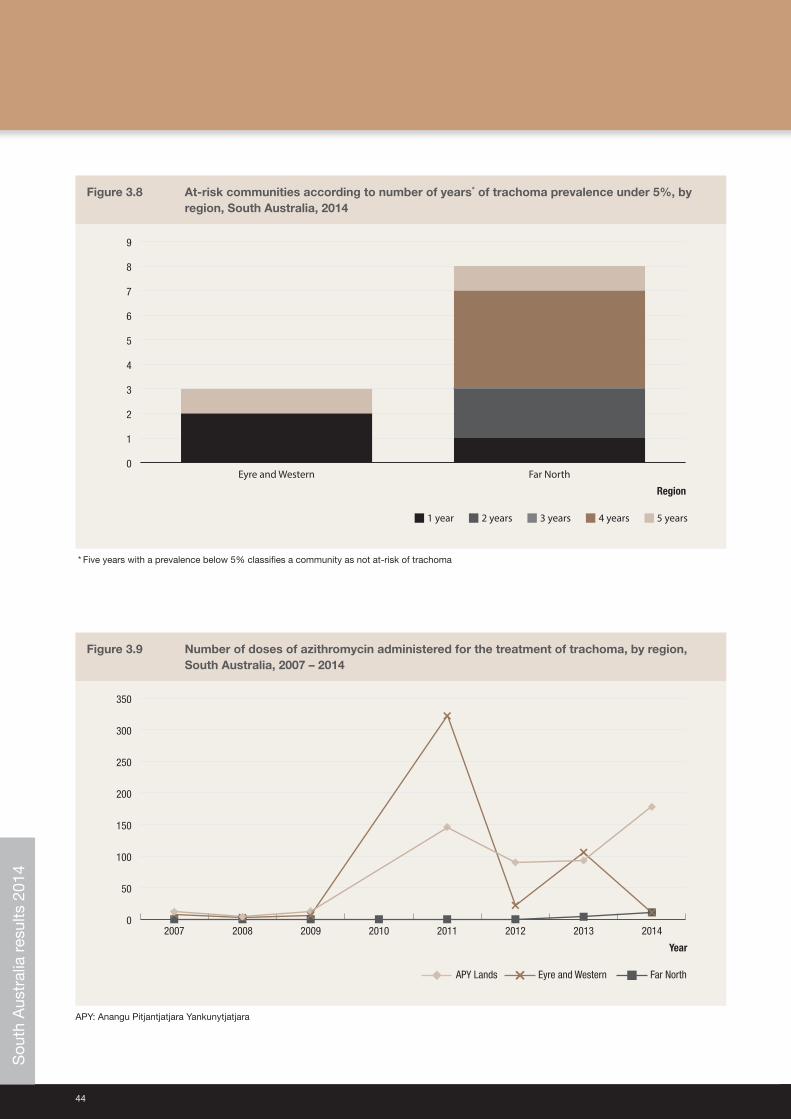
44
Figure 3.8 At‑risk communities according to number of years* of trachoma prevalence under 5%, by region, South Australia, 2014
3 years2 years1 year 4 years 5 years
0
1
2
3
4
5
6
7
8
9
Far NorthEyre and Western
Region
* Five years with a prevalence below 5% classifies a community as not at‑risk of trachoma
Figure 3.9 Number of doses of azithromycin administered for the treatment of trachoma, by region, South Australia, 2007 – 2014
0
50
100
150
200
250
300
350
20142013201220112010200920082007
Far NorthAPY Lands Eyre and Western
Year
APY: Anangu Pitjantjatjara Yankunytjatjara
Sou
th A
ustr
alia
res
ults
201
4
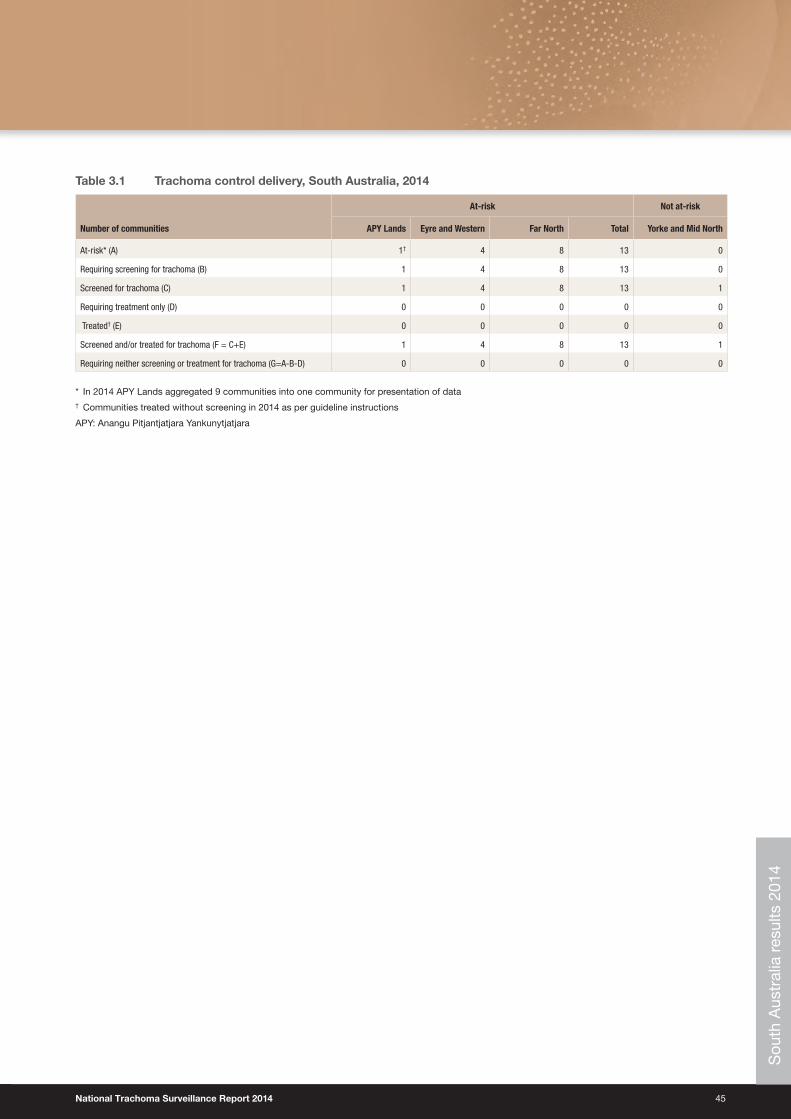
National Trachoma Surveillance Report 2014 45
Table 3.1 Trachoma control delivery, South Australia, 2014
Number of communities
At‑risk Not at‑risk
APY Lands Eyre and Western Far North Total Yorke and Mid North
At‑risk* (A) 1† 4 8 13 0
Requiring screening for trachoma (B) 1 4 8 13 0
Screened for trachoma (C) 1 4 8 13 1
Requiring treatment only (D) 0 0 0 0 0
Treated† (E) 0 0 0 0 0
Screened and/or treated for trachoma (F = C+E) 1 4 8 13 1
Requiring neither screening or treatment for trachoma (G=A‑B‑D) 0 0 0 0 0
* In 2014 APY Lands aggregated 9 communities into one community for presentation of data† Communities treated without screening in 2014 as per guideline instructions
APY: Anangu Pitjantjatjara Yankunytjatjara
Sou
th A
ustr
alia
res
ults
201
4
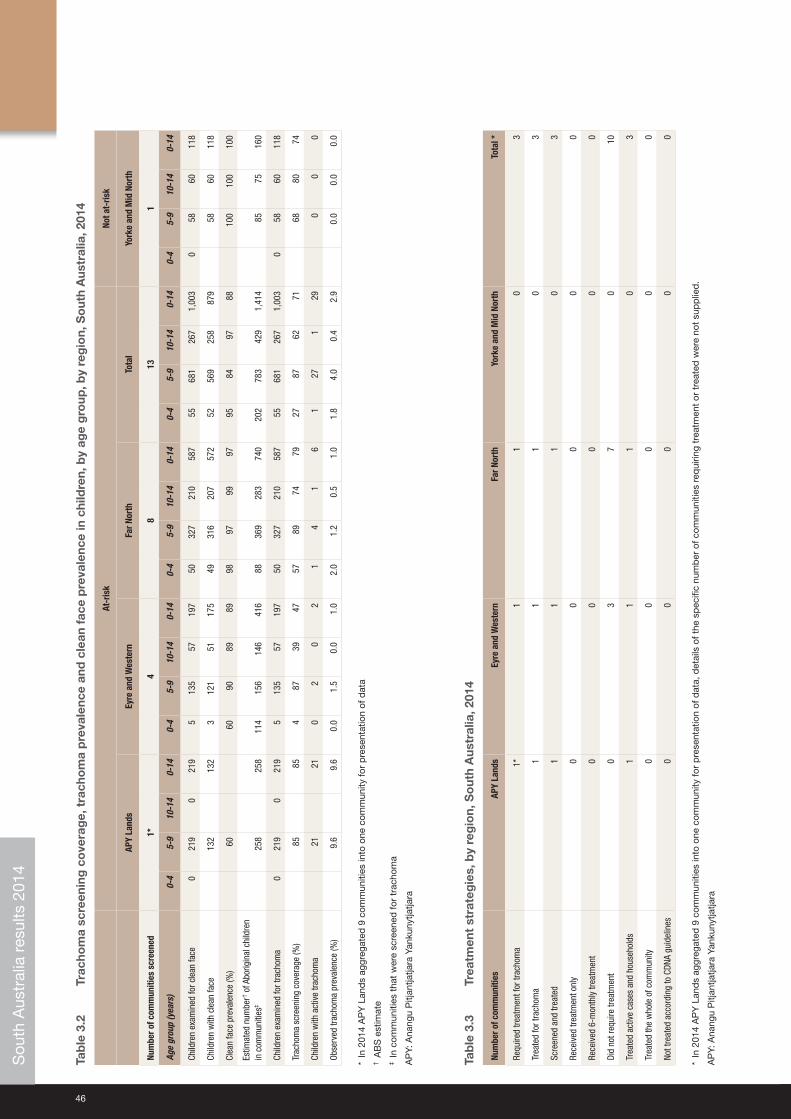
46
Tab
le 3
.2
Trac
hom
a sc
reen
ing
co
vera
ge,
tra
cho
ma
pre
vale
nce
and
cle
an f
ace
pre
vale
nce
in c
hild
ren,
by
age
gro
up, b
y re
gio
n, S
out
h A
ustr
alia
, 201
4
At‑r
isk
Not a
t‑ris
k
APY
Land
sEy
re a
nd W
este
rnFa
r Nor
thTo
tal
York
e an
d M
id N
orth
Num
ber o
f com
mun
ities
scr
eene
d1*
48
131
Age
grou
p (y
ears
)0‑
45‑
910
‑14
0‑14
0‑4
5‑9
10‑1
40‑
140‑
45‑
910
‑14
0‑14
0‑4
5‑9
10‑1
40‑
140‑
45‑
910
‑14
0‑14
Child
ren
exam
ined
for c
lean
face
021
90
219
513
557
197
5032
721
058
755
681
267
1,00
30
5860
118
Child
ren
with
cle
an fa
ce13
213
23
121
5117
549
316
207
572
5256
925
887
958
6011
8
Clea
n fa
ce p
reva
lenc
e (%
)60
6090
8989
9897
9997
9584
9788
100
100
100
Estim
ated
num
ber† o
f Abo
rigin
al c
hild
ren
in c
omm
uniti
es‡
258
258
114
156
146
416
8836
928
374
020
278
342
91,
414
8575
160
Child
ren
exam
ined
for t
rach
oma
021
90
219
513
557
197
5032
721
058
755
681
267
1,00
30
5860
118
Trac
hom
a sc
reen
ing
cove
rage
(%)
8585
487
3947
5789
7479
2787
6271
6880
74
Child
ren
with
act
ive
trach
oma
2121
02
02
14
16
127
129
00
0
Obse
rved
trac
hom
a pr
eval
ence
(%)
9.6
9.6
0.0
1.5
0.0
1.0
2.0
1.2
0.5
1.0
1.8
4.0
0.4
2.9
0.0
0.0
0.0
* In
201
4 A
PY
Lan
ds
aggr
egat
ed 9
com
mun
ities
into
one
com
mun
ity fo
r p
rese
ntat
ion
of d
ata
† A
BS
est
imat
e‡
In c
omm
uniti
es t
hat
wer
e sc
reen
ed fo
r tr
acho
ma
AP
Y: A
nang
u P
itjan
tjatja
ra Y
anku
nytja
tjara
Tab
le 3
.3
Trea
tmen
t st
rate
gie
s, b
y re
gio
n, S
out
h A
ustr
alia
, 201
4
Num
ber o
f com
mun
ities
APY
Land
sEy
re a
nd W
este
rnFa
r Nor
thYo
rke
and
Mid
Nor
thTo
tal *
Requ
ired
treat
men
t for
trac
hom
a1*
11
03
Trea
ted
for t
rach
oma
11
10
3
Scre
ened
and
trea
ted
11
10
3
Rece
ived
trea
tmen
t onl
y0
00
00
Rece
ived
6‑m
onth
ly tr
eatm
ent
00
00
0
Did
not r
equi
re tr
eatm
ent
03
70
10
Trea
ted
activ
e ca
ses
and
hous
ehol
ds1
11
03
Trea
ted
the
who
le o
f com
mun
ity0
00
00
Not t
reat
ed a
ccor
ding
to C
DNA
guid
elin
es0
00
00
* In
201
4 A
PY
Lan
ds
aggr
egat
ed 9
com
mun
ities
into
one
com
mun
ity fo
r p
rese
ntat
ion
of d
ata,
det
ails
of t
he s
pec
ific
num
ber
of c
omm
uniti
es r
equi
ring
trea
tmen
t or
tre
ated
wer
e no
t su
pp
lied
.
AP
Y: A
nang
u P
itjan
tjatja
ra Y
anku
nytja
tjara
Sou
th A
ustr
alia
res
ults
201
4
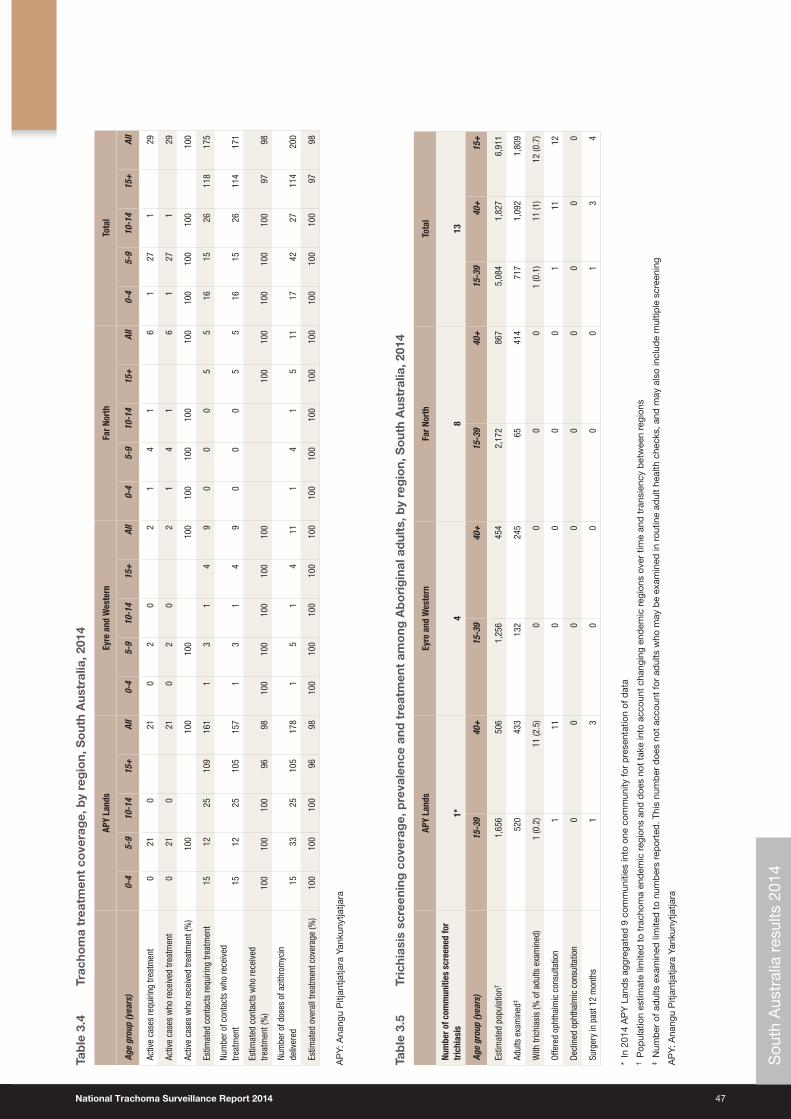
National Trachoma Surveillance Report 2014 47
Tab
le 3
.4
Trac
hom
a tr
eatm
ent
cove
rag
e, b
y re
gio
n, S
out
h A
ustr
alia
, 201
4
APY
Land
sEy
re a
nd W
este
rnFa
r Nor
thTo
tal
Age
grou
p (y
ears
)0‑
45‑
910
‑14
15+
All
0‑4
5‑9
10‑1
415
+Al
l0‑
45‑
910
‑14
15+
All
0‑4
5‑9
10‑1
415
+Al
l
Activ
e ca
ses
requ
iring
trea
tmen
t0
210
210
20
21
41
61
271
29
Activ
e ca
ses
who
rece
ived
trea
tmen
t0
210
210
20
21
41
61
271
29
Activ
e ca
ses
who
rece
ived
trea
tmen
t (%
)10
010
010
010
010
010
010
010
010
010
010
010
0
Estim
ated
con
tact
s re
quiri
ng tr
eatm
ent
1512
2510
916
11
31
49
00
05
516
1526
118
175
Num
ber o
f con
tact
s w
ho re
ceiv
ed
treat
men
t15
1225
105
157
13
14
90
00
55
1615
2611
417
1
Estim
ated
con
tact
s w
ho re
ceiv
ed
treat
men
t (%
)10
010
010
096
9810
010
010
010
010
010
010
010
010
010
097
98
Num
ber o
f dos
es o
f azi
thro
myc
in
deliv
ered
1533
2510
517
81
51
411
14
15
1117
4227
114
200
Estim
ated
ove
rall
treat
men
t cov
erag
e (%
)10
010
010
096
9810
010
010
010
010
010
010
010
010
010
010
010
010
097
98
AP
Y: A
nang
u P
itjan
tjatja
ra Y
anku
nytja
tjara
Tab
le 3
.5
Tric
hias
is s
cree
ning
co
vera
ge,
pre
vale
nce
and
tre
atm
ent
amo
ng A
bo
rig
inal
ad
ults
, by
reg
ion,
So
uth
Aus
tral
ia, 2
014
APY
Land
sEy
re a
nd W
este
rnFa
r Nor
thTo
tal
Num
ber o
f com
mun
ities
scr
eene
d fo
r tr
ichi
asis
1*4
813
Age
grou
p (y
ears
)15
‑39
40+
15‑3
940
+15
‑39
40+
15‑3
940
+15
+
Estim
ated
pop
ulat
ion†
1,65
650
61,
256
454
2,17
286
75,
084
1,82
76,
911
Adul
ts e
xam
ined
‡52
043
313
224
565
414
717
1,09
21,
809
With
tric
hias
is (%
of a
dults
exa
min
ed)
1 (0
.2)
11 (2
.5)
00
00
1 (0
.1)
11 (1
)12
(0.7
)
Offe
red
opht
halm
ic c
onsu
ltatio
n1
110
00
01
1112
Decl
ined
oph
thal
mic
con
sulta
tion
00
00
00
00
0
Surg
ery
in p
ast 1
2 m
onth
s1
30
00
01
34
* In
201
4 A
PY
Lan
ds
aggr
egat
ed 9
com
mun
ities
into
one
com
mun
ity fo
r p
rese
ntat
ion
of d
ata
† P
opul
atio
n es
timat
e lim
ited
to
trac
hom
a en
dem
ic r
egio
ns a
nd d
oes
not
take
into
acc
ount
cha
ngin
g en
dem
ic r
egio
ns o
ver
time
and
tra
nsie
ncy
bet
wee
n re
gion
s‡
Num
ber
of a
dul
ts e
xam
ined
lim
ited
to
num
ber
s re
por
ted
. Thi
s nu
mb
er d
oes
not
acco
unt
for
adul
ts w
ho m
ay b
e ex
amin
ed in
rou
tine
adul
t he
alth
che
cks,
and
may
als
o in
clud
e m
ultip
le s
cree
ning
AP
Y: A
nang
u P
itjan
tjatja
ra Y
anku
nytja
tjara
Sou
th A
ustr
alia
res
ults
201
4
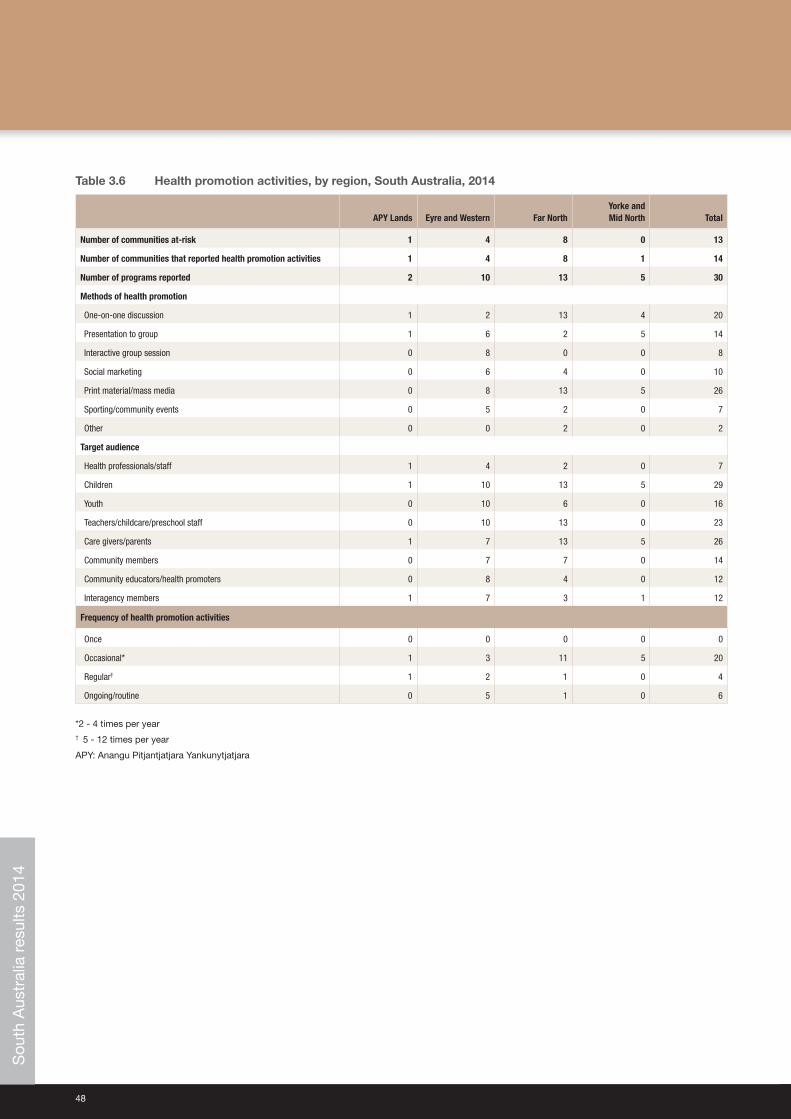
48
Table 3.6 Health promotion activities, by region, South Australia, 2014
APY Lands Eyre and Western Far NorthYorke and Mid North Total
Number of communities at‑risk 1 4 8 0 13
Number of communities that reported health promotion activities 1 4 8 1 14
Number of programs reported 2 10 13 5 30
Methods of health promotion
One‑on‑one discussion 1 2 13 4 20
Presentation to group 1 6 2 5 14
Interactive group session 0 8 0 0 8
Social marketing 0 6 4 0 10
Print material/mass media 0 8 13 5 26
Sporting/community events 0 5 2 0 7
Other 0 0 2 0 2
Target audience
Health professionals/staff 1 4 2 0 7
Children 1 10 13 5 29
Youth 0 10 6 0 16
Teachers/childcare/preschool staff 0 10 13 0 23
Care givers/parents 1 7 13 5 26
Community members 0 7 7 0 14
Community educators/health promoters 0 8 4 0 12
Interagency members 1 7 3 1 12
Frequency of health promotion activities
Once 0 0 0 0 0
Occasional* 1 3 11 5 20
Regular† 1 2 1 0 4
Ongoing/routine 0 5 1 0 6
*2 ‑ 4 times per year† 5 ‑ 12 times per year
APY: Anangu Pitjantjatjara Yankunytjatjara
Sou
th A
ustr
alia
res
ults
201
4
National Trachoma Surveillance Report 2014 49
Western Australia results 2014
Trachoma program coverage• In 2014 WA identified 59 communities in four regions as being at‑risk of trachoma (Table 4.1).
• Of the 59 at‑risk communities, 58 communities required screening for trachoma and one community was identified as requiring treatment without screening (see methodology).
• Of the 59 at‑risk communities, all received screening and treatment or both for trachoma according to the guidelines.
• In 2014 WA aggregated 10 communities in the Goldfields region into one community due to small population size of communities and high mobility between communities.
Screening coverage• Population screening coverage of children aged 5‑9 years in the 58 at‑risk communities screened was 91%, ranging
from 85% in the Midwest region to 100% in the Pilbara region (Table 4.2).
Clean face prevalence• Clean face prevalence was assessed in all communities that were screened and in the community that required
treatment only.
• The overall proportion of clean faces among children aged 5‑9 years was 79%, ranging from 59% in the Goldfields region to 91% in the Midwest and Pilbara regions (Table 4.2, Figure 4.5).
Trachoma prevalence• The observed prevalence of trachoma in children aged 5‑9 years screened was 2%. Prevalence ranged from 0% in
the Pilbara region to 11.5% in the Midwest region (Table 4.2, Figure 4.6a, Figure 4.6b).
• No trachoma was reported in 45 communities (Figure 4.7).
• Endemic levels of trachoma were reported in eight communities, including communities that screened for trachoma in children aged 5‑9 years and that did not screen in accordance with guidelines (Figure 4.7).
• Non‑endemic levels of trachoma have been reported for nine communities over a period of five years which may reclassify these communities as being not at‑risk for trachoma (Figure 4.8).
Treatment delivery and coverage• Trachoma treatment strategies were applied in 20 communities (Table 4.3).
• Treatment was delivered to active cases and households in 17 communities, and to the whole of community in three communities as per guidelines (Table 4.3).
• The overall treatment coverage in all regions was 98% with 1,798 doses of azithromycin delivered (Table 4.4, Figure 4.9).
Trichiasis• Overall 2,836 adults aged over 15 years were reported to be screened, with 11 cases of trichiasis reported (Table 4.5).
• A large volume of trichiasis screening in WA is undertaken within the Medicare Health Assessment for Aboriginal and Torres Strait Islander People (MBS Item 715). These data are not made available to the NTSRU.
Health promotion• Health promotion activities were reported to have occurred in 59 at‑risk communities across all regions.
• A total of 179 health promotion activities were reported (Table 4.6).
• The majority of the health promotion activities were delivered to children, teachers, childcare or preschool staff members (Table 4.6). W
este
rn A
ustr
alia
res
ults
201
4
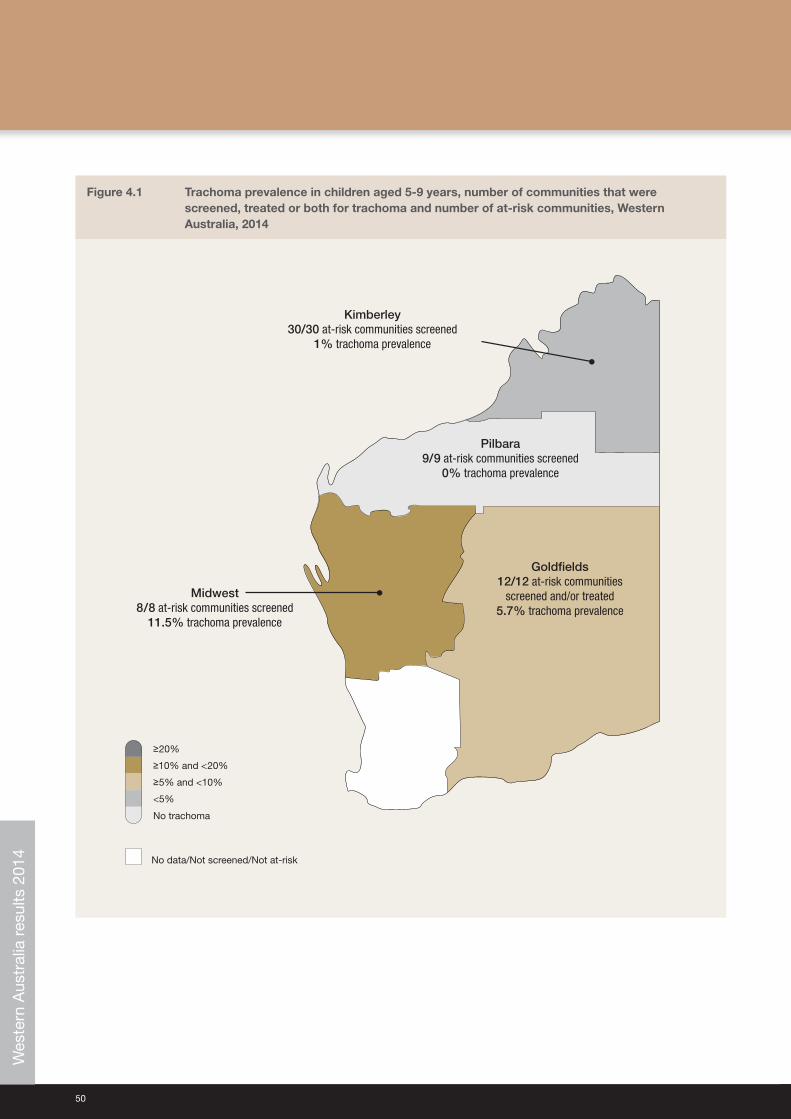
50
Figure 4.1 Trachoma prevalence in children aged 5‑9 years, number of communities that were screened, treated or both for trachoma and number of at‑risk communities, Western Australia, 2014
No data/Not screened/Not at-risk
<5%
No trachoma
≥5% and <10%
≥10% and <20%
≥20%
Midwest8/8 at-risk communities screened
11.5% trachoma prevalence
Kimberley30/30 at-risk communities screened
1% trachoma prevalence
Pilbara9/9 at-risk communities screened
0% trachoma prevalence
Goldfields12/12 at-risk communities
screened and/or treated5.7% trachoma prevalence
Wes
tern
Aus
tral
ia r
esul
ts 2
014
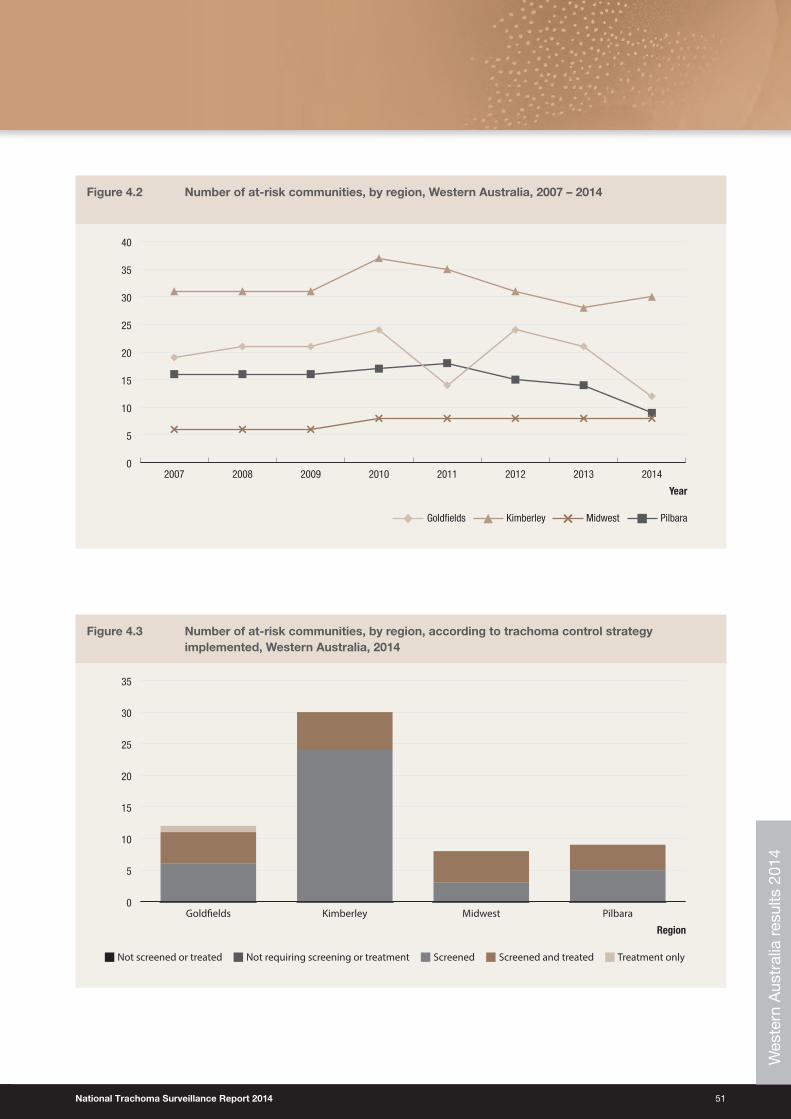
National Trachoma Surveillance Report 2014 51
Figure 4.2 Number of at‑risk communities, by region, Western Australia, 2007 – 2014
0
5
10
15
20
25
30
35
40
20142013201220112010200920082007
PilbaraKimberleyGoldfields Midwest
Year
Figure 4.3 Number of at‑risk communities, by region, according to trachoma control strategy implemented, Western Australia, 2014
ScreenedNot requiring screening or treatmentNot screened or treated Screened and treated Treatment only
Region
0
5
10
15
20
25
30
35
PilbaraMidwestKimberleyGold�elds
Wes
tern
Aus
tral
ia r
esul
ts 2
014
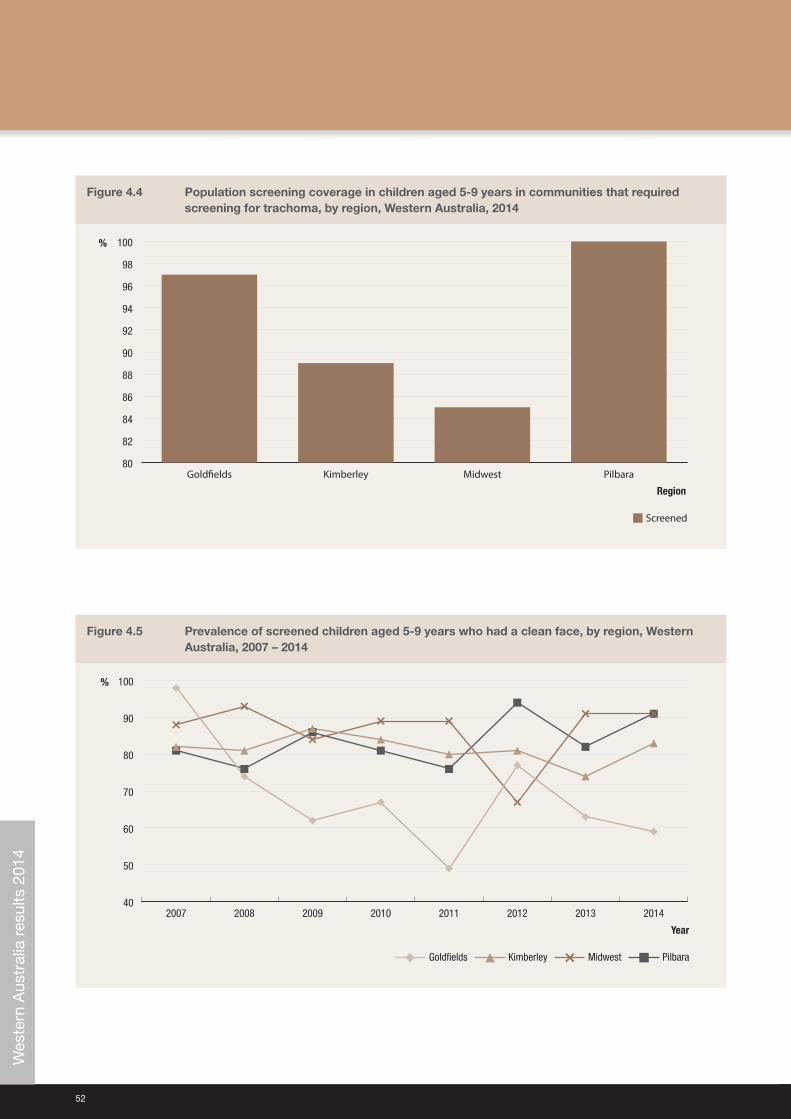
52
Figure 4.4 Population screening coverage in children aged 5‑9 years in communities that required screening for trachoma, by region, Western Australia, 2014
Screened
%
80
82
84
86
88
90
92
94
96
98
100
PilbaraMidwestKimberleyGold�elds
Region
Figure 4.5 Prevalence of screened children aged 5‑9 years who had a clean face, by region, Western Australia, 2007 – 2014
40
50
60
70
80
90
100
20142013201220112010200920082007
PilbaraKimberley
%
Goldfields Midwest
Year
Wes
tern
Aus
tral
ia r
esul
ts 2
014
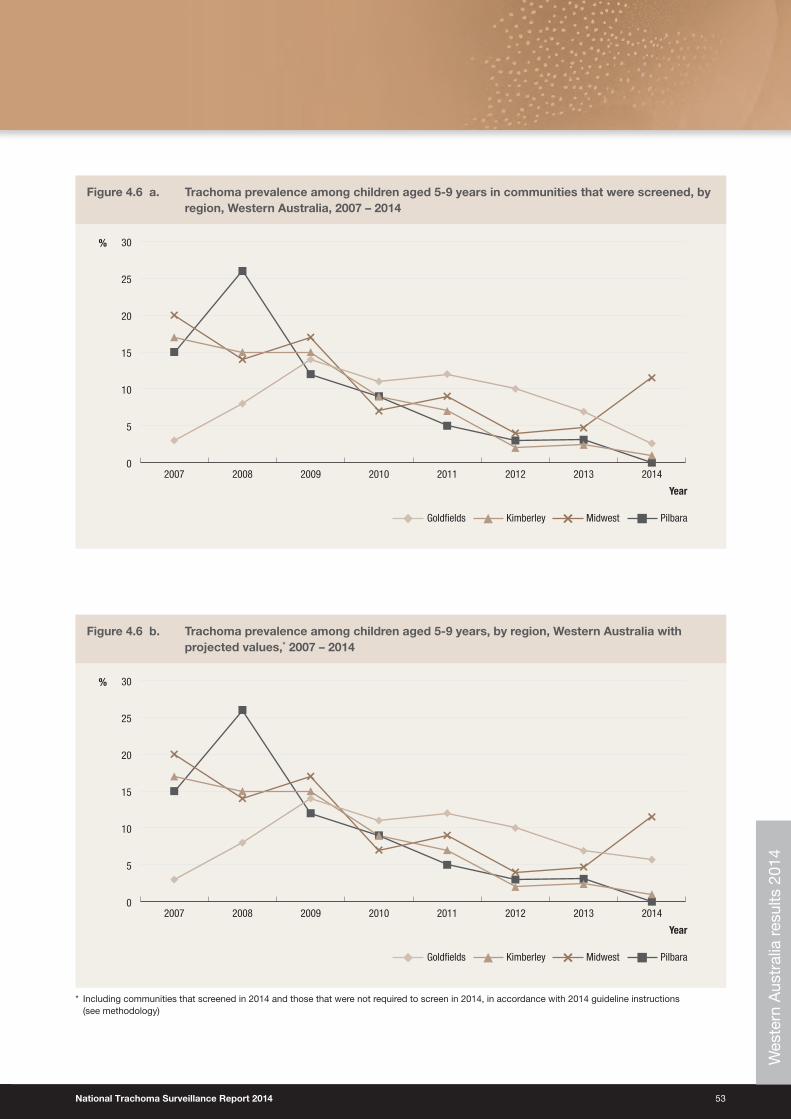
National Trachoma Surveillance Report 2014 53
Figure 4.6 a. Trachoma prevalence among children aged 5‑9 years in communities that were screened, by region, Western Australia, 2007 – 2014
0
5
10
15
20
25
30
20142013201220112010200920082007
PilbaraKimberleyGoldfields
%
Midwest
Year
Figure 4.6 b. Trachoma prevalence among children aged 5‑9 years, by region, Western Australia with projected values,* 2007 – 2014
0
5
10
15
20
25
30
20142013201220112010200920082007
PilbaraKimberley
%
Goldfields Midwest
Year
* Including communities that screened in 2014 and those that were not required to screen in 2014, in accordance with 2014 guideline instructions (see methodology)
Wes
tern
Aus
tral
ia r
esul
ts 2
014
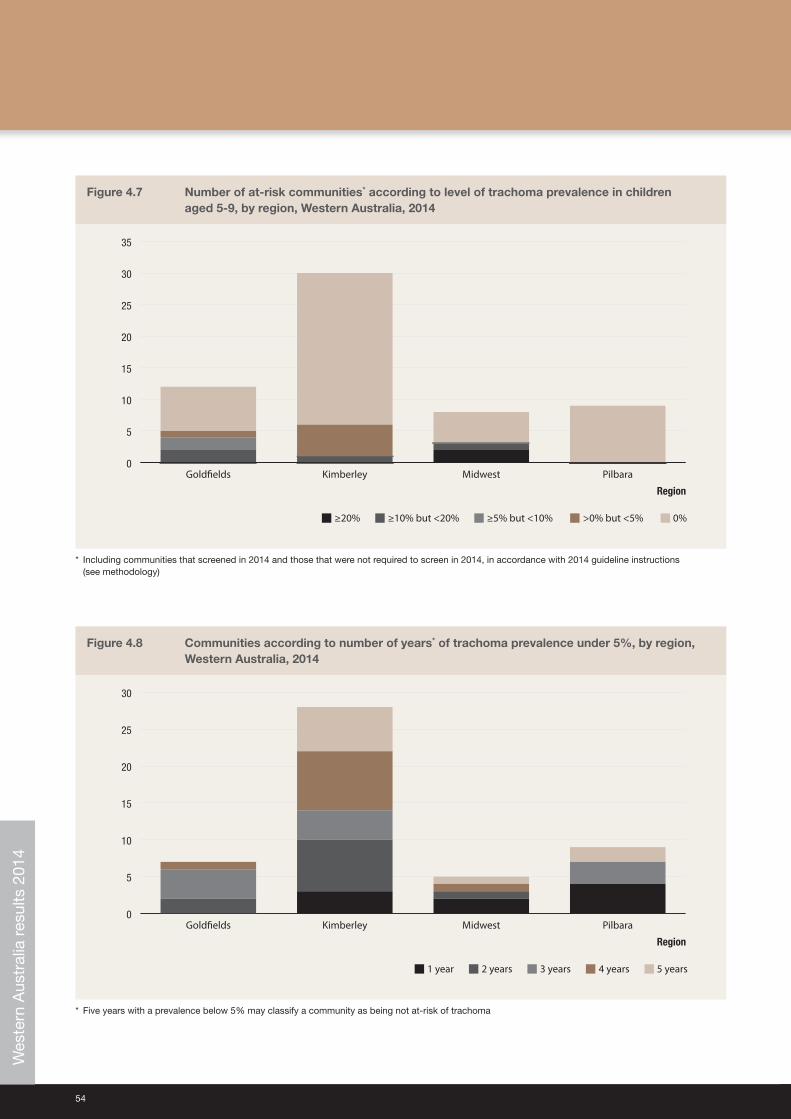
54
Figure 4.7 Number of at‑risk communities* according to level of trachoma prevalence in children aged 5‑9, by region, Western Australia, 2014
≥5% but <10% ≥10% but <20%≥20% >0% but <5% 0%
0
5
10
15
20
25
30
35
PilbaraMidwestKimberleyGold�elds
Region
* Including communities that screened in 2014 and those that were not required to screen in 2014, in accordance with 2014 guideline instructions (see methodology)
Figure 4.8 Communities according to number of years* of trachoma prevalence under 5%, by region, Western Australia, 2014
3 years2 years1 year 4 years 5 years
0
5
10
15
20
25
30
PilbaraMidwestKimberleyGold�elds
Region
* Five years with a prevalence below 5% may classify a community as being not at‑risk of trachoma
Wes
tern
Aus
tral
ia r
esul
ts 2
014
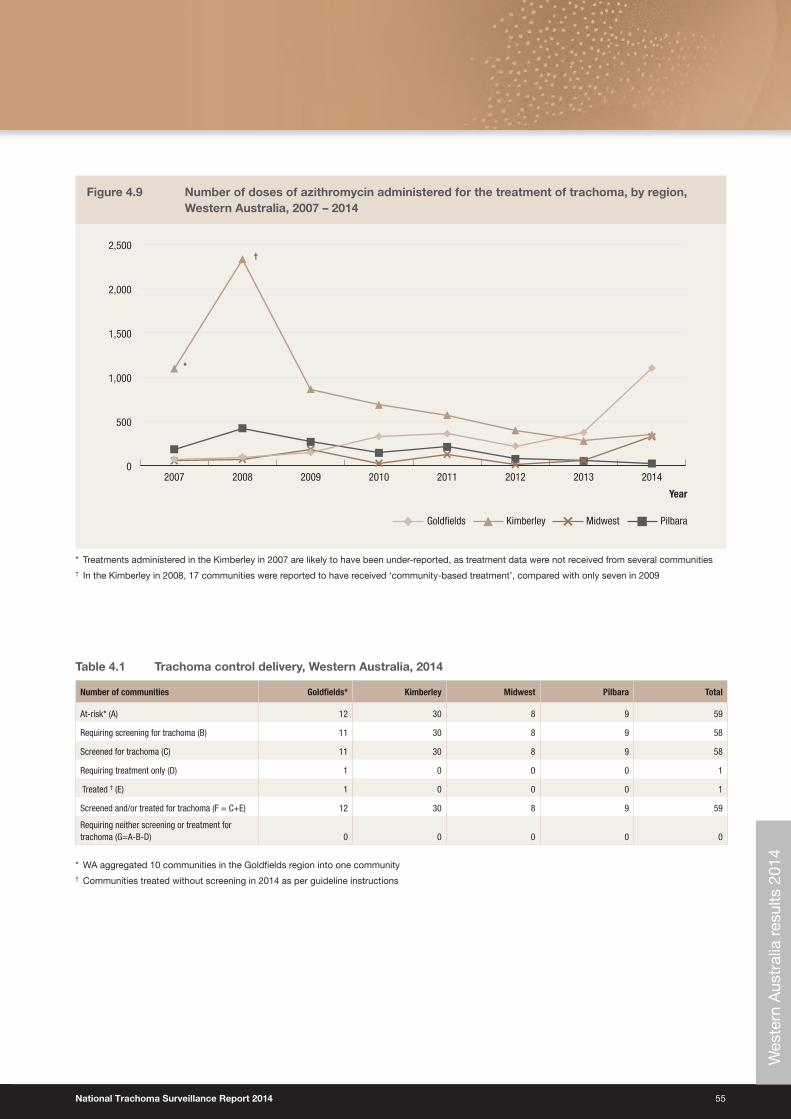
National Trachoma Surveillance Report 2014 55
Figure 4.9 Number of doses of azithromycin administered for the treatment of trachoma, by region, Western Australia, 2007 – 2014
0
500
1,000
1,500
2,000
2,500
20142013201220112010200920082007
Year
PilbaraKimberleyGoldfields Midwest
*
†
* Treatments administered in the Kimberley in 2007 are likely to have been under‑reported, as treatment data were not received from several communities† In the Kimberley in 2008, 17 communities were reported to have received ‘community‑based treatment’, compared with only seven in 2009
Table 4.1 Trachoma control delivery, Western Australia, 2014
Number of communities Goldfields* Kimberley Midwest Pilbara Total
At‑risk* (A) 12 30 8 9 59
Requiring screening for trachoma (B) 11 30 8 9 58
Screened for trachoma (C) 11 30 8 9 58
Requiring treatment only (D) 1 0 0 0 1
Treated † (E) 1 0 0 0 1
Screened and/or treated for trachoma (F = C+E) 12 30 8 9 59
Requiring neither screening or treatment for trachoma (G=A‑B‑D) 0 0 0 0 0
* WA aggregated 10 communities in the Goldfields region into one community† Communities treated without screening in 2014 as per guideline instructions
Wes
tern
Aus
tral
ia r
esul
ts 2
014
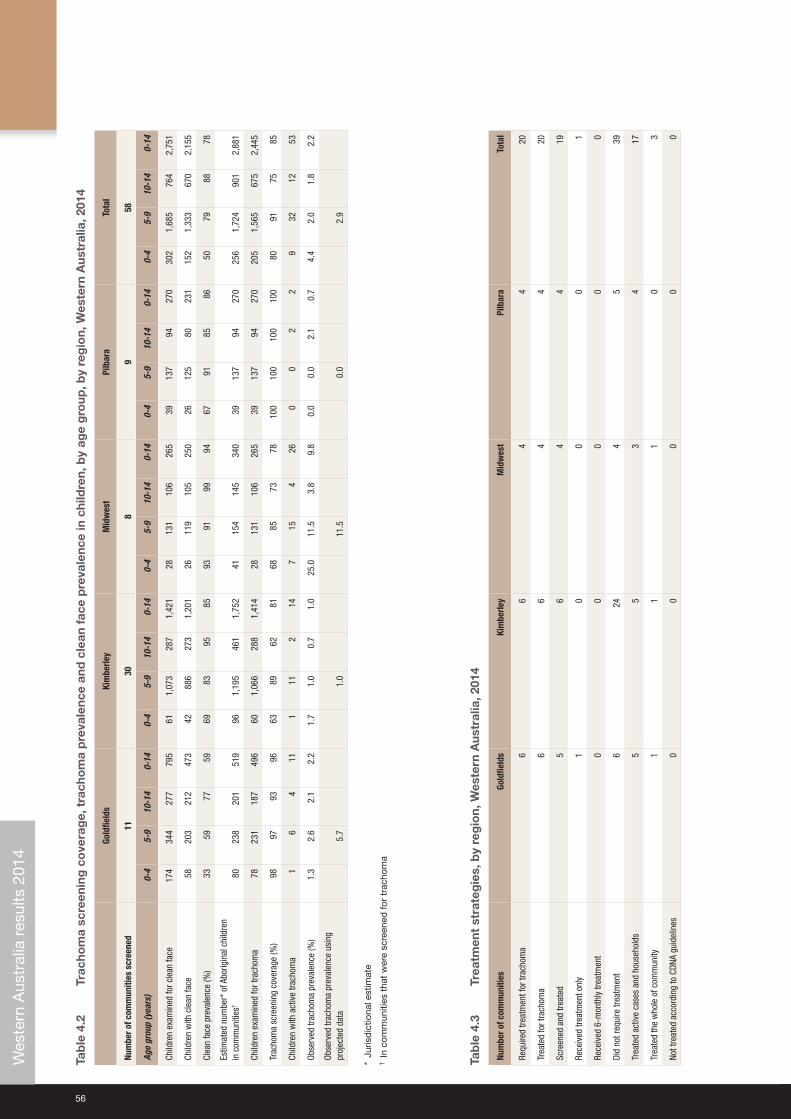
56
Tab
le 4
.2
Trac
hom
a sc
reen
ing
co
vera
ge,
tra
cho
ma
pre
vale
nce
and
cle
an f
ace
pre
vale
nce
in c
hild
ren,
by
age
gro
up, b
y re
gio
n, W
este
rn A
ustr
alia
, 201
4
Gold
field
sKi
mbe
rley
Mid
wes
tPi
lbar
aTo
tal
Num
ber o
f com
mun
ities
scr
eene
d11
308
958
Age
grou
p (y
ears
)0‑
45‑
910
‑14
0‑14
0‑4
5‑9
10‑1
40‑
140‑
45‑
910
‑14
0‑14
0‑4
5‑9
10‑1
40‑
140‑
45‑
910
‑14
0‑14
Child
ren
exam
ined
for c
lean
face
174
344
277
795
611,
073
287
1,42
128
131
106
265
3913
794
270
302
1,68
576
42,
751
Child
ren
with
cle
an fa
ce58
203
212
473
4288
627
31,
201
2611
910
525
026
125
8023
115
21,
333
670
2,15
5
Clea
n fa
ce p
reva
lenc
e (%
)33
5977
5969
8395
8593
9199
9467
9185
8650
7988
78
Estim
ated
num
ber*
of A
borig
inal
chi
ldre
n
in c
omm
uniti
es†
8023
820
151
996
1,19
546
11,
752
4115
414
534
039
137
9427
025
61,
724
901
2,88
1
Child
ren
exam
ined
for t
rach
oma
7823
118
749
660
1,06
628
81,
414
2813
110
626
539
137
9427
020
51,
565
675
2,44
5
Trac
hom
a sc
reen
ing
cove
rage
(%)
9897
9396
6389
6281
6885
7378
100
100
100
100
8091
7585
Child
ren
with
act
ive
trach
oma
16
411
111
214
715
426
00
22
932
1253
Obse
rved
trac
hom
a pr
eval
ence
(%)
1.3
2.6
2.1
2.2
1.7
1.0
0.7
1.0
25.0
11.5
3.8
9.8
0.0
0.0
2.1
0.7
4.4
2.0
1.8
2.2
Obse
rved
trac
hom
a pr
eval
ence
usi
ng
proj
ecte
d da
ta5.
71.
011
.50.
02.
9
* Ju
risd
ictio
nal e
stim
ate
† In
com
mun
ities
tha
t w
ere
scre
ened
for
trac
hom
a
Tab
le 4
.3
Trea
tmen
t st
rate
gie
s, b
y re
gio
n, W
este
rn A
ustr
alia
, 201
4
Num
ber o
f com
mun
ities
Gold
field
sKi
mbe
rley
Mid
wes
tPi
lbar
aTo
tal
Requ
ired
treat
men
t for
trac
hom
a6
64
420
Trea
ted
for t
rach
oma
66
44
20
Scre
ened
and
trea
ted
56
44
19
Rece
ived
trea
tmen
t onl
y1
00
01
Rece
ived
6‑m
onth
ly tr
eatm
ent
00
00
0
Did
not r
equi
re tr
eatm
ent
624
45
39
Trea
ted
activ
e ca
ses
and
hous
ehol
ds5
53
417
Trea
ted
the
who
le o
f com
mun
ity1
11
03
Not t
reat
ed a
ccor
ding
to C
DNA
guid
elin
es0
00
00
Wes
tern
Aus
tral
ia r
esul
ts 2
014
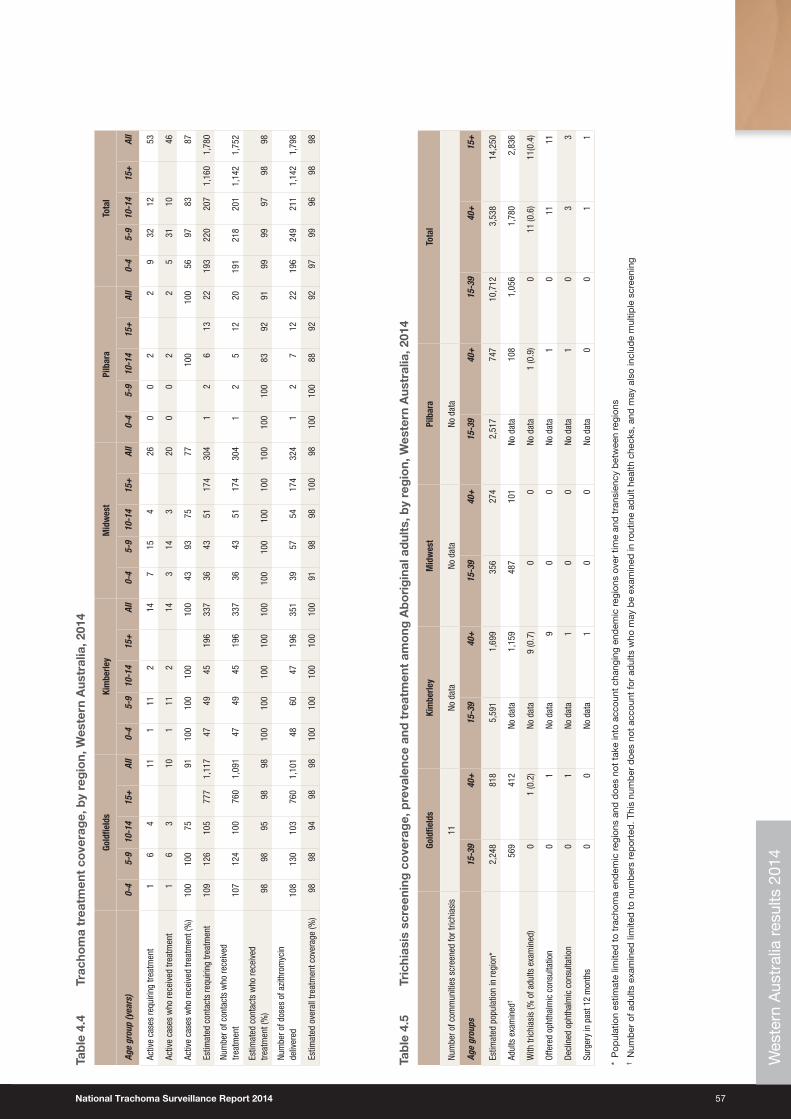
National Trachoma Surveillance Report 2014 57
Tab
le 4
.4
Trac
hom
a tr
eatm
ent
cove
rag
e, b
y re
gio
n, W
este
rn A
ustr
alia
, 201
4
Gold
field
sKi
mbe
rley
Mid
wes
tPi
lbar
aTo
tal
Age
grou
p (y
ears
)0‑
45‑
910
‑14
15+
All
0‑4
5‑9
10‑1
415
+Al
l0‑
45‑
910
‑14
15+
All
0‑4
5‑9
10‑1
415
+Al
l0‑
45‑
910
‑14
15+
All
Activ
e ca
ses
requ
iring
trea
tmen
t1
64
111
112
147
154
260
02
29
3212
53
Activ
e ca
ses
who
rece
ived
trea
tmen
t1
63
101
112
143
143
200
02
25
3110
46
Activ
e ca
ses
who
rece
ived
trea
tmen
t (%
)10
010
075
9110
010
010
010
043
9375
7710
010
056
9783
87
Estim
ated
con
tact
s re
quiri
ng tr
eatm
ent
109
126
105
777
1,11
747
4945
196
337
3643
5117
430
41
26
1322
193
220
207
1,16
01,
780
Num
ber o
f con
tact
s w
ho re
ceiv
ed
treat
men
t10
712
410
076
01,
091
4749
4519
633
736
4351
174
304
12
512
2019
121
820
11,
142
1,75
2
Estim
ated
con
tact
s w
ho re
ceiv
ed
treat
men
t (%
)98
9895
9898
100
100
100
100
100
100
100
100
100
100
100
100
8392
9199
9997
9898
Num
ber o
f dos
es o
f azi
thro
myc
in
deliv
ered
108
130
103
760
1,10
148
6047
196
351
3957
5417
432
41
27
1222
196
249
211
1,14
21,
798
Estim
ated
ove
rall
treat
men
t cov
erag
e (%
)98
9894
9898
100
100
100
100
100
9198
9810
098
100
100
8892
9297
9996
9898
Tab
le 4
.5
Tric
hias
is s
cree
ning
co
vera
ge,
pre
vale
nce
and
tre
atm
ent
amo
ng A
bo
rig
inal
ad
ults
, by
reg
ion,
Wes
tern
Aus
tral
ia, 2
014
Gold
field
sKi
mbe
rley
Mid
wes
tPi
lbar
aTo
tal
Num
ber o
f com
mun
ities
scr
eene
d fo
r tric
hias
is11
No d
ata
No d
ata
No d
ata
Age
grou
ps15
‑39
40+
15‑3
940
+15
‑39
40+
15‑3
940
+15
‑39
40+
15+
Estim
ated
pop
ulat
ion
in re
gion
*2,
248
818
5,59
11,
699
356
274
2,51
774
710
,712
3,53
814
,250
Adul
ts e
xam
ined
†56
941
2No
dat
a1,
159
487
101
No d
ata
108
1,05
61,
780
2,83
6
With
tric
hias
is (%
of a
dults
exa
min
ed)
01
(0.2
)No
dat
a9
(0.7
)0
0No
dat
a1
(0.9
)0
11 (0
.6)
11(0
.4)
Offe
red
opht
halm
ic c
onsu
ltatio
n0
1No
dat
a9
00
No d
ata
10
1111
Decl
ined
oph
thal
mic
con
sulta
tion
01
No d
ata
10
0No
dat
a1
03
3
Surg
ery
in p
ast 1
2 m
onth
s0
0No
dat
a1
00
No d
ata
00
11
* P
opul
atio
n es
timat
e lim
ited
to
trac
hom
a en
dem
ic r
egio
ns a
nd d
oes
not
take
into
acc
ount
cha
ngin
g en
dem
ic r
egio
ns o
ver
time
and
tra
nsie
ncy
bet
wee
n re
gion
s†
Num
ber
of a
dul
ts e
xam
ined
lim
ited
to
num
ber
s re
por
ted
. Thi
s nu
mb
er d
oes
not
acco
unt
for
adul
ts w
ho m
ay b
e ex
amin
ed in
rou
tine
adul
t he
alth
che
cks,
and
may
als
o in
clud
e m
ultip
le s
cree
ning
Wes
tern
Aus
tral
ia r
esul
ts 2
014
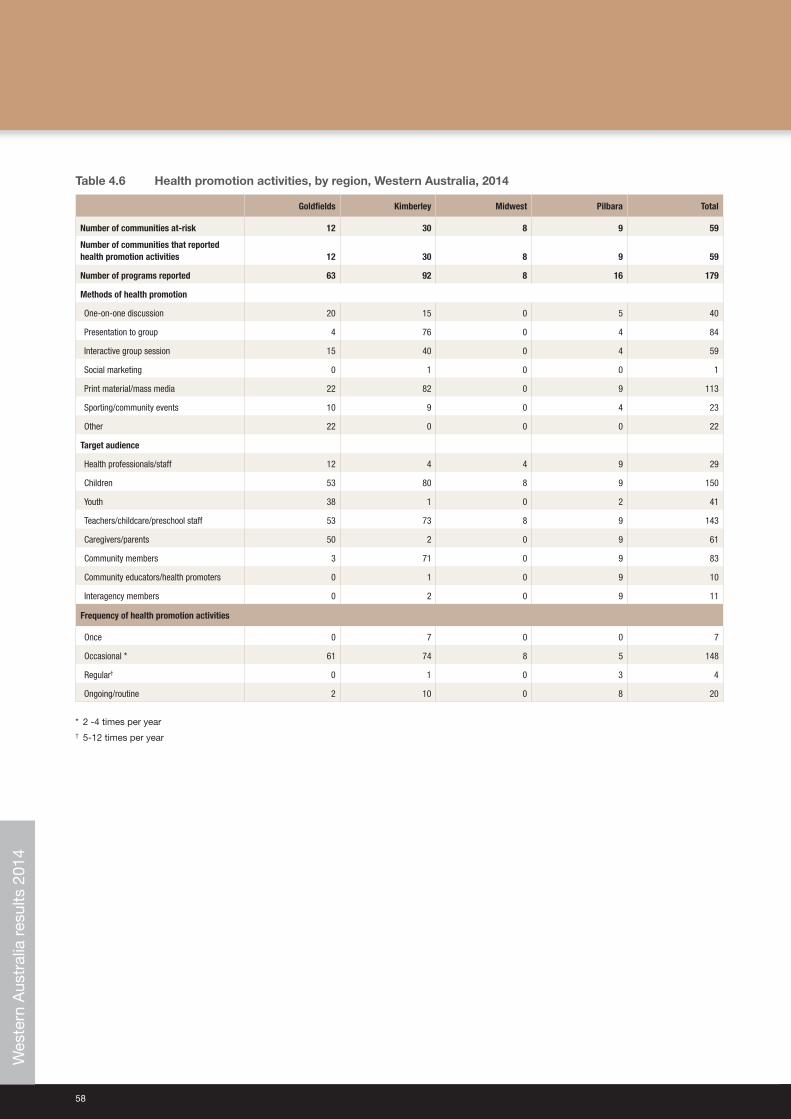
58
Table 4.6 Health promotion activities, by region, Western Australia, 2014
Goldfields Kimberley Midwest Pilbara Total
Number of communities at‑risk 12 30 8 9 59
Number of communities that reported health promotion activities 12 30 8 9 59
Number of programs reported 63 92 8 16 179
Methods of health promotion
One‑on‑one discussion 20 15 0 5 40
Presentation to group 4 76 0 4 84
Interactive group session 15 40 0 4 59
Social marketing 0 1 0 0 1
Print material/mass media 22 82 0 9 113
Sporting/community events 10 9 0 4 23
Other 22 0 0 0 22
Target audience
Health professionals/staff 12 4 4 9 29
Children 53 80 8 9 150
Youth 38 1 0 2 41
Teachers/childcare/preschool staff 53 73 8 9 143
Caregivers/parents 50 2 0 9 61
Community members 3 71 0 9 83
Community educators/health promoters 0 1 0 9 10
Interagency members 0 2 0 9 11
Frequency of health promotion activities
Once 0 7 0 0 7
Occasional * 61 74 8 5 148
Regular† 0 1 0 3 4
Ongoing/routine 2 10 0 8 20
* 2 ‑4 times per year† 5‑12 times per year
Wes
tern
Aus
tral
ia r
esul
ts 2
014
National Trachoma Surveillance Report 2014 59
Health promotion summaryThe promotion of facial cleanliness is an important strategy for health promotion activity across the WA endemic regions. School education sessions were conducted using the “No Germs on Me” trachoma resources, the “Clean Faces, Strong Eyes” story kits and interactive displays to demonstrate trachoma transmission and the importance of clean faces and hands in preventing trachoma infection. Health promotion resources such as stickers, water bottles, wrist bands and pamphlets were developed in collaboration between Aboriginal Medical Services, Environmental Health Officers and WA Country Health Service (WACHS) to promote the trachoma prevention message. In addition to health promotion materials, a range of interactive education sessions were used including:
• soap making• face washing demonstrations• creating personalised pillow cases and fridge magnets• a puppet show illustrating transmission vectors
The school sessions incorporated community education in a number of communities to further reinforce the prevention messages, where parents and carers were provided with information about trachoma prevention. Health‑care workers including Aboriginal Health Workers and Community Health Nurses were also supported to deliver regular hand and face washing promotions throughout the year.
Local media and Aboriginal media outlets have successfully been used to deliver culturally appropriate messages targeting communities across the Kimberley. Key messages were provided to local radio stations to produce prevention messages, and regular community announcements were played on local radio stations to complement related health and environmental health promotion messages and raise awareness in the community in the lead up to screening.
Wes
tern
Aus
tral
ia r
esul
ts 2
014
60
New South Wales results 2014
Trachoma program coverage• NSW undertook a mapping exercise in the Far Western NSW and Western NSW regions and follow‑up screening in
the Western NSW region.
• Ten communities were identified by expert advice and local knowledge as being potentially at‑risk of trachoma and therefore screened (Table 5.1).
Screening coverage• Population screening coverage for trachoma in children aged 5‑9 years was 63% (Table 5.1)
Clean face prevalence• Clean face prevalence was assessed in all communities that were screened.
• The overall prevalence of clean faces among children aged 5‑9 years in the screened communities was 100% (Table 5.1).
Trachoma prevalence• The prevalence of trachoma in children aged 5‑9 years screened was 0% (Table 5.1)
Treatment delivery and coverage• No treatment was required in 2014.
Trichiasis• Trichiasis screening was not required to be undertaken in 2014.
Health Promotion• Health promotion activities were not provided in 2014 as part of the NSW trachoma mapping exercise.
New
Sou
th W
ales
res
ults
201
4
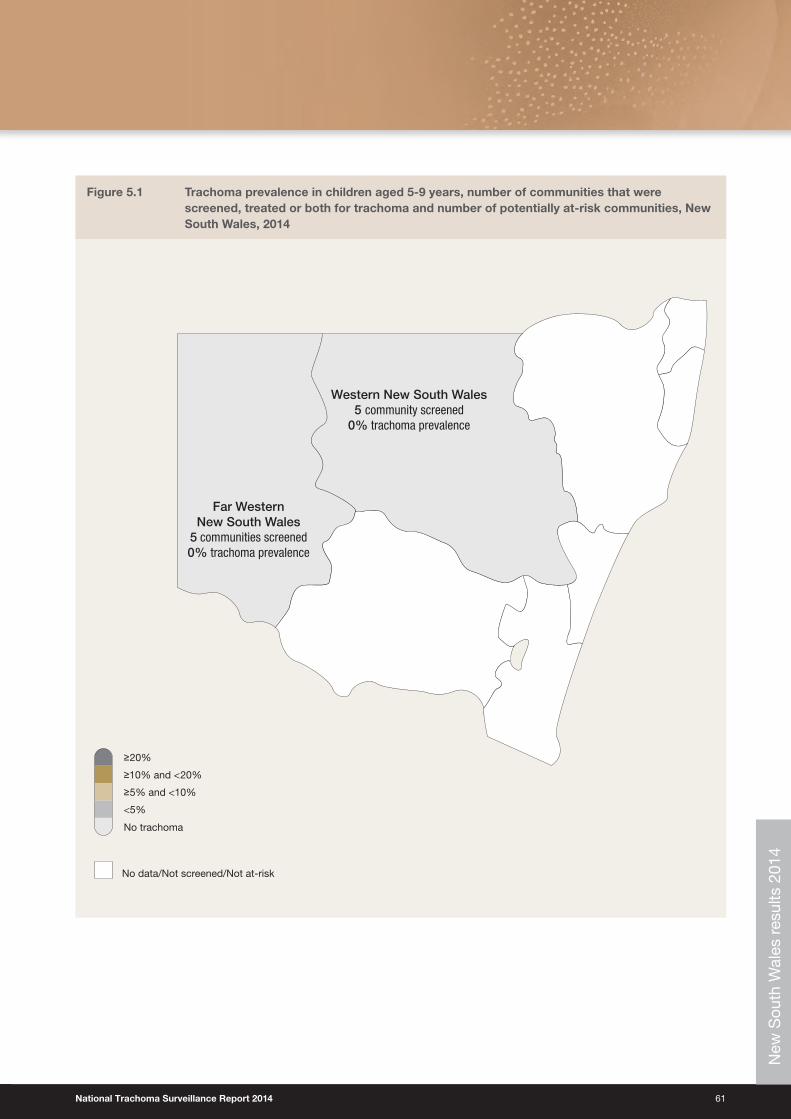
National Trachoma Surveillance Report 2014 61
Figure 5.1 Trachoma prevalence in children aged 5‑9 years, number of communities that were screened, treated or both for trachoma and number of potentially at‑risk communities, New South Wales, 2014
No data/Not screened/Not at-risk
<5%
No trachoma
≥5% and <10%
≥10% and <20%
≥20%
Western New South Wales5 community screened
0% trachoma prevalence
Far Western New South Wales
5 communities screened0% trachoma prevalence
New
Sou
th W
ales
res
ults
201
4
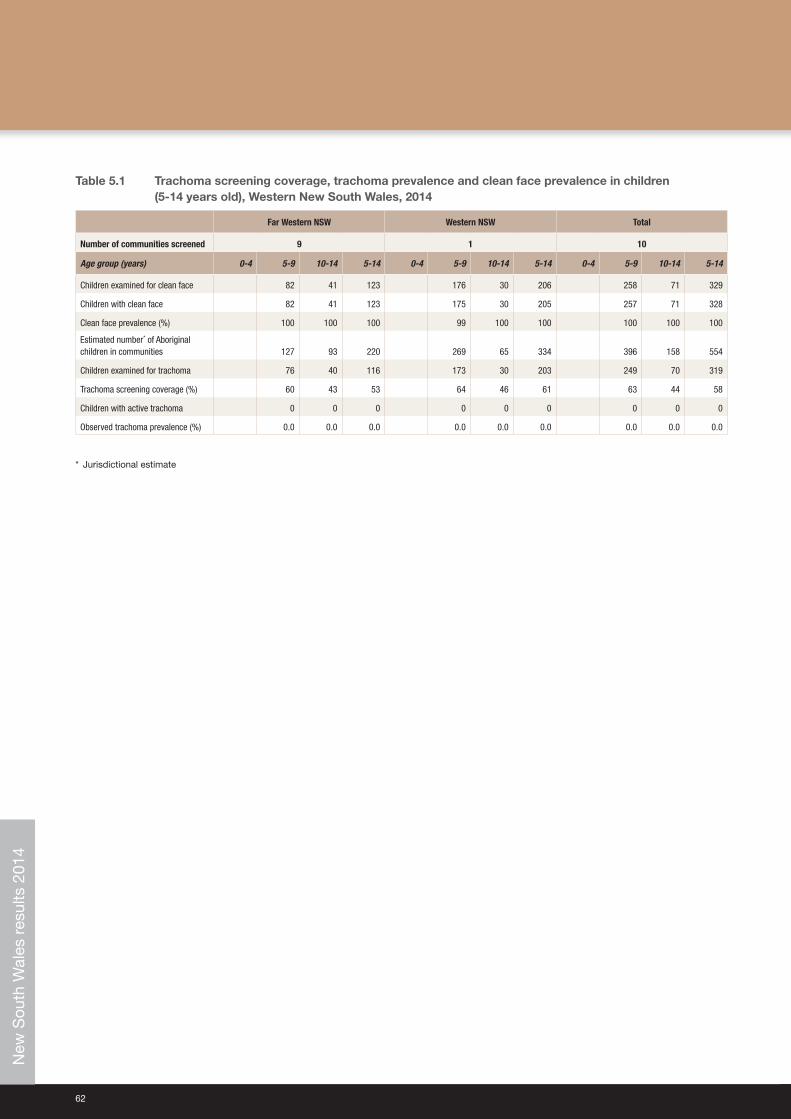
62
Table 5.1 Trachoma screening coverage, trachoma prevalence and clean face prevalence in children (5‑14 years old), Western New South Wales, 2014
Far Western NSW Western NSW Total
Number of communities screened 9 1 10
Age group (years) 0‑4 5‑9 10‑14 5‑14 0‑4 5‑9 10‑14 5‑14 0‑4 5‑9 10‑14 5‑14
Children examined for clean face 82 41 123 176 30 206 258 71 329
Children with clean face 82 41 123 175 30 205 257 71 328
Clean face prevalence (%) 100 100 100 99 100 100 100 100 100
Estimated number* of Aboriginal children in communities 127 93 220 269 65 334 396 158 554
Children examined for trachoma 76 40 116 173 30 203 249 70 319
Trachoma screening coverage (%) 60 43 53 64 46 61 63 44 58
Children with active trachoma 0 0 0 0 0 0 0 0 0
Observed trachoma prevalence (%) 0.0 0.0 0.0 0.0 0.0 0.0 0.0 0.0 0.0
* Jurisdictional estimate
New
Sou
th W
ales
res
ults
201
4
National Trachoma Surveillance Report 2014 63
This page left blank intentionally
New
Sou
th W
ales
res
ults
201
4
64
Screening coverageScreening coverage was measured as both the proportion of at‑risk communities screened and the proportion of children aged 5‑9 years screened in at‑risk communities. A higher screening coverage provides confidence that those screened are representative of the community at‑risk therefore providing a more accurate reflection of the prevalence of disease within the community. The revised Guidelines for the public health management of trachoma in Australia1
guide communities to focus resources on treatment without annual screening where trachoma prevalence is already well established. Communities with non‑endemic levels of trachoma are not required to screen annually, unless resources are available to do so. In response to the 2014 revised guidelines, the annual report has shifted focus from screening coverage to the extent of implementation of the guidelines with respect to screening, treatment and health promotion activities. For communities that undertake screening for trachoma, the guidelines recommend screening coverage of 85%. Screening for trachoma is predominantly undertaken through primary school‑based initiatives where the focus is on children aged 5‑9 years. Screening of older (10‑14 years) and younger (0‑4 years) children also takes place, but less consistently, and treatment strategies are informed by the prevalence in the 5‑9‑year age group. In 2014, population estimates provided by jurisdictions were used to calculate proportions.
In 2014, all communities in all regions that required screening for trachoma received screening. All regions except Alice Springs Remote and the two NSW regions achieved 85% or over in screening coverage, with a national coverage level of 89%.
The number of at‑risk communities screened has decreased marginally in the NT, and decreased seemingly more substantially in SA and WA. However, taking into consideration both SA and WA aggregated nine and 10 previously distinct communities respectively into one single reporting community, the actual decrease in SA and WA is also marginal. Figure 1.8 illustrates that some communities in all jurisdictions have reached the threshold for being considered no longer at‑risk for trachoma. Jurisdictions will assess other factors including known travel exchange of the population with areas that are hyperendemic to establish if these communities should be removed from the at‑risk register. It is expected that this decreasing trend will continue in future years. The Trachoma Surveillance and Control Reference Group will formulate advice on the ongoing monitoring of communities that were previously at‑risk. A number of NSW communities screened for the first time in 2014 did not have trachoma, and therefore will not be considered as being at‑risk for future years.
Trachoma prevalenceEndemic trachoma is defined by the WHO as a prevalence of active trachoma of 5% or greater in children aged 1‑9 years. In past years, the National Trachoma Surveillance and Reporting Unit (NTSRU) had been able to estimate the prevalence using population weights. Due to the limited screening coverage of the 1‑4‑year age group, it was considered that the results reported were not representative of that age group.
Across all four jurisdictions in 2014, the prevalence of trachoma in 5‑9‑year‑old children was 4.7%, which includes data projected forward in communities that did not screen due to implementation of the revised guidelines (see methodology, data analysis). This percentage is a slight increase from the 2013 national prevalence of trachoma in children aged 5‑9 years of 4%. The observed trachoma prevalence in communities that were screened in 2014 was 3.7%. At a regional level in 2014, the prevalence of trachoma in children aged 5‑9 years ranged from 0% in Western and Far Western NSW to 24.3% in the Barkly region of the NT.
Trachoma prevalence in 2014 has slightly increased in SA and the NT and decreased in WA and NSW. At the regional level, large increases in prevalence were recorded in Alice Springs Remote, Barkly and Midwest regions. Of some concern is the increase in trachoma prevalence in several communities that had previous prevalence rates under 5%, and the consequent increase in the number of communities recording endemic levels of trachoma. In interpreting these changes it is important to keep in mind that many of the communities have small populations and are not monitored on an annual basis. Therefore, fluctuations in rates at the community level can occur for statistical reasons. Another factor may be the inevitable variation in diagnostic accuracy between individuals, as trachoma detection depends on a clinical judgment. The continued need for health promotion programs that focus on facial cleanliness and environmental improvements may also be a contributing factor. The Trachoma Surveillance and Control Reference Group (TSCRG) will continue to monitor changes in trachoma prevalence and consider the impact of possible variables. Nevertheless, the ongoing presence of trachoma in many communities is a timely reminder of the need for all jurisdictions to maintain their commitment to national control strategies in all aspects. Advice will be sought from the Trachoma Surveillance and Control Reference Group on whether treatment strategies decisions should take more account of regional groupings of communities, given the potential for re‑infection to occur through movement between communities. The target set by WHO for the elimination of blinding trachoma is defined as a community prevalence of trachoma in children aged 1‑9 years of less than 5% over a period of five years. In Australia, the Communicable Diseases Network Australia (CDNA) target is defined as a prevalence in children aged 5‑9 years of less than 5% over a period of five years. Several communities designated as at‑risk have reported a prevalence of
Discussion
National Trachoma Surveillance Report 2014 65
less than 5% over the past five years, or have a baseline prevalence of 0% and are therefore designated not at‑risk. The NTSRU will be working closely with jurisdictions to appropriately designate at‑risk status for communities for future program delivery.
Trachoma treatmentThe 2014 CDNA guidelines recommend the treatment of active cases and their household contacts when trachoma prevalence is under 5% (not endemic levels). When prevalence is greater than 5% in children aged 5‑9 years and cases are not clustered within a few households, community‑wide treatment is recommended. This approach includes treatment to all people living in households with children younger than 15 years of age annually for a period of three years. The guidelines also recommend six‑monthly treatments over a period of three years for all people living in households with children younger than 15 years of age in hyperendemic communities (prevalence in 5‑9‑year olds at least 20%).
Nationally, 92% of active cases that were identified in 2014 were treated for trachoma. Contact and community‑treatment coverage using estimates provided by the jurisdictions was 90%. Total doses of azithromycin administered in 66 communities were 9,803.
TrichiasisPrevious annual trachoma reports have described trichiasis screening coverage. The previous at‑risk population was estimated using the current year’s trachoma at‑risk community adult population, which does not account for changing endemic areas that have occurred over time, and transiency into non‑endemic regions. It was therefore decided that estimating an at‑risk population for trichiasis is not feasible as it cannot capture the actual potential risk for trichiasis.
The number of adults aged 40 years and older reported to be screened for trichiasis increased in 2014 with 5,151 reported in 2014, and 3,856 screened in 2013. Screening for trichiasis is believed to be greatly under‑reported. Of the adults aged older than 40 years who were screened, 0.9% (47/5,151) prevalence levels of trichiasis were reported. In 2014, 17 cases of trichiasis surgery were reported, from NT (12), SA (4) and WA (1). These cases may have been identified from previous years’ screening activities. The reporting of trichiasis data regarding referral and surgery undertaken is limited due to incomplete data collection and compilation.
Facial cleanlinessPromoting facial cleanliness is a component of the SAFE strategy, recognising that the presence of nasal and ocular discharge is significantly associated with the risk for acquiring, transmitting and potential presence of trachoma. The proportion of children aged 5‑9 years screened who had clean faces increased in all jurisdictions except in SA.
Program delivery and monitoringImprovements in program delivery have been reported in 2014, with increased coverage of screening and treatment delivery and health promotion activities in all jurisdictions. Data quality also improved in all jurisdictions. One issue that will need to be considered when Australia comes to assess trachoma elimination against international standards is the lack of information on children aged 1‑4 years, who are considered in many populations to be at higher risk than children aged 5‑9 years.
The revised CDNA guidelines have strengthened the trachoma control program planning in all jurisdictions by reducing ambiguity experienced in previous guidelines and providing clear guidance on screening and treatment methods. The impact of the new strategies, in particular treatment and screening schedules, may not be evident for several years.
Progress towards Australia’s elimination targetThe Australian Government’s commitment to the WHO Alliance of the Global Elimination of Blinding Trachoma by the year 2020 (GET 2020) continues with funding provided to jurisdictions to deliver rigorous trachoma screening and treatment programs. Ongoing efforts are required to ensure high quality control in diagnosing active cases, and that all intervention systems are being applied appropriately. The small increases in trachoma prevalence in 2014 are a timely reminder that trachoma trends and elimination may be unpredictable, especially in small local populations, and that local outbreaks must be managed under close adherence to the guidelines.
The Trachoma Surveillance and Control Reference Group has a significant role in the near future in reviewing surveillance procedures under the 2014 guidelines, considering the next phase of monitoring communities that are no longer considered at‑risk, and advising on strengthening elimination monitoring systems and future surveillance once blinding trachoma has been eliminated from Australia.
66
1 Communicable Diseases Network Australia. National guidelines for the public health management of trachoma in Australia. January 2014. Canberra: Commonwealth of Australia; 2014. Available at: http://www.health.gov.au/internet/main/publishing.nsf/Content/cdna-song-trachoma.htm.
2 World Health Organization. Global WHO Alliance for the Elimination of Blinding Trachoma by 2020. Wkly Epidemiol Rec 2012;87(17):161-8.
3 Taylor HR. Trachoma: a blinding scourge from the Bronze Age to the Twenty First Century. Melbourne: Centre for Eye Research Australia; 2008.
4 Polack S, Brooker S, Kuper K, Mariotti S, Mabey D, Foster A. Mapping the global distribution of trachoma. Bull World Health Organization 2005;80(12):913-9.
5 World Health Organization. Trichiasis surgery for trachoma. Geneva: WHO; 2013. Available at: http://apps.who.int/iris/bitstream/10665/101430/1/9789241548670_eng.pdf.
6 World Health Organization. Future approaches to trachoma control – report of a global scientific meeting. 17-20 June 1996. Geneva: WHO; 1997.
7 Mariotti SP, Pararajasegaram R, Resnikoff S. Trachoma: looking forward to global elimination of trachoma by 2020 (GET 2020). Am J Trop Med Hyg 2003;69(5 Suppl):33-5.
8 World Health Organization. Report of the 2nd global scientific meeting on trachoma. 25-27 August 2003. Geneva: WHO; 2003.
9 World Health Organization. Trachoma control: a guide for programme managers. Geneva: WHO; 2008.
10 Taylor HR, Fox SS, Xie J, Dunn RA, Arnold AL, Keeffe JE. The prevalence of trachoma in Australia: the National Indigenous Eye Health Survey. Med J Aust 2010;192(5):248-53.
11 Australian Government. Budget 2013-14. Budget Paper No. 3 [Internet]. Canberra: Commonwealth of Australia; 2013. Available at: http://www.budget.gov.au/2013-14/content/bp3/html/bp3_03_part_2b.htm.
12 Cowling CS, Liu BC, Ward JS, Snelling TL, Kaldor JM, Wilson DP for the National Trachoma Surveillance and Reporting Unit. Australian Trachoma Surveillance Report 2011. Sydney: The Kirby Institute, UNSW Australia; 2012.
13 Cowling CS, Liu BC, Snelling TL, Ward JS, Kaldor JM, Wilson DP for the National Trachoma Surveillance and Reporting Unit. Australian Trachoma Surveillance Report 2012. Sydney: The Kirby Institute, UNSW Australia; 2013.
14 Cowling CS, Liu BC, Snelling TL, Ward JS, Kaldor JM, Wilson DP for the National Trachoma Surveillance and Reporting Unit. Australian Trachoma Surveillance Report 2013. Sydney: The Kirby Institute, UNSW Australia; 2014. Available at: http://www.health.gov.au/internet/publications/publishing.nsf/Content/2013-trachoma-toc.
15 Tellis B, Dunn R, Keeffe JE for the National Trachoma Surveillance and Reporting Unit: Trachoma Surveillance Report 2006. Commun Dis Intell 2007;31:366–74.
16 Tellis B, Dunn R, Keeffe JE, Taylor HR for the National Trachoma Surveillance and Reporting Unit. Trachoma Surveillance Annual Report, 2007. Commun Dis Intell 2008;32:388–99.
17 Tellis B, Fotis K, Dunn R, Keeffe JE, Taylor HR for the National Trachoma Surveillance and Reporting Unit. Trachoma Surveillance Report 2008. Melbourne: Centre for Eye Research Australia; 2009.
18 Adams K, Burgess J, Dharmage S for the National Trachoma Surveillance and Reporting Unit. National Trachoma Surveillance Report 2009. Melbourne: Centre for Molecular, Environmental, Genetic and Analytic Epidemiology, University of Melbourne; 2010.
Reference list
National Trachoma Surveillance Report 2014 67
This page left blank intentionally.
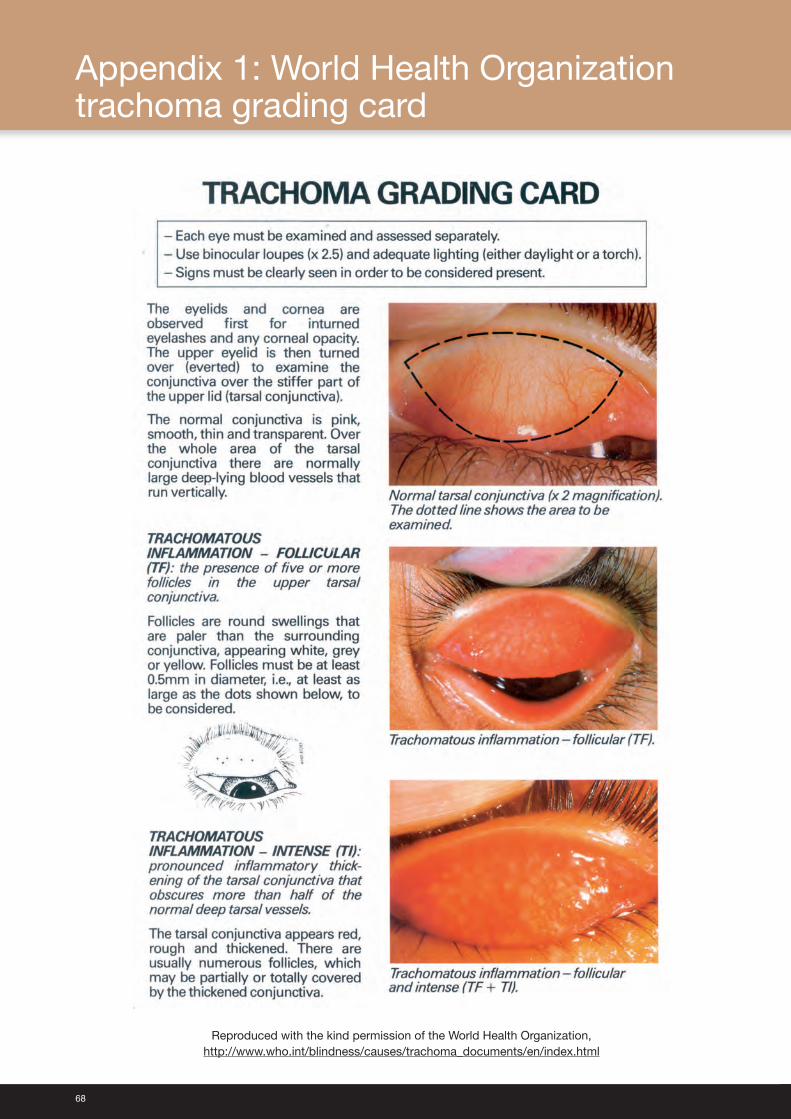
68
Reproduced with the kind permission of the World Health Organization, http://www.who.int/blindness/causes/trachoma_documents/en/index.html
Appendix 1: World Health Organization trachoma grading card
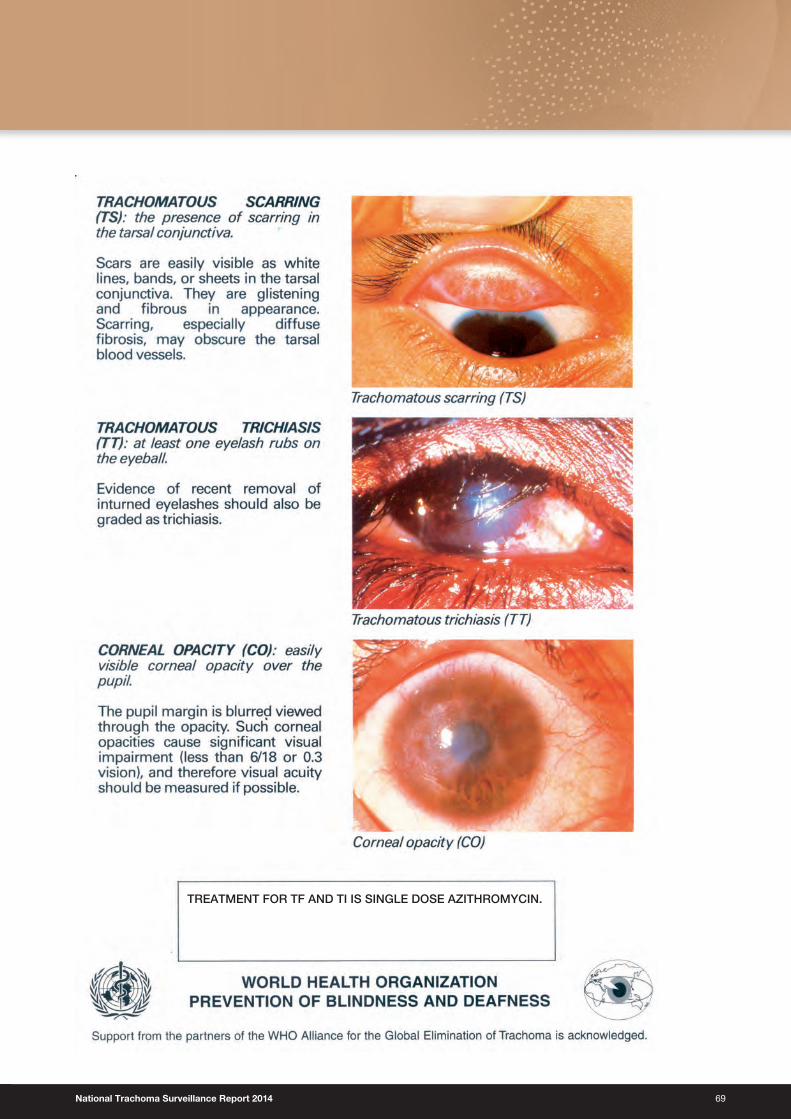
National Trachoma Surveillance Report 2014 69
TREATMENT FOR TF AND TI IS SINGLE DOSE AZITHROMYCIN.
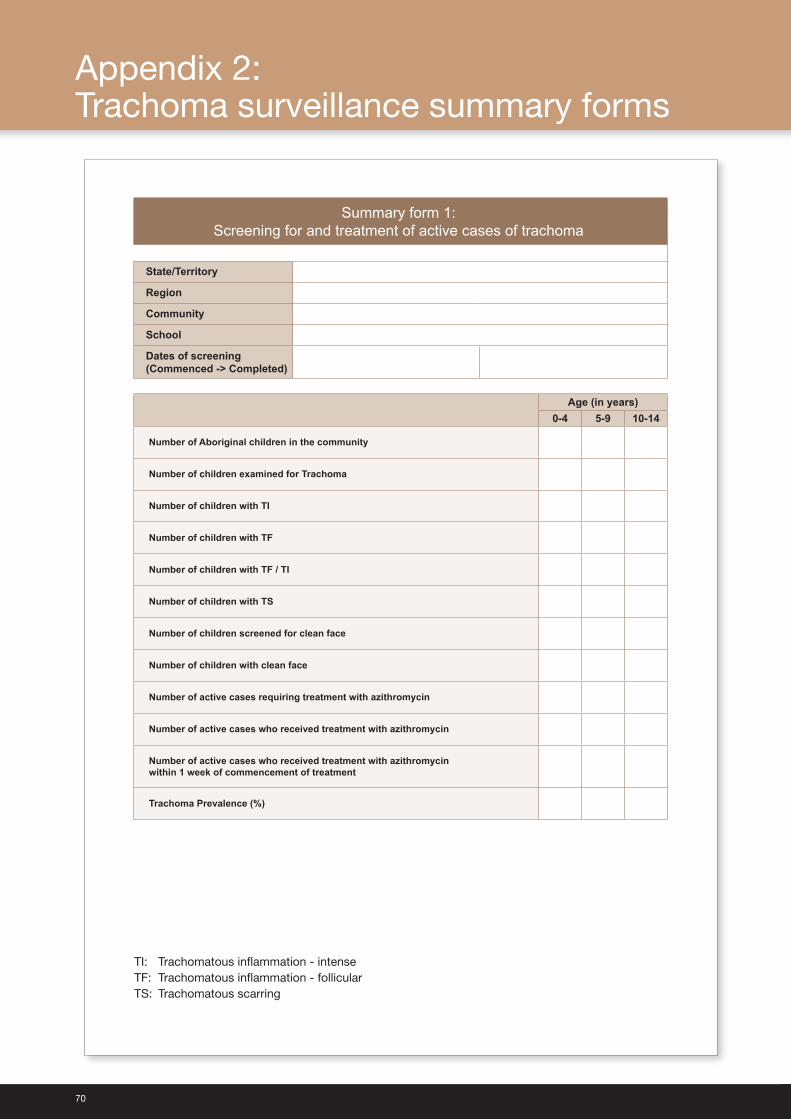
70
Appendix 2: Trachoma surveillance summary forms
Summary form 1:Screening for and treatment of active cases of trachoma
State/Territory
Region
Community
School
Dates of screening(Commenced -> Completed)
Age (in years)0-4 5-9 10-14
Number of Aboriginal children in the community
Number of children examined for Trachoma
Number of children with TI
Number of children with TF
Number of children with TF / TI
Number of children with TS
Number of children screened for clean face
Number of children with clean face
Number of active cases requiring treatment with azithromycin
Number of active cases who received treatment with azithromycin
Number of active cases who received treatment with azithromycinwithin 1 week of commencement of treatment
Trachoma Prevalence (%)
TI: Trachomatous inflammation - intense TF: Trachomatous inflammation - follicular TS: Trachomatous scarring
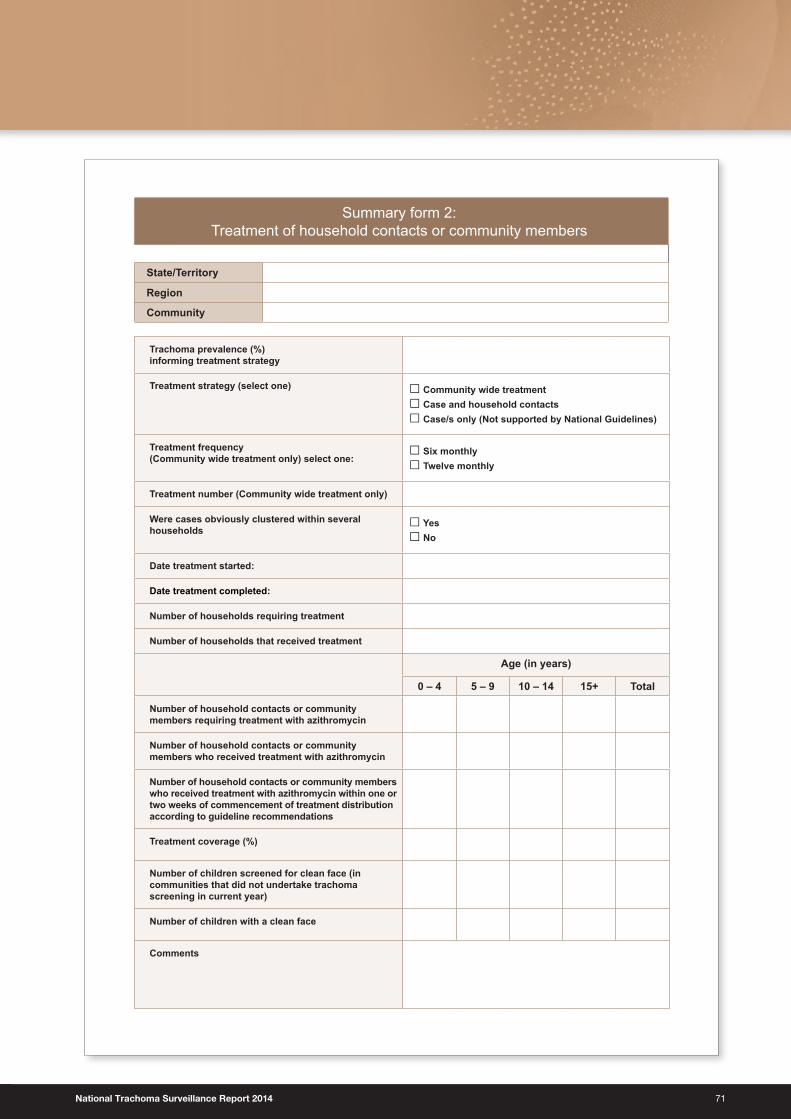
National Trachoma Surveillance Report 2014 71
Summary form 2: Treatment of household contacts or community members
State/Territory
Region
Community
Trachoma prevalence (%) informing treatment strategy
Treatment strategy (select one) □ Community wide treatment □ Case and household contacts□ Case/s only (Not supported by National Guidelines)
Treatment frequency(Community wide treatment only) select one:
□ Six monthly □ Twelve monthly
Treatment number (Community wide treatment only)
Were cases obviously clustered within several households
□ Yes □ No
Date treatment started:
Date treatment completed:
Number of households requiring treatment
Number of households that received treatment
Age (in years)
0 – 4 5 – 9 10 – 14 15+ Total
Number of household contacts or community members requiring treatment with azithromycin
Number of household contacts or community members who received treatment with azithromycin
Number of household contacts or community members who received treatment with azithromycin within one or two weeks of commencement of treatment distribution according to guideline recommendations
Treatment coverage (%)
Number of children screened for clean face (in communities that did not undertake trachoma screening in current year)
Number of children with a clean face
Comments
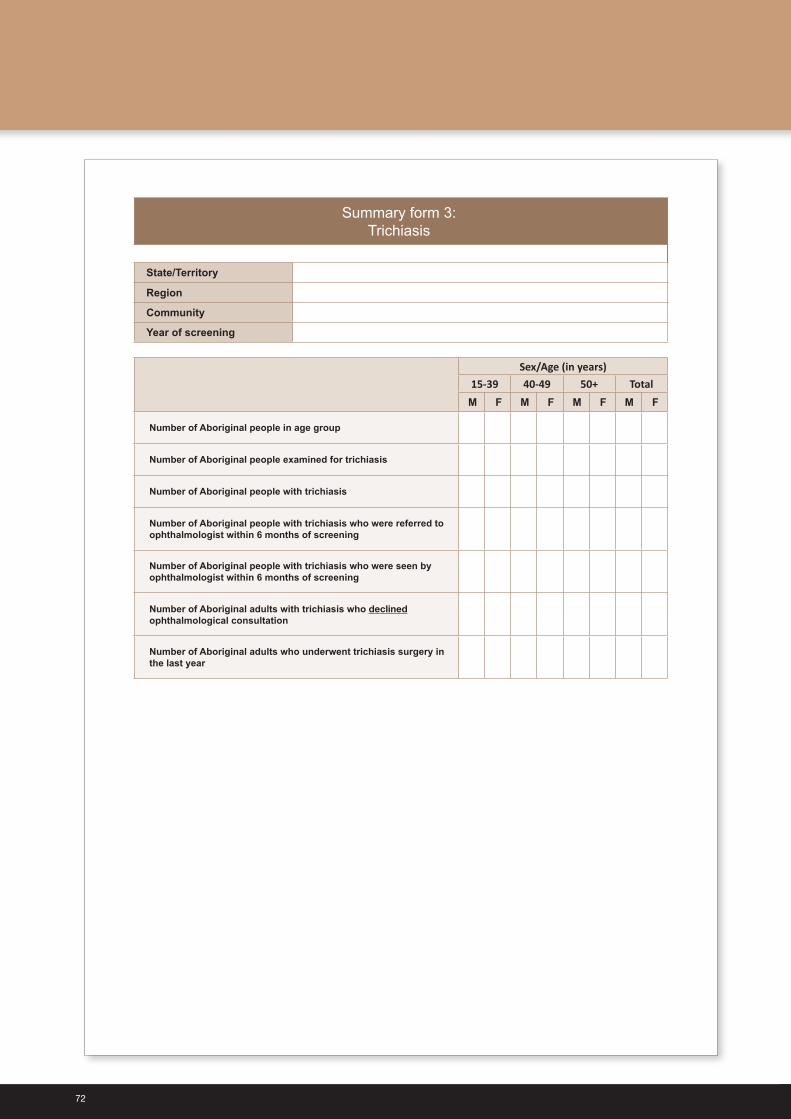
72
Summary form 3:Trichiasis
State/Territory
Region
Community
Year of screening
Sex/Age (in years)15-39 40-49 50+ TotalM F M F M F M F
Number of Aboriginal people in age group
Number of Aboriginal people examined for trichiasis
Number of Aboriginal people with trichiasis
Number of Aboriginal people with trichiasis who were referred to ophthalmologist within 6 months of screening
Number of Aboriginal people with trichiasis who were seen by ophthalmologist within 6 months of screening
Number of Aboriginal adults with trichiasis who declined ophthalmological consultation
Number of Aboriginal adults who underwent trichiasis surgery in the last year
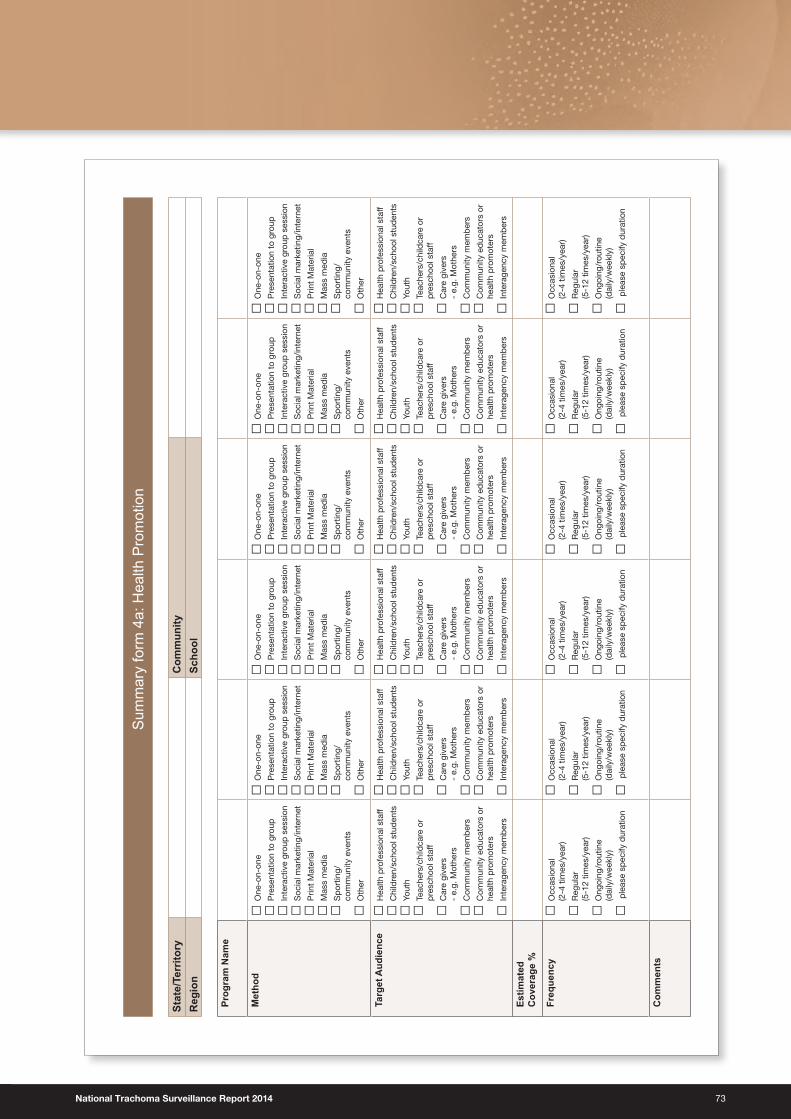
National Trachoma Surveillance Report 2014 73
Sum
mar
y fo
rm 4
a: H
ealth
Pro
mot
ion
Stat
e/Te
rrito
ry
Com
mun
ityR
egio
n
Scho
ol
Prog
ram
Nam
e
Met
hod
□O
ne-o
n-on
e
□P
rese
ntat
ion
to g
roup
□In
tera
ctiv
e gr
oup
ses
sion
□S
ocia
l mar
ketin
g/in
tern
et
□P
rint
Mat
eria
l
□M
ass
med
ia
□S
por
ting/
com
mun
ity e
vent
s
□O
ther
□O
ne-o
n-on
e
□P
rese
ntat
ion
to g
roup
□In
tera
ctiv
e gr
oup
ses
sion
□S
ocia
l mar
ketin
g/in
tern
et
□P
rint
Mat
eria
l
□M
ass
med
ia
□S
por
ting/
com
mun
ity e
vent
s
□O
ther
□O
ne-o
n-on
e
□P
rese
ntat
ion
to g
roup
□In
tera
ctiv
e gr
oup
ses
sion
□S
ocia
l mar
ketin
g/in
tern
et
□P
rint
Mat
eria
l
□M
ass
med
ia
□S
por
ting/
com
mun
ity e
vent
s
□O
ther
□O
ne-o
n-on
e
□P
rese
ntat
ion
to g
roup
□In
tera
ctiv
e gr
oup
ses
sion
□S
ocia
l mar
ketin
g/in
tern
et
□P
rint
Mat
eria
l
□M
ass
med
ia
□S
por
ting/
com
mun
ity e
vent
s
□O
ther
□O
ne-o
n-on
e
□P
rese
ntat
ion
to g
roup
□In
tera
ctiv
e gr
oup
ses
sion
□S
ocia
l mar
ketin
g/in
tern
et
□P
rint
Mat
eria
l
□M
ass
med
ia
□S
por
ting/
com
mun
ity e
vent
s
□O
ther
□O
ne-o
n-on
e
□P
rese
ntat
ion
to g
roup
□In
tera
ctiv
e gr
oup
ses
sion
□S
ocia
l mar
ketin
g/in
tern
et
□P
rint
Mat
eria
l
□M
ass
med
ia
□S
por
ting/
com
mun
ity e
vent
s
□O
ther
Targ
et A
udie
nce
□H
ealth
pro
fess
iona
l sta
ff
□C
hild
ren/
scho
ol s
tud
ents
□Yo
uth
□Te
ache
rs/c
hild
care
or
pre
scho
ol s
taff
□C
are
give
rs
- e.
g. M
othe
rs
□C
omm
unity
mem
ber
s
□C
omm
unity
ed
ucat
ors
or
heal
th p
rom
oter
s
□In
tera
genc
y m
emb
ers
□H
ealth
pro
fess
iona
l sta
ff
□C
hild
ren/
scho
ol s
tud
ents
□Yo
uth
□Te
ache
rs/c
hild
care
or
pre
scho
ol s
taff
□C
are
give
rs
- e.
g. M
othe
rs
□C
omm
unity
mem
ber
s
□C
omm
unity
ed
ucat
ors
or
heal
th p
rom
oter
s
□In
tera
genc
y m
emb
ers
□H
ealth
pro
fess
iona
l sta
ff
□C
hild
ren/
scho
ol s
tud
ents
□Yo
uth
□Te
ache
rs/c
hild
care
or
pre
scho
ol s
taff
□C
are
give
rs
- e.
g. M
othe
rs
□C
omm
unity
mem
ber
s
□C
omm
unity
ed
ucat
ors
or
heal
th p
rom
oter
s
□In
tera
genc
y m
emb
ers
□H
ealth
pro
fess
iona
l sta
ff
□C
hild
ren/
scho
ol s
tud
ents
□Yo
uth
□Te
ache
rs/c
hild
care
or
pre
scho
ol s
taff
□C
are
give
rs
- e.
g. M
othe
rs
□C
omm
unity
mem
ber
s
□C
omm
unity
ed
ucat
ors
or
heal
th p
rom
oter
s
□In
tera
genc
y m
emb
ers
□H
ealth
pro
fess
iona
l sta
ff
□C
hild
ren/
scho
ol s
tud
ents
□Yo
uth
□Te
ache
rs/c
hild
care
or
pre
scho
ol s
taff
□C
are
give
rs
- e.
g. M
othe
rs
□C
omm
unity
mem
ber
s
□C
omm
unity
ed
ucat
ors
or
heal
th p
rom
oter
s
□In
tera
genc
y m
emb
ers
□H
ealth
pro
fess
iona
l sta
ff
□C
hild
ren/
scho
ol s
tud
ents
□Yo
uth
□Te
ache
rs/c
hild
care
or
pre
scho
ol s
taff
□C
are
give
rs
- e.
g. M
othe
rs
□C
omm
unity
mem
ber
s
□C
omm
unity
ed
ucat
ors
or
heal
th p
rom
oter
s
□In
tera
genc
y m
emb
ers
Estim
ated
Cov
erag
e %
Freq
uenc
y □O
ccas
iona
l(2
-4 t
imes
/yea
r)
□R
egul
ar(5
-12
times
/yea
r)
□O
ngoi
ng/r
outin
e (d
aily
/wee
kly)
□ p
leas
e sp
ecify
dur
atio
n
□O
ccas
iona
l(2
-4 t
imes
/yea
r)
□R
egul
ar(5
-12
times
/yea
r)
□O
ngoi
ng/r
outin
e (d
aily
/wee
kly)
□ p
leas
e sp
ecify
dur
atio
n
□O
ccas
iona
l(2
-4 t
imes
/yea
r)
□R
egul
ar(5
-12
times
/yea
r)
□O
ngoi
ng/r
outin
e (d
aily
/wee
kly)
□ p
leas
e sp
ecify
dur
atio
n
□O
ccas
iona
l(2
-4 t
imes
/yea
r)
□R
egul
ar(5
-12
times
/yea
r)
□O
ngoi
ng/r
outin
e (d
aily
/wee
kly)
□ p
leas
e sp
ecify
dur
atio
n
□O
ccas
iona
l(2
-4 t
imes
/yea
r)
□R
egul
ar(5
-12
times
/yea
r)
□O
ngoi
ng/r
outin
e (d
aily
/wee
kly)
□ p
leas
e sp
ecify
dur
atio
n
□O
ccas
iona
l(2
-4 t
imes
/yea
r)
□R
egul
ar(5
-12
times
/yea
r)
□O
ngoi
ng/r
outin
e (d
aily
/wee
kly)
□ p
leas
e sp
ecify
dur
atio
n
Com
men
ts
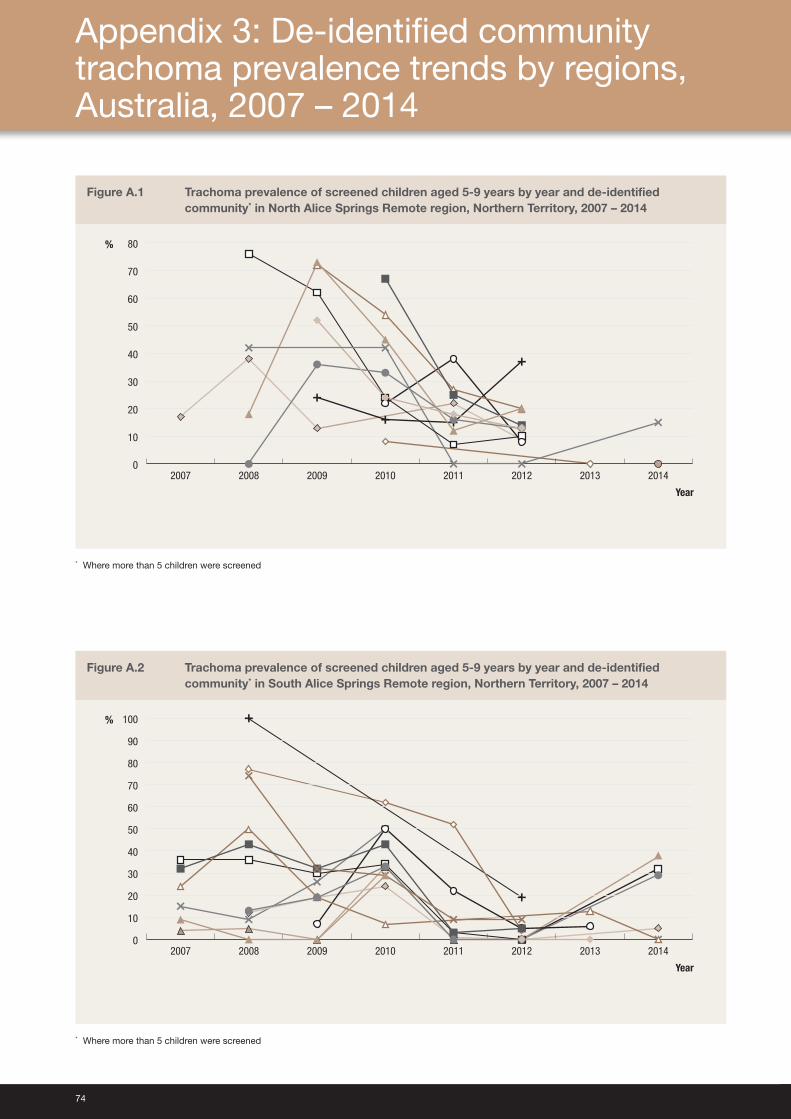
74
Figure A.1 Trachoma prevalence of screened children aged 5‑9 years by year and de‑identified community* in North Alice Springs Remote region, Northern Territory, 2007 – 2014
0
10
20
30
40
50
60
70
80
20142013201220112010200920082007
Year
%
* Where more than 5 children were screened
Figure A.2 Trachoma prevalence of screened children aged 5‑9 years by year and de‑identified community* in South Alice Springs Remote region, Northern Territory, 2007 – 2014
Year
0
10
20
30
40
50
60
70
80
90
100
20142013201220112010200920082007
%
* Where more than 5 children were screened
Appendix 3: De‑identified community trachoma prevalence trends by regions, Australia, 2007 – 2014
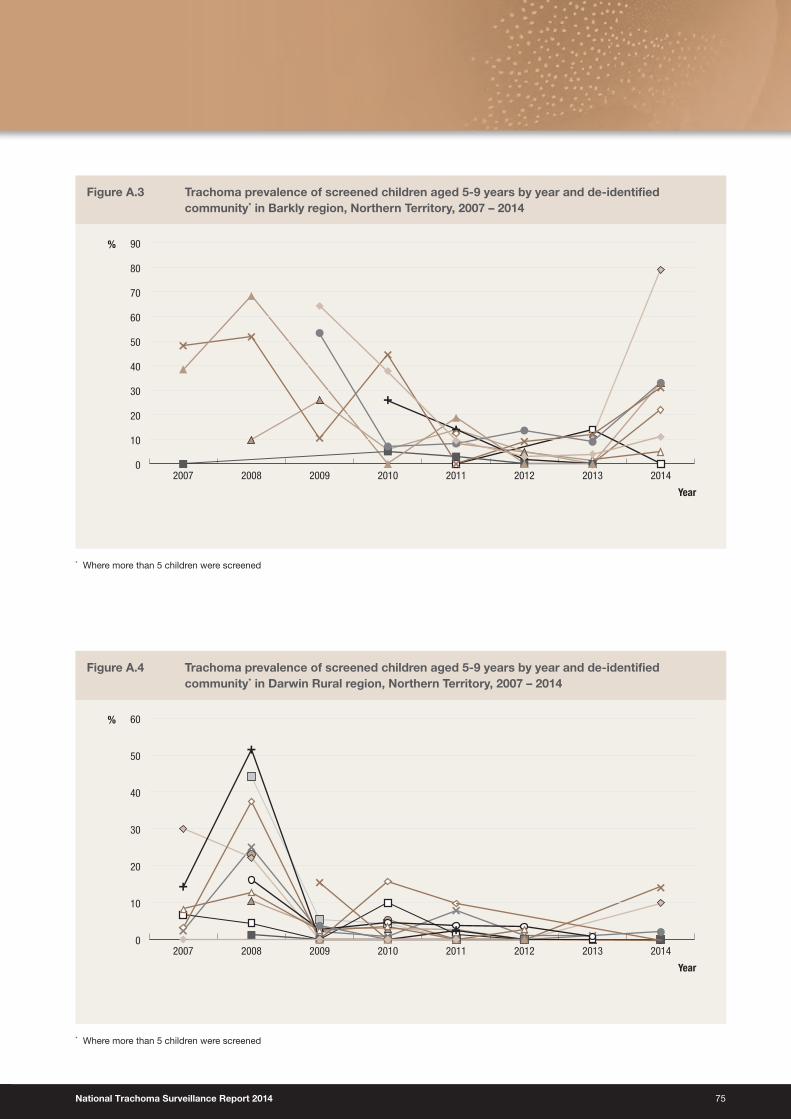
National Trachoma Surveillance Report 2014 75
Figure A.3 Trachoma prevalence of screened children aged 5‑9 years by year and de‑identified community* in Barkly region, Northern Territory, 2007 – 2014
0
10
20
30
40
50
60
70
80
90
20142013201220112010200920082007
Year
%
* Where more than 5 children were screened
Figure A.4 Trachoma prevalence of screened children aged 5‑9 years by year and de‑identified community* in Darwin Rural region, Northern Territory, 2007 – 2014
0
10
20
30
40
50
60
20142013201220112010200920082007
Year
%
* Where more than 5 children were screened
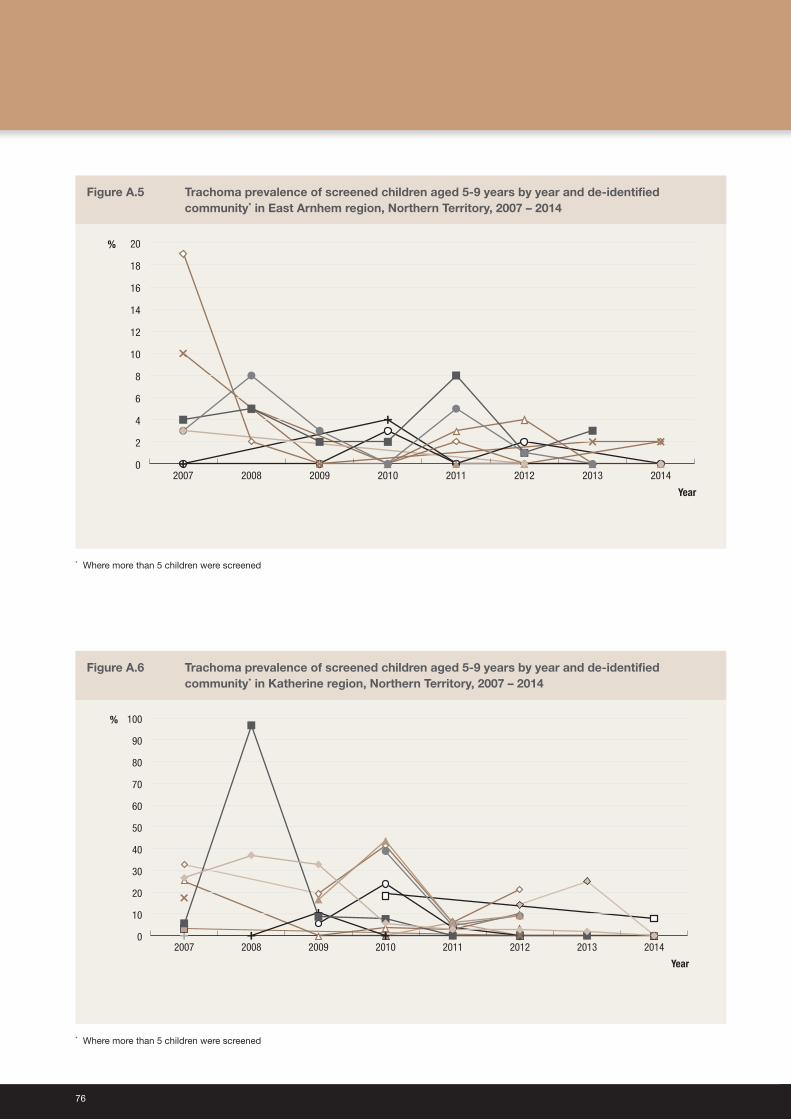
76
Figure A.5 Trachoma prevalence of screened children aged 5‑9 years by year and de‑identified community* in East Arnhem region, Northern Territory, 2007 – 2014
0
2
4
6
8
10
12
14
16
18
20
20142013201220112010200920082007
Year
%
* Where more than 5 children were screened
Figure A.6 Trachoma prevalence of screened children aged 5‑9 years by year and de‑identified community* in Katherine region, Northern Territory, 2007 – 2014
0
10
20
30
40
50
60
70
80
90
100
20142013201220112010200920082007
Year
%
* Where more than 5 children were screened
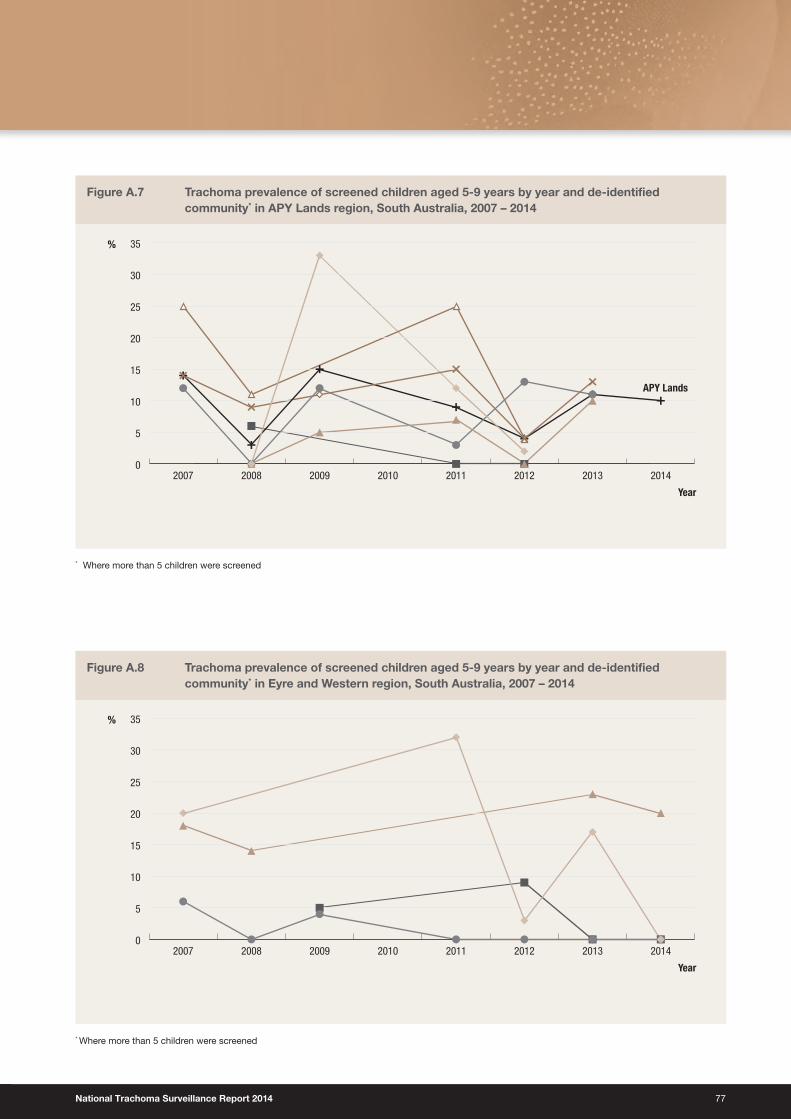
National Trachoma Surveillance Report 2014 77
Figure A.7 Trachoma prevalence of screened children aged 5‑9 years by year and de‑identified community* in APY Lands region, South Australia, 2007 – 2014
Year
0
5
10
15
20
25
30
35
20142013201220112010200920082007
%
APY Lands
* Where more than 5 children were screened
Figure A.8 Trachoma prevalence of screened children aged 5‑9 years by year and de‑identified community* in Eyre and Western region, South Australia, 2007 – 2014
0
5
10
15
20
25
30
35
20142013201220112010200920082007
Year
%
* Where more than 5 children were screened
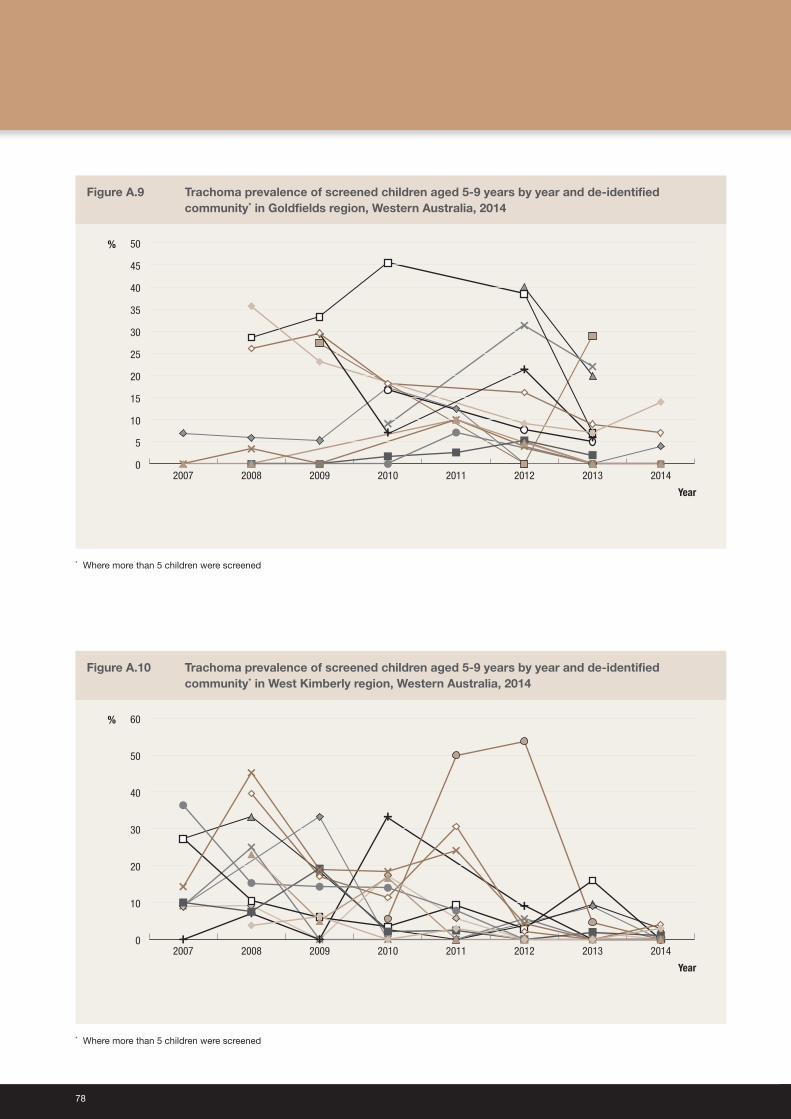
78
Figure A.9 Trachoma prevalence of screened children aged 5‑9 years by year and de‑identified community* in Goldfields region, Western Australia, 2014
Year
%
0
5
10
15
20
25
30
35
40
45
50
20142013201220112010200920082007
* Where more than 5 children were screened
Figure A.10 Trachoma prevalence of screened children aged 5‑9 years by year and de‑identified community* in West Kimberly region, Western Australia, 2014
0
10
20
30
40
50
60
20142013201220112010200920082007
Year
%
* Where more than 5 children were screened
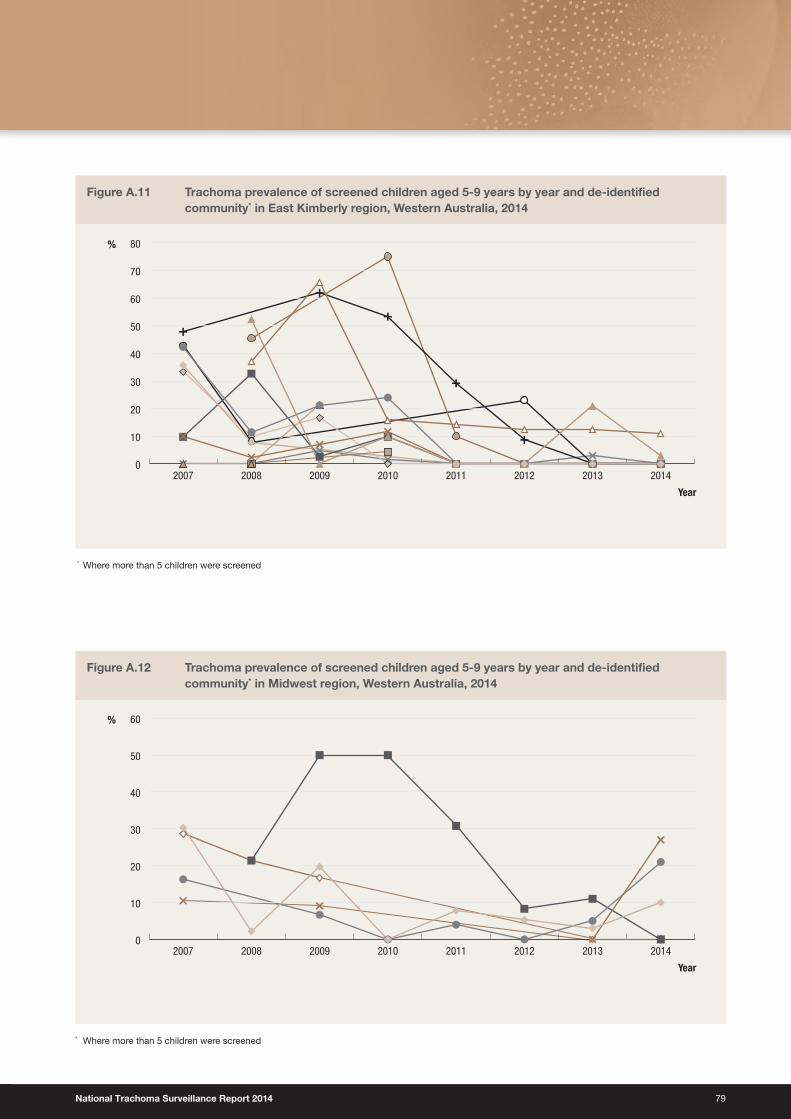
National Trachoma Surveillance Report 2014 79
Figure A.11 Trachoma prevalence of screened children aged 5‑9 years by year and de‑identified community* in East Kimberly region, Western Australia, 2014
Year
%
0
10
20
30
40
50
60
70
80
20142013201220112010200920082007
* Where more than 5 children were screened
Figure A.12 Trachoma prevalence of screened children aged 5‑9 years by year and de‑identified community* in Midwest region, Western Australia, 2014
Year
0
10
20
30
40
50
60
20142013201220112010200920082007
%
* Where more than 5 children were screened
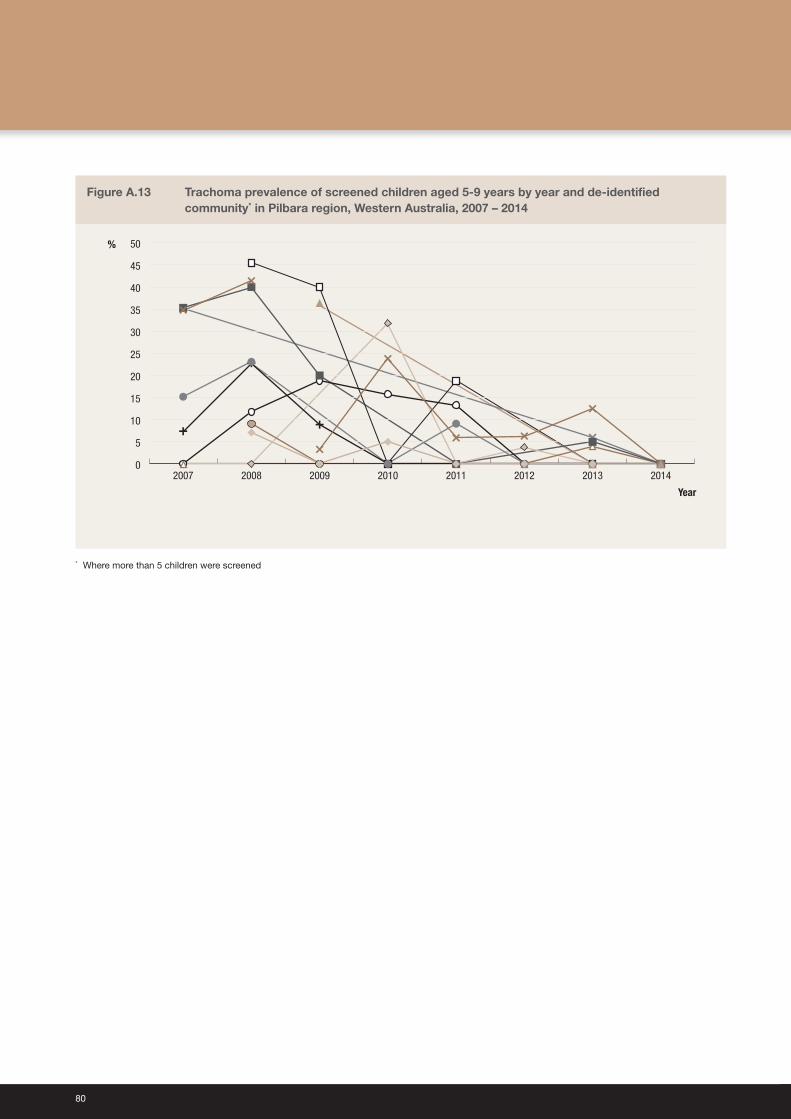
80
Figure A.13 Trachoma prevalence of screened children aged 5‑9 years by year and de‑identified community* in Pilbara region, Western Australia, 2007 – 2014
Year
0
5
10
15
20
25
30
35
40
45
50
20142013201220112010200920082007
%
* Where more than 5 children were screened

Australian Trachoma Surveillance Report 2014
ISSN 1839-2210
Suggested citation:Australian Trachoma Surveillance Report 2014. The Kirby Institute, UNSW Australia, Sydney NSW 2052.
© Commonwealth of Australia 2015
This report has been produced by the National Trachoma Surveillance Unit of The Kirby Institute for infection and immunity in society, UNSW Australia for the Australian Government Department of Health.
This work is copyright. You may reproduce the whole or part of this work in unaltered form for your own personal use or, if you are part of an organisation, for internal use within your organisation, but only if you or your organisation do not use the reproduction for any commercial purpose and retain this copyright notice and all disclaimer notices as part of that reproduction. Apart from rights to use as permitted by the Copyright Act 1968 or allowed by this copyright notice, all other rights are reserved and you are not allowed to reproduce the whole or any part of this work in any way (electronic or otherwise) without first being given the specific written permission from the Commonwealth to do so. Requests and inquiries concerning reproduction and rights are to be sent to the Communication Branch, Department of Health, GPO Box 9848, Canberra ACT 2601, or via e-mail to [email protected].
This publication is available at Internet address http://www.kirby.unsw.edu.au/trachoma
The Kirby Institute Wallace Wurth Building, UNSW Australia, Sydney NSW 2052
Telephone: 02 9385 0900 Facsimile: 02 9385 0920 International prefix: 61 2 Email: [email protected]

Australian Trachoma Surveillance Report
2014
Edited by National Trachoma Surveillance and Reporting Unit
www.health.gov.au
1131
7 N
ovem
ber 2
015
All information in this publication is correct as at November 2015