Australian Securities Exchange - ASX - For personal use only · Microsoft Online Services •...
88
ANNUAL REPORT I 4 | I 5 For personal use only
Transcript of Australian Securities Exchange - ASX - For personal use only · Microsoft Online Services •...

ANNUALREPORTI4|I5
For
per
sona
l use
onl
y

2
For
per
sona
l use
onl
y
OVERVIEWMessage from the Chairman 7
Managing Director’s Report 8
Our Board 10
Our Executive Team 12
FINANCIAL REPORTCorporate Governance Statement 14
Investor Relations 21
Directors’ Report 22
Auditor’s Independence Declaration 40
FINANCIAL STATEMENTS
Consolidated Statement of Profit and Loss and Other Comprehensive Income 42
Consolidated Statement of Financial Position 43
Consolidated Statement of Changes in Equity 44
Consolidated Statement of Cash Flows 45
Notes to the Financial Statements 47
Directors’ Declaration 80
Independent Auditor’s Report 82
Shareholding Information 84
Corporate Directory 85
Contents06
13
41
For
per
sona
l use
onl
y
4
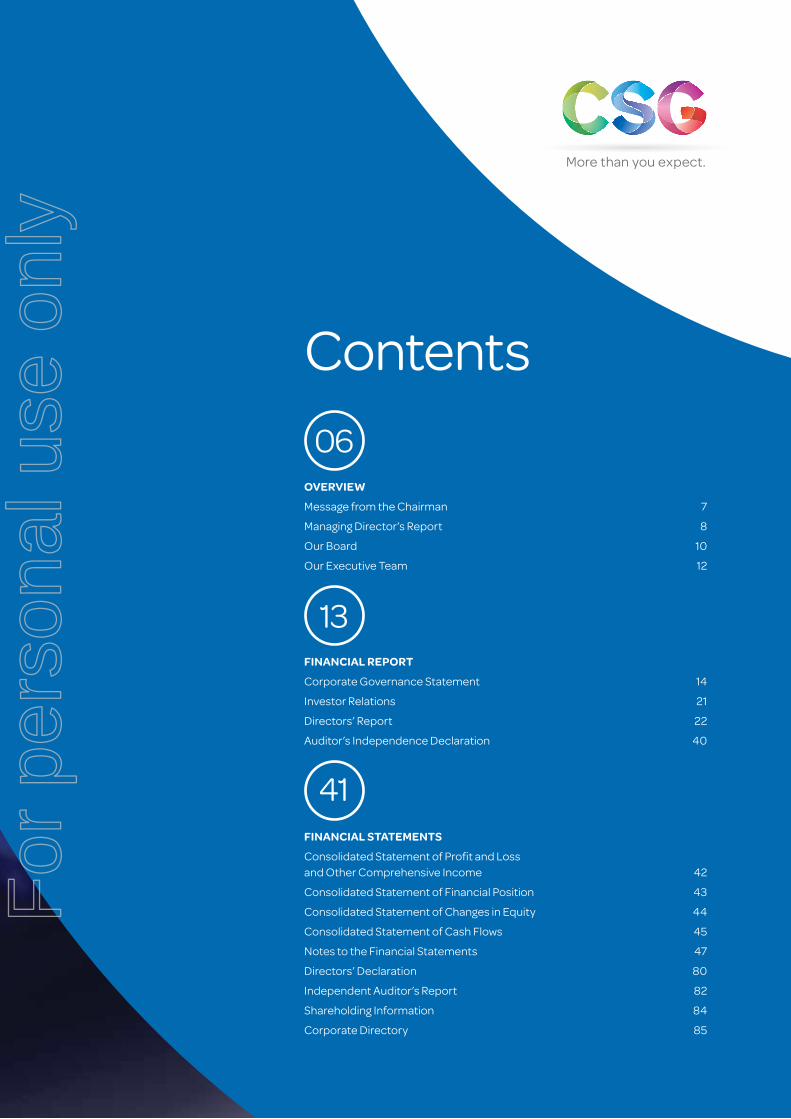
CSG PRODUCT SUITE
One Partner. One Bill. One Cloud.
TECHNOLOGY AS A SERVICE
This year CSG begun the journey to reposition as a Technology as a Service provider with a staged roll out of new products and solutions sold as a service to help our customers maximise productivity, reduce costs and drive flexibility and agility.
From FY16 onwards, customers will be able to source print, display, unified communications, desktop, data storage, backup and infrastructure all as a service from the one supplier with one simple monthly bill.
What does the ‘as a service’ approach mean for our customers?
Full support
Flexibility and agility
Cash flow benefits
Ease and simplicity
For
per
sona
l use
onl
y

CSG 14|15 ANNUAL REPORT 5
Print as a Service Tailored to our customers’ individual needs from small offices through to large scale managed print solutions.
Communications as a Service World leading, cloud telephony, video conferencing and unified communications solutions for a connected enterprise.
Desktop as a ServiceA complete desktop, communication and support package to provide employees with their IT needs for a fixed price per month.
CSG Virtual Office Powered by 8×8 this cloud telephony solution is truly ground breaking technology and anything but a traditional communication solution.
CSG Total Office • Online file storage, Online File
Server & team folders• Online backup for their PC• CSG Support service
Boardroom as a ServiceA full boardroom package that combines the latest state of the art Samsung digital display technology with CSG Conferencing.
CSG Virtual Office • Desk and direct phone number• Unified communications suite• Unlimited call plan to all Australian
or New Zealand based land lines
CSG Conferencing This unique solution simplifies video, regardless of the device or technical capabilities of the people you want to join.
Hardware bundle and Microsoft Online Services• Office 365 with Exchange Email• Microsoft Surface or HP touch
Windows Notebook• 24” monitor, keyboard and mouse
Infrastructure as a Service Built on the HP Helion Private Virtual cloud platform, CSG Cloud management takes away the IT Management burden so customers can focus on running their business.
Display as a Service Latest Samsung Digital display technology for a simple monthly payment fully supported by CSG. Large format, interactive and cloud displays to deliver engaging experiences.
For
per
sona
l use
onl
y

CSG OVERVIEW
6
For
per
sona
l use
onl
y

growth and increasing complexity of our business. Each of our new Directors have made significant contributions to the business.
Philip Bullock, our longest serving Director, has advised he will step down at this year’s Annual General Meeting. I would like to take this opportunity, on behalf of all at CSG and its shareholders, to recognise Philip’s outstanding contribution and wish him well for the future.
I also take this opportunity to recognise the contributions made by all my fellow Directors, our CEO and her senior management team, together with all our valued employees who continue to grow CSG into a leading provider of technology services to the Australian and New Zealand markets.
We are on an exciting journey at CSG and we thank you for your ongoing support.
Tom Cowan
Message from the Chairman
Dear Fellow Shareholders
It is with great pleasure that I present CSG’s Annual Report for the year ended 30 June 2015.
This year, CSG has built upon the strategy and business plan first adopted in 2012 and delivered another year of strong growth.
Our traditional print business continued to win new business in a mature and competitive marketplace. Importantly, the sales team had some early success in selling exciting new technology products and services introduced during the year. The vision of delivering a full suite of global best-of-breed technology to both existing and new customers ‘as a service’ and on one bill is fast becoming a reality.
In the area of capital management, we again delivered on our objective to return a minimum of $25 million per annum to shareholders. In the past year, this was by way of dividend payments totalling 9 cents per share. We have announced our
intention to maintain the dividend at this level over the next year.
We also took the opportunity, post balance date, to raise $40.2 million of new equity. This was achieved by way of an institutional placement of $30 million and an offer to all eligible shareholders of a Share Purchase Plan which raised $10.2 million. These funds were all raised at $1.42 per share. The response by existing and new shareholders to these offers was extremely pleasing.
The funds raised have been partly used to acquire the CodeBlue business in New Zealand. This business is a leader in the markets in which it operates, providing technology managed services to Small and Medium Enterprises (SME’s) in New Zealand. The remaining funds raised will be utilised on opportunities to further support our growth.
The Board believes the implementation of the new employee remuneration structures introduced in 2012 have played a major role in aligning, motivating and rewarding CSG staff for achieving our growth objectives. The Board intends to seek approval at the upcoming 2015 Annual General Meeting for a new Long Term Incentive Plan for key Executives and employees. As is the case with the current plans, management will be very well rewarded if the business continues to grow earnings and shareholder returns strongly.
Last year we appointed three new Board members in recognition of the
CSG 14|15 ANNUAL REPORT 7 CSG 14|15 ANNUAL REPORT 7
For
per
sona
l use
onl
y

Dear Shareholders
FY15 has been a busy one, rife with activity centred on business improvement and growth. Three years into our turnaround strategy set in 2012, I am delighted that this year we have again delivered on our objectives, announcing rises in revenue, profit and EBITDA while positioning the business for the future.
The financial results were pleasing with all business divisions achieving double digit growth. Key highlights include a 13% increase in revenue to $224 million, 12% growth in underlying NPAT to $21.3million and 15% growth in underlying EBITDA to $33.5million. We also reported a 30% increase in lease receivables within our finance business to $210 million.
This year we executed our strategy to expand our portfolio of products and solutions to include non-print offerings. We have enjoyed a successful first year in our partnership with Samsung and commenced ‘Technology as a Service’ sales of subscription software and hardware. The first solution to launch was ‘Boardroom as a Service’, which includes CSG Conferencing software bundled with a Samsung Interactive touch screen smart display.
In 2HY15 10% of all of our deals in Business Solutions Australia included non-print technology with an average value of $32K per customer. These Technology as a Service sales combined with continued acquisition of new customers were key contributors
to the growth of this division. I look forward to the non-print attach rate increasing as we roll out the full suite of cloud solution and Technology as a Service offerings over the coming year.
I am also pleased the Enterprise Solutions division achieved 28% revenue growth and won three major Print as a Service contracts during the year, with a total contract value of over $40 million over five years.
NEW PRODUCTS AND PARTNERSHIPS
As our restraint following the sale of our technology solutions business to NEC has lifted, we are full steam ahead on repositioning CSG from a print to a Technology as a Service provider.
As mentioned the first of our new ‘as a service’ solutions was launched this year with the roll out to continue in FY16, enabling CSG to deliver single source technology solutions to our customers across the SME and Enterprise sectors.
From FY16 onwards, a CSG customer will be able to source print, communications, desktop, IT infrastructure data storage and back up all ‘as a service’. The value proposition is clear. Our customers can source multiple products and solutions from one partner, with one simple monthly bill and access the latest, state of the art technologies with minimal capital outlay. Those who have seen me speak will have heard the expression ‘One Partner. One Bill. One Cloud’. An expression that underpins what it is we offer our customers.
CSG OVERVIEW
Managing Director’s Report
8
For
per
sona
l use
onl
y

driver in aligning staff performance to the business objectives.
In a recent survey undertaken by the People & Culture team, 100% of respondents participating in the Staff Incentive Share Plan believed it to be extremely valuable, an indication the plan is a success.
This year we say farewell to Dianne Silvestro who has left the company. Mark Thomas has replaced Dianne in the role of Executive General Manager, People and Culture. I would like to thank Dianne for her contribution to CSG over the last few years and welcome Mark to the team. Mark has an extensive background in human resource management having worked in blue chip and private companies across financial, professional and business services and also in the oil industry. His significant international experience includes 7 years based in London leading a global HR function. Mark joins us from Aurecon, where he was Global Human Capital Leader responsible for a workforce of 7,500 people across 20 countries.
I would also like to thank Philip Bullock for his many years on the CSG Board and wish him the best for the future.
The outlook is positive for FY16 and I look forward to building upon our success this year to achieve our desired growth in future years.
Julie-Ann Kerin
Our SME customers will benefit from the ease and simplicity of preconfigured, rapidly deployable cloud technology solutions that will help them save time and money. These solutions also scale up to suit the more tailored and complex needs of our Enterprise customers.
A key highlight in the roll out of our new products and solutions was the signing of our new partnership with 8x8, Inc., one of the fastest growing, leading providers of cloud based unified communications based out of the US. In signing the agreement, CSG has become a major channel partner for the 8x8 Virtual Office and Virtual Contact Centre solutions across the Asia Pacific region. We are looking forward to a very successful relationship with 8x8 and adding real value to our customers with the 8x8 solutions.
Another key highlight was the CodeBlue acquisition, which provides an attractive platform to support the CSG strategy and enhances our expertise in delivering IT support to the small to medium enterprise. CodeBlue and CSG are a natural fit and I look forward to a successful integration.
BUSINESS TRANSFORMATION – CUSTOMER HUB
This year we continued the roll out of our cloud based IT platform built on SalesForce.com with pleasing results. In Australia, this world class solution has replaced more than 100 legacy systems and we have started to enjoy the associated productivity and efficiency gains. The roll out in New Zealand is scheduled to be completed in the second half of FY16.
When complete, we will have one platform to manage all aspects of the business and the entire lifecycle of a customer from initial quote through to delivery and post sales service and account management. Having all of our data in one place will be a key contributor to our success moving forward.
We have implemented one of the leading business intelligence tools to support our move towards real time, minute by minute management, review and reporting of the business. Going forward, this will enable the business to make decisions based on predictive analysis of real time data rather than review of what has occurred in the past.
PEOPLE
The results we have achieved over the last few years are testament to the high quality professionals that comprise the CSG team across Australia and New Zealand and the contribution they make to the business every day. We will continue to bolster the skills and knowledge within our teams as our portfolio of solutions expand and I am looking forward to the increased career path opportunities we will be able to offer our staff as the business grows.
We again this year issued $1,000 worth of shares to every employee participating in the Staff Share Incentive Plan and as mentioned in the Chairman’s report will be seeking approval for the renewal of both this plan and the Long Term Incentive Plan at this year’s Annual General Meeting. I believe that the Staff Incentive Share Plan has been a key
CSG 14|15 ANNUAL REPORT 9
For
per
sona
l use
onl
y

CSG OVERVIEW
Our Board
Mr. Thomas CowanB.Com (Hons)
Non-Executive Chairman Member, Audit Committee Member, Nomination and Remuneration Committee
Tom Cowan is a partner of TDM Asset Management, a Sydney based private investment firm. TDM Asset Management invests in public and private companies globally. Mr. Cowan has over 15 years of financial markets experience, including roles in corporate finance and investment banking at Investec Wentworth and KPMG Australia. He has a Bachelor of Commerce (Honours – Class 1) from the University of Sydney.
Mr. Cowan is currently a Non-Executive Director of Baby Bunting Group Limited.
Appointed 8 February 2012 Appointed Chairman 15 August 2012
Ms. Julie-Ann KerinAICD
Managing Director
Since Julie-Ann Kerin was appointed as Chief Executive Officer and Managing Director of CSG in 2012, she has established a proven track record of delivering strong growth and significant return to shareholders.
Under Ms. Kerin’s leadership, CSG successfully completed the transaction of the sale of the former Technology Solutions Division to NEC Australia in 2012 for $227.5 million and subsequently returned $130 million to shareholders over the following three years.
Prior to Ms. Kerin’s appointment as CEO, she was the Group General Manager of the former Technology Solutions Division for five years, and achieved revenue growth from $9m to $183m.
She has more than 20 years’ experience as a senior executive managing both private and public companies across the information technology sector. Prior to joining CSG, Ms. Kerin was responsible for the global management of operations and staff across Asia, the United States, Australia and Europe for a number of organisations. She has also held roles with IT companies Actuate, Haht Commerce, Genasys Inc and Computer Power. Ms. Kerin is a member of the Australian Institute of Company Directors.
Appointed 1 February 2012
Mr. Stephen AnsticeBA (Economics), Grad. Dip. (SAI)
Non-Executive Director Member, Nomination and Remuneration Committee
Stephen Anstice has over 20 years’ experience in the communications industry. Until June 2013, Mr. Anstice was CEO of IPMG Pty Ltd (IPMG), a print, digital and marketing communications business. Mr. Anstice also has an extensive background in investment banking. He is currently a Non-Executive Director of IPMG, Audant Investments Limited and The Song Company Limited.
Mr. Anstice has a Bachelor of Arts (Economics) from Macquarie University and a Graduate Diploma from the Securities Institute of Australia.
Appointed 20 August 2014
10
For
per
sona
l use
onl
y
Ms. Robin LowB.Com, FCA, GAICD
Non-Executive Director Chairman, Audit Committee
Robin Low was formerly a partner at PricewaterhouseCoopers for over 17 years and has extensive experience in assurance and risk management, particularly in the financial services area.
She is currently a Non-Executive Director of Austbrokers Holdings Limited, IPH Limited and Appen Limited. Ms. Low is also a member of the Audit and Assurance Standards Board and on the board of a number of not-for-profit organisations including Sydney Medical School Foundation, Public Education Foundation and Primary Ethics.
Ms. Low has a Bachelor of Commerce from The University of New South Wales, is a Fellow of the Institute of Chartered Accountants in Australia and is a Graduate Member of the Australian Institute of Company Directors.
Appointed 20 August 2014
Mr. Philip BullockBA, Dip Ed, MBA, GAICD
Non-Executive Director Chairman, Nomination and Remuneration Committee Member, Audit Committee
Appointed a Director of CSG in August 2009, Mr. Bullock was formerly Vice President, Systems and Technology Group, IBM Asia Pacific, Shanghai, China. Prior to that position he was Managing Director of IBM Australia and New Zealand. His IBM career spanned almost 30 years in the Asia Pacific region.
Mr. Bullock is a Non-Executive Director of Perpetual Limited and Hills Limited, and was previously a Non-Executive Director of Healthscope Limited. Over the years he has served on a number of Federal Government bodies, most notably as the Chair of Skills Australia.
Appointed 1 August 2009
Mr. Mark PhillipsB. Com (Hons), M. Com, FAICD
Non-Executive Director Member, Audit Committee
Mark Phillips has substantial experience in banking and asset leasing. Mr. Phillips worked at the Commonwealth Bank of Australia for 20 years in various roles involving asset finance, securities and trading markets, property lending and government finance.
Mr. Phillips was formerly Managing Director of Record Investments Limited (Record) and Keybridge Capital Ltd. While Managing Director at Record, the market capitalisation grew from approximately $100 million to over $1.5 billion.
Mr. Phillips is currently a Non-Executive Director of General Reinsurance Australia Limited and General Reinsurance Life Australia Limited (a Berkshire Hathaway company) and a Non-Executive Director of Cancer Council (NSW).
Mr. Phillips was formerly a Non-Executive Director of Interlink Roads Ltd and ASB Bank Limited in New Zealand.Mr. Phillips has a Bachelor of Commerce and a Masters of Commerce from the University of New South Wales and is a Fellow of the Australian Institute of Company Directors.
Appointed 20 August 2014
CSG 14|15 ANNUAL REPORT 11
For
per
sona
l use
onl
y

Our Executive Team
Neil Lynch was appointed Chief Financial Officer of CSG in 2012. In the role, Mr. Lynch has been responsible for the merging of CSG Finance in Australia and New Zealand.
Mr. Lynch came to CSG after an 11 year career at Virgin Blue Airlines. As a foundation employee at Virgin Australia, Neil was involved in the development of all aspects of the finance team through several roles with the most recent being General Manager of Finance.
Prior to Virgin Australia, Mr. Lynch worked in a variety of finance roles in both private practice and large corporate organisations. Neil is a Chartered Accountant with degrees in both Commerce and Economics from the University of Queensland.
Stephen Birrell is a proven business leader with over 25 years’ experience in the Information Technology, Aerospace and Government sectors. His career has included senior executive roles with leading organisations in Australia, the United States, Asia and Europe, including The Boeing Company, BAE Systems and Honeywell Space and Aviation.
Prior to joining CSG in June 2013, Mr. Birrell was the General Manager of NEC Australia’s Strategic Business Unit, accountable for achieving strategic growth objectives and business expansion in Asia and the Middle East. Mr. Birrell is a former Officer in the Royal Australian Air Force.
Warwick Beban has been the Executive General Manager of CSG Business Solutions in New Zealand since 2007. With over 15 years’ experience in the Document Technology business, Mr. Beban started working with Ubix Document Technology in 1991. During his 10 year career with Ubix he was ultimately promoted to Southern Regional Manager, responsible for the company’s operation in the lower North Island and South Island. After five years with Telecom New Zealand as Head of Business and Corporate for Telecom Mobile, Mr. Beban re-joined Konica Minolta as General Manager.
Mr. Beban has a Bachelor of Science Degree and Masters of Science with First Class Honours from Massey University.
Neil Lynch
Chief Financial Officer
Stephen Birrell
Executive General Manager, Enterprise Solutions
Declan Ramsay
Executive General Manager, Business Solutions Australia
Warwick Beban
Executive General Manager, Business Solutions New Zealand
Declan Ramsay has more than 20 years’ experience within the print sector. He has been with CSG since 2006, when he managed and controlled the Xerox Business Centre key accounts as the Major Account Manager before becoming the Brisbane Sales Manager in July 2007, followed by the Queensland General Manager position.
In February 2012, Mr. Ramsay was appointed to the role of Regional General Manager for NT/QLD. In July 2012, Declan was appointed as the Executive General Manager of CSG Business Solutions Australia.
Mr. Ramsay has a strong background in sales and management of highly professional and motivated teams covering all facets of a business solutions organisation.
Mark Thomas joined CSG in September this year bringing extensive experience in the human resource management profession. Mark has worked in blue chip and private companies across financial, professional and business services as well as the oil industry.
Prior to joining CSG, Mark was the Global Human Capital Leader for Aurecon, responsible for a workforce of 7,500 people across 20 countries. His significant international experience includes seven years based in London leading a global HR function. Mark holds a Bachelor of Business.
Mark Thomas
Executive General Manager, People and Culture
CSG OVERVIEW
12
For
per
sona
l use
onl
y

I4|I5Financial Report
For
per
sona
l use
onl
y

CORPORATE GOVERNANCE STATEMENT
Corporate Governance StatementThe Board of CSG Limited (CSG, Board or Company) is committed to protecting shareholders’ interests and keeping investors fully informed about the performance of the Company. In doing so, it seeks to ensure the future sustainability of the organisation and create long term value for its shareholders. The Board have established the following processes to protect the interests and assets of shareholders and to ensure high standards of integrity and governance.
In undertaking these responsibilities, the Board has adopted a formal:
• Board Charter
• Audit Committee Charter
• Nomination and Remuneration Committee Charter
• Code of Conduct for Directors and Officers
Further, the Board has also adopted or issued revised policies with respect to:
• Independence and Conflicts of Interest
• Risk Management
• Board Performance Evaluation
• CEO Performance Evaluation
• Continuous Disclosure and External Communications
• Share Trading
• Remuneration
• Diversity
Copies of these charters and policies are available to shareholders on the Company’s website (www.csg.com.au/investors) or on request. These documents are not intended to be an exhaustive list of all corporate governance practices in place at CSG.
This Corporate Governance Statement outlines the Company’s practices for the year-ended 30 June 2015 and as at the date of this Annual Report. It is referenced against the latest Corporate Governance Principles and Recommendations (3rd Edition) issued by the ASX Corporate
Governance Council, which took effect from 1 July 2014 (Principles and Recommendations). There are eight principles prescribed by the Council and these are reported against below.
Principal 1: Lay solid foundations for management and oversight1.1 The BoardThe Directors of the Company are accountable to shareholders and other stakeholders for the proper management of the business and affairs of the Company. The Board fulfils these obligations by delegating certain business development responsibilities to the Chief Executive Officer (CEO), but retains the following responsibilities, as set out in the Board Charter:
• agreeing with the CEO the annual cycle and process for review of strategic plans, including which stakeholders are to be involved and how;
• ensuring that the whole Board is directly involved in the strategic planning and review processes;
• ensuring that strategy development includes proper consideration by the Board and management of associated risks and opportunities;
• ensuring that all approved strategic plans include clear and measurable financial and other objectives;
• requiring that business plans and budgets are prepared and provided to the Board to support the agreed strategic plans;
• monitoring and reviewing the performance of the Company against the agreed strategic plans and goals;
• developing key Company policy; and
• monitoring and evaluating the Executive Management Team’s performance.
The Board is responsible for the development of appropriate internal controls to monitor and supervise the implementation of agreed strategies, policies, and the financial and other performance of the Company against approved strategies, budgets and delegations.
The Board delegates responsibility for day-to-day management of the Company to the CEO. The Company has adopted a Delegated Authorities Policy which establishes delegations and approval levels throughout the business. The CEO is responsible for executing the delegations contained in the policy, but must consult the Board on matters that are noted as requiring specific Board approval or are of a sensitive, extraordinary or strategic nature.
The Board has also adopted a CEO Evaluation Policy and a Remuneration Policy to govern the process for evaluating the employees of the Company, including the performance of the CEO and the Executive Management Team.
For the 2015 financial year, the Board measured the CEO and Executive Management Team against an approved corporate scorecard and, where applicable, divisional scorecards. The outcomes of this process are set out in the Remuneration Report.
1.2 Appointment of DirectorsIn accordance with recommended practice, the Company undertakes a series of character, security and financial checks prior to appointing a candidate to the Board.
The Company also ensures shareholders are provided with all material information in its possession relevant to a decision on whether to elect or re-elect a Director. This is provided by a variety of means, including Director information contained in this Annual Report, the Company website and in the Notice of
14
For
per
sona
l use
onl
y

• seeking to ensure that the Company’s business practices, systems and processes do not prevent people from diverse backgrounds having equality of opportunity within the Company;
• developing flexible work practices to meet the differing needs of our employees at different stages of their life cycle in the context of business requirements;
• attracting and retaining a skilled and diverse workforce;
• attracting and retaining a Board whose composition reflects a diversity of backgrounds, knowledge, experience and abilities; and
• improving the quality of decision-making, productivity and teamwork to meet the relevant requirements of local legislation and the Board and shareholders.
The policy is implemented by an internal Diversity Council under the direction of the CEO and Executive General Manager, People & Culture. This Council has adopted a Workplace Diversity Strategy and Action Plan for the 2015 to 2018 period.
Assessment of gender diversity objectives under the policy are measured by the following key benchmarks, each of which are reviewed annually as a minimum or upon presentation of results in the table above.
The Company also captures a range of indicators for purposes of assessing progress against its policy and for government reporting purposes. At a high level these include:
• composition of the Board by gender (currently 33% are female);
• composition of the workforce between full time and part time;
• salary comparisons based on gender; and
• policy development and implementation.
The Company is a ‘relevant employer’ for the purposes of the Workplace Gender Equality Act. Our latest report was lodged in May 2015 with the Workplace Gender Equality Agency and can be viewed on their website at www.wgea.gov.au. This Agency compiles industry based data for comparison purposes in the form of Gender Equality Indicators. One such indicator used to measure performance is a gender comparison within the Information Technology Professional, Scientific & Technical Services industry. This graphic, based on 2014 data, provided the following comparison:
Meeting relating to the election or re-election of a Director.
During the financial year, three (3) new Directors were appointed to the Board and one (1) Director resigned, resulting in a Board of six (6); five (5) Non-Executive Directors and the CEO
1.3 Appointment Terms.Each Director and nominated Executive under the Remuneration Policy of the Company has in place a written agreement specifying the terms of their engagement, including their roles and responsibilities. Any variations to their initial appointment agreements are also appropriately documented.
Employment agreements for the CEO and Executive team are for unlimited periods but may be terminated by written notice by either party. Details of notice periods relating to these agreements are outlined in the Remuneration Report.
A procedure has also been determined for each Director to have the right to seek independent professional advice, at the Company’s expense, subject to the prior approval from the Chairman.
1.4 Company Secretary The Company Secretary is accountable directly to the Board, through the Chairman, on all matters to do with the proper functioning of the Board and its Committees.
The qualifications and experience of CSG’s Company Secretary is set out in the Directors’ Report.
1.5 DiversityThe Company has adopted a Diversity Policy which, consistent with its organisational values and strategic goals, focuses upon gender, ethnicity/culture, disability and flexibility as key levers linked to building a high performing and sustainable organisation. Key principles include:
• facilitating equal employment opportunities based on relative ability, performance and potential;
• building and maintaining an inclusive work environment by taking action against inappropriate workplace and business behaviour (including discrimination, harassment, bullying, victimisation and vilification),
• fostering a diverse workforce by developing an environment of mutual respect, dignity and openness to others;
Key Benchmark
Outcome 2015
Percentage of women in the Executive Management Team and other senior management(i) to exceed 30% 29% are female
Percentage of women employed by CSG exceed 25%
30% are female
Complete a diversity audit by 31 March each year Completed
(i) Under the Diversity Policy, the definition of senior executive positions will include all Executives at CEO level (Level 5) and Executive General Managers (Level4) as set out in the Company’s Remuneration Policy.
Women
CSG Comparison group
CSG 14|15 ANNUAL REPORT 15
100% 11.4%
20% 23.8%
37.5% 25.6%
14.3% 32%
36.4% 42.6%
30.9% 46.8%
CEO (or equivalent)
Key management personnel
Other executives/ general managers
Senior managers
Other managers
Non- managers
For
per
sona
l use
onl
y

CORPORATE GOVERNANCE STATEMENT
The Company carries out a comprehensive employee survey at regular intervals (the last being during the 2014 financial year). This survey covered a number of areas and included diversity topics such as gender balance, flexible work practices and diversity recognition within the business. The Company has used this survey feedback during 2015 to continue to improve and develop strategies that promote diversity and inclusion throughout the business.
The Company’s Diversity Policy and Code of Conduct can be found at ww.csg.com.au/investors.
1.6 Non-Executive Director Evaluation
The Board has adopted a policy in relation to its performance evaluation. The Board carried out a performance evaluation during the 2015 financial year using a self-evaluation questionnaire. The evaluation focused on:
• the role of the Board within the business;
• Board composition, skills and application;
• Board procedures and practices; and
• Board culture and behaviour.
In addition to this formal process, the Chairman communicates regularly with Directors individually and collectively on the functioning of the Board and seeks feedback on his own performance as part of these discussions.
A standing item is included on the agenda at the end of each Board meeting to encourage Directors to provide regular feedback on the conduct of Board meetings or any other Board business to assist in the continual improvement of Board processes.
1.7 CEO and Executive EvaluationsThe Remuneration and Nomination Committee undertakes the process of performance reviews for the CEO and the Executive Management Team as provided under the Remuneration Policy. These reviews are assessed against KPIs set at the start of the financial year and which are both financial and non-financial in nature. Further details of these assessments, including outcomes, can be found in the Remuneration Report.
Principle 2: Structure the Board to add value2.1 Nomination and Remuneration
CommitteeThe Nomination and Remuneration Committee is chaired by independent Non-Executive Director, Mr Philip Bullock, and operates under a formal charter that clearly sets out its role, responsibilities, composition, structure, membership requirements and the procedures for inviting non-Committee members to attend meetings.
The names of the members of this Committee and their attendance at Committee meetings is set out in the Directors’ Report.
The role of this Committee is to support the Board in fulfilling its statutory and fiduciary responsibilities, including ensuring that there are appropriate processes for items such as Board renewal and succession, assessment of performance, new Director induction, and identifying appropriate industry and education programs
2.2 Board Skills MatrixThe Board is ultimately responsible for the oversight and review of the management, administration and overall governance of CSG. Accordingly, the Board has identified the following matrix which it believes captures the key skills and diversity attributes which the Board as a whole requires to deliver against its objectives. The Board, having introduced three (3) new Directors in 2014, reviews these attributes annually and believes it presently possesses this blend of skills and diversity attributes:
• Governance
• Strategy
• Mergers and Acquisitions
• Accounting and Financial
• Banking and finance leasing
• Technology industry experience and expertise
• Customer Service and Delivery
• Risk Management
• Capital Management and Investor Relations
The Directors therefore believe the Board collectively has the necessary skill set to ensure an appropriate and diverse mix of backgrounds, expertise, experience and qualifications to effectively advise and set the Company’s strategic direction, and govern on behalf of shareholders.
2.3 Composition of the BoardThe Board consists of six (6) Directors, of which five (5) are Non-Executive Directors. During the 2015 financial year, the Board composition changed with three (3) new independent Non-Executive Directors being appointed (as defined by the Principles and Recommendations). The Chairman is a Non-Executive Director. The CEO is an Executive Director. The skills, experience and appointment date of each Director are set out in the Directors’ Report.
2.4 Director IndependenceBased on the applicable Principles and Recommendations guidelines, to be independent a Director should be Non-Executive and:
• not be a substantial security holder of the Company or an officer of, or otherwise associated with, a substantial security holder of the Company;
• not have, within the last three (3) years, been employed in an executive capacity by the Company or another company within the Group, or been a Director after ceasing to hold any such employment;
• not be a partner, principal or senior employee of a provider of material professional services to a company in the Group ;
• not been within the last three (3) years, in a material business relationship (e.g. as a supplier or customer) to a company within the Group, or an officer of, or otherwise associated with, someone with such a relationship ;
• not have a material contractual relationship with the Company or another Group company other than as a Director;
• not have close family ties with any person who falls within any of the categories described above; or
• not been a Director of the Company for such period that his or her independence may have been compromised.
16
For
per
sona
l use
onl
y

During the 2015 financial year, Messrs Stephen Anstice, Philip Bullock, Ian Kew, Mark Phillips and Ms Robin Low were considered by the Board to be independent Non-Executive Directors.
2.5 Chairman IndependenceUnder the guidelines set out above, the Chairman, Mr Tom Cowan, would not be considered independent due to his partnership in a fund manager which is a substantial security holder in the Company. This is contrary to the recommendation that a Chairman be independent. However, the Board believe Mr Cowan’s experience as a Non-Executive Director of the Company together with his qualifications and close alignment with security holders make him the most appropriate Director to be Chairman. The Board also has an Independence and Conflicts of Interest Policy to manage any potential conflicts arising from the shareholding.
2.6 Director Induction and Professional Development
The Nomination and Remuneration Committee has responsibility under its charter for the oversight of Director induction and on-going professional development. The Committee work with management to introduce a Director to CSG, including its policies and procedures. A program is specifically developed based on the individual Non-Executive Director’s role within the Board. Their skills matrix and their previous experiences are considered in developing an appropriate induction program.
Board members are encouraged and assisted to visit CSG work sites and Board meetings are rotated to various locations as part of this program. Where appropriate, expert advisers, in conjunction with internal expertise, undertake presentations at Board meetings addressing specific elements of the Company’s business.
Principle 3: Act Ethically and ResponsiblyThe Company has developed a Code of Conduct to guide, in particular, the Directors, the CEO, Chief Financial Officer (CFO) and other members of the Executive Management Team in respect of ethical behaviour. The Code of Conduct is designed to maintain confidence in the Company’s integrity and the responsibility and accountability of all individuals within the Company for reporting unlawful and unethical practices.
The Code of Conduct addresses such areas as:
• standard of behaviour;
• interests of legitimate stakeholders;
• conflicts of interest;
• use of information or position;
• use of Company property;
• confidentiality;
• fair trading;
• compliance with the law;
• whistle blowing; and
• political contributions and activities.
The Company’s Code of Conduct can be found at www.csg.com.au/investors
Principle 4: Safeguard Integrity in Corporate Reporting4.1 Board Audit CommitteeThe Board has established an Audit Committee which is chaired by independent Non-Executive Director Ms Robin Low, and operates under a formal charter that clearly sets out the Committee’s roles, responsibilities, composition, structure, membership requirements and the procedures for inviting non-Committee members to attend meetings. The Board has not established a separate risk
management committee, as the Board has determined that these matters are appropriately addressed by the Audit Committee or the full Board.
The names of the members of the Audit Committee and their attendance at Committee meetings are set out in the Directors’ Report.
During the 2015 financial year, the Audit Committee:
• consisted only of Non-Executive Directors;
• had a majority of independent Directors;
• was chaired by an independent chair, who is not the Chairman of the Board; and
• had three (3) members.
The Audit Committee provide an independent review of:
• the effectiveness of the accounting and internal control systems and management reporting, which are designed to safeguard Company assets;
• the integrity and reliability of information prepared for use by the Board, including financial information;
• the accounting policies adopted by the Company;
• the quality of the external audit function;
• external auditor’s performance and independence as well as considering such matters as replacing the external auditor where and when necessary;
• risk profile and mitigation plans;
• the Company’s exposure to significant risks, strategic and operational improvements in risk management planning and implementation; and
• the insurance renewal process, including the appointment of an insurance broker and review of policies.
The charter for the Audit Committee can be found at www.csg.com.au/investors.
4.2 AssurancesThe Board receives assurances from the CEO and CFO that the annual declaration provided in accordance with section 295A of the Corporations Act 2001 is founded on a sound system of
CSG 14|15 ANNUAL REPORT 17
For
per
sona
l use
onl
y

risk management and internal control and that the system is operating effectively in all material respects in relation to financial reporting risks.
The Board has received these assurances for the 2015 financial year.
4.3 External AuditorThe external Auditor attends the Annual General Meeting and is available to answer shareholders’ questions raised at the Annual General Meeting, concerning the conduct of the audit, the preparation and content of the Auditor’s Report, the accounting policies adopted and auditor independence.
Principle 5: Make timely and balanced disclosureThe Board recognises that the Company, as a publicly listed entity, has an obligation to make timely and balanced disclosure in accordance with the requirements of the ASX Listing Rules and the Corporations Act 2001. The Board is also of the view that an appropriately informed shareholder base, and market in general, is essential to an efficient market for the Company’s securities. The Board is committed to ensuring that shareholders and the market have timely and balanced disclosure of matters concerning the Company.
The Company has adopted a formal Continuous Disclosure and External Communications Policy to ensure compliance with its continuous disclosure requirements and to allow the market to be appropriately informed of the Company’s strategy and performance.
Amongst other matters, this policy requires the immediate notification to ASX of information concerning the Company that a reasonable person would expect to have a material effect on the price or value of the Company’s securities as prescribed under ASX Listing Rule 3.1, except where such information is not required to be disclosed in accordance with the exception provisions of the Listing Rules.
A copy of the policy can be found at www.csg.com.au/investors.
Principle 6: Respect the rights of shareholders6.1 Communication with
ShareholdersThe Board recognises that the shareholders are the beneficial owners of the Company and respects their rights, and will continually seek ways to assist shareholders in the exercise of those rights.
In accordance with its communication strategy, the Company’s website (www.csg.com.au) is considered to be the primary means to provide information to all stakeholders. It has recently been upgraded to enable information regarding CSG to be accessed in a clear and readable manner, including under the Investors tab:
• biographies of Directors and the Executive Management Team;
• corporate governance charters and policies;
• all announcements and releases to the ASX;
• copies of presentations to shareholders, institutional investors, brokers and analysts;
• any media or other releases;
• all notices of meetings and explanatory material;
• current and prior Annual Reports and similar documents; and
• any other relevant information concerning non-confidential activities of the Company including new business developments.
The Board also recognises that, as owners of the Company, the shareholders may best contribute to the Company’s growth, value and prosperity if they are informed. In accordance with the Company’s Continuous Disclosure and External Communications Policy, the Board seeks to empower shareholders by:
• communicating effectively with shareholders through periodic disclosure and market briefings;
• enabling shareholders access to balanced and understandable information about the Company, its operations and proposals; and
• assisting shareholders participation in general meetings.
All shareholders are entitled to receive a hard copy of the Company’s annual reports upon request. All relevant announcements made to the market are made available on the Company’s website after they have been released to the ASX.
6.2 Investor Relations ProgramIn addition to the Company website, there is a dedicated Investor Relations page contained within the Annual Report which provides shareholders with Company contact details and key dates.
Shareholders can contact the Company by mail at Level 1, 357 Collins Street, Melbourne, Victoria 3000 or by email at [email protected]
6.3 Participation in MeetingsThe Board is committed to assisting shareholders participation in meetings. In particular, the Company requests that a representative of the Company’s external auditor be present at all Annual General Meetings and that shareholders have adequate opportunity to ask questions of the auditor at that meeting concerning the audit, preparation and content of the auditor’s report.
The next Annual General Meeting of the Company is scheduled for 19 November 2015 in Melbourne.
Results of the meeting and any presentations given will be released to the ASX and subsequently made available on the Company’s website.
6.4 Electronic CommunicationsThe Company has established an investor enquiry email address ([email protected]). This provides a means by which shareholders and other interested parties can contact the Company and seek information or raise specific questions.
The Company also encourages shareholders to register their email addresses at any time with our Share Registry, Computershare Investor Services Pty Limited, and benefit from the range of communications and services they can provide electronically.
In addition, as a listed company, shareholders can also visit the ASX website (www.asx.com.au) and obtain information, including the current share price, under the ASX code “csv”.
CORPORATE GOVERNANCE STATEMENT
18
For
per
sona
l use
onl
y

Principle 7: Recognise and manage risk7.1 Responsibility for RiskThe Company is committed to managing its risks in a consistent and practical manner. Effective risk management is directly focussed on the achievement of organisational objectives and helps ensure the business delivers on its strategic goals in alliance with its vision and values.
The Board carries overall responsibility to all stakeholders for the identification, assessment, management and monitoring of the risks faced by the Company and is assisted in this process by the Audit Committee.
7.2 Review Risk Management Framework
The Company has adopted a formal Risk Management Policy which aims to ensure that the Board implements appropriate risk management policies and procedures in order to protect the assets and undertaking of the Company. The approach to risk management and the effectiveness of its implementation is based on, as a minimum, the Australian and New Zealand Standards AS/NZS 31000:2009.
The Board has previously adopted a risk management guideline which is designed to provide a high level overview of key steps within the Company’s risk management process and to provide the tools to facilitate risk management across the organisation. The framework enables the identification and documentation of risk across the business by requiring management to:
1. identify the risk;
2. assign the risk to a category;
3. assess the likelihood of a risk;
4. assess the consequences of a risk;
5. apply the risk to the risk matrix; and
6. monitor, review, communicate and consult on the risk.
The risk management guideline requires management to produce a risk profile report which was presented to the Audit Committee for its review during the financial year.
7.3 Internal Audit FunctionThe Company has not formally adopted an internal audit function at this time. It has engaged with advisers in the current year to identify the structure and role of this function, with the view to appointing a specialist external firm to carry out this function in the near term.
In the interim, it continues to undertake the process identified under the Risk Management Policy. The outcomes of this process are reviewed initially by external advisers and a risk profile report is provided to the Audit Committee, capturing key changes, movements and trends since the last report.
7.4 Economic, Environmental and Social Sustainability Risk
The Board, in their Directors’ Report, has identified some key risks that require management and adoption of mitigation strategies, where they assess the inherent risks to be unacceptable.
From an environmental perspective, the Company does not require any specific licences to operate the business. Nevertheless, the Company takes a proactive approach in minimising its environmental footprint and seeks to operate its businesses in a sustainable way.
In terms of its social obligations, CSG employs over 600 people across its operations in Australia and New Zealand. It monitors the health and well-being of its employees and reports to the Board any serious matters of concern. Under the direction of its People and Culture team, the Company has conducted staff surveys and seeks opportunities to support and assist its employees. An employee assistance program has been established in this regard and provides a means by which employees can obtain confidential and independent advice through access to qualified counsellors on a range of work-related or personal issues.
Principal 8: Remunerate fairly and responsibly8.1 Nomination and Remuneration
CommitteeThe Board’s primary remuneration objectives are to motivate Directors and management to pursue the long-term growth and success of the Company within an appropriate control framework, and to demonstrate a clear relationship between key Executive performance and remuneration. The Board believes that it is in the interest of all stakeholders in the Company for there to be in place a Remuneration Policy that attracts and retains talented and motivated Directors, managers and employees so as to encourage enhanced performance of the Company.
As noted previously, the Board has an established Nomination and Remuneration Committee that:
• consists of a majority of independent Directors;
• is chaired by an independent chair; and
• has three (3) members.
Please refer to the Directors’ Report for membership and attendance details.
The Committee is responsible for the following, amongst other matters:
• nominating, as required, candidates for the Board to consider for Board membership;
• nominating, as required, candidates for the role of CEO and setting criteria for their appointment and termination;
• setting criteria for Board membership, skill requirements and, subject to the Company’s constitution, number of Directors comprising the Board;
• the provision of a Directors’ induction and education programme;
• reviewing and making recommendations to the Board on appropriate remuneration for the Directors, the CEO and the Executive Management Team;
• ensuring that remuneration levels take into account risks involved, demands and time requirements of
CSG 14|15 ANNUAL REPORT 19
For
per
sona
l use
onl
y

each role and relevant industry and related benchmarks;
• developing and recommending to the Board remuneration incentive programs such as bonus schemes and company share schemes; and
• developing, maintaining and monitoring appropriate remuneration policies and procedures.
8.2 Remuneration PolicyDuring the 2015 financial year, the Board reviewed and adopted a revised Remuneration Policy to govern remuneration paid to employees and senior Executives, including Non-Executive Directors.
Remuneration paid to Non-Executive Directors is clearly distinguished from that of Executive Directors and senior management. Please refer to the Remuneration Report for details of remuneration for all Directors and Key Management Personnel.
Whilst it is not mandatory for Non-Executive Directors to hold CSG shares, all current Directors do so and their share holdings are disclosed via the ASX and the Remuneration Report.
8.3 Equity Based RemunerationAs detailed in the Remuneration Policy, the Company believes that equity based remuneration is a critical component in achieving the long term objectives of the Company. To this end, it offers a Long Term Incentive Plan (LTIP) to the CEO and nominated Executives. Details of this LTIP are provided in the Remuneration Report.
In addition, the Company utilises Tax Exempt Share Plans to motivate and encourage performance across the Company generally. Under these plans, eligible employees can be offered the opportunity to apply for an allocation of $1,000 worth of CSG shares, subject to the rules that apply under these plans.
To govern these equity opportunities and holdings, the Company has a Share Trading Policy which stipulates processes to be followed and guides Executives and employees on any equities they hold or wish to hold in the Company. A summary of this policy being:
Share Trading Policy
The Company has adopted a formal Share Trading Policy, which applies to Directors, the Company Secretary, all senior Executives, Key Management Personnel and employees of the Company and their associates (Officers).
An Officer may not deal in any of the Company’s securities at any time if they have inside information.
Subject to this restriction an Officer may trade in securities at any time apart from certain blackout periods. These being:
• in the period between the close of a financial period and the announcement of results for that period;
• in the four (4) week period leading up to the Annual General Meeting; or
• at any other time the Company nominates.
If they do wish to trade, Executives of a senior level must obtain clearance under the policy prior to trading.
Officers must advise the Company Secretary in writing of the details of completed transactions within specified timeframes following each transaction. Under this policy, participants in equity based plans offered by the Company are not permitted to utilise mechanisms to limit the risk associated with that plan.
The Company Secretary must maintain a register of securities transactions.
The Company must comply with its obligations to notify ASX in writing of any changes in the holdings of securities or interest in securities of the Company by Directors.
CORPORATE GOVERNANCE STATEMENT
20
For
per
sona
l use
onl
y
INVESTOR RELATIONS
CSG 14|15 ANNUAL REPORT 21
Investor Relations
ASX ListingCSG Limited is listed on the Australian Securities Exchange (ASX). Find us on the ASX website (asx.com.au) under the trading code “CSV”. Our share price is available on that web site and is also available in major Australian metropolitan newspapers.
Shareholder CommunicationsWe are committed to delivering a high level of service to all shareholders. As a listed entity, we release information via the ASX and also communicate to shareholders via a variety of means, including our website, an Annual Report, dividend statements, notices of meetings and other advices. Details of our website and how you can contact us by email are:
Email: [email protected]
Annual General MeetingsWe hold an Annual General Meeting where shareholders are able to attend and vote on a range of matters including Non-Executive Director elections, the Remuneration Report and any other business included in the Notice of Meeting. These meetings also provide shareholders with the opportunity to meet the Board and key members of the Executive Management Team.
Our next Annual General Meeting is currently scheduled to be held on Thursday, 19 November 2015 at 1:00pm (AEDT) at the Sheraton Melbourne Hotel, Level 2, 27 Little Collins Street, Melbourne, Victoria 3000.
Share RegistryIf you have queries relating to your security holding or wish to update your personal or payment details, please contact the Share Registry.
CSG LimitedC/- Computershare Investor Services Pty LimitedGPO Box 2975Melbourne VIC 3001
Phone: +61 1300 850 505Fax: +61 3 9473 2500www.computershare.com
Key DatesOur current key dates are:
Annual General Meeting Thursday, 19 November 2015
1HY16 Results Monday, 15 February 2016*
FY16 Results Monday, 15 August 2016*
*These dates are subject to change without notice.
For
per
sona
l use
onl
y

The Directors present their report together with the financial report of the consolidated entity consisting of CSG Limited (CSG or the Company) and its subsidiaries (CSG Group), for the financial year ended 30 June 2015 and Auditor’s report thereon. This financial report has been prepared in accordance with Australian Accounting Standards.
1. DirectorsThe qualifications, experience and special responsibilities of each person who has been a Director of the Company at any time during or since the end of the financial year is provided on pages 22 and 23 of this Annual Report. The details of the Company Secretary as at the year end is provided below.
Mr. Thomas Cowan
Non-Executive Chairman Member, Audit Committee Member, Nomination and Remuneration Committee
Tom Cowan is a partner of TDM Asset Management, a Sydney based private investment firm. TDM Asset Management invests in public and private companies globally. Mr. Cowan has over 15 years of financial markets experience, including roles in corporate finance and investment banking at Investec Wentworth and KPMG Australia. He has a Bachelor of Commerce (Honours – Class 1) from the University of Sydney.
Mr. Cowan is currently a Non-Executive Director of Baby Bunting Group Limited.
Appointed 8 February 2012 Appointed Chairman 15 August 2012
Ms. Julie-Ann Kerin
Managing Director
Since Julie-Ann Kerin was appointed as Chief Executive Officer and Managing Director of CSG in 2012, she has established a proven track record of delivering strong growth and significant return to shareholders.
Under Ms. Kerin’s leadership, CSG successfully completed the transaction of the sale of the former Technology Solutions Division to NEC Australia in 2012 for $227.5 million and subsequently returned $130 million to shareholders over the following three years.
Prior to Ms. Kerin’s appointment as CEO, she was the Group General Manager of the former Technology Solutions Division for five years, and achieved
revenue growth from $9m to $183m.
She has more than 20 years’ experience as a senior executive managing both private and public companies across the information technology sector. Prior to joining CSG, Ms. Kerin was responsible for the global management of operations and staff across Asia, the United States, Australia and Europe for a number of organisations. She has also held roles with IT companies Actuate, Haht Commerce, Genasys Inc and Computer Power.
Ms. Kerin is a member of the Australian Institute of Company Directors.
Appointed 1 February 2012
Mr. Ian Kew
Non-Executive Director Chairman, Audit Committee Member, Nomination and Remuneration Committee
Ian Kew is the Chief Executive Officer for Airport Development Group Pty Ltd which has interests in Darwin International, Alice Springs and Tennant Creek Airports. He graduated with an Economics Degree from Monash University and joined Exxon for two years before being employed with Shell Australia for twenty years prior to joining Northern Territory Airports in 2001.
At Shell Australia, Mr. Kew worked in a variety of oil marketing, operations, change management, strategy and special project positions in Hobart, Sydney, Brisbane, Darwin and Melbourne. Previously, he was on the Board of the Automobile Association of the Northern Territory (AANT), was Chair of the Darwin Symphony Orchestra and the Charles Darwin University Foundation. He is also a Director of the Australian Airports Association (AAA) and on the Board of the Museum and Art Gallery of the Northern Territory (MAGNT).
Mr. Kew is a National Councilor of Creative Partnerships Australia and a Fellow of the Australian Institute of Company Directors.
Appointed 1 March 2007 Ceased 20 November 2014
Mr. Philip Bullock
Non-Executive Director Chairman, Nomination and Remuneration Committee Member, Audit Committee
Appointed a Director of CSG in August 2009, Mr. Bullock was formerly Vice President, Systems and Technology Group, IBM Asia Pacific, Shanghai, China.
Prior to that position he was Managing Director of IBM Australia and New Zealand. His IBM career spanned almost 30 years in the Asia Pacific region.
Mr. Bullock is a Non-Executive Director of Perpetual Limited and Hills Limited, and was previously a Non-Executive Director of Healthscope Limited. Over the years he has served on a number of Federal Government bodies, most notably as the Chair of Skills Australia.
Appointed 1 August 2009
Ms. Robin Low
Non-Executive Director Chairman, Audit Committee
Robin Low was formerly a partner at PricewaterhouseCoopers for over 17 years and has extensive experience in assurance and risk management, particularly in the financial services area.
She is currently a Non-Executive Director of Austbrokers Holdings Limited, IPH Limited and Appen Limited. Ms. Low is also a member of the Audit and Assurance Standards Board and on the board of a number of not-for-profit organisations including Sydney Medical School Foundation, Public Education Foundation and Primary Ethics.
Ms. Low has a Bachelor of Commerce from The University of New South Wales, is a Fellow of the Institute of Chartered Accountants in Australia and is a Graduate Member of the Australian Institute of Company Directors.
Appointed 20 August 2014
Mr. Mark Phillips
Non-Executive Director Member, Audit Committee
Mark Phillips has substantial experience in banking and asset leasing. Mr. Phillips worked at the Commonwealth Bank of Australia for 20 years in various roles involving asset finance, securities and trading markets, property lending and government finance.
Mr. Phillips was formerly Managing Director of Record Investments Limited (Record) and Keybridge Capital Ltd. While Managing Director at Record, the market capitalisation grew from approximately $100 million to over $1.5 billion.
Mr. Phillips is currently a Non-Executive Director of General Reinsurance Australia Limited and General Reinsurance Life Australia Limited (a Berkshire Hathaway company) and a Non-Executive Director of Cancer Council (NSW).
DIRECTORS’ REPORT
22
For
per
sona
l use
onl
y

Mr. Phillips was formerly a Non-Executive Director of Interlink Roads Ltd and ASB Bank Limited in New Zealand.
Mr. Phillips has a Bachelor of Commerce and a Masters of Commerce from the University of New South Wales and is a Fellow of the Australian Institute of Company Directors.
Appointed 20 August 2014
Mr. Stephen Anstice
Non-Executive Director Member, Nomination and Remuneration Committee
Stephen Anstice has over 20 years’ experience in the communications industry. Until June 2013, Mr. Anstice was CEO of IPMG Pty Ltd (IPMG), a print, digital and marketing communications business. Mr. Anstice also has an extensive background in investment banking. He is currently a Non-Executive Director of IPMG, Audant Investments Limited and The Song Company Limited.
Mr. Anstice has a Bachelor of Arts (Economics) from Macquarie University and a Graduate Diploma from the Securities Institute of Australia.
Appointed 20 August 2014
Board MeetingAudit
Committee
Nomination & Remuneration
Committee
Director Name Mee
tings
H
eld
(i)
Mee
tings
At
tend
ed
Mee
tings
H
eld
(i)
Mee
tings
At
tend
ed
Mee
tings
H
eld
(i)
Mee
tings
At
tend
ed
Current
Mr. Thomas Cowan 13 13 6 6 4 4
Mr. Philip Bullock 13 12 6 6 4 4
Mr. Mark Phillips 11 11 4 4 - -
Mr. Stephen Anstice 11 11 - - 3 3
Ms. Robin Low 11 10 4 4 - -
Ms. Julie-Ann Kerin 13 13 6 6(ii) 4 4(ii)
Former Mr. Ian Kew 6 5 3 3 1 1
(i) Number of meetings held during the time the Director held office or was a member of the relevant committee during the financial year.
(ii) Ms. Julie-Ann Kerin attended by invitation.In addition to the above meetings, the Directors’ held three (3) meetings by circular resolution. In addition to the above meetings, a committee of the Board comprising of Mr. Thomas Cowan, Ms. Robin Low and Ms. Julie-Ann Kerin met on one (1) occasion for the purposes of approving the Half Year Financial Statements.
3. Directors’ MeetingsThe number of Directors’ meetings (including meetings of Committees of Directors) and number of meetings attended by each of the Directors of the Company during the financial year are:
2. Company SecretaryChristopher Lobb
Company Secretary
Chris Lobb has an extensive background in company secretariat, corporate governance and corporate restructuring for both private and ASX listed public groups. Mr. Lobb joined CSG in December 2014, having previously held company secretarial positions in the agriculture and property sectors. He has also held Non-Executive Directorships in the not for profit and TAFE sectors.
Mr. Lobb is a Fellow of the Governance Institute of Australia, a Member of the Australian Institute of Company Directors and a CPA. He holds a Bachelor of Business (Accounting) from Swinburne University of Technology.
Appointed 19 December 2014
CSG 14|15 ANNUAL REPORT 23
For
per
sona
l use
onl
y
4. Principal ActivitiesThe principal activities of the CSG Group during the financial year were print and business technology solutions in Australia and New Zealand supported by in-house equipment financing.
There have been no significant changes in the nature of the activities of the CSG Group during the financial year.
5. Operating and Financial Review1. Operations overview
CSG is a leading Technology as a Service provider in Australia and New Zealand, supported by an in house equipment financing business.
CSG is the largest non-manufacturer of print and business technology solutions in the Australia and New Zealand marketplace, and has a national sales and service footprint in both countries. CSG services more than 20,000 customers ranging from small-to-medium enterprises, through to large corporate, government and commercial clients. CSG has developed a unique product suite to deliver a single source technology solution to all its customers - regardless of size.
In the Australian market, CSG works closely with a number of major business partners, including Canon, Samsung, Lexmark, HP, 8x8.com and FaceMe, to deliver a brand agnostic end-to-end product and service offering which is unique in the Australian marketplace. In the New Zealand market, CSG operates under the Konica Minolta brand and is one of the largest suppliers of print and technology sales and services to the corporate, government and commercial markets.
A key differentiator for CSG in the region is the breadth and quality of service it provides its customers. Premium service combined with efficient financing and high quality technical advice is paramount to the CSG value proposition. As the only listed company
of size and scale that can provide sales, service and support access in Australia and New Zealand, CSG truly differentiates itself from the manufacturers, office supply and technology retailers, integrators, equipment finance providers and independent dealers with whom it competes.
CSG currently employs approximately 650 staff across Australia and New Zealand with offices in 30 locations. CSG has a commitment to diversity and recognizing and rewarding its staff. CSG strives to achieve above industry standard benchmarks for workforce productivity whilst delivering the highest level of staff satisfaction.
2. Review of Group Operations
CSG expanded its product and service offering in FY2015 to better meet the needs of its customers. Increasing reliance on technology has resulted in SME’s and larger organisations alike to look for technology providers capable of delivering a single point of contact for their entire office technology requirement. CSG’s full-spectrum product offering delivers this, and gives a clear value proposition to its broad customer base. CSG creates genuine value for its customers by providing a one stop total business solutions offering, saving the customer their most valued assets: time and money.
Key operational achievements for CSG in FY2015 included:
• Launched the first of our Technology as a Service offerings – Boardroom as a Service
• Established relationships with key partners, such as 8x8 in preparation for the launch of other “as a Service” offerings
• Executed an agreement with HP to launch the CSG Cloud Marketplace to support the delivery of our Technology as a Service offering
• Three (3) major contract signings in Enterprise Solutions for Print as a Service
• Non-print sales represented more than 8.5% of equipment sales revenue in Australia
• Achieved in the field Net Promoter Score2 (NPS) score of 58
• Creation of CSG ‘Customer Hub’ built on the Salesforce.com
platform to deliver one common IT platform across the business and one common set of processes
• Recruited key personnel to ensure successful delivery of Technology as a Service platform
3. Review of Group Financial Performance1
The Board was pleased that the business again achieved solid growth in underlying EBITDA during the 2015 financial year. During the year, CSG delivered on a number of key initiatives that have now positioned CSG for continued top line growth, as well as improved profitability over the medium term.
CSG achieved revenue growth of 13% and Reported EBITDA growth of 20% in FY2015. The CSG Group saw growth across all three divisions, both in Australia and in New Zealand.
Key highlights from the results include:
• total revenue increased by 13% to $224.3m;
• underlying EBITDA increased by 15% to $33.5m;
• reported NPAT increased by 19% to $14.3m;
• underlying NPAT before customer contract amortisation increased by 12% to $21.3m; and
• solid conversion of underlying EBITDA to operating cash flow excluding the investment in lease receivables and non-recurring items.
Operating Performance
The Board measures the performance of the business using Underlying EBITDA after taking into account all non–recurring or one off items. This is an unaudited measure which is reconciled to the audited Net Profit After Tax (NPAT) in the table overleaf.
a. Revenue
Group revenue grew by 13% to $224.3m during FY2015. This was driven by:
• revenue from sale of goods increasing 24% to $103.6m;
• Finance Solutions revenue growth of 24% driven by growth of Lease Receivables to $210.0m; and
• solid new customer sales growth in Australia and New Zealand. New customers were 14% of equipment in Australia compared to 16% in 2014. In New Zealand, there was 31% growth in new customer sales during the year.
1 Figures contained in the “Review of Group Financial Performance” are unaudited.2 Net promoter score is a method of measuring customers’ loyalty. To calculate NPS, customers are categorised
as "Promoters", "Passives" or "Detractors" based on how likely they would be to recommend CSG to a friend or colleague. The percentage of Detractors is then subtracted from the percentage of Promoters.
DIRECTORS’ REPORT
24
For
per
sona
l use
onl
y

b. Expenses
Management has sustained tight controls over expenditures to deliver a slight increase in Underlying EBITDA margin from 14.6% to 14.9%. Key drivers of this improvement were:
• total expenses grew by 11% year on year compared to a 13% increase in revenue;
• cost of goods sold expenses increased by 8% year on year whilst revenues from sales of goods and services increased by 11%;
• non-COGS related costs (excluding share based payments) increased by 11% year on year compared to 13% growth in Group revenue; and
• borrowing costs on the Finance Solutions continues to benefit from the low interest rate environment in delivering 50% gross margin.
4. Review of Group Financial Position
A closing cash balance of $24.8m, after dividend distributions of $25.3m made during the year. Included in closing cash balance is an amount of $13.9m held in restricted cash accounts under the terms of the CSG Finance Solutions debt facilities (refer note 6).
Cash conversion has improved in FY2015 after excluding the impact of investment in the Lease Receivables and non-recurring items.
Lease receivables in the Finance Solutions business has grown to $210.0m ($161.5m in FY2014) with 89% funded by associated debt (86% in FY2014). The majority of this growth has been due to the continued expansion of the Australian operations.
Debt associated with lease receivables has improved the advance rate from 86% to 89% due to a revision to the banking facilities.
Total capital returned to Shareholders including the current final dividend is now $134m in the three years since the commencement of the Restructuring Plan in July 2012.
5. Divisional Review
a. Business Solutions
CSG Business Solutions provides the sales, support, service and financing of print and business technology equipment to more than 20,000 SME customers across Australia and New Zealand. CSG’s scale, national presence and significant brand partnerships gives it the flexibility to service businesses of any size, and in any location across Australia and New Zealand.
SME’s have traditionally relied on up to 15 separate suppliers for a variety of business and print equipment requirements, each with separate billing, leasing and service relationships.
In FY2015, CSG made significant progress in positioning itself as a single provider for all SME business technology needs. CSG Business Solutions can now deliver significant time savings and improved cash flow management to customers through the provision of centralised ordering for all business technology through a single billing system and finance relationship. This offering is currently unique to the market in Australia and New Zealand. The CSG ‘Technology as a Service’ product suite is currently comprised of the following offerings:
• ‘Print as a Service’
• ‘Board room as a service’
• ‘Communication as a Service’
• ‘Desktop as a Service’
CSG customers will be able to subscribe to technology services and manage their IT on a single platform through the CSG customer market place. This marketplace will provide self service access for customers to browse, request and approve new CSG services (conferencing, communications, business applications, data management) and technology equipment (desktop, laptop, tablets, boardroom display).
The CSG customer marketplace will provide a number of significant benefits to CSG Business Solutions customers:
• replace multiple vendors with one invoice;
• predictable monthly subscription payments;
• no large capital outlay – equipment fully financed by CSG;
• proven best of breed technology;
• easily scalable in line with customers’ needs; and
• single point of technical support (Level 1 / 2).
It is anticipated that earnings growth will be driven in FY2016 by a number of key initiatives, including:
• focused effort on the sale of the expanded product and service offerings to existing customers hence a greater share of the customer IT spend will be directed to CSG;
• growth in print market share by using the other technology products to penetrate print vendors customer base;
• increase sales leads by improving online presence and repositioning CSG Business Solutions as a full service IT organization;
FY15 $m
Revenue from continuing operations 224.3
NPAT 14.3
Add Tax 8.3
Add Depreciation and Amortisation
4.5
Add Interest expense/(income)
1.4
EBITDA 28.5
Add Non-recurring items
1. LTIP/Employee Share Plan 4.0
2. Deferred consideration & legal
0.3
3. Stamp Duty on Acquisition
0.3
4. Transaction advisory costs
0.4
Total 5.0
Underlying EBITDA 33.5
1H14 2H14 FY14 1H15 2H15 FY15
EBITDA (underlying) 13.4 15.7 29.1 15.4 18.1 33.5
Operating cash flow (reported)
(21.1) (11.8) (32.9) (19.1) (0.2) (19.3)
+ tax paid 3.7 2.8 6.5 3.0 1.8 4.8
+ net interest paid 0.3 0.6 0.9 0.6 0.9 1.5
+ non-recurring cash items 1.3 1.3 2.6 0.2 1.0 1.2
+ change in lease receivables 23.2 22.8 46.0 27.1 14.7 41.8
Ungeared pre-tax cash flow 7.4 15.7 23.1 11.8 18.2 30.0
Profit to cash conversion 55% 100% 79% 77% 102% 90%
CSG 14|15 ANNUAL REPORT 25
For
per
sona
l use
onl
y

• further evolution of the new internal use IT platform to support improved customer service, increased productivity in service and operations and focused targeting for potential and existing customers; and
• leveraging the relationship and high quality profile and reputation of world class business partners like HP, 8x8, Samsung, Canon and Konica Minolta.
b. Enterprise Solutions
CSG Enterprise Solutions provides managed service based print and technology solutions for Enterprise, education and government customers in Australia and New Zealand. In Australia, CSG is the only national, brand agnostic provider of print solutions in the market, and in New Zealand the Group operates a well-established and market leading business under the Konica Minolta brand. Following the sale of the Technology Solutions business to NEC in July 2012, the Enterprise Solutions business has been restrained from competing in the IT managed services sector. That restraint ended on 3 July 2015 and the Enterprise Solutions business is now preparing to reenter the IT managed services sector focusing on Tier 2 Enterprise, government and education.
The same product suite that will be the platform for the delivery of ‘Technology as a Service’ in the Business Solutions business will scale to deliver a robust and scalable platform to deliver enterprise IT managed services. The focus of FY16 in the Enterprise Solutions business will be to continue to grow the Managed Print Services business whilst also growing the pipeline for next generation IT managed services.
During FY2015, Management successfully leveraged a number of competitive advantages to grow the division in Australia and New Zealand. These include:
• being the only print and business technology provider with a national service and sales team in Australia and New Zealand;
• providing a level of assurance to government customers by being ASX listed and therefore compliant to ASX reporting and regulatory standards;
• leveraging the expertise of an internal financing capability to develop innovative and flexible solutions for Enterprise customers;
• possessing the ability to sell, install,
service and repair all major multi-function device brands in Australia, and leverage Konica Minolta’s strong support and presence in the New Zealand market; and
• having the scale to be able to service customers of all sizes.
Enterprise Solutions made good progress in FY2015 signing managed print contracts with University of Sydney, Victoria University and a mid-sized enterprise business. The total contract value of these deals exceeded $40m over 5 years. CSG was also chosen for the Queensland Whole of Government ‘Print and Imaging as a service’ panel.
Growth opportunities exist in both markets, with a strong pipeline in place to expand market share in Australia, and build on the existing large enterprise business currently in place in New Zealand. The customer acquisition strategy for Enterprise Solutions includes:
• partnering with Tier One integrators to provide services in consortiums for major Enterprise or government customers;
• expand existing customer relationships to provide IT managed services particularly focusing in the tertiary education and Tier 2 Enterprise sector; and
• leveraging growth from government panels.
c. Finance Solutions
CSG Finance Solutions is a specialist service provider of lease and rental products for print and business technology assets sold and serviced by CSG in both Australia and New Zealand.
In New Zealand, CSG’s finance business is an established, well managed business with strong performance, driven by bad debts of less than 0.5% and a strong return on equity of 47% for the last half.
The Australian finance business, launched in March 2013, has seen a rapid sales uptake. The book is driven by 95% conversion of customers, which includes government, corporate and commercial businesses across Australia. Overall, Leasing Receivables grew 30% to $210m in FY2015, with revenue up 24% to $23.6m.
CSG Finance is a critical element in enabling the Business Solutions business to be able to deliver bundled ‘Technology as a Service’ offerings and also to be able to finance the equipment
component of large annuity enterprise contracts. Growth targets for this division include:
• continuing to support the current print business in both the existing customer and the targeting of new customers;
• increasing penetration into Enterprise Solutions customer base; and
• supporting the growth of the ‘Technology as a Service’ product suite.
6. Market sizing
The current market size for sales and service of multifunction devices in Australia and New Zealand is estimated at $2.5 billion1. CSG currently captures 8% of that market in Australia and New Zealand. The business-to-business technology products and service market is much larger at $12 billion.
Management believe that, given the size of these markets, CSG is well positioned to capitalise on its growth strategies to establish itself as the market leading, end-to-end business technology provider.
92%
CSG
Rest of market
8%
A$2.5 billion multifunction device market across Australia and NZ.
1. Sources: IBISWorld Industry Report Computer and Software Retailing in Australia; Constella-tion Research Unified Communication Trends; Forrester Software-as-a-service in ANZ; IBISWorld Industry Report Stationary Goods Retailing; IDC
DIRECTORS’ REPORT
26
For
per
sona
l use
onl
y

Dealer sales
Direct sales
Distributor sales
35%
3%
62%
A$12 billion business-to-business technology products and services market.
Stationery
Software as a Service
Unified communications technology
Computers and software
$7.56b
$1.78b
$1.58b
$1.10b
7. Risk Management
Corporate GovernanceThe Board of CSG Limited believes that a strong corporate governance framework helps to underpin a strong company. CSG’s corporate governance policies and practices are set out in the Corporate Governance Statement.
Principal Risk Area – Innovation Inability to optimise full value of innovation opportunities in services, products, processes and commercial solutions to support growth opportunities.
Risk Management Approach CSG has a proactive growth strategy that combines leadership, partnerships and continual review.
Principal Risk Area – Foreign ExchangeRevenue from non-Australian operations is denominated primarily in New Zealand Dollars (NZD) and equipment purchases for New Zealand operations are primarily in US Dollars (USD). Fluctuations in foreign currency exchange rates may result in corresponding movements in revenues and earnings.
Risk Management Approach Currency risk is hedged in accordance with treasury risk policy. The treasury risk policy aims to manage the impact of short-term fluctuations in CSG’s earnings. Derivative financial instruments (forward exchange contracts) and options are used to hedge exposure to fluctuations in
foreign exchange rates. Over the longer term, permanent changes in market rates will have an impact on earnings.
Principal Risk Area – Interest Rate The CSG Group has both corporate and operational debt facilities. Movements in interest rates could have an adverse impact on cash flows and operating results.
Risk Management Approach To minimise interest rate risk between the fixed rate assets and variable rate liabilities, Management uses interest rate swaps to broadly match fixed rate assets to floating rate liabilities.
Principal Risk Area – Availability of Debt CSG’s finance divisions in Australia and New Zealand provide rental and lease products. These businesses are sensitive to credit cost and availability as well as market liquidity. Should there be any disruptions in the credit markets or changes in the procurement of credit there could be a reduction in the availability of credit or an increase in the cost of sources of funding.
Risk Management Approach Credit indicators and market conditions are monitored on a regular basis by management. CSG has also recently completed the refinancing of the majority of facilities to diversify sources of financing to mitigate this risk. External expert advice is also sought to keep abreast of market developments.
Principal Risk Area – Key Suppliers CSG’s key suppliers are Canon Australia
and Konica Minolta Inc. who supply the majority of inventory. It is critical to maintain relationships.
Risk Management Approach These are long standing relationships managed by CSG’s Executive Team and the Board through long term contracts under commercial terms.
Principal Risk Area – Key Personnel CSG’s continued success is highly dependent upon the efforts of the Executive Team and other key employees including sales professionals. The retention of these skilled personnel is critical.
Risk Management Approach CSG has introduced a Long Term Incentive Plan for Executive personnel and other key management, including the key sales team, and a share based plan for all other employees across Australia and New Zealand.
Principal Risk Area –Competition The Company’s business is susceptible to competition in the markets in which the Company operates. Additionally, competitive pricing strategies and demands from high value clients seeking preferred supplier agreements, may impact on the Company’s profit margins and profit share.
Risk Management Approach The risk is mitigated by a large diversified client base with multi-year agreements in place reducing the impact of pricing strategies and demands from any one customer.
CSG 14|15 ANNUAL REPORT 27
For
per
sona
l use
onl
y

Dear Shareholder
On behalf of your Board, I am pleased to present CSG’s 2015 Remuneration Report which sets out remuneration information for the Chief Executive Officer (CEO), the Group Executive, Non-Executive Directors and the broader employee group.
The Board recognises that the performance of CSG depends on the quality and motivation of its people, including both the Group Executives and the approximate 650 employees across Australia and New Zealand. CSG’s remuneration strategy seeks to appropriately reward, incentivise and retain key employees.
At the November 2012 Annual General Meeting, the shareholders approved a three stage multi-year Long Term Incentive Plan (LTIP) for our key Executives with hurdles based upon growth in the share price, with vesting to occur on the second, third and fourth anniversary of the offer date. Given the continued strong performance of the Company, we were pleased to advise that these Executives
exceeded the hurdles for Stage 1 (which vested on 30/11/14) and are well on the way to exceeding the hurdles for Stages 2 and 3 which vest on 30/11/15 and 30/11/16 respectively. Since the inception of this Executive LTIP, shareholders have seen strong Total Shareholder Returns as outlined in Section 10.1.
At the same time, the Board introduced a Staff Incentive Share Plan for all employees, which offered eligible employees in Australia and New Zealand, AUD $1,000 worth of CSG shares on a tax free basis. These shares have been subsequently issued annually (subject to the satisfactory performance of the Company and Board approval). To date, we have issued approximately 875,000 shares to our employees and have approved a further issue in FY2016 in accordance with the Staff Incentive Share Plan rules. We are pleased to report that over 90% of CSG eligible employees participate in this plan.
At this time, we are designing the next multi-year LTIP for our key Executives and it is our intention to bring this to the 2015 Annual
General Meeting later in the year for shareholder approval.
The Board also notes that FY2015 has been another strong year for CSG, both in terms of revenue and profit growth. As a result, we are pleased to confirm that our executives achieved a high percentage of their Short Term Incentive payments as outlined in the Report in recognition of their latest achievements.
Thank you for taking the time to review the 2015 Remuneration Report. The Board is confident that CSG’s remuneration practices are well designed to help best drive outstanding employee and Executive performance. It is this performance that is required to execute our business strategy and create sustainable shareholder value.
Mr. Philip Bullock
DIRECTORS’ REPORT
6. Remuneration Report
28
For
per
sona
l use
onl
y

This report covers the Key Management Personnel (KMP) of CSG. KMP are employees with authority and responsibility for planning, directing and controlling the activities of large business units that can materially affect the performance of the CSG Group. As such the KMP for the year ending 30 June 2015 are:
• all persons who have held the position of Director of CSG Limited during the financial year;
• Julie-Ann Kerin, CEO/Managing Director;
• Neil Lynch, Chief Financial Officer (CFO);
• Duncan Powell, Chief Operating Officer (departed 3 July 2014);
• Declan Ramsay, Executive General Manager, Business Solutions Australia;
• Warick Beban, Executive General Manager, Business Solutions New Zealand; and
• Stephen Birrell, Executive General Manager, Enterprise Solutions.
7. Remuneration Governance
The policy for determining the nature and amount of remuneration of Directors and Group Executives is agreed by the Board. The Board has established
a Nomination and Remuneration Committee (N&R Committee), which is responsible for the following:
• reviewing and recommending to the Board the appropriate remuneration of the CEO, members of the Group Executive and Non-Executive Directors;
• ensuring that remuneration levels take into account risks involved, demands and time requirements of each role and relevant industry and related benchmarks;
• developing and recommending to the Board remuneration incentive programs such as bonus schemes and group share schemes;
• developing, maintaining and monitoring appropriate remuneration policies and procedures;
• ensuring that the structure of Non-Executive and Executive Directors’ remuneration is clearly distinguished;
• ensuring that equity based Group Executive remuneration is paid in accordance with thresholds set out in plans as disclosed or approved by shareholders; and
• reviewing and approving appropriate disclosures to be included in the Company’s Annual Report regarding the N&R Committee, its activities and performance.
The Board obtains professional advice where necessary to ensure that the Company attracts and retains talented and motivated employees and Non-Executive Directors who can enhance company performance through their contributions and leadership.
8. Remuneration Objectives, Policy and PracticeThe Board, with assistance from the N&R Committee, is ultimately responsible for ensuring that CSG’s Remuneration Policy is consistent with the business strategy and performance, supporting increased shareholder wealth over the long term.
The objective of the Remuneration Policy is to ensure the reward for performance is competitive and appropriate for the results delivered.
The Remuneration Policy details a framework for remuneration to be paid across the Company, from employees to Group Executives, including Non-Executive Directors, which includes a mix of fixed and variable remuneration, and short-term and long-term performance based indicators.
Fixed remuneration
• Fixed remuneration is determined according to industry standards, relevant laws and regulations, labour market conditions and the profitability of the CSG business. It consists of base remuneration and superannuation. Base remuneration includes cash salary and any salary sacrifice items (e.g. motor vehicles).
• CSG provides employer superannuation contributions at Government legislated rates (2015: 9.5% in Australia and 3% in New Zealand), capped at the relevant concessional contribution limit unless part of a salary sacrifice election by the employee.
• The Board determines an appropriate level of fixed remuneration for the CEO and Group Executives, with recommendations from the N&R Committee.
• Fixed remuneration is reviewed annually and adjusted where appropriate.
LTI
STI
BASE SALARY
ACHIEVEMENT OF A SHARE PRICE HURDLE
CORPORATE SCORECARD(CEO & CFO 100%)
(Financial - 60% & Non-Financial - 40%)
Below is a summary of the remuneration mix for a Group Executive , which includes Base Salary, Short-Term Incentives (STI) and Long-Term Incentives (LTI) as currently on issue:
Remuneration Mix
Below is a summary of the remuneration mix for the CEO and CFO, which includes Base Salary, Short-Term Incentives (STI) and Long-Term Incentives (LTI) as currently on issue:
LTI
STI
BASE SALARY
ACHIEVEMENT OF A SHARE PRICE HURDLE
50% DIVISIONAL SCORECARD(Financial & Non-Financial)
50% CORPORATE SCORECARD(Financial - 60% & Non-Financial - 40%)
CSG 14|15 ANNUAL REPORT 29
For
per
sona
l use
onl
y
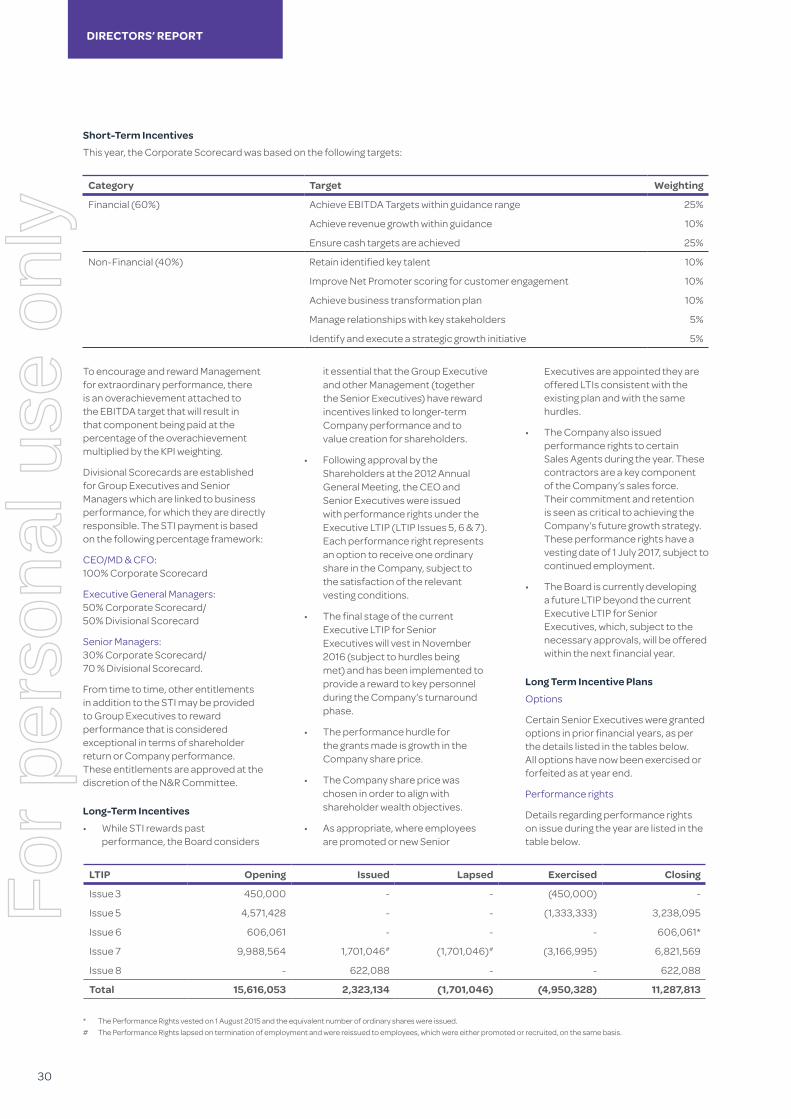
Short-Term IncentivesThis year, the Corporate Scorecard was based on the following targets:
Category Target Weighting
Financial (60%) Achieve EBITDA Targets within guidance range 25%
Achieve revenue growth within guidance 10%
Ensure cash targets are achieved 25%
Non-Financial (40%) Retain identified key talent 10%
Improve Net Promoter scoring for customer engagement 10%
Achieve business transformation plan 10%
Manage relationships with key stakeholders 5%
Identify and execute a strategic growth initiative 5%
To encourage and reward Management for extraordinary performance, there is an overachievement attached to the EBITDA target that will result in that component being paid at the percentage of the overachievement multiplied by the KPI weighting.
Divisional Scorecards are established for Group Executives and Senior Managers which are linked to business performance, for which they are directly responsible. The STI payment is based on the following percentage framework:
CEO/MD & CFO: 100% Corporate Scorecard
Executive General Managers: 50% Corporate Scorecard/ 50% Divisional Scorecard
Senior Managers: 30% Corporate Scorecard/ 70 % Divisional Scorecard.
From time to time, other entitlements in addition to the STI may be provided to Group Executives to reward performance that is considered exceptional in terms of shareholder return or Company performance. These entitlements are approved at the discretion of the N&R Committee.
Long-Term Incentives • While STI rewards past
performance, the Board considers
it essential that the Group Executive and other Management (together the Senior Executives) have reward incentives linked to longer-term Company performance and to value creation for shareholders.
• Following approval by the Shareholders at the 2012 Annual General Meeting, the CEO and Senior Executives were issued with performance rights under the Executive LTIP (LTIP Issues 5, 6 & 7). Each performance right represents an option to receive one ordinary share in the Company, subject to the satisfaction of the relevant vesting conditions.
• The final stage of the current Executive LTIP for Senior Executives will vest in November 2016 (subject to hurdles being met) and has been implemented to provide a reward to key personnel during the Company’s turnaround phase.
• The performance hurdle for the grants made is growth in the Company share price.
• The Company share price was chosen in order to align with shareholder wealth objectives.
• As appropriate, where employees are promoted or new Senior
Executives are appointed they are offered LTIs consistent with the existing plan and with the same hurdles.
• The Company also issued performance rights to certain Sales Agents during the year. These contractors are a key component of the Company’s sales force. Their commitment and retention is seen as critical to achieving the Company’s future growth strategy. These performance rights have a vesting date of 1 July 2017, subject to continued employment.
• The Board is currently developing a future LTIP beyond the current Executive LTIP for Senior Executives, which, subject to the necessary approvals, will be offered within the next financial year.
Long Term Incentive PlansOptions
Certain Senior Executives were granted options in prior financial years, as per the details listed in the tables below. All options have now been exercised or forfeited as at year end.
Performance rights
Details regarding performance rights on issue during the year are listed in the table below.
LTIP Opening Issued Lapsed Exercised Closing
Issue 3 450,000 - - (450,000) -
Issue 5 4,571,428 - - (1,333,333) 3,238,095
Issue 6 606,061 - - - 606,061*
Issue 7 9,988,564 1,701,046# (1,701,046)# (3,166,995) 6,821,569
Issue 8 - 622,088 - - 622,088
Total 15,616,053 2,323,134 (1,701,046) (4,950,328) 11,287,813
* The Performance Rights vested on 1 August 2015 and the equivalent number of ordinary shares were issued.# The Performance Rights lapsed on termination of employment and were reissued to employees, which were either promoted or recruited, on the same basis.
DIRECTORS’ REPORT
30
For
per
sona
l use
onl
y

Plan Detail
LTIP 3 The former CFO was granted options in the 2012 financial year under LTIP 3 to support the business during an on-market takeover bid that was made after he had submitted his resignation to ensure that he supported the Company during this period. The terms of the grant were:
• issued on 15 September 2011, vesting equally over two years;• there were no performance conditions attached to these options and the participant did not need to be
employed by the CSG Group; and• LTIP 3 had an exercise price of $0.71 (which was reduced due to the latest capital return).
The remaining options under LTIP 3 were exercised progressively on 27 July 2014, 7 August 2014 and 14 August 2014. There are no further options under this plan.
LTIP 5 The CEO was granted performance rights in the 2013 financial year under LTIP 5. The terms of the grant were:
Share Price (i) TSR CAGR Vesting Date Expiry Date
LTI Stage 1 >$0.75 31.5% 30/11/14 30/11/15
LTI Stage 2 >$1.05 33.6% 30/11/15 30/11/16
LTI Stage 3 >$1.50 35.4% 30/11/16 30/11/17(i) Share price means the volume weighted average price of the Company’s ordinary shares on the ASX for a period
of 4 weeks plus any cash dividends paid or capital return from February 2013 onwards minus $0.13.
The structure of the LTIP was formulated in early 2012 upon appointment of the CEO, and was subsequently approved by the shareholders at the Annual General Meeting in November 2012. The Performance Rights have 2, 3 and 4 year vesting periods with vesting dates on the third and fourth anniversaries of the approval date remaining. LTIP 5 has a zero exercise price.
LTIP 6 The CEO was granted performance rights in the 2013 financial year under LTIP 6 as part of a retention arrangement following the sale of the Technology Solutions business. The terms of the grant were:
• issued on 28 June 2013 and the rights vest on 1 August 2015;• the participant must be employed by the CSG Group throughout the retention period; • the expiry date for exercise of vested rights is 1 December 2015; and • LTIP 6 has a zero exercise price.
These performance rights vested on 1 August 2015 and the CEO was subsequently issued with 606,061 ordinary shares on 4 August 2015.
LTIP 7 Certain Group Executives and Senior Managers were granted performance rights in the 2013 financial year under LTIP 7. The terms of the grant were:
Share Price (i) TSR CAGR Vesting Date Expiry Date
LTI Stage 1 >$0.75 31.5% 30/11/14 30/11/15
LTI Stage 2 >$1.05 33.6% 30/11/15 30/11/16
LTI Stage 3 >$1.50 35.4% 30/11/16 30/11/17
(i) Share price means the volume weighted average price of the Company’s ordinary shares on the ASX for a period of 4 weeks plus any cash dividends paid or capital return from February 2013 onwards minus $0.13.
The structure of the LTIP was formulated in early 2012 upon appointment of the CEO (together with LTIP 5 and 6), and was subsequently approved by the shareholders at the Annual General Meeting in November 2012. The Performance Rights have 2, 3 and 4 year vesting periods with vesting dates on the third and fourth anniversaries of the approval date remaining. LTIP 7 has a zero exercise price.
During the year further issues were made under the plan as employees were promoted or new Executives were appointed. These issues equated to the number that had lapsed during the year due to termination of employment.
LTIP 8 Certain Group Executives and Senior Managers were granted performance rights in the 2015 financial year under LTIP 8. The terms of the grant were:
Share Price (i) TSR CAGR Vesting Date Expiry Date
LTI Stage 2 >$1.05 33.6% 30/11/15 30/11/16
LTI Stage 3 >$1.50 35.4% 30/11/16 30/11/17
(i) Share price means the volume weighted average price of the Company’s ordinary shares on the ASX for a period of 4 weeks plus any cash dividends paid or capital return from February 2013 onwards minus $0.13.
The structure of the LTIP was based on that formulated in early 2012 upon appointment of the CEO, with some variation, as appropriate, to the testing period to reflect the Group Executives and Senior Managers start date or promotion.
CSG 14|15 ANNUAL REPORT 31
For
per
sona
l use
onl
y

Staff Incentive Share PlansThere are two Staff Incentive Share Plans that were approved at the 2012 Annual General Meeting to assist the Company to recruit, reward, retain and to generate increased engagement in its employees that are not part of the Executive LTIP. Both have been implemented and are listed below:
1. The CSG Tax Exempt Share Plan (Australia) (AUS Tax Exempt Plan) in which eligible employees were offered up to AUD$1,000 worth of ordinary shares in the Company on a tax free basis. These shares are held in a trust and are subject to a three year holding lock. No consideration is payable by participants for the grant of ordinary shares and there are no additional vesting conditions or forfeiture conditions in respect of the plan other than that required by law.
2. The CSG Tax Exempt Share Plan (New Zealand) (NZ Tax Exempt Plan) in which eligible employees were offered up to (AUD)$ 1,000 worth of ordinary shares in the Company on a tax free basis. These shares are held in a trust and are subject to a three year holding lock. Nominal consideration ($NZD1) was payable for the grant of ordinary shares and there are no additional vesting conditions or forfeiture conditions in respect of the plan other than that required by law.
The Board approved a further issue under the above Staff Incentive Share Plans in FY2015 in accordance with each Plan’s rules.
Non-Executive Directors remuneration fees effective from 1 July 2014 onwards are set out below:
Following a recent review of Non-Executive Director fees, it was agreed that from 1 July 2015, Non-Executive Director remuneration fees (excluding statutory superannuation) be adjusted as follows:
2014/15 BoardAudit
Committee
Nomination & Remuneration
Committee
Chairman $150,0001 $20,000 $20,000
Member $57,500 $3,000 $3,000
1 Superannuation is not paid on the Chairman’s fee in the above table.
2015/16 BoardAudit
Committee
Nomination & Remuneration
Committee
Chairman $140,0001 $17,500 $17,500
Member $65,000 - -
1 Superannuation is not paid on the Chairman’s fee in the above table.
This adjustment will increase the overall pool for Non-Executive Directors fees from $455,505 to $463,025 or an increase of 1.7%. The last Non-Executive Director fee increase was 1 July 2013.
9. Non-Executive Director Remuneration
The available remuneration pool for Non-Executive Directors, as approved at the 2014 Annual General Meeting, is $600,000 (all inclusive). There is no intention to seek an increase at this year’s Annual General Meeting.
The table below summarises the rates for the various roles. Key points to note are:
• the Chairman is paid an all-inclusive fee regardless of Committee positions;
• Board members are currently paid a base fee plus additional fees for each Committee Chair and Member role (see table below for fee structure); and
• Superannuation is paid on all fees at the statutory rates (increased to 9.50% for the 2015 financial year).
DIRECTORS’ REPORT
32
For
per
sona
l use
onl
y

10. Link to 2015 Financial Year Performance
10.1 Company PerformanceThe table below provides summary information on the Company’s earnings and shareholder wealth for the current year and prior years:
2015 2014 2013 2012 2011
Revenue ($m) 224.3 199.3 184.6 202.8 388.6
Net profit/(loss) after tax ($m)
14.4 12.1 8.7 (22.2) 40.4
Share price ($) 1.60 1.03 0.94 0.79 1.00
Change in share price ($) 0.57 0.09 0.15 (0.21) (0.84)
Dividends paid ($) 0.09 0.04 0.29 0.055 0.055
Total Shareholder Return (TSR)
64% 14% 56% (16%) (43%)
Earnings per Share (cents) 5.1 4.3 3.1 (7.9) 15.6
10.2 STI OutcomesA balanced Corporate Scorecard was introduced in 2014 for the Group Executive. For the 2015 financial year the following allocations were made:
Scorecard Measure Scorecard weighting FY15 Outcome
EBITDA 25% 27.2%*
Revenue growth 10% 10%
Cash conversion 25% 25%
Employee engagement 10% 10%
Customer engagement 10% 10%
Business transformation 10% 7.5%
Stakeholders engagement 10% 10%
Total 100% 99.7%
* Overachievement entitlement of 108.8 % in accordance with the Company’s Remuneration Policy.
STI payments are made based on the position of the KMP within the organisation. The CEO’s and CFO’s STI payment is based on 100% of Corporate Scorecard performance and Executive Group’s STI payment is based on 50% Corporate Scorecard and 50% Divisional Scorecard performance.
10.3 LTI OutcomesThe movement in options issued and performance rights under previous LTIP during the year ended 30 June 2015 is summarized below:
LTIP Opening Issued Lapsed Exercised Closing
Issue 3 450,000 - - (450,000) -
Issue 5 4,571,428 - - (1,333,333) 3,238,095
Issue 6 606,061 - - - 606,061*
Issue 7 9,988,564 1,701,046# (1,701,046)# (3,166,995) 6,821,569
Issue 8 - 622,088 - - 622,088
Total 15,616,053 2,323,134 (1,701,046) (4,950,328) 11,287,813
* These Performance Rights vested on 1 August 2015 and the equivalent number of ordinary shares were issued.# The Performance Rights lapsed on termination of employment and were reissued to employees, which were either promoted or recruited, on the same basis.
CSG 14|15 ANNUAL REPORT 33
For
per
sona
l use
onl
y

11. Remuneration Tables and Disclosures 11.1 Directors’ Remuneration
Cash, Salary and Fees
STI and Other Fees
Termination Payments
Post-employment Super
LTI TOTAL Performance Related %
2015
Non-Executive Directors
Mr. Thomas Cowan* 149,946 - - - - 149,946 -
Mr. Philip Bullock 80,500 - - 7,647 - 88,147 -
Mr. Ian Kew 27,926 - - 2,653 - 30,579 -
Mr. Mark Phillips 52,278 - - 4,966 - 57,244 -
Mr. Stephen Anstice 52,278 - - 4,966 - 57,244 -
Ms. Robin Low 69,560 - - 6,608 - 76,168 -
Total 432,488 - - 26,840 - 459,328 -
Executive Directors
Ms. Julie-Ann Kerin 590,510 199,400 - 25,000 867,893 1,682,803 80%
Total 590,510 199,400 - 25,000 867,893 1,682,803 80%
Cash, Salary and Fees
STI and Other Fees
Termination Payments
Post-employment Super
LTI TOTAL Performance Related %
2014
Non-Executive Directors
Mr. Thomas Cowan* 150, 000 - - - - 150, 000 -
Mr. Philip Bullock 80,500 - - 7,446 - 87,946 -
Mr. Ian Kew 80,500 - - 7,446 - 87,946 -
Total 311,000 - - 14,892 - 325,892 -
Executive Directors
Ms. Julie-Ann Kerin 614,875 198,900 - 25,000 743,205 1,581,980 60%
Total 614,875 198,900 - 25,000 743,205 1,581,980 60%
* Note: salary is inclusive of all entitlements.
11.2 Executive Group Remuneration
Cash, Salary and Fees
STI Termination Payments
Post-employment Super
LTI Total Performance Related %
2015
Mr. Neil Lynch 314,225 149,550 - 18,780 347,157 829,712 60%
Mr. Duncan Powell (i) 3,750 - 90,191 4,696 - 98,637 N/A
Mr. Warwick Beban 293,791 44,138 - - 173,579 511,508 43%
Mr. Declan Ramsay 296,538 164,850 - 18,783 217,491 697,662 54%
Mr. Stephen Birrell 400,000 89,025 - 18,783 347,157 854,965 51%
Mr. Shailendra Singh (ii) 200,026 37,387 11,583 99,691 348,687 39%
Total 1,508,330 484,950 90,191 72,625 1,185,075 3,341,171 50%
(i) Resigned 3 July 2014.(ii) Commenced 10 December 2014. Ceased employment on 12 August 2015.
DIRECTORS’ REPORT
34
For
per
sona
l use
onl
y

Cash, Salary and Fees
STI Termination Payments
Post-employment Super
LTI TOTAL Performance Related %
2014
Mr. Neil Lynch 346,234 119,676 - 17,775 297,281 780,966 53%
Mr. Duncan Powell (i) 344,259 - - 17,775 297,281 659,315 45%
Mr. Warwick Beban 276,734 113,670 - - 148,641 539,045 49%
Mr. Declan Ramsay 318,661 100,616 - 17,775 148,641 585,693 43%
Mr. Stephen Birrell 407,692 97,087 - 17,775 297,281 819,835 48%
Total 1,693,580 431,049 - 71,100 1,189,125 3,384,854 48%
Cash, Salary and Fees
STI and Other Fees
Termination Payments
Post-employment Super
LTI TOTAL Performance Related %
2015
Non-Executive Directors
Mr. Thomas Cowan* 149,946 - - - - 149,946 -
Mr. Philip Bullock 80,500 - - 7,647 - 88,147 -
Mr. Ian Kew 27,926 - - 2,653 - 30,579 -
Mr. Mark Phillips 52,278 - - 4,966 - 57,244 -
Mr. Stephen Anstice 52,278 - - 4,966 - 57,244 -
Ms. Robin Low 69,560 - - 6,608 - 76,168 -
Total 432,488 - - 26,840 - 459,328 -
Executive Directors
Ms. Julie-Ann Kerin 590,510 199,400 - 25,000 867,893 1,682,803 80%
Total 590,510 199,400 - 25,000 867,893 1,682,803 80%
(i) Resigned 3 July 2014.
11.3 LTIP Issue 4, 5, 6, 7 & 8 – Options & Performance Rights
All Performance Rights refer to rights over ordinary shares of CSG Limited, which are exercisable on a one-for-one basis under various plans. Performance rights are provided at no cost to the recipients. Non-Executive Directors are not entitled to participate in LTI plans.
(i) Resigned 3 July 2014. (ii) Commenced 10 December 2014. Ceased employment 12 August 2015.
Date Granted Balance at Beginning of Year
Granted in Year Vested Forfeited in Year
Balance at End of Year
2015
Ms. Julie-Ann Kerin 28/6/2013 5,177,489 - (1,333,333) - 3,844,156
Mr. Neil Lynch 28/6/2013 1,828,571 - (533,333) - 1,295,238
Mr. Duncan Powell (i) 28/6/2013 1,828,571 - (533,333) (1,295,238) 0
Mr. Warwick Beban 28/6/2013 914,286 - (266,667) - 647,619
Mr. Declan Ramsay 28/6/2013 & 30/12/2014
914,286 97,143 (266,667) - 744,762
Mr. Stephen Birrell 28/6/2013 1,828,571 - (533,333) - 1,295,238
Mr. Shailendra Singh(ii) 30/12/2014 - 433,000 - - 433,000
Total 12,491,774 530,143 (3,466,666) (1,295,238) 8,260,013
Date Granted Balance at Beginning of Year
Granted in Year Vested Forfeited in Year
Balance at End of Year
2014
Ms. Julie-Ann Kerin 28/6/2013 5,314,101 - - (136,612)* 5,177,489
Mr. Neil Lynch 28/6/2013 1,921,172 - - (92,601)* 1,828,571
Mr. Duncan Powell (i) 28/6/2013 1,828,571 - - - 1,828,571
Mr. Warwick Beban 28/6/2013 914,286 - - - 914,286
Mr. Declan Ramsay 28/6/2013 914,286 - - - 914,286
Mr. Stephen Birrell 28/6/2013 1,828,571 - - - 1,828,571
Total 12,720,987 - - (229,213) 12,491,774
* LTIP 4 granted 9 September 2011.(i) Resigned 3 July 2014.
CSG 14|15 ANNUAL REPORT 35
For
per
sona
l use
onl
y

Fair Value
per Right at
Grant Date
$
Exercise Price
per Right
$
% Vested in Year
(a)
%
% Lapsed in Year
(a)
%
Value of Rights
Granted in Year
(b)
$
Value of Rights
Held in Year (b)
$
Value of Rights
Vested in Year (c)
$
Value of Rights
Lapsed in Year
(c)
$
Financial Years in
which Grant Vests
Expiry Date
2015
Ms. Julie-Ann Kerin* 0.6649 1.185 100 - 258,500 1,580,000 - 2015 30/11/2015
0.5451 - - - 428,442 - - 2016 30/11/2016
0.4646 - - - 180,951 - - 2017 30/11/2017
Total 867,893 1,580,000
Mr. Neil Lynch 0.6649 1.185 100 - 103,400 632,000 - 2015 30/11/2015
0.5451 - - - 171,377 - - 2016 30/11/2016
0.4646 - - - 72,380 - - 2017 30/11/2017
Total 347,157 632,000
Mr. Duncan Powell (i) 0.6649 1.185 100 - - 632,000 - 2015 30/11/2015
0.5451 - - 100% - - 171,377 2016 30/11/2016
0.4646 - - 100% - - 72,380 2017 30/11/2017
Total 632,000 243,696
Mr. Warwick Beban 0.6649 1.185 100 - 51,700 316,000 - 2015 30/11/2015
0.5451 - - - 85,689 - - 2016 30/11/2016
0.4646 - - - 36,190 - - 2017 30/11/2017
Total 173,579 316,000
Mr. Declan Ramsay 0.6649 1.185 100 - 51,700 316,000 - 2015 30/11/2015
0.5451 - - - 85,689 - - 2016 30/11/2016
0.4646 - - - 36,190 - - 2017 30/11/2017
1.11 34,703 2016 30/11/2016
0.88 9,209 2017 30/11/2017
Total 43,912 173,579 316,000
Mr. Stephen Birrell 0.6649 1.185 100 - 103,400 632,000 - 2015 30/11/2015
0.5451 - - - 171,377 - - 2016 30/11/2016
0.4646 - - - 72,380 - - 2017 30/11/2017
Total 347,157 632,000
Mr. Shailendra Singh (ii)
0.88 - - - 99,691 - - 2017 30/11/2017
Total 99,691
* Excluding retention rights.(i) Resigned 3 July 2014.(ii) Commenced 10 December 2014. Ceased employment on 12 August 2015.
Details of the performance criteria attached to each of the performance rights are included in the LTI discussion above and in Note 23 to the financial statements. No performance rights have been granted since the end of the financial year.
a. The percent forfeited and lapsed in the year represents the reduction from the maximum number of options available to vest due to the performance or conditions not being achieved.
b. Fair value is independently determined utilising assumptions underlying the Black-Scholes methodology to produce a Monte Carlo simulation model which allows for the incorporation of performance hurdles that must be met before the performance right vests. The valuation is undertaken in a risk-neutral framework whilst allowing for variables such as volatility, dividends, the risk free rate, the withdrawal rate and performance hurdles along with constants such as the strike price, term and vesting periods.
c. The value of options that lapsed or were forfeited during the year represents the benefit foregone and was calculated as the number of options at the date the options lapsed or were forfeited, multiplied by the fair value of the options calculated independently at the date the options lapsed or were forfeited but assuming the vesting conditions were satisfied.
DIRECTORS’ REPORT
36
For
per
sona
l use
onl
y

12. Service AgreementsExpiry Termination
NoticeTermination
Payment
Executive Director
Ms. Julie-Ann Kerin N/A 6 months 6 months
Group Executive
Mr. Neil Lynch N/A 6 months 6 months
Mr. Warwick Beban N/A 3 months 3 months
Mr. Declan Ramsay N/A 3 months 3 months
Mr. Stephen Birrell N/A 3 months 6 months
13. Directors’ Interests The KMP’s relevant interests in shares of the Company or options over shares in the Company are detailed below. Changes in shareholdings during the year are specified in Note 28 of the financial statements.
Ordinary shares of CSG
Options over shares in CSG
Mr. Thomas Cowan(i) 19,924,622 -
Mr. Phillip Bullock 60,000 -
Mr. Ian Kew(ii) - -
Mr. Stephen Anstice 140,000 -
Mr. Mark Phillips 60,000 -
Ms. Robin Low 46,362 -
Ms. Julie-Ann Kerin 133,333 3,844,156
20,032,279 3,844,156
(i) Mr. Thomas Cowan is a partner in TDM Asset Management (TDM). TDM has a direct interest in the shares held by its clients by virtue of the control it exercises in relation to the shares under its investment management arrangements with clients. TDM and its clients hold in aggregate 19,924,622 shares at 30 June 2015.
(ii) Ceased to be a director on 20 November 2014 at which time Mr. Kew held 69,730 ordinary shares
14. Transactions with Key Management PersonnelThe Group used the corporate advisory services of TDM Asset Management, a firm which Mr. Thomas Cowan is a partner of, during the year for the total amount of $17,500. Amounts were billed based on normal market rates for such services and were due and payable under normal payment terms.
During the financial year, the companies in the Group entered into agreements in respect of the purchase of print and technology products and services on normal commercial terms and conditions with related entities of the Directors.
15. Environmental RegulationThe CSG Group’s operations are not subject to any significant environmental Commonwealth or State regulations or laws.
16. Proceedings on Behalf of the Consolidated EntityNo person has applied for leave of Court to bring proceedings on behalf of the consolidated entity.
17. State of AffairsThere have been no significant changes in the CSG Group’s state of affairs during the financial year.
CSG 14|15 ANNUAL REPORT 37
For
per
sona
l use
onl
y

18. DividendsThe dividends paid or declared since the start of the year are as follows:
Consolidated entity
2015 $’000
2014 $’000
Current year interim: Unfranked dividends of 4 cents per share paid 11 March 2015
11,365 -
Current year final: Dividends declared* at 5 cents per share (2014: Unfranked dividends of 5 cents per share paid 8 September 2015)
14,238 13,965
Total Dividends 25,603 13,965
* Unfranked dividends of 5 cents per share were declared and approved on 17 August 2015 for a payment date of 8 September 2015, refer to item 23.
19. Directors’ Interests in ContractsDirectors’ interests in contracts are disclosed in Note 28 to the financial statements.
20. Indemnification and Insurance of Directors and OfficersDuring the financial year, the consolidated entity has paid a premium amounting to $210,832 insuring all the Directors and the officers against judgments, settlements, investigative costs, defence costs and costs to appear at inquiries or investigations.
Amounts paid or payable to an auditor for non-audit services provided during the year by the auditor to any entity that is part of the consolidated entity for:
2015$
2014$
Other assurance services
98,659 53,700
22. Auditor’s Independence DeclarationThe lead auditor’s independence declaration in relation to the audit for the financial year is set out on page 40 of this report.
23. Events Subsequent to Reporting DateUnfranked dividends of 5 cents per share were declared and approved by the Directors on 17 August 2015 for a payment date of 8 September 2015.
On 16 August 2015, the Company executed an agreement to acquire Code Blue, an IT services company based in New Zealand, for total purchase consideration of $13.5m (NZ$15m). The consideration will be paid as $4.5m
21. Non-Audit ServicesNon-audit services are approved by resolution of the Audit and Risk Management Committee and approval is provided in writing to the Board. Non-audit services provided by the auditors of the Group during the year, KPMG, are detailed below. The Directors are satisfied that the provision of the non-audit services during the year by the auditor is compatible with the general standard of independence for auditors imposed by the Corporations Act 2001.
DIRECTORS’ REPORT
38
(NZ$5m) in cash on completion, and the balance of $9m (NZ$10m) subject to meeting agreed earn-out objectives over the following two years. Up to $3.3m (NZ$3.7m) could be paid by way of the issue of new shares, with the balance in cash, as part of the deferred purchase consideration. Both the purchase price and value of shares issued are subject to completion adjustments.
The financial effect of these transactions have not been brought to account in the financial statements for the year ended 30 June 2015.
24. Likely DevelopmentsThe CSG Group will continue to pursue its policy of increasing the profitability and market share of its business units during the next financial year. Refer to the Operational and Financial Review for further details.
25. Rounding of AmountsThe CSG Group is of a kind referred to in ASIC Class Order 98/100 dated 10 July 1998 and in accordance with that Class Order, amounts in the consolidated financial statements and Directors’ Report have been rounded off to the nearest thousand dollars, unless otherwise stated.
Signed in accordance with a resolution of the Directors.
Julie-Ann Kerin
Managing Director
Sydney
17 August 2015
For
per
sona
l use
onl
y

Auditor’sIndependence
Declaration
For
per
sona
l use
onl
y

AUDITOR’S INDEPENDENCEDECLARATION
40
For
per
sona
l use
onl
y

I4|I5Financial
Statements
For
per
sona
l use
onl
y

Consolidated Statement of Profit and Loss and Other Comprehensive Income for the year ended 30 June 2015
Consolidated entity
Notes2015
$’0002014
$’000
Revenue from continuing operations
Sales revenue 7 193,161 173,929
Finance lease interest income 23,636 19,040
Interest income 111 148
Other income 7 7,382 6,208
224,290 199,325
Changes in inventories of finished goods 8 105,899 97,690
Finance lease interest expense 11,697 8,520
Marketing expenses 2,360 2,167
Occupancy expenses 5,571 5,612
Administration expenses 23,073 20,783
Employee benefits expenses 41,936 34,459
Share based transactions 3,804 2,812
Acquisition and integration related expenses 540 -
Other expenses 8 685 3,252
Depreciation and amortization 8 4,518 5,161
Finance costs 8 1,599 1,054
201,682 181,510
Profit before income tax 22,608 17,815
Income tax (expense) 9 (8,295) (5,728)
Profit from continuing operations 14,313 12,087
Profit is attributable to:
Members of the parent 13,572 11,125
Non-controlling interest 741 962
14,313 12,087
Profit after income tax expense 14,313 12,087
Items that may be reclassified subsequently to profit and loss:
Exchange differences on translation of foreign operations, net of tax
24 (2,283) 3,518
Cash flow hedges:
Net gains / (losses) taken to equity 24 (2,260) (374)
Other comprehensive income for the year (4,543) 3,144
Total comprehensive income for the year 9,770 15,231
Total profit and loss and other comprehensive income is attributable to:
Members of the Parent 9,029 14,269
Non-controlling interest 741 962
9,770 15,231
Earnings per share for profit from continuing operations attributable to equity holders of the parent entity:
Basic earnings per share (cents) 30 5.1 4.3
Diluted earnings per share (cents) 30 4.8 4.1
The accompanying notes form part of these financial statements
14|15 FINANCIAL STATEMENTS
42
For
per
sona
l use
onl
y

Consolidated Statement of Financial Position as at 30 June 2015
Consolidated entity
Notes2015
$’0002014
$’000
CURRENT ASSETS
Cash and cash equivalents 11 24,754 27,268
Receivables 12 25,762 23,072
Lease receivables 12 67,598 57,617
Inventories 13 41,592 40,961
Other 14 6,574 6,546
Derivatives 15 915 -
TOTAL CURRENT ASSETS 167,195 155,464
NON-CURRENT ASSETS
Lease receivables 12 142,444 103,887
Deferred tax assets 9 - 1,182
Property, plant and equipment 16 2,361 2,667
Intangible assets 17 193,233 191,001
TOTAL NON-CURRENT ASSETS 338,038 298,737
TOTAL ASSETS 505,233 454,201
CURRENT LIABILITIES
Payables 18 43,235 42,826
Deferred income 95 435
Short term borrowings 19 10,131 675
Deferred Tax Liability 9 3,435 -
Current tax payable 9 515 1,325
Provisions 22 3,325 3,154
Debt associated with lease receivables 20 617 3,716
TOTAL CURRENT LIABILITIES 61,353 52,131
NON-CURRENT LIABILITIES
Provisions 22 545 1,326
Derivatives 21 2,441 1,118
Debt associated with lease receivables 20 187,149 134,614
TOTAL NON-CURRENT LIABILITIES 190,135 137,058
TOTAL LIABILITIES 251,488 189,189
NET ASSETS 253,745 265,012
EQUITY
Contributed equity 23 166,533 160,838
Reserves 24 3,147 9,091
Retained earnings 24 70,768 82,527
Equity attributable to owners of CSG Limited 240,448 252,456
Non-Controlling interest 13,297 12,556
TOTAL EQUITY 253,745 265,012The accompanying notes form part of these financial statements
CSG 14|15 ANNUAL REPORT 43
For
per
sona
l use
onl
y
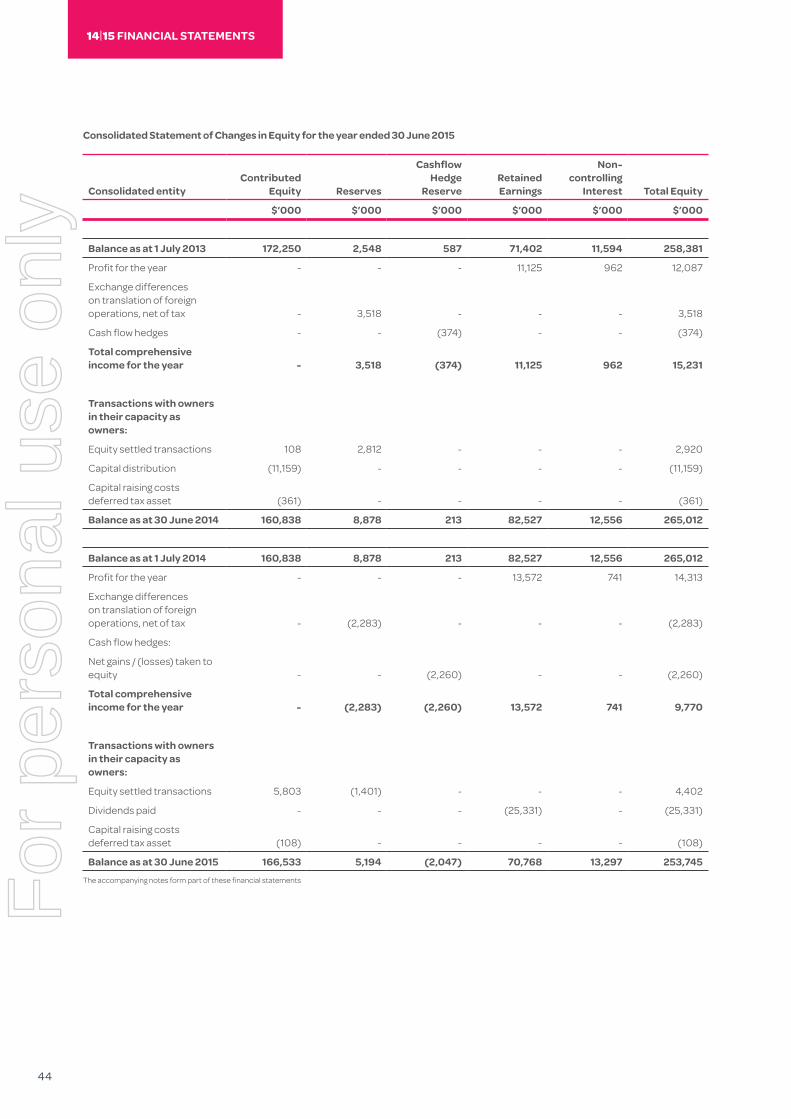
Consolidated Statement of Changes in Equity for the year ended 30 June 2015
Consolidated entityContributed
Equity Reserves
Cashflow Hedge
ReserveRetained Earnings
Non-controlling
Interest Total Equity
$’000 $’000 $’000 $’000 $’000 $’000
Balance as at 1 July 2013 172,250 2,548 587 71,402 11,594 258,381
Profit for the year - - - 11,125 962 12,087
Exchange differences on translation of foreign operations, net of tax - 3,518 - - - 3,518
Cash flow hedges - - (374) - - (374)
Total comprehensive income for the year - 3,518 (374) 11,125 962 15,231
Transactions with owners in their capacity as owners:
Equity settled transactions 108 2,812 - - - 2,920
Capital distribution (11,159) - - - - (11,159)
Capital raising costs deferred tax asset (361) - - - - (361)
Balance as at 30 June 2014 160,838 8,878 213 82,527 12,556 265,012
Balance as at 1 July 2014 160,838 8,878 213 82,527 12,556 265,012
Profit for the year - - - 13,572 741 14,313
Exchange differences on translation of foreign operations, net of tax - (2,283) - - - (2,283)
Cash flow hedges:
Net gains / (losses) taken to equity - - (2,260) - - (2,260)
Total comprehensive income for the year - (2,283) (2,260) 13,572 741 9,770
Transactions with owners in their capacity as owners:
Equity settled transactions 5,803 (1,401) - - - 4,402
Dividends paid - - - (25,331) - (25,331)
Capital raising costs deferred tax asset (108) - - - - (108)
Balance as at 30 June 2015 166,533 5,194 (2,047) 70,768 13,297 253,745The accompanying notes form part of these financial statements
14|15 FINANCIAL STATEMENTS
44
For
per
sona
l use
onl
y

Consolidated Statement of Cash Flows for the year ended 30 June 2015
Consolidated entity
Notes2015
$’0002014
$’000
CASH FLOWS FROM OPERATING ACTIVITIES
Receipts from customers 243,086 211,740
Payments to suppliers, employees and others (214,447) (191,278)
Movement in lease receivables (41,774) (46,010)
Interest income 111 148
Interest expense (1,454) (1,054)
Income tax paid (4,773) (6,540)
Net cash (used in) operating activities 25(a) (19,251) (32,994)
CASH FLOWS FROM INVESTING ACTIVITIES
Payment for intangibles (3,946) (4,344)
Payments for property, plant and equipment (1,117) (432)
Proceeds from the sale of property, plant and equipment - 398
Payments for businesses 27 (11,506) (8,000)
Net cash from/(used in) investing activities (16,569) (12,378)
CASH FLOWS FROM FINANCING ACTIVITIES
Borrowings associated with lease receivables 49,436 41,906
Options exercised 320 225
Proceeds from borrowings 9,400 15,095
Repayment of borrowings - (15,167)
On-market share buy-backs - (117)
Capital distributions - (11,159)
Dividend distributions 10 (25,331) -
Net cash flows provided by/(used in) financing activities 33,825 30,783
Net increase/(decrease) in cash held (1,995) (14,589)
Cash at the beginning of the financial year 27,268 40,017
Foreign exchange difference on cash holdings (519) 1,840
Cash and cash equivalents at end of year 25(b) 24,754 27,268The accompanying notes form part of these financial statements
CSG 14|15 ANNUAL REPORT 45
For
per
sona
l use
onl
y

46
For
per
sona
l use
onl
y

Notes to theFinancial
Statements30 June 2015
For
per
sona
l use
onl
y

Note 1: Reporting EntityCSG Limited (the “Company”) is a company limited by shares, incorporated and domiciled in Australia. The address of the Company’s registered office is Level 1, 357 Collins Street, Melbourne, VIC, Australia, 3000. The consolidated financial statements of the Company as at and for the year ended 30 June 2015 comprise the Company and its controlled entities (together referred to as the “Group” and individually as (“Group entities”). The Group is a for-profit entity and primarily involved in print related sales and service and financing of office equipment.
Note 2: Basis Of PreparationStatement of complianceThis financial report is a general purpose financial report that has been prepared in accordance with Australian Accounting Standards and other authoritative pronouncements of the Australian Accounting Standards Board and the Corporations Act 2001. The consolidated financial statements of the Company also comply with International Financial Reporting Standards (IFRS) as issued by the International Accounting Standards Board (IASB).
The financial report was authorised for issue by the Directors on 17 August 2015.
a. Basis of measurementThe financial report has been prepared under the historical cost convention, as modified by revaluations to fair value for certain material items in the statement of financial position and as described in the accounting policies.
b. Functional and presentation currency
The financial report is presented in Australia dollars which is the Company’s functional currency. The Company is of a kind referred to in ASIC Class Order 98/0100 and in accordance with that Class Order, amounts in the financial statements have been rounded off to the nearest thousand dollars, or in certain cases, to the nearest dollar.
c. Use of estimates and judgmentsThe preparation of the financial report in conformity with IFRS requires management to make judgments, estimates and assumptions that affect the application of accounting policies and the reported amounts of assets, liabilities, income and expenses. Actual results may differ from these estimates.
Estimates and underlying assumptions are reviewed on an ongoing basis. Revisions to accounting estimates are recognised in the period in which the estimates are revised and in any future periods affected.
Estimates and assumptions based on future events have a significant inherent risk, and where future events are not as anticipated there could be a material impact on the carrying amounts of the assets and liabilities discussed below:
i. Assessing impairment of goodwill
Goodwill is allocated to cash generating units (“CGUs”) according to applicable business operations. The CGUs are aligned at the segment level. The recoverable amount of a CGU is based on value-in-use calculations. These calculations are based on projected financial forecasts and projected cash flows approved by management covering a period not exceeding five years. Management’s determination of cash flow projections are based on past performance and its expectation for the future. The present value of future cash flows has been calculated using a post-tax discount rates listed in Note 17 to determine value-in-use.
ii. Income taxes
Income tax benefits are based on the assumption that no adverse change will occur in the income tax legislation and the anticipation that the company will derive sufficient future assessable income to enable the benefit to be realised and comply with the conditions of deductibility imposed by the law.
iii. Employment benefits
Calculation of long term employment benefits requires estimation of the retention of staff, future remuneration levels and timing of the settlement of the benefits. The estimates are based on historical trends.
iv. Share-based payments
Calculation of shared based payments requires estimation of the timing of the exercise of the underlying instrument. The estimates are based on historical trends.
v. Inventory – consumables at customer premises
Inventory balances include consumables owned by the group but located at customer premises. The value of consumables recorded as inventory is based on management’s estimate resultant from information held in customer servicing systems and a sample of customer holdings.
vi. Inventory - obsolescence
Inventory balances relate to items subject to technological obsolescence and unknown usage levels. Obsolete and slow-moving inventory is estimated based on the age of the inventory items, historical usage and likely future usage, and likely recoverable values.
Note 3: Summary Of Significant Accounting PoliciesThe accounting policies set out below have been applied consistently to all periods presented in this financial report, and have been applied consistently by Group entities.
a. Basis of consolidation
i. Business combinations
Business combinations are accounted for using the acquisition method as at the acquisition date, which is the date on which control is transferred to the Group. Control is the power to govern the financial and operating policies of an entity so as to obtain benefits from its activities. In assessing control, the Group takes into consideration potential voting rights that are currently exercisable.
The Group measures goodwill at the acquisition date as:
• the fair value of the consideration transferred; plus
• the recognised amount of any non-controlling interests in the acquiree; plus
• if the business combination is achieved in stages, the fair value of the existing equity interest in the acquiree; less
• the net recognized amount (generally fair value) of the identifiable assets acquired and liabilities assumed.
NOTES TO THE FINANCIAL STATEMENTS 30 JUNE 2015
48
For
per
sona
l use
onl
y
When the excess is negative, a bargain purchase gain is recognised immediately in profit or loss.
The consideration transferred does not include amounts related to the settlement of pre-existing relationships. Such amounts are generally recognised in profit or loss.
Transaction costs, other than those associated with the issue of debt or equity securities, that the Group incurs in connection with a business combination are expensed as incurred.
Any contingent consideration payable is recognised at fair value at acquisition date. If the contingent consideration is classified as equity, it is not remeasured and settlement is accounted for within equity. Otherwise, subsequent changes to the fair value of the contingent consideration are recognised in profit or loss.
When share-based payment awards (replacement awards) are required to be exchanged for awards held by the acquiree’s employees (acquiree’s awards) and relate to past services, then all or a portion of the amount of the acquirer’s replacement awards is included in measuring the consideration transferred in the business combination. This determination is based on the market-based value of the replacement awards compared with the market-based value of the acquiree’s awards and the extent to which the replacement awards relate to past and/or future service.
ii. Subsidiaries
Subsidiaries are entities controlled by the Group. The financial statements of subsidiaries are included in the consolidated financial statements from the date that control commences until the date that control ceases.
The financial statements of subsidiaries are prepared for the same reporting period as the parent entity, using consistent accounting policies. Adjustments are made to bring into line any dissimilar accounting policies, which may exist.
iii. Non-controlling interests
Non-controlling interests in the results of subsidiaries are shown separately in the consolidated statement of profit and loss and other comprehensive income and consolidated statement of financial position respectively.
iv. Loss of control
Upon the loss of control, the Group
derecognises the assets and liabilities of the subsidiary, any non-controlling interests and other components of equity related to the subsidiary. Any surplus or deficit arising on the loss of control is recognised in profit or loss. If the Group retains any interest in the previous subsidiary, then such interest is measured at fair value at the date that control is lost. Subsequently, it is accounted for as an equity-accounted investee or as an available-for-sale financial asset depending on the level of influence retained.
v. Transactions eliminated on consolidation
All intercompany balances and transactions, including any unrealised profits or losses have been eliminated on consolidation.
b. Foreign currency
i. Foreign currency transactions
Transactions in foreign currencies of entities within the consolidated group are translated into functional currency at the rate of exchange ruling at the date of the transaction. Foreign currency monetary items that are outstanding at the reporting date (other than monetary items arising under foreign currency contracts where the exchange rate for that monetary item is fixed in the contract) are translated using the spot rate at the end of the financial year. All resulting exchange differences arising on settlement or re statement are recognised as revenues and expenses for the financial year.
ii. Foreign operations
Entities that have a functional currency different to the presentation currency are translated as follows:
• assets and liabilities are translated at year-end exchange rates prevailing at that reporting date;
• income and expenses are translated at actual exchange rates or average exchange rates for the period, where appropriate; and
• all resulting exchange differences are recognised as a separate component of equity.
c. Financial instruments
i. Non-derivative financial assets
The Group initially recognises loans and receivables on the date that they are originated. All other financial assets (including assets designated at fair value through profit or loss) are recognised
initially on the trade date at which the Group becomes a party to the contractual provisions of the instrument.
The Group derecognises a financial asset when the contractual rights to the cash flow from the asset expire, or it transfers the rights to receive the contractual cash flows on the financial asset in a transaction in which substantially all the risks and rewards of ownership of the financial asset are transferred. Any interest in transferred financial assets that is created or retained by the Group is recognised as a separate asset or liability.
Financial assets and liabilities are offset and the net amount presented in the statement of financial position only when the Group has a legal right to offset the amounts and intends either to settle on a net basis or to realise the asset and settle the liability simultaneously.
The Group has the following non-derivative financial assets: financial assets at fair value through profit or loss and loans and receivables.
Financial assets at fair value through profit or loss
A financial asset is classified as at fair value through profit or loss if it is classified as held for trading or is designated as such upon initial recognition. Financial assets are designated at fair value through profit or loss if the Group manages such investments and makes purchase and sale decisions based on their fair value in accordance with the Group’s documented risk management or investment strategy. Attributable transaction costs are recognised in profit or loss when incurred. Financial assets at their fair value through profit or loss are remeasured at fair value, and changes therein are recognised in profit or loss.
Loans and receivables
Loans and receivables are financial assets with fixed or determinable payments that are not quoted on an active market. Loans and receivables are measured at fair value at inception net of transaction costs and subsequently at amortised cost using the effective interest rate method, less any impairment losses.
Loans and receivables comprise cash and cash equivalents and, trade and other receivables.
Cash and cash equivalents
Cash and cash equivalents include cash on hand and at banks, including restricted cash and a group multi-
CSG 14|15 ANNUAL REPORT 49
For
per
sona
l use
onl
y

function bank overdraft facility. Bank overdrafts are shown within long-term borrowings in non-current liabilities on the balance sheet.
ii. Non-derivative financial liabilities
Financial liabilities (including liabilities designated at fair value through profit or loss) are recognised initially on the trade date, which is the date that the Group becomes a party to the contractual provisions of the instrument.
The Group derecognises a financial liability when its contractual obligations are discharged or cancelled or expire.
The Group classifies non-derivative financial liabilities into the other financial liabilities category. Such financial liabilities are recognised initially at fair value less any directly attributable transaction costs. Subsequent to initial recognition, these financial liabilities are measured at amortised cost using the effective interest rate method.
Other financial liabilities comprise trade payables, other creditors and loans from third parties including inter company balances and loans from or other amounts due to Director related entities.
iii. Derivative financial instruments, including hedge accounting
The Group uses derivative financial instruments to hedge its exposure to interest rate risks arising from financing activities and foreign exchange risk in respect of inventory purchases. In accordance with treasury policy, the Company does not hold or issue derivative financial instruments for trading purposes. However, derivatives that are not designated hedges are accounted for as held for trading instruments.
On initial designation of the derivative as the hedging instrument, the Group formally documents the relationship between the hedging instrument and the hedged item, including the risk management objectives and strategy in undertaking the hedge transaction and the hedged risk, together with the methods that will be used to assess the effectiveness of the hedging relationship. The Group makes an assessment, both at the inception of the hedge relationship as well as on an ongoing basis, whether the hedging instruments are expected to be highly effective in offsetting the changes in the fair value or cash flows of the respective hedged items attributable to hedged risk, and whether the actual results of each hedge are within a range of 80 – 125%. For a cash flow hedge of a forecast transaction, the transaction
should be highly probable to occur and should present an exposure to variations in cash flows that could ultimately affect reported profit or loss.
Derivative financial instruments are recognised initially at fair value and transaction costs are expensed immediately. Subsequent to initial recognition, derivative financial instruments are stated at fair value and subject to the nature of the hedging instrument the gain or loss on re-measurement to fair value is recognised immediately in the statement of comprehensive income or as described below.
Cash flow hedges
When a derivative is designated as the hedging instrument in a hedge of the variability in cash flows attributable to a particular risk associated with a recognised asset or liability or a highly probable forecast transaction that could affect profit or loss, the effective portion of changes in the fair value of the derivative is recognised in other comprehensive income and presented in the hedging reserve in equity. The ineffective portion of changes in the fair value of the derivative is recognised immediately in profit or loss.
When the hedged item is a non-financial asset, the amount recognised in equity is included in the carrying amount of the asset when the asset is recognised. In other cases the amount accumulated in equity is reclassified to profit or loss in the same period that the hedged item affects profit or loss. If the hedging instrument no longer meets the criteria for hedge accounting, expires or is sold, terminated or exercised, or the designation is revoked, the hedge accounting is discontinued prospectively. If the forecast transaction is no longer expected to occur, then the balance in equity is reclassified to profit or loss.
d. Revenue RecognitionSale of Goods
Revenue is measured at the fair value of the consideration received or receivable.
Revenue from the sale of goods and disposal of other assets is recognised when significant risks and rewards of ownership of the goods have passed to the buyer and the costs incurred or to be incurred in respect of the transaction can be reliably measured.
Rendering of Services
Revenue from a contract to provide
services is recognised by reference to the stage of completion of the contract. The revenue recognised from rendering of services combines:
i. invoicing from the provision of the Group’s services inclusive of the amounts due and payable under the terms of the long term service contracts; and
ii. revenue not yet invoiced but earned on work completed in servicing long term service contracts which, while owing to the Group under the terms of those contracts, will not become payable until future years.
The long term service contracts specifically detail both services to be performed and the invoicing components for each year of the contracts. The Group’s contract administration system enables the stage of completion of each contract to be reliably determined.
Interest income
Interest on loans and receivables from finance leases is recognised on an effective interest rate basis. Minimum lease payments received under finance leases are apportioned between the finance income and the reduction of the outstanding asset. The finance income is allocated to each period during the lease term so as to produce a constant period rate of interest on the remaining balance of the asset. An accrual basis is used to record interest income.
Operating lease revenue
Rental income from operating leases of equipment is recognised on an accrual basis with income recognised on a straight line basis over the term of the lease. Lease incentives granted are recognised as an integral part of the total rental income, over the term of the lease.
Equipment sales under financing arrangement
Equipment which is subject to rental agreements with customers may be sold to a finance company prior to the commencement of the rental agreement. Rental payments are collected by the relevant CSG entity and passed on to the finance company. A sale is recognised when goods have been dispatched to a customer pursuant to a rental agreement and a sales invoice has been issued to the finance company. Under these arrangements the risks of ownership of the equipment passes to the customer upon delivery of the equipment to the customer and the credit risk in relation to the rental stream passes
NOTES TO THE FINANCIAL STATEMENTS 30 JUNE 2015
50
For
per
sona
l use
onl
y

to the finance company. In these circumstances the entity guarantees to buy back the equipment for a nominal amount at the end of the rental agreement (or upon termination of the agreement) based on the term of the agreement.
Other income
Dividend revenue is recognised when the right to receive a dividend has been established.
Revenue arrangements with multiple deliverables
Where two or more revenue-generating activities or deliverables are sold under a single arrangement, each deliverable that is considered to be a separate unit of accounting is accounted for separately. When the deliverables in a multiple element arrangement are not considered to be separate units of accounting, the arrangement is accounted for as a single unit.
A separate unit of accounting exists where the deliverable has value to the customer on a stand-alone basis and there is objective and reliable evidence of the fair values.
e. Receivables
All trade receivables are recognised initially at fair value, and subsequently at amortised cost, less impairment.
Collectability of trade receivables is reviewed on an ongoing basis. Debts which are known to be uncollectible are written off. An impairment loss is raised when there is objective evidence that the company will not be able to collect all amounts due according to the original terms of the receivables. The amount of the impairment is the difference between the asset’s carrying amount and the present value of estimated future cash flows, discounted at the original effective interest rate. Cash flows relating to short-term receivables are not discounted if the effect of discounting is not material. The amount of the impairment is recognised in the statement of comprehensive income.
f. InventoriesInventories are valued on the weighted average cost basis at the lower of cost and net realisable value.
Net realisable value represents the estimated selling price in the ordinary course of business less the estimated costs of completion.
g. Property, Plant and EquipmentProperty, plant and equipment is recorded at cost less accumulated depreciation and accumulated impairment charges. Cost includes expenditure that is directly attributable to the acquisition of the items.
Subsequent costs are included in the asset’s carrying amount or recognised as a separate asset, as appropriate, only when it is probable that future economic benefits associated with the item will flow to the company and the cost of the item can be measured reliably. All repairs and maintenance are charged to the income statement during the financial period in which they are incurred.
Gains and losses on disposals are determined by comparing proceeds with carrying amount. These are included in the statement of profit and loss and other comprehensive income.
An asset’s carrying amount is written down immediately to its recoverable amount if the asset’s carrying amount is greater than its estimated recoverable amount.
Where the Company leases assets as a lessor on an operating lease, the Company retains substantially all the risks and rewards of ownership. The assets are stated at historical cost less accumulated depreciation and impairment losses (where applicable).
Depreciation of property, plant and equipment is calculated on a straight line and diminishing value basis to allocate their cost or revalued amounts, net of their residual values, over their estimated useful lives to the Company.
The following rates used in the calculation of depreciation are as follows:
Assets Rate Method
Leasehold improvements 2.5% - 33% Diminishing value and straight line
Plant and equipment 2.5% - 40% Diminishing value and straight line
Motor vehicles 13% - 19% Diminishing value
Office computer equipment 10% - 50% Diminishing value and straight line
Furniture and fittings 5% - 20% Diminishing value and straight line
Leased plant and equipment 20% Straight-line
h. Intangible assetsGoodwill
Goodwill represents the excess of the cost of the acquisition over the fair value of the net identifiable assets of the acquired subsidiary at the date of acquisition. Goodwill on acquisition of subsidiaries is included in intangible assets. Goodwill acquired in a business combination is allocated into the specific components acquired as part of the business combination.
All goodwill is tested for impairment annually or more frequently if events or circumstances indicate that it might be impaired, and is carried at cost less accumulated impairment losses. Gains and losses on the disposal of an entity include the carrying amount of goodwill relating to the entity sold.
Licenses and other Intangible Assets
Licenses and other intangible assets have a finite useful life and are recorded at cost less accumulated amortisation and impairment losses. Amortisation is calculated using the straight-line method to allocate the cost of the licenses over their estimated useful life. Other intangible assets have been assigned finite lives between 3-10 years. Software developed for resale is amortised over five years. Customer contracts/relationships acquired in a business combination have been assigned a finite life of 14 years and are amortised on a straight line basis over this period.
i. Impairment
i. Non-derivative financial assets
A financial asset not carried at fair value through profit or loss is assessed at each reporting date to determine whether there is objective evidence that it is impaired. A financial asset is impaired if there is objective evidence of impairment as a result of one or more events that occurred after the initial recognition of the asset, and that the loss event(s) had an impact on the estimated future cash flows of that asset that can be estimated reliably.
An impairment loss in respect of a financial asset measured at amortised costs is calculated as the difference between its carrying amount and the present value of the estimated future cash flows discounted at the asset’s original effective interest rate. Losses are recognised in profit or loss and reflected in an allowance account against loans and receivables. Interest on the impaired asset continues to be recognised. When an event occurring after the impairment was recognised causes the amount
CSG 14|15 ANNUAL REPORT 51
For
per
sona
l use
onl
y

of impairment loss to decrease, the decrease in impairment loss is reversed through profit or loss.
ii. Non-financial assets
The carrying amounts of the Group’s non-financial assets are reviewed at each reporting date to determine whether there is any indication of impairment. If any such indication exists, then the asset’s recoverable amount is estimated. Goodwill and indefinite life intangible assets are tested annually for impairment. An impairment loss is recognised if the carrying amount of an asset or its related cash-generating unit (CGU) exceeds its recoverable amount.
The recoverable amount of an asset or CGU is the greater of its value in use and its fair value less costs to sell. In assessing value in use, the estimated future cash flows are discounted to the present value using a pre-tax discount rate that reflects current market assessments of the time value of money and the risks specific to the asset or CGU. For the purpose of impairment testing, assets that cannot be tested individually are grouped together into the smallest group of assets that generates cash inflows from continuing use that are largely independent of the cash inflows of other assets or CGUs. Subject to an operating segment ceiling test, CGUs to which goodwill has been allocated are aggregated so that the level at which impairment testing is performed reflects the lowest level at which goodwill is monitored for internal reporting purposes. Goodwill acquired in a business combination is allocated to groups of CGUs that are expected to benefit from the synergies of the combination.
Impairment losses are recognised in profit or loss. Impairment losses recognised in respect of CGUs are allocated first to reduce the carrying amount of goodwill allocated to the CGU (group of CGUs), and then to reduce the carrying amounts of the other assets in the CGU (group of CGUs) on a pro rata basis.
An impairment loss in respect of goodwill is not reversed. For other assets, an impairment loss is reversed only to the extent that the asset’s carrying amount does not exceed the carrying amount that would have been determined, net of depreciation or amortisation, if no impairment loss had been recognised.
iii. Trade and other Payables
These amounts represent liabilities for goods and services provided to the
Group prior to the end of the financial year, which are unpaid.
j. BorrowingsBorrowings are initially recognised at fair value. Borrowings are subsequently measured at amortised cost. Any differences between the proceeds (net of transaction costs) and the redemption amount is recognised in the statement of comprehensive income over the period of the borrowings using the effective interest method. Fees paid on the establishment of loan facilities, which are not incremental costs relating to the actual draw down of the facility, are recognised as transaction costs and amortised on a straight-line basis over the term of the facility.
Borrowings are classified as current liabilities unless the company has an unconditional right to defer settlement of the liability for at least 12 months after the balance sheet date.
Borrowing costs are recognised as expenses in the period in which they are incurred.
k. Employee benefitsLiabilities arising in respect of wages and salaries, annual leave and any other employee benefits expected to be settled within twelve months of the reporting date are measured at their nominal amounts based on remuneration rates which are expected to be paid when the liability is settled. All other employee benefit liabilities are measured at the present value of the estimated future cash outflow to be made in respect of services provided by employees up to the reporting date.
Share-based Payments
The consolidated entity operates an employee share option plan. The bonus element over the exercise price for the grant of options is recognised as an expense in the statement of comprehensive income in the period(s) when the benefit is earned.
The total amount to be expensed over the vesting period is determined by reference to the fair value of the options at grant date. The fair value of options at grant date is determined using the Monte Carlo pricing model, and is recognised as an employee expense over the period during which the employees become entitled to the option.
l. ProvisionsA provision is recognised when a legal or constructive obligation exists as a result of a past event and it is probable
that an outflow of economic benefits will be required to settle the obligation, and the amount of the provision can be measured reliably. Provisions are determined by discounting the expected future cash flows at a pre-tax rate that reflects current market assessments of the time value of money and the risks specific to the liability. The unwinding of the discount is recognised as a finance cost.
i. Restructuring
A provision for restructuring is recognised when the Group has approved a detailed and formal restructuring plan, and the restructuring either has commenced or has been announced publicly. Future operating losses are not provided for.
ii. Onerous contracts
A provision for onerous contracts is recognised when the expected benefits to be derived by the Group from a contract are lower than the unavoidable cost of meeting its obligations under the contract. The provision is measured at the present value of the lower of the expected cost of terminating the contract and the expected net cost of continuing with the contract. Before a provision is established, the Group recognises any impairment loss on the assets associated with the contract.
m. LeasesLeases are classified at their inception as either operating or finance leases based on the economic substance of the agreement so as to reflect the risks and benefits incidental to ownership.
Finance leases
Assets held under finance leases are initially recognised at their fair value or, if lower, at amounts equal to the present value of the minimum lease payments, each determined at the inception of the lease. The corresponding liability to the lessor is included in the balance sheet as a finance lease obligation. Leased assets are depreciated over the shorter of the estimated useful life of the assets and the lease term.
Lease payments are apportioned between finance charges and reduction of the lease obligation so as to achieve a constant rate of interest on the remaining balance of the liability. Finance charges are charged directly against income.
Operating lease
Operating lease payments are recognised as an expense on a straight-
NOTES TO THE FINANCIAL STATEMENTS 30 JUNE 2015
52
For
per
sona
l use
onl
y

line basis over the lease term, except where another systematic basis is more representative of the time pattern in which economic benefits from the leased asset are consumed.
n. Finance income and finance costs
Finance income comprises interest income on funds invested, dividend income, fair value gains on financial assets at fair value through profit or loss, gains on the re-measurement to fair value of any pre-existing interest in an acquiree, gains on hedging instruments that are recognised in profit or loss and reclassifications of amounts previously recognised in other comprehensive income. Interest income is recognised as it accrues in profit or loss, using the effective interest method. Dividend income is recognised in profit or loss on the date that the Group’s right to receive payment is established.
Finance costs comprise interest expense on borrowings, unwinding of the discount on provisions and contingent consideration, fair value losses on financials assets at fair value through profit or loss, impairment losses recognised on financial assets (other than trade receivables), losses on hedging instruments that are recognised in profit or loss and reclassifications of amounts previously recognised in other comprehensive income.
Borrowing costs that are not directly attributable to the acquisition of a qualifying asset are recognised in profit or loss using the effective interest method.
Foreign currency gains and losses are reported on a net basis in other income in Note 7 depending on whether foreign currency movements are in a net gain or net loss position.
o. Income taxTax expense comprises current and deferred tax. Current tax and deferred tax is recognised in profit or loss except to the extent that it relates to a business combination, or items recognised directly in equity or in other comprehensive income.
Current income tax expense or revenue is the tax payable on the current year’s taxable income based on the applicable income tax rate adjusted by changes in deferred tax assets and liabilities and any adjustment to tax payable in respect of previous years. Current tax payable also includes any tax liability arising from the declaration of dividends.
A balance sheet approach is adopted under which deferred tax assets and liabilities are recognised for temporary differences between the tax bases of assets and liabilities and their carrying amounts in the financial statements. No deferred tax asset or liability is recognised in relation to temporary differences arising from the initial recognition of an asset or a liability if they arose in a transaction, other than a business combination, that at the time of the transaction did not affect either accounting profit or taxable profit or loss.
Deferred tax is measured at the tax rates that are expected to be applied to temporary differences when they reverse, using tax rates enacted or substantively enacted at the reporting date.
In determining the amount of current and deferred tax the Group takes into account the impact of uncertain tax positions and whether additional taxes and interest may be due. The Group believes that its accruals for tax liabilities are adequate for all open tax years based on its assessment of many factors, including interpretations of tax law and prior experience. This assessment relies on estimates and assumptions and may involve a series of judgements about future events. New information may become available that causes the Group to change its judgement regarding the adequacy of existing tax liabilities; such changes to tax liabilities will impact tax expense in the period that such a determination is made.
Deferred tax assets and liabilities are offset if there is a legally enforceable right to offset current tax liabilities and assets, and they relate to income taxes levied by the same tax authority on the same taxable entity, or on different tax entities, but they intend to settle current tax liabilities and assets on a net basis or their tax assets and liabilities will be realised simultaneously.
Deferred tax assets are recognised for deductible temporary differences and unused tax losses only when it is probable that future taxable amounts will be available to utilise those temporary differences and losses.
Additional income tax expenses that arise from the distribution of cash dividends are recognised at the same time that the liability to pay the related dividend is recognised. The Group does not distribute non-cash assets as dividends to its shareholders.
Tax consolidation
CSG Limited and its Australian subsidiaries have formed an income tax consolidated group under the tax consolidation legislation on 1 July 2007. The parent entity is responsible for recognising the current tax liabilities and deferred tax assets arising in respect of tax losses, for the tax consolidated group. The tax consolidated group has also entered a tax funding agreement whereby each company in the group contributes to the income tax payable in proportion to their contribution to the net profit before tax of the tax consolidated group.
p. Research & DevelopmentResearch expenditure is recognised as an expense as incurred. Concessional tax benefits receivable in respect of eligible expenditure are recognised as income. Income is recognised with respect to concessional benefits upon confirmation and registration of eligible projects with evaluation and registration of eligible projects typically completed in the following financial year.
Costs incurred on development projects are recognised as intangible assets when it is probable that the project will, after considering its commercial and technical feasibility, be completed and generate future economic benefits and its costs can be measured reliably.
q. Discontinued operationsClassification as a discontinued operation occurs upon the disposal or when the operation meets the criteria to be classified as held for sale or distribution, if earlier.
r. Segment reportingSegment results that are reported to the CEO include items directly attributable to a segment as well as those that can be allocated on a reasonable basis. Unallocated items comprise mainly corporate assets (primarily the Company’s headquarters), head office expenses, and income tax assets and liabilities.
CSG 14|15 ANNUAL REPORT 53
For
per
sona
l use
onl
y

a. New standards adoptedDuring the year, the Group has adopted the following new standards and amendments to standards, including any consequential amendments to other standards, with a date of initial application of 1 July 2014.
i. AASB 2011-4 Key management personnel disclosures
The new standards have not had a significant effect on the Group’s disclosures and on existing financial assets and liabilities.
b. New standards and interpretations not yet adopted
A number of new standards, amendments to standards and interpretations are effective for annual periods beginning after 1 July 2014, and have not been applied in preparing these consolidated financial statements. The standards which may be relevant to the Group as set out below.
i. AASB 9 Financial Instruments (2013), AASB 9 Financial Instruments (2010) and AASB 9 Financial Instruments (2009) (together AASB 9)
AASB 9 (2009) introduces new requirements for the classification and measurement of financial assets.
Under AASB 9 (2009), financial assets are classified and measured based on the business model in which they are held and the characteristics of their contractual cash flows. AASB 9 (2010) introduces additional changes relating to financial liabilities. The IASB currently has an active project to make limited amendments to the classification and measurement requirements of AASB 9 and add new requirements to address the impairment of financial assets. AASB 9 (2013) introduces new requirements for hedge accounting. AASB 9 is effective for annual periods beginning on or after 1 January 2018. However, early adoption is permitted. The adoption of these standards is expected to have an impact on the Group’s financial assets, but no impact on the Group’s financial liabilities. The Group has not yet determined the impact on its hedging arrangements.
ii. AASB 15 Revenue Contracts (2014)
AASB15 (2014) contains a single model that applies to contracts with customers and two approaches to recognizing revenue: at a point in time or over time. The model features a contract-based five-step analysis of transactions to determine whether, how much and when revenue is recognised. AASB15 is effective for annual periods beginning or after 1 January 2018. However, early adoption is permitted.
Note 4: New Accounting Standards And Interpretations
NOTES TO THE FINANCIAL STATEMENTS 30 JUNE 2015
54
For
per
sona
l use
onl
y

Note 5: Determination Of Fair ValuesA number of the Group’s accounting policies and disclosures require the determination of fair value, for both financial and non-financial assets and liabilities.
Fair value hierarchy
In valuing financial instruments, the consolidated entity uses the following fair value measurement hierarchy that reflects the significance of the inputs used in making the measurements:
Level 1: Quoted market price (unadjusted) in an active market for an identical instrument.
Level 2: Valuation techniques based on observable inputs, either directly (i.e. as prices) or indirectly (i.e. derived from prices).
Level 3: Valuation techniques using significant unobservable inputs. This category includes all instruments where the valuation technique includes inputs not based on observable data and the unobservable inputs have a significant effect on the instrument’s valuation. There are no material level 3 financial instruments.
The fair value of financial assets and financial liabilities, other than the fair value of derivatives, approximates their carrying amounts as disclosed in the Statement of Financial Position and Notes to the financial statements. The fair value hierarchy instruments not at fair value include borrowings as level 2 and finance leases as level 3.
The fair values of the Group’s derivative financial instruments, being interest rate swaps and forward foreign exchange contracts, are categorised as Level 2 in the fair value hierarchy (2014: Level 2). The fair values are based on the market comparison technique, using broker or counterparty quotes. Similar contracts are traded in an active market and the quotes reflect the actual transactions in similar instruments. There are no significant unobservable inputs used in the valuations.
Fair value measurement
Fair values have been determined for measurement and/or disclosure purposes based on the following methods. When applicable, further information about the assumptions made in determining fair values is
disclosed in the notes specific to that asset or liability.
a. Forward exchange contracts and interest rate swaps
The fair value of forward exchange contracts is based on their quoted price, if available. If a quoted price is not available, then the fair value is estimated by discounting the difference between the contractual forward price and the current forward price for the residual maturity of the contract using a credit-adjusted risk-free interest rate (based on government bonds).
The fair value of interest rate swaps is based on broker quotes. These quotes are tested for reasonableness by discounting estimated future cash flows based on the terms and maturity of each contract and using the market interest rates for a similar instrument at the measurement date. Fair values reflect the credit risk of the instrument and include adjustments to take account of the credit risk of the Group entity and counterparty when appropriate.
b. Other non-derivative financial liabilities
Fair value, which is determined for disclosure purposes, is calculated based on the present value of future principal and interest cash flows, discounted at the market rate of interest at the reporting date. For finance leases the market rate of interest is referenced to the contract.
c. Share-based payment transactions
The fair value of the Performance Rights under the Long Term Incentive Plan are measured using Monte Carlo sampling. The fair value of the employee share options currently under issue is measured using the Black-Scholes formula. Measurement inputs include the share price on the measurement date, the exercise price of the instrument, expected volatility (based on an evaluation of the historic volatility of the Company’s share price, particularly over the historical period commensurate with the expected term), expected term of the instruments (based on historical experience and general option holder behaviour), expected dividends, and the risk-free interest rate (based on government bonds). Service and non-market performance conditions attached to the transactions are not taken into account in determining fair value.
d. Contingent considerationThe fair value of contingent consideration is calculated using the income approach based on the expected payment amounts and their associated probabilities. When appropriate, it is discounted to present value.
Note 6: Financial Risk ManagementThe major financial instruments entered into by the Group comprise short term trade receivables and payables, loans and receivables, short and long term borrowings. The Group does not have any significant financial risks in respect of trade receivables and payables. The main area of financial risk arises in respect of interest rate risk on long-term borrowings. Certain aspects of financial risk management are considered further as detailed below.
The Group is exposed to a variety of financial risks comprising:
• interest rate risk;
• credit risk;
• liquidity risk;
• foreign exchange risk; and
• fair values.
The Board of Directors has overall responsibility for identifying and managing operational and financial risks.
a. Interest rate risk
Corporate debt facility
During the year the Group negotiated a temporary increase in the limit of the Senior Debt Facility Agreement with the Commonwealth Bank of Australia (“CBA”) to a facility amount of $45m (2014: $35m). The facility limit reverts to $35m on 31 January 2016 and the maturity date remains 1 January 2017. This Facility is primarily to be used for working capital and general corporate purposes but also provides for a business card facility and a lease finance facility. Interest on the Facility is charged at a floating rate plus a margin.
Lease financing facilities – New Zealand
On 22 June 2015, Westpac New Zealand became the sole funder to the CSG Finance NZ Trust securitisation funding facility, with CBA’s commitment transferred to Westpac New Zealand on that date. The availability period for writing new business was extended
CSG 14|15 ANNUAL REPORT 55
For
per
sona
l use
onl
y

NOTES TO THE FINANCIAL STATEMENTS 30 JUNE 2015
Interest Rate Sensitivity Analysis2015
$000’s2014
$000’s
Impact on Income Statement
Impact on Equity Impact on Income Statement
Impact on Equity
Increase/ (decrease) on profit
Increase/ (decrease) on equity
Increase/ (decrease) on profit
Increase/ (decrease) on equity
Interest Rates:
100 bps increase:
Cash flow sensitivity:
Impact on interest income on cash 208 208 189 189
Impact on interest expense on loans (1,774) (1,774) (1,256) (1,256)
Impact on cash flows from derivative
1,110 1,110 818 818
Fair value sensitivity:
Impact on derivative fair value at balance date
2,729 2,729 1,554 1,554
Total impact 3,683 3,683 1,305 1,305
Interest Rates:
100 bps decrease:
Cash flow sensitivity:
Impact on interest income on cash (208) (208) (189) (189)
Impact on interest expense on loans 1,774 1,774 1,256 1,256
Impact on cash flows from derivative
(1,110) (1,110) (818) (818)
Fair value sensitivity:
Impact on derivative fair value at balance date
(2,729) (2,729) (1,554) (1,554)
Total impact (3,683) (3,683) (1,305) (1,305)
12 months until 15 April 2017, with a final maturity date of 15 April 2019. The funding limit under this facility is $85m (NZ$95m) (2014: NZ$100m) Interest on the CSG Finance NZ Trust securitisation funding facility is charged at a floating rate plus a margin, and re-prices on a monthly basis. As the finance lease receivables are predominantly fixed rate in nature, the Group enters into interest rate swaps to fix these floating rate exposures.
In addition to the CSG Finance NZ Trust securitization funding facility, the Group has funded leasing activities in New Zealand by way of finance leases with CBA through a Cash Advance Facility, also secured by finance lease receivables, operated by CSG Finance NZ (Facility 2) Limited. The facility limit is $31.3m (NZ$35.0m) (2014: NZ$35.0m). The maturity date of this facility has been extended a further 12 months to 24 January 2017. Interest on the facility is charged at a floating rate plus a margin and re-prices at specified short-term intervals.
Lease financing facilities – Australia
On 22 June 2015, Westpac became the sole funder to the CSG Finance Australia Trust securitisation funding facility, with CBA’s commitment transferred to Westpac on that date. The funding limit under this facility is $100m (2014: $65m). The availability period for writing new business was extended 12 months until 10 February 2017 and the facility matures on 10 February 2019. Interest on the CSG Finance Australia Trust securitisation funding facility is charged at a floating rate plus a margin, and re-prices generally on a quarterly basis. As the finance lease receivables are predominantly fixed rate in nature, the Group enters into interest rate swaps to fix these floating rate exposures.
In June 2015, the Group negotiated an increase in the facility limit of the Senior Facility operated by subsidiary CSG Finance Group Receivables Pty Ltd. The facility limit is $25m (2014:$15m) and the debt is secured by the finance lease receivables. The maturity date of this facility has been
extended a further 12 months to 23 January 2017. Interest on the facility is charged at a floating rate plus a margin and re-prices at specified short-term intervals (usually one month).
Financial instruments are subject to the risk that market values may change subsequent to their acquisition. In the case of interest rates, market changes will affect the cash flows of interest income and interest expense for the Company and Group. The management of the Group’s exposure to interest rates is carried out through regular monitoring of the interest re-pricing profile for both assets and liabilities of the Group. In terms of the securitisation facilities interest rate swaps are taken out by the trust entities to hedge 100% of the debt drawn to fund future cash flow equivalent to the portfolio designated “securitised” leases.
The Group’s exposure to interest rate risks and the effective interest rates of financial assets and financial liabilities, both recognised and unrecognised at the balance date, are detailed in the table provided below.
56
For
per
sona
l use
onl
y

b. Credit Risk Exposures Credit risk is the risk that a loss will be incurred if a counterparty to a transaction does not fulfill its financial obligations. Management is responsible for sanctioning large credit exposures to all customers arising from lending activities. Financial instruments that potentially subject the Group to concentrations of credit risk consist principally of cash and bank balances, finance leases receivables, trade receivables and prepayments.
The Group has a credit policy that is used to manage its exposure to credit risk. As part of this policy, limits on exposures have been set, lease agreements are subject to defined criteria, and leases are monitored on a regular basis. Maximum exposures are net of any recognised provisions. The maximum credit risk is the contract value of the leases. To control the level of credit risk taken, management evaluates each customer’s credit risk on a case by case basis. Credit risk is mitigated by the large number of clients and relatively small size of individual credit exposures.
For finance and operating leases the collateral taken on the provision of a financial facility is by way of a registered security interest over the leased asset. In some cases a personal guarantee is obtained. Loan and lease agreements provide that, if an event of default occurs, collateral will be repossessed and/or the personal guarantee invoked. The repossessed collateral is either held until overdue payments have been received or sold in the secondary market.
In addition the Company has contingent liabilities relating to buy back guarantees on certain finance contracts for the lease of copiers and multi-function devices by customers. The Company undertakes a credit approval process to determine whether it is prepared to buy back the loan on default. When a circumstance arises where the Company is required to buy back the loan, the equipment financed becomes the property of the Company.
Concentrations of Credit Risk
The Group minimises concentrations of credit risk in relation to trade receivables by undertaking transactions with a large number of customers. The print businesses have a broad range of clients across all sectors of the economy, and spread throughout all regions of Australia and New Zealand. The leasing business has a wide spread of clients across all economic sectors and regions of Australia and New Zealand. The Group does not have any
material credit risk exposure to any single debtor or group of debtors under financial instruments entered into by the consolidated entity.
Impairment
At 30 June 2015, the ageing of the trade and other receivables that were not impaired was as follows:
2015 2014
Neither past due or impaired
222,754 178,680
Past due 1 – 30 days
9,634 4,374
Past due not impaired 31 – 90 days
1,610 1,150
Past due not impaired 91+ days
1,807 372
235,805 184,576
Management believes that the unimpaired amounts that are past due by more than 30 days are still collectible in full, based on historic payment behavior and analysis of individual customer credit risk.
c. Liquidity RiskLiquidity risk is the risk that the Group will encounter difficulty in meeting the obligations associated with its financial liabilities that are settled by delivering cash or other financial assets. The Group’s approach to managing liquidity is to ensure, as far as possible, that it will have sufficient liquidity to meet its liabilities when they are due, under both normal and stressed conditions. The level of expected cash inflows from trade and lease receivables are closely monitored against the predicted outflows arising from operations. The Group has access to various financing facilities to support its lease receivables financing activities, and to provide funding for working capital and general corporate purposes. Refer to Note 25 (c) for details on the unused banking facilities.
The securitisation financing facilities in both Australia and New Zealand require the Group to contribute to credit enhancement. At 30 June 2015, this comprised 8.8% of the net pool balance of securitised leases for the New Zealand facility ($6.1m (NZ$6.8m)) and 11.6% of the net pool balances of securitised leases for the Australian facility ($10.2m).
As part of the arrangements regarding
the Cash Advance Facility and the Senior Facility, the Group is required to contribute towards credit protection reserves. The credit protection reserve of the Cash Advance Facility is a cash reserve maintained at 10% of the loan drawn to fund the lease book value (2014: 10%), and for the Senior Facility, a cash reserve of 15% of the loan drawn to fund the lease book value (2014: 15%). The cash reserve maintained for the Cash Advance Facility at balance date was $3.1m (NZ$3.5m) (2014: $2.9m (NZ $3.1m)) and for the Senior Facility $2.0m (2014: $1.0m).
The Company was in full compliance with these covenants at balance date.
Cash reserve accounts are restricted under the financing arrangements. The funds will be repaid to the Group on request if the Company has paid more than required for the Credit Protection. Once a month funds paid into the bank accounts by the lessees, which do not relate to repayment of principal balances, are returned to the Group.
d. Foreign Exchange riskThe Group operates internationally and is exposed to foreign exchange risk arising from various currency exposures, primarily with respect to the New Zealand dollar and US dollar.
Foreign exchange risk arises from future commercial transactions, recognised assets and liabilities and net investments in foreign operations.
The Company’s subsidiary, Konica Minolta Business Solutions New Zealand Limited, settles purchases of equipment predominantly in US dollars. All committed purchases are fully hedged using forward contracts or option contracts to buy US$ / sell NZ$ to protect from exchange rate movements between the shipping date and settlement. Forecast highly probable but not yet committed purchases may also be hedged using forward contracts or option contracts. Foreign exchange hedge contracts have maturities of less than one year and are designated as cash flow hedges.
As at 30 June 2015, a total of US$4.7m of forward cover was in place with an average NZ$/US$ rate of 0.7217.
The Company has hedged it’s exposure to income generated by the New Zealand businesses using purchased put options.
As at 30 June 2015, a total of NZ$17.7m of forward cover was in place at an average rate of 0.93.
CSG 14|15 ANNUAL REPORT 57
For
per
sona
l use
onl
y
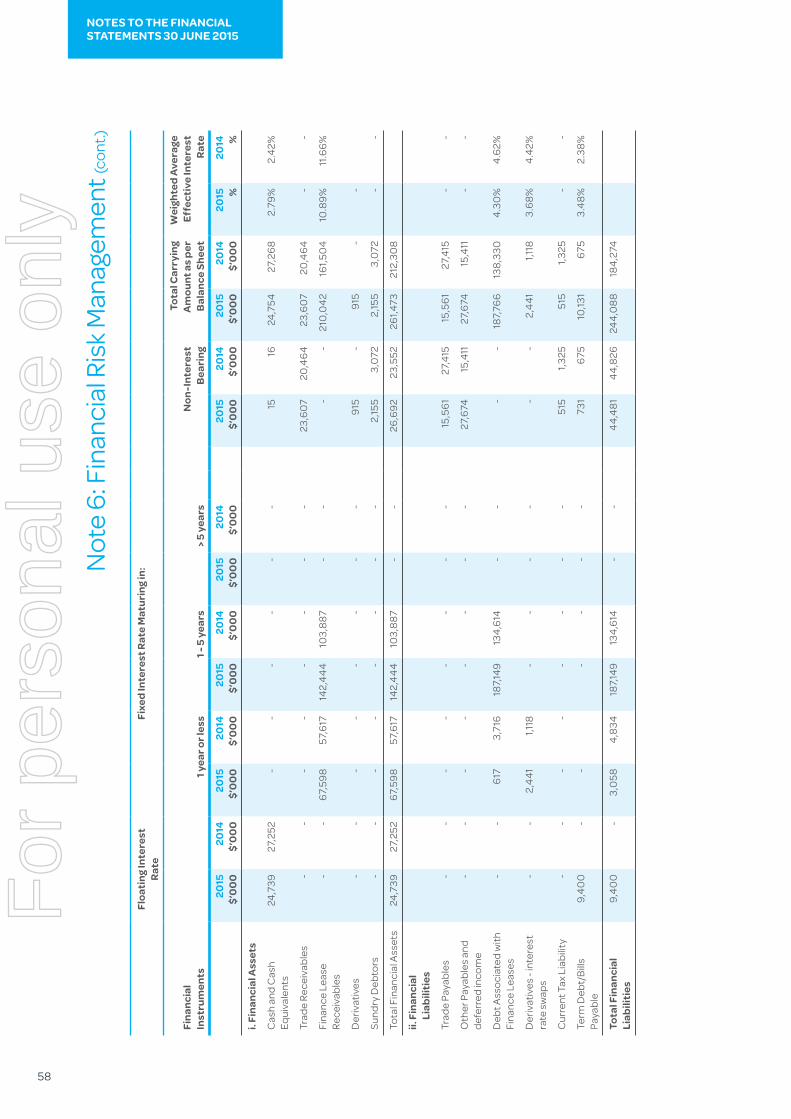
NOTES TO THE FINANCIAL STATEMENTS 30 JUNE 2015
Floa
ting
Inte
rest
Ra
te
Fi
xed
Inte
rest
Rat
e M
atur
ing
in:
Fina
ncia
l In
stru
men
ts1 y
ear o
r les
s1 -
5 y
ears
> 5 y
ears
Non
-Int
eres
t Be
arin
g
Tota
l Car
ryin
g A
mou
nt a
s per
Ba
lanc
e Sh
eet
Wei
ghte
d Av
erag
e Ef
fect
ive
Inte
rest
Ra
te
2015
$’
00
020
14
$’0
00
2015
$’
00
020
14
$’0
00
2015
$’
00
020
14
$’0
00
2015
$’
00
020
14
$’0
00
2015
$’
00
020
14
$’0
00
2015
$’
00
020
14
$’0
00
2015
%
2014
%
i. Fi
nanc
ial A
sset
s
Cas
h an
d C
ash
Equi
vale
nts
24,7
3927
,252
--
--
--
1516
24,7
5427
,268
2.79
%2.
42%
Trad
e Re
ceiv
able
s-
--
--
--
-23
,60
720
,464
23,6
07
20,4
64-
-
Fina
nce
Leas
e Re
ceiv
able
s-
-67
,598
57,6
1714
2,44
410
3,88
7-
--
-21
0,0
4216
1,50
410
.89%
11.6
6%
Der
ivat
ives
--
--
--
--
915
-91
5-
-
Sund
ry D
ebto
rs-
--
--
--
-2,
155
3,0
722,
155
3,0
72-
-
Tota
l Fin
anci
al A
sset
s24
,739
27,2
5267
,598
57,6
1714
2,44
410
3,88
7-
-26
,692
23,5
5226
1,473
212,
308
ii. F
inan
cial
Li
abili
ties
Trad
e Pa
yabl
es-
--
--
--
-15
,561
27,4
1515
,561
27,4
15-
-
Oth
er P
ayab
les
and
defe
rred
inco
me
--
--
--
--
27,6
7415
,411
27,6
7415
,411
--
Deb
t Ass
ocia
ted
with
Fi
nanc
e Le
ases
--
617
3,71
618
7,14
913
4,61
4-
--
-18
7,76
613
8,33
04.
30%
4.62
%
Der
ivat
ives
- in
tere
st
rate
sw
aps
--
2,44
11,1
18-
--
--
-2,
441
1,118
3.68
%4.
42%
Cur
rent
Tax
Lia
bilit
y-
--
--
--
-51
51,3
2551
51,3
25-
-
Term
Deb
t/B
ills
Paya
ble
9,40
0-
--
--
-73
167
510
,131
675
3.48
%2.
38%
Tota
l Fin
anci
al
Liab
iliti
es9,
400
- 3
,058
4,8
3418
7,14
913
4,61
4-
-44
,481
44,8
2624
4,0
8818
4,27
4
Not
e 6:
Fin
anci
al R
isk M
anag
emen
t (co
nt.)
58
For
per
sona
l use
onl
y

Consolidated entity
2015 $’000
2014 $’000
Revenues from continuing operations
Sales revenue
Revenue from sales of goods 103,621 83,565
Revenue from services 89,540 90,364
193,161 173,929
Other Income
Sundry 6,637 4,321
Interest rate swap income 833 1,378
Gain/(Loss) on foreign exchange (88) 509
7,382 6,208
Note 7: Revenue
CSG 14|15 ANNUAL REPORT 59
For
per
sona
l use
onl
y

NOTES TO THE FINANCIAL STATEMENTS 30 JUNE 2015
Note 8: Profit From Continuing OperationsProfit from continuing operations before income tax has been determined after the following specific expenses:
Consolidated entity
2015 $’000
2014 $’000
Changes in inventories of finished goods
Cost of goods 52,148 44,926
Cost of sales – service 34,925 33,752
Cost of sales – service (employee benefits) 18,826 19,012
Total changes in inventories of finished goods 105,899 97,690
Other expenses
Bad debts expense 811 909
Other (126) 2,343
Total other expenses 685 3,252
Depreciation and amortization
Plant and equipment 1,027 1,735
Leased property, plant and equipment 105 470
Leasehold improvements 243 325
Amortisation of customer contracts/relationships 2,266 2,267
Amortisation of intangible assets 682 278
Amortisation of borrowing costs 195 86
Total depreciation and amortisation 4,518 5,161
Finance costs
Interest 1,454 902
Bank fees 145 152
Total finance costs 1,599 1,054
60
For
per
sona
l use
onl
y

Consolidated entity
2015 $’000
2014 $’000
a. Components of tax expense:
Current tax expense in respect of the current year: 2,096 2,642
Deferred tax expense recognised in the current year 6,573 3,256
Adjustments recognised in the current year in relation to the prior year (374) (170)
Total tax expense 8,295 5,728
b. Prima facie tax payable
The prima facie tax payable on profit before income tax is reconciled to the income tax expense as follows:
Profit/loss before tax from continuing operations 22,608 17,815
Prima facie income tax payable on profit before income tax at 30% (2013: 30%) 6,782 5,345
Add tax effect of:
- other non-allowable items 1,002 1,016
- effect of different tax rates in other jurisdictions (i) (274) (338)
- share-based payments 1,141 791
- under provision for income tax in prior years (28) 10
1,841 1,479
Less tax effect of:
- other non-assessable items (328) (653)
- non-assessable group dividends (0) (443)
(328) (1,096)
Income tax expense attributable to profit 8,295 5,728
c. Deferred tax
Deferred tax relates to the following:
Deferred tax assets
The balance comprises:
Inventories 335 230
Doubtful debts 280 343
Property, plant and equipment 565 253
Accrued expenses 1,107 536
Provision for annual and long service leave 841 793
Other provisions 624 376
Research and development tax offsets 2,348 1,156
Tax losses carried forward 6,928 3,857
Share issue costs 131 345
Other 100 267
Total deferred tax assets 13,259 8,156
Note 9: Income Tax
(i) The corporate tax rate in New Zealand is 28%.
CSG 14|15 ANNUAL REPORT 61
For
per
sona
l use
onl
y
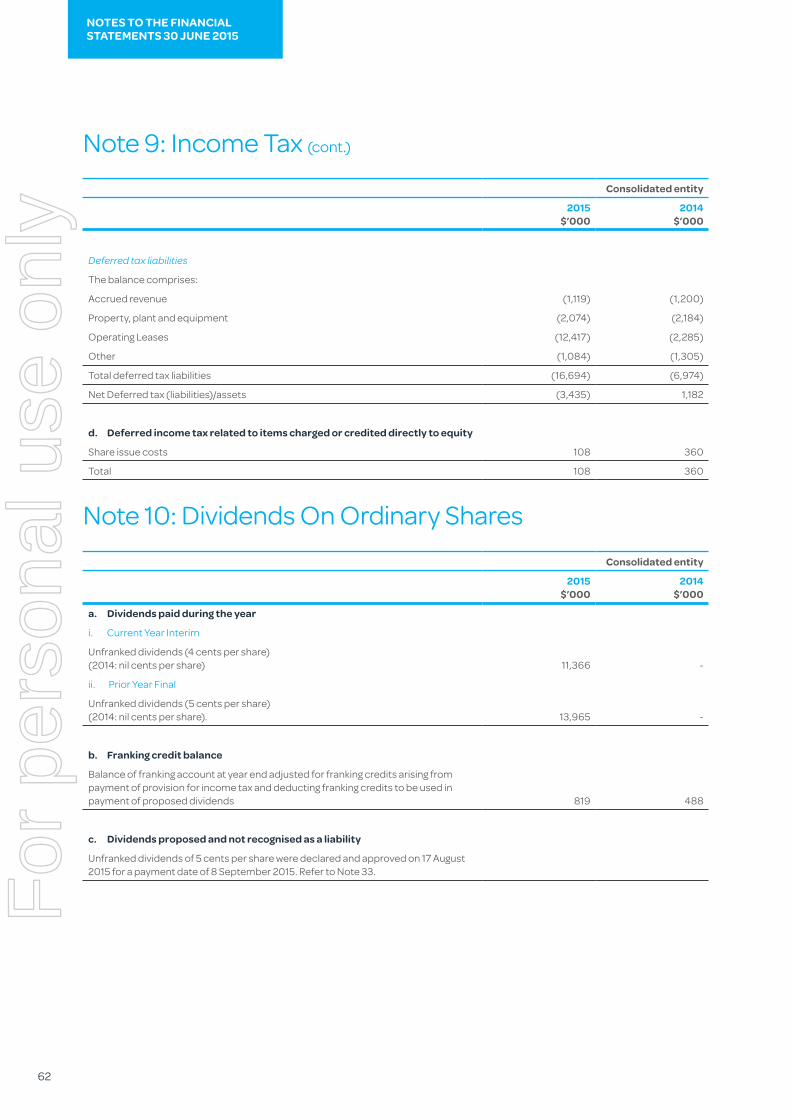
Consolidated entity
2015 $’000
2014 $’000
Deferred tax liabilities
The balance comprises:
Accrued revenue (1,119) (1,200)
Property, plant and equipment (2,074) (2,184)
Operating Leases (12,417) (2,285)
Other (1,084) (1,305)
Total deferred tax liabilities (16,694) (6,974)
Net Deferred tax (liabilities)/assets (3,435) 1,182
d. Deferred income tax related to items charged or credited directly to equity
Share issue costs 108 360
Total 108 360
Note 9: Income Tax (cont.)
NOTES TO THE FINANCIAL STATEMENTS 30 JUNE 2015
Consolidated entity
2015 $’000
2014 $’000
a. Dividends paid during the year
i. Current Year Interim
Unfranked dividends (4 cents per share) (2014: nil cents per share) 11,366 -
ii. Prior Year Final
Unfranked dividends (5 cents per share) (2014: nil cents per share). 13,965 -
b. Franking credit balance
Balance of franking account at year end adjusted for franking credits arising from payment of provision for income tax and deducting franking credits to be used in payment of proposed dividends 819 488
c. Dividends proposed and not recognised as a liability
Unfranked dividends of 5 cents per share were declared and approved on 17 August 2015 for a payment date of 8 September 2015. Refer to Note 33.
Note 10: Dividends On Ordinary Shares
62
For
per
sona
l use
onl
y
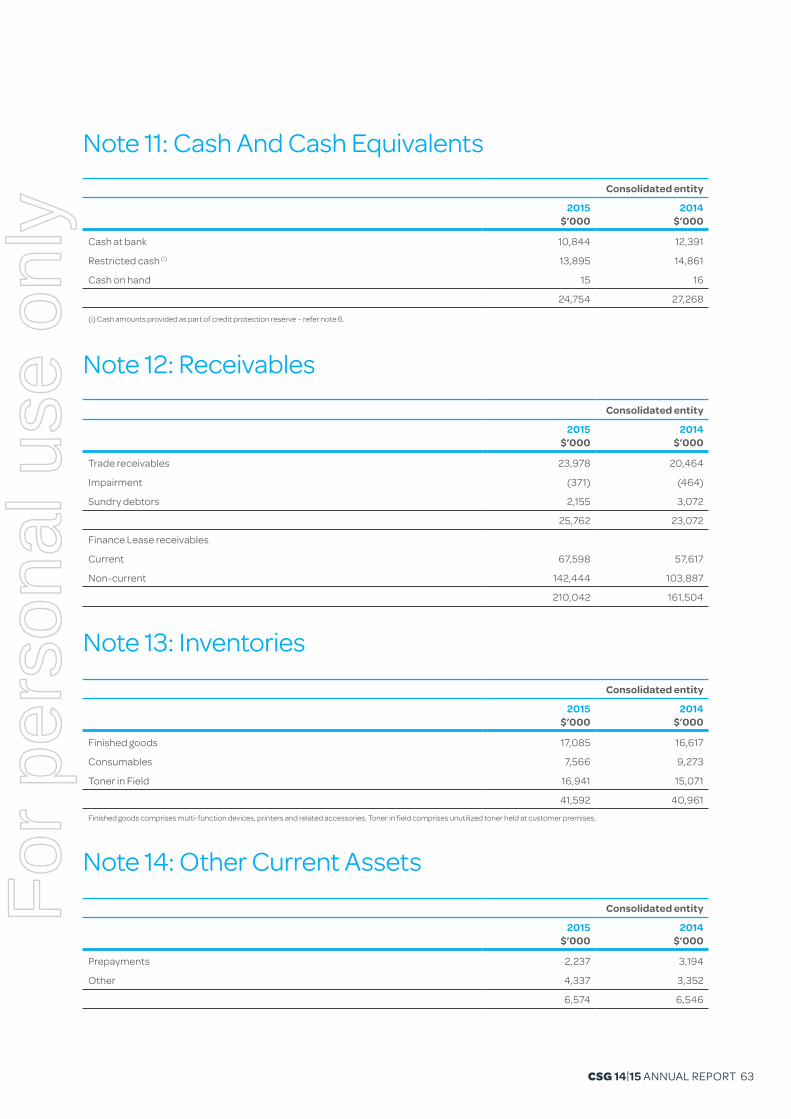
Consolidated entity
2015 $’000
2014 $’000
Cash at bank 10,844 12,391
Restricted cash (i) 13,895 14,861
Cash on hand 15 16
24,754 27,268
(i) Cash amounts provided as part of credit protection reserve – refer note 6.
Note 11: Cash And Cash Equivalents
Note 12: ReceivablesConsolidated entity
2015 $’000
2014 $’000
Trade receivables 23,978 20,464
Impairment (371) (464)
Sundry debtors 2,155 3,072
25,762 23,072
Finance Lease receivables
Current 67,598 57,617
Non-current 142,444 103,887
210,042 161,504
Note 13: InventoriesConsolidated entity
2015 $’000
2014 $’000
Finished goods 17,085 16,617
Consumables 7,566 9,273
Toner in Field 16,941 15,071
41,592 40,961
Finished goods comprises multi-function devices, printers and related accessories. Toner in field comprises unutilized toner held at customer premises.
Consolidated entity
2015 $’000
2014 $’000
Prepayments 2,237 3,194
Other 4,337 3,352
6,574 6,546
Note 14: Other Current Assets
CSG 14|15 ANNUAL REPORT 63
For
per
sona
l use
onl
y

NOTES TO THE FINANCIAL STATEMENTS 30 JUNE 2015
Note 15: Derivative AssetsConsolidated entity
2015 $’000
2014 $’000
Derivatives – Foreign currency options 915 -
915 -
Consolidated entity
Notes2015
$’0002014
$’000
Leasehold improvements
At Cost 3,102 3,093
Accumulated depreciation (2,592) (2,550)
16(a) 510 543
Plant and equipment
At Cost 791 902
Accumulated depreciation (485) (645)
16(a) 306 257
Furniture and fittings
At Cost 3,532 3,685
Accumulated depreciation (3,104) (3,004)
16(a) 428 681
Office computer equipment
At Cost 8,949 9,145
Accumulated depreciation (7,859) (8,106)
16(a) 1,090 1,039
Leased plant & equipment
At Cost 642 736
Accumulated depreciation (615) (589)
16(a) 27 147
Total written down value 2,361 2,667
Note 16: Property, Plant And Equipment
a. Reconciliation of the carrying amount of property, plant and equipment at the beginning of the year
Leasehold improvements
Carrying amount 543 693
Transfer between classes - -
Additions 216 122
Foreign currency translation (6) 53
Depreciation expense (243) (325)
510 543
64
For
per
sona
l use
onl
y
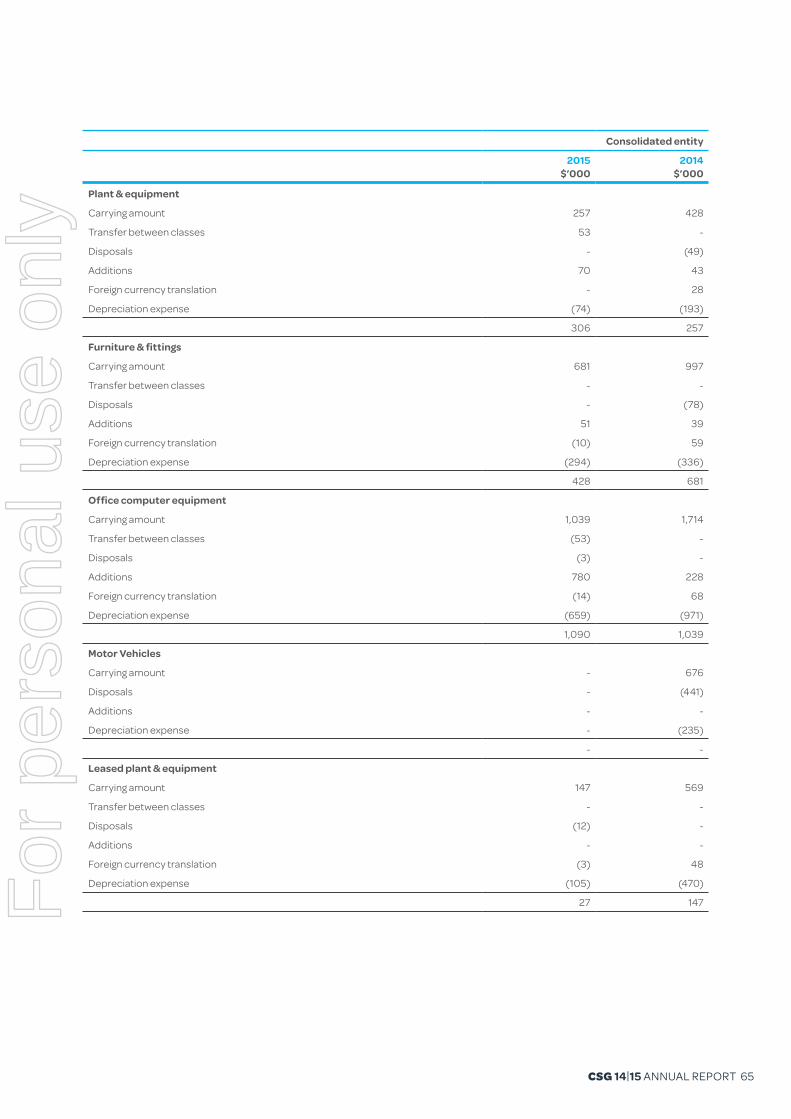
Consolidated entity
2015 $’000
2014 $’000
Plant & equipment
Carrying amount 257 428
Transfer between classes 53 -
Disposals - (49)
Additions 70 43
Foreign currency translation - 28
Depreciation expense (74) (193)
306 257
Furniture & fittings
Carrying amount 681 997
Transfer between classes - -
Disposals - (78)
Additions 51 39
Foreign currency translation (10) 59
Depreciation expense (294) (336)
428 681
Office computer equipment
Carrying amount 1,039 1,714
Transfer between classes (53) -
Disposals (3) -
Additions 780 228
Foreign currency translation (14) 68
Depreciation expense (659) (971)
1,090 1,039
Motor Vehicles
Carrying amount - 676
Disposals - (441)
Additions - -
Depreciation expense - (235)
- -
Leased plant & equipment
Carrying amount 147 569
Transfer between classes - -
Disposals (12) -
Additions - -
Foreign currency translation (3) 48
Depreciation expense (105) (470)
27 147
CSG 14|15 ANNUAL REPORT 65
For
per
sona
l use
onl
y

Consolidated entity
2015 $’000
2014 $’000
Goodwill 164,317 162,888
Net carrying amount 164,317 162,888
Opening net book amount 162,888 162,457
Adjustment to prior period acquisitions - -
Additions 1,429 431
Closing net book value 164,317 162,888
Customer Contracts/Relationships
Customer Contracts/Relationships on consolidation 31,727 31,727
Accumulated amortisation (12,000) (9,734)
Net carrying amount 19,727 21,993
Opening net book amount 21,993 24,260
Amortisation expense (2,266) (2,267)
Closing net book value 19,727 21,993
Licenses and other intangibles assets
Licenses and other intangibles at cost 10,376 6,598
Accumulated amortisation (1,187) (478)
Net carrying amount 9,189 6,120
Opening net book amount 6,120 2,054
Additions 3,946 4,344
Amortisation expense (877) (278)
Closing net book value 9,189 6,120
Total 193,233 191,001
For the purpose of impairment testing, goodwill is allocated to the Group’s operating divisions. The aggregate carrying amounts of goodwill allocated to each CGU are as follows:
NOTES TO THE FINANCIAL STATEMENTS 30 JUNE 2015
Note 17: Intangible Assets
Consolidated entity
2015 $’000
2014 $’000
Business Solutions Australia 57,388 67,268
Enterprise Solutions Australia 3,406 -
Business Solutions New Zealand 70,019 70,019
Finance Solutions Australia 9,120 1,216
Finance Solutions New Zealand 24,385 24,385
164,317 162,888
The recoverable amounts of the CGUs are based on their value in use, determined by discounting the future cash flows covering a five year period, based on financial budgets approved by the Board, plus a terminal growth rate.
66
For
per
sona
l use
onl
y

Terminal Growth Rate Discount Rate
2015 2014 2015 2014
Business Solutions Australia 2.5% 2.5% 10.2% 11.6%
Enterprise Solutions Australia 2.5% - 10.7% -
Business Solutions New Zealand 2.5% 2.5% 10.4% 10.6%
Finance Solutions Australia 2.5% 2.5% 11.3% 11.6%
Finance Solutions New Zealand 2.5% 2.5% 10.3% 10.1%
Key assumptions used in the calculation of value in use were discount rate and the EBITDA growth rate, which are listed in the table below.
The discount rate applied was a pre-tax measure based on the risk-free rate obtained from the yield on 10-year bonds issued by the government in the relevant market and in the same currency as the cash flows adjusted for a risk premium to reflect both the increased risk of investing in equities generally and the systemic risk of the specific CGU.
The Board has determined there are no reasonably possible changes that could occur in the two key assumptions that would cause the carrying amount of these CGUs to exceed their recoverable amount.
Consolidated entity
2015 $’000
2014 $’000
CURRENT
Trade payables 15,561 27,415
Other payables 27,674 15,411
43,235 42,826
Note 18: Payables
Consolidated entity
2015 $’000
2014 $’000
CURRENT
Secured
Loans and Borrowings 9,400 -
Other 731 675
10,131 675
Note 19: Short Term Borrowings
Consolidated entity
2015 $’000
2014 $’000
CURRENT
Loans and borrowings 617 3,716
617 3,716
NON - CURRENT
Loans and borrowings 187,149 134,614
187,149 134,614
Note 20: Debt Associated With Lease Receivables
CSG 14|15 ANNUAL REPORT 67
For
per
sona
l use
onl
y

NOTES TO THE FINANCIAL STATEMENTS 30 JUNE 2015
Note 21: Derivatives LiabilitiesConsolidated entity
2015 $’000
2014 $’000
NON - CURRENT
Derivatives – Interest rate swaps 2,441 1,118
2,441 1,118
Information about interest rate risk is detailed in Note 6
Consolidated entity
2015 $’000
2014 $’000
CURRENT
Employee Benefits 2,584 2,291
Other 741 863
3,325 3,154
NON - CURRENT
Employee Benefits 545 604
Other - 722
545 1,326
Note 22: Provisions
Note 23: Contributed EquityConsolidated entity
2015 $’000
2014 $’000
a. Issued and paid up capital
Ordinary shares fully paid 166,533 160,838
166,533 160,838
The Company does not have authorised capital or par value in respect of its issued shares. All issued shares are fully paid. The holders of ordinary shares are entitled to receive dividends as declared from time to time and are entitled to one vote per share at meetings of the Company.
b. Movement in shares on issue
No. of shares2015
$’000 No. of shares2014
$’000
Beginning of the financial year 278,840,492 160,838 278,155,477 172,250
Share buy-backs - - (132,583) (117)
Issued shares 4,950,328 5,653 300,000 225
Tax exempt share plan 358,019 150 517,598 -
Capital distribution - - - (11,159)
Capital raising costs deferred tax asset - (108) - (361)
Balance at the end of the year 284,148,839 166,533 278,840,492 160,838
68
For
per
sona
l use
onl
y

c. Employee Share SchemeThe Company, in accordance with its Executive Remuneration Framework, continued to offer employee participation in short-term and long-term incentive schemes as part of the remuneration packages for the employees of the companies.
d. Options All employees, including Directors, may be issued options at the discretion of the Nomination and Remuneration Committee.
The options are issued for $nil consideration and the strike price and vesting period are set by the Nomination and Remuneration Committee. The options are exercisable in two or three tranches and have an expiry period of up to three years. The total amount of issued options cannot exceed 5% of share capital. The options are not listed on the ASX and any Director issued options are approved at the Annual General Meeting.
During the 2015 financial year there were no additional options granted to employees or Directors.
Options on issue 30 June 2015:
Issued date Expiry dateExercise
priceOpening
01/07/2014 Issued Exercised LapsedClosing
30/06/2015
LTIP Issue 3 15/09/2014 $0.71 450,000 - (450,000) - -
450,000 - (450,000) - -
Options on issue 30 June 2014:
e. Performance RightsEach performance right represents an option to receive one ordinary share subject to the satisfaction or waiver of the relevant vesting conditions. No consideration is payable by the participants for the grant of the performance rights and no consideration is to be paid on the exercise of the performance rights.
Performance rights on issue at 30 June 2015:
Issued DatePerformance
Hurdle DateOpening
01/07/2014 Issued Lapsed VestedClosing
30/06/2015
LTIP Issue 5 & 7 30/11/2014 4,600,327 - (99,999) (4,500,328) -
LTIP Issue 5 & 7 30/11/2015 5,859,333 857,329 (936,381) - 5,780,281
LTIP Issue 5 & 7 30/11/2016 4,100,332 843,717 (664,666) - 4,279,383
LTIP Issue 6 01/08/2015 606,061 - - - 606,061
LTIP Issue 8 30/11/2015 - 57,143 - - 57,143
LTIP Issue 8 30/11/2016 - 564,945 - - 564,945
MAIP 1/07/2017 - 1,779,731 - - 1,779,731
Total 15,166,053 4,102,865 (1,701,046) (4,500,328) 13,067,544
Performance rights on issue at 30 June 2014:
Issued DatePerformance
Hurdle DateOpening
01/07/2013 Issued Lapsed VestedClosing
30/06/2014
LTIP Issue 5 & 7 30/11/2014 4,600,327 - - - 4,600,327
LTIP Issue 5 & 7 30/11/2015 5,859,333 - - - 5,859,333
LTIP Issue 5 & 7 30/11/2016 4,100,332 - - - 4,100,332
LTIP Issue 6 01/08/2015 606,061 - - - 606,061
LTIP Issue 4 30/06/2014 229,213 - (229,213) - -
Total 15,395,266 - (229,213) - 15,166,053
Issued date Expiry dateExercise
priceOpening
01/07/2013 Issued Exercised LapsedClosing
30/06/2014
LTIP Issue 1 and 2 01/01/2014 $1.18 - $1.23 1,020,000 - - (1,020,000) -
LTIP Issue 3 15/09/2014 $0.71 750,000 - (300,000) - 450,000
1,770,000 - (300,000) (1,020,000) 450,000
CSG 14|15 ANNUAL REPORT 69
For
per
sona
l use
onl
y

NOTES TO THE FINANCIAL STATEMENTS 30 JUNE 2015
Note 24: Reserves And Retained EarningsConsolidated entity
Notes2015
$’0002014
$’000
Share-based payment reserve 24(a) 2,065 3,466
Foreign currency translation reserve 24(b) 3,129 5,412
Cash flow hedge reserve 24(c) (2,047) 213
3,147 9,091
Retained earnings 24(d) 70,768 82,527
a. Share-based payment reserve
i. Nature and purpose of reserve
This reserve is used to record the value of equity benefit provided to employee and Directors as part of their remuneration.
ii. Movements in reserve
Balance at beginning of year 3,466 654
Equity settled transactions (1,401) 2,812
Balance at end of year 2,065 3,466
b. Foreign currency translation reserve
i. Nature and purpose of reserve
This reserve is used to record the exchange differences arising on translation of a foreign entity.
ii. Movements in reserve
Balance at beginning of year 5,412 1,894
Exchange differences on translation of foreign operations (2,283) 3,518
Balance at end of year 3,129 5,412
c. Cash flow hedge reserve
i. Nature and purpose of reserve
This reserve is used to record the effective portion of changes in the value of hedging derivatives.
ii. Movements in reserve
Balance at beginning of year 213 587
Net gains/(losses) taken to equity (2,260) (374)
Net gains/(losses) transferred to profit and loss - -
Balance at end of year (2,047) 213
d. Retained Earnings
Balance at beginning of year 82,527 71,402
Net profit attributable to members 13,572 11,125
Total available for appropriation 96,099 82,527
Dividends paid 10 (25,331) -
Balance at end of year 70,768 82,527
70
For
per
sona
l use
onl
y
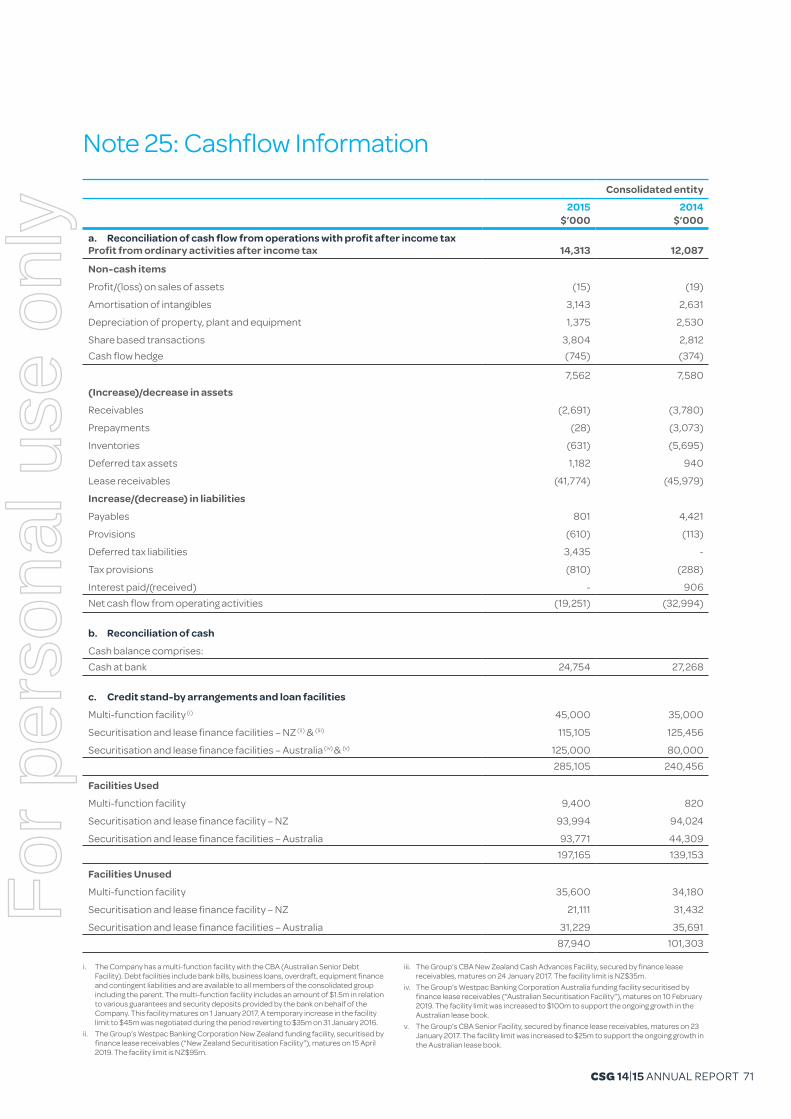
Consolidated entity
2015 $’000
2014 $’000
a. Reconciliation of cash flow from operations with profit after income taxProfit from ordinary activities after income tax 14,313 12,087
Non-cash items
Profit/(loss) on sales of assets (15) (19)
Amortisation of intangibles 3,143 2,631
Depreciation of property, plant and equipment 1,375 2,530
Share based transactions 3,804 2,812Cash flow hedge (745) (374)
7,562 7,580
(Increase)/decrease in assets
Receivables (2,691) (3,780)
Prepayments (28) (3,073)
Inventories (631) (5,695)
Deferred tax assets 1,182 940
Lease receivables (41,774) (45,979)
Increase/(decrease) in liabilities
Payables 801 4,421
Provisions (610) (113)
Deferred tax liabilities 3,435 -
Tax provisions (810) (288)
Interest paid/(received) - 906Net cash flow from operating activities (19,251) (32,994)
b. Reconciliation of cash
Cash balance comprises:Cash at bank 24,754 27,268
c. Credit stand-by arrangements and loan facilities
Multi-function facility (i) 45,000 35,000
Securitisation and lease finance facilities – NZ (ii) & (iii) 115,105 125,456
Securitisation and lease finance facilities – Australia (iv) & (v) 125,000 80,000285,105 240,456
Facilities Used
Multi-function facility 9,400 820
Securitisation and lease finance facility – NZ 93,994 94,024
Securitisation and lease finance facilities – Australia 93,771 44,309197,165 139,153
Facilities Unused
Multi-function facility 35,600 34,180
Securitisation and lease finance facility – NZ 21,111 31,432
Securitisation and lease finance facilities – Australia 31,229 35,69187,940 101,303
Note 25: Cashflow Information
i. The Company has a multi-function facility with the CBA (Australian Senior Debt Facility). Debt facilities include bank bills, business loans, overdraft, equipment finance and contingent liabilities and are available to all members of the consolidated group including the parent. The multi-function facility includes an amount of $1.5m in relation to various guarantees and security deposits provided by the bank on behalf of the Company. This facility matures on 1 January 2017. A temporary increase in the facility limit to $45m was negotiated during the period reverting to $35m on 31 January 2016.
ii. The Group’s Westpac Banking Corporation New Zealand funding facility, securitised by finance lease receivables (“New Zealand Securitisation Facility”), matures on 15 April 2019. The facility limit is NZ$95m.
iii. The Group’s CBA New Zealand Cash Advances Facility, secured by finance lease receivables, matures on 24 January 2017. The facility limit is NZ$35m.
iv. The Group’s Westpac Banking Corporation Australia funding facility securitised by finance lease receivables (“Australian Securitisation Facility”), matures on 10 February 2019. The facility limit was increased to $100m to support the ongoing growth in the Australian lease book.
v. The Group’s CBA Senior Facility, secured by finance lease receivables, matures on 23 January 2017. The facility limit was increased to $25m to support the ongoing growth in the Australian lease book.
CSG 14|15 ANNUAL REPORT 71
For
per
sona
l use
onl
y

NOTES TO THE FINANCIAL STATEMENTS 30 JUNE 2015
Note 26: Lease CommitmentsConsolidated entity
Lease expenditure commitments Notes2015
$’0002014
$’000
Operating Leases (non-cancellable)
i. Operating leases relate to the lease of land, buildings, vehicles and office computer equipment
ii. Minimum lease payments
Commitments for minimum lease payments in relation to non-cancellable operating leases are payable as follows:
No later than one year 5,176 4,815
Later than one year but not later than five years 9,496 8,701
Later than five years 4 124
14,676 13,640
Note 27: Business CombinationsDuring the year the Company purchased from Capital Finance Limited a business comprising lease receivables for total purchase consideration of $12m.
The provisional acquisition accounting had the following effect on the consolidated entity’s assets and liabilities:
2015 $’000
Assets
Finance lease receivables 10,419
Collective Provision (300)
Specific Provision (42)
Total Assets 10,077
Net identifiable assets and liabilities 10,077
Goodwill and other intangibles on acquisition 1,429
Total Consideration 11,506
Net Cash outflow 11,506
Note 28: Related Party Disclosuresa. Key Management Personnel CompensationThe key management personnel compensation comprised:
Consolidated entity
2015 In dollars
2014 In dollars
Short-term employee benefits 2,783,190 3,249,404
Post-employment benefits 97,625 110,992
Termination benefits 90,191 -
Other long-term benefits 2,052,968 1,932,330
5,023,974 5,292,726
72
For
per
sona
l use
onl
y

b. Individual Directors and executives compensation disclosuresInformation regarding individual Directors and executive’s compensation and some equity instruments disclosures as required by Corporations Regulation 2M.3.03 is provided in the Remuneration Report section of the Directors’ Report.
Apart from the details disclosed in this note, no Director has entered into a material contract with the Group since the end of the previous financial year and there were no material contracts involving Directors’ interests existing at year end.
d. Movements in SharesThe number of ordinary shares in the Company held directly, indirectly or beneficially, by each key management person, including their related parties, is as follows:
30 June 2015:
Held at 1 July 2014 Purchases
Received on Exercise of
Performance Rights Sales
Ceased as a KMP
Held at 30 June 2015
DIRECTORS
Mr. Thomas Cowan 19,924,622 - - - - 19,924,622
Mr. Philip Bullock 37,927 22,073 - - - 60,000
Mr. Ian Kew(i) 69,730 - - - (69,730) -
Mr. Stephen Anstice - 140,000 - - - 140,000
Mr. Mark Phillips - 60,000 - - - 60,000
Ms. Robin Low - 46,362 - - - 46,362
KEY MANAGEMENT
Ms. Julie-Ann Kerin - - 1,333,333 (1,200,000) - 133,333
Mr. Neil Lynch - - 533,333 (500,000) - 33,333
Mr. Declan Ramsay - - 266,667 (266,667) - -
Mr. Warwick Beban - - 266,667 - - 266,667
Mr. Stephen Birrell - - 533,333 (500,000) - 33,333
Mr. Shailendra Singh(ii) - - - - - -
20,032,279 268,435 2,933,333 (2,466,667) (69,730) 20,697,650
(i) Mr. Kew resigned as a Director and therefore ceased to be a KMP on 20 November 2014.(ii) Commenced employed on 10 December 2014. Ceased employment on 12 August 2015.
Held at 1 July 2013 Purchases
Received on Exercise of
Options SalesCeased
as a KMPHeld at
30 June 2014
DIRECTORS
Mr. Thomas Cowan 19,924,622 - - - - 19,924,622
Mr. Philip Bullock 37,927 - - - - 37,927
Mr. Ian Kew 69,730 - - - - 69,730
20,032,279 - - - - 20,032,279
30 June 2014:
Consolidated entity
2015 In dollars
2014 In dollars
Loans made by CSG Limited to controlled entities under normal terms and conditions. The aggregate amounts receivable/(payable) from controlled entities by the parent entity at the end of the reporting period were : 26,496,916 49,459,500
c. Loans to related partiesThe following table provides the total amount of transactions that were entered into with related parties for the relevant year.
CSG 14|15 ANNUAL REPORT 73
For
per
sona
l use
onl
y
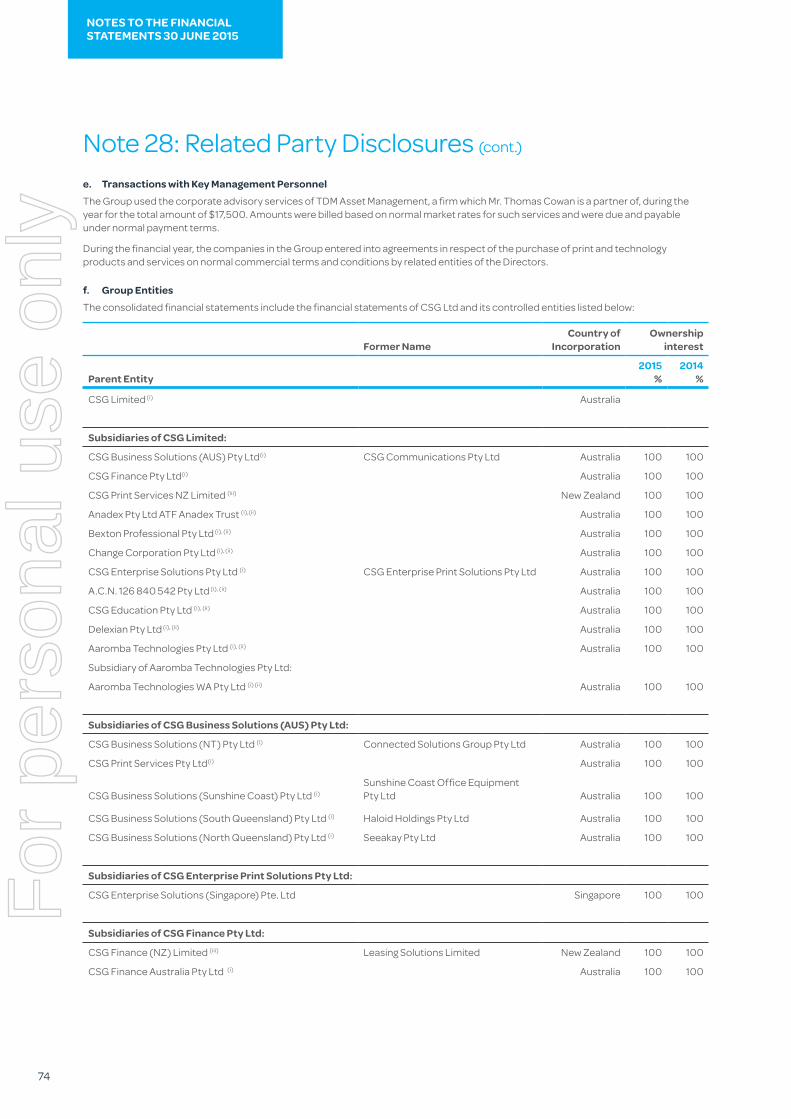
e. Transactions with Key Management PersonnelThe Group used the corporate advisory services of TDM Asset Management, a firm which Mr. Thomas Cowan is a partner of, during the year for the total amount of $17,500. Amounts were billed based on normal market rates for such services and were due and payable under normal payment terms.
During the financial year, the companies in the Group entered into agreements in respect of the purchase of print and technology products and services on normal commercial terms and conditions by related entities of the Directors.
f. Group EntitiesThe consolidated financial statements include the financial statements of CSG Ltd and its controlled entities listed below:
NOTES TO THE FINANCIAL STATEMENTS 30 JUNE 2015
Former NameCountry of
IncorporationOwnership
interest
Parent Entity2015
%2014
%
CSG Limited (i) Australia
Subsidiaries of CSG Limited:
CSG Business Solutions (AUS) Pty Ltd(i) CSG Communications Pty Ltd Australia 100 100
CSG Finance Pty Ltd(i) Australia 100 100
CSG Print Services NZ Limited (iii) New Zealand 100 100
Anadex Pty Ltd ATF Anadex Trust (i),(ii) Australia 100 100
Bexton Professional Pty Ltd (i), (ii) Australia 100 100
Change Corporation Pty Ltd (i), (ii) Australia 100 100
CSG Enterprise Solutions Pty Ltd (i) CSG Enterprise Print Solutions Pty Ltd Australia 100 100
A.C.N. 126 840 542 Pty Ltd (i), (ii) Australia 100 100
CSG Education Pty Ltd (i), (ii) Australia 100 100
Delexian Pty Ltd (i), (ii) Australia 100 100
Aaromba Technologies Pty Ltd (i), (ii) Australia 100 100
Subsidiary of Aaromba Technologies Pty Ltd:
Aaromba Technologies WA Pty Ltd (i) (ii) Australia 100 100
Subsidiaries of CSG Business Solutions (AUS) Pty Ltd:
CSG Business Solutions (NT) Pty Ltd (i) Connected Solutions Group Pty Ltd Australia 100 100
CSG Print Services Pty Ltd(i) Australia 100 100
CSG Business Solutions (Sunshine Coast) Pty Ltd (i)
Sunshine Coast Office Equipment Pty Ltd Australia 100 100
CSG Business Solutions (South Queensland) Pty Ltd (i) Haloid Holdings Pty Ltd Australia 100 100
CSG Business Solutions (North Queensland) Pty Ltd (i) Seeakay Pty Ltd Australia 100 100
Subsidiaries of CSG Enterprise Print Solutions Pty Ltd:
CSG Enterprise Solutions (Singapore) Pte. Ltd Singapore 100 100
Subsidiaries of CSG Finance Pty Ltd:
CSG Finance (NZ) Limited (iii) Leasing Solutions Limited New Zealand 100 100
CSG Finance Australia Pty Ltd (i) Australia 100 100
Note 28: Related Party Disclosures (cont.)
74
For
per
sona
l use
onl
y

Former NameCountry of
IncorporationOwnership
interest
Parent Entity2015
%2014
%
Subsidiaries of CSG Finance Australia Pty Ltd:
CSG Finance Group Receivables Pty Ltd(i) Australia 100 100
CSG Finance Australia Trust Australia 100 100
Subsidiaries of CSG Print Services NZ Limited:
CSG Business Solutions Limited (iii) CSG Management Services Limited New Zealand 100 100
Konica Minolta Business Solutions New Zealand Limited New Zealand 90 90
Ubix Business Solutions Limited (iii) New Zealand 100 100
Subsidiaries of CSG Finance (NZ) Limited: Leasing Solutions Limited
CSG Finance (NZ Facility 2) Limited (iii) Onesource Finance Limited New Zealand 100 100
CSG Finance (NZ Warehouse) Limited (iii) Solutions Group Receivables Limited New Zealand 100 100
CSG Finance New Zealand Trust New Zealand 100 100
(i) CSG Limited and its Australian subsidiaries are part of a tax consolidated group.(ii) Dormant company which historically held assets and liabilities for the Technology Solutions Division which was sold in 2012. Member’s voluntary liquidation is currently underway. (iii) Form part of a NZ tax consolidated group.
CSG Limited and its Australian wholly owned subsidiaries (excluding CSG Finance Entities) are parties to a Deed of Cross Guarantee under which each company guarantees the debts of others.
By entering into the Deed, the participating wholly owned entities have been relieved of the requirements to prepare financial reports and Director’s Report under the Class Order 98/1418 (as amended by Class Orders 98/2017, 00/0321 and 01/1087)
issued by the Australian Securities and Investment Commission.
The above companies represent a ‘Closed Group’ for the purpose of the Class Order, and there are no other parties to the Deed of Cross Guarantee that are controlled by CSG Limited, that also represent the ‘Extended Closed Group’. Those wholly owned subsidiaries which are included in the Deed of Cross Guarantee are exempt from preparing a financial report and
Director’s Report under the terms of ASIC Class Order 98/1418 and the Corporations Act 2001.
A consolidated Income Statement, consolidated Statement of Comprehensive Income and consolidated Statement of Financial Position, comprising the Company and controlled entities which are a party to the Deed, after eliminating all transactions between parties to the Deed of Cross Guarantee is set out as follows:
Note 29: Deed Of Cross Guarantee
2015 $’000
2014 $’000
Income Statement
Revenue and income 102,331 84,004
Operating expenses (95,462) (85,797)
Profit/(loss) before income tax expense 6,869 (1,793)
Income tax expense (3,446) 552
Net profit/(loss) 3,423 (2,345)
Statement of Other Comprehensive Income and Retained Earnings
Profit/(loss) for the period 3,423 (2,345)
Other comprehensive income - -
Total comprehensive income for the period 3,423 (2,345)
Retained earnings at the beginning of the year 66,128 68,473
Dividends distributed (25,331) -
Retained earnings at the end of the year 44,220 66,128
CSG 14|15 ANNUAL REPORT 75
For
per
sona
l use
onl
y

NOTES TO THE FINANCIAL STATEMENTS 30 JUNE 2015
Note 29: Deed Of Cross Guarantee (cont.)
Consolidated entity
2015 $’000
2014 $’000
Statement of Financial Position
Current assets
Cash and cash equivalents - 3,102
Trade and other receivables 14,541 18,888
Inventories 23,045 21,827
Lease receivables - -
Other current assets 3,362 3,241
Total current assets 40,948 47,058
Non-current assets
Lease receivables - -
Property, plant and equipment 1,337 1,011
Deferred tax assets - 572
Intangible assets 28,793 27,990
Goodwill 68,484 68,484
Investment in subsidiaries 116,682 116,638
Total non-current assets 215,296 214,695
Total assets 256,244 261,753
Current liabilities
Bank overdraft 2,038 -
Trade and other payables 26,109 26,030
Deferred income 95 435
Borrowings 9,400 674
Debt associated with lease receivables - -
Deferred tax liability 1,286 -
Provisions 1,874 783
Total current liabilities 40,802 27,922
Non-current liabilities
Debt associated with lease receivables - -
Provisions 436 1,212
Total non-current liabilities 436 1,212
Total liabilities 41,238 29,134
Net assets 215,006 232,619
Equity
Share capital 169,279 163,583
Reserves 1,507 2,908
Retained earnings 44,220 66,128
Total equity 215,006 232,619
76
For
per
sona
l use
onl
y

Consolidated entity
2015 $’000
2014 $’000
The following reflects the income and share data used in the calculations of basic and diluted earnings per share:
Profit/(loss) 14,313 12,087
Note 30: Earnings Per Share
Consolidated entity
2015 $’000
2014 $’000
Auditors remuneration parent entity
Amount received or due and receivable to KPMG:
Statutory audits and reviews (excluding disbursements) 217,193 174,000
Other services (excl. disbursements) 98,659 53,700
315,852 227,700
Auditors remuneration overseas subsidiaries
Amount received or due and receivable to KPMG:
Statutory audits and reviews (excluding disbursements) 131,604 140,893
Other services (excl. disbursements) - -
131,604 140,893
Note 31: Auditors Remuneration
a. Description of SegmentsManagement has determined the operating segment based on reports reviewed by the Chief Executive Officer and the Group Executive (comprising the Chief Financial Officer and Group General Managers) for making strategic decisions. The Chief Executive Officer and the Group Executive monitor the business based on product/service factors and have identified the following reportable segments:
1. Business Solutions
CSG Business Solutions provides the sale, support, service and financing of print and business technology
equipment to customers across Australia and New Zealand. CSG Enterprise Solutions provides managed service based print and technology solutions for Tier 1 enterprise, education and government customers also in Australia and New Zealand. CSG Enterprise Solutions is still in its growth phase in terms of developing and building a pipeline of potential business and therefore will be grouped with Business Solutions for the purpose of segment reporting.
Management has determined that the Australian and New Zealand businesses are separate operating segments but due to their similarity in terms of product
and service offerings in addition to the methods used to distribute products across both geographies these business units will be aggregated for the purposes of segment reporting.
2. Finance Solutions
CSG Finance Solutions is a specialist service provider of lease and rental products for business technology assets sold and serviced by CSG in both Australia and New Zealand.
3. Other
The remaining business operations/activities (including corporate office activities) are classified as ‘Other’ to facilitate reconciliation to Group results.
Note 32: Segment Information
Consolidated entity
2015 No. of Shares
2014 No. of Shares
Weighted average number of ordinary shares used in calculating basic earnings per share 282,690,782 278,813,811
Effect of dilutive securities:
Effect of performance rights and options issued 13,205,393 15,616,061
Weighted average number of ordinary shares and potential ordinary shares used as the denominator in calculating diluted earnings per share 295,896,176 294,429,872
CSG 14|15 ANNUAL REPORT 77
For
per
sona
l use
onl
y

NOTES TO THE FINANCIAL STATEMENTS 30 JUNE 2015
Note 32: Segment Information (cont.)
Business Solutions
$’000Finance
$’000Other $’000
Eliminations $’000
Total $’000
2015
Segment revenue
External segment revenue 199,223 24,251 816 - 224,290
Inter- segment revenue - - 287 (287) -
Total 199,223 24,251 1,103 (287) 224,290
Segment result
Interest revenue 874 - 52 (815) 111
Interest expense 293 246 4,021 (2,961) 1,599
Depreciation & amortisation 2,135 214 2,169 - 4,518
Total segment Profit/(loss) before income tax
26,422 7,650 (10,989) (475) 22,608
Total Segment Assets (i) 200,152 268,128 208,645 (171,692) 505,233
Total Segment Liabilities (i) 53,943 192,498 5,047 - 251,488
b. Segment Information
Business Solutions
$’000Finance
$’000Other $’000
Eliminations $’000
Total $’000
2014
Segment revenue
External segment revenue 178,533 20,375 417 - 199,325
Inter-segment revenue - 1,507 - (1,507) -
Total 178,533 21,882 417 (1,507) 199,325
Segment result
Interest revenue 60 - 88 - 148
Interest expense 427 20 607 - 1,054
Depreciation & amortisation 2,709 650 1,802 - 5,161
Total segment Profit/(loss) before income tax 20,050 10,518 (11,246) (1,507) 17,815
Total Segment Assets (i) 196,610 215,221 213,178 (170,664) 454,201
Total Segment Liabilities (i) 46,368 139,870 2,951 - 189,189(i) Excludes loans to and from CSG Group entities (related parties).
c. Geographical InformationCSG’s reporting segments provide sales, support, service and financing to more than 20,000 customers across Australia and New Zealand.
In presenting information on the basis of geographical segments, segment revenue is based on the geographical location of customers and segment assets are based on the geographical location of the assets.
Australia $’000
New Zealand $’000
Eliminations $’000
Total $’000
2015
Revenue 110,359 114,218 (287) 224,290
Assets 400,932 275,993 (171,692) 505,233
2014
Revenue 88,005 112,827 (1,507) 199,325
Assets 376,893 356,647 (279,339) 454,201
78
For
per
sona
l use
onl
y
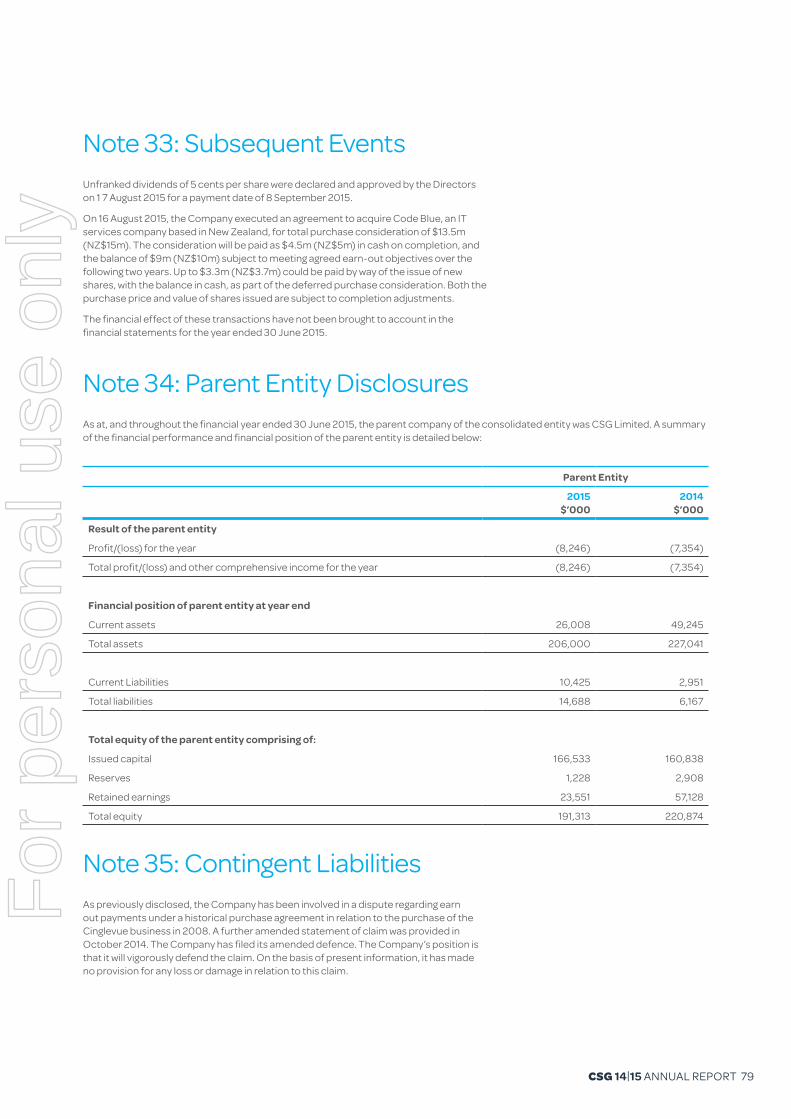
Note 33: Subsequent Events Unfranked dividends of 5 cents per share were declared and approved by the Directors on 1 7 August 2015 for a payment date of 8 September 2015.
On 16 August 2015, the Company executed an agreement to acquire Code Blue, an IT services company based in New Zealand, for total purchase consideration of $13.5m (NZ$15m). The consideration will be paid as $4.5m (NZ$5m) in cash on completion, and the balance of $9m (NZ$10m) subject to meeting agreed earn-out objectives over the following two years. Up to $3.3m (NZ$3.7m) could be paid by way of the issue of new shares, with the balance in cash, as part of the deferred purchase consideration. Both the purchase price and value of shares issued are subject to completion adjustments.
The financial effect of these transactions have not been brought to account in the financial statements for the year ended 30 June 2015.
Note 34: Parent Entity Disclosures As at, and throughout the financial year ended 30 June 2015, the parent company of the consolidated entity was CSG Limited. A summary of the financial performance and financial position of the parent entity is detailed below:
Parent Entity
2015 $’000
2014 $’000
Result of the parent entity
Profit/(loss) for the year (8,246) (7,354)
Total profit/(loss) and other comprehensive income for the year (8,246) (7,354)
Financial position of parent entity at year end
Current assets 26,008 49,245
Total assets 206,000 227,041
Current Liabilities 10,425 2,951
Total liabilities 14,688 6,167
Total equity of the parent entity comprising of:
Issued capital 166,533 160,838
Reserves 1,228 2,908
Retained earnings 23,551 57,128
Total equity 191,313 220,874
Note 35: Contingent LiabilitiesAs previously disclosed, the Company has been involved in a dispute regarding earn out payments under a historical purchase agreement in relation to the purchase of the Cinglevue business in 2008. A further amended statement of claim was provided in October 2014. The Company has filed its amended defence. The Company’s position is that it will vigorously defend the claim. On the basis of present information, it has made no provision for any loss or damage in relation to this claim.
CSG 14|15 ANNUAL REPORT 79
For
per
sona
l use
onl
y
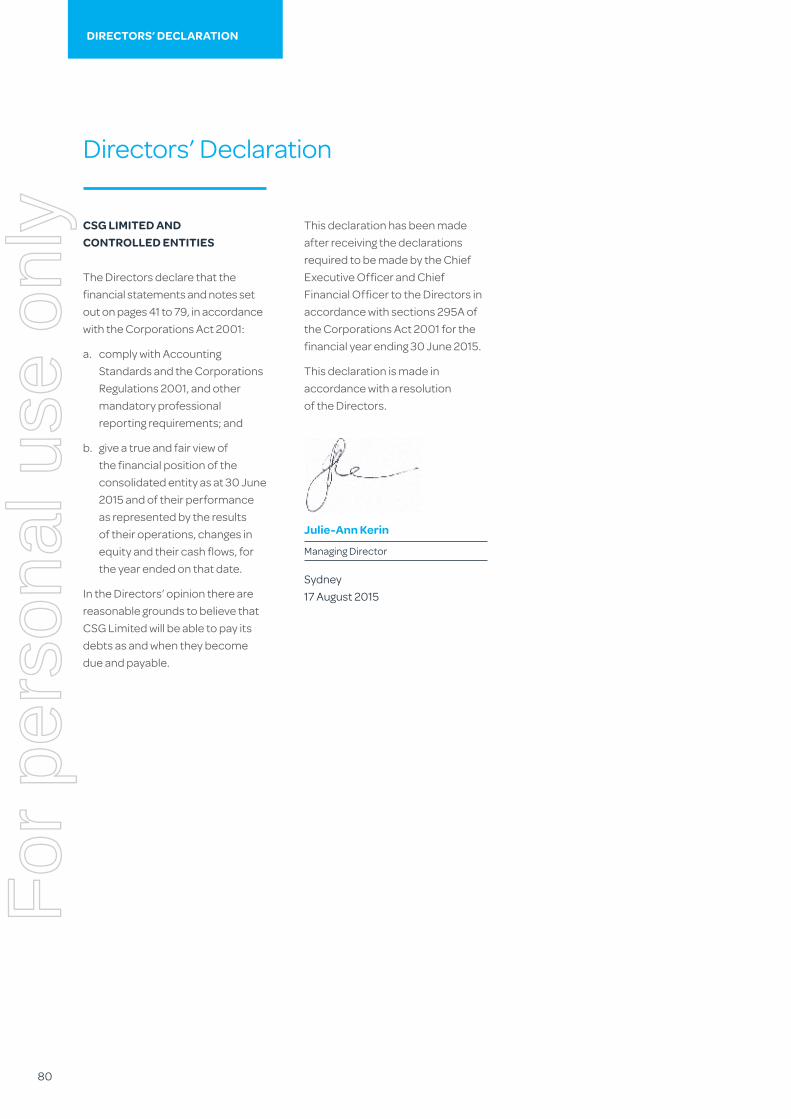
CSG LIMITED AND CONTROLLED ENTITIES
The Directors declare that the financial statements and notes set out on pages 41 to 79, in accordance with the Corporations Act 2001:
a. comply with Accounting Standards and the Corporations Regulations 2001, and other mandatory professional reporting requirements; and
b. give a true and fair view of the financial position of the consolidated entity as at 30 June 2015 and of their performance as represented by the results of their operations, changes in equity and their cash flows, for the year ended on that date.
In the Directors’ opinion there are reasonable grounds to believe that CSG Limited will be able to pay its debts as and when they become due and payable.
This declaration has been made after receiving the declarations required to be made by the Chief Executive Officer and Chief Financial Officer to the Directors in accordance with sections 295A of the Corporations Act 2001 for the financial year ending 30 June 2015.
This declaration is made in accordance with a resolution of the Directors.
Julie-Ann Kerin
Managing Director
Sydney17 August 2015
Directors’ Declaration
DIRECTORS’ DECLARATION
80
For
per
sona
l use
onl
y

IndependentAuditor’s Report
CSG 14|15 ANNUAL REPORT 81
For
per
sona
l use
onl
y
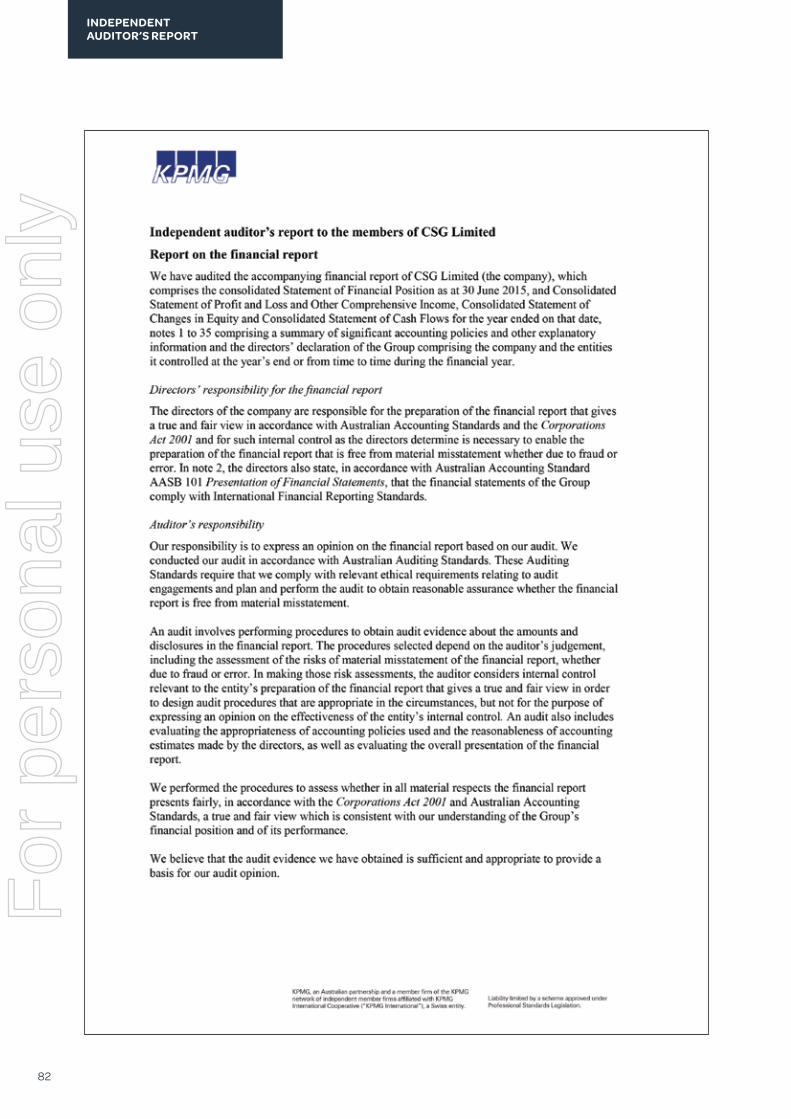
INDEPENDENTAUDITOR’S REPORT
82
For
per
sona
l use
onl
y

CSG 14|15 ANNUAL REPORT 83
For
per
sona
l use
onl
y

In accordance with Listing Rule 4.10 of the Australian Securities Exchange Limited, the Directors provide the following shareholding information as at 8 September 2015.
SHAREHOLDING INFORMATION
Shareholding Information as at 8 September 2015
NameNumber of
Ordinary Shares% of
Ordinary Shares
Caledonia (Private) Investments Pty Limited & its associates 74,654,386 24.41
Paradice Investment Management Pty Ltd 21,548,563 7.71
TDM Asset Management Pty Limited & its associates 19,924,622 7.14
Substantial Shareholders
Voting RightsFully paid ordinary shares in the Company carry voting rights of one vote per share.
Range Total holdersNumber of
Ordinary Shares% of
Issued Capital
1 - 1,000 512 161,960 0.05
1,001 - 5,000 607 1,847,050 0.60
5,001 - 10,000 340 2,621,265 0.86
10,001 - 100,000 450 13,757,990 4.50
100,001 - and over 84 287,493,396 93.99
Total 1,993 305,881,661 100.00
Distribution of Shareholding
Less than Marketable Parcels313 shareholders hold less than a marketable parcel of shares, being a market value of less than $500.
Twenty Largest Shareholders
NameNumber of Shares
at 8 September 2015 % of
Issued CapitalHSBC CUSTODY NOMINEES (AUSTRALIA) LIMITED 55,480,994 18.14UBS NOMINEES PTY LTD 41, 176,723 13.46NATIONAL NOMINEES LIMITED 30, 430,585 9.95J P MORGAN NOMINEES AUSTRALIA LIMITED 27, 4 1 1,688 8.96CITICORP NOMINEES PTY LIMITED 21,239,859 6.94UBS WEALTH MANAGEMENT AUSTRALIA NOMINEES PTY LTD 19,205, 123 6.28NATIONAL NOMINEES LIMITED<DB A/C> 16,622, 153 5.43RBC INVESTOR SERVICES AUSTRALIA PTY LIMITED <VFA A/C> 11,220,586 3.67LYNDEN INVESTMENTS NT PTY LTD <THE MACKENZIE FAMILY A/C> 8, 116,228 2.65MANDERRAH PTY LTD <WILLIAM VICARS S/FUND A/C> 6, 352,055 2.08HSBC CUSTODY NOMINEES (AUSTRALIA) LIMITED <NT-COMNWLTH SUPER CORP A/C> 5, 341, 362 1.75HSBC CUSTODY NOMINEES (AUSTRALIA) LIMITED-GSCO ECA 4,436, 803 1.45BOLTEC PTY LTD <BOLLER FAMILY A/C> 4, 410, 915 1.44BOND STREET CUSTODIANS LIMITED<LAMAN-DO5019 A/C> 3,267,466 1.07BNP PARIBAS NOMS PTY LTD<DRP> 2,554, 914 0.84AMCIL LIMITED 2, 221, 045 0.73AMP LIFE LIMITED 1, 980, 918 0.65RBC INVESTOR SERVICES AUSTRALIA NOMINEES PTY LIMITED <BKCUST A/C> 1,888,509 0.62CITICORP NOMINEES PTY LIMITED<COLONIAL FIRST STATE INV A/C> 1,860, 277 0.61MIRRABOOKA INVESTMENTS LIMITED 1, 793, 955 0.59
Total 267,012,158 87.29
On-Market Buy-BackThere is no current on-market buy-back, a previous buy-back having expired on 29 April 2015.
84
For
per
sona
l use
onl
y

Corporate Directory
CORPORATE DIRECTORY
Registered OfficeLevel 1357 Collins StreetMelbourne VIC 3000
Phone +61 7 3840 1234Fax +61 7 3840 1222www.csg.com.au
DirectorsTom CowanNon-Executive Chairman
Julie-Ann KerinManaging Director
Stephen AnsticeNon-Executive Director
Philip BullockNon-Executive Director
Robin LowNon-Executive Director
Mark PhillipsNon-Executive Director
Company SecretaryChristopher Lobb
Share RegistryComputershare Investor Services Pty Limited
452 Johnston StreetAbbotsford VIC 3067
Phone 1300 850 505www.computershare.com
AuditorKPMG71 Eagle StreetBrisbane QLD 4000
CSG Limited ABN 64 123 989 631
CSG 14|15 ANNUAL REPORT 85
For
per
sona
l use
onl
y

86
CSG OVERVIEW
UNRIVALLED CUSTOMER CARECustomer care and lifetime relationships are at the heart of everything we do. So we go further, to be better.
TECHNOLOGY & INNOVATIONAt CSG, innovation and great thinking is expected. We seek and supply the best software and digital solutions to make your business more efficient and productive.
EXPERT INDEPENDENT ADVICECSG provides indepth expert analysis objectively without bias. We are independent and create value because we are solutions focused. So you can expect more with CSG.
LOCAL NOT GLOBALOf the top five providers, only CSG is Australian owned with headquarters in Australia and New Zealand. This means faster response and decision making, greater efficiencies and unequalled customer care.
MULTIPLE BRANDS, NOT A CHOICE OF ONEWhen you engage with CSG we recommend the best solution(s) for you, irrespective of the brand name. We are not manufacturers so we are not limited by product - you shouldn’t be either.
CSG MAKES YOUR BUSINESS OUR BUSINESSCSG takes the time to understand your business, industry and unique challenges. We tailor our solutions to meet your specific needs. Because we know one size does not fit all.
PROACTIVE, NEVER COMPLACENTCSG’s proven success over the last 20 years is based on making things happen and a can do attitude. We actively engage and always stay one step ahead.
FLEXIBLE FINANCE FACILITATIONFunding your new equipment shouldn’t be a hassle. CSG Finance removes the barriers and opens the door to flexible financial solutions - the right ones that suit you.
SUSTAINABILITY & CSRThe CSG commitment to corporate social responsibility and sustainability is firmly entrenched in our policies and culture. We demonstrate this in deeds and actions - not just words.
QUALITY & SERVICE GUARANTEEAt CSG we stand behind our products and services with our 5 year guarantee. We aim to deliver more than you expect so you can always be confident with CSG.
CSGCustomer Imperatives
For
per
sona
l use
onl
y

CSG 14|15 ANNUAL REPORT 87
For
per
sona
l use
onl
y

csg.com.au
For
per
sona
l use
onl
y