Australian Office of Financial Management - Treasury.gov.au · The AOFM supports and advances...
162
Australian Office of Financial Management Annual Report 2016-17
-
Upload
nguyenthien -
Category
Documents
-
view
212 -
download
0
Transcript of Australian Office of Financial Management - Treasury.gov.au · The AOFM supports and advances...

Australian Office of Financial Management
Annual Report
2016-17

© Commonwealth of Australia 2017
ISSN 2204-0838 (print) ISSN 2204-0846 (online)
This publication is available for your use under a Creative Commons BY Attribution 3.0 Australia licence, with the exception of the Commonwealth Coat of Arms, the AOFM logo, images, signatures, and information sourced from the Reserve Bank of Australia, Australian Bureau of Statistics, Australian Financial Markets Association and the Australian Securities Exchange, and where otherwise stated. The full licence terms are available from http://creativecommons.org/licenses/by/3.0/au/legalcode.
Use of AOFM material under a Creative Commons BY Attribution 3.0 Australia licence requires you to attribute the work (but not in any way that suggests that the AOFM endorses you or your use of the work).
Australian Office of Financial Management material used ‘as supplied’
Provided you have not modified or transformed AOFM material in any way including, for example, by changing the AOFM text; calculating percentage changes; graphing or charting data; or deriving new statistics from published AOFM statistics — then the AOFM prefers the following attribution:
Source: The Australian Government the Australian Office of Financial Management
Derivative material
If you have modified or transformed AOFM material, or derived new material from those of the AOFM in any way, then the AOFM prefers the following attribution:
Based on The Australian Government the Australian Office of Financial Management data
Use of the Coat of Arms
The terms under which the Coat of Arms can be used are set out on the It’s an Honour website (see www.itsanhonour.gov.au)
Other uses
Enquiries regarding this licence and any other use of this document are welcome at:
Communications Officer Australian Office of Financial Management Treasury Building, Newlands Street Parkes ACT 2600 Email: [email protected]
Printed by CanPrint Communications Pty Ltd.

Treasury Building Newlands Street CANBERRA ACT 2600 Telephone: (61-2) 6263 1111 Facsimile: (61-2) 6263 1222
11 October 2017 The Hon Scott Morrison MP Treasurer Parliament House CANBERRA ACT 2600
Dear Treasurer
I have pleasure in presenting the Annual Report of the Australian Office of Financial Management for the year ending 30 June 2017 for presentation to the Parliament.
The Report has been prepared in accordance with section 46 of the Public Governance, Performance and Accountability Act 2013.
Part 2 Performance of this Annual Report includes the Australian Office of Financial Management Annual Performance Statement, which is prepared in accordance with section 39 of the Public Governance, Performance and Accountability Act 2013. In my opinion this Annual Performance Statement accurately reflects the Australian Office of Financial Management’s performance for 2016-17.
Yours sincerely
Rob Nicholl Chief Executive Officer


The AOFM supports and advances Australia’s economic growth and stability, and the effective operation of its financial markets, through issuing debt, investing in financial assets and managing that debt and those investments for the Government
ITS ROLE
v

vii
CONTENTS
Review by the Chief Executive Officer ....................................................................... xi Context............................................................................................................................................... xiii Debt issuance and market development ....................................................................................... xiv Portfolio management ...................................................................................................................... xv Residential mortgage-backed securities ......................................................................................... xv Looking ahead .................................................................................................................................. xvi
Part 1: AOFM overview ................................................................................................. 1 Role, function, outcome and program structure ............................................................................. 3 Organisational structure ..................................................................................................................... 4
Part 2: Performance and outcomes............................................................................. 5 Introduction ......................................................................................................................................... 7 Section 1: Annual Performance Statement ....................................................................................... 7 Section 2: Outcomes ............................................................................................................................ 9 Bond issuance .................................................................................................................................... 10 Debt portfolio management ............................................................................................................. 20 Cash management ............................................................................................................................. 28 Residential mortgage-backed securities ......................................................................................... 32 Market engagement .......................................................................................................................... 35
Part 3: Management and accountability ................................................................... 39 Governance of the AOFM ................................................................................................................ 41 Overview of accountabilities ........................................................................................................... 41 Committees ........................................................................................................................................ 42 Management of fraud risk ................................................................................................................ 44 Enterprise risk .................................................................................................................................... 44 Business continuity arrangements .................................................................................................. 45 Assurance ........................................................................................................................................... 46 Judicial decisions ............................................................................................................................... 47 External reports on agency operations ........................................................................................... 47 Management of human resources ................................................................................................... 47 Consultants ........................................................................................................................................ 51 Purchasing .......................................................................................................................................... 51 ANAO access clauses and exempt contracts ................................................................................. 52 Procurement initiatives to support small business ....................................................................... 52

Contents
viii
Part 4: Financial statements ...................................................................................... 55 Independent Auditor’s Report ........................................................................................................ 57 Statement by the Chief Executive Officer and Chief Financial Officer ...................................... 60 Administered schedule of comprehensive income ....................................................................... 61 Administered schedule of assets and liabilities ............................................................................ 63 Administered reconciliation schedule ............................................................................................ 64 Administered schedule of cash flows ............................................................................................. 65 Statement of comprehensive income .............................................................................................. 66 Statement of financial position ........................................................................................................ 67 Statement of changes in equity ........................................................................................................ 68 Statement of cash flows .................................................................................................................... 69 Basis of preparation of the financial statements ............................................................................ 70 Objectives and activities of the AOFM ........................................................................................... 73 Administered Notes .......................................................................................................................... 75 Departmental Notes ........................................................................................................................ 104
Part 5: Other information .......................................................................................... 117 Agency financial performance ....................................................................................................... 119 Agency resource statement and resources for outcomes ........................................................... 119 Grant programs ............................................................................................................................... 121 Advertising and market research .................................................................................................. 121 Freedom of information ................................................................................................................. 121 Ecologically sustainable development ......................................................................................... 122 Management structure of the AOFM’s debt and assets ............................................................. 122 AGS issuance for 2016-17 ............................................................................................................... 123
Glossary ..................................................................................................................... 129
Acronyms ................................................................................................................... 139
Index of compliance with requirements ................................................................. 141
Contact details ........................................................................................................... 144 Enquiries ........................................................................................................................................... 144 Internet address ............................................................................................................................... 144
Index ........................................................................................................................... 145

Contents
ix
LIST OF TABLES
Part 2: Performance and outcomes............................................................................. 5 Table 1: Annual Performance Statement 2016-17 ............................................................................ 8 Table 2: Summary of Treasury Bond tender results ..................................................................... 18 Table 3: Commonwealth debt and assets administered by the AOFM ...................................... 27 Table 4: Summary of investor relations activities in 2016-17 ....................................................... 38
Part 3: Management and accountability ................................................................... 39 Table 1: Audit Committee meetings for 2016-17 ........................................................................... 43 Table 2: Operative and paid inoperative staff as at 30 June 2017 and 2016 ............................... 48 Table 3: AOFM salary ranges ........................................................................................................... 49 Table 4: Consultancy contracts ........................................................................................................ 51
Part 5: Other information .......................................................................................... 117 Table 1: Expenses and resources for Outcome 1 ......................................................................... 119 Table 2: AOFM resource statement ............................................................................................... 120 Table 3: Treasury Bond tender results — 2016-17 ....................................................................... 123 Table 4: Treasury Bond syndication results — 2016-17 .............................................................. 125 Table 5: Treasury Bond buyback tender results — 2016-17 ....................................................... 126 Table 6: Treasury Indexed Bond tender results — 2016-17 ........................................................ 127 Table 7: Treasury Indexed Bond syndication results — 2016-17 ............................................... 127 Table 8: Treasury Note tender results — 2016-17 ....................................................................... 128
Contents
x
LIST OF CHARTS
Part 2: Performance and outcomes............................................................................. 5 Chart 1: Non-resident holdings of Australian Government Securities ...................................... 12 Chart 2: Treasury Bonds outstanding as at 30 June 2017 and issuance in 2016-17 .................. 14 Chart 3: Treasury Bond average term to maturity and length of yield curve (years) .............. 15 Chart 4: Volume outstanding in short-dated Treasury Bonds as at 30 June 2016
and 30 June 17 .................................................................................................................. 16 Chart 5: Treasury Indexed Bonds — average term to maturity and share of the
long-term funding base ................................................................................................... 17 Chart 6: Treasury Indexed Bonds outstanding as at 30 June 2017 and issuance
in 2016-17 .......................................................................................................................... 18 Chart 7: Treasury Bond issuance — average yield, term to maturity and 10-year
bond yield ......................................................................................................................... 23 Chart 8: Treasury Bond portfolio — modified duration, average term to maturity
and cost of funds .............................................................................................................. 24 Chart 9: Treasury Bond maturity profile ........................................................................................ 25 Chart 10: Net AGS debt and Long Term Debt Portfolio cost of funds analysis
(per cent) ........................................................................................................................... 26 Chart 11: Within-year funding requirement 2016-17 .................................................................... 29 Chart 12: Short-term financial asset holdings and Treasury Notes on issue 2016-17 ............... 31 Chart 13: 91-day moving average cash balance 2016-17 .............................................................. 32 Chart 14: RMBS investments, amortisation and divestments ..................................................... 34

xi
Context ��������������������������������������������������������������������������������������xiiiDebt issuance and market development ������������������������������������������xivPortfolio management ������������������������������������������������������������������ xvResidential mortgage-backed securities ������������������������������������������ xvLooking ahead ����������������������������������������������������������������������������xvi
REVIEW BY THE CHIEF EXECUTIVE OFFICER


xiii
REVIEW BY THE CHIEF EXECUTIVE OFFICER
Context
The term issuance program for 2016-17 was $106.3 billion — the highest to date although issuance programs will decline in accordance with forecast financing requirements.
The year also marked a successful conclusion of the AOFM’s six-year strategy to extend the Australian Government Securities (AGS) yield curve. This will: accommodate growth in the debt portfolio over time if required; increase AOFM’s issuance options; contribute to further diversification of the investor base; reduce funding risk; and reduce the impact of interest rate volatility on debt servicing costs should this occur in future. Establishing a 30-year benchmark bond also brought the AGS market into line with other major sovereign bond markets. This will increase its attractiveness to non-resident investors in particular, but has also benefited the domestic investor base. The new benchmark bond was launched by syndication and attracted wide and deep support from the market. Two other new maturities established by syndication during the year, also attracted (successive) record total bids.
With the AOFM needing to maintain a consistently high rate of issuance through the year, managing the liquidity risks associated with a potential reduction or loss of access to the market was an important consideration. As the Government’s cash manager, the AOFM took measures to ensure that a reasonable contingency was in place at all times to cover payment obligations even if the ability to issue bonds was temporarily impeded. While the 2016-17 program was completed as planned, there were times during the year when signs of market congestion raised legitimate concerns regarding the capacity of intermediaries to absorb the elevated rate of issuance.
The large ongoing quantitative easing programs of major central monetary authorities (namely the European Central Bank, the US Federal Reserve and the Bank of Japan), formed an ongoing backdrop to financial markets and this was largely supportive of sovereign bonds. Given the amount of issuance undertaken since 2008, the AGS market now has international significance and supports a diverse range of global sovereign bond investors. These investors are attracted by the strong underlying liquidity of the AGS market, the credit quality and yield advantage over other comparable markets and the transparency and regularity of issuance.
A continued decline in the proportion of AGS held by non-resident investors would seem to contradict the above observation but global financial markets are complex and

Review by the Chief Executive Officer
xiv
the changing patterns of participation underlying high-level trends are not straightforward to determine. While non-resident investors collectively continued adding to their AGS holdings, the rate of this has not matched increases in issuance. The difference is reflected by stronger domestic investor buying, most notably by bank balance sheets. This is in large part because of requirements for bank balance sheets to hold increased high quality liquid assets under Basel III. It is difficult to make a judgement about the re-balancing between non-resident and domestic AGS ownership other than to say that the AOFM continues to observe diversity across the investor base overall. Should this diversity endure and liquidity remain strong, we are confident that the AGS market will continue to exhibit efficiency and resilience.
The likely pace of increases to the US federal funds rate remained a high profile consideration in global financial markets given its impact on US Treasury yields and relative comparisons with other sovereign bond markets. Added to this was speculation about how quickly the US Federal Reserve will reduce the size of its balance sheet — this will reinforce (or even amplify) the influence of a rising federal funds rate. During the year the European Central Bank also signalled that conditions across the EU might warrant a slowing of its quantitative easing program. All other things equal, these factors combined to create conditions for an easing in offshore demand for AGS and higher bond yields. Continued low yields on Japanese sovereign bonds acted as an offsetting factor. Furthermore, the sharp sell-off in US Treasuries (and sovereign bonds generally) in response to the change in the US Administration in November 2016 was a clear reminder of how quickly market conditions can change.
Over 2016-17 AGS yields broadly tracked the global sell-off in rates, which began in August (when AGS yields were at a multi-decade low) before rising sharply after the US elections. While the sell-off was partially reversed over the second half of the year (due to a combination of economic and geopolitical factors), three and 10-year, AGS yields still rose by around 35 and 60 basis points respectively in the year to 30 June 2017.
Debt issuance and market development
The AOFM continued its well established practice of issuing through a combination of regular weekly competitive tenders, and syndications to establish new maturities.
Treasury Bond issuance of $103 billion in 2016-17 focused on executing the AOFM’s portfolio strategy, while also being responsive to a diverse investor base and supporting the three-year, 10-year and 20-year futures contracts. Market facing operations were also augmented by introducing a regular bond buyback program. The aims of the program are to: manage funding risk by reducing the volume outstanding of short-dated bonds (thus reducing future gross issuance programs); improve efficiency of the AGS market through effectively switching bonds with less demand for

Review by the Chief Executive Officer
xv
longer maturities in greater demand (which reduces inventories of bank trading accounts used for AGS and improves market efficiency); and assist the RBA in managing system liquidity through reducing the size of cash flows on maturity dates. Competitive buyback tenders operate in the reverse manner of issuance tenders; they are funded by the issuance of equivalent amounts of longer-dated bonds.
Gross issuance of Treasury Indexed Bonds for the year totalled $3.25 billion, almost all of which was issued via twice-monthly competitive tenders. This segment of the AGS market continues to be predominantly domestic investor focused.
Portfolio management
The AOFM exercises informed judgement in devising a portfolio management strategy to guide debt issuance choices each year. The structure of the portfolio can only be changed gradually and the core aims of minimising cost and reducing risk typically present as competing objectives. For example, issuing longer-dated bonds reduces funding risk and dampens the potential for future interest rate volatility to impact debt interest costs; but normally comes at a higher overall interest cost. Similarly, the cash management portfolio incurs increased carrying costs when cash balances are high; however, cash balances need to be able to accommodate short-term or unforseen Budget financing requirements and are required ahead of bond maturities.
The average term to maturity of Treasury Bond issuance in 2016-17 at just over 10 years was higher than it was the previous year but as the portfolio has grown over time and the yield curve extended such increases are getting harder to achieve. However, the outcome for 2016-17 underpinned a further lengthening of the average term to maturity of the portfolio to 7.13 years, from 6.97 the year before. In operation since 2011, the lengthening strategy is estimated to have deferred the need to re-finance about $15 billion on average per year in maturities over the next five years. This is a considerable reduction in near-term funding risk, which is now being complimented by the buyback program.
Residential mortgage-backed securities
In May 2015, the AOFM was issued a Direction to commence a program of regular divestment of the remaining residential mortgage backed securities (RMBS) portfolio. A program of monthly competitive auctions commenced in June 2015. The Direction requires the AOFM to exercise discretion on timing and sales volume to minimise potential market disruptions; and to suspend RMBS sales that cannot occur at a price that is acceptable to the AOFM.
Due to a marked widening of RMBS yields the AOFM (consistent with the intent of the Direction) suspended the auction process in November 2015. The auction process

Review by the Chief Executive Officer
xvi
remained suspended throughout 2016-17 because the AOFM assessed prices to remain at unacceptable levels. In addition to ongoing assessments of investor demand for RMBS, credit market conditions will influence the AOFM in its deliberations regarding a resumption of the divestment process.
Looking ahead
The outlook continues to be dominated by speculation about global economic growth and inflation, changes to the conduct of monetary policy overseas, and the performance of sovereign bond markets generally. In particular, the prospect of steadily improving economic growth in the US and now the EU attract close scrutiny by the investor community. However, uncertainty associated with these outlooks is likely to persist in the coming year, not least because of heightened geo-political risk and a weakening consensus about the ability for broad stimulatory budget measures to be implemented in the US. These, amongst other factors, remain relevant to the AOFM’s deliberations.
The AOFM remains focused on portfolio management objectives that will support a diversified investor base and an outlook for declining issuance, but little expected change in the overall size of the debt portfolio. If achieved, these objectives will maintain an efficient AGS market that will support domestic financial market operations generally.
With completion of its long-term market development program (including a substantial yield curve extension), the AOFM will appear more to the market like a business as usual operation over the coming years. In particular this will allow more straightforward and less intensive engagement with the investor community.
Rob Nicholl Chief Executive Officer
•

Role, function, outcome and program structure �������������������������������� 3Organisational structure ����������������������������������������������������������������� 4
PART 1 AOFM OVERVIEW
1


3
AOFM OVERVIEW
Role, function, outcome and program structure
The AOFM is responsible for the management of Australian Government debt. The AOFM also manages the Government’s cash balances and invests in very low risk financial assets, which in recent years has been in the form of term deposits with the Reserve Bank of Australia (RBA).
The objectives of the AOFM are to:
1) meet the budget financing task in a cost-effective manner subject to acceptable risk;
2) facilitate the Government’s cash outlay requirements as and when they fall due; and
3) be a credible custodian of the AGS market and other portfolio responsibilities.
The AOFM’s debt management activities include the issuance of Treasury Bonds and Treasury Indexed Bonds. To support the efficient operation of the markets for these debt instruments, a securities lending facility that allows financial market participants to borrow bonds is maintained on behalf of the AOFM by the RBA.
The AOFM’s cash management activities include the issuance of Treasury Notes for short-term funding.
The AOFM’s investment management activities include managing a portfolio of Australian RMBS that were acquired under a Government program that supported competition in lending for housing after the global financial crisis.
The AOFM is part of the Treasury portfolio. It is accountable to the Secretary to the Treasury and to the Treasurer, and through the Treasurer to the Parliament and the public. However, it is a listed entity under the Public Governance, Performance and Accountability Act 2013 (PGPA Act) and maintains its own accounts and is responsible for compliance with the Act separately to the Treasury. AOFM staff are employed under the Public Service Act 1999.
For budgetary purposes, the AOFM’s activities comprise of one program directed to achieve the following outcome on behalf of the Australian Government: — the advancement of macroeconomic growth and stability. This is pursued through the

Part 1: AOFM overview
4
effective operation of financial markets by issuing debt and investing in financial assets; and managing debt, investments and cash. The AOFM aims to manage net debt for which it is responsible at least cost, subject to an acceptable level of risk. It also issues bonds taking into account the Government’s policy objectives of supporting the AGS market.
Organisational structure
During 2016-17, the AOFM structured its core operational activities into three broad areas. Activities in portfolio and global market research (including monitoring and anticipating regulatory impacts on financial markets), transaction design and execution, and investor engagement, together form what in the financial sector is typically viewed as ‘front office’ related (Funding, Markets and Strategy).
Business Operations comprise transaction settlements, together with all associated payment obligations and the monitoring and financial statement reporting of the AOFM’s transactions (and balance sheet activity) on behalf of the Australian Government. These activities form what is typically viewed in the financial sector as the ‘back office’ (Accounting Services). This is effectively two separate teams.
A ‘middle office’ (Enterprise Assurance and Performance) oversights separation of the back and front office functions through maintaining complementary frameworks for enterprise risk and assurance (including audit) and the coordination of outsourced legal services, and compliance with the AOFM’s obligations under relevant legal, regulatory and delegated powers. It also undertakes performance monitoring of the various portfolio and transaction activities.
AOFM governance, corporate related functions and support to the Chief Executive sit within a Corporate Development business unit. Advice on issues regarding the AOFM’s staff development objectives and APS specific issues are provided directly to the Chief Executive through a dedicated role.
This overall structure provides for an appropriate segregation of duties — consistent with financial industry best practice.
In addition, the AOFM supports the Australian Government’s aims to transfer knowledge and skill to developing countries through related foreign aid programs. In 2016-17, an AOFM staff member worked on a program organised by the Department of Foreign Affairs and Trade under the Solomon Islands Economic and Public Sector Governance Program in the Solomon Islands. This program offers the host government support for their debt and cash management activities.
Introduction ��������������������������������������������������������������������������������� 7Section 1: Annual Performance Statement ��������������������������������������� 7Section 2: Outcomes �������������������������������������������������������������������� 9Bond issuance ����������������������������������������������������������������������������10Debt portfolio management�����������������������������������������������������������20Cash management �����������������������������������������������������������������������28Residential mortgage-backed securities ������������������������������������������32Market engagement ���������������������������������������������������������������������35
PART 2 PERFORMANCE AND OUTCOMES
5

7
PERFORMANCE AND OUTCOMES
Introduction
The role of the AOFM encompasses a number of principal functions that serve three key objectives. These key objectives are to: (1) meet the Budget financing task in a cost-effective manner subject to acceptable risk; (2) facilitate the Government’s cash outlay requirements as and when they fall due; and (3) be a credible custodian of the AGS market and other portfolio responsibilities.
This part of the annual report is presented in two sections: Section 1 is focused on the PGPA Act requirement to provide an Annual Performance Statement; and Section 2 gives context to the outcomes achieved through the AOFM’s operations to support its principal functions and discusses relevant market aspects of the environment in which the AOFM operates.
The principal functions of the AOFM are:
• issuing AGS in accordance with Government policy objectives (such as promoting sovereign bond market liquidity);
• managing the aggregate daily cash balances in the Government’s Official Public Account (OPA);
• managing financial assets (including Australian Residential Mortgage-Backed Securities (RMBS)) according to policy directives, or as part of broader portfolio management;
• the settlement and payment of Commonwealth financial obligations on AGS;
• developing risk assessments to undertake cost effective management of the debt and asset portfolios; and
• where appropriate, supporting the efficient operation of the Australian financial system.
Section 1: Annual Performance Statement
The purpose of the AOFM is achieved through three key objectives (above). Table 1 presents the Annual Performance Statement, outlines these objectives, and provides a summary of key performance indicators and results for the year. The statement of results refers to detailed context in Section 2 of this part, which provides a

Part 2: Performance and outcomes
8
comprehensive explanation of a range of outcomes important to the AOFM’s achievement of annual and longer-term aims.
The Annual Performance Statement is prepared in accordance with paragraph 39(1)(a) of the PGPA Act.
Table 1: Annual Performance Statement 2016-17 Key performance indicator Measure Result
Objective: Meet the Budget financing task in a cost-effective manner subject to acceptable risk
Term issuance Shortfall in volume ($) between
actual Treasury Bond issuance
and planned issuance announced
at the Budget and subsequent
releases
The shortfall in issuance was zero,
with the financing task for 2016-17
fully met through sufficient
issuance ($106.25 billion)
Discussion from page 12
Financing cost The cost of the long-term debt
portfolio compared to the 10 year
average of the 10-year bond rate
Debt issuance in 2016-17 was
cost effective, and consistent with
the AOFM strategy of lengthening
the average term to maturity of the
nominal portfolio to reduce
refinancing risk and variability in
interest costs. The effective yield
of the long-term debt portfolio for
2016-17 was 3.42 per cent
(2015-16: 3.76 per cent). This is
below the 10 year average of the
10-year bond rate of 4.15 per cent.
The average yield of Treasury
Bond issuance (accounting for
97 per cent of all long term
issuance) for 2016-17 was
2.38 per cent (2015-16:
2.48 per cent). This is below the
2016-17 average of the 10-year
bond rate of 2.62 per cent
(2015-16: 2.61 per cent). The
average term to maturity of the
Treasury Bond portfolio was
7.13 years as at 30 June 2017
(2015-16: 6.97 years). The
average term of new issuance in
2016-17 was 10.29 years
(2015-16: 9.41 years).
Discussion from pages 15 and
25-28

Part 2: Performance and outcomes
9
Key performance indicator Measure Result
Objective: Meet the Budget financing task in a cost-effective manner subject to acceptable risk
(continued)
New issuance yields Weighted average issue yield at
Treasury Bond and Treasury
Indexed Bond tenders less
prevailing mid-market secondary
yields
The weekly selection of bond
maturities and issuance volumes
for tenders facilitated continual
efficient functioning of the primary
market. This is reflected by
average tender yields being below
secondary market yields for
Treasury
Bonds (-0.40 basis points), and
Treasury Indexed Bonds
(-0.79 basis points).
Discussion from page 18
Objective: Facilitate the government’s cash outlay requirements as and when they fall due
Use of the overdraft facility Number of instances the RBA
overdraft facility was utilised to the
extent that it required Ministerial
approval during the assessment
period
Sufficient cash was available at all
times to meet the government’s
outlays such that there was no
requirement during the year to use
the RBA overdraft facility.
Discussion from page 30
Objective: AOFM is a credible custodian of the AGS market and other portfolio responsibilities
A liquid and efficient
secondary market
Annual turnover in the secondary
market for Treasury Bonds and
Treasury Indexed Bonds
Annual secondary market turnover
for Treasury Bonds was
$1.1 trillion and for Treasury
Indexed Bonds $42 billion in
2016-17. This is adequate for the
market to function effectively.
Discussion from page 19
Number of times the AOFM
securities lending facility was
accessed and the aggregate face
value amount of stock lent
(excluding intraday borrowings)
The securities lending facility was
used 51 times (excluding intra-day
uses), but only for small volumes
and generally for short periods.
Discussion from page 20
Market commitments Number of times the AOFM failed
to undertake actions consistent
with public announcements
All commitments were met.
Section 2: Outcomes
This section outlines AOFM operations undertaken in achieving its principal functions, and reports on the aims underpinning these operations and how these principal functions were achieved. It is presented according to five primary operational
Part 2: Performance and outcomes
10
considerations: bond issuance; debt portfolio management; cash portfolio management; RMBS portfolio management; and market engagement. The discussion of each refers to underlying aims, how they are achieved and outcomes.
Bond issuance
Aims
The AOFM currently has two term debt instrument choices — nominal Treasury Bonds and Treasury Indexed Bonds, the latter for which the capital value is adjusted over time according to inflation outcomes. During times of Australian Government Budget deficits the main aim of Treasury Bond and Treasury Indexed Bond issuance is to meet the budget financing task; however the issuance program is also determined such that it will assist with meeting overall debt portfolio aims (such as increasing the average term to maturity of the portfolio). The AOFM plans its programs each year to undertake issuance in a cost effective manner.
The AOFM also aims to support the efficient operation of Australia’s financial markets by being a credible custodian of the AGS market. This takes account of the following financial market activities:
• Treasury Bonds, Treasury Indexed Bonds and Treasury Bond futures are used by financial market participants as benchmarks for the pricing of other capital market instruments and to manage interest rate risk; and
• the existence of active and efficient physical and futures markets for sovereign debt strengthens the robustness of the financial system and reduces its vulnerability to shocks.
Another element of market efficiency that is important to issuers, intermediaries and investors is market liquidity. Bond market liquidity is broadly accepted to mean the ability to trade bonds at short notice and at low cost without materially moving prices. Strong liquidity is attractive to investors and reflects favourably on a sovereign bond market. There is no single measure of liquidity; it is an assessment by individuals (and institutions) based on a number of considerations. These considerations include, but are not restricted to, turnover in secondary markets, the frequency of primary market activity, bid-offer spreads, and the time it takes to execute ‘large’ transactions (something in itself that has a different meaning to different parties).
Treasury bond buybacks
The AOFM repurchases Treasury Bonds before their maturity with several aims in mind: to increase the duration of the debt portfolio; reduce refinancing risk; assist in the cash management task around the time of bond maturities; enhance the operation

Part 2: Performance and outcomes
11
of the secondary market; and assist the RBA in its liquidity management task on days of very large maturities.
Approach to achieving these aims and market influences
The AOFM only uses competitive tenders and syndications to conduct bond issuance. The use of competitive tenders remains the mainstay of AOFM’s issuance operations; 102 Treasury Bond tenders and 17 Treasury Indexed Bond tenders were conducted during the year. Three new Treasury Bond lines were launched via syndication. The first ‘syndicated tap’ of an existing bond maturity was held and this was for the 2040 Treasury Indexed Bond.
Buybacks of short-dated Treasury Bonds were conducted via tenders, in conjunction with syndicated issues, and via bilateral transactions with the RBA.
Implementing the government’s largest ever term funding program while pursuing a strategy designed to lengthen the average term to maturity of the portfolio proved challenging, particularly during the latter part of 2016. Elevated weekly issuance volumes, low yields and constrained market-maker balance sheets were reflected through higher repo rates, cheaper physical Treasury Bonds relative to futures, and lower coverage ratios at tenders.
The proportion of outstanding AGS held by offshore investors continued to fall over 2016-17, as illustrated in Chart 1. This reflects a continued increase in the absolute level of non-resident investment but not at a rate to match that at which the size of the market has increased. Australian-domiciled investors, particularly bank balances sheets facing increased requirements to hold high quality liquid assets under Basel III, were a strong presence in the market in 2016-17.
Strong offshore interest in long-dated AGS was demonstrated in the syndicated issue of the 30-year Treasury Bond, 65 per cent of which was allocated to non-resident investors.

Part 2: Performance and outcomes
12
Chart 1: Non-resident holdings of Australian Government Securities
50
55
60
65
70
75
80
50
55
60
65
70
75
80
Jun-
12
De
c-1
2
Jun-
13
De
c-1
3
Jun-
14
De
c-1
4
Jun-
15
De
c-1
5
Jun-
16
De
c-1
6
Per centPer cent
Non-resident percentage holdings of AGS
Source: Australian Bureau of Statistics and the AOFM
Treasury Bond buybacks
In May 2016 the AOFM announced its intention to begin a program of Treasury Bond ‘conversions’, seeking feedback on how this could best be implemented. Feedback indicated broad support for the plan, with clear understanding of and appreciation for the AOFM’s objectives; a preference for separate buyback and issuance transactions (rather than single transaction conversion tenders); simple, market-based, transparent and competitive operations; and that Treasury Bonds shorter than those comprising the three-year futures basket should be targeted.
A program of regular competitive buyback tenders commenced in September 2016. These operations are funded by separate tenders for issuance of longer-dated Treasury Bonds. The AOFM expects that buyback tenders will add to its operational flexibility and become an accepted and enduring feature of the market.
There are two other ways in which the AOFM can repurchase bonds prior to maturity: switches or buybacks can be accommodated in conjunction with syndicated issues; and via transactions with the RBA, which purchases short-dated Treasury Bonds in its liquidity operations.
Outcomes
Meeting the Budget financing task
The financing task for 2016-17 was fully met. A total of $106.25 billion of term debt was issued during the year.

Part 2: Performance and outcomes
13
At the time of the 2016-17 Budget, Treasury Bond and Treasury Indexed Bond issuance for the year was expected to total around $93 billion in face value terms. This volume was revised over the course of the year to meet the government’s increased financing requirement and to increase the cash balances managed by the AOFM as part of its assessment of liquidity risk.
Treasury Bond issuance
Gross Treasury Bond issuance for the year totalled $103 billion. This was the highest issuance program the AOFM has achieved to date. The bulk of this issuance was into existing bond lines in order to enhance market liquidity. In addition, three new Treasury Bond lines were launched in 2016-17:
• a new bond line maturing in December 2021 was issued to support the operation of the three-year Treasury Bond futures contract;
• a new bond line maturing in November 2028 was issued to support the operation of the 10-year Treasury Bond futures contract and to reduce growth in the amount outstanding in surrounding bond lines, which will make it easier to manage maturity of those bonds lines; and
• a new bond line maturing in March 2047 was issued to lengthen the yield curve to include a 30-year benchmark.
In selecting the bond lines to issue each week, the AOFM took account of its debt issuance strategy; prevailing market conditions; information from financial market contacts about investor demand; relative value considerations; scope for increasing the liquidity of outstanding bond lines; and the need to manage the maturity structure to limit funding risk. Two tenders were held during most weeks, typically comprising a tender of a long-dated bond line and another of a short-dated bond line. To facilitate tenders of ultra-long-dated (around 20-year tenor) Treasury Bonds, three tenders were held in some weeks. The amount offered at each tender ranged from $300 million to $1 billion.
Large issuance volumes were achieved via the syndicated issues of new Treasury Bonds. The March 2047 ($7.6 billion), December 2021 ($9.3 billion) and November 2028 ($11 billion) issues were each the largest issue on record when they were held. This allowed a reduction in weekly tender issuance volumes from April 2017.
At the end of the year, there were 24 Treasury Bond lines, with 12 of these lines having over $20 billion on issue and 21 having over $10 billion on issue. Chart 2 shows Treasury Bonds outstanding as at 30 June 2017 and the allocation of issuance across bond lines during 2016-17.

Part 2: Performance and outcomes
14
Chart 2: Treasury Bonds outstanding as at 30 June 2017 and issuance in 2016-17
0
5
10
15
20
25
30
0
5
10
15
20
25
304.
25%
Jul
17
5.50
% J
an 1
8
3.25
% O
ct 1
8
5.25
% M
ar 1
9
2.75
% O
ct 1
9
4.50
% A
pr 2
0
1.75
% N
ov 2
0
5.75
% M
ay 2
1
2.00
% D
ec 2
1
5.75
% J
ul 2
2
5.50
% A
pr 2
3
2.75
% A
pr 2
4
3.25
% A
pr 2
5
4.25
% A
pr 2
6
4.75
% A
pr 2
7
2.75
% N
ov 2
7
2.25
% M
ay 2
8
2.75
% N
ov 2
8
3.25
% A
pr 2
9
4.50
% A
pr 3
3
2.75
% J
un 3
5
3.75
% A
pr 3
7
3.25
% J
un 3
9
3.00
% M
ar 4
7
$billion$billion
Issuance during 2016-17
Part 2: Performance and outcomes
15
Extension of the Treasury Bond yield curve
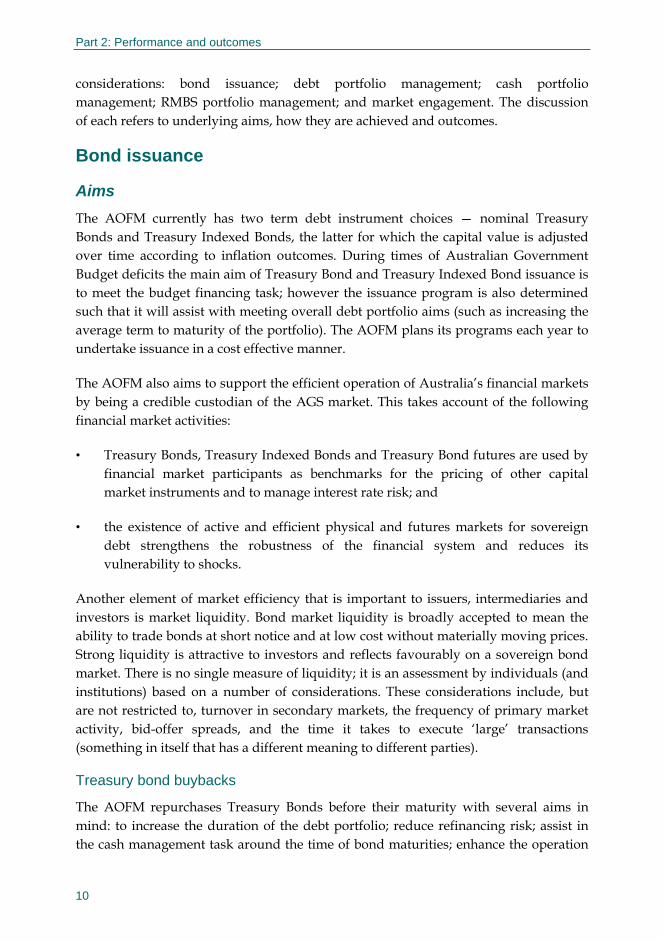
Yield curve extension has been an integral component of the AOFM’s debt strategy for a number of years. The achievement of this strategy has added to the depth and diversity of the AGS investor base by appealing to longer duration investors while simultaneously providing the AOFM with greater flexibility in how it meets government financing requirements through time. Chart 3 demonstrates that 2016-17 was the sixth consecutive year of yield curve extension and with the establishment of a 30-year benchmark occurring in October 2016. Curve extensions have both facilitated and contributed to the AOFM’s lengthening strategy as reflected by an uplift in the average term to maturity of issuance and of the broader portfolio since 2010-11, while also being central to the AOFM’s approach to managing risk and accommodating appreciable growth in the AGS market since the global financial crisis.
Chart 3: Treasury Bond average term to maturity and length of yield curve (years)
5
10
15
20
25
30
35
4
5
6
7
8
9
10
11
2008-09 2009-10 2010-11 2011-12 2012-13 2013-14 2014-15 2015-16 2016-17
Years Years
Weighted average term to maturity of Treasury Bond portfolio (left axis)
Longest maturity on issue (right axis)
Weighted average term to maturity of issuance by f inancial year (left axis)
Part 2: Performance and outcomes
16
Treasury Bond buybacks
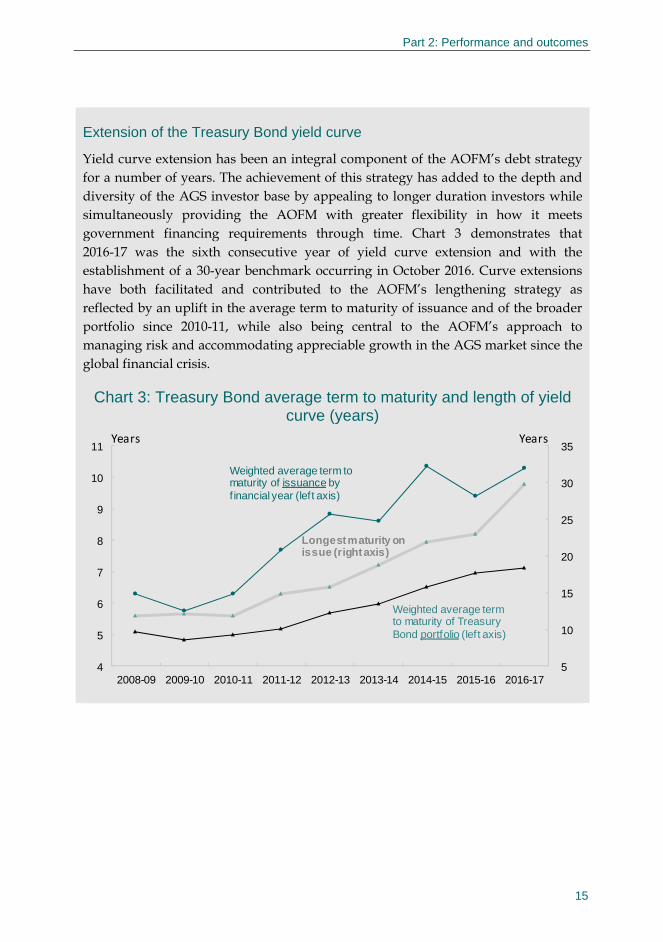
A total of $12.3 billion of Treasury Bonds were repurchased ahead of maturity in 2016-17:
• eleven Treasury Bond buyback tenders were conducted, at which $4.9 billion of bonds were repurchased;
• the AOFM repurchased $3.1 billion of bonds in conjunction with the syndicated issue of the new 21 December 2021 Treasury Bond;
• $4.4 billion of bonds were repurchased from the RBA; and
• a small amount of bonds were repurchased from retail investors who sold their holdings via the Australian Government Securities Buyback Facility.
Buyback tenders are effectively a reverse of normal competitive issuance tenders. The AOFM sets the total volume of bonds it is prepared to buy back and offers from intermediaries are accepted from the highest yield (lowest price) in descending order until the total volume is reached. All buybacks other than those from retail investors were of Treasury Bond lines shorter than the three-year futures basket.
The volume outstanding in short-dated Treasury Bonds was reduced as illustrated in Chart 4.
Chart 4: Volume outstanding in short-dated Treasury Bonds as at 30 June 2016 and 30 June 17
0
5
10
15
20
25
0
5
10
15
20
25
4.25% Jul 17 5.50% Jan 18 3.25% Oct 18 5.25% Mar 19
$billion
Outstanding 30 June 2016 Outstanding 30 June 2017
$billion

Part 2: Performance and outcomes
17
Treasury Indexed Bond issuance
The AOFM’s alternative long-term funding instrument to Treasury Bonds is Treasury Indexed Bonds, the capital values of which are adjusted with changes in the CPI. The issuance of these bonds typically attracts a different (and predominantly domestic) class of investor to Treasury Bonds and thus provides a source of diversification in the funding base. The regular issuance of Treasury Indexed Bonds re-commenced in 2009-10 following an extended absence from this market. While the indexed bond portfolio has declined marginally as a share of the long term funding, the total stock of indexed bonds has continued to grow steadily (as shown in Chart 5).
Chart 5: Treasury Indexed Bonds — average term to maturity and share of the long-term funding base
6.8
9.410.1
9.3
8.7
9.5
8.3
8.7
8.3
9.810.5
10.1
9.2
9.2
8.9
9.0
8.5
8.0
0
5
10
15
20
25
30
35
40
0
2
4
6
8
10
12
30-Jun-0930-Jun-1030-Jun-1130-Jun-1230-Jun-1330-Jun-1430-Jun-1530-Jun-1630-Jun-17
Nominal face value Inflation accrual
Average term to maturity Indexed bond share
Years / per cent $billion
Treasury Indexed Bond issuance for the year totalled $3.25 billion. Two tenders for the issue of Treasury Indexed Bonds were conducted in most months. The volume of each line outstanding, relative yields and other prevailing market conditions were considered in the selection of which line to offer. Complementing regular tenders, liquidity in the ultra-long part of the TIB curve was assisted by a ‘syndicated tap’ of the August 2040 line. $700 million was issued in the tap, with the majority of demand from domestic fund managers.
Chart 6 shows the amount outstanding in each of the seven Treasury Indexed Bond lines as at 30 June 2017, and the allocation of issuance during the 2016-17 year.

Part 2: Performance and outcomes
18
Chart 6: Treasury Indexed Bonds outstanding as at 30 June 2017 and issuance in 2016-17
0
1
2
3
4
5
6
7
0
1
2
3
4
5
6
7
1.00%Nov 18
4.00%Aug 20
1.25%Feb 22
3.00%Sep 25
2.50%Sep 30
2.00%Aug 35
1.25%Aug 40
$billion$billion
Issuance during 2016-17
Efficiency of issuance
Table 2 summarises the results of Treasury Bond tenders conducted during the year. The results are shown as averages for each half-year and grouped by the maturity dates of the bonds offered.
Table 2: Summary of Treasury Bond tender results Face value Average spread
amount Weighted average to secondary Averageallocated issue yield market yield times
Period Maturity ($m) (%) (basis points) covered
Up to 2024 17,900 1.7831 -0.47 3.40
2025 - 2029 23,100 2.2504 -0.18 2.43
2030 - 2047 1,600 2.4180 -0.24 2.42
Up to 2024 13,000 2.0048 -0.73 5.05
2025 - 2029 15,700 2.7214 -0.28 3.41
2030 - 2047 3,800 3.1691 -0.45 3.01
July - December 2016
January - June 2017
Despite the pronounced market congestion experienced at times in the latter half of 2016, the average coverage ratio for all Treasury Bond tenders in 2016-17 was 3.41, an increase from 2.99 in 2015-16. The average tender size of $736 million was lower than in 2015-16 despite the higher issuance program. This was due to the large volumes of
Part 2: Performance and outcomes
19
issuance achieved via syndication and more tenders of ultra-long bonds, which tended to be for smaller volumes. Shorter-dated bond tenders generally received a greater volume of bids (higher than average coverage ratios), which reflected core investor base interest.
The strength of bidding at tenders was also reflected in competitive issue yield spreads to secondary market yields. At most Treasury Bond tenders the weighted average issue yields were below prevailing secondary market yields.
The average coverage ratio was 3.14 for Treasury Indexed Bond tenders, a decrease from 3.69 in 2015-16. At most tenders, the weighted average issue yields were below prevailing secondary market yields.
Full tender details are available in Part 5 of this annual report.
Market liquidity and efficiency
The Treasury Bond market operated smoothly during 2016-17 with liquidity and efficient price discovery being maintained throughout the year. However, there were times during the second half of 2016 when repo rates were elevated and Treasury Bonds traded at cheap levels relative to bond futures.
In previous years, data on secondary market turnover in Treasury Bonds has been obtained from the Australian Financial Markets Association (AFMA). With changes in the AFMA data collection methodology and in order to have a clearer understanding of turnover in AGS, the AOFM began collecting secondary market turnover data from market-makers from July 2016. Total secondary market turnover of Treasury Bonds in 2016-17 amounted to $1.1 trillion.
Although liquidity in Treasury Indexed Bonds remains good compared to global inflation-linked debt markets, it has continued to prove noticeably more challenging than for Treasury Bonds. This is consistent with the relative liquidity of nominal and inflation-linked securities in other sovereign debt markets. Market participants reported that large trades may have to be executed carefully and over time, and larger transactions can at times move market prices. Treasury Indexed Bond turnover in 2016-17 was around $42 billion.
There was tightness in the August 2040 TIB for several months, requiring some market participants to borrow that line from the securities lending facility. To assist the operation of the TIB market and build liquidity, the first syndicated tap of an existing indexed bond (the August 2040 TIB) was conducted in February 2017.

Part 2: Performance and outcomes
20
Turnover in the Treasury Bond futures market is significantly higher than in the underlying Treasury Bonds. The three and 10-year Treasury Bond futures contracts are highly liquid: over 53 million three-year contracts (representing $5.3 trillion face value of bonds) and over 42 million 10-year contracts ($4.2 trillion face value of bonds) were traded in 2016-17. Turnover in the 20-year contract is considerably lower: 545 thousand contracts ($27 billion face value of bonds) were traded. All contract close-outs in 2016-17 occurred smoothly.
The AOFM’s securities lending facility allows market participants to borrow Treasury Bonds and Treasury Indexed Bonds for short periods when they are not otherwise available in the secondary market. This enhances the efficiency of the market by improving the capacity of intermediaries to continuously make two-way prices, reduces the risk of settlement failures and supports market liquidity. The facility was used 51 times for overnight borrowing in 2016-17 compared with 29 times during 2015-16. However, the volumes borrowed tended to be small, with the total face value amount lent in 2016-17 being $388 million, an increase from $261 million in the previous year.
Debt portfolio management
Aims
In managing the Commonwealth’s debt portfolio and meeting the Government’s financing requirements, the AOFM seeks to minimise debt servicing costs over the medium term at an acceptable level of risk, by which is meant an acceptable level of variability in cost outcomes. It also seeks to maintain liquid bond lines to facilitate the issuance of debt at acceptable cost and to manage the refinancing risk that arises when bond lines mature.
To meet these aims the AOFM endeavours to execute a debt issuance strategy that appropriately accounts for the trade-offs between cost and risk while simultaneously providing effective and transparent stewardship of the AGS market in order to underpin confidence and promote participation in the market. Through its strategy and operations the AOFM contributes to an efficient and resilient market while providing continuity of access to financial markets for the Australian Government.
The AOFM uses measures that appropriately reflect the costs and risks faced by a sovereign debt manager. The primary cost measure used is historic accrual debt service cost. This includes interest payments made on AGS, realised market value gains and losses, capital indexation of indexed debt and the amortisation of any issuance premiums and discounts. Total accrual debt service cost can be expressed as a percentage of the stock of debt outstanding to provide the effective yield of the portfolio. The use of an historic accrual debt service cost measure excludes unrealised market value gains and losses.

Part 2: Performance and outcomes
21
An alternative measure of cost is ‘fair value’, which takes account of unrealised gains and losses resulting from movements in the market value of physical debt and assets. Debt service cost outcomes are presented in the AOFM’s financial statements on this basis. A comprehensive income format is used that allows revenues and expenses on an historic basis to be distinguished from the effects of unrealised market value fluctuations. Fair value is useful in circumstances where it is possible that changes in market value may be realised in the future.
Approach to achieving the aims
Variability in portfolio outcomes can be measured in several ways. The AOFM calculates and compares several metrics to assess risk. In general, an acceptable level of risk can be characterised as an acceptable level of variation in interest cost outcomes over time. Debt issuance decisions made today impact the variability of future interest cost outcomes because of their influence on the maturity profile of the portfolio and hence the amount of debt that needs to be refinanced (and ‘re-priced’) through time.
The AOFM influences the cost and risk profile of the portfolio primarily through the maturity structure of the debt securities it issues (and to a lesser extent, the mix between nominal and inflation linked securities). Issuing longer-term securities will typically involve paying higher debt service costs (in the presence of a positive term premium)1 although this is compensated by reduced variability in future interest cost outcomes and lower exposure to refinancing or rollover risk.2 Issuing shorter term debt securities by contrast will typically be cheaper (avoiding a term premium) but result in higher variability in cost outcomes through time and a greater debt refinancing task. Striking the right balance between these cost and risk considerations is the debt manager’s ongoing challenge.
Strategic decision making around the portfolio is informed by an ongoing research program focussed on exploring the cost and risk characteristics of alternative portfolio structures and issuance strategies. This is done in light of prevailing fiscal and economic circumstances. Drawing on this research, a strategy for the structure and composition of issuance for the financial year was formulated and ultimately approved by the Treasurer. Separately, a range of complementary limits, thresholds, guidelines and targets governing the AOFM’s operations were submitted to the Secretary to the Treasury for approval through an Annual Remit. Implementing the strategy requires weekly operational issuance decisions such as determining how much and which lines to issue or when a new maturity should be established. These operational decisions
1 The term premium is the additional yield demanded by investors in order to hold a long-term bond instead of a series of shorter-term bonds.
2 Refinancing risk, also referred to as rollover risk, is the inability to renew maturing debt by further borrowing.

Part 2: Performance and outcomes
22
were influenced by several factors including general market conditions, relative value considerations and feedback from investors. The ongoing suitability of any issuance and portfolio strategy is constantly under review.
Outcomes
During the year, the total volume of Treasury Bonds outstanding increased by around $79 billion, to $464 billion.
Portfolio risk management
The AOFM’s strategy in 2016-17 followed a similar theme to recent years. This involved focussing on lengthening the maturity structure of the overall debt portfolio in order to accommodate growth in outstanding debt levels while limiting growth in the volume of maturities to be re-financed each year. The strategy also aimed to increase the diversity of issuance options available to the AOFM and to facilitate further diversification of the investor base. The strategy was influenced by a range of factors including a continuation of low outright bond yields, below average term premium (which increases the cost-effectiveness of longer term issuance), an elevated financing task in 2016-17 and an external environment characterised by a number of political and geopolitical events with the potential to generate uncertainty in markets. A bias towards issuance of longer maturity bonds and yield curve extension continued to form the backbone of the AOFM’s portfolio management strategy, although, this was complemented for the first time by a regular program of bond buyback tenders (introduced from September 2016 onwards) to aid in the management of refinancing risks around near maturity lines and contribute to the efficient operation of the AGS market.
Chart 7 demonstrates the lengthening bias implicit to the AOFM’s strategy with the average Treasury Bond issued in 2016-17 having a term to maturity of 10.29 years. The issuance program continued to benefit from low interest rates and was delivered cost effectively, with an average yield on issuance of 2.38 per cent which is lower than the average 10-year bond yield over the course of the financial year of 2.43 per cent.

Part 2: Performance and outcomes
23
Chart 7: Treasury Bond issuance — average yield, term to maturity and 10-year bond yield
6.295.77
6.29
7.68
8.84 8.59
10.33
9.4110.29
4.32
5.22 5.12
3.91
3.143.73
2.912.48 2.38
5.07 5.55 5.31
4.04
3.25
4.01
3.002.61 2.43
0
1
2
3
4
5
6
7
8
9
10
11
0
1
2
3
4
5
6
7
8
9
10
11
2008-09 2009-10 2010-11 2011-12 2012-13 2013-14 2014-15 2015-16 2016-17
Average term of issuance Average yield of issuance Average 10Y bond yield
Years / Per cent Years / Per cent
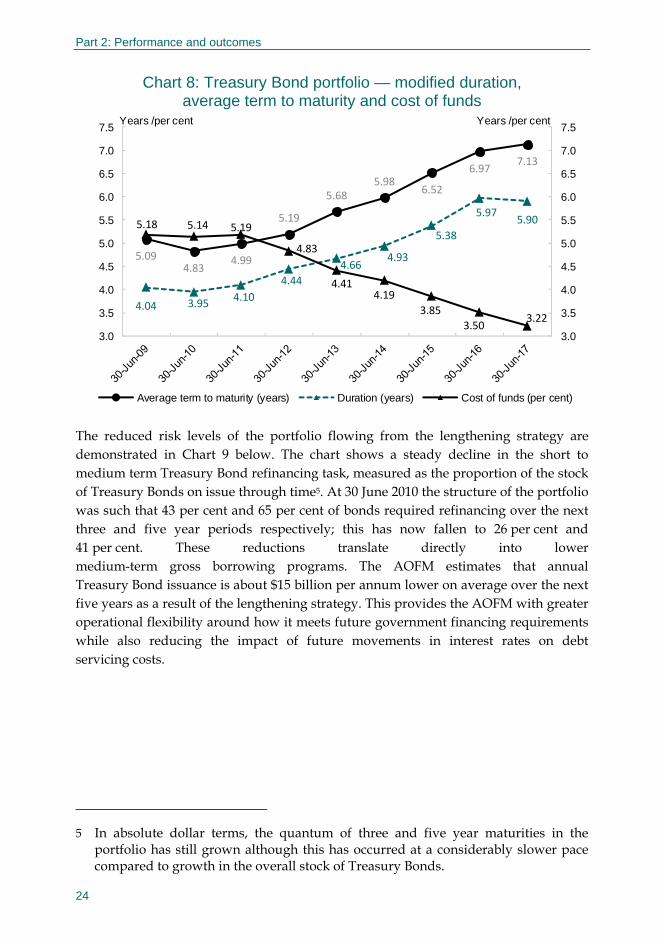
Chart 8 shows that the average term to maturity of the Treasury Bond portfolio as a whole lengthened by 0.16 years to 7.13 years over 2016-2017. Duration was slightly lower due to a combination of bond yields moving higher over the year and the proximity of the July 2017 maturity to financial year end.3 The effective cost of funds or yield on the Treasury Bond portfolio fell from 3.50 to 3.22 per cent over the same period.4
3 The profile of modified duration over any span of time is rarely smooth. In particular it will tend to jump when bond lines mature or when the AOFM executes very large issuance transactions. It is also inversely correlated with movements in bond yields.
4 These are point in time measures as at 30 June each year, in contrast to the debt servicing cost incurred throughout the year captured in Table 3. Figures are calculated by weighting Treasury Bond issuance yields by book volume.
Part 2: Performance and outcomes
24
Chart 8: Treasury Bond portfolio — modified duration, average term to maturity and cost of funds
5.094.83
4.99
5.19
5.685.98
6.52
6.977.13
4.04 3.954.10
4.44
4.664.93
5.38
5.975.905.18 5.14 5.19
4.83
4.414.19
3.85
3.503.22
3.0
3.5
4.0
4.5
5.0
5.5
6.0
6.5
7.0
7.5
3.0
3.5
4.0
4.5
5.0
5.5
6.0
6.5
7.0
7.5
Average term to maturity (years) Duration (years) Cost of funds (per cent)
Years /per cent Years /per cent
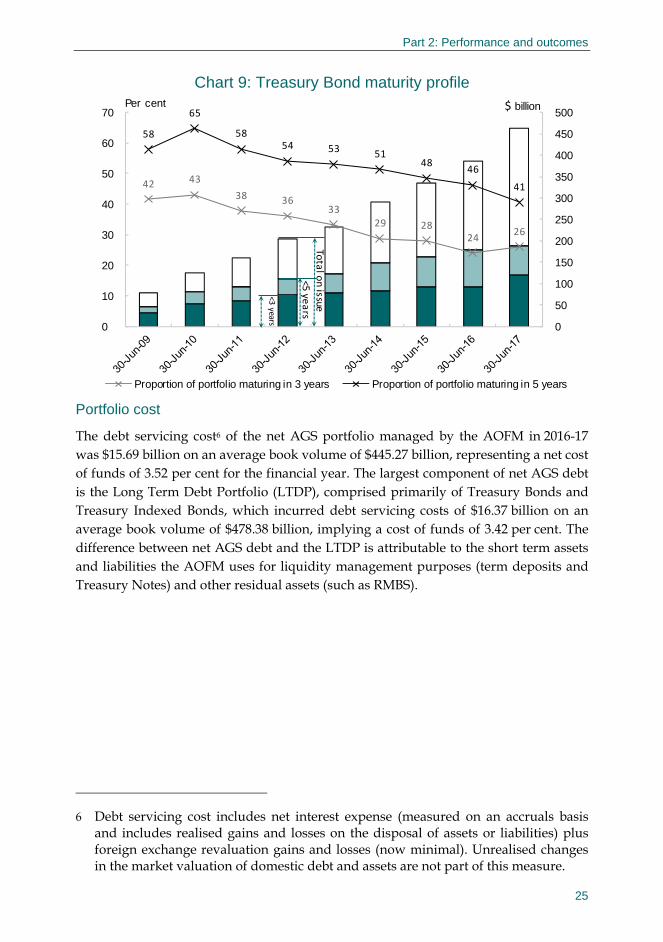
The reduced risk levels of the portfolio flowing from the lengthening strategy are demonstrated in Chart 9 below. The chart shows a steady decline in the short to medium term Treasury Bond refinancing task, measured as the proportion of the stock of Treasury Bonds on issue through time5. At 30 June 2010 the structure of the portfolio was such that 43 per cent and 65 per cent of bonds required refinancing over the next three and five year periods respectively; this has now fallen to 26 per cent and 41 per cent. These reductions translate directly into lower medium-term gross borrowing programs. The AOFM estimates that annual Treasury Bond issuance is about $15 billion per annum lower on average over the next five years as a result of the lengthening strategy. This provides the AOFM with greater operational flexibility around how it meets future government financing requirements while also reducing the impact of future movements in interest rates on debt servicing costs.
5 In absolute dollar terms, the quantum of three and five year maturities in the portfolio has still grown although this has occurred at a considerably slower pace compared to growth in the overall stock of Treasury Bonds.
Part 2: Performance and outcomes
25
Chart 9: Treasury Bond maturity profile
42 43
38 3633
29 2824
26
58
65
5854 53 51
4846
41
0
50
100
150
200
250
300
350
400
450
500
0
10
20
30
40
50
60
70
Proportion of portfolio maturing in 3 years Proportion of portfolio maturing in 5 years
Per cent $ billion
<3 years
<5 ye
ars
Totalon issue
Portfolio cost
The debt servicing cost6 of the net AGS portfolio managed by the AOFM in 2016-17 was $15.69 billion on an average book volume of $445.27 billion, representing a net cost of funds of 3.52 per cent for the financial year. The largest component of net AGS debt is the Long Term Debt Portfolio (LTDP), comprised primarily of Treasury Bonds and Treasury Indexed Bonds, which incurred debt servicing costs of $16.37 billion on an average book volume of $478.38 billion, implying a cost of funds of 3.42 per cent. The difference between net AGS debt and the LTDP is attributable to the short term assets and liabilities the AOFM uses for liquidity management purposes (term deposits and Treasury Notes) and other residual assets (such as RMBS).
6 Debt servicing cost includes net interest expense (measured on an accruals basis and includes realised gains and losses on the disposal of assets or liabilities) plus foreign exchange revaluation gains and losses (now minimal). Unrealised changes in the market valuation of domestic debt and assets are not part of this measure.
Part 2: Performance and outcomes
26
Chart 10: Net AGS debt and Long Term Debt Portfolio cost of funds analysis (per cent)
2007‐08
2008‐09 2009‐10
2010‐11
2011‐122012‐13
2013‐142014‐15
2015‐162016‐17
0.0
1.0
2.0
3.0
4.0
5.0
6.0
7.0
8.0
0.0
1.0
2.0
3.0
4.0
5.0
6.0
7.0
8.0
Jun-07 Jun-08 Jun-09 Jun-10 Jun-11 Jun-12 Jun-13 Jun-14 Jun-15 Jun-16 Jun-17
Net AGS debt Long term debt portfolio
10Y bond yield moving average Cash rate
Per cent Per cent
Funding costs fell sharply in 2008-09 due to gains from the disposal of interest rate sw aps.
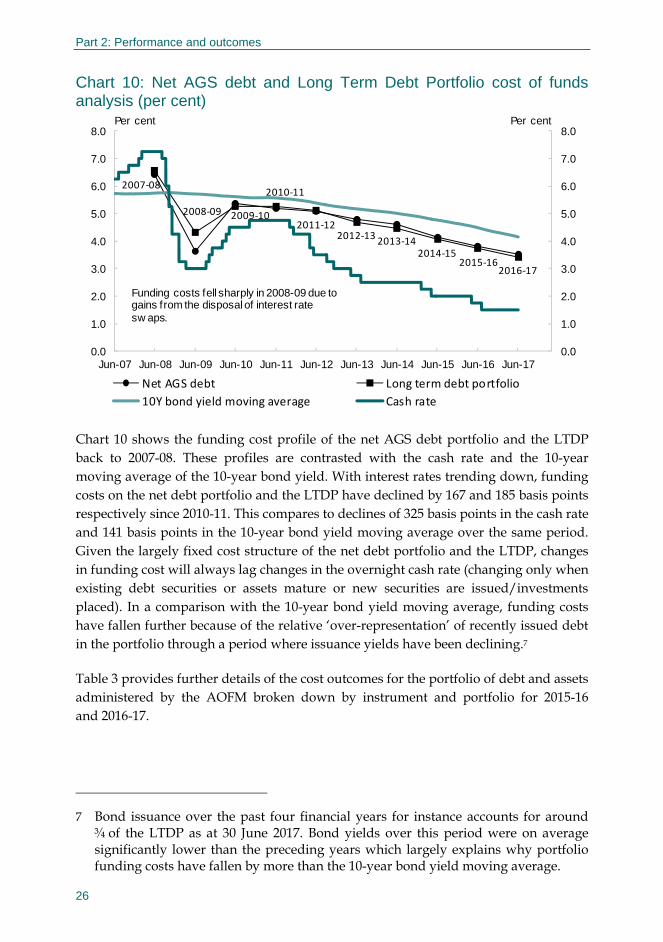
Chart 10 shows the funding cost profile of the net AGS debt portfolio and the LTDP back to 2007-08. These profiles are contrasted with the cash rate and the 10-year moving average of the 10-year bond yield. With interest rates trending down, funding costs on the net debt portfolio and the LTDP have declined by 167 and 185 basis points respectively since 2010-11. This compares to declines of 325 basis points in the cash rate and 141 basis points in the 10-year bond yield moving average over the same period. Given the largely fixed cost structure of the net debt portfolio and the LTDP, changes in funding cost will always lag changes in the overnight cash rate (changing only when existing debt securities or assets mature or new securities are issued/investments placed). In a comparison with the 10-year bond yield moving average, funding costs have fallen further because of the relative ‘over-representation’ of recently issued debt in the portfolio through a period where issuance yields have been declining.7
Table 3 provides further details of the cost outcomes for the portfolio of debt and assets administered by the AOFM broken down by instrument and portfolio for 2015-16 and 2016-17.
7 Bond issuance over the past four financial years for instance accounts for around ¾ of the LTDP as at 30 June 2017. Bond yields over this period were on average significantly lower than the preceding years which largely explains why portfolio funding costs have fallen by more than the 10-year bond yield moving average.

Part 2: Performance and outcomes
27
Table 3: Commonwealth debt and assets administered by the AOFM
2015-16 2016-17 2015-16 2016-17 2015-16 2016-17
Contribution by instrument
Treasury Bonds (14,246) (15,059) (375,961) (439,320) 3.79 3.43
Treasury Indexed Bonds (1,240) (1,312) (35,465) (39,064) 3.50 3.36
Treasury Notes (129) (72) (6,419) (4,339) 2.01 1.66
Foreign loans (a) (1) (0) (6) (5) 14.17 6.78
Gross physical AGS debt (15,616) (16,443) (417,851) (482,728) 3.74 3.41
Term deposits with the RBA 537 570 26,682 33,123 2.01 1.72
RMBS investments 112 70 3,314 2,379 3.37 2.93
State Housing Advances 118 115 2,033 1,958 5.80 5.86
Gross assets 766 754 32,029 37,460 2.39 2.01
Net AGS debt (14,850) (15,689) (385,822) (445,268) 3.85 3.52
Contribution by portfolio
Long Term Debt Portfolio (15,487) (16,372) (411,431) (478,389) 3.76 3.42
Cash Management Portfolio 408 498 20,263 28,784 2.01 1.73
RMBS Portfolio 112 70 3,314 2,379 3.37 2.93
State Housing Portfolio 118 115 2,033 1,958 5.80 5.86
Total debt and assets (14,850) (15,689) (385,822) (445,268) 3.85 3.52
Re-measurements (b) (17,633) 19,403
Total after re-measurements (32,483) 3,714 (385,822) (445,268)
Debt servicing cost Book volume Effective yield
$ million $ million per cent per annum
Note: Sub totals and totals are actual sum results, rounded to the nearest million dollars. Effective yields are based on actual results before rounding, rounded to two decimal places. Book volume is a through the year average. (a) Interest expense and effective yield on foreign loans incorporates foreign exchange revaluation effects. (b) Re-measurements refer to unrealised gains and losses from changes in the market valuation of financial
assets and liabilities.
The cost of gross debt increased in dollar terms by $828 million compared to the previous year. This was primarily due to an increase in the average volume of debt on issue from $417.85 billion in 2015-16 to $482.73 billion in 2016-17. In percentage terms however, the funding cost of gross debt declined by 33 basis points (from 3.74 per cent to 3.41 per cent). This improvement was driven by the issuance of new bonds through the year at yields that were below the average of pre-existing (and maturing) debt. Low rates also reduced the yield on funds invested in term deposits from 2.01 to 1.72 per cent and RMBS investments from 3.37 to 2.93 per cent.
The return on gross assets in dollar terms for the period was $754 million, a decrease of $12 million compared to 2015-16. This was driven by a $42 million reduction in income from RMBS (resulting from the maturity of existing investments and lower

Part 2: Performance and outcomes
28
interest rates) which was partially offset by a $33 million increase in income from term deposits resulting from holding higher balances through the year.
The net servicing cost of the combined portfolio of debt and assets was $15.69 billion. This was higher in dollar terms compared to 2015-16, due to the volume of debt on issue being higher than the previous year. As a percentage of net debt, servicing costs fell from 3.85 per cent to 3.52 per cent, a product of more expensive historically issued debt maturing and continued issuance over the year into a low interest rate environment.
Movements in market interest rates had a favourable impact on the market value of the portfolio in 2016-17. Unrealised gains from re-measurements amounted to $19.40 billion. This compares to an unrealised loss of $17.63 billion in the previous year. About 94 per cent of re-measurement gains are attributable to the lower market value of Treasury Bonds. Re-measurement items are highly volatile from one year to the next and have no bearing on the AOFM’s debt issuance strategy. Indeed were the AOFM to adopt a strategy designed to minimise the ‘noise’ from re-measurements, issuance would be limited to only very short-term debt securities, for example Treasury Notes and near maturity bonds, creating a portfolio structure that would maximise expected variability in debt servicing costs when measured in cash, accrual and public debt interest terms, while also maximising exposure to refinancing and funding risk. In practice, the AOFM has been seeking to reduce these risks, through allocating a greater proportion of issuance to long dated lines.
Cash management
Aims
The AOFM manages the daily cash balances of the Australian Government in the OPA.8 This is undertaken in a manner that ensures the government is able to meet its financial obligations as and when they fall due. Other objectives are to minimise the cost of funding and the carrying cost of holding cash balances (which centres on holding only balances assessed as prudent to cover forecast needs and contingencies, while investing excess balances but at low or minimal risk). In minimising cost, the AOFM seeks to avoid use of the overdraft facility provided by the RBA.9
8 The OPA is the collective term for the Core Bank Accounts maintained at the RBA for Australian Government cash balance management.
9 The overdraft facility is more costly than equivalent short-term borrowing (for example, issuance of Treasury Notes). The terms of the facility provide that it is to cover only temporary shortfalls of cash and is to be used infrequently and, in general, only to cover unexpected events.

Part 2: Performance and outcomes
29
Approach to achieving the aims
Achieving the cash management objective involves formulating forecasts of government cash flows, and developing and implementing appropriate strategies for short-term investments and debt issuance.
A precautionary asset balance is maintained to manage the forecasting risk associated with potentially large unexpected cash requirements (or shortfalls in revenue collections) and the funding risk associated with market constraints.
Cash balances not required immediately were invested in term deposits at the RBA, with the magnitudes and tenors of the term deposits determined by the AOFM. Maturity dates of term deposits were selected to most efficiently finance net outflows. Interest rates for term deposits at the RBA reflect the rates earned by the RBA in its open market operations.
Treasury Notes are issued to assist with management of the within-year funding requirement. The volume of Treasury Notes on issue ranged from $3 billion to $6.5 billion during 2016-17.
The size and volatility of the within-year funding requirement are reflected in changes in the short-term financial asset holdings managed by the AOFM, after deducting Treasury Notes on issue. Chart 11 shows movement in the funding requirement over the year.
Chart 11: Within-year funding requirement 2016-17
0
10
20
30
40
50
60
70
0
10
20
30
40
50
60
70
Jul-1
6
Aug
-16
Sep
-16
Oct
-16
Nov
-16
Dec
-16
Jan-
17
Feb
-17
Mar
-17
Apr
-17
May
-17
Jun-
17
$bil l ion$bill ion
Short-term financial assets less Treasury Notes

Part 2: Performance and outcomes
30
Outcomes
The task of meeting the government’s financial obligations as and when they fall due was fully met, without use of the overdraft facility provided by the RBA.
During 2016-17, the AOFM placed 424 term deposits with the RBA. The stock of term deposits fluctuated according to a range of factors influencing the AOFM’s cash portfolio management needs and decisions. The balance of term deposits ranged from a minimum of $14.6 billion in February 2017 to a maximum of $66.4 billion in June 2017.
The average yield obtained on term deposits during 2016-17 was 1.72 per cent, compared with 2.01 per cent in 2015-16. The decrease in average yield reflects the lower average level of interest rates that prevailed during 2016-17.
A total of $13 billion of Treasury Notes were issued in 2016-17 (in face value terms). The average coverage ratio at tenders was 3.35, an increase from 3.19 in 2015-16. Yields were on average around 10 basis points higher than Overnight Indexed Swap (OIS) rates for corresponding tenors (compared to around eight basis points higher than OIS rates in 2015-16). Details are available in Part 5 of this annual report.
The movement in total short-term financial asset holdings managed by the AOFM (OPA cash balance plus term deposits with the RBA), together with the volume of Treasury Notes on issue during 2016-17 are shown in Chart 12.
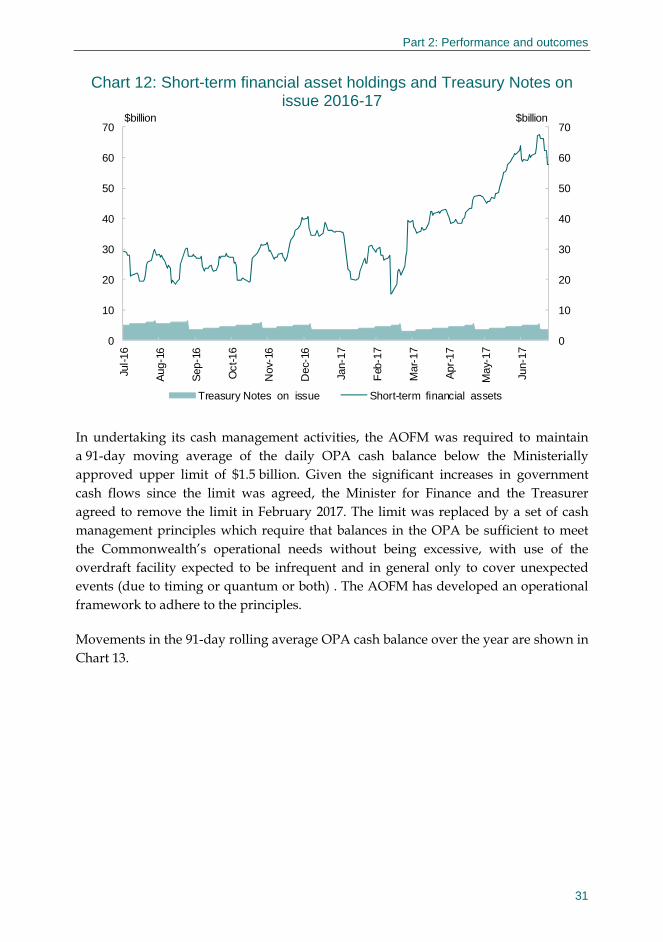
Part 2: Performance and outcomes
31
Chart 12: Short-term financial asset holdings and Treasury Notes on issue 2016-17
0
10
20
30
40
50
60
70
0
10
20
30
40
50
60
70Ju
l-16
Aug
-16
Sep
-16
Oct
-16
Nov
-16
Dec
-16
Jan-
17
Feb
-17
Mar
-17
Apr
-17
May
-17
Jun-
17
$billion$billion
Treasury Notes on issue Short-term financial assets
In undertaking its cash management activities, the AOFM was required to maintain a 91-day moving average of the daily OPA cash balance below the Ministerially approved upper limit of $1.5 billion. Given the significant increases in government cash flows since the limit was agreed, the Minister for Finance and the Treasurer agreed to remove the limit in February 2017. The limit was replaced by a set of cash management principles which require that balances in the OPA be sufficient to meet the Commonwealth’s operational needs without being excessive, with use of the overdraft facility expected to be infrequent and in general only to cover unexpected events (due to timing or quantum or both) . The AOFM has developed an operational framework to adhere to the principles.
Movements in the 91-day rolling average OPA cash balance over the year are shown in Chart 13.

Part 2: Performance and outcomes
32
Chart 13: 91-day moving average cash balance 2016-17
500
750
1,000
1,250
1,500
1,750
2,000
500
750
1,000
1,250
1,500
1,750
2,000
Jul-1
6
Aug
-16
Sep
-16
Oct
-16
Nov
-16
Dec
-16
Jan-
17
Feb
-17
Mar
-17
Apr
-17
May
-17
Jun-
17
$million$million
Residential mortgage-backed securities
Aim
During the period October 2008 to April 2013, the AOFM was directed to invest up to $20 billion in eligible RMBS to support competition in mortgage lending. In total, just under $15.5 billion was invested10. On 5 May 2015, the Treasurer issued a new Direction under the PGPA Act to divest the Government’s RMBS portfolio through a regular competitive process.
The Treasurer’s Direction requires that sales must not exceed $500 million per month and that the AOFM should exercise its discretion on timing and sales volume to minimise potential market disruptions. The Direction also provides the AOFM with discretion to cancel a sale or suspend the auction process when RMBS sales cannot occur at a price level that the AOFM considers to be acceptable.
Approach to achieving the aim and market influences
Consistent with the Treasurer’s Direction, the AOFM commenced a competitive sales process for the Government’s RMBS portfolio in June 2015. Under the current Direction, five auctions were held in which RMBS with an amortised value of around $458 million were sold. Conditions affecting the Australian RMBS market deteriorated during 2015 such that in November 2015 the AOFM exercised its operational discretion to suspend RMBS auctions until further notice.
10 Copies of each Direction are available on the AOFM website.
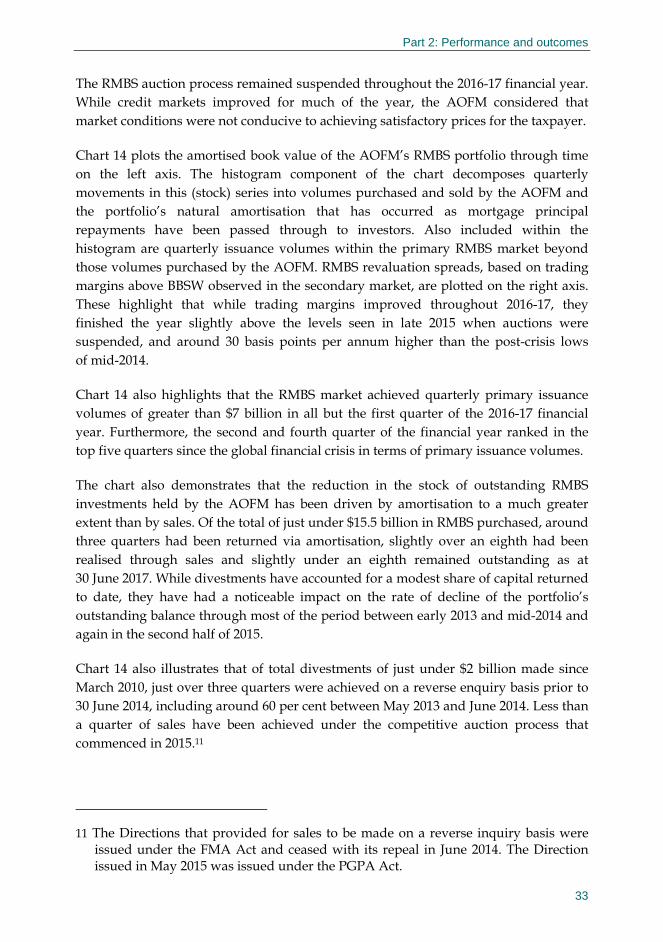
Part 2: Performance and outcomes
33
The RMBS auction process remained suspended throughout the 2016-17 financial year. While credit markets improved for much of the year, the AOFM considered that market conditions were not conducive to achieving satisfactory prices for the taxpayer.
Chart 14 plots the amortised book value of the AOFM’s RMBS portfolio through time on the left axis. The histogram component of the chart decomposes quarterly movements in this (stock) series into volumes purchased and sold by the AOFM and the portfolio’s natural amortisation that has occurred as mortgage principal repayments have been passed through to investors. Also included within the histogram are quarterly issuance volumes within the primary RMBS market beyond those volumes purchased by the AOFM. RMBS revaluation spreads, based on trading margins above BBSW observed in the secondary market, are plotted on the right axis. These highlight that while trading margins improved throughout 2016-17, they finished the year slightly above the levels seen in late 2015 when auctions were suspended, and around 30 basis points per annum higher than the post-crisis lows of mid-2014.
Chart 14 also highlights that the RMBS market achieved quarterly primary issuance volumes of greater than $7 billion in all but the first quarter of the 2016-17 financial year. Furthermore, the second and fourth quarter of the financial year ranked in the top five quarters since the global financial crisis in terms of primary issuance volumes.
The chart also demonstrates that the reduction in the stock of outstanding RMBS investments held by the AOFM has been driven by amortisation to a much greater extent than by sales. Of the total of just under $15.5 billion in RMBS purchased, around three quarters had been returned via amortisation, slightly over an eighth had been realised through sales and slightly under an eighth remained outstanding as at 30 June 2017. While divestments have accounted for a modest share of capital returned to date, they have had a noticeable impact on the rate of decline of the portfolio’s outstanding balance through most of the period between early 2013 and mid-2014 and again in the second half of 2015.
Chart 14 also illustrates that of total divestments of just under $2 billion made since March 2010, just over three quarters were achieved on a reverse enquiry basis prior to 30 June 2014, including around 60 per cent between May 2013 and June 2014. Less than a quarter of sales have been achieved under the competitive auction process that commenced in 2015.11
11 The Directions that provided for sales to be made on a reverse inquiry basis were issued under the FMA Act and ceased with its repeal in June 2014. The Direction issued in May 2015 was issued under the PGPA Act.

Part 2: Performance and outcomes
34
Chart 14: RMBS investments, amortisation and divestments
20
40
60
80
100
120
140
160
180
200
220
240
260
280
-2
-1
0
1
2
3
4
5
6
7
8
9
10
11
12Margin (bps)$ billion
AOFM RMBS portfolio divestmentAOFM RMBS portfolio amortisationNon-AOFM investment in RMBSAOFM RMBS investmentAOFM RMBS portfolio amortised value (stock)Average RMBS revaluation margin (RHS)
Source: AOFM, Macquarie Debt Markets Analysis
Turning to the financial performance of the RMBS portfolio, the weighted average margin over the one month bank bill rate of the AOFM’s RMBS book remained stable over the financial year at around 127 basis points per annum. Accrual interest income in 2016-17 was approximately $70 million. This represented an annualised accrual return of 2.93 per cent on the portfolio’s average book value of $2.379 billion. This is lower than the corresponding rate of return in 2015‐16, due largely to lower prevailing short term interest rates.
Losses or gains in the market value of the portfolio change with prevailing conditions and therefore vary at any particular point in time. These are not realised returns and so

Part 2: Performance and outcomes
35
are excluded from the accrual measure, but are included as re-measurements within the AOFM’s comprehensive income statement treatment.12
The RMBS securities held by the AOFM are valued using indicative ‘bid’ margins in secondary markets as estimated by an independent valuation service provider. The cumulative unrealised profit on the portfolio was $5 million as at the end of the financial year, a gain in value of around $15 million versus the year before. This improvement was due to the compression of revaluation spreads illustrated in Chart 14. The total return on the RMBS portfolio for 2016-17, including re-measurements, was thus around $85 million, or approximately 3.56 per cent of the portfolio’s average book value.
Market engagement
Aim
In order to achieve its core objectives the AOFM needs to maintain a comprehensive understanding of market related issues including major announcements and events, impacts on the global flow of capital, changing investor preferences, and the performance of banks that play the role of intermediaries — particularly in the primary AGS market, on which the AOFM relies exclusively for access to end investors. While this latter aim can in part be served by assessing announced regulatory changes there remains the need for a heavy emphasis on maintaining strong lines of communication directly with intermediaries and (both directly and indirectly through intermediaries) with end investors. Communication with intermediaries is frequent and with investors it is based on an investor relations program. The program is underpinned by an investor relations strategy that is reviewed annually, in response to changes in market conditions, investor activity and changes in the key investor base and/or the AOFM’s planned issuance strategy.
Achieving the Aims
The Investor Relations strategy in 2016-17 focused on identifying opportunities to promote further diversity in the AGS investor base while maintaining and managing engagement with current key investors.
There were four parts to the investor relations strategy:
• targeted direct engagement with investors in specific geographic regions (in particular Europe, Asia and Japan), and the current key investor base, together with monitoring emerging interest from new and potential investors;
12 Information on the realised gains made on the sale of RMBS for each financial year since 2009-10 can be found in the AOFM’s 2015-16 Annual Report.

Part 2: Performance and outcomes
36
• a regular use of face-to-face investor meetings (both within Australia andoffshore);
• increased use of opportunities to present to conferences or speaking events togroups of investors; and
• use of the AOFM website to provide updates for investors.
Of greatest interest to investors throughout the year were discussions about AGS market conditions, AOFM plans for issuance and further market development (with particular interest around yield curve extensions), and AOFM assessments on the changing composition of the AGS investor base.
Outcomes
With investors in the AGS market growing in number and geographic diversity, the ability to engage and/or meet with them regularly is becoming increasingly challenging. Domestic investors are easily accessible and therefore this part of the task is relatively straightforward and occurs with established regularity. The range and geographic locations of the non-resident investor base means that the AOFM will not have direct contact with most of these investors throughout the year. At the same time as new institutions such as fund managers, banks and hedge funds enter the market for the first time and current investor holdings and their activities within the market increase, the number of key AGS investors has also grown. Managing the choice between how, when, where and who to engage with during the year, remains a key priority and judgement.
A significant part of the investor engagement task over the last five to six years has involved understanding the potential demand for ultra-long AGS and explaining the AOFM’s planned issuance and yield curve extension strategy. Experience has shown that issuer transparency and reputational credibility are important factors for investors. With the issuance of a 30-year benchmark bond in October 2016, this signalled completion of the yield curve extension strategy, however some effort went in to updating investors on the AOFM’s ongoing issuance into the long end of the curve.
With this in mind, many of the 131 individual meetings (up from 116 last year) conducted throughout the year, were with investors focusing on long dated (ultra-long) AGS. Of the total number of meetings 29 were with new investors. Most of these new investors were offshore (i.e. non-resident) and these included bank balance sheets and fund managers.
The investor engagement strategy has proved useful in achieving the aims of enhancing the AOFM’s understanding of the investor base and explaining its market
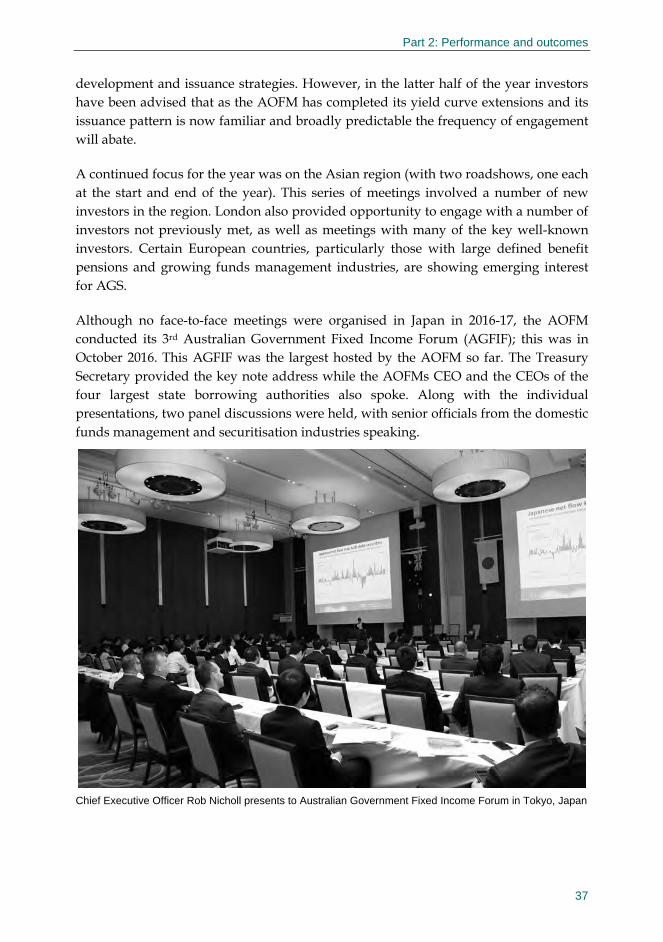
Part 2: Performance and outcomes
37
development and issuance strategies. However, in the latter half of the year investors have been advised that as the AOFM has completed its yield curve extensions and its issuance pattern is now familiar and broadly predictable the frequency of engagement will abate.
A continued focus for the year was on the Asian region (with two roadshows, one each at the start and end of the year). This series of meetings involved a number of new investors in the region. London also provided opportunity to engage with a number of investors not previously met, as well as meetings with many of the key well-known investors. Certain European countries, particularly those with large defined benefit pensions and growing funds management industries, are showing emerging interest for AGS.
Although no face-to-face meetings were organised in Japan in 2016-17, the AOFM conducted its 3rd Australian Government Fixed Income Forum (AGFIF); this was in October 2016. This AGFIF was the largest hosted by the AOFM so far. The Treasury Secretary provided the key note address while the AOFMs CEO and the CEOs of the four largest state borrowing authorities also spoke. Along with the individual presentations, two panel discussions were held, with senior officials from the domestic funds management and securitisation industries speaking.
Chief Executive Officer Rob Nicholl presents to Australian Government Fixed Income Forum in Tokyo, Japan

Part 2: Performance and outcomes
38
A total of 70 individual investors from 51 different institutions attended the AGFIF. Based on direct and indirect feedback from financial market participants the AGFIF is deemed to offer an efficient way to provide a general issuance update to the Tokyo investor community (which is now the single largest concentration of investors for the AOFM).
Australian based investors continued to grow in importance, particularly in the banking sector. Not only were the larger Australian banks more active in in AGS but an increasing number of medium sized and smaller ADIs were also active. Domestic fund managers continued to remain key investors and their importance was prominent, particularly in their participation of new long bond syndications. The domestic support for AGS issuance was obvious from the continued decline in non-resident holdings through the year, with the proportion of AGS held by non-resident investors falling to around 55 per cent in the June 2017 quarter. However the absolute holdings by non-residents continued to rise but the rate of increase has not matched the rate of increases in AOFM issuance (the difference being absorbed by the domestic investor base).
The AOFM continued to participate in third party sponsored conferences and events. These engagements provide a useful platform to reach a greater audience per day of effort. While these events do not substitute for the benefits derived from face-to-face meetings, they do offer opportunity to offer useful updates to investors and usually offer opportunity for short face-to-face meetings with some attendees.
As well as face-to-face meetings and presentations, the AOFM again conducted a number of phone meetings with international and domestic investors throughout the year. Regular fortnightly calls with ten domestic Treasury Indexed Bond investors have assisted in the selection of individual lines to tender and were useful in gauging demand for Treasury Indexed Bonds in general.
Table 4: Summary of investor relations activities in 2016-17 Activity Details
Conferences, speaking engagements and investor roadshows
16 events
Presentations: large engagements/ roundtables
7 presentations
Approximate total audience size: large presentations
315 attendees
Individual meetings 131 investor meetings
Individual cities visited 19 cities
AOFM staff participating in investor relation activities
CEO, Head of Investor Relations, Head of Funding and Liquidity, Senior Strategist Investor Relations, Acting Communications Officer Investor Relations, Analyst Funding and Liquidity
Hosting banks: Investor roadshows, conferences, roundtable discussions
ANZ, Commonwealth Bank, Deutsche Bank, UBS, Westpac

Governance of the AOFM ��������������������������������������������������������������41Overview of accountabilities ����������������������������������������������������������41Committees ��������������������������������������������������������������������������������42Management of fraud risk ������������������������������������������������������������ 44Enterprise risk ���������������������������������������������������������������������������� 44Business continuity arrangements ��������������������������������������������������45Assurance ��������������������������������������������������������������������������������� 46Judicial decisions�������������������������������������������������������������������������47External reports on agency operations ��������������������������������������������47Management of human resources ��������������������������������������������������47Consultants ��������������������������������������������������������������������������������51Purchasing ���������������������������������������������������������������������������������51ANAO access clauses and exempt contracts ������������������������������������52Procurement initiatives to support small business ����������������������������������������������������������������������������52
PART 3 MANAGEMENT AND ACCOUNTABILITY
39


41
MANAGEMENT AND ACCOUNTABILITY
Governance of the AOFM
The AOFM’s governance arrangements foster a strong organisational culture that enables efficient and effective delivery of business objectives. Key elements include:
• corporate and tactical business planning processes;
• enterprise-wide risk management, assurance and compliance activities that areoversighted by an Audit Committee chaired by an independent member;
• performance frameworks that facilitate on-going monitoring and review; and
• delegations, instructions and internal guidance regarding powers and duties toensure adherence with relevant legislation, regulations, and policies.
Overview of accountabilities
The AOFM is part of the Treasury portfolio. It is accountable to the Secretary to the Treasury and to the Treasurer, and through the Treasurer to the Parliament. As a listed entity under the PGPA Act the AOFM’s CEO is accountable for the management and performance of the AOFM, namely with respect to the implementation of debt management and investment policies. This also extends to matters such as the maintenance of accounts and records, management of risks and compliance with legislation and Government policy.
The Secretary to the Treasury is responsible for advising the Treasurer on Government policy relating to debt management and investment activities. In order to undertake the required functions of the AOFM, the CEO is delegated powers and authorisations by the Treasurer and the Secretary to the Treasury for debt creation and issuance, investment, and portfolio management.
The AOFM’s corporate plan, policies and codes of conduct mirror AOFM values and these reflect high standards of integrity and accountability. Activities are designed to meet the requirements of legislative and regulatory frameworks, as well as the codes and practices expected of financial market participants.
The AOFM meets an important part of its accountability to the Secretary of the Treasury through the annual (pre-Budget) provision of a comprehensive debt portfolio management strategy that takes into account the outlook for issuance (in the context of the financing task); appropriate AGS market development aspirations (such as yield

Part 3: Management and accountability
42
curve extensions); planned cash portfolio management parameters; and planned bond buybacks. This is then formalised after the release of the Budget through an annual remit, with the Treasurer approving the scope of planned borrowing on behalf of the government for the Budget year ahead.
Committees
Executive Group
The role of the AOFM Executive Group is to lead the continuing development of the AOFM in accordance with its purpose and objectives. The Executive Group assists and supports the CEO in fulfilling his responsibilities to manage the AOFM (in particular, as the accountable authority under the PGPA Act, and pursuant to other Commonwealth legislation). Its activities include the: setting and tracking of strategic plans and performance targets; review of the AOFM’s risk profile and setting of risk appetite; monitoring financial and compliance performance; and building capability and capacity to support high levels of performance. The Executive Group, which is chaired by the CEO and comprises the AOFM’s senior executives, meets monthly.
Audit Committee
The Audit Committee monitors and reviews the AOFM’s governance, enterprise risk management, internal control, and financial reporting arrangements. It receives periodic briefings from AOFM management on changes to the business and risk profiles. It oversees the AOFM’s assurance program, receiving reports, indicator dashboards and briefings from the AOFM’s Assurance unit and auditors. This information assists the Audit Committee to form a view on the AOFM’s compliance with its obligations, together with the on-going effectiveness of AOFM risk and control frameworks.
Key activities of the Committee during 2016-17 included:
• advice on the preparation and review of the AOFM’s financial statements;
• considering developments in the AOFM’s risk profile and complianceperformance, as reported through quarterly risk and assurance (including audit)reports;
• reviewing the adequacy of fraud control strategies and monitoring activities;
• monitoring the progress of: major corporate projects; initiatives to achieve theAOFM’s workforce planning outcomes; and the implementation of auditrecommendations; and
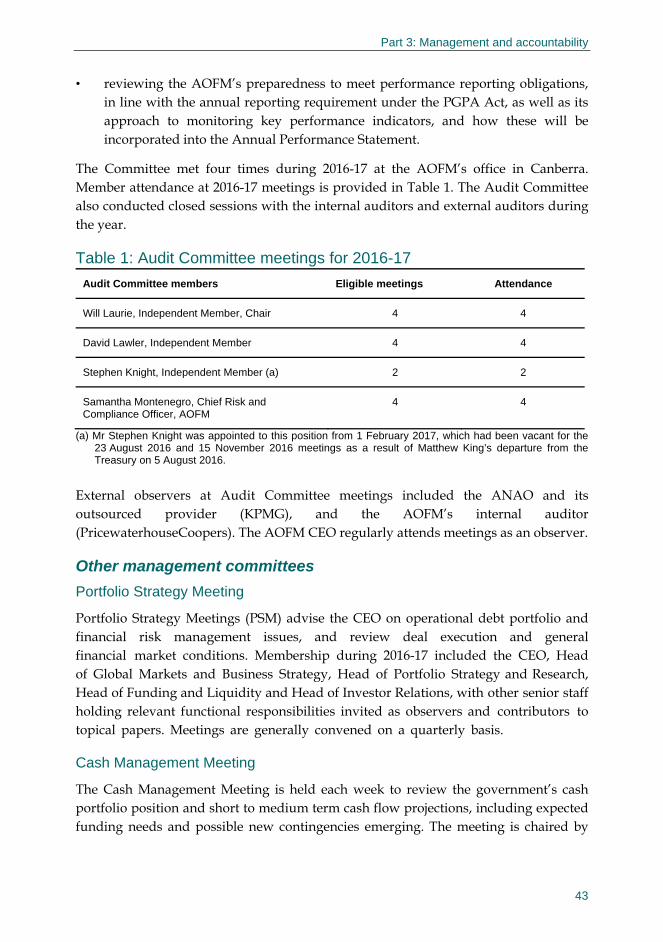
Part 3: Management and accountability
43
• reviewing the AOFM’s preparedness to meet performance reporting obligations,in line with the annual reporting requirement under the PGPA Act, as well as itsapproach to monitoring key performance indicators, and how these will beincorporated into the Annual Performance Statement.
The Committee met four times during 2016-17 at the AOFM’s office in Canberra. Member attendance at 2016-17 meetings is provided in Table 1. The Audit Committee also conducted closed sessions with the internal auditors and external auditors during the year.
Table 1: Audit Committee meetings for 2016-17
Audit Committee members Eligible meetings Attendance
Will Laurie, Independent Member, Chair 4 4
David Lawler, Independent Member 4 4
Stephen Knight, Independent Member (a) 2 2
Samantha Montenegro, Chief Risk and Compliance Officer, AOFM
4 4
(a) Mr Stephen Knight was appointed to this position from 1 February 2017, which had been vacant for the 23 August 2016 and 15 November 2016 meetings as a result of Matthew King’s departure from the Treasury on 5 August 2016.
External observers at Audit Committee meetings included the ANAO and its outsourced provider (KPMG), and the AOFM’s internal auditor (PricewaterhouseCoopers). The AOFM CEO regularly attends meetings as an observer.
Other management committees
Portfolio Strategy Meeting
Portfolio Strategy Meetings (PSM) advise the CEO on operational debt portfolio and financial risk management issues, and review deal execution and general financial market conditions. Membership during 2016-17 included the CEO, Head of Global Markets and Business Strategy, Head of Portfolio Strategy and Research, Head of Funding and Liquidity and Head of Investor Relations, with other senior staff holding relevant functional responsibilities invited as observers and contributors to topical papers. Meetings are generally convened on a quarterly basis.
Cash Management Meeting
The Cash Management Meeting is held each week to review the government’s cash portfolio position and short to medium term cash flow projections, including expected funding needs and possible new contingencies emerging. The meeting is chaired by

Part 3: Management and accountability
44
the CEO, and attended by the Head of Funding and Liquidity and other front office staff.
Security Committee
The Security Committee meets quarterly and oversights security management within the AOFM. Its membership comprises the CEO (as Chair), Chief Risk and Compliance Officer, Agency Security Advisor, and IT Security Advisor. The head of the Treasury Security Team is also invited to attend ex officio to assist in security harmonisation.
Management of fraud risk
The AOFM has a low risk appetite for fraud, and has taken comprehensive steps to prevent the occurrence of fraud. These include the application of a fraud control plan, and systems to ensure the regular identification, assessment and treatment of fraud risk vulnerabilities. The AOFM’s approach to fraud risk management complies with the PGPA Act and Rule and the Commonwealth Fraud Control Framework.
For 2016-17 the AOFM did not identify any instance of fraud or suspected fraud.
Enterprise risk
Risk management is integral to the AOFM’s activities and is viewed internally as the responsibility of all staff. The Executive Group, in a leadership capacity, fosters a strong risk culture and supports staff in judging appropriate risk in which to engage. The risk and assurance functions guide staff on the design, implementation and effective operation of appropriate risk treatments and controls.
The enterprise risk management framework provides for the active, transparent and collaborative management of uncertainty (threats and opportunities). Key reflection points are provided quarterly (at Executive Group meetings), and these are an established feature of annual corporate planning activities. Risk assessments are used as key inputs to strategy development and decisions on operational activities. The enterprise risk management framework captures information that is used to indicate emerging matters of note and key risks to be managed and monitored. This approach is used at both enterprise (‘top-down’, outward focussed) and business unit (‘bottom-up’, inward focussed) levels. Staff understand that risks are to be managed in line with the AOFM’s risk appetite and tolerance statements.
The AOFM’s enterprise risk management framework is consistent with the Commonwealth Risk Management Policy. In 2016-17, the framework was assessed at an ‘advanced’ rating of maturity under the Comcover Benchmarking Program, consistent with the AOFM’s target level of maturity.

Part 3: Management and accountability
45
The AOFM’s enterprise risks are classified into three broad categories:
• Strategic risks: opportunities and exposures that impact on the AOFM’s medium to long term objectives. These risks are monitored and reviewed by the Executive Group on a semi-annual basis, with a comprehensive review of the context in which the AOFM operates undertaken on an annual basis as part of the corporate planning process;
• Portfolio risks: impact on portfolio management, investment and debt issuance activities; these risks are managed pursuant to the AOFM’s financial risk management framework; and
• Operational risks: relate to business as usual and corporate activities of the AOFM, and generally deal with matters of compliance, or the availability, integrity and/or actions of staff, providers, systems and/or processes. These risks are reviewed at least on a quarterly basis.
The AOFM’s most significant risks typically arise from uncertainty relating to external factors (most notably the potential for sudden changes in economic or financial market conditions), or major changes to business activities. Key entity risks under management include the:
• potential negative impact of market trends or disruptive technologies on the successful issuance of AGS necessary to meet funding requirements;
• ongoing management of actions and messaging by the AOFM to maintain AGS investor confidence, as well as the positive view of the AGS market; and
• potential disruptions to third party suppliers or failure of internal systems and controls, which may negatively impact the AOFM’s ability to deliver outcomes in accordance with its objectives.
Business continuity arrangements
The AOFM has a comprehensive business continuity plan to ensure that its critical functions can continue in the event of a major short-term or prolonged disruption. These arrangements include the provision of full back-up of IT and related business services that can be implemented when the AOFM’s day-to-day business systems or office accommodation are not accessible, or when AOFM staff are not available to perform key tasks.
Business continuity plans were updated and tested in 2016-17, to ensure that staff are familiar with processes and procedures in the event of a business disruption. Business continuity arrangements are supplemented by emergency procedures to support the AOFM’s resiliency in a range of situations.
Part 3: Management and accountability
46
Assurance
The AOFM’s enterprise risk framework is complemented by an assurance framework, which seeks to confirm the operation and effectiveness of key controls. The framework is designed to meet the needs of the AOFM and is modelled on better practice industry standards.
The AOFM’s compliance with external obligations, internal controls and its business procedures is monitored through a co-sourced arrangement, with in-house assurance and compliance activities supplemented by the use of independent internal audit services.
In 2016-17, assurance and compliance activities provided structured assurance on the effectiveness and efficiency of the AOFM’s governance arrangements, risk management and internal control environment. Key activities undertaken in 2016-17 included:
• assurance tasks focussed on the AOFM’s new financial management information system;
• project assurance for implementation of the AOFM’s Treasury Bond buy-back program;
• maintenance and performance of the AOFM’s approach to obligations under the Anti-Money Laundering and Counter-Terrorism Financing Act 2006; and
• completion of annual assurance testing to assess compliance with key legislative and policy requirements, with monthly reporting provided to the Executive Group and quarterly reporting provided to the Audit Committee.
Information and output derived from the enterprise risk and assurance frameworks support the CEO in meeting the obligation to maintain a system of risk management and internal control pursuant to section 16 of the PGPA Act.
Internal audit
The AOFM’s internal audit service provider is PricewaterhouseCoopers. Internal audit coverage is determined using a methodology aligned with professional internal audit standards, with due regard to the AOFM’s business and risk contexts. The Audit Committee endorses the internal audit strategy, for CEO approval.
The internal auditor completed five reviews in 2016-17:
• AOFM’s compliance with AML/CTF legislation and AUSTRAC guidelines;

Part 3: Management and accountability
47
• two integrity reviews of critical spreadsheets for the: portfolio modelling framework; and the public debt interest model;
• assessing the adequacy of the approach to the development of the investor relations strategy; and
• a survey of the AOFM to understand its risk culture and progress towards a risk mature entity.
There was also a management initiated review of the AOFM’s adoption of the new One-Government financial management information system as implemented by the shared services provider (the Treasury).
In its annual report on internal controls, the internal auditor concluded that AOFM continues to have a mature control environment (demonstrated by the nature and type of findings reported). Audit recommendations were aimed at enhancing the efficiency of the current control environment or clarifying current settings. At 30 June 2017, five internal audit recommendations remained outstanding and these are being addressed in accordance with agreed timelines.
Judicial decisions
In 2016-17, no matters relating to the AOFM were the subject of judicial proceedings, administrative tribunal hearings or consideration by the Commonwealth Ombudsman.
External reports on agency operations
There were no reports in 2016-17 on the operations of the AOFM by the Auditor-General (other than the report on financial statements); a Parliamentary committee; or the Commonwealth Ombudsman.
Management of human resources
Workforce planning
The majority of actions arising from the AOFM Workforce Plan 2014-2018 have been completed. Actions relating to organisational resilience and succession risk management are ongoing and will continue beyond the current plan. Planning is underway to prepare the next workforce plan.
Enterprise Agreement
The AOFM Enterprise Agreement 2015-2018 was approved by the Fair Work Commission subject to an undertaking concerning staff at APS Level 2 and below. The agreement came into effect on 17 July 2015. One individual flexibility arrangement has been made under clause 1.5 of the Agreement during 2016-17. The CEO has increased

Part 3: Management and accountability
48
AOFM pay rates via a determination under subsection 24(1) of the Public Service Act 1999.
Training and development
In 2016-17, all staff participated in some form of training. This included compliance training, leadership programmes, financial market related courses, an internal seminar series, and individual professional development activities. Payments to external providers for training and development during the period were on average $4,303 per full-time equivalent employee (FTE).
The AOFM workforce
Table 2 shows this workforce by broadband classification as at the beginning and end of 2016-17.
Table 2: Operative and paid inoperative staff as at 30 June 2017 and 2016 Ongoing Non-ongoing
Full-time Part-time Full-time Part-time Classification Male Female Male Female Male Female Male Female Total
2017
AOFM1 - 2 - - - - - - 2
AOFM2 18 8 - 3 - - - - 29
AOFM3 5 1 - - - - - - 6
AOFM4 1 - - - - - - - 1
CEO 1 - - - - - - - 1
Total 25 11 - 3 - - - - 39
2016
AOFM1 - 2 - - - - - - 2
AOFM2 16 8 1 2 - 1 - - 28
AOFM3 5 1 - - - - - - 6
AOFM4 1 - - - - - - - 1
CEO 1 - - - - - - - 1
Total 23 11 1 2 - 1 - - 38
Note: AOFM broadband classifications are linked to Australian Public Service classifications as follows: AOFM1 corresponds to APS1 to APS4, AOFM2 corresponds to APS5 to EL1, AOFM3 corresponds to EL2 and AOFM4 covers higher level EL2.
One position was staffed by AOFM to support knowledge transfer and technical capacity building in sovereign debt management in the Solomon Islands during 2016-17. This position was a continuation of a past arrangement and originally organised under the Solomon Islands Economic and Public Sector Governance Program.
Ninety per cent of AOFM staff have degree qualifications, with 31 per cent holding higher degrees and 28 per cent holding double degrees. Forty-one per cent have professional qualifications related to the technical aspects of their role with the AOFM.

Part 3: Management and accountability
49
Employees who identify as indigenous
The AOFM does not have any staff who identify as indigenous.
Changes to senior management
There were no changes to senior management during 2016-17.
Other staffing changes
Five ongoing employees and one non-ongoing employee were recruited during 2016-17.
There were seven staff departures during the year; five ongoing staff and two non-ongoing.
Staff departures represented 19.0 per cent of average staffing levels in 2016-17 (24.9 per cent in 2015-16).
The retention rate for 2016-17 was 85.0 per cent, with an average annual retention rate of 88.6 per cent over the last five years.
Employment arrangements
All non-SES staff had terms and conditions set during 2016-17 by the AOFM Enterprise Agreement 2015-2018 and a determination made under subsection 24(1) of the Public Service Act 1999 by the CEO.
The CEO has his terms and conditions set by the Secretary through a determination made under subsection 24(1) of the Public Service Act 1999.
Remuneration
Pay rates as at 30 June 2017 are shown in Table 3. These rates were set in accordance with the AOFM Enterprise Agreement 2015-2018 and a determination made under subsection 24(1) of the Public Service Act 1999.
Table 3: AOFM salary ranges 30 June 2017
Band low Band high
Classification $ $
AOFM1 41,937 76,641
AOFM2 74,587 152,028
AOFM3 177,223 221,529
AOFM4 238,356 297,946
Remuneration within the range for the classification depends on individual performance ratings. Performance appraisals balance what is achieved (outputs) with

Part 3: Management and accountability
50
how those results are obtained (behaviours). Performance-linked bonuses are not available.
Non-salary benefits provided to staff principally comprise superannuation and support for professional development through study assistance, short courses and payment of job-relevant professional society membership fees. A mobile phone, laptop, or other mobile device may be provided where there is a business need. Remuneration for key management personnel is reported in Note A of Part 4: Financial Statements.
Disability reporting mechanism
Since 1994, non-corporate Commonwealth entities have reported on their performance as policy adviser, purchaser, employer, regulator and provider under the Commonwealth Disability Strategy. In 2007-08, reporting on the employer role was transferred to the Australian Public Service Commission’s State of the Service reports and the APS Statistical Bulletin. These reports are available at www.apsc.gov.au. From 2010-11, entities have no longer been required to report on these functions.
The Commonwealth Disability Strategy has been overtaken by the National Disability Strategy 2010-2020, which sets out a 10-year national policy framework to improve the lives of people with disability, promote participation and create a more inclusive society. A high level two-yearly report will track progress against each of the six outcome areas of the Strategy and present a picture of how people with disability are faring. The first of these reports was published in 2014, and can be found at www.dss.gov.au.
Work health and safety
Health, wellbeing and safety services are provided by the Treasury under a Memorandum of Understanding. The AOFM has one Health and Safety Representative who assists staff in accordance with the Work Health and Safety Act 2011.
Monitoring the emergence of notable work health and safety issues is a standing agenda item at Executive Group meetings.
Flu vaccinations were made available to staff in 2016-17. Counselling and related support is available under an Employee Assistance Programme provided by Davidson Trahaire Corpsych. Additional online resources are provided to all staff to assist with safety, health and wellbeing promotion.
There were no compensable injury claims in 2016-17.
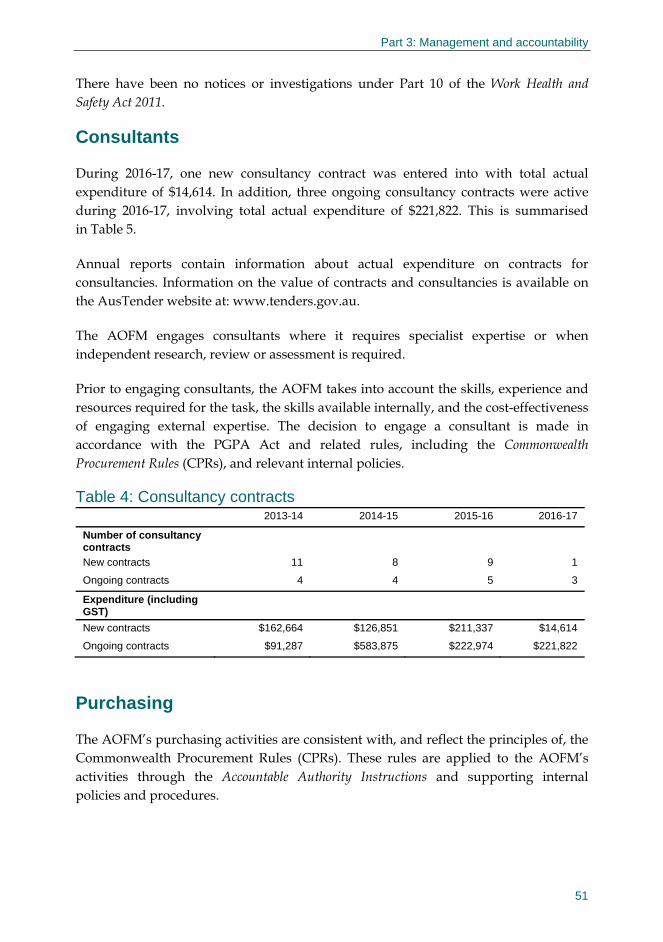
Part 3: Management and accountability
51
There have been no notices or investigations under Part 10 of the Work Health and Safety Act 2011.
Consultants
During 2016-17, one new consultancy contract was entered into with total actual expenditure of $14,614. In addition, three ongoing consultancy contracts were active during 2016-17, involving total actual expenditure of $221,822. This is summarised in Table 5.
Annual reports contain information about actual expenditure on contracts for consultancies. Information on the value of contracts and consultancies is available on the AusTender website at: www.tenders.gov.au.
The AOFM engages consultants where it requires specialist expertise or when independent research, review or assessment is required.
Prior to engaging consultants, the AOFM takes into account the skills, experience and resources required for the task, the skills available internally, and the cost-effectiveness of engaging external expertise. The decision to engage a consultant is made in accordance with the PGPA Act and related rules, including the Commonwealth Procurement Rules (CPRs), and relevant internal policies.
Table 4: Consultancy contracts 2013-14 2014-15 2015-16 2016-17
Number of consultancy contracts
New contracts 11 8 9 1
Ongoing contracts 4 4 5 3
Expenditure (including GST)
New contracts $162,664 $126,851 $211,337 $14,614
Ongoing contracts $91,287 $583,875 $222,974 $221,822
Purchasing
The AOFM’s purchasing activities are consistent with, and reflect the principles of, the Commonwealth Procurement Rules (CPRs). These rules are applied to the AOFM’s activities through the Accountable Authority Instructions and supporting internal policies and procedures.

Part 3: Management and accountability
52
The AOFM’s Procurement Plan is published annually and available from the AusTender website: www.tenders.gov.au. The plan is updated when circumstances change.
ANAO access clauses and exempt contracts
Four contracts in excess of $100,000 were entered into during the reporting period that did not provide for the Auditor-General to have access to the contractor’s premises.
One contract was for the syndicated issuance of $7.6 billion of Australian Government Treasury Bonds (a March 2047 maturity) in October 2016. The AOFM appointed ANZ Citi, Commonwealth Bank of Australia, Deutsche Bank AG, UBS AG (Australia Branch) and Westpac Institutional Bank to act as joint-lead managers for the issue.
The second contract was for the syndicated issuance of $9.3 billion of Australian Government Treasury Bonds (a December 2021 maturity) in January 2017. The AOFM appointed ANZ, Citi, UBS AG (Australia Branch) and Westpac Institutional Bank to act as joint-lead managers for the issue.
The third contract was for the syndicated issuance of $11 billion of Australian Government Treasury Bonds (a November 2028 maturity) in February 2017. The AOFM appointed ANZ, Commonwealth Bank of Australia, Deutsche Bank AG and Westpac Institutional Bank to act as joint-lead managers for the issue.
The fourth contract was for the syndicated issuance of $0.7 billion of Australian Government Treasury Indexed Bonds (an August 2040 maturity) in February 2017. The AOFM appointed Deutsche Bank AG, UBS AG (Australia Branch) and Westpac Institutional Bank to act as joint-lead managers for the issue.
ANAO access clauses were not included in the contracts as the AOFM maintains all relevant information in relation to the contracted services. Under these contracts, $49.7 million (including GST) was paid.
No contract or standing offer has been exempted from being published in the Purchasing and Disposals Gazette on the basis that it would disclose exempt matters under the Freedom of Information Act 1982.
Procurement initiatives to support small business
The AOFM supports small business participation in the Commonwealth Government procurement market. Small and Medium Enterprises (SME) and Small Enterprise participation statistics are available on the Department of Finance’s website.

Part 3: Management and accountability
53
www.finance.gov.au/procurement/statistics-on-commonwealth-purchasing-contracts/.
Consistent with paragraph 5.4 of the CPRs, the AOFM’s procurement practices provide appropriate opportunities for SMEs to compete and ensure that SMEs are not unfairly discriminated against.
The AOFM recognises the importance of ensuring that small businesses are paid on time. The results of the Survey of Australian Government Payments to Small Business are available on the Treasury’s website: www.treasury.gov.au.


Independent Auditor’s Report ��������������������������������������������������������57Statement by the Chief Executive Officer and Chief Financial Officer ����������������������������������������������������������������� 60Administered schedule of comprehensive income �����������������������������61Administered schedule of assets and liabilities �������������������������������� 63Administered reconciliation schedule ��������������������������������������������� 64Administered schedule of cash flows ����������������������������������������������65Statement of comprehensive income ��������������������������������������������� 66Statement of financial position ������������������������������������������������������67Statement of changes in equity ���������������������������������������������������� 68Statement of cash flows ���������������������������������������������������������������69Basis of preparation of the financial statements �������������������������������70Objectives and activities of the AOFM ��������������������������������������������73Administered Notes ���������������������������������������������������������������������75Departmental Notes �������������������������������������������������������������������104
PART 4 FINANCIAL STATEMENTS
55


Part 4: Financial statements
57

Part 4: Financial statements
58

Part 4: Financial statements
59

Part 4: Financial Statements
60
AUSTRALIAN OFFICE OF FINANCIAL MANAGEMENT
Statement by the Chief Executive Officer and Chief Financial Officer
In our opinion, the attached financial statements for the year ended 30 June 2017 comply with subsection 42 (2) of the Public Governance, Performance and Accountability Act 2013, and are prepared from properly maintained financial records as required by subsection 41 (2) of the Public Governance, Performance and Accountability Act 2013.
In our opinion, and on the condition of receiving continuing appropriations from Parliament, there are reasonable grounds to believe that the Australian Office of Financial Management will be able to pay its debts as and when they fall due.
No matter, transaction or event of a material or unusual nature has arisen in the interval between the end of the reporting period (30 June 2017) and the date of signing this report that has significantly affected or may significantly affect the AOFM’s operations.
Signed Signed
R Nicholl P Raccosta Chief Executive Officer Chief Financial Officer 24 August 2017 24 August 2017

Part 4: Financial Statements
61
AUSTRALIAN OFFICE OF FINANCIAL MANAGEMENT Administered schedule of comprehensive income for the period ended 30 June 2017
2017$'m
2016$'m Notes
EXPENSESInterest expense:
Treasury Bonds 14,644 13,943 2Treasury Indexed Bonds 1,312 1,240 3Treasury Notes 72 129 Other 1 1
Interest expense 16,029 15,313
Supplier expenses 47 26 Grants .. ..
Total expenses 16,076 15,339
INCOMEInterest revenue:
Loans to State and Territory Governments:Perpetual debt .. ..Advances 115 118
Deposits 570 537 Residential mortgage-backed securities 70 110
Interest revenue 755 765
Other .. ..
Total income 755 765
GAINS (LOSSES)Foreign exchange .. ..Residential mortgage-backed securities sales - 1 Debt repurchased (414) (303)
Total gains (losses) (414) (302)
Surplus (deficit) before re-measurements (15,735) (14,876)
RE-MEASUREMENTS (net market revaluation)Treasury Bonds 18,258 (17,160)Treasury Indexed Bonds 1,126 (443)Treasury Notes 1 (1)Other 18 (29)
Total re-measurements 19,403 (17,633)
Surplus (deficit) 3,668 (32,509)
The above schedule should be read in conjunction with the accompanying notes.

Part 4: Financial Statements
62
AUSTRALIAN OFFICE OF FINANCIAL MANAGEMENT Administered schedule of comprehensive income (continued) for the period ended 30 June 2017
Interest expense and interest revenue are determined using the effective interest method.
The category ‘gains (losses)’ represents the total proceeds paid or received from repurchasing debt prior to maturity or from selling a financial asset prior to maturity, less the amortised cost carrying value of the debt or financial asset using the effective interest method at the time of repurchase or sale. Given the AOFM conducts these transactions at market rates, the economic cost arising from their conduct is zero.
The category ‘surplus (deficit) before re measurements’ records a financial result that is consistent with an accruals (or amortised cost) basis of accounting under the historic cost accounting convention and is most relevant to the AOFM’s role in managing its debt portfolio whereby debt and other financial instruments are predominately issued and held to maturity, and where portfolio restructuring is performed primarily for portfolio management purposes, rather than for profit making purposes.
The category ‘re measurements’ provides information on the unrealised changes in the market revaluation of the portfolio of administered financial assets and financial liabilities (which are carried at fair value through profit or loss) during the financial year. This is relevant for assessing changes in financial risk exposures and changes to the value of transactions managed from year to year. The revaluation effect will net to zero over the life of a financial instrument.

Part 4: Financial Statements
63
AUSTRALIAN OFFICE OF FINANCIAL MANAGEMENT Administered schedule of assets and liabilities as at 30 June 2017
2017$'m
2016$'m Notes
LIABILITIESInterest bearing liabilities at fair value:
Treasury Bonds 499,040 436,937 2Treasury Indexed Bonds 44,718 41,417 3Treasury Notes 3,490 4,986 4Other debt (at fair value) .. 7
Interest bearing liabilities at amortised cost:Other debt (at amortised cost) 6 14
Interest bearing liabilities 547,254 483,361
Other - liabilities .. ..
Total liabilities 547,254 483,361
FINANCIAL ASSETSCash at bank 1 1 Investments at fair value:
Term deposits with the RBA 56,860 28,925 5Residential mortgage-backed securities 1,927 2,808 6
Loans at amortised cost:Loans to State and Territory Governments 1,872 1,957 7
Total assets 60,660 33,691
Net assets (486,594) (449,670)
The above schedule should be read in conjunction with the accompanying notes.
Financial assets and financial liabilities denoted as being measured at amortised cost, are measured at fair value on initial recognition and at amortised cost on subsequent measurement using the effective interest method. Changes in carrying value, including amortisation of premiums or discounts, are recognised in Interest Revenue (for assets) and Interest Expense (for liabilities).
Financial assets and financial liabilities denoted as being measured at fair value, are measured at fair value on initial recognition and at fair value through profit or loss on subsequent measurement. Changes in carrying value are attributed between changes in amortised cost of the asset and other changes. Changes in carrying value attributable to amortised cost, including amortisation of premiums or discounts, are recognised in Interest Revenue (for assets) and Interest Expense (for liabilities). Other changes in carrying value (including unrealised changes in valuation due to a change in interest rates) are recognised in Re measurements.
The AOFM is not aware of any quantifiable or unquantifiable administered contingencies as of the signing date that may have an impact on its operations.
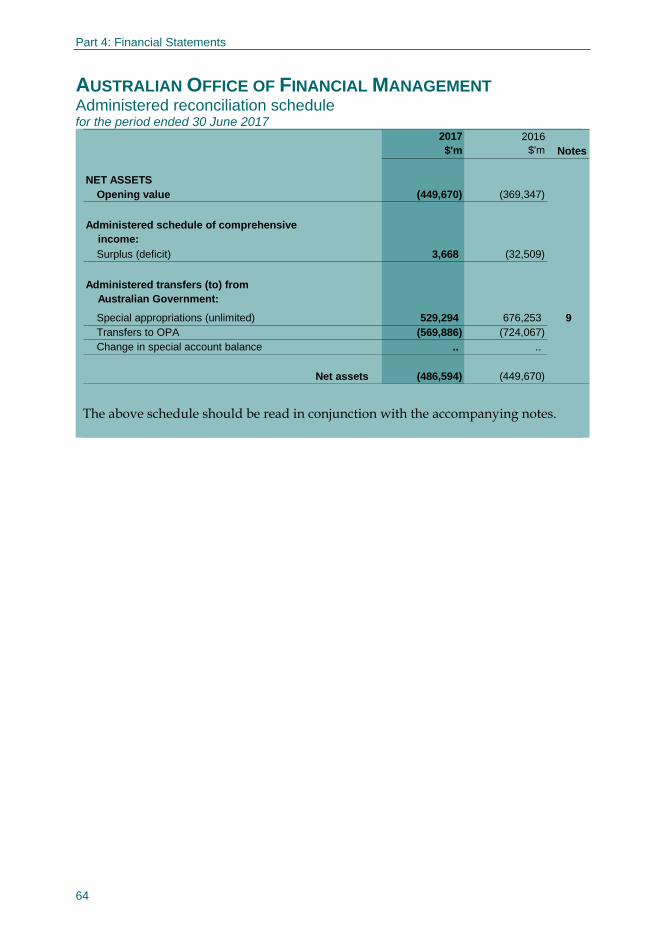
Part 4: Financial Statements
64
AUSTRALIAN OFFICE OF FINANCIAL MANAGEMENT Administered reconciliation schedule for the period ended 30 June 2017
2017$'m
2016$'m Notes
NET ASSETSOpening value (449,670) (369,347)
Administered schedule of comprehensive income:
Surplus (deficit) 3,668 (32,509)
Administered transfers (to) from Australian Government:
Special appropriations (unlimited) 529,294 676,253 9Transfers to OPA (569,886) (724,067)Change in special account balance .. ..
Net assets (486,594) (449,670)
The above schedule should be read in conjunction with the accompanying notes.

Part 4: Financial Statements
65
AUSTRALIAN OFFICE OF FINANCIAL MANAGEMENT Administered schedule of cash flows for the period ended 30 June 2017
2017$'m
2016$'m Notes
OPERATING ACTIVITIESCash received (used):
Interest receipts 713 750 GST refunds from ATO 3 2 Interest payments:
Treasury Bonds (17,198) (15,826) 2Treasury Indexed Bonds (908) (1,093) 3Treasury Notes (80) (128)Other (7) (7)
Other payments (50) (28)Net cash from operating activities (17,527) (16,330) 8
INVESTING ACTIVITIESCash received (used):
Capital proceeds from deposits 443,400 598,200
Capital proceeds from residential mortgage-backed securities 895 1,450 State and Territory loan repayments 94 92 Acquisition of deposits (471,300) (592,850)
Net cash from investing activities (26,911) 6,892
FINANCING ACTIVITIESCash received (used):
Capital proceeds from borrowings 124,053 122,812 Other receipts 23 27 Repayment of borrowings (39,032) (65,560)Other payments (14) (27)
Net cash from financing activities 85,030 57,252
TRANSACTIONS WITH OPACash from (to):
Appropriations 529,294 676,253 Special account payments 9 .. Receipts sent to OPA (569,886) (724,067)Special account receipts to OPA (9) ..
Net cash from OPA (40,592) (47,814)
Net change in cash held - -
+ cash held at the beginning of period 1 1
Cash held at the end of the period 1 1 The above schedule should be read in conjunction with the accompanying notes.
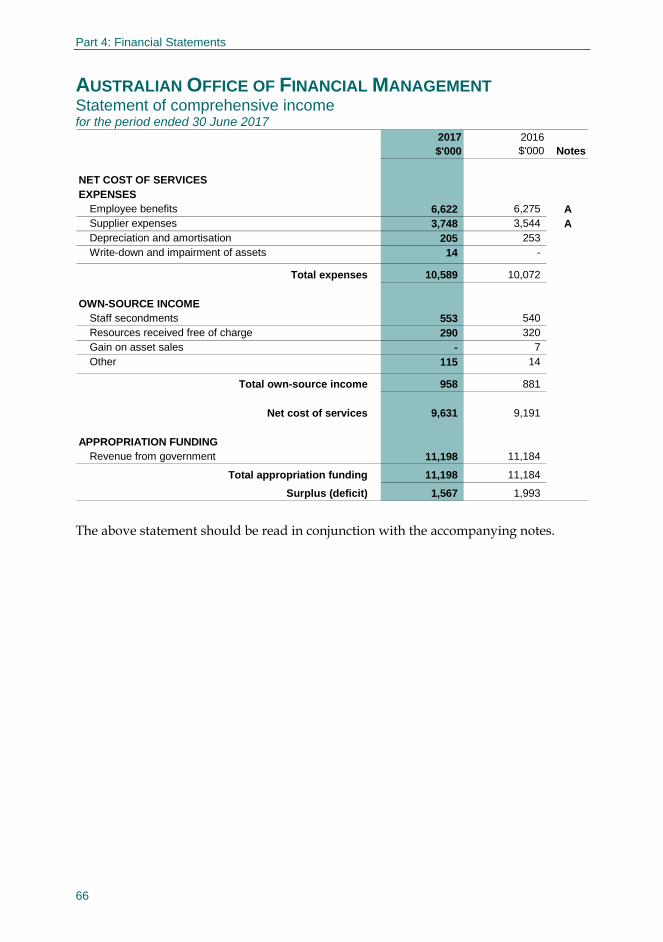
Part 4: Financial Statements
66
AUSTRALIAN OFFICE OF FINANCIAL MANAGEMENT Statement of comprehensive income for the period ended 30 June 2017
2017$'000
2016$'000 Notes
NET COST OF SERVICESEXPENSES
Employee benefits 6,622 6,275 ASupplier expenses 3,748 3,544 ADepreciation and amortisation 205 253 Write-down and impairment of assets 14 -
Total expenses 10,589 10,072
OWN-SOURCE INCOMEStaff secondments 553 540 Resources received free of charge 290 320 Gain on asset sales - 7 Other 115 14
Total own-source income 958 881
Net cost of services 9,631 9,191
APPROPRIATION FUNDINGRevenue from government 11,198 11,184
Total appropriation funding 11,198 11,184
Surplus (deficit) 1,567 1,993 The above statement should be read in conjunction with the accompanying notes.

Part 4: Financial Statements
67
AUSTRALIAN OFFICE OF FINANCIAL MANAGEMENT Statement of financial position as at 30 June 2017
2017$'000
2016$'000 Notes
ASSETSFinancial assets:
Cash and cash equivalents 100 100 Receivables 24,673 31,635 B
Non-financial assets:Computers, plant and equipment 409 44 Leasehold improvements 1,890 - CComputer software 1,104 1,272 DSupplier prepayments 58 107
Total assets 28,234 33,158
LIABILITIESPayables:
Supplier payables 510 124 Salary and superannuation 49 23 Other payables - 6
Provisions:Employee provisions 2,279 2,110 EOther provisions 418 160 F
Total liabilities 3,256 2,423
Net assets 24,978 30,735
EQUITYRetained surplus 29,611 28,044 Contributed equity (4,633) 2,691
Total equity 24,978 30,735 The above statement should be read in conjunction with the accompanying notes.
The AOFM is not aware of any quantifiable or unquantifiable departmental contingencies as of the signing date that may have an impact on its operations.
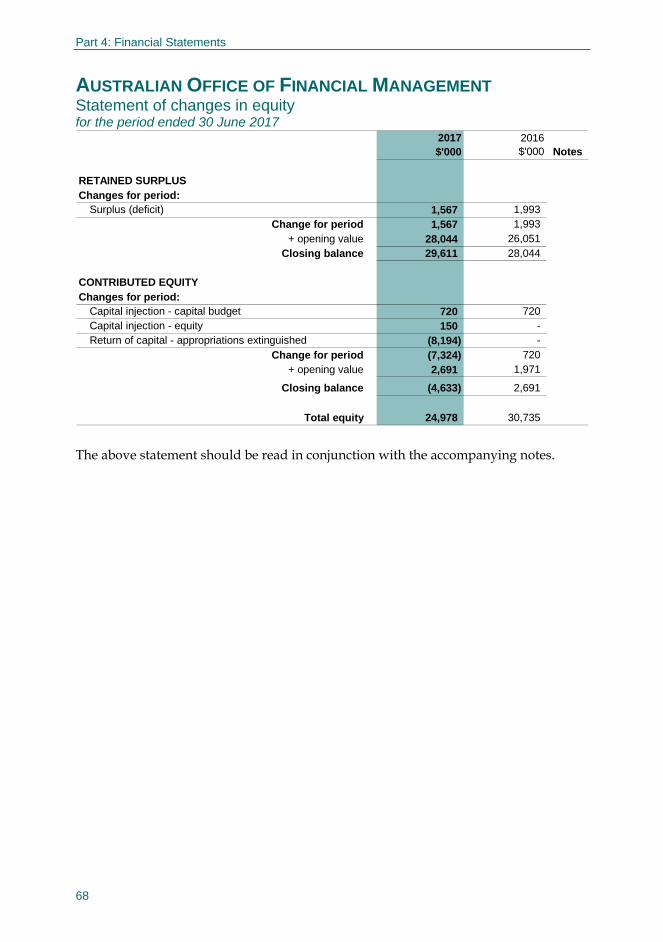
Part 4: Financial Statements
68
AUSTRALIAN OFFICE OF FINANCIAL MANAGEMENT Statement of changes in equity for the period ended 30 June 2017
2017$'000
2016$'000 Notes
RETAINED SURPLUSChanges for period:
Surplus (deficit) 1,567 1,993 Change for period 1,567 1,993
+ opening value 28,044 26,051 Closing balance 29,611 28,044
CONTRIBUTED EQUITYChanges for period:
Capital injection - capital budget 720 720 Capital injection - equity 150 - Return of capital - appropriations extinguished (8,194) -
Change for period (7,324) 720 + opening value 2,691 1,971
Closing balance (4,633) 2,691
Total equity 24,978 30,735 The above statement should be read in conjunction with the accompanying notes.

Part 4: Financial Statements
69
AUSTRALIAN OFFICE OF FINANCIAL MANAGEMENT Statement of cash flows for the period ended 30 June 2017
2017$'000
2016$'000 Notes
OPERATING ACTIVITIESCash received (used):
Appropriations 9,822 9,780 GST received from ATO 3 3 Services and other 585 562 Employees (6,470) (6,494)Suppliers (3,350) (3,277)GST paid to ATO (2) (9)Transfers to Official Public Account (a) (588) (764)
Net cash from operating activities - (199) G
INVESTING ACTIVITIESCash received (used):
Sale of computers, plant and equipment - 199 Purchase of leasehold improvements (1,294) - Purchase of plant and equipment (392) -
Net cash from investing activities (1,686) 199
FINANCING ACTIVITIESCash received (used):
Appropriations - contributed equity 1,686 -
Net cash from financing activities 1,686 -
Net change in cash held - -
+ cash held at the beginning of period100 100
Cash held at the end of the period 100 100 (a) Non-appropriation receipts are required to be returned to the Official Public Account (OPA). They
increase the AOFM’s available appropriation under section 74 of the Public Governance, Performance and Accountability Act 2013 and when subsequently drawn down for use by the AOFM they are recorded as appropriations.
The above statement should be read in conjunction with the accompanying notes.

Part 4: Financial Statements
70
BASIS OF PREPARATION OF THE FINANCIAL STATEMENTS The Australian Office of Financial Management (AOFM) is a listed entity under the Public Governance, Performance and Accountability Act 2013. The AOFM is a not-for-profit Australian Government entity.
These financial statements cover the AOFM as an individual entity and are for the reporting period 1 July 2016 to 30 June 2017. They are required by section 42 of the Public Governance, Performance and Accountability Act 2013, and are general purpose financial statements prepared on a going concern basis.
The financial statements have been prepared in accordance with:
• the Public Governance, Performance and Accountability (Financial Reporting) Rule 2015; and
• Australian Accounting Standards that apply for the reporting period.
The financial statements have been prepared on an historical cost basis, except for certain assets and liabilities which are carried at fair value or on a discounted cash flow basis as required or allowable by relevant accounting standards.
The financial statements are presented in Australian dollars and values are rounded as indicated.
The continued existence of the AOFM in its present form, and with its present
outcome and program, is dependent on government policy and on continuing appropriations by Parliament for the AOFM’s administration and activities.
1.1 New Australian Accounting Standards applicable to the reporting period
During 2016-17 the AOFM adopted all applicable Australian Accounting Standards that became effective during the reporting period.
1.2 New Australian Accounting Standards applicable in future reporting periods
A number of revised or new Australian Accounting Standards have been issued that are effective for future reporting periods. With the exception of AASB 16 Leases (effective for the 2019-20 financial year), and AASB 9 Financial Instruments (effective for the 2018-19 financial year) the revisions are not expected to materially affect the AOFM’s assets, liabilities, revenue or expenses.
AASB 16 Leases
Currently, accounting standards distinguish between operating leases and finance leases. Lessees are required to recognise finance leases only on the balance sheet. Under AASB 16 the majority of leases will need to be recognised on the balance sheet by lessees. The standard is expected to have a moderate impact on the AOFM’s departmental balance sheet arising from its property lease which is currently recognised as an operating lease.
Part 4: Financial Statements
71
AASB 9 Financial Instruments
Financial assets
Currently, all of the AOFM’s administered financial assets, with the exception of loans to the State and the Territory Governments, are designated at fair value through profit or loss. Loans to the State and the Territory Governments are measured at amortised cost.
AASB 9 establishes new principles for determining the accounting treatment for financial assets. AASB 9 requires that a financial asset be measured at:
• amortised cost — where the business objective of the entity is to hold the instrument to collect its contractual cash flows (rather than trading to earn capital profits) and those contractual cash flows are solely in the nature of principal and interest on the principal outstanding; or
• fair value through other comprehensive income — where the business objective is achieved by collecting the contractual cash flows and selling financial assets, and those contractual cash flows are solely in the nature of principal and interest on the principal outstanding; or
• fair value through profit or loss — where the financial asset is held for trading to earn capital profits, or is designated as such to reduce an accounting mismatch, or where contractual cash flows are not solely in the nature of principal and interest.
Where an entity’s objective for holding a financial asset changes, so too should the accounting treatment, where relevant. The sale of a financial asset for portfolio management, credit or liquidity reasons may not represent a change of purpose from one of collection of contractual cash flows.
The cash flows arising from the AOFM’s administered investments are in the nature of principal and interest. Accordingly, the AOFM’s objective for holding these assets will be relevant for determining their measurement. The AOFM currently holds term deposit investments to collect contractual cash flows; and holds residential mortgage-backed securities to collect contractual cash flows and for sale. On adoption of AASB 9 the AOFM may need to change its accounting treatment for its financial assets from fair value through profit or loss to amortised cost for term deposits, and fair value through other comprehensive income for residential mortgage-backed securities. For assets classified at amortised cost or at fair value through other comprehensive income an allowance for expected credit losses needs to be considered. This is not expected to be material for the AOFM. The quantitative impact on the AOFM’s administered financial assets has not been determined.
Financial liabilities
The classification requirements for financial liabilities remain largely unchanged in AASB 9 from AASB 139. The AOFM is not expecting a quantitative impact on the

Part 4: Financial Statements
72
measurement of its administered financial liabilities resulting from the accounting standard changes.
For financial liabilities carried at fair value through profit or loss, AASB 9 has adopted a revised disclosure for the presentation of unrealised fair value gains and losses due to own credit risk. These changes require the gain or loss to be apportioned between changes in credit risk (recognised in other comprehensive income) and other changes (recognised in profit or loss).

Part 4: Financial Statements
73
OBJECTIVES AND ACTIVITIES OF THE AOFM
The AOFM’s activities are focused on delivering to a single outcome:
the advancement of macroeconomic growth and stability, and the effective operation of financial markets, through issuing debt, investing in financial assets and managing debt, investments and cash for the Australian Government.
The AOFM aims to achieve the outcome through the following objectives:
• meeting the budget financing task in a cost-effective manner subject to acceptable risk;
• facilitating the government’s cash outlay requirements as and when they fall due; and
• being a credible custodian of the Australian Government Securities market and other portfolio responsibilities.
The AOFM manages a portfolio of debt and financial assets on behalf of the Australian Government. It issues Treasury Bonds and Treasury Indexed Bonds to finance budget deficits. It also manages the government’s cash in the Official Public Account (OPA) which is surplus to immediate requirements to manage the within-year financing task. It undertakes the administration, financial and operational risk management, and financial reporting of its portfolio of debt and assets.
Financing the budget
For many years debt issuance by the AOFM was undertaken solely with the objective of maintaining the Treasury Bond and Treasury Bond futures markets, as successive budget surpluses removed the need to borrow to fund the Budget. On 3 February 2009 the Budget outlook changed in the Updated Economic and Fiscal Outlook and the objective of issuance changed to funding the Budget. Since that time the AOFM has significantly increased debt issuance and intensified its engagement with investors (including overseas investors) and intermediaries.
Portfolio management
The cost and risk of the debt portfolio is managed through debt issuance and (where appropriate) investment activities. Since early 2009, debt issuance volumes have exceeded those necessary to maintain liquidity in Treasury Bond and Treasury Bond futures markets, affording the AOFM with a greater level of flexibility in setting its issuance program against an overarching objective of minimising cost subject to acceptable risk. In recent years the AOFM has lengthened the duration of its Treasury Bond portfolio through longer term issuance as a means of reducing refinancing risk

Part 4: Financial Statements
74
and the variability of debt servicing costs. The Treasury Bond yield curve extends to 30 years currently (an extension of 18 years since 2011).
Cash management
The AOFM manages the overall level of cash in the OPA to ensure that the government is able to meet its financial obligations as and when they fall due. To this end, it makes short-term borrowings by issuing Treasury Notes. It invests OPA cash surplus to short term requirements in term deposits with the RBA. The AOFM holds continuing balances of short-term assets to allow it to respond flexibly and quickly to swings in cash requirements.
The OPA is recorded in the Department of Finance’s financial statements and is not reported by the AOFM.
Investments in residential mortgage-backed securities (RMBS)
From September 2008 to April 2013 the AOFM was directed by the government to invest up to $20 billion in Australian RMBS to support competition in the Australian residential mortgage market. The AOFM invested $15.5 billion in RMBS over the life of the program.
On 5 May 2015, the then Treasurer issued a direction to the AOFM to divest the RMBS portfolio through a regular competitive process, subject to appropriate market conditions as determined by the AOFM.
Legislation
The AOFM’s borrowing and portfolio management activities comply with applicable legislative requirements. The key legislative mechanisms that governed these activities during the reporting period were as follows:
• the Commonwealth Inscribed Stock Act 1911 represents the Australian Government’s primary vehicle for the creation and issuance of stock, including Treasury Bonds, Treasury Indexed Bonds and Treasury Notes. It also provides a standing authority to the Treasurer to borrow in Australian currency;
– On 9 May 2017 the Treasurer issued a direction under section 51JA of the Act permitting the AOFM to borrow up to $600 billion.
• the Loans Securities Act 1919 includes provisions relating to overseas borrowings, securities lending, repurchase agreements and other financial arrangements;
• the Financial Agreement Act 1994 formalises debt consolidation and redemption arrangements applying since 1 July 1990 between the Australian Government and the State and Territory Governments; and
• section 58 of Public Governance, Performance and Accountability Act 2013 allows the Treasurer to invest public money in authorised investments.
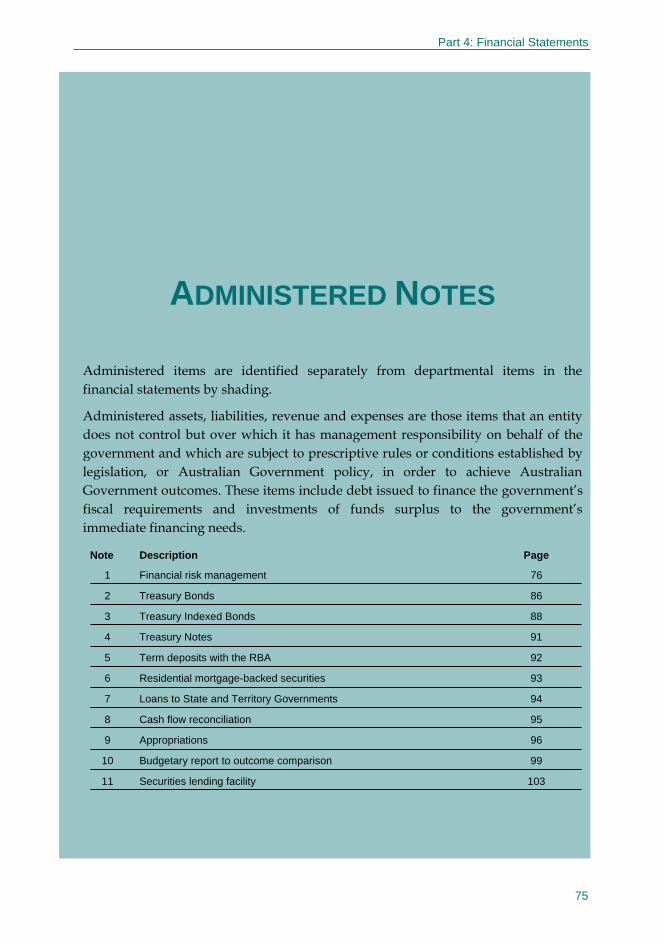
Part 4: Financial Statements
75
76
86
88
91
92
93
94
95
96
99
103
ADMINISTERED NOTES
Administered items are identified separately from departmental items in the financial statements by shading.
Administered assets, liabilities, revenue and expenses are those items that an entity does not control but over which it has management responsibility on behalf of the government and which are subject to prescriptive rules or conditions established by legislation, or Australian Government policy, in order to achieve Australian Government outcomes. These items include debt issued to finance the government’s fiscal requirements and investments of funds surplus to the government’s immediate financing needs.
Note Description Page
1 Financial risk management
2 Treasury Bonds
3 Treasury Indexed Bonds
4 Treasury Notes
5 Term deposits with the RBA
6 Residential mortgage-backed securities
7 Loans to State and Territory Governments
8 Cash flow reconciliation
9 Appropriations
10 Budgetary report to outcome comparison
11 Securities lending facility

Part 4: Financial Statements
76
Note 1: Financial risk management
The government is exposed to financial risks arising from its portfolio of financial assets and liabilities — interest rate risk, inflation risk, credit risk, prepayment risk, liquidity risk and refinancing risk. These risks are managed by the AOFM within a financial risk management framework that includes directions from the Treasurer and policies and limits approved by the Secretary to the Treasury and overseen by the CEO and senior management of the AOFM.
Timing mismatches between the Australian Government’s receipts and expenditures cause large fluctuations in the volume of short term assets and liabilities managed by the AOFM, and thus in the overall size of its net portfolio, relative to the gross volume of debt outstanding. To provide stability in the management of the longer term component of debt, long term financing and short term financing are managed through separate portfolios, the debt portfolio and the cash management portfolio. In addition, the investments in RMBS and loans to State and Territory Governments are held in separate portfolios.
Debt portfolio
The debt portfolio is used to meet the Australian Government’s budget financing needs and to support efficient Treasury Bond and Treasury Bond futures markets. Issuance is the primary mechanism for managing interest rate risk of the debt portfolio. That is, the AOFM manages the cost structure of the debt portfolio through the choice of instruments and bond series in issuing debt. The annual debt issuance strategy is informed by qualitative and quantitative factors to achieve an interest rate profile that appropriately balances cost and cost variability, investor demand and diversification, the refinancing task and financial market efficiency. The cost and interest rate risk of the debt portfolio is regularly measured and reported to the Secretary to the Treasury.
Cash management portfolio
The cash management portfolio is used to manage within year timing mismatches between Australian Government receipts and expenditures. The cash management portfolio holds a fluctuating portfolio of short term investments and short term liabilities. The portfolio is managed to achieve an appropriate balance between refinancing risk and interest rate risk.
Residential mortgage backed securities (RMBS)
With the government decision to divest the RMBS portfolio, market conditions are an important consideration in managing the sale of the portfolio. Due to a deterioration in market conditions, in 2016-17 the AOFM did not conduct auctions to sell its RMBS.

Part 4: Financial Statements
77
Note 1: Financial risk management (continued)
Interest rate risk
Interest rate risk represents the risk to debt servicing cost outcomes and investment return outcomes, and to the value of debt and financial assets caused by changes in interest rates.
In its ordinary course of business the primary measure used by the AOFM to assess interest rate risk is the accruals basis of accounting under the historic cost accounting convention. Fair value measures of interest rate risk are considered to be secondary.
Financial instruments with a fixed interest rate expose the portfolio to changes in fair value with changes in interest rates, whilst those financial instruments at floating interest rates expose the portfolio to changes in debt servicing costs with changes in interest rates. The extent to which the AOFM can match the repricing profile of financial assets with financial liabilities is limited due to the differences in the volumes and the need for assets to be available for cash management or other purposes. The interest rate exposure is predominately to fixed interest instruments.
The following sensitivity analysis illustrates the interest rate risk sensitivity of administered financial instruments and the financial impact on profit or loss and equity to a reasonably possible change in domestic interest rates on 30 June 2017 (30 June 2016), with all other variables held constant, to financial positions held as at 30 June 2017 (30 June 2016).

Part 4: Financial Statements
78
Note 1: Financial risk management (continued)
CarryingValue
$'m +30 - 30
2017: Impact $'m Impact $'m
Changes in fair value:Treasury Bonds 499,040 8,705 (8,973)Treasury Indexed Bonds 44,718 978 (1,016)Treasury Notes 3,490 2 (2)Term deposits with the RBA 56,860 (6) 6 Residential mortgage-backed securities 1,927 (9) 9
Changes in interest revenue:Residential mortgage-backed securities 1,927 6 (6)
$'m +30 - 30
2016: Impact $'m Impact $'m
Changes in fair value:Treasury Bonds 436,937 7,711 (7,941)Treasury Indexed Bonds 41,417 969 (1,006)Treasury Notes 4,986 3 (3)Term deposits with the RBA 28,925 (2) 2 Residential mortgage-backed securities 2,808 (17) 17
Changes in interest revenue:Residential mortgage-backed securities 2,808 8 (8)
Sensitivity (basis points)
The following assumptions have been made in undertaking the analysis:
• a sensitivity of 30 basis points has been used for domestic interest rates as at 30 June 2017 and 30 June 2016;
• a parallel shift in interest rates (real and nominal) takes place;
• for fixed rate instruments that are carried at fair value, changes in fair value only are considered relevant;
• for fixed rate instruments that are carried at amortised cost, interest rate risk is not considered relevant;
• for floating rate instruments, the impact on interest revenue or interest expense represents an annualised estimate calculated as if the positions as at each 30 June were outstanding for the whole financial year.

Part 4: Financial Statements
79
Note 1: Financial risk management (continued)
Interest rate exposure and quality of fair value measurements
Carrying value
$'m Fixed interest
rate Floating
interest rate Non-interest
bearing
2017:Liabilities:
Treasury Bonds 499,040 499,040 - - Treasury Indexed Bonds 44,718 44,718 - - Treasury Notes 3,490 3,490 - - Other 6 - - 6
Total 547,254 547,248 - 6
Assets:Cash at bank 1 - - 1 Term deposits with the RBA 56,860 56,860 - - Residential mortgage-backed securities 1,927 - 1,927 - Loans to State and Territory Governments 1,872 1,872 - ..
Total 60,660 58,732 1,927 1
2016:Liabilities:
Treasury Bonds 436,937 436,937 - - Treasury Indexed Bonds 41,417 41,417 - - Treasury Notes 4,986 4,986 - - Other 21 16 - 5
Total 483,361 483,356 - 5 Assets:
Cash at bank 1 - - 1 Term deposits with the RBA 28,925 28,925 - - Residential mortgage-backed securities 2,808 - 2,808 - Loans to State and Territory Governments 1,957 1,957 - ..
Total 33,691 30,882 2,808 1
Interest exposure

Part 4: Financial Statements
80
Note 1: Financial risk management (continued)
Effective interest rate
as at 30 June (per cent) (a)
Balance measured at
fair value $'m (b)
Level 1Market
rates
Level 2Observable
inputs
2017:Liabilities:
Treasury Bonds 3.24% 499,040 499,040 - Treasury Indexed Bonds 1.70% 44,718 44,718 - Treasury Notes 1.58% 3,490 3,490 - Other 0.00% - - -
Total 547,248 547,248 -
Assets:Cash at bank - - - - Term deposits with the RBA 1.68% 56,860 - 56,860 Residential mortgage-backed securities 2.88% 1,927 - 1,927 Loans to State and Territory governments 5.89% - - -
Total 58,787 - 58,787
2016:Liabilities:
Treasury Bonds 3.52% 436,937 436,937 - Treasury Indexed Bonds 1.80% 41,417 41,417 - Treasury Notes 1.91% 4,986 4,986 - Other 4.01% 8 - 8
Total 483,348 483,340 8 Assets:
Cash at bank - - - - Term deposits with the RBA 1.83% 28,925 - 28,925 Residential mortgage-backed securities 3.12% 2,808 - 2,808 Loans to State and Territory governments 5.88% - - -
Total 31,733 - 31,733
Fair value determined by
(a) These interest rates are relevant for determining the amortised cost value of financial assets and
financial liabilities, and hence the value of interest expense and interest revenue reported. These interest rates are not relevant for determining fair value as at period end.
(b) Only those financial assets and financial liabilities measured at fair value as at period end are reported in this column. Those measured at amortised cost are excluded.

Part 4: Financial Statements
81
Note 1: Financial risk management (continued)
Inflation risk
Treasury Indexed Bonds have their principal value indexed against the all Groups Australian Consumer Price Index (CPI). The interest is a fixed rate of interest payable on the accreted principal value. Accordingly these debt instruments expose the AOFM to inflation risk on interest payments and on the value of principal payable on maturity. There is a six month lag between the calculation period for the CPI and its impact on the value of interest and principal.
Credit risk
Credit risk is the risk of non-performance (including partial performance) by a counterparty to a financial contract, leading to a financial loss for the creditor.
The AOFM’s investment activity is made in accordance with legislative requirements, delegations and directions from the Treasurer and policies and limits established by the Secretary to the Treasury. For 2016-17 the limits established allowed only for investment in term deposits with the Reserve Bank of Australia.
To protect the Australian Government’s financial position with respect to securities lending arrangements (which allows market participants to borrow Treasury Bonds and Treasury Indexed Bonds not readily available from other sources), the market value of the collateral securities taken from counterparties is greater than the market value of the Treasury Bonds or Treasury Indexed Bonds lent. There is a right to seek additional collateral if there is a decline in the market value of the collateral securities relative to the lent securities.
The AOFM no longer makes new investments in RMBS. The credit quality of the remaining RMBS (after sales and principal repayments) derives from the underlying quality of the mortgage assets and structural enhancements.

Part 4: Financial Statements
82
Note 1: Financial risk management (continued)
Credit risk (continued)
The following table sets out the AOFM’s credit risk by asset class and credit rating as at the reporting date.
Fair value
$'m AaaAAA
Aa1AA+
Aa2AA
2017:
Cash at bank 1 1 - - Term deposits with the RBA 56,860 56,860 - - Residential mortgage-backed securities 1,927 1,927 - - Loans to State and Territory Governments 2,397 1,026 328 1,043
Total 61,185 59,814 328 1,043
2016:
Cash at bank 1 1 - - Term deposits with the RBA 28,925 28,925 - - Residential mortgage-backed securities 2,808 2,808 - - Loans to State and Territory Governments 2,662 1,148 782 732
Total 34,396 32,882 782 732
S&P, Fitch or Moody'slong term credit rating (a)
(a) Where a counterparty has a split rating between the rating agencies, the AOFM’s exposure is allocated to the lower credit rating. The RBA is assumed to have the same credit rating as the Commonwealth of Australia.
Prepayment risk
All RMBS currently held by the AOFM are fully amortising, pass through instruments. This means that the principal collections from the underlying portfolio of mortgages are repaid to the holders of the securities thereby reducing the principal outstanding on them.
Due to the pass through nature of the RMBS, the repayment of principal is dependent upon the timing of principal repayments on the underlying mortgages and the payment priorities set out in each trust. Accordingly, the rate at which principal is repaid varies over time and the actual date that the securities will be repaid in full cannot be precisely determined (this is referred to as prepayment risk).

Part 4: Financial Statements
83
Note 1: Financial risk management (continued)
Prepayment risk (continued)
The AOFM monitors the performance of each RMBS issue through a monthly report by the issuer. The report provides details of cash received from payments on the underlying mortgages, payments made, the rate of the loan principal repayments ahead of scheduled principal payments and the estimated weighted average remaining life of the securities.
Liquidity risk and refinancing risk
The following table discloses the undiscounted value of the contractual maturities of financial liabilities as at the reporting date, including estimated future interest payments. Interest payments and the principal value on redemption of Treasury Indexed Bonds are based on capital values as at period end.
Total future cash flows
Within1 year
1 to 5years
Up to 5 yearssub-total
2017:Principal:
Treasury Bonds 464,044 31,169 157,126 188,295 Treasury Indexed Bonds 40,242 - 20,277 20,277 Treasury Notes 3,482 3,482 - 3,482 Other 6 6 - 6
Interest:Treasury Bonds 125,277 17,718 54,077 71,795 Treasury Indexed Bonds 7,482 962 3,044 4,006 Treasury Notes 18 18 - 18 Other - - - -
Total 640,551 53,355 234,524 287,879
2016:Principal:
Treasury Bonds 385,220 11,828 166,742 178,570 Treasury Indexed Bonds 35,991 - 13,730 13,730 Treasury Notes 4,969 4,969 - 4,969 Other 21 21 - 21
Interest:
Treasury Bonds 110,282 16,114 49,452 65,566 Treasury Indexed Bonds 7,318 876 3,120 3,996 Treasury Notes 31 31 - 31 Other - - - -
Total 543,832 33,839 233,044 266,883
Payable within 5 years $'m

Part 4: Financial Statements
84
Note 1: Financial risk management (continued)
Liquidity risk and refinancing risk (continued)
5 to 10 years
10 to 15years 15 years+
5 years and greater
sub-total
2017:Principal:
Treasury Bonds 162,499 71,200 42,050 275,749 Treasury Indexed Bonds 8,581 4,705 6,679 19,965 Treasury Notes - - - - Other - - - -
Interest:Treasury Bonds 35,806 9,989 7,687 53,482 Treasury Indexed Bonds 1,990 947 539 3,476 Treasury Notes - - - - Other - - - -
Total 208,876 86,841 56,955 352,672
2016:Principal:
Treasury Bonds 122,600 55,000 29,050 206,650 Treasury Indexed Bonds 13,206 3,936 5,119 22,261 Treasury Notes - - - - Other - - - -
Interest:
Treasury Bonds 31,521 8,601 4,594 44,716 Treasury Indexed Bonds 1,969 865 488 3,322 Treasury Notes - - - - Other - - - -
Total 169,296 68,402 39,251 276,949
Payable in greater than 5 years $'m
The AOFM manages liquidity risk by maintaining sufficient cash and short-term investments to ensure that the government can meet its financial obligations as and when they fall due. The AOFM manages the daily volume of cash in the OPA by monitoring the projected daily transactions of major spending and revenue agencies, undertaking investment of funds that are surplus to immediate cash requirements and by issuing Treasury Notes. The AOFM also has access to an overdraft facility with the RBA. The overdraft facility is not to be used in normal day-to-day operations but only to cover temporary, unexpected shortfalls of cash and it has a limit of $1 billion (in the absence of Ministerial approval). The AOFM monitors the daily balance in the OPA, holdings of short-term assets and short-term and long-term debt issuance activity.

Part 4: Financial Statements
85
Note 1: Financial risk management (continued)
Liquidity risk and refinancing risk (continued)
Refinancing risk is the risk that when maturing debt needs to be funded by debt issuance, it may have to be refinanced at a higher cost or market conditions may prevent sufficient funds from being raised in an orderly manner. The AOFM seeks to control refinancing risk by issuing along the entire yield curve. This creates a range of short-dated and mid-to-long-dated exposures that balance cost and refinancing patterns. In formulating its debt issuance strategy the AOFM considers the volume of debt in any one line and the maturity structure of its debt (including the number of bond lines and the maturity gaps between lines).
The AOFM monitors market conditions in order to form a view on refinancing risk, and considers it when issuing debt along the yield curve. In addition, as a means of further reducing refinancing risk in future years and to improve market efficiency, the AOFM conducts regular buy backs of Treasury Bonds that no longer form part of the ASX three-year futures contract.

Part 4: Financial Statements
86
Note 2: Treasury Bonds
Treasury Bonds are denominated in Australian dollars and pay a fixed coupon semi-annually in arrears. Treasury Bonds are redeemable at face value on maturity. There are no options available to either the Australian Government or the holder of the securities to exchange or convert Treasury Bonds. There are also no options to either party for early redemption. The AOFM issues Treasury Bonds primarily through a competitive auction process to registered bidders. In certain circumstances syndicated issuance is undertaken.
Accounting policy
The AOFM monitors the cost and risk on Treasury Bonds primarily on an accruals basis, but also on a fair value basis. The AOFM has designated Treasury Bonds to be carried at fair value through profit or loss under AASB 139.
The fair value of Treasury Bonds is determined by reference to observable market rates for identical instruments.
Key aggregates are comprised of: 2017$'m
2016$'m
SCHEDULE OF ADMINISTERED COMPREHENSIVE INCOMEInterest expense:
Interest paid / payable 17,236 16,043 Amortisation of net premiums (2,592) (2,100)
Interest expense 14,644 13,943
SCHEDULE OF ADMINISTERED ASSETS AND LIABILITIESTreasury Bonds:
Face value 464,044 385,220 Accrued interest 4,041 4,003 Unamortised net premiums 12,473 10,974 Market value adjustment 18,482 36,740
Carrying value 499,040 436,937
SCHEDULE OF ADMINISTERED CASH FLOWS
Interest paid:Coupons paid 17,844 16,365 Interest received on issuance (709) (726)Interest paid on repurchase 63 187
Interest paid 17,198 15,826 As at 30 June 2017 the weighted average market yield on Treasury Bonds was 2.30 per cent (30 June 2016: 1.82 per cent). As at 30 June 2017 the weighted average (nominal) issuance yield on Treasury Bonds was 3.24 per cent (30 June 2016: 3.52 per cent).
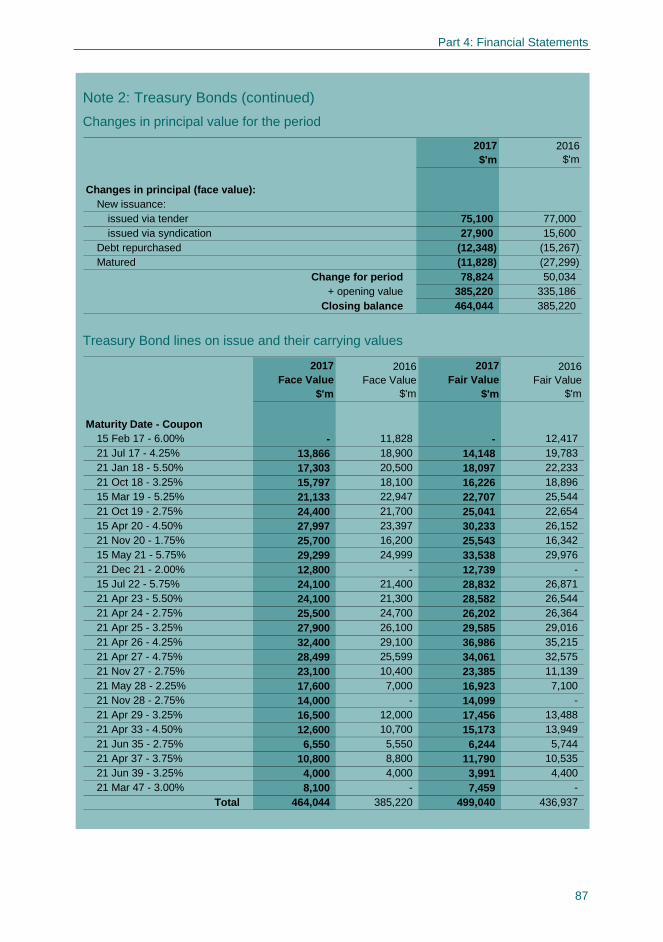
Part 4: Financial Statements
87
Note 2: Treasury Bonds (continued)
Changes in principal value for the period
2017$'m
2016$'m
Changes in principal (face value):New issuance:
issued via tender 75,100 77,000 issued via syndication 27,900 15,600
Debt repurchased (12,348) (15,267)Matured (11,828) (27,299)
Change for period 78,824 50,034 + opening value 385,220 335,186
Closing balance 464,044 385,220 Treasury Bond lines on issue and their carrying values
2017Face Value
$'m
2016Face Value
$'m
2017Fair Value
$'m
2016Fair Value
$'m
Maturity Date - Coupon15 Feb 17 - 6.00% - 11,828 - 12,417 21 Jul 17 - 4.25% 13,866 18,900 14,148 19,783 21 Jan 18 - 5.50% 17,303 20,500 18,097 22,233 21 Oct 18 - 3.25% 15,797 18,100 16,226 18,896 15 Mar 19 - 5.25% 21,133 22,947 22,707 25,544 21 Oct 19 - 2.75% 24,400 21,700 25,041 22,654 15 Apr 20 - 4.50% 27,997 23,397 30,233 26,152 21 Nov 20 - 1.75% 25,700 16,200 25,543 16,342 15 May 21 - 5.75% 29,299 24,999 33,538 29,976 21 Dec 21 - 2.00% 12,800 - 12,739 - 15 Jul 22 - 5.75% 24,100 21,400 28,832 26,871 21 Apr 23 - 5.50% 24,100 21,300 28,582 26,544 21 Apr 24 - 2.75% 25,500 24,700 26,202 26,364 21 Apr 25 - 3.25% 27,900 26,100 29,585 29,016 21 Apr 26 - 4.25% 32,400 29,100 36,986 35,215 21 Apr 27 - 4.75% 28,499 25,599 34,061 32,575 21 Nov 27 - 2.75% 23,100 10,400 23,385 11,139 21 May 28 - 2.25% 17,600 7,000 16,923 7,100 21 Nov 28 - 2.75% 14,000 - 14,099 - 21 Apr 29 - 3.25% 16,500 12,000 17,456 13,488 21 Apr 33 - 4.50% 12,600 10,700 15,173 13,949 21 Jun 35 - 2.75% 6,550 5,550 6,244 5,744 21 Apr 37 - 3.75% 10,800 8,800 11,790 10,535 21 Jun 39 - 3.25% 4,000 4,000 3,991 4,400 21 Mar 47 - 3.00% 8,100 - 7,459 -
Total 464,044 385,220 499,040 436,937

Part 4: Financial Statements
88
Note 3: Treasury Indexed Bonds
Treasury Indexed Bonds are denominated in Australian dollars and are capital-indexed with the principal value of the bond adjusted by reference to movements in the CPI (based on a six month lag).
Interest payments are made quarterly in arrears, at a fixed rate, on the adjusted capital value. At maturity, investors receive the adjusted capital value of the security.
The AOFM issues Treasury Indexed Bonds primarily through a competitive auction process to registered bidders. In certain circumstances syndicated issuance is undertaken.
Accounting policy The AOFM monitors the cost and risk on Treasury Indexed Bonds primarily on an accruals basis, but also on a fair value basis. The AOFM has designated Treasury Indexed Bonds to be carried at fair value through profit or loss under AASB 139.
The fair value of Treasury Indexed Bonds is determined by reference to observable market rates for identical instruments.
Capital accretion is recognised in Interest Expense over time with the quarterly release of the CPI.
As future inflation rates are uncertain, an estimate of the adjusted capital value on maturity of each series of Treasury Indexed Bonds is not disclosed in the financial statements.
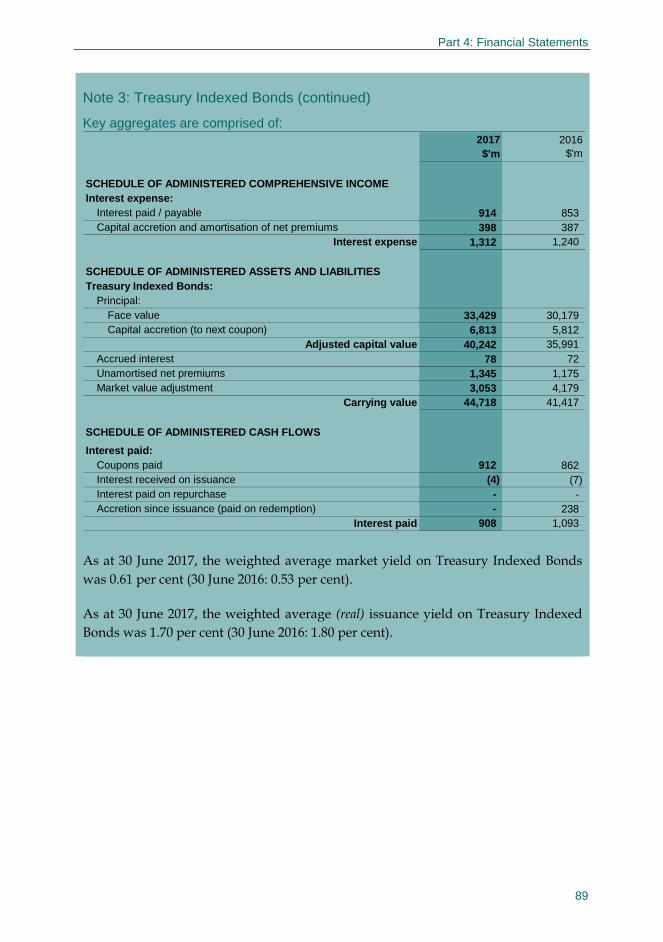
Part 4: Financial Statements
89
Note 3: Treasury Indexed Bonds (continued)
Key aggregates are comprised of: 2017$'m
2016$'m
SCHEDULE OF ADMINISTERED COMPREHENSIVE INCOMEInterest expense:
Interest paid / payable 914 853 Capital accretion and amortisation of net premiums 398 387
Interest expense 1,312 1,240
SCHEDULE OF ADMINISTERED ASSETS AND LIABILITIESTreasury Indexed Bonds:
Principal:Face value 33,429 30,179 Capital accretion (to next coupon) 6,813 5,812
Adjusted capital value 40,242 35,991 Accrued interest 78 72 Unamortised net premiums 1,345 1,175 Market value adjustment 3,053 4,179
Carrying value 44,718 41,417
SCHEDULE OF ADMINISTERED CASH FLOWS
Interest paid:Coupons paid 912 862 Interest received on issuance (4) (7)Interest paid on repurchase - - Accretion since issuance (paid on redemption) - 238
Interest paid 908 1,093 As at 30 June 2017, the weighted average market yield on Treasury Indexed Bonds was 0.61 per cent (30 June 2016: 0.53 per cent).
As at 30 June 2017, the weighted average (real) issuance yield on Treasury Indexed Bonds was 1.70 per cent (30 June 2016: 1.80 per cent).

Part 4: Financial Statements
90
Note 3: Treasury Indexed Bonds (continued)
Changes in principal value for the period
2017Face Value
$'m
2016Face Value
$'m
2017Adjusted
Capital Value(a)
$'m
2016Adjusted Capital
Value(a)
$'m
Changes in principal:New issuance
issued via tender 2,550 2,550 2,572 2,834 issued via syndication 700 1,250 721 1,252
Debt repurchased - - - - Matured - (1,152) - (2,014)Accretion - - 958 507
Change for period 3,250 2,648 4,251 2,579 + opening value 30,179 27,531 35,991 33,412
Closing balance 33,429 30,179 40,242 35,991 (a) to next coupon
Treasury Indexed Bond lines on issue and their carrying amounts 2017
Face Value$'m
2016Face Value
$'m
2017Fair Value
$'m
2016Fair Value
$'m
Maturity Date - Coupon21 Nov 18 - 1.00% 5,089 5,089 5,478 5,359 20 Aug 20 - 4.00% 5,114 5,114 9,537 9,660 21 Feb 22 - 1.25% 5,690 5,090 6,521 5,806 20 Sep 25 - 3.00% 7,193 6,543 10,139 9,485 20 Sep 30 - 2.50% 4,043 3,443 5,655 5,001 21 Aug 35 - 2.00% 3,650 3,200 4,558 4,175 21 Aug 40 - 1.25% 2,650 1,700 2,830 1,931
Total 33,429 30,179 44,718 41,417

Part 4: Financial Statements
91
Note 4: Treasury Notes
Treasury Notes are discount instruments, denominated in Australian dollars and repayable at face value on maturity.
Accounting policy
The AOFM monitors the cost and risk on Treasury Notes primarily on an accruals basis, but also on a fair value basis. The AOFM has designated Treasury Notes to be carried at fair value through profit or loss under AASB 139.
The fair value of Treasury Notes is determined by reference to observable market rates for identical instruments.
Key aggregates are comprised of: 2017$'m
2016$'m
SCHEDULE OF ADMINISTERED ASSETS AND LIABILITIESTreasury Notes:
Face value 3,500 5,000 Unexpired interest discount (11) (16)Market value adjustment 1 2
Carrying value 3,490 4,986
Changes in principal value for the period 2017$'m
2016$'m
Change in principal (face value):New issuance:
issued via tender 13,000 20,000 Matured (14,500) (21,000)
Change for period (1,500) (1,000) + opening value 5,000 6,000
Closing balance 3,500 5,000 The average tenor of issuance was around four months (2015-16: four months).

Part 4: Financial Statements
92
Note 5: Term deposits with the RBA
Term deposits with the RBA are Australian dollar denominated short term deposits placed for a fixed term of less than 12 months at an agreed fixed interest rate, with interest calculated on a simple interest basis.
Term deposit investments are made under the authority of section 58 of the Public Governance, Performance and Accountability Act 2013.
Accounting policy
The AOFM monitors the cost and risk on term deposits primarily on an accruals basis, but also on a fair value basis. The AOFM has designated term deposits to be carried at fair value through profit or loss under AASB 139.
The fair value of term deposits is based on a zero coupon curve using the overnight cash rate and overnight indexed swap rates. These yields reflect a default free credit risk.
Key aggregates are comprised of:
2017$'m
2016$'m
SCHEDULE OF ADMINISTERED ASSETS AND LIABILITIESTerm deposits:
Face value 56,800 28,900 Accrued interest 57 24 Market value adjustment 3 1
Carrying value 56,860 28,925
Changes in principal value for the period 2017
Face Value$'m
2016Face Value
$'m
Changes in principal (face value):New term deposits 471,300 592,850 Matured term deposits (443,400) (598,200)
Change for period 27,900 (5,350) + opening value 28,900 34,250
Closing balance 56,800 28,900

Part 4: Financial Statements
93
Note 6: Residential mortgage-backed securities (RMBS)
Residential mortgage-backed securities (RMBS) are investments in Australian dollar denominated debt instruments secured by pools of mortgages and held by special purpose vehicles.
Accounting policy
The AOFM monitors the cost and risk on RMBS primarily on an accruals basis, but also on a fair value basis. The AOFM has designated RMBS to be carried at fair value through profit or loss under AASB 139.
Each RMBS security is modelled to determine its weighted average life, which is tested and compared against other sources where available. Fair value is determined using the weighted average life, market quotes (where available) and assumptions based on credit quality.
Key aggregates are comprised of:
2017$'m
2016$'m
SCHEDULE OF ADMINISTERED ASSETS AND LIABILITIESRMBS:
Face value 1,919 2,813 Accrued interest 2 4 Market value adjustment 6 (9)
Carrying value 1,927 2,808
Expected to be received:Within one year 497 227 In one to five years 1,430 2,581 In more than five years - -
Total 1,927 2,808 Changes in principal value for the period
2017$'m
2016$'m
Changes in principal (face value):Principal repaid (894) (1,151)Sales - (297)
Change for period (894) (1,448) + opening value 2,813 4,261
Closing balance 1,919 2,813
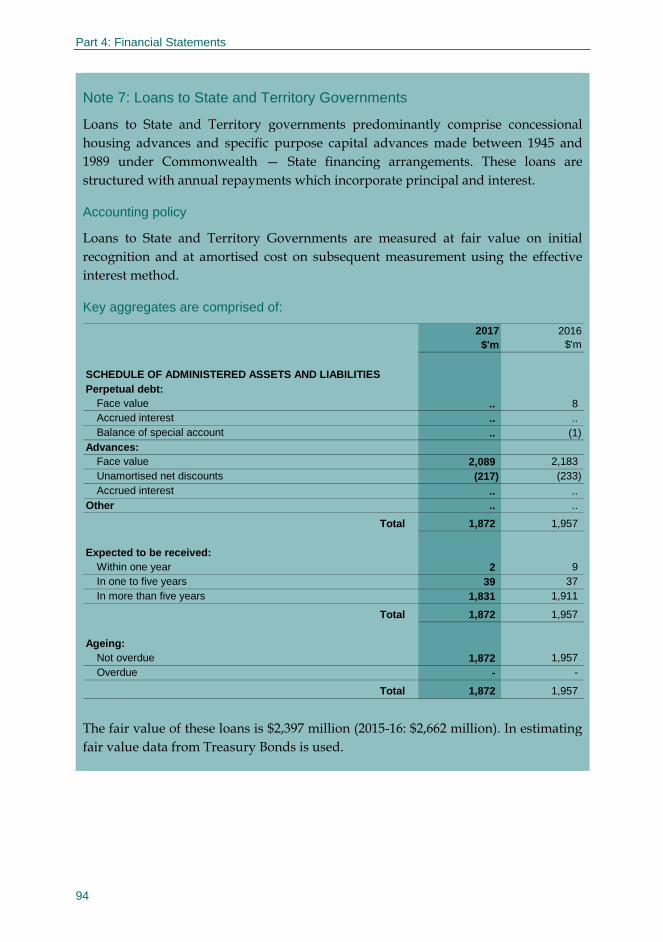
Part 4: Financial Statements
94
Note 7: Loans to State and Territory Governments
Loans to State and Territory governments predominantly comprise concessional housing advances and specific purpose capital advances made between 1945 and 1989 under Commonwealth — State financing arrangements. These loans are structured with annual repayments which incorporate principal and interest.
Accounting policy
Loans to State and Territory Governments are measured at fair value on initial recognition and at amortised cost on subsequent measurement using the effective interest method.
Key aggregates are comprised of:
2017$'m
2016$'m
SCHEDULE OF ADMINISTERED ASSETS AND LIABILITIESPerpetual debt:
Face value .. 8 Accrued interest .. ..Balance of special account .. (1)
Advances:Face value 2,089 2,183 Unamortised net discounts (217) (233)Accrued interest .. ..
Other .. ..
Total 1,872 1,957
Expected to be received:Within one year 2 9 In one to five years 39 37 In more than five years 1,831 1,911
Total 1,872 1,957
Ageing:Not overdue 1,872 1,957 Overdue - -
Total 1,872 1,957 The fair value of these loans is $2,397 million (2015-16: $2,662 million). In estimating fair value data from Treasury Bonds is used.

Part 4: Financial Statements
95
Note 8: Cash flow reconciliation
The following table reconciles the surplus (deficit) reported in the Schedule of Comprehensive Income to net cash flows from operating activities reported in the Schedule of Cash Flows.
2017$'m
2016$'m
Surplus (deficit) 3,668 (32,509)
Adjustments for non-cash items:Amortisation and capital accretion of debt instruments (2,194) (1,712)
Amortisation of net discounts on Loans to State and Territory Governments (17) (16)Net (gains) losses 414 302 Re-measurements (19,403) 17,633
Debt Retirement Reserve Trust Account contributions and interest payments .. ..
Adjustments for cash items:Capital accretion costs on redemption of debt .. (238)
Accrual adjustments:Interest accruals on debt 36 215 Interest accruals on assets (31) (5)Accrued expenses .. ..
Net cash from operating activities (17,527) (16,330)
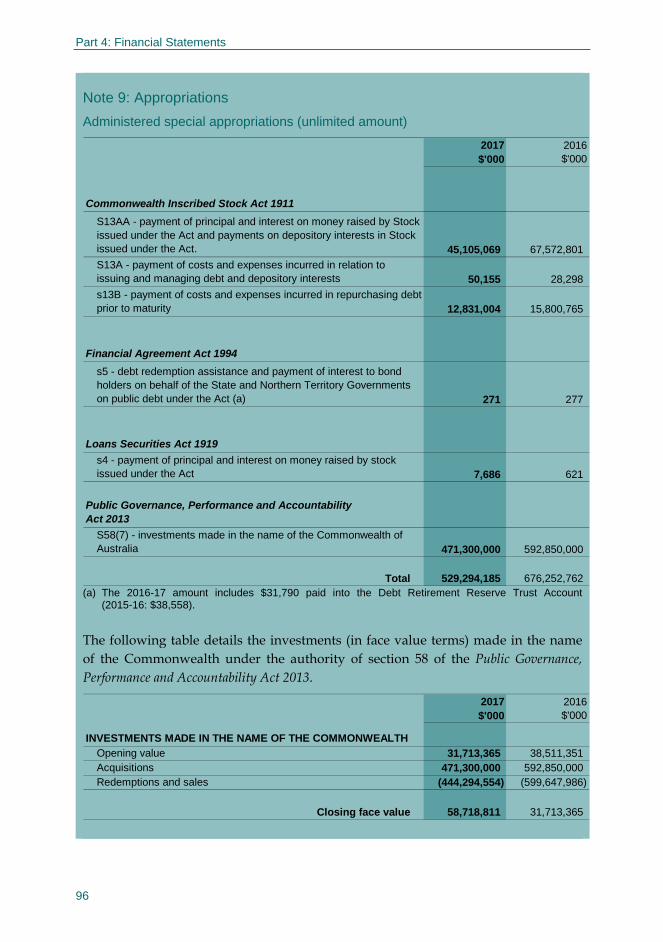
Part 4: Financial Statements
96
Note 9: Appropriations
Administered special appropriations (unlimited amount)
2017$'000
2016$'000
Commonwealth Inscribed Stock Act 1911
S13AA - payment of principal and interest on money raised by Stock issued under the Act and payments on depository interests in Stock issued under the Act. 45,105,069 67,572,801
S13A - payment of costs and expenses incurred in relation to issuing and managing debt and depository interests 50,155 28,298
s13B - payment of costs and expenses incurred in repurchasing debt prior to maturity 12,831,004 15,800,765
Financial Agreement Act 1994
s5 - debt redemption assistance and payment of interest to bond holders on behalf of the State and Northern Territory Governments on public debt under the Act (a) 271 277
Loans Securities Act 1919
s4 - payment of principal and interest on money raised by stock issued under the Act 7,686 621
Public Governance, Performance and Accountability Act 2013
S58(7) - investments made in the name of the Commonwealth of Australia 471,300,000 592,850,000
Total 529,294,185 676,252,762 (a) The 2016-17 amount includes $31,790 paid into the Debt Retirement Reserve Trust Account
(2015-16: $38,558).
The following table details the investments (in face value terms) made in the name of the Commonwealth under the authority of section 58 of the Public Governance, Performance and Accountability Act 2013.
2017$'000
2016$'000
INVESTMENTS MADE IN THE NAME OF THE COMMONWEALTHOpening value 31,713,365 38,511,351 Acquisitions 471,300,000 592,850,000 Redemptions and sales (444,294,554) (599,647,986)
Closing face value 58,718,811 31,713,365

Part 4: Financial Statements
97
Note 9: Appropriations (continued)
The following details administered special appropriations that are available but were not used by the AOFM during 2016-17 or 2015-16:
• Australian National Railways Commission Sale Act 1997, sec 67AW — Purpose: payment of principal and interest on former debts of the National Railways Commission.
• Loans Redemption and Conversion Act 1921, sec 5 — Purpose: payment of principal, interest and costs of converting loans made in accordance with the Act.
• Loans Securities Act 1919, sec 5B — Purpose: payment of money under a swap or other financial arrangement and any expenditure in connection with the negotiation, management or service of, or a repayment under, any such agreement.
• Loans Securities Act 1919, sec 5BA — Purpose: payment of money to enter into securities lending arrangements.
• Moomba-Sydney Pipeline System Sale Act 1994, sec 19 — Purpose: payment of principal and interest on former debts of the Pipeline Authority.
• Public Governance, Performance and Accountability Act 2013, sec 74A — Purpose: payments of recoverable GST.
• Snowy Hydro Corporatisation Act 1997, sec 22 — Purpose: payment of principal and interest on former debts of the Snowy Mountains Hydro Electricity Authority.
• Treasury Bills Act 1914, sec 6 — Purpose: payment of principal and interest on money raised by issuance of Treasury Bills.
Administered annual appropriations
2017$'000
2016$'000
Annual appropriations 10 10 Total available for payment 10 10
Appropriation applied - - Variance 10 10

Part 4: Financial Statements
98
Note 9: Appropriations (continued)
Unspent administered annual appropriation
2017$'000
2016$'000
UNSPENT ADMINISTERED ANNUAL APPROPRIATIONS
Appropriation Act 1 2015-16 - 10 Appropriation Act 1 2016-17 10 -
Special accounts — Debt Retirement Reserve Trust Account
2017$'000
2016$'000
DEBT RETIREMENT RESERVE TRUST ACCOUNT (DRRTA)
Opening balance 1,037 943 Appropriation for reporting period:
Commonwealth contributions 19 20 Interest amounts credited 12 19
State contributions 7,824 60 Available for payments 8,892 1,042 Debt repayments made (8,848) (5)
Balance 44 1,037
Balance represented by:
Cash - held in the Official Public Account 44 1,037
Establishing Instrument — Public Governance, Performance and Accountability Act 2013, section 80.
Purpose — to fund the redemption of the State and Territory debt governed by the Financial Agreement Act 1994. Monies standing to the credit of the DRRTA are applied to repurchase debt of the States and the Northern Territory.
Monies standing to the credit of the Debt Retirement Reserve Trust Account are held on behalf of New South Wales and Victoria. These monies are held for the purposes prescribed by the Financial Agreement Act 1994.

Part 4: Financial Statements
99
Note 10: Budgetary report to outcome comparison
The AOFM produces budget estimates of Australian Government Securities (AGS) and certain financial assets for the Australian Government Budget which is released in May each year for the Budget year (the financial year commencing on the following 1 July) and three forward years.
The projections of debt issuance and asset holdings are a consequence of the expenditure, investment and revenue decisions and assumptions made by the government in producing its Budget. As part of the Budget process, the AOFM receives an estimate of the aggregated annual financing task for the Budget year and forward years from the Treasury. The Headline Cash Deficit (which represents net cash flows after operating activities and investing activities for policy purposes; and before investments for liquidity purposes and financing activities) is the closest published aggregate to this financing task. The financing task plus the volume of maturing AGS debt and planned early repurchases of AGS debt (that would otherwise mature in a future year) determines the size of the debt issuance program in each year.
The volume of AGS debt that needs to be issued in face value terms to generate the required level of financing will depend on the future level of AGS yields (or interest rates) and the mix and tenor of debt to be issued. The mix and tenor of debt to be issued is based on the debt management strategy for the period ahead.
A technical assumption is made about future AGS yields. It is assumed that the AGS yields for different tenors of debt will be the same as the prevailing observed market rates at the time the budget estimates are prepared.
2016-17 Budget
In the 2016-17 Budget (released in May 2016) the government estimated a Headline Cash Deficit of $53.438 billion for 2016-17. After AGS maturities of $21.103 billion, operational considerations (such as market conditions, the uncertainty and timing associated with future year funding requirements and maintaining a cash rich position) and the financing transactions of other agencies; the long term debt issuance program for 2016-17 was set at $93 billion.
At the time of the Mid-Year Economic and Fiscal Outlook (released in December 2016) the Headline Cash Deficit for 2016-17 was forecast to improve marginally (by $933 million) to $52.505 billion. The long term debt issuance program was increased to $103 billion. The $10 billion increase in debt issuance since Budget was to fund regular buybacks of Treasury Bonds maturing in future years (for the purposes of reducing refinancing risk and improving market efficiency) and to further increase cash liquidity.

Part 4: Financial Statements
100
Note 10: Budgetary report to outcome comparison (continued)
At the time of the 2017-18 Budget (released in May 2017) the Headline Cash Deficit for 2016-17 was forecast to improve further (by $1.444 billion) to $51.061 billion. Due to operational considerations, the long term debt issuance program was increased further by $3.15 billion to $106.15 billion.
Comparison of the Outcome and Budget 2016-17 administered schedule of comprehensive income
Outcome2017$'m
Budget (a)2017
$'m
Variance2017
$'m
EXPENSESGrants .. .. ..Interest expense 16,029 16,643 (614)Supplier expenses 47 1 46
Total expenses 16,076 16,644 (568)
INCOMEInterest revenue 755 929 (174)Other revenue - - -
Total income 755 929 (174)
GAINS (LOSSES)Foreign exchange .. - .. Residential mortgage-backed securities sales - - - Debt repurchased (414) - (414)
Total gains (losses) (414) - (414)
Surplus (deficit) before re-measurements (15,735) (15,715) (20)
RE-MEASUREMENTSNet market revaluation 19,403 3,163 16,240
Total re-measurements 19,403 3,163 16,240
Surplus (deficit) 3,668 (12,552) 16,220 (a) Original Budget released in May 2016. The Budget figures are not audited.
Significant variances in expenses before re-measurements
Interest expense for 2016-17 was $614 million lower than forecast in the 2016-17 Budget. This is notwithstanding that AGS on issue as at 30 June 2017 was around $1.8 billion (in face value terms) higher than Budget forecasts.

Part 4: Financial Statements
101
Note 10: Budgetary report to outcome comparison (continued)
The lower interest expense is primarily attributable to:
• redemption of $12.346 billion of Treasury Bonds prior to maturity, which were not factored into budget forecasts, resulting in a favourable impact on interest cost due to refinancing at lower interest rates;
• lower than forecast CPI for the period resulting in lower capital accretion costs on Treasury Indexed Bonds;
• lower Treasury Bond issuance yields as compared to Budget; and
• a greater reliance on term deposits as opposed to Treasury Notes to manage the within-year cash management task.
Significant variances in income before re-measurements
Interest revenue for 2016-17 was $174 million lower than forecast in the 2016-17 Budget, comprising $165 million for term deposits and $9 million for RMBS.
Revenue earned on term deposit investments was lower than forecast in Budget due to two factors. Firstly, the AOFM’s average term deposit holdings in 2016-17 were lower than forecast. In 2016-17, as a means of reducing refinancing risk and improving market efficiency, the AOFM commenced conducting regular buy backs of Treasury Bonds maturing within 3 years. This resulted in a smoother and lower term deposit profile than forecast. This practice was not factored into budget forecasts.
In addition, term deposit investment yields for 2016-17 were lower than forecast (by around 50 basis points) due to monetary policy decisions made by the RBA after the budget estimates were prepared.
Significant variances in gains (losses) before re-measurements
During 2016-17 as part of its cash management operations the AOFM redeemed $12.346 billion of Treasury Bonds prior to maturity. The early redemption of debt was not forecast in the Budget because it was unclear at that time when and how the regular buy-back program would be implemented.
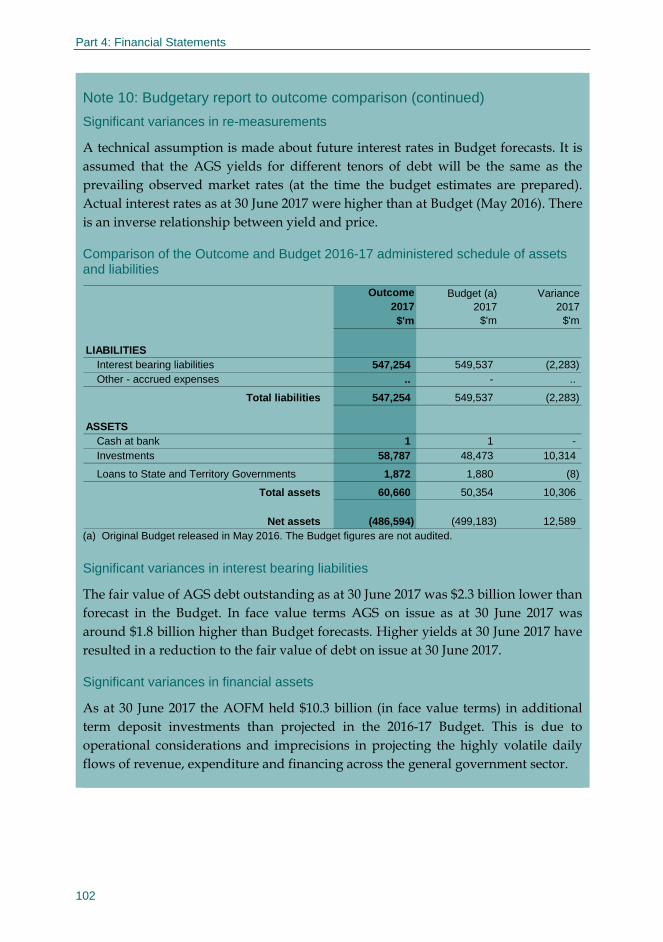
Part 4: Financial Statements
102
Note 10: Budgetary report to outcome comparison (continued)
Significant variances in re-measurements
A technical assumption is made about future interest rates in Budget forecasts. It is assumed that the AGS yields for different tenors of debt will be the same as the prevailing observed market rates (at the time the budget estimates are prepared). Actual interest rates as at 30 June 2017 were higher than at Budget (May 2016). There is an inverse relationship between yield and price.
Comparison of the Outcome and Budget 2016-17 administered schedule of assets and liabilities
Outcome2017$'m
Budget (a)2017
$'m
Variance2017
$'m
LIABILITIESInterest bearing liabilities 547,254 549,537 (2,283)Other - accrued expenses .. - ..
Total liabilities 547,254 549,537 (2,283)
ASSETSCash at bank 1 1 - Investments 58,787 48,473 10,314
Loans to State and Territory Governments 1,872 1,880 (8)
Total assets 60,660 50,354 10,306
Net assets (486,594) (499,183) 12,589 (a) Original Budget released in May 2016. The Budget figures are not audited.
Significant variances in interest bearing liabilities
The fair value of AGS debt outstanding as at 30 June 2017 was $2.3 billion lower than forecast in the Budget. In face value terms AGS on issue as at 30 June 2017 was around $1.8 billion higher than Budget forecasts. Higher yields at 30 June 2017 have resulted in a reduction to the fair value of debt on issue at 30 June 2017.
Significant variances in financial assets
As at 30 June 2017 the AOFM held $10.3 billion (in face value terms) in additional term deposit investments than projected in the 2016-17 Budget. This is due to operational considerations and imprecisions in projecting the highly volatile daily flows of revenue, expenditure and financing across the general government sector.

Part 4: Financial Statements
103
Note 11: Securities lending facility
The AOFM has a securities lending facility for Treasury Bonds and Treasury Indexed Bonds, operated by the RBA. The purpose of the facility is to enhance the efficiency of the bond markets by allowing bond market participants to borrow Treasury Bonds and Treasury Indexed Bonds when they are not readily available in those markets. Bonds are lent on an intra-day or overnight basis.
2017 No.
2016No.
2017$'m
2016$'m
New transactions completed during the financial year
Overnight:Treasury Bonds 2 - 22 - Treasury Indexed Bonds 47 29 355 261
Intra-day:Treasury Bonds 2 4 230 909
Treasury Indexed Bonds - 5 - 250
Total - completed 51 38 607 1,420
Open transactions as at the end of the financial year
Overnight:Treasury Bonds - - - - Treasury Indexed Bonds 2 - 11 -
Total - open 2 - 11 -

Part 4: Financial Statements
104
DEPARTMENTAL NOTES
Departmental assets, liabilities, revenue and expenses are those items that an entity has control over and include ordinary operating costs and associated funding, and include salaries, accruing employee entitlements and operational expenses.
Note Description Page
A Expenses 105
B Receivables 106
C Leasehold improvements 107
D Computer software 108
E Employee provisions 109
F Other provisions 110
G Cash flow reconciliation 111
H Appropriations 112
I Budgetary report to outcome comparison 113

Part 4: Financial Statements
105
Note A: Expenses 2017$'000
2016$'000
EMPLOYEE BENEFITSWages and salaries 5,111 5,162 Superannuation 1,021 879 Leave entitlements 3 14 Other employee expenses 487 220
Total 6,622 6,275
Key Management Personnel
Key management personnel are those persons having authority and responsibility for planning, directing and controlling the activities of the entity, directly or indirectly. The Chief Executive Officer (CEO) (the Accountable Authority under the Public Governance, Performance and Accountability Act 2013), the Secretary to the Treasury and the Treasurer have been determined to be key management personnel for the AOFM. The CEO only is remunerated by the AOFM. The below table sets out the CEO’s actual remuneration (on an accruals basis):
2017$'000
2016$'000
Short-term employee benefits: Salary and other short-term benefits 345 337 Annual leave accrued 28 28
Long service leave accrued 9 9 Post employment benefits:
Superannuation 50 48
Total 432 422
Number of key management personnel 1 1
2017$'000
2016$'000
SUPPLIER EXPENSESANAO - notional audit fee 290 320 Corporate support services 805 818 Market data services 581 563 Operating lease payments - premises 258 272 Depository and transaction services 160 133 Travel 373 209 Workers compensation premium 17 14 Other 1,264 1,215
Total 3,748 3,544
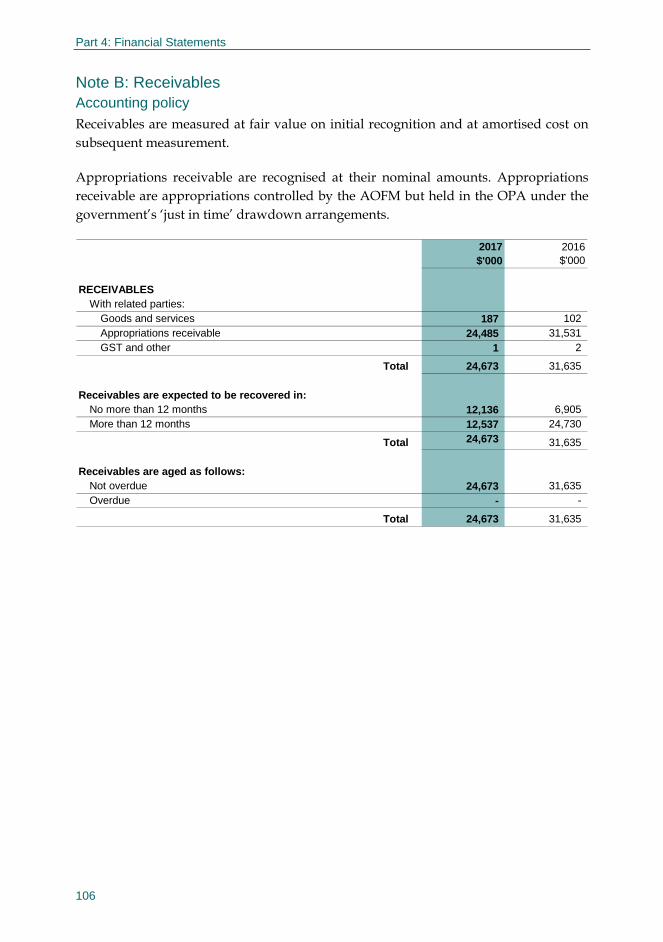
Part 4: Financial Statements
106
Note B: Receivables Accounting policy
Receivables are measured at fair value on initial recognition and at amortised cost on subsequent measurement.
Appropriations receivable are recognised at their nominal amounts. Appropriations receivable are appropriations controlled by the AOFM but held in the OPA under the government’s ‘just in time’ drawdown arrangements.
2017$'000
2016$'000
RECEIVABLESWith related parties:
Goods and services 187 102 Appropriations receivable 24,485 31,531 GST and other 1 2
Total 24,673 31,635
Receivables are expected to be recovered in:No more than 12 months 12,136 6,905 More than 12 months 12,537 24,730
Total 24,673 31,635
Receivables are aged as follows:Not overdue 24,673 31,635 Overdue - -
Total 24,673 31,635

Part 4: Financial Statements
107
Note C: Leasehold improvements Until 19 May 2017, the AOFM had a property sub-lease for 779 square metres in the E Block of the Treasury Building with the Department of The Treasury. From 22 May 2017, the AOFM occupied equivalent office space in the A Block of the Treasury Building. During 2016-17, the AOFM appointed a head contractor to construct fitout for its A Block premises.
Accounting policy Asset recognition threshold on acquisition
Purchases of leasehold improvements are recognised initially at cost except for purchases costing less than $1,000 which are expensed at the time of acquisition.
Revaluations
Following initial recognition at cost, valuations are conducted with sufficient frequency to ensure that the carrying amounts of assets do not materially differ from fair value as at the reporting date. Fair value is determined by depreciated replacement cost for leasehold improvements. Leasehold improvements as at 30 June 2017 are measured at cost.
Depreciation
Leasehold improvements are depreciated on a straight-line basis over the unexpired period of the lease.
2017$'000
2016$'000
LEASEHOLD IMPROVEMENTSGross value 1,914 1,475 Accumulated depreciation (24) (1,475)
Total 1,890 -
Reconciliation of gross value:Opening value 1,475 1,475 Purchases 1,914 - Disposal (1,475) - Revaluation - -
Total 1,914 1,475
Reconciliation of accumulated depreciation:Opening value (1,475) (1,420)Depreciation charge for period (24) (55)Disposal 1,475 - Revaluation - -
Total (24) (1,475) No indicators of impairment were identified for leasehold improvements.
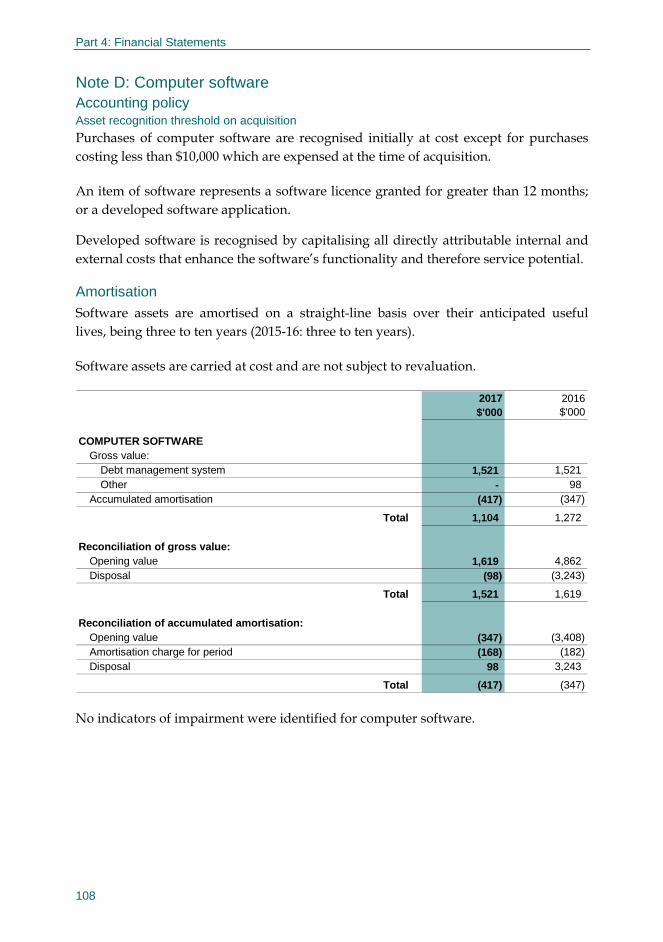
Part 4: Financial Statements
108
Note D: Computer software Accounting policy Asset recognition threshold on acquisition
Purchases of computer software are recognised initially at cost except for purchases costing less than $10,000 which are expensed at the time of acquisition.
An item of software represents a software licence granted for greater than 12 months; or a developed software application.
Developed software is recognised by capitalising all directly attributable internal and external costs that enhance the software’s functionality and therefore service potential.
Amortisation
Software assets are amortised on a straight-line basis over their anticipated useful lives, being three to ten years (2015-16: three to ten years).
Software assets are carried at cost and are not subject to revaluation.
2017$'000
2016$'000
COMPUTER SOFTWAREGross value:
Debt management system 1,521 1,521 Other - 98
Accumulated amortisation (417) (347)
Total 1,104 1,272
Reconciliation of gross value:Opening value 1,619 4,862 Disposal (98) (3,243)
Total 1,521 1,619
Reconciliation of accumulated amortisation:Opening value (347) (3,408)Amortisation charge for period (168) (182)Disposal 98 3,243
Total (417) (347)
No indicators of impairment were identified for computer software.

Part 4: Financial Statements
109
Note E: Employee provisions Accounting policy Leave
The liability for employee benefits includes provisions for annual leave and long service leave. No provision has been made for sick leave as sick leave is non-vesting and the average sick leave taken in future years by employees of the AOFM is estimated to be less than the annual entitlement for sick leave.
Long service leave and annual leave are measured at the present value of the estimated future payments to be made. In determining the present value, the AOFM commissions a periodic actuarial assessment.
Superannuation
The AOFM contributes to the Commonwealth Superannuation Scheme (CSS; a defined benefit scheme), Public Sector Superannuation Scheme (PSS; a defined benefit scheme), Public Sector Superannuation Accumulation Plan (PSSap; an accumulation scheme) and other nominated schemes on behalf of staff.
The superannuation benefits payable to an employee upon termination of employment with the Australian Government is recognised in the financial statements of the Department of Finance and is settled by the Australian Government in due course. The AOFM accounts for its superannuation contributions as if they were defined contribution plans.
An on-cost liability is recognised for superannuation contributions payable on accrued annual leave and long service leave as at the end of the financial year.
2017$'000
2016$'000
EMPLOYEE PROVISIONSAnnual leave 460 422 Long service leave 1,450 1,484 Superannuation 369 204
Total 2,279 2,110
Employee provisions are expected to be settled in:No more than 12 months 617 444 More than 12 months 1,662 1,666
Total 2,279 2,110

Part 4: Financial Statements
110
Note F: Other provisions 2017$'000
2016$'000
OTHER PROVISIONSMake good on leasehold premises 418 160
Total 418 160
Other provisions are expected to be settled in:No more than 12 months - 160 More than 12 months 418 -
Total 418 160
Reconciliation of movements in other provisions:Opening balance 160 156 Paid (45) - Derecognised (115) - New / re-measurements 418 4
Total 418 160
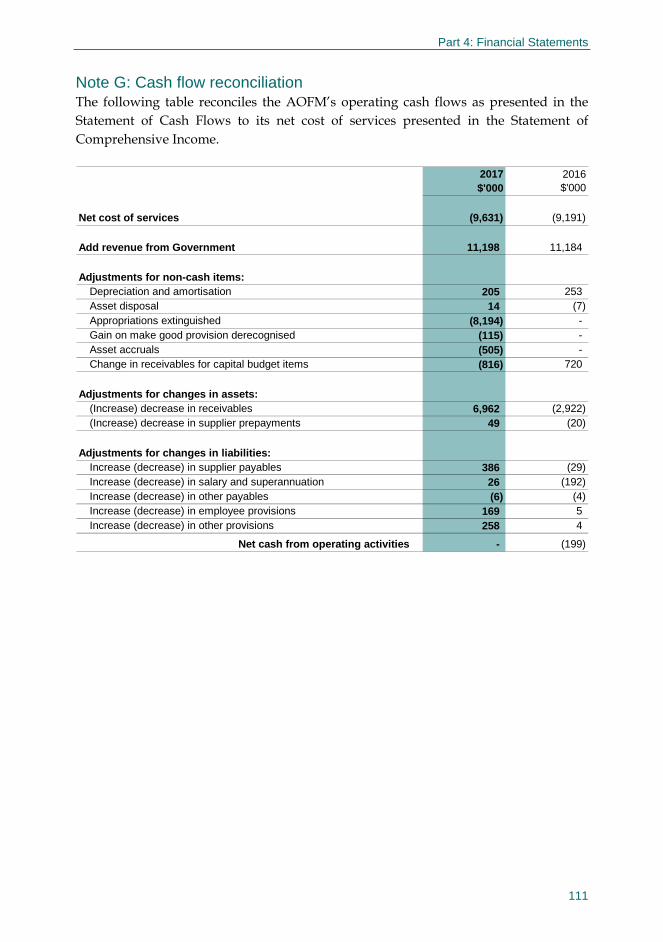
Part 4: Financial Statements
111
Note G: Cash flow reconciliation The following table reconciles the AOFM’s operating cash flows as presented in the Statement of Cash Flows to its net cost of services presented in the Statement of Comprehensive Income.
2017$'000
2016$'000
Net cost of services (9,631) (9,191)
Add revenue from Government 11,198 11,184
Adjustments for non-cash items:Depreciation and amortisation 205 253 Asset disposal 14 (7)Appropriations extinguished (8,194) - Gain on make good provision derecognised (115) - Asset accruals (505) - Change in receivables for capital budget items (816) 720
Adjustments for changes in assets:(Increase) decrease in receivables 6,962 (2,922)(Increase) decrease in supplier prepayments 49 (20)
Adjustments for changes in liabilities:Increase (decrease) in supplier payables 386 (29)Increase (decrease) in salary and superannuation 26 (192)Increase (decrease) in other payables (6) (4)Increase (decrease) in employee provisions 169 5 Increase (decrease) in other provisions 258 4
Net cash from operating activities - (199)
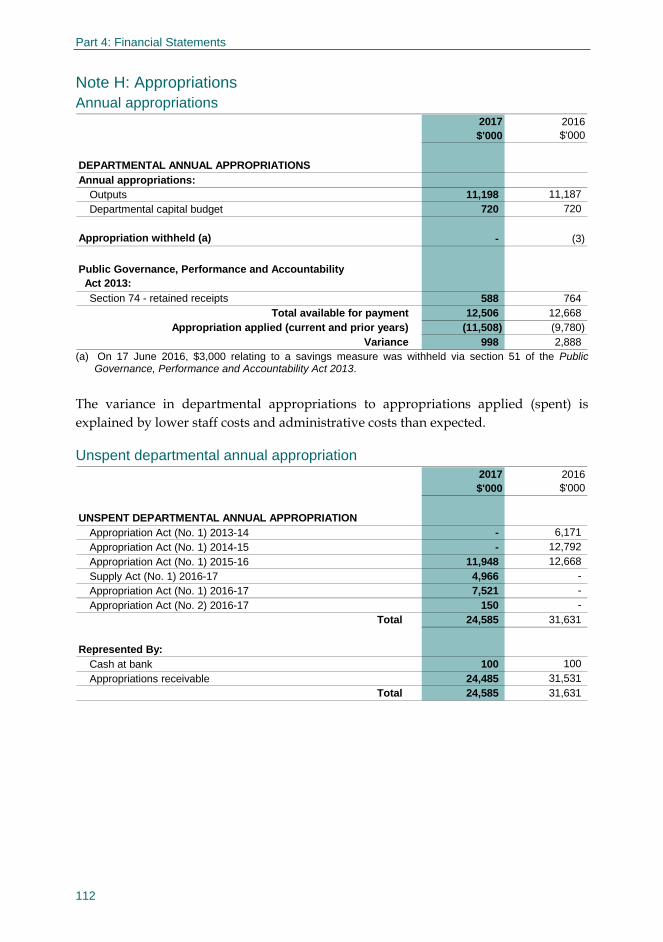
Part 4: Financial Statements
112
Note H: Appropriations Annual appropriations
2017$'000
2016$'000
DEPARTMENTAL ANNUAL APPROPRIATIONSAnnual appropriations:
Outputs 11,198 11,187
Departmental capital budget 720 720
Appropriation withheld (a) - (3)
Public Governance, Performance and Accountability Act 2013:
Section 74 - retained receipts 588 764 Total available for payment 12,506 12,668
Appropriation applied (current and prior years) (11,508) (9,780)Variance 998 2,888
(a) On 17 June 2016, $3,000 relating to a savings measure was withheld via section 51 of the Public Governance, Performance and Accountability Act 2013.
The variance in departmental appropriations to appropriations applied (spent) is explained by lower staff costs and administrative costs than expected.
Unspent departmental annual appropriation 2017$'000
2016$'000
UNSPENT DEPARTMENTAL ANNUAL APPROPRIATIONAppropriation Act (No. 1) 2013-14 - 6,171
Appropriation Act (No. 1) 2014-15 - 12,792
Appropriation Act (No. 1) 2015-16 11,948 12,668
Supply Act (No. 1) 2016-17 4,966 -
Appropriation Act (No. 1) 2016-17 7,521 -
Appropriation Act (No. 2) 2016-17 150 - Total 24,585 31,631
Represented By: Cash at bank 100 100
Appropriations receivable 24,485 31,531 Total 24,585 31,631

Part 4: Financial Statements
113
Note I: Budgetary report to outcome comparison The Budgetary comparison is to the original Budget released in May 2016. The Budget figures are not audited.
Comparison of the Outcome and Budget 2016-17 — Statement of comprehensive income
Outcome2017$'000
Budget2017$'000
Variance2017$'000
NET COST OF SERVICESEXPENSES
Employee benefits 6,622 7,226 (604)Supplier expenses 3,748 5,103 (1,355)Depreciation and amortisation 205 500 (295)Write-down and impairment of assets 14 - 14
Total 10,589 12,829 (2,240)
OWN-SOURCE INCOME
Revenue 958 1,131 (173)
Total 958 1,131 (173)
Net cost of services 9,631 11,698 (2,067)
APPROPRIATION FUNDING
Revenue from government 11,198 11,198 -
Total 11,198 11,198 -
Surplus (deficit) 1,567 (500) 2,067

Part 4: Financial Statements
114
Note I: Budgetary report to outcome comparison (continued)
Comparison of the Outcome and Budget 2016-17 Statement of financial position
Outcome2017$'000
Budget2017$'000
Variance2017$'000
ASSETSFinancial assets:
Cash and cash equivalents 100 100 - Receivables 24,673 29,311 (4,638)
Non-financial assets:Infrastructure, plant and equipment 2,299 1,379 920 Computer software 1,104 1,472 (368)Supplier prepayments 58 87 (29)
Total 28,234 32,349 (4,115)LIABILITIES
Payables 559 163 396 Employee provisions 2,279 2,417 (138)Other provisions 418 157 261
Total 3,256 2,737 519
Net assets 24,978 29,612 (4,634)
EQUITYRetained surplus 29,611 26,051 3,560 Contributed equity (4,633) 3,561 (8,194)
Total 24,978 29,612 (4,634)

Part 4: Financial Statements
115
Note I: Budgetary report to outcome comparison (continued)
Comparison of the Outcome and Budget 2016-17 Statement of changes in equity
Outcome2017$'000
Budget2017$'000
Variance2017$'000
EQUITYRETAINED SURPLUS
Opening balance 28,044 26,551 1,493 Surplus (deficit) 1,567 (500) 2,067
Total 29,611 26,051 3,560 CONTRIBUTED EQUITY
Opening balance 2,691 2,691 - Capital injections 870 870 - Appropriations extinguished (8,194) - (8,194)
Total (4,633) 3,561 (8,194) Comparison of the Outcome and Budget 2016-17 Statement of cash flows
Outcome2017$'000
Budget2017$'000
Variance2017$'000
OPERATING ACTIVITIES Cash received 10,410 12,770 (2,360)Cash used (10,410) (12,770) 2,360
Net cash from operating activities - - -
INVESTING ACTIVITIESCash received - - - Cash used (1,686) (870) (816)
Net cash from investing activities (1,686) (870) (816)
FINANCING ACTIVITIESCash received - appropriations 1,686 870 816
Net cash from financing activities 1,686 870 816
Net change in cash held- - -
+ cash held at the beginning of period100 100 -
Cash held at the end of the period100 100 -
Part 4: Financial Statements
116
Note I: Budgetary report to outcome comparison (continued) Significant variances in the Departmental financial statements
During 2016-17, the AOFM’s average staffing level (ASL) was lower than projected in the 2016-17 Budget. The AOFM had an ASL of 35 during the reporting period against an ASL of 40 estimated at Budget. Accordingly, employee expenses were lower than forecast.
During 2016-17 the AOFM incurred lower than anticipated administrative costs (represented in supplier expenses) for undertaking its issuance program and managing its portfolio of financial assets and liabilities.
As at 30 June 2017, appropriations receivable (represented in receivables) was lower than projected in the 2016-17 Budget by $4.6 million. This was primarily due to the extinguishment of the 2014-15 Appropriation Act on 30 June 2017 ($8.2 million), which was partially offset by higher operating surpluses than projected for both 2016-17 and the prior year.
The balance of infrastructure, plant and equipment as at 30 June 2017 was higher than estimated at Budget due to additional expenditure on AOFM fitout during the course of 2016-17. On the other hand, the balance of computer software was less than forecast due to lower capital expenditure than anticipated.
As at 30 June 2017 supplier payables were significantly higher than forecast at Budget. This was primarily due to outstanding retention monies in relation to AOFM’s fitout project.
The balance of contributed equity as at 30 June 2017 was lower than Budget forecasts due to the extinguishment of the 2014-15 Appropriation Act.

Agency financial performance������������������������������������������������������119Agency resource statement and resources for outcomes �����������������119Grant programs �������������������������������������������������������������������������121Advertising and market research ��������������������������������������������������121Freedom of information ��������������������������������������������������������������121Ecologically sustainable development �������������������������������������������122Management structure of the AOFM’s debt and assets �������������������122AGS issuance for 2016-17 ����������������������������������������������������������123
PART 5 OTHER INFORMATION
117


119
OTHER INFORMATION
Agency financial performance
The AOFM recorded an operating surplus on agency activities of $1.57 million for the 2016-17 financial year, comprising total revenue of $12.16 million and expenses of $10.59 million. The surplus in 2016-17 was due to lower than anticipated operating costs.
As at 30 June 2017, the AOFM was in a sound net worth and liquidity position, with net assets of $24.98 million, represented by assets of $28.23 million and liabilities of $3.25 million.
As at 30 June 2017, the AOFM had unspent appropriations totalling $24.59 million of which $0.10 million was held in cash. Unspent appropriations are available to settle liabilities as and when they fall due and for future asset replacements and improvements.
Agency resource statement and resources for outcomes
Table 1: Expenses and resources for Outcome 1 Outcome 1: The advancement of macroeconomicgrowth and stability and the effective operation Actualof financial markets, through issuing debt, investing in Budget(a) Expensesfinancial assets and managing debt, investments and 2016-17 2016-17 Variationcash for the Australian Government $'000 $'000 $'000
Program1.1: Australian Office of Financial Management
Departmental expenses
Departmental appropriation 10,743 10,080 663 Expenses not requiring appropriation in the Budget year 570 509 61
Administered expenses before re-measurements Ordinary annual services (Appropriation Bill No.1) 10 - 10
Expenses not requiring appropriation 405,839 414,406 (8,567)
Special appropriations expenses Commonwealth Inscribed Stock Act 1911 16,026,968 16,075,373 (48,405) Financial Agreement Act 1994 20 206 (186) Loans Securities Act 1919 411 418 (7)Total expenses for program1.1 16,444,561 16,500,992 (56,431)
2016-17 2016-17
Average staffing level (number) 36 35 1 (a) The Budget figure for 2016-17 is the estimated actual 2016-17 expenses, reported in Table 2.1 of the Portfolio Budget Statements 2017-18.

Part 5: Other information
120
Table 2: AOFM resource statement Actual
available Payments Appropriationsappropriation made extinguished = Balance
2016-17 2016-17 2016-17 2016-17$'000 $'000 $'000 $'000
Ordinary annual servicesDepartmental appropriation(a)(b) 43,549 10,920 8,194 24,435 Receipts from other sources (c) 588 588 - - Total departmental 44,137 11,508 8,194 24,435
Administered expensesOutcome 1 10 - - 10 Total administered 10 - - 10
Total ordinary annual services A 44,147 11,508 8,194 24,445
Other servicesDepartmental non-operating 150 - - 150
Total other services B 150 - - 150
Total available annual appropriations (A+B) 44,297 11,508 8,194 24,595
Special appropriations - operating
Commonwealth Inscribed Stock Act 1911
18,946,437 18,946,437 - -
Financial Agreement Act 1994 271 271 - - Loans Securities Act 1919 592 592 - - Subtotal 18,947,300 18,947,300 - -
Commonwealth Inscribed Stock Act 1911 39,039,791 39,039,791 - -
Loans Securities Act 1919 7,094 7,094 Public Governance, Performance and Accountability Act 2013 471,300,000 471,300,000 - - Subtotal 510,346,885 510,346,885 - -
Total special appropriations C 529,294,185 529,294,185 - -
Total appropriations excluding special accounts (A + B + C) 529,338,482 529,305,693 8,194 24,595
Special Accounts
Debt Retirement Reserve Trust Account 8,892 8,848 44 Total Special Account D 8,892 8,848 - 44
Total net resourcing and payments for AOFM
(A + B + C + D) 529,347,374 529,314,541 8,194 24,639
Special appropriations - investing and financing
(a) Actual available appropriation comprises Appropriation Act (No.1) 2016-17 plus carried forward
appropriation balances as at 1 July 2016. (b) Includes capital budget appropriation for 2016-17 of $0.720 million. (c) Receipts received under section 74 of the PGPA Act.
Part 5: Other information
121
Grant programs
Under the Financial Agreement Act 1994, the Commonwealth is required to contribute to the Debt Retirement Reserve Trust Account to assist the state and Northern Territory governments to redeem maturing debt on allocation to them. Monies standing to the credit of this Account are held for the purposes prescribed by the Financial Agreement Act 1994.
The contributions made by the Commonwealth are accounted for as grants in the AOFM’s financial statements.
Advertising and market research
During 2016-17, the AOFM made no payments to market research organisations, polling organisations or direct mail organisations.
The AOFM incurred expenditure of $12,855 in advertising to promote the Australian Government Securities market to investors. This was paid to Dentsu Mitchell for the placement of an advertisement.
The AOFM incurred expenditure of $3,446 during 2016-17 to media advertising organisations for staff recruitment.
Freedom of information
Agencies subject to the Freedom of Information Act 1982 (FOI Act) are required to publish information to the public as part of the Information Publication Scheme (IPS). This requirement is in Part II of the FOI Act and has replaced the former requirement to publish a section 8 statement in an annual report. Freedom of information (FOI) matters in respect of the AOFM are handled by the Treasury and all documents disclosed in response to FOI requests (other than personal or business information that would be unreasonable to publish) are published on the FOI Disclosure Log of the Treasury website. The Treasury reports on AOFM’s FOI requests in an annual submission to the Office of the Australian Information Commissioner (OAIC) for inclusion in the OAIC’s annual report. In 2016-17, the AOFM received one FOI request.
An agency plan showing what information is published in accordance with the IPS requirements, including material relevant to the AOFM, is accessible from the Treasury’s website at www.treasury.gov.au.

Part 5: Other information
122
Ecologically sustainable development
The AOFM’s operations have an impact on the environment typical of office operations generally. Procurement and facilities management services are provided to the AOFM by the Treasury under a Memorandum of Understanding. Information on the environmental impact of these services is published in the Treasury’s Annual Report.
Management structure of the AOFM’s debt and assets
The assets and liabilities managed by the AOFM and held on its administered balance sheet in 2016-17 were AGS (Treasury Bonds, Treasury Indexed Bonds, Treasury Notes and other securities), term deposits placed with the RBA, RMBS and housing advances to the States under the various Commonwealth-State Housing Agreements.
For financial and risk management purposes, these assets and liabilities are allocated between four financial portfolios: Long-Term Debt, Cash Management, RMBS; and Housing Advances. This allocation recognises the different objectives, risks and management approaches required in each area.
The Long-Term Debt Portfolio contains debt denominated in Australian dollars and in foreign currencies. It includes all AGS, other than Treasury Notes, which are issued for cash management purposes.
As no borrowings have been undertaken in foreign currencies since 1987, the Long-Term Debt Portfolio holds only a small residual amount of foreign currency debt. The last foreign currency loan matured during 2016-17.
The Cash Management Portfolio is used to manage within-year variability in the Australian Government’s financing requirement due to differences in the timing of Government payments and receipts. It is also used to provide for contingency liquidity in the event of an unforeseen call on cash requirements separate to planned needs (such as reduced issuance capability during a major market dislocation event). It contains all the assets and liabilities not held in the other three portfolios.
The RMBS Portfolio contains residential mortgage-backed securities purchased through a Government investment program that was operational during 2008-09 to 2012-13.
The Housing Advances Portfolio comprises loans for public housing made to the States and Territories. These loans, which were not evidenced by the issue of securities, were made under previous Commonwealth-State financing arrangements. The last of these loans is due to mature on 30 June 2042.

Part 5: Other information
123
AGS issuance for 2016-17
Table 3: Treasury Bond tender results — 2016-17 Face value Weighted Spread to Range
amount average secondary of bidsTender Coupon allocated issue yield market yield accepted Timesdate and maturity ($m) (%) (basis points) (basis points) covered1-Jul-16 2.75% 21-Nov-2027 1,000 2.0647 0.10 0.75 2.274-Jul-16 2.75% 21-Jun-2035 400 2.5142 0.80 1.25 2.346-Jul-16 2.25% 21-May-2028 700 2.0210 -0.65 0.25 3.548-Jul-16 1.75% 21-Nov-2020 800 1.5669 -0.93 1.25 3.0311-Jul-16 3.75% 21-Apr-2037 500 2.4196 -0.26 0.75 2.2913-Jul-16 3.25% 21-Apr-2029 800 2.1922 -0.28 0.50 2.9615-Jul-16 5.75% 15-May-2021 600 1.6555 -0.70 0.75 4.1718-Jul-16 2.75% 21-Jun-2035 300 2.4853 -1.29 0.25 3.2320-Jul-16 2.75% 21-Nov-2027 1,000 2.0125 0.00 0.75 1.6622-Jul-16 4.50% 15-Apr-2020 600 1.4541 -0.46 0.25 3.8625-Jul-16 5.50% 21-Apr-2023 1,000 1.7343 -0.32 0.25 3.0029-Jul-16 4.25% 21-Apr-2026 900 1.8412 -0.58 0.25 2.583-Aug-16 2.75% 21-Nov-2027 900 2.0054 -0.46 0.75 2.315-Aug-16 5.75% 15-Jul-2022 1,000 1.6368 -0.74 0.75 2.3710-Aug-16 4.75% 21-Apr-2027 1,000 1.9470 -0.27 0.75 2.2912-Aug-16 5.50% 21-Apr-2023 900 1.7096 -0.34 0.75 2.3915-Aug-16 4.50% 21-Apr-2033 400 2.2528 -0.22 1.25 1.8217-Aug-16 2.75% 21-Apr-2024 800 1.8098 -0.02 0.75 2.3419-Aug-16 2.25% 21-May-2028 700 2.0242 -0.08 0.75 1.9824-Aug-16 2.75% 21-Nov-2027 1,000 1.9459 -0.33 0.75 1.9826-Aug-16 1.75% 21-Nov-2020 900 1.4879 -0.51 0.75 2.5331-Aug-16 4.25% 21-Apr-2026 1,000 1.8341 -0.09 0.75 2.092-Sep-16 4.50% 15-Apr-2020 900 1.4359 -0.41 1.00 2.097-Sep-16 4.75% 21-Apr-2027 1,000 1.8920 0.13 0.75 1.599-Sep-16 2.75% 21-Oct-2019 900 1.5263 -0.80 0.25 3.6816-Sep-16 2.25% 21-May-2028 700 2.2612 0.02 0.75 3.6819-Sep-16 3.25% 21-Apr-2029 400 2.3558 -0.13 0.50 3.8921-Sep-16 2.75% 21-Nov-2027 900 2.1936 -0.31 0.75 3.1123-Sep-16 5.75% 15-May-2021 1,000 1.7183 -0.42 0.75 3.7128-Sep-16 2.25% 21-May-2028 1,000 2.0815 -0.22 0.75 1.8530-Sep-16 3.25% 21-Apr-2025 900 1.8877 0.14 1.25 1.665-Oct-16 2.75% 21-Nov-2027 1,000 2.1832 -0.17 1.00 2.077-Oct-16 1.75% 21-Nov-2020 900 1.6936 -0.44 1.00 3.4519-Oct-16 2.25% 21-May-2028 900 2.4051 0.01 0.75 2.3921-Oct-16 5.75% 15-May-2021 900 1.8076 -0.99 0.75 3.5824-Oct-16 5.75% 15-Jul-2022 300 1.9282 -0.25 0.50 6.5728-Oct-16 4.75% 21-Apr-2027 900 2.3742 -0.33 0.75 2.662-Nov-16 2.75% 21-Nov-2027 1,000 2.4189 0.14 1.00 2.364-Nov-16 1.75% 21-Nov-2020 800 1.7953 -0.47 0.75 3.999-Nov-16 4.50% 15-Apr-2020 800 1.7503 -0.39 1.00 3.4111-Nov-16 2.25% 21-May-2028 1,000 2.7005 0.03 1.00 1.7716-Nov-16 3.25% 21-Apr-2025 900 2.5613 -0.07 0.75 2.6118-Nov-16 2.75% 21-Oct-2019 900 1.8414 -0.36 0.50 4.0321-Nov-16 1.75% 21-Nov-2020 600 1.9852 -0.48 0.50 3.38

Part 5: Other information
124
Table 3: Treasury Bond tender results — 2016-17 (continued) Face value Weighted Spread to Range
amount average secondary of bidsTender Coupon allocated issue yield market yield accepted Timesdate and maturity ($m) (%) (basis points) (basis points) covered23-Nov-16 2.25% 21-May-2028 900 2.8136 -0.21 1.00 1.6325-Nov-16 5.50% 21-Apr-2023 900 2.4328 0.20 0.75 2.1630-Nov-16 4.25% 21-Apr-2026 900 2.6436 -0.14 0.50 2.332-Dec-16 2.75% 21-Oct-2019 900 1.9689 -0.61 0.25 2.727-Dec-16 1.75% 21-Nov-2020 900 2.0949 -0.51 1.25 4.299-Dec-16 2.75% 21-Nov-2027 900 2.8677 -0.05 1.50 3.0412-Dec-16 2.25% 21-May-2028 800 2.9819 -0.81 0.75 3.0016-Dec-16 5.75% 15-May-2021 600 2.1935 -0.35 0.75 4.1311-Jan-17 2.75% 21-Nov-2027 1,000 2.7967 -0.20 0.75 3.0113-Jan-17 1.75% 21-Nov-2020 600 2.0519 -0.61 0.25 5.3520-Jan-17 3.25% 21-Apr-2029 600 3.0029 0.07 0.25 4.9823-Jan-17 4.50% 15-Apr-2020 500 2.0242 -0.57 0.25 4.4827-Jan-17 2.25% 21-May-2028 700 2.8995 -0.05 0.75 2.911-Feb-17 2.75% 21-Nov-2027 800 2.7841 -0.21 0.75 3.243-Feb-17 5.75% 15-Jul-2022 600 2.2669 -0.81 0.25 5.188-Feb-17 3.25% 21-Apr-2029 800 2.8922 -0.38 0.50 2.4810-Feb-17 4.50% 15-Apr-2020 600 1.9294 -0.69 0.75 5.4713-Feb-17 4.50% 21-Apr-2033 300 3.1640 -0.35 0.50 3.4215-Feb-17 4.25% 21-Apr-2026 500 2.7311 -0.22 0.25 5.0517-Feb-17 1.75% 21-Nov-2020 600 2.1157 -0.70 0.50 5.863-Mar-17 1.75% 21-Nov-2020 800 2.1076 -1.34 1.00 5.166-Mar-17 3.75% 21-Apr-2037 600 3.4984 -1.16 1.25 2.538-Mar-17 2.25% 21-May-2028 800 2.9816 -0.56 0.25 3.7810-Mar-17 5.75% 15-May-2021 600 2.2905 -0.72 0.75 5.2617-Mar-17 3.25% 21-Apr-2029 700 3.0373 -0.34 1.00 3.7522-Mar-17 2.25% 21-May-2028 800 2.8595 -0.27 0.75 2.1924-Mar-17 1.75% 21-Nov-2020 600 2.0563 -1.04 0.50 6.2527-Mar-17 3.00% 21-Mar-2047 500 3.6732 -0.68 0.75 2.6529-Mar-17 2.75% 21-Nov-2027 800 2.8096 -0.16 0.75 3.5531-Mar-17 5.75% 15-May-2021 600 2.0766 -0.84 0.25 6.895-Apr-17 2.75% 21 Nov-2028 800 2.7480 -0.07 0.75 3.037-Apr-17 2.00% 21-Dec-2021 600 2.0635 -0.52 0.50 6.1310-Apr-17 4.50% 21-Apr-2033 400 3.0080 0.30 0.50 3.8112-Apr-17 1.75% 21-Nov-2020 800 1.8675 -0.62 0.75 3.7419-Apr-17 2.75% 21-Nov-2027 800 2.5146 0.09 0.50 3.2421-Apr-17 2.00% 21-Dec-2021 600 2.0444 -0.81 0.25 4.9624-Apr-17 4.50% 21-Apr-2033 300 3.0205 -1.47 0.75 3.0728-Apr-17 5.75% 15-Jul-2022 800 2.1198 -0.64 0.50 4.681-May-17 2.75% 21-Jun-2035 300 3.1375 0.26 1.25 3.593-May-17 2.75% 21 Nov-2028 600 2.7213 -0.19 0.25 4.695-May-17 2.00% 21-Dec-2021 800 2.1368 -0.64 0.75 4.0310-May-17 4.50% 15-Apr-2020 600 1.8406 -0.67 0.75 4.8412-May-17 3.25% 21-Apr-2029 800 2.8033 -0.29 0.50 3.1517-May-17 4.50% 21-Apr-2033 500 2.9342 -0.58 0.50 2.67
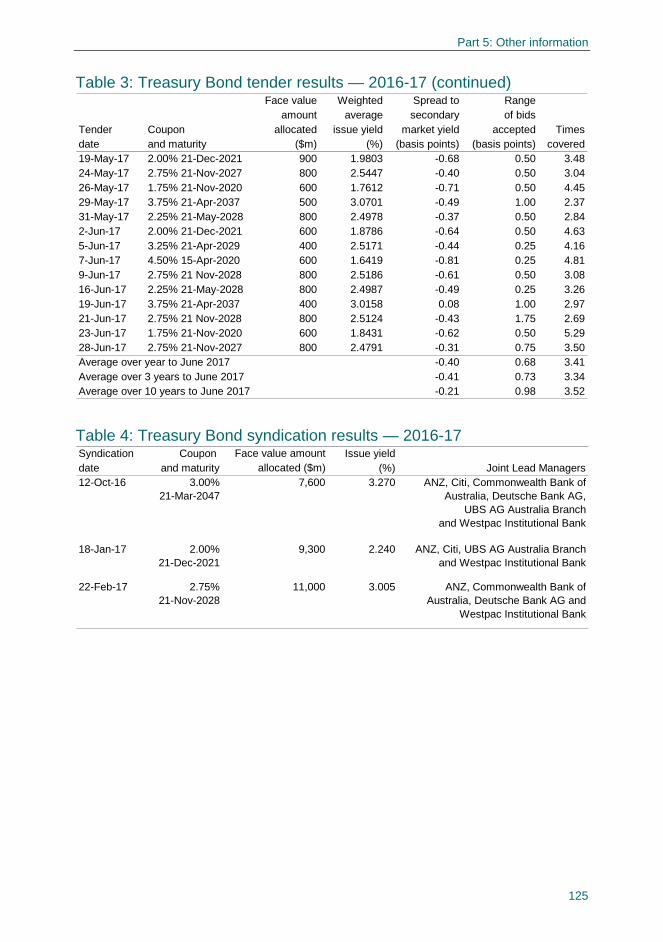
Part 5: Other information
125
Table 3: Treasury Bond tender results — 2016-17 (continued) Face value Weighted Spread to Range
amount average secondary of bidsTender Coupon allocated issue yield market yield accepted Timesdate and maturity ($m) (%) (basis points) (basis points) covered19-May-17 2.00% 21-Dec-2021 900 1.9803 -0.68 0.50 3.4824-May-17 2.75% 21-Nov-2027 800 2.5447 -0.40 0.50 3.0426-May-17 1.75% 21-Nov-2020 600 1.7612 -0.71 0.50 4.4529-May-17 3.75% 21-Apr-2037 500 3.0701 -0.49 1.00 2.3731-May-17 2.25% 21-May-2028 800 2.4978 -0.37 0.50 2.842-Jun-17 2.00% 21-Dec-2021 600 1.8786 -0.64 0.50 4.635-Jun-17 3.25% 21-Apr-2029 400 2.5171 -0.44 0.25 4.167-Jun-17 4.50% 15-Apr-2020 600 1.6419 -0.81 0.25 4.819-Jun-17 2.75% 21 Nov-2028 800 2.5186 -0.61 0.50 3.0816-Jun-17 2.25% 21-May-2028 800 2.4987 -0.49 0.25 3.2619-Jun-17 3.75% 21-Apr-2037 400 3.0158 0.08 1.00 2.9721-Jun-17 2.75% 21 Nov-2028 800 2.5124 -0.43 1.75 2.6923-Jun-17 1.75% 21-Nov-2020 600 1.8431 -0.62 0.50 5.2928-Jun-17 2.75% 21-Nov-2027 800 2.4791 -0.31 0.75 3.50Average over year to June 2017 -0.40 0.68 3.41Average over 3 years to June 2017 -0.41 0.73 3.34Average over 10 years to June 2017 -0.21 0.98 3.52
Table 4: Treasury Bond syndication results — 2016-17 Syndication Coupon Face value amount Issue yielddate and maturity allocated ($m) (%) Joint Lead Managers12-Oct-16 3.00%
21-Mar-20477,600 3.270 ANZ, Citi, Commonwealth Bank of
Australia, Deutsche Bank AG,UBS AG Australia Branch
and Westpac Institutional Bank
18-Jan-17 2.00% 21-Dec-2021
9,300 2.240 ANZ, Citi, UBS AG Australia Branch and Westpac Institutional Bank
22-Feb-17 2.75% 21-Nov-2028
11,000 3.005 ANZ, Commonwealth Bank of Australia, Deutsche Bank AG and
Westpac Institutional Bank

Part 5: Other information
126
Table 5: Treasury Bond buyback tender results — 2016-17 Face value Weighted Spread to Range
amount average secondary of offersTender Coupon repurchased accepted yield market yield accepted Timesdate and maturity ($m) (%) (basis points) (basis points) covered19-Sep-16 3.25% 21-Oct-18 400 1.6300 2.38 1.00 3.5624-Oct-16 5.50% 21-Jan-2018 300 1.6687 0.37 1.00 3.6121-Nov-16 5.50% 21-Jan-2018 340 1.6925 0.50 1.50 4.1721-Nov-16 3.25% 21-Oct-18 260 1.7353 0.53 0.5023-Jan-17 3.25% 21-Oct-18 100 1.8275 0.12 0.50 3.2223-Jan-17 5.25% 15 March 2019 400 1.8999 0.44 0.506-Mar-17 3.25% 21-Oct-18 265 1.7556 0.36 1.50 3.766-Mar-17 5.25% 15 March 2019 235 1.8375 0.22 0.5027-Mar-17 3.25% 21-Oct-18 265 1.6498 0.23 0.25 3.2927-Mar-17 5.25% 15 March 2019 235 1.7237 0.37 0.7510-Apr-17 3.25% 21-Oct-18 193 1.6184 0.09 0.75 2.6610-Apr-17 5.25% 15 March 2019 207 1.6869 0.11 0.501-May-17 3.25% 21-Oct-18 161 1.5970 0.70 1.00 4.181-May-17 5.25% 15 March 2019 139 1.6436 0.48 0.7529-May-17 3.25% 21-Oct-18 100 1.5660 0.15 0.50 2.9929-May-17 5.25% 15 March 2019 400 1.5775 0.62 0.755-Jun-17 5.50% 21-Jan-2018 145 1.5557 0.32 1.00 3.325-Jun-17 3.25% 21-Oct-18 255 1.5530 0.42 1.0019-Jun-17 3.25% 21-Oct-18 300 1.6117 0.54 0.75 2.7319-Jun-17 5.25% 15 March 2019 100 1.6840 0.30 0.25Average over year to June 2017 0.46 0.76 3.41

Part 5: Other information
127
Table 6: Treasury Indexed Bond tender results — 2016-17 Face value Weighted Spread to Range
amount average secondary of bidsTender Coupon allocated issue yield market yield accepted Timesdate and maturity ($m) (%) (basis points) (basis points) covered
12-Jul-16 2.00% 21-Aug-2035 150 0.6155 -1.20 0.75 3.629-Aug-16 2.50% 20-Sep-2030 150 0.3921 -0.16 2.75 2.6323-Aug-16 1.25% 21-Feb-2022 150 0.1842 -0.45 1.25 2.6013-Sep-16 3.00% 20-Sep-2025 150 0.4106 0.38 2.00 2.3327-Sep-16 1.25% 21-Feb-2022 150 0.3018 -0.83 1.25 2.2718-Oct-16 1.25% 21-Aug-2040 100 0.7169 -0.90 2.50 2.918-Nov-16 3.00% 20-Sep-2025 150 0.5127 -0.18 2.00 2.7022-Nov-16 1.25% 21-Aug-2040 150 1.0974 -0.37 1.50 2.7513-Dec-16 3.00% 20-Sep-2025 200 0.7462 -0.38 2.75 2.1014-Feb-17 1.25% 21-Feb-2022 150 0.4785 -1.15 0.75 4.8314-Mar-17 2.50% 20-Sep-2030 150 1.1256 -1.44 2.50 3.3728-Mar-17 2.00% 21-Aug-2035 150 1.0930 -1.70 1.00 5.6311-Apr-17 3.00% 20-Sep-2025 150 0.5407 -1.18 1.25 3.009-May-17 2.50% 20-Sep-2030 150 0.8288 -1.12 2.25 3.1030-May-17 2.00% 21-Aug-2035 150 0.7998 -0.46 1.75 2.3613-Jun-17 1.25% 21-Feb-2022 150 0.2776 -1.56 2.25 3.6327-Jun-17 2.50% 20-Sep-2030 150 0.6562 -0.72 1.75 3.59Average over year to June 2017 -0.79 1.78 3.14Average over 3 years to June 2017 -1.25 1.78 3.86
Table 7: Treasury Indexed Bond syndication results — 2016-17 Syndication Coupon Face value amount Issue yielddate and maturity allocated ($m) (%) Joint Lead Managers
28-Feb-171.25%
21-Aug-2040700 1.2425
Deutsche Bank AG, UBS AG Australia Branch and Westpac
Institutional Bank

Part 5: Other information
128
Table 8: Treasury Note tender results — 2016-17 Face value Weighted Range
amount average Spread to of bidsTender allocated issue yield OIS accepted Times
date Maturity ($m) (%) (basis points) (basis points) covered7-Jul-16 28-Oct-16 500 1.7093 4.55 10.0 3.0221-Jul-16 28-Oct-16 500 1.7340 6.54 5.0 3.1328-Jul-16 9-Dec-16 500 1.6408 7.75 2.0 3.7111-Aug-16 9-Dec-16 500 1.5321 8.89 10.0 3.3725-Aug-16 9-Dec-16 500 1.5433 9.12 8.0 2.848-Sep-16 9-Dec-16 500 1.5606 10.06 7.0 3.9422-Sep-16 24-Feb-17 500 1.5884 13.84 6.0 2.926-Oct-16 24-Feb-17 500 1.6186 18.47 7.0 2.7320-Oct-16 24-Feb-17 500 1.6391 17.02 3.0 4.2627-Oct-16 24-Feb-17 500 1.6204 13.90 5.0 3.4810-Nov-16 24-Feb-17 500 1.6392 15.31 9.0 1.8624-Nov-16 28-Apr-17 500 1.6486 15.86 5.0 3.528-Dec-16 28-Apr-17 500 1.5953 11.15 5.0 4.3919-Jan-17 28-Apr-17 500 1.6226 13.26 5.0 3.472-Feb-17 28-Apr-17 500 1.6630 17.30 8.0 1.9716-Feb-17 23-Jun-17 500 1.5687 7.87 8.0 3.3423-Feb-17 23-Jun-17 500 1.5561 6.61 8.0 3.819-Mar-17 23-Jun-17 500 1.5414 4.14 6.0 4.1923-Mar-17 23-Jun-17 500 1.5612 6.62 4.0 3.916-Apr-17 25-Aug-17 500 1.5522 6.22 4.0 4.0320-Apr-17 25-Aug-17 500 1.5510 7.60 4.0 3.4127-Apr-17 25-Aug-17 500 1.5360 4.60 10.0 3.4311-May-17 25-Aug-17 500 1.5871 9.30 6.0 2.6125-May-17 25-Aug-17 500 1.5929 10.47 3.0 2.118-Jun-17 27-Oct-17 500 1.6242 13.71 8.0 3.6922-Jun-17 27-Oct-17 500 1.6100 11.50 4.0 4.01
Average over year to June 2017 10.45 6.2 3.35Average over 3 years to June 2017 6.59 5.4 3.38

129
GLOSSARY Accrual cost
A method of accounting based on recording revenue and expenses when they are incurred, regardless of when cash is exchanged.
Bank Bill Swap (BBSW) rate
The mid-rate of the market for bank accepted bills and negotiable certificates of deposit issued by banks designated by the Australian Financial Markets Association as ‘Prime Banks’, that have a remaining maturity of between one and six months. BBSW is used as a reference rate for various financial products.
Basis point
One hundredth of one per cent.
Bid-ask spread
The difference between the price (or yield) at which a market maker is willing to buy and sell a particular financial product or instrument.
Book value (or carrying amount)
The amount at which an asset or liability is recognised in the balance sheet. Under a fair value methodology, measurement is by reference to current market rates. Under an historic cost methodology, measurement is by reference to market value rates at the time the original transaction was conducted. The AOFM’s assets and liabilities are measured at fair value, except for advances to State and Territory governments for public housing, which are measured at historic cost.
Cash Management Portfolio
The Cash Management Portfolio is a part of the overall portfolio of assets and liabilities managed by the AOFM. It contains short-term assets and liabilities and is used to manage the within-year variability in government cash flows.
Australian Government Securities (AGS)
Debt obligations of the Australian Government evidenced by the issue of securities or, nowadays, issued as inscribed stock. AGS on issue are predominantly Treasury Bonds,

Glossary
130
Treasury Indexed Bonds and Treasury Notes but also include small residual amounts of Australian Savings Bonds, Peace Saving Certificates and War Saving Certificates.
Coupon rate
A rate of interest paid on a bond, which is fixed for a specified period (usually the term of the bond). In the case of Treasury Bonds coupon interest is payable semi-annually, while for Treasury Indexed Bonds it is paid quarterly. In each case, the coupon rate is set on the date of announcement of first issuance of the bond line.
Credit risk
The risk of counterparty default creating financial loss. Credit risk is contingent on the combination of a default and there being pecuniary loss. The AOFM faces credit risk in relation to its settlement and investment activities.
Credit spread
The difference in yields between securities of different credit qualities. The credit spread reflects the additional net yield required by an investor from a security with more credit risk relative to one with less credit risk.
Discount
An amount by which the value of a security on transfer is less than its face (or par) value.
Discounting
Calculating the present value of a future amount.
Duration
Duration (expressed in years) represents the ‘effective term’ of a bond. It is the weighted average life of a bond or a portfolio of bonds. The weights are the relative cash flows associated with the bond or portfolio (the coupon payments and principal), discounted to their present value. See also ‘modified duration’.
Exposure
The amount of money at risk in a portfolio. Exposure to a risk is calculated by measuring the current mark-to-market value that is exposed to that risk.

Glossary
131
Face value
The amount of money indicated on a security, or inscribed in relation to a security, payable to the holder on maturity and used to calculate interest payments. In the case of a Treasury Indexed Bond, the face value is the principal or par value, unadjusted for changes in the Consumer Price Index.
Fixed rate
An interest rate calculated as a constant percentage of the face value or notional principal and generally payable quarterly, semi-annually or annually. Treasury Bonds pay a fixed coupon rate semi-annually.
Floating rate
An interest rate that varies according to a particular indicator, such as BBSW (the Bank Bill Swap Reference Rate). For example, the floating leg of an interest rate swap may provide for the interest paid to be reset every six months in accordance with BBSW.
Funding risk
The risk that an issuer is unable to raise funds, as required, in an orderly manner and without financial penalty. For the Australian Government, funding risk encompasses the ability to raise term funding to cover future Budget needs (including the maturities of Treasury Bonds and Treasury Indexed Bonds). This is distinct from re-financing risk, which relates to the ability to ‘roll-over’ or pay down short-term funding obligations.
Futures basket
A collection of like financial products or commodities, grouped together, that are used to define the benchmark for pricing a futures contract. The Australian Securities Exchange three-year, 10-year and 20-year Treasury Bond futures baskets consist of collections of Treasury Bond lines that have an average term to maturity of approximately three, ten and twenty years respectively.
Futures contract
An agreement to buy or sell an asset at a specified date in the future at a price agreed today. The agreement is completed by physical delivery or cash settlement, or alternatively is offset prior to the expiration date. In Australia, standardised futures contracts are traded on the Australian Securities Exchange. Futures contracts traded on the Australian Securities Exchange include contracts for three-year, 10-year and 20-year Treasury Bonds.

Glossary
132
Historic cost
The basis of measurement where an asset or liability is recorded at fair value on initial recognition and, after initial recognition, by amortisation of the initial value using market rates at the time the transaction was conducted that gave rise to the asset or liability.
Interest
The charge for borrowing money, usually expressed as an annual percentage rate. For the AOFM financial statements, interest cost is the coupon payment (where relevant) adjusted for the amortised cost carrying value of a debt security. Where a debt security is issued at a premium or discount to its principal value, the premium or discount at issuance is recognised in amortised cost carrying value and amortised over the life of the security using the effective interest method. This amortisation is recognised in the interest cost.
For Treasury Indexed Bonds, the change in amortised cost carrying value includes capital accretion of the principal due to inflation. As capital accretion occurs, it is also recognised in the interest cost.
Interest rate risk
The risk that the value of a portfolio or security will change due to a change in interest rates. For example, the market value of a bond falls as interest rates rise.
Issuance
The sale of debt securities in the primary market.
Liquidity
The capacity for a debt instrument to be readily purchased or sold. A liquid market allows the ready buying or selling of large quantities of an instrument at relatively short notice, in reasonable volume and without significant movement in price.
Liquidity also refers to the ability to meet cash payment obligations.
Liquidity risk
The risk that a financial instrument will not be able to be readily purchased or sold.
Long-Term Debt Portfolio (LTDP)
The Long-Term Debt Portfolio is the substantive part of the portfolio managed by the AOFM. It contains ongoing domestic and foreign currency liabilities.

Glossary
133
Market risk
The risk that the price (value) of a financial instrument or portfolio of financial instruments will vary as market conditions change. In the case of a debt issuer and investor such as the AOFM, the principal source of market risk is from changes in interest rates.
Market value
The amount of money for which a security is traded in the market at a particular point in time.
Modified duration
A measure of the sensitivity of the market value of a debt security to a change in interest rates. It is measured as the percentage change in the market value of a debt instrument in response to a one percentage point change in nominal interest rates. Portfolios with higher modified durations tend to have more stable interest costs through time, but more volatile market values. Modified duration is related to duration by the equation:
Modified duration = Duration (years) ) 1 + yield to maturity
At times, ‘modified duration’ is abbreviated to ‘duration’, and desirably only in contexts where this will not lead to confusion.
Nominal debt
Debt that is not indexed to inflation. Treasury Notes and Treasury Bonds are examples of nominal debt.
Nominal interest rate
Interest rate that does not take account of the effects of inflation (in contrast to the ‘real’ interest rate).
Official Public Account (OPA)
The OPA is the collective term for the Core Bank Accounts maintained at the RBA for Australian Government cash balance management.
Operational risk
The risk of loss, whether direct or indirect, arising from inadequate or failed internal business processes or systems.

Glossary
134
Overnight cash rate
The interest rate charged on overnight loans between financial intermediaries. The RBA manages the supply of funds available in the money market to keep the cash rate as close as possible to a target set by the Bank Board as an instrument of monetary policy.
Overnight Indexed Swap (OIS)
A fixed for floating interest rate swap in which one party agrees to pay another party a fixed interest rate in exchange for receiving the average overnight cash rate recorded over the term of the swap. The term to maturity of such swaps is typically between one week and one year. Financial market participants enter into overnight indexed swaps to manage their exposures to movement in the overnight cash rate.
Physical debt
Securities that give rise to debt, in contrast to derivatives (which give rise to a contingent liability). Treasury Bonds, Treasury Indexed Bonds and Treasury Notes represent physical debt.
Present value
The value today of a payment to be received (or made) in the future. If the opportunity cost of funds, or discount rate is 10 per cent, the present value of $100 to be received in two years is $100 x [1/(1 + 0.10)2] = $82.64.
Primary market
The market where securities are issued for the first time and where the sale proceeds go to the issuer. For example, the primary market for Treasury Bonds is when the bonds are sold at tender or by syndication by the AOFM on behalf of the Australian Government.
Real interest rate
An interest rate that has been adjusted to take account of the effects of inflation.
Repricing risk
The risk that interest rates will have increased when maturing debt needs to be refinanced.
Glossary
135
Residential mortgage-backed security (RMBS)
A debt instrument issued by a special purpose vehicle to finance the securitisation of a pool of loans that is secured by residential mortgages.
Risk premium
The difference between the return available on a risk-free asset and the return available on a riskier asset.
Secondary market
The market where securities are bought and sold subsequent to original issuance. Investors trade securities between themselves (usually via intermediaries such as banks) in the secondary market.
Securities lending
An activity whereby securities are lent to a financial market participant for a fee.
Securities lending facility
A facility established by the AOFM in 2004 that uses repurchase agreements to lend Treasury Bonds and Treasury Indexed Bonds to market participants for short periods. The facility is operated by the RBA on behalf of the AOFM. It supports the efficient operation of these markets as it facilitates trading by enabling dealers to obtain specific lines of stock when they are not readily available from other sources.
Short-dated exposure
The proportion of a portfolio that will have its interest rate reset in the short-term. A portfolio with a high short-dated exposure will tend to have more volatile annual interest payments than a portfolio with low short-dated exposure.
Spread
The difference between two prices or yields.
Syndication
Where an issuer arranges a primary market transaction through a panel of banks but the bonds that are issued are purchased as a result of direct orders from end-investors during the syndication process. The final price and volume of issuance are typically determined as part of the process, but either or both could be pre-set at specific levels prior to commencement of the process.

Glossary
136
Tender
A method of issuance whereby debt is sold through auction. The amount, coupon and maturity date of the stock are announced by the issuer. Registered participants then bid for their desired amounts of stock at interest rates at which they are prepared to buy. Bids are accepted from lowest interest rate (yield) upward until the issue amount has been filled. Stock is therefore allocated in order of lowest yield (and highest price).
Tenor
The tenor of a financial instrument is its remaining term to maturity.
Term deposit
A deposit held at a financial institution that has a fixed (short) term. When a term deposit is purchased, the lender (the customer) understands that the money can only be withdrawn after the term has ended, or after having given a predetermined number of days’ notice.
Term premium
The extra return investors demand for holding a longer-term bond as opposed to investing in a series of short-term bonds.
Treasury Bond
A medium to long term debt security issued by the Australian Government that carries an annual rate of interest (the coupon rate), which is fixed over the life of the security and payable in six-monthly instalments (semi-annually) on the face, or par, value of the security. The bonds are repayable in full at face value on maturity.
Treasury Indexed Bond
A security issued by the Australian Government for which the capital value is adjusted periodically according to movements in the Consumer Price Index. Interest is paid quarterly at a fixed rate on the adjusted capital value. At maturity, investors receive the adjusted capital value of the bond — that is, the initial face value as adjusted for inflation over the life of the bond. Interest Indexed Bonds, another form of indexed bond, were also issued by the Commonwealth Government in the past but these have all now matured.
Treasury Note
A short-term debt security issued by the Australian Government at a discount and redeemable at par on maturity. The interest payable on the notes is represented by the difference between their issue value and their par or face value.
Glossary
137
Two-way price
A price (or yield) at which a market-maker is prepared to both buy and sell a particular financial product or instrument. That is, the simultaneous quoting of a bid and an offer.
Yield
The expected rate of return expressed as a percentage of the net outlay or net proceeds of an investment.
Yield curve
Graphical representation on a specific date of the relationship between the yield on debt securities of the same credit quality, but different terms to maturity. When securities with longer terms to maturity have a higher yield than securities with shorter terms to maturity, the curve is said to have a positive slope. In the opposite case, the slope is said to be negative or inverse.


139
ACRONYMS AASB Australian Accounting Standards Board
ADIs Authorised Deposit-taking Institutions
AFMA Australian Financial Markets Association
AGFIF Australian Government Fixed Income Forum
AGS Australian Government Securities
AML/CTF Anti-Money Laundering and Counter-Terrorism Financing
ANAO Australian National Audit Office
AOFM Australian Office of Financial Management
APS Australian Public Service
APSC Australian Public Service Commission
AUD Australian dollar
AUSTRAC Australian Transaction Reports and Analysis Centre
BBSW Bank Bill Swap Reference Rates
CEO Chief Executive Officer
CPI Consumer Price Index
CPRs Commonwealth Procurement Rules
EL Executive Level (APS Classification)
EU European Union
FOI Freedom of Information
FTE Full-time equivalent
GST Goods and Services Tax
Acronyms
140
IPS Information Publication Scheme
IT Information technology
LTDP Long-Term Debt Portfolio
OAIC Office of the Australian Information Commissioner
OIS Overnight Indexed Swap
OPA Official Public Account
PGPA Public Governance, Performance and Accountability Act 2013
PSM Portfolio Strategy Meeting
RBA Reserve Bank of Australia
RMBS Residential Mortgage-backed Security
SES Senior Executive Service
SME Small and Medium Enterprises
TIB Treasury Indexed Bond
US United States of America
USD United States dollar
141
INDEX OF COMPLIANCE WITH REQUIREMENTS
Requirement Page
Letter of transmittal iii
Aids to access
Table of contents vii
Glossary 129
Acronyms 139
Alphabetical index 145
List of requirements for Australian Government annual reports 141
Contact details, website and electronic address of report 144
Review by Chief Executive Officer xi
Overview of the entity
Role and functions 3
Purpose (objectives) 7
Outcome and program structure 3
AOFM organisational structure 4
Report on the Performance of the entity
Annual Performance Statement 7
Discussion and analysis of financial performance 119

Index of compliance with requirements
142
Requirement (continued) Page
Management and Accountability
Corporate governance 41
Compliance with Commonwealth Fraud Control Guidelines 44
External scrutiny; Reports on operations of the AOFM 47
Judicial decisions 47
Management of human resources 47
Staffing statistics 48
Information on enterprise agreements, individual flexibility agreements, determinations, common law contracts and Australian Workplace Agreements
47
Performance pay 49
Disability reporting 50
Purchasing 51
Consultants 51
ANAO access clauses 52
Contracts exempt from the AusTender 52
Procurement initiatives to support small business 52
Financial statements
Independent Auditor’s Report 57

Index of compliance with requirements
143
Requirement (continued) Page
Other Mandatory Information
Grant programs 121
Advertising and market research 121
AOFM resource statement 120
AOFM expenses and resources by outcome 119
Freedom of information and information publication scheme 121
Ecologically sustainable development and environmental performance
122

Index of compliance with requirements
144
CONTACT DETAILS
Enquiries
Enquiries regarding this report may be directed to:
Communications Officer Australian Office of Financial Management Treasury Building Newlands Street PARKES ACT 2600
Telephone: (61-2) 6263 1111 Fax: (61-2) 6263 1222 Email: [email protected]
Internet address
The AOFM web site address is: http://aofm.gov.au.
A copy of this document can be located on the AOFM web site at: http://aofm.gov.au/publications/annual-reports.

145
INDEX
A
Agency financial performance, 119
ANAO
access clauses, 52
exempt contracts, 52
AOFM
Annual Performance Statement, 7
function, 3
organisational structure, 4
outcome, 3
overview, 3
performance and outcomes, 7
role, 3
Audit
Audit Committee, 42
B
Bond issuance, 10
Business continuity arrangements, 45
C
Cash flow volatility, 122
Cash management, 28, 31
Cash Management Portfolio, 122
D
Daily cash balance, 28
Debt portfolio management, 20
E
Ecologically sustainable development, 122
Enterprise risk, 44
External reports, 47
F
Financial statements, 55–116
Fraud, 44
Freedom of information, 121
Funding, 28
H
Human resources, 47–51
I
Inflation-linked bonds, 17
J
Judicial decisions, 47
L
Long-Term Debt Portfolio, 122
O
Official Public Account (OPA), 28
Overdraft facility, 28
P
Portfolio
Cash Management Portfolio, 122
Housing Advances Portfolio, 122

Index
146
Long Term Debt Portfolio, 122
RMBS Portfolio, 122
Structure of the AOFM’s portfolio, 122
Portfolio Strategy Meeting, 43
Purchasing, 51
R
Reserve Bank of Australia (RBA), 30
Residential mortgage-backed securities, 32
Review by the Chief Executive Officer, xiii
S
Securities lending facility, 20
T
The Treasury
Secretary, 3, 41
Treasury Bond
futures, 20
Treasury Bonds
efficiency of issuance, 18
funding the Budget, 12
outstanding, 13
secondary market turnover, 19
Treasury Indexed Bonds
outstanding, 17
secondary market turnover, 19
Treasury Notes, 29