Australian Market Report Q3 2015 - manheim.com.au · manheim.com.au Introduction Q (possible image...
20
manheim.com.au 5 201 Australian Market Report Q3
Transcript of Australian Market Report Q3 2015 - manheim.com.au · manheim.com.au Introduction Q (possible image...

manheim.com.au
5201Australian Market Report Q3

manheim.com.au
Introduction 3
International News 4
Local News 6
Quarter 3 Overview 8
Special Report - The Salvage Marketplace 12
Market Analysis 15
Insights 17
Initiatives 20
Contents
2
manheim.com.au
Introduction
(possible image here)Q3Nine months in and the new car market is motoring along nicely.
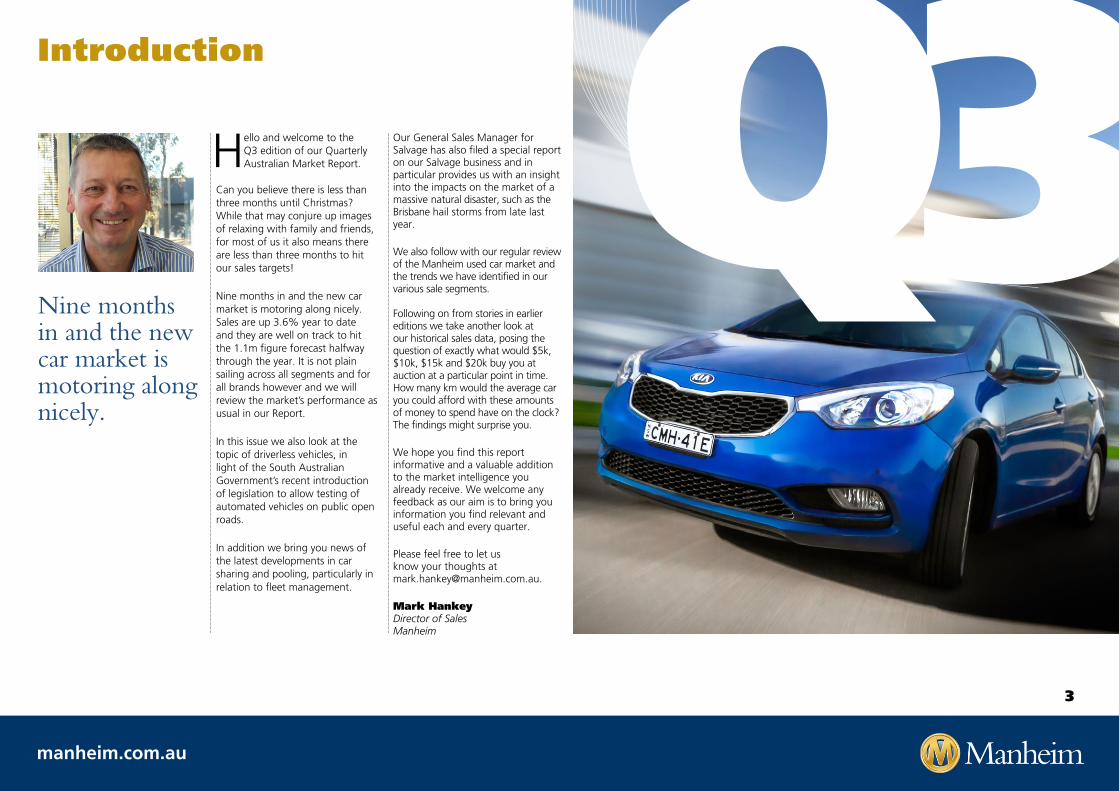
Hello and welcome to the Q3 edition of our Quarterly Australian Market Report.
Can you believe there is less than three months until Christmas? While that may conjure up images of relaxing with family and friends, for most of us it also means there are less than three months to hit our sales targets!
Nine months in and the new car market is motoring along nicely. Sales are up 3.6% year to date and they are well on track to hit the 1.1m figure forecast halfway through the year. It is not plain sailing across all segments and for all brands however and we will review the market’s performance as usual in our Report.
In this issue we also look at the topic of driverless vehicles, in light of the South Australian Government’s recent introduction of legislation to allow testing of automated vehicles on public open roads.
In addition we bring you news of the latest developments in car sharing and pooling, particularly in relation to fleet management.
Our General Sales Manager for Salvage has also filed a special report on our Salvage business and in particular provides us with an insight into the impacts on the market of a massive natural disaster, such as the Brisbane hail storms from late last year.
We also follow with our regular review of the Manheim used car market and the trends we have identified in our various sale segments. Following on from stories in earlier editions we take another look at our historical sales data, posing the question of exactly what would $5k, $10k, $15k and $20k buy you at auction at a particular point in time. How many km would the average car you could afford with these amounts of money to spend have on the clock? The findings might surprise you.
We hope you find this report informative and a valuable addition to the market intelligence you already receive. We welcome any feedback as our aim is to bring you information you find relevant and useful each and every quarter.
Please feel free to let us know your thoughts at [email protected].
Mark Hankey Director of Sales Manheim
3
manheim.com.au
Q3International News New Bettercar solution to help fleets optimise car sharing and pooling
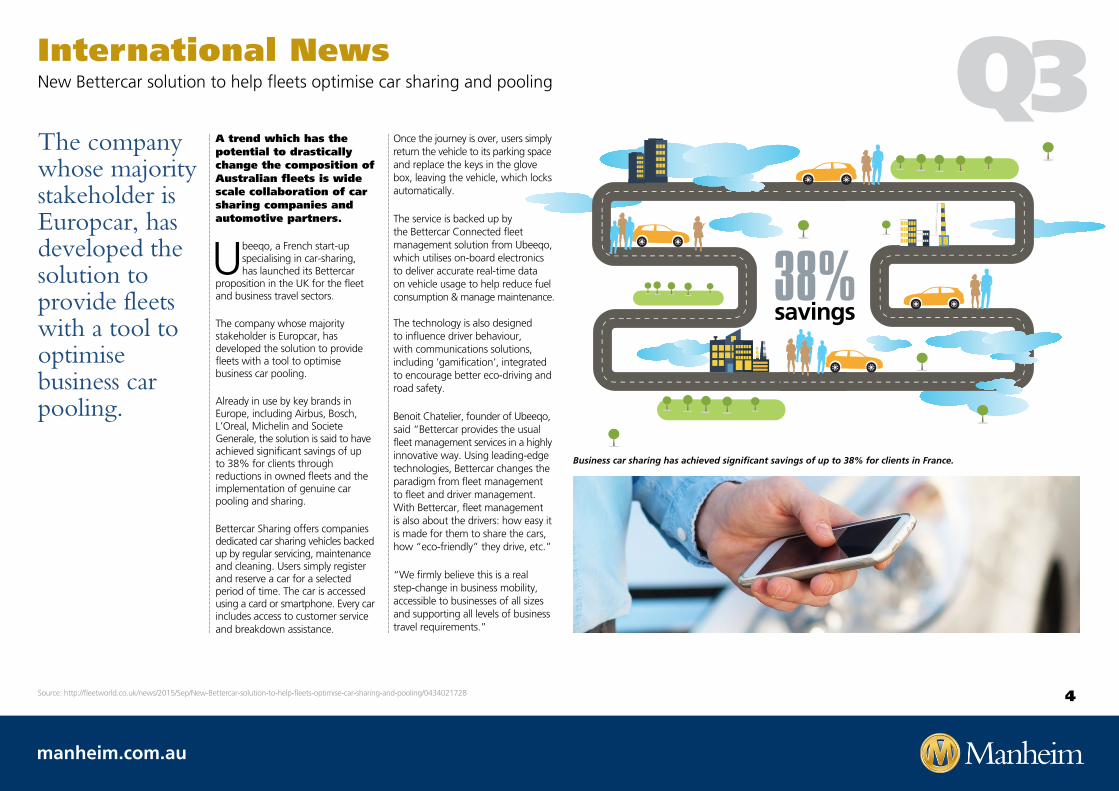
A trend which has the potential to drastically change the composition of Australian fleets is wide scale collaboration of car sharing companies and automotive partners.
Ubeeqo, a French start-up specialising in car-sharing, has launched its Bettercar
proposition in the UK for the fleet and business travel sectors.
The company whose majority stakeholder is Europcar, has developed the solution to provide fleets with a tool to optimise business car pooling.
Already in use by key brands in Europe, including Airbus, Bosch, L’Oreal, Michelin and Societe Generale, the solution is said to have achieved significant savings of up to 38% for clients through reductions in owned fleets and the implementation of genuine car pooling and sharing.
Bettercar Sharing offers companies dedicated car sharing vehicles backed up by regular servicing, maintenance and cleaning. Users simply register and reserve a car for a selected period of time. The car is accessed using a card or smartphone. Every car includes access to customer service and breakdown assistance.
Once the journey is over, users simply return the vehicle to its parking space and replace the keys in the glove box, leaving the vehicle, which locks automatically.
The service is backed up by the Bettercar Connected fleet management solution from Ubeeqo, which utilises on-board electronics to deliver accurate real-time data on vehicle usage to help reduce fuel consumption & manage maintenance. The technology is also designed to influence driver behaviour, with communications solutions, including ‘gamification’, integrated to encourage better eco-driving and road safety.
Benoit Chatelier, founder of Ubeeqo, said “Bettercar provides the usual fleet management services in a highly innovative way. Using leading-edge technologies, Bettercar changes the paradigm from fleet management to fleet and driver management. With Bettercar, fleet management is also about the drivers: how easy it is made for them to share the cars, how “eco-friendly” they drive, etc.”
“We firmly believe this is a real step-change in business mobility, accessible to businesses of all sizes and supporting all levels of business travel requirements.”
The company whose majority stakeholder is Europcar, has developed the solution to provide fleets with a tool to optimise business car pooling.
Source: http://fleetworld.co.uk/news/2015/Sep/New-Bettercar-solution-to-help-fleets-optimise-car-sharing-and-pooling/0434021728
Business car sharing has achieved significant savings of up to 38% for clients in France.
4

manheim.com.au
International News Driverless vehicles could save logistics industry £34 billion
Source: http://www.supplymanagement.com/news/2015/driverless-vehicles-could-save-logistics-industry-ps34-billion
Q3As the South Australian government becomes the first state to introduce legislation to allow driverless vehicles to be trialed on open public roads, research in the UK highlights the cost savings the could be realised in the driverless vehicle future.
A study by AXA UK and independent financial analyst Douglas McNeill,
found there would be significant economy-wide business and consumer advantages with the advent of automated or ‘driverless’ haulage and logistics vehicles, including nearly £34 billion in savings.
The report ‘The Future of Driverless Haulage’, found when considering the anticipated cost savings across four categories - labour, fuel, insurance and vehicle utilisation - there would be an estimated £33.6 billion of savings, potentially rising as high as £47.5 billion, after 10 years.
The cost reductions would arise from the need for fewer drivers and from more fuel efficient driving of computer controlled vehicles, as well as lower insurance costs if driverless vehicles prove to be less accident-prone.
AXA UK said the decrease in transport costs should also have a knock on effect of reduced prices for consumers.
Driverless vehicles could also be used more efficiently as they would not have the restrictions of driver working hours.
The report concluded as a result of these savings, the financial impact of introducing a significant number of driverless HGVs on the haulage industry would be between £19.5 billion and £47.5 billion over 10 years, with total cost savings of £33.6 billion over the 10-year period being the base case assumption. AXA UK said the decrease in transport costs should also have a knock on effect of reduced prices for consumers.
David Williams, head of underwriting at AXA UK, said “The results confirmed our suspicion that automated freight will not only be much more efficient and make the roads safer for other users, it will also reduce the prices of the end products that we all buy.”
AXA UK said that autonomous vehicles could also help reduce the number of lives lost through road traffic accidents caused by human error.
5

manheim.com.au
Q317.0% of Young Singles now don’t have a car in the household (up from 15.6% in 2011). The most likely household type to have a car is Mid-Life Families-however the proportion without one has nearly doubled from 1.8% to 3.5% over the last four years.
Jordan Pakes, Industry Director – Automotive, Roy Morgan Research, says “The number of Aussie car free households is on the rise, with almost 1 in 5 young singles living in a house with no car at all.”
Local NewsMore young singles, couples and parents now car-free while older homes hold on to their wheels
An estimated 6.3% of Australian households now don’t have a car, up from 5.8% four years ago. However this small overall increase masks divergent trends at opposite ends of the household life cycle, new research from Roy Morgan shows.
A higher proportion of younger and mid-life households, ranging from
Young Singles, Young Couples and Young Parents through to Mid-Life Families, now don’t have car compared with 2011.
But Older Households—which make up around a third of the population—have bucked the trend, and are now less likely to be car-free.
In the year to March 2011, only around 1 in 15 households comprising Young Couples (6.4%) didn’t have a car; four years later, and it’s over 1 in 9 (11.3%). During that time, the rate of car-free living among Young Couples surpassed that among Older Households, which declined from 7.5% to 6.4%.
“Only car-free young couple households are as likely to intend to buy a new car as the industry average.”
Source: http://www.roymorgan.com/findings/6423-no-car-households-rise-except-older-homes-australia-march-2015-201508280148 ^ Source: Roy Morgan
% of households with no car 2011 vs 2015^
“Overall, households without a car don’t appear to be rushing to the dealership anytime soon, with purchase intention levels well below average across the majority of the household life-cycle segments.”
“Only car-free young couple households are as likely to intend to buy a new car as the industry average.”
“Looking at young singles or parents living in a household with no car, used car purchase intention is at or above the norm – suggesting new car affordability may be a factor.”
“Among mid-life families, mid-life households and older households with no car, car purchase intention is much lower when compared with car-owners in equivalent household.”
“Of all the life cycle segments and combinations of current car ownership, those most likely to be in the market for a new car are mid-life households that already have three or more cars in the driveway—in fact, around 1 in 5 are intending to either expand the garage or replace an existing vehicle in the next four years.”
0
2%
4%
6%
8%
10%
12%
14%
16%
18%
All Househ
olds
Young Singles
Young Couples
Young Paren
ts
Mid-Life
Familie
s
Mid-Life
Households
Older Househ
olds
5.8% 6.3%
15.6% 17.0%
4.0% 5.5%
6.4% 11.3% 1.8% 3.5% 7.5% 6.4%
4.7% 4.8%
2011 2015
6

manheim.com.au
Q3Local NewsSouth Australia introduces legislation to allow driverless cars on public roads
As briefly mentioned in one of our previous stories, legislation introduced to the South Australian parliament recently means that driverless cars could soon be on Aussie roads.
South Australian Transport Minister Stephen Mullighan wants the state to be at the forefront of the emerging technology and the bill will pave the way for trials to be conducted on public roads.
While trials are set to take place on a closed-off Southern Expressway in November, the new legislation will relax restrictions on self-driving cars — an industry expected to be worth roughly $90 billion in 15 years.
“As the first state in Australia to regulate a framework for such testing, we are opening our doors to global businesses to develop and trial their technologies here, while also creating the right environment for local businesses to grow and flourish,” Mr Mullighan told the Adelaide Advertiser.
Companies looking to take advantage of the new legal environment will have to submit detailed proposals to satisfy the state’s concerns around public safety and insurance.
“It is critical that the public has confidence that these trials will operate safely on our roads,” the minister said.
Adelaide-based technology company Cohda Wireless makes sensors for driverless cars and the bill will likely see an uptick in production for the local manufacturer.
Mr Mullighan also hopes to entice international companies such as Google and Tesla into conducting trials in the state. He will be heading to California next week to meet with Google — a company that has spearheaded the driverless car industry — to discuss its future.
“They specifically want to speak to regulators and legislators about what sort of operating environment they want to see and I’m very much looking forward of taking over a piece of nation leading reform,” he told the ABC.
The state’s Premier Jay Weatherill is a strong supporter of the initiative but the opposition leader Steven Marshall is not convinced it will be the economic boon touted by the Transport Minister.
“It is critical that the public has confidence that these trials will operate safely on our roads,” the minister said.
Source: http://www.news.com.au/technology/innovation/south-australia-introduces-legislation-to-allow-driverless-cars-on-public-roads/story-fnjwucvh-1227540971600
“I think what the Government needs to do is build the case that this is going to create long-term jobs not just be another pet project and another diversion,” he said.
Excitement has been building around the market of self-driving cars for a number of years now and it was recently revealed that even Apple is throwing its hat in the ring.
The hype behind self driving cars from the likes of Volvo, Google, Tesla and Mercedes-Benz isn’t just because people are too lazy to drive themselves, but for the genuine possibility of fatality-free roads.
Earlier in the year, news.com.au test drove Volvo’s new XC90 SUV model which uses driver tracking technology and pilot assist functions to operate the car in a controlled environment.
It’s the same vehicle that will be used in the November trials in South Australia.
The Volvo XC90 will be used on public road trials in South Australia.
7

manheim.com.au
Q3Sales in the ACT, New South Wales, Queensland, Tasmania and Victoria rose in Q3 2015 compared to Q3 2014. Leading the way was Tasmania (up 17.8%), NSW (up 8.5%) and QLD (up 6.4%).
Sales in the Western Australia, Northern Territory and South Australia declined by 10.0%, 9.0% and 6.0% respectively.
The Chief Executive of the Federal Chamber of Automotive Industries, Tony Weber, said “the continued growth in the market indicates support for wider data that suggests vehicle affordability is at an all-time high. The phenomenal growth in the sales of SUVs also indicates the trend towards these vehicles has continued.”
The FCAI’s prediction of another year of over 1.1m sales seems to be well on track with 862,832 sales recorded in the first nine months of the year. The signs for continued growth are good with September sales up 6.8% compared to September last year.
In September, Toyota has maintained the overall market leadership with sales representing 16.4% of the market, followed by Mazda (10.7%), Holden (9.2%), Hyundai (9.2%) and Mitsubishi (6.8%).
Quarter 3 OverviewTotal New Vehicle Sales by State - Passenger & Commercial
100,000
120,000
80,000
60,000
40,000
20,000
0 NSW VIC QLD WA SA ACT TAS NT
Total New Vehicle Sales by State | Q3 2015 v Q3 2014
Sales in the ACT, New South Wales, Queensland, Tasmania and Victoria rose in Q3 2015 compared to Q3 2014.
25,721
2.388
57,270
94,844
4,549
5,245
78,185
16,203
Q3 2015 Q3 2014
Source: Federal Chamber of Automotive Industries; VFACTS National Reports (April, May, June)
A key factor impacting the supply and mix of the used car market is obviously new cars sales. There are both short and long term impacts felt by each quarter’s sales. Some are felt immediately, such as an increase of trade-ins which are soon seen flowing through the auction lanes.
Some take time and are only evident in 18 months or so, such as a change in the mix of
the type of makes and models being purchased over time.
Each quarter we will examine VFACTS and provide you with an update as well as some insights into the potential effects on the used vehicle market.
Sales in the third quarter continued the strong start to the first half of 2015, with over 284,000 vehicles sold in the last three months. Sales were up 4.2% in Q3 this year compared to Q3 last year and YTD sales are up 3.6% on 2014 for the same period.
Despite the continued strong growth in demand for SUVs the top selling vehicles in September remained passenger vehicles, with the Hyundai i30 taking the top spot with sales of 4,490, followed by the Mazda 3 (3,588), the Toyota Corolla (3,530), Toyota Camry (2,522) and Ford Ranger (2,471).
8

manheim.com.au
Strong performers in the Q3 heavy commercial segment included the Isuzu N-Series.
Q3Some large increases and large falls characterised the performance of the market categories in Q3. While overall sales for the quarter are up 4.2% compared to last year’s Q3 results, growth was not consistent across all of the segments.
With sales down 2.4% for the quarter, the decline in Passenger vehicle sales was
slightly abated; YTD the segment is down by 2.8% compared to 2014.
Although the market was down overall, there were some segment increases. Led primarily by the Medium segment which saw an increase of 9.3% and although coming off a lower base, also up were the Sports (up 14.3%) and the People Mover (up 31.3%) segments. The most notable drops were in the Micro segment (down 36.5%) and the Large segment (down 9.0%).
The continued love affair of Australian buyers with SUV’s has never been more evident with Q3 sales up 18.7%. YTD sales are up 15.4% so it appears the trend towards SUV body types over passenger vehicles is still gaining momentum.
Quarter 3 OverviewNew Vehicle Market - Sales by Segment
Top 15 Total New Vehicle Sales by Marque (Passenger)
Top 15 Total New Sales by Marque (SUV)
Top 15 Total New Vehicle Sales by Marque (Light Commercial)
70,000
60,000
50,000
40,000
30,000
20,000
10,000
0
25,000
20,000
15,000
10,000
5,000
0
16,00014,00012,00010,000 8,000 6,000 4,0002,000
0
Small
Toyo
ta
Maz
da
Hyund
ai
Holden
Volksw
agen
Mer
cede
s - B
enz
Ford
HondaKia
Suzu
ki
BMW
Mits
ubish
i
Suba
ru
Audi
Nissan
Other
Toyo
ta
Nissan
Maz
da
Suba
ru
Mits
ubish
i
Jeep
Hyund
ai
Holden
Honda
Ford Kia
Land
Rov
er
Volksw
agen
BMW
Audi
Other
PU/C
C 4X4
SUV La
rge
SUV M
edium Light
Small
SUV
Med
ium
PU/C
C 4X2
Larg
e
Heavy
Com
mercial
Spor
ts
Vans
/ CC 2.
5 - 3.
5t
Vans /
CC <
= 2.5
Peop
le M
over
sSS
V Upp
er La
rge
Upper
Larg
e
Light
Buse
s < 20
seats
Micr
o
Light
Buse
s => 2
0 sea
ts
14,00012,00010,000 8,000 6,000 4,0002,000
0
Toyo
ta
Ford
Mits
ubish
i
Holden
Maz
da
Nissan
Volksw
agen
Isuzu
Ute
Hyund
ai
Rena
ult
Foto
n Lig
ht
Mer
cede
s Ben
z
Fiat P
rofe
ssion
al
LDV
Suzu
ki
Other
Percentage Market Share by Marque - Q3 2015
25%
20%
15%
10%
5%
0%
Toyo
ta
Maz
da
Hyund
ai
Holden
Nissan
Volksw
agen
Ford
Mits
ubish
i
Suba
ru
Honda Kia
Mer
cede
s Ben
z
Jeep
Audi
BMW
Other
Market Segmentation by Vehicle Body Type
Jan
Feb
Mar Apr
May Ju
n Jul
Aug
2012 2013 2014 2015
Sep
OctNov Dec Ja
nFe
bM
ar AprM
ay Jun Ju
lAug Se
pOct
Nov Dec Jan
Feb
Mar Ja
nFe
bM
arAprM
ay Jun
AprM
ay JunJu
lAug Se
pOct
Nov Dec
70%
60%
50%
40%
30%
20%
10%
0%
Market Segmentation by Vehicle Body Type | Q3 2015 vs Q3 2014†
The continued love affair of Australian buyers with SUV’s has never been more evident with Q3 sales up 18.7%.
In what is becoming an ongoing trend, all SUV segments were up on Q3 sales this year compared to last year. The Small SUV segment led the way (up 37.0%) followed by SUV Medium segment which was up 18.3%. The Large segment (up 8%) and Upper Large (up 6.0%) both experienced moderate growth and ensured all SUV segments finished the quarter with higher sales than this time a year ago.
In Light Commercials, Q3 saw a fall in sales of 3.6% compared to 2014 results. With YTD sales up only 0.2% a strong last quarter will be required to see sales stay on track to at least match last year’s sales levels.
Representing almost two thirds of the Light Commercial sales volume, it was the 3.4% fall in quarterly sales of the PU/CC 4x4 segment which drove the overall sales fall. With the 4x2 segment also falling (down 10.8%) it was left up to both van segments to steady the sales. Although coming off a smaller base (2.5t and under and 2.5t to 3.5t) sales were up 11.8% and 10.7% respectively over Q3 2014.
In the Heavy Commercial segment, sales were up 2.9% YTD and are up 1% in Q3 2015 compared to Q3 2014. Strong performers were the Ford Transit Heavy (up 95.2% YTD), the Isuzu N-Series (MD) (up 505.8%) and the Iveco (HD) which was up 107.6% YTD.
Q3 2015 Q3 2014
Source: Federal Chamber of Automotive Industries; VFACTS National Reports (July, August, September)
Overview
9

manheim.com.au
Top 15 Total New Vehicle Sales by Marque (Passenger)
Top 15 Total New Sales by Marque (SUV)
Top 15 Total New Vehicle Sales by Marque (Light Commercial)
70,000
60,000
50,000
40,000
30,000
20,000
10,000
0
25,000
20,000
15,000
10,000
5,000
0
16,00014,00012,00010,000 8,000
6,000 4,0002,000
0
Small
Toyo
ta
Maz
da
Hyund
ai
Holden
Volksw
agen
Mer
cede
s - B
enz
Ford
HondaKia
Suzu
ki
BMW
Mits
ubish
i
Suba
ru
Audi
Nissan
Other
Toyo
ta
Nissan
Maz
da
Suba
ru
Mits
ubish
i
Jeep
Hyund
ai
Holden
Honda
Ford Kia
Land
Rov
er
Volksw
agen
BMW
Audi
Other
PU/C
C 4X4
SUV La
rge
SUV M
edium Light
Small
SUV
Med
ium
PU/C
C 4X2
Larg
e
Heavy
Com
mercial
Spor
ts
Vans
/ CC 2.
5 - 3.
5t
Vans /
CC <
= 2.5
Peop
le M
over
sSS
V Upp
er La
rge
Upper
Larg
e
Light
Buse
s < 20
seats
Micr
o
Light
Buse
s => 2
0 sea
ts
14,00012,00010,000 8,000
6,000 4,0002,000
0
Toyo
ta
Ford
Mits
ubish
i
Holden
Maz
da
Nissan
Volksw
agen
Isuzu
Ute
Hyund
ai
Rena
ult
Foto
n Lig
ht
Mer
cede
s Ben
z
Fiat P
rofe
ssion
al
LDV
Suzu
ki
Other
Percentage Market Share by Marque - Q3 2015
25%
20%
15%
10%
5%
0%
Toyo
ta
Maz
da
Hyund
ai
Holden
Nissan
Volksw
agen
Ford
Mits
ubish
i
Suba
ru
Honda Kia
Mer
cede
s Ben
z
Jeep
Audi
BMW
Other
Market Segmentation by Vehicle Body Type
Jan
Feb
Mar Apr
May Ju
n Jul
Aug
2012 2013 2014 2015
Sep
OctNov Dec Ja
nFe
bM
ar AprM
ay Jun Ju
lAug Se
pOct
Nov Dec Jan
Feb
Mar Ja
nFe
bM
arAprM
ay Jun
AprM
ay JunJu
lAug Se
pOct
Nov Dec
70%
60%
50%
40%
30%
20%
10%
0%
Q3Quarter 3 OverviewNew Vehicle Market - Top 15 Sales by Marque
There were some positive performances from brands such as Kia, Mercedes-Benz, Volkswagen and BMW.
Top 15 Total New Vehicle Sales by Marque (Passenger) | Q3 2015 vs Q3 2014† Q3 2015 Q3 2014
Source: Federal Chamber of Automotive Industries; VFACTS National Reports (July, August, September)
xxxPassenger Vehicles
Toyota led the passenger vehicle market once again in Q3, recording a slight rise
of 0.7% in Q3 compared to its sales in Q3 2014. YTD however sales of Toyota passenger vehicles were slightly down, with a drop of 0.4% compared to the same period last year.
While the entire segment is down 2.4% this quarter compared to last year, the performance YTD shows a fall of 2.8% compared to 2014. Despite the fall in total sales, there were some positive performances from brands such as Kia, Mercedes-Benz, Volkswagen and BMW who recorded growth rates of 34.6%, 29.3%, 27.5% and 22.1% respectively.
Brands that experienced a reduction in Q3 sales and had the largest fall compared to last year were Ford, Nissan and Mitsubishi.
As we enter the last three months of the sales year, the top selling passenger vehicle year to date is the Toyota Corolla (31,903 units) followed by the Mazda 3 (29, 513 units) and the Hyundai i30 with 25,139 sales.
Kia delivered a positive performance for Q3 2015.
10

manheim.com.au
Top 15 Total New Vehicle Sales by Marque (Passenger)
Top 15 Total New Sales by Marque (SUV)
Top 15 Total New Vehicle Sales by Marque (Light Commercial)
70,000
60,000
50,000
40,000
30,000
20,000
10,000
0
25,000
20,000
15,000
10,000
5,000
0
16,00014,00012,00010,000
8,000 6,000 4,0002,000
0
Small
Toyo
ta
Maz
da
Hyund
ai
Holden
Volksw
agen
Mer
cede
s - B
enz
Ford
HondaKia
Suzu
ki
BMW
Mits
ubish
i
Suba
ru
Audi
Nissan
Other
Toyo
ta
Nissan
Maz
da
Suba
ru
Mits
ubish
i
Jeep
Hyund
ai
Holden
Honda
Ford Kia
Land
Rov
er
Volksw
agen
BMW
Audi
Other
PU/C
C 4X4
SUV La
rge
SUV M
edium Light
Small
SUV
Med
ium
PU/C
C 4X2
Larg
e
Heavy
Com
mercial
Spor
ts
Vans
/ CC 2.
5 - 3.
5t
Vans /
CC <
= 2.5
Peop
le M
over
sSS
V Upp
er La
rge
Upper
Larg
e
Light
Buse
s < 20
seats
Micr
o
Light
Buse
s => 2
0 sea
ts
14,00012,00010,000
8,000 6,000 4,0002,000
0
Toyo
ta
Ford
Mits
ubish
i
Holden
Maz
da
Nissan
Volksw
agen
Isuzu
Ute
Hyund
ai
Rena
ult
Foto
n Lig
ht
Mer
cede
s Ben
z
Fiat P
rofe
ssion
al
LDV
Suzu
ki
Other
Percentage Market Share by Marque - Q3 2015
25%
20%
15%
10%
5%
0%
Toyo
ta
Maz
da
Hyund
ai
Holden
Nissan
Volksw
agen
Ford
Mits
ubish
i
Suba
ru
Honda Kia
Mer
cede
s Ben
z
Jeep
Audi
BMW
Other
Market Segmentation by Vehicle Body Type
Jan
Feb
Mar Apr
May Ju
n Jul
Aug
2012 2013 2014 2015
Sep
OctNov Dec Ja
nFe
bM
ar AprM
ay Jun Ju
lAug Se
pOct
Nov Dec Jan
Feb
Mar Ja
nFe
bM
arAprM
ay Jun
AprM
ay JunJu
lAug Se
pOct
Nov Dec
70%
60%
50%
40%
30%
20%
10%
0%
Top 15 Total New Vehicle Sales by Marque (Passenger)
Top 15 Total New Sales by Marque (SUV)
Top 15 Total New Vehicle Sales by Marque (Light Commercial)
70,000
60,000
50,000
40,000
30,000
20,000
10,000
0
25,000
20,000
15,000
10,000
5,000
0
16,00014,00012,00010,000 8,000
6,000 4,0002,000
0
Small
Toyo
ta
Maz
da
Hyund
ai
Holden
Volksw
agen
Mer
cede
s - B
enz
Ford
HondaKia
Suzu
ki
BMW
Mits
ubish
i
Suba
ruAud
i
Nissan
Other
Toyo
ta
Nissan
Maz
da
Suba
ru
Mits
ubish
iJe
ep
Hyund
ai
Holden
Honda
Ford Kia
Land
Rov
er
Volksw
agen
BMW
Audi
Other
PU/C
C 4X4
SUV La
rge
SUV M
edium Lig
ht
Small
SUV
Med
ium
PU/C
C 4X2
Larg
e
Heavy
Com
mercial
Spor
ts
Vans
/ CC 2.
5 - 3.
5t
Vans /
CC <
= 2.5
Peop
le M
over
s
SSV U
pper
Larg
e
Upper
Larg
e
Light
Buse
s < 20
seats
Micr
o
Light
Buse
s => 2
0 sea
ts
14,00012,00010,000 8,000
6,000 4,0002,000
0
Toyo
taFo
rd
Mits
ubish
i
Holden
Maz
da
Nissan
Volksw
agen
Isuzu
Ute
Hyund
ai
Rena
ult
Foto
n Lig
ht
Mer
cede
s Ben
z
Fiat P
rofe
ssion
alLD
V
Suzu
ki
Other
Percentage Market Share by Marque - Q3 2015
25%
20%
15%
10%
5%
0%
Toyo
ta
Maz
da
Hyund
ai
Holden
Nissan
Volksw
agen
Ford
Mits
ubish
i
Suba
ru
Honda Kia
Mer
cede
s Ben
zJe
epAud
i
BMW
Other
Market Segmentation by Vehicle Body Type
Jan
Feb
Mar Apr
May Ju
n Jul
Aug
2012 2013 2014 2015
Sep
OctNov Dec Ja
nFe
bM
ar AprM
ay Jun Ju
lAug Se
pOct
Nov Dec Jan
Feb
Mar Ja
nFe
bM
arAprM
ay Jun
AprM
ay JunJu
lAug Se
pOct
Nov Dec
70%
60%
50%
40%
30%
20%
10%
0%
Q3Sports Utility Vehicles
Once again reflecting their market leadership in total New Vehicle sales, it was Toyota
also leading the way in the SUV segment during Q3. While they sold more than 2,500 units in the quarter than their closest competitor, their growth was only a moderate 3.7% compared to Q3 last year.
With an 18.7% increase for Q3 SUV category sales this year compared to last year, as you would expect a number of brands recorded strong sales results. In fact all brands with the exception of Jeep, BMW and Ford saw sales improvements for the quarter.
The highest percentage growth belonged to Honda, with sales up a whopping 118.2% over Q3 last year, driven by the introduction of their all new HR-V model.
The launch of a new model also drove the next biggest increase, with Mazda’s new CX-3 behind the 79.8% increase compared to Q3 sales in 2014. Audi, Kia and Mitsubishi also recorded solid increases of 45.6%, 33.8% and 21.5% respectively.
Year to date the top selling SUV models are the Mazda CX-5 (19,013 units), the Hyundai ix35 (13,910 units) and the Toyota RAV4 (13,782 units).
Quarter 3 OverviewNew Vehicle Market - Top 15 Sales by Marque
The highest percentage growth belonged to Honda, with sales up a whopping 118.2% over Q3 last year.
Although Toyota clearly led the sales race in Q3 in this segment, their sales actually
fell by 20.6% compared to Q3 last year. Such is their dominance however that they still sold more than 3,000 units than Ford, the second placed brand in quarterly sales results.
Light Commercial Vehicles With Light Commercial sales falling by 3.6% in Q3 2015 compared to 2014, YTD sales are ahead by only the slightest of margins – up by 0.2%.
Results across the board were mixed. The strongest performers in Q3 were those coming off lower bases, with Mercedes-Benz up 50.5% and Foton Light up 43.4%.
Higher volume brands such as Isuzu Ute (up 34.6%), Mitsubishi (up 24.3%) and Mazda (up 17.8%) were also strong performers. Other volume brands who experienced a decline in quarterly sales in addition to Toyota were Nissan, Holden, Ford and Volkwagen.
Source: Federal Chamber of Automotive Industries; VFACTS National Reports (July, August, September)
Top 15 Total New Sales by Marque (Light Commercial) | Q3 2015 vs Q3 2014†
Q3 2015
Q3 2015
Q3 2014
Q3 2014
Top 15 Total New Sales by Marque (SUV) | Q3 2015 vs Q3 2014†
The top selling models YTD in 2015 are the Toyota Hilux 4x4 (18,479 units), the Mitsubishi Triton 4x4 (16,741 units) and the Ford Ranger 4x4 (16,599 units).
11
manheim.com.au
Q3
Many readers of our Market Reports would be familiar with the fact we sell accident
damaged vehicles which have been written off, on behalf on our many insurance customers. Perhaps less well known is the fact we are called upon by insurance companies in times of catastrophe, to sell vehicles written off by hail and storm damage.
In addition to our remarketing services we also assist insurers in times of catastrophe with logistical support, making our facilities available for mass onsite assessments and short term storage as required.
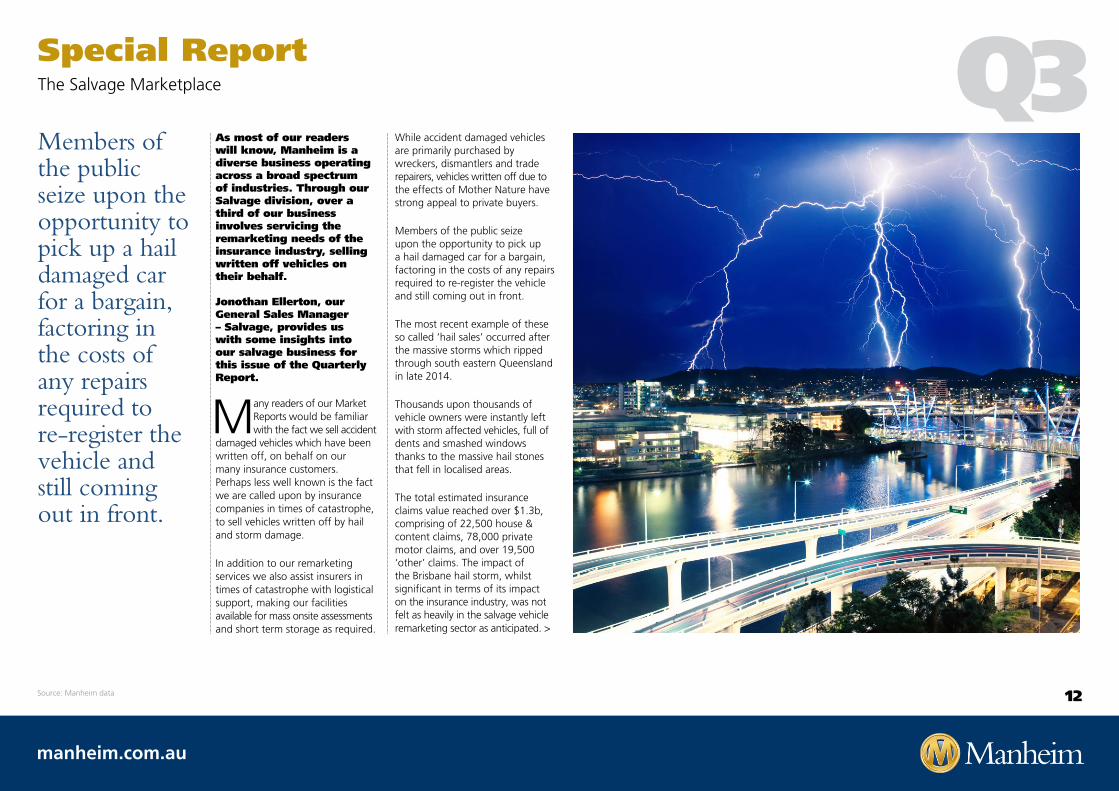
Members of the public seize upon the opportunity to pick up a hail damaged car for a bargain, factoring in the costs of any repairs required to re-register the vehicle and still coming out in front.
Special Report The Salvage Marketplace
As most of our readers will know, Manheim is a diverse business operating across a broad spectrum of industries. Through our Salvage division, over a third of our business involves servicing the remarketing needs of the insurance industry, selling written off vehicles on their behalf. Jonothan Ellerton, our General Sales Manager – Salvage, provides us with some insights into our salvage business for this issue of the Quarterly Report.
While accident damaged vehicles are primarily purchased by wreckers, dismantlers and trade repairers, vehicles written off due to the effects of Mother Nature have strong appeal to private buyers.
Members of the public seize upon the opportunity to pick up a hail damaged car for a bargain, factoring in the costs of any repairs required to re-register the vehicle and still coming out in front.
The most recent example of these so called ‘hail sales’ occurred after the massive storms which ripped through south eastern Queensland in late 2014.
Thousands upon thousands of vehicle owners were instantly left with storm affected vehicles, full of dents and smashed windows thanks to the massive hail stones that fell in localised areas.
The total estimated insurance claims value reached over $1.3b, comprising of 22,500 house & content claims, 78,000 private motor claims, and over 19,500 ‘other’ claims. The impact of the Brisbane hail storm, whilst significant in terms of its impact on the insurance industry, was not felt as heavily in the salvage vehicle remarketing sector as anticipated. >
Source: Manheim data 12

manheim.com.au
Q3Special Report The Salvage Marketplace
Returns across the board were lower than in previous major hail events (Melbourne 2012, Perth & Melbourne 2010) which was based on a number of important factors. These included the larger total loss volume of vehicles to be sold and the severity of the actual damage, as the wind speeds (up to 140kmh) produced unprecedented levels of damage on vertical panels and vehicle windows.
Additionally there was a higher percentage of vehicles being placed on the written off vehicle register than in other hail events due to the vehicle age profile, resulting in a more complicated re-registration process for the new owners.
Over the following months we conducted an extensive auction program to move more than 8,000 written off vehicles. Supported by targeted marketing campaigns, public buyers attended in their thousands each week, looking to pick up a bargain from the wide variety of vehicles on offer.
Although the vehicles were written off, most were able to be re-registered once they were made roadworthy.
Many of the cars being offered were also brand new vehicles which were damaged in car dealerships during the storms.
In the first four weeks of the auction program more than half of the eventual volume of written off vehicles found new homes with public and trade buyers. We were able to move quickly and had the advantage of being first to market, especially with a focus on new and late model used dealer stock. The strategy paid dividends, with record average returns of almost 80% of pre accident value for some sellers and record attendances at our Eagle Farm site.
The wide spread nature of the event through Brisbane’s southside also provided us a snapshot of the vehicle car parc in south east Queensland. The most prevalent vehicle makes through the auction lanes were Toyota, Holden, Mazda and Mitsubishi representing approximately 40% of all volume sold. This volume however was not represented in average returns with Toyota, Volkswagen, Suzuki and Nissan providing the best returns against their pre accident value. >
1200
1000
800
600
400
200
0
Toyo
taM
azda
Holden
Mits
ubish
iHon
daHyu
ndai
Ford
Suba
ruNiss
anSu
zuki
Volksw
agen
30.00%
25.00%
20.00%
15.00%
10.00%
5.00%
0.00%
Toyo
ta
Maz
da
Holden
Mits
ubish
i
Honda
Hyund
ai
Ford
Suba
ru
Nissan
Suzu
ki
Volksw
agen
Volume by make Percentage of PAV Return by Make
1200
1000
800
600
400
200
0
Toyo
taM
azda
Holden
Mits
ubish
iHon
daHyu
ndai
Ford
Suba
ruNiss
anSu
zuki
Volksw
agen
30.00%
25.00%
20.00%
15.00%
10.00%
5.00%
0.00%
Toyo
ta
Maz
da
Holden
Mits
ubish
i
Honda
Hyund
ai
Ford
Suba
ru
Nissan
Suzu
ki
Volksw
agen
Volume by make Percentage of PAV Return by Make
Volume by Make Percent of PAV Return by MakeVolume % PAV
Storm damaged vehicles were quickly processed and readied for sale.
13
manheim.com.au
Q3Special Report The Salvage Marketplace
With such a high volume of written off vehicles available for sale to the public, it was always going to be interesting to see what the wider effect would be on the used vehicle auction market.
As many consumers chose to buy a hail damaged vehicle in place of a traditional used vehicle, the volume of ‘non-hail’ damaged cars being sold in December reduced significantly.
Sales eventually recovered in January and then strengthened in February and March.
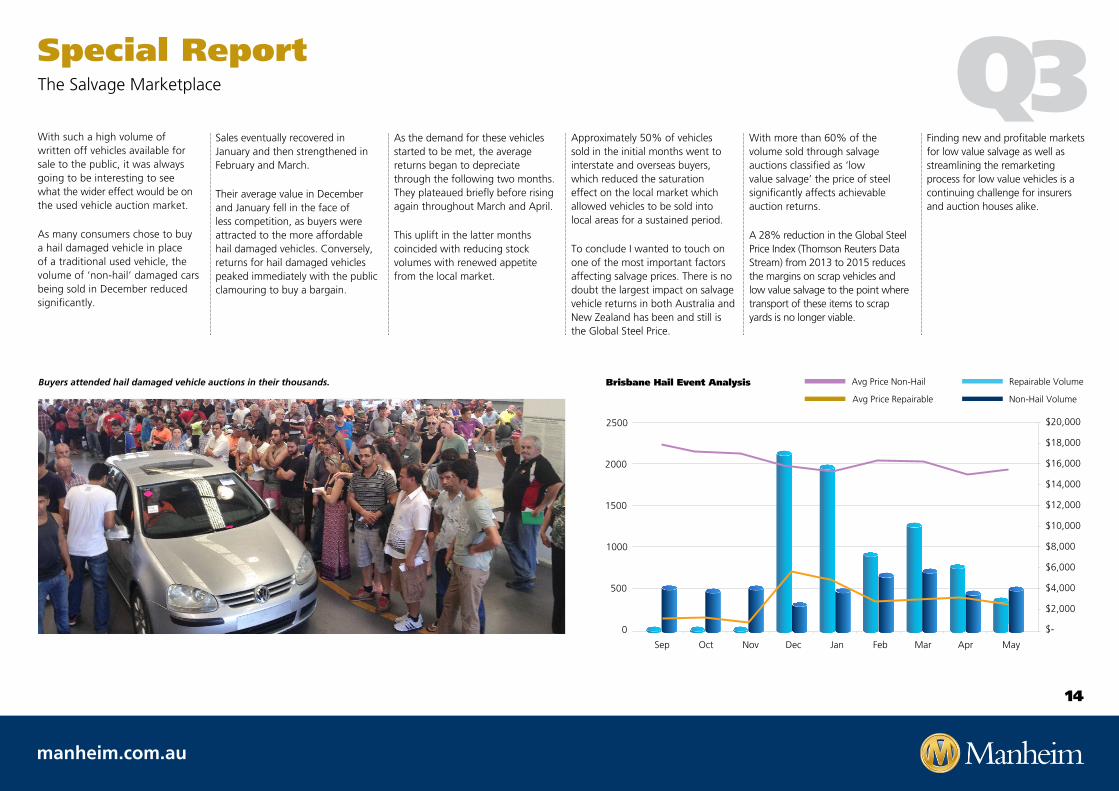
Their average value in December and January fell in the face of less competition, as buyers were attracted to the more affordable hail damaged vehicles. Conversely, returns for hail damaged vehicles peaked immediately with the public clamouring to buy a bargain.
As the demand for these vehicles started to be met, the average returns began to depreciate through the following two months. They plateaued briefly before rising again throughout March and April.
This uplift in the latter months coincided with reducing stock volumes with renewed appetite from the local market.
Approximately 50% of vehicles sold in the initial months went to interstate and overseas buyers, which reduced the saturation effect on the local market which allowed vehicles to be sold into local areas for a sustained period.
To conclude I wanted to touch on one of the most important factors affecting salvage prices. There is no doubt the largest impact on salvage vehicle returns in both Australia and New Zealand has been and still is the Global Steel Price.
With more than 60% of the volume sold through salvage auctions classified as ‘low value salvage’ the price of steel significantly affects achievable auction returns.
A 28% reduction in the Global Steel Price Index (Thomson Reuters Data Stream) from 2013 to 2015 reduces the margins on scrap vehicles and low value salvage to the point where transport of these items to scrap yards is no longer viable.
Finding new and profitable markets for low value salvage as well as streamlining the remarketing process for low value vehicles is a continuing challenge for insurers and auction houses alike.
2500
2000
$-
$2,000
$4,000
$6,000
$8,000
$10,000
$12,000
$14,000
$16,000
$18,000
$20,000
1500
1000
500
0
Sep Oct Nov Dec Jan MarFeb May Apr
Brisbane Hail Event Analysis Avg Price Non-Hail
Avg Price Repairable
Repairable Volume
Non-Hail Volume
Buyers attended hail damaged vehicle auctions in their thousands.
14

manheim.com.au
Q30
20,00040,00060,00080,000
100,000120,000140,000160,000180,000
200,000
Oct
-13
Nov
-13
Dec
-13
Jan
-14
Feb
-14
Mar
-14
Apr
-14
May
-14
Jun
-14
Jul -
14A
ug -1
4Se
p -1
4O
ct -1
4N
ov -1
4D
ec -1
4Ja
n -1
5Fe
b -1
5M
ar-1
5A
pr -1
5M
ay -1
5Ju
n -1
5Ju
l -15
Aug
-15
Sep
-15
Oct
-13
Nov
-13
Dec
-13
Jan
-14
Feb
-14
Mar
-14
Apr
-14
May
-14
Jun
-14
Jul -
14A
ug -1
4Se
p -1
4O
ct -1
4N
ov -1
4D
ec -1
4Ja
n -1
5Fe
b -1
5M
ar-1
5A
pr -1
5M
ay -1
5Ju
n -1
5Ju
l -15
Aug
-15
Sep
-15
Oct
-13
Nov
-13
Dec
-13
Jan
-14
Feb
-14
Mar
-14
Apr
-14
May
-14
Jun
-14
Jul -
14A
ug -1
4Se
p -1
4O
ct -1
4N
ov -1
4D
ec -1
4Ja
n -1
5Fe
b -1
5M
ar-1
5A
pr -1
5M
ay -1
5Ju
n -1
5Ju
l -15
Aug
-15
Sep
-15
Kms
0
2
4
6
8
10
12
14
$0
$2,000
$4,000
$6,000
$8,000
$10,000
$12,000
$14,000
$16,000
$18,000
$20,000
Years
Sales Price
Manheim Used Car Market Kms by Segment
Manheim Used Car Market Avg Vehicle Age by Segment
Manheim Used Car Market Avg Sales Price by Segment
Government
Corporate
Rental
Dealer/Trade
The most stable segments in regards to average age, kms and sales price were the Government and the Dealer segments. Values for age and price remained constant with variations of less than 1% for Q3 versus Q2 results with only some small movements within each month. Continuing the trend of increasing km however, average km for Government vehicles increased by 6% across the quarter.
In the first six months of the year, the Corporate sector set trends for higher prices coupled with lowering average ages and kms. This trend continued into Q3 with values remaining stable across the three months, albeit with some movements on a month to month basis particularly in September.
As the graphs indicate, the sharpest movement within the Corporate segment occurred in September. We saw a younger mix of vehicles offered for sale, with lower km which had a very positive impact on sales results. In September the average sale price rose by over $1,500 compared to the August results, largely driven by some special event auctions of prime quality FleetPartners’ vehicles. It will be interesting to see if this trend continues as 2015 comes to a close.
Each quarter we will continue to report on the performances of our different market segments, to provide you with an overview of the trends in the age, kms and prices of vehicles making up the Manheim used vehicle market.
Looking at the graphs, one can see that in the third quarter of this year, most segments experienced some
minor fluctuations each month in their values for average kms, age and sales price. Exceptions were the Corporate and Rental segments which recorded some larger shifts in the month of September.
With consistent volumes of Rental vehicles coming off fleet, the average age held fairly stable, however in the last three months we saw vehicles with higher km coming off rental fleets. While the average age across the quarter of Rental vehicles held steady, the average km rose to about 78,000km which was a 10% increase over the previous quarter. Prices actually rose by 5% in Q3 compared to Q2, despite weakening in the month of September. The impact of higher km vehicles being offered across the quarter, seemed to finally affect purchase prices as September came to a close.
The most stable segments in regards to average age, kms and sales price were the Government and the Dealer segments.
Manheim Market AnalysisManheim Used Passenger Cars by Segment
† Source:: Manheim Used Car Market Report
Segment Avg Vehicle Age (Years) Avg Kms Avg Sale Price
Government 4.5 84,424 $16,572
Corporate 5.1 109,718 $14,601
Rental 3.5 78,183 $16,080
Dealer/ Trade 11.3 181,293 $5,477
Passenger & Commercial Manheim Used Segments Q3
15

manheim.com.au
Manheim Market AnalysisNew vs Manheim Used – Market Contribution by Marque
Source: Federal Chamber of Automotive Industries; VFACTS National Reports (July, August, September) Manheim Used Car Market Report
One again in Q3 we are taking a look at the mix of brands being sold through our public sales channels. While the changing tastes in consumer demand and sales successes in the new car market take time to filter into our sales channels, the Manheim used vehicle market eventually reflects these changes.
A key factor is the desirability of the brand and its models in the eyes of the
buying public. There can be no doubt however that the key factor which affects the mix is the choice our selling customers are making when it comes to determining the make-up of their vehicle fleets.
Reviewing our sales for Q3 2015 against those of the new car market over the same timeframe highlights some interesting findings.
As ever, Toyota’s presence in used vehicle sales at Manheim continues to dominate. 21.2% of vehicles sold in Q3 at Manheim were Toyota’s, up on their Q3 market share of 16.9% of all new car sales.
Holden, Ford. Mitsubishi and Nissan continue to post high shares in used vehicle sales at Manheim, with higher used market shares compared to their new market in Q3. This higher used car market share indicates the popularity of a particular brand’s models on our customer’s fleets over a long period of time, with higher volumes of these vehicles subsequently coming off fleet during the quarter.
On the other hand, Mazda, Hyundai, Volkswagen and Subaru stand out as having stronger market shares of the new vehicle market compared to their volumes at Manheim.
21.2% of vehicles sold in Q3 at Manheim were Toyota’s, up on their Q3 market share of 16.9% of all new car sales.
Top 15 Total New Vehicle Sales by Marque (Passenger)
Top 15 Total New Sales by Marque (SUV)
Top 15 Total New Vehicle Sales by Marque (Light Commercial)
70,000
60,000
50,000
40,000
30,000
20,000
10,000
0
25,000
20,000
15,000
10,000
5,000
0
16,00014,00012,00010,000 8,000
6,000 4,0002,000
0
Small
Toyo
ta
Maz
da
Hyund
ai
Holden
Volksw
agen
Mer
cede
s - B
enz
Ford
HondaKia
Suzu
ki
BMW
Mits
ubish
i
Suba
ru
Audi
Nissan
Other
Toyo
ta
Nissan
Maz
da
Suba
ru
Mits
ubish
i
Jeep
Hyund
ai
Holden
Honda
Ford Kia
Land
Rov
er
Volksw
agen
BMW
Audi
Other
PU/C
C 4X4
SUV La
rge
SUV M
edium Light
Small
SUV
Med
ium
PU/C
C 4X2
Larg
e
Heavy
Com
mercial
Spor
ts
Vans
/ CC 2.
5 - 3.
5t
Vans /
CC <
= 2.5
Peop
le M
over
sSS
V Upp
er La
rge
Upper
Larg
e
Light
Buse
s < 20
seats
Micr
o
Light
Buse
s => 2
0 sea
ts
14,00012,00010,000 8,000
6,000 4,0002,000
0
Toyo
ta
Ford
Mits
ubish
i
Holden
Maz
da
Nissan
Volksw
agen
Isuzu
Ute
Hyund
ai
Rena
ult
Foto
n Lig
ht
Mer
cede
s Ben
z
Fiat P
rofe
ssion
al
LDV
Suzu
ki
Other
Percentage Market Share by Marque - Q3 2015
25%
20%
15%
10%
5%
0%
Toyo
ta
Maz
da
Hyund
ai
Holden
Nissan
Volksw
agen
Ford
Mits
ubish
i
Suba
ru
Honda Kia
Mer
cede
s Ben
z
Jeep
Audi
BMW
Other
Market Segmentation by Vehicle Body Type
Jan
Feb
Mar Apr
May Ju
n Jul
Aug
2012 2013 2014 2015
Sep
OctNov Dec Ja
nFe
bM
ar AprM
ay Jun Ju
lAug Se
pOct
Nov Dec Jan
Feb
Mar Ja
nFe
bM
arAprM
ay Jun
AprM
ay JunJu
lAug Se
pOct
Nov Dec
70%
60%
50%
40%
30%
20%
10%
0%
Percentage Market Share by Marque – Q3 2015 New car market share Manheim used car market share - public auction
A disproportionately higher result in the new car market as compared to our used vehicle sales for a particular marque for example, can indicate recent strong sales performances in new car sales for that brand. As the volumes of vehicles on customer fleets and in the hands of private buyers build up, over time we will see the share of these brands increase in our used vehicle sale volumes as they are on sold.
Ford posted high shares in used vehicle sales at Manheim.
Q3
16

manheim.com.au
Q3Manheim InsightsWhat does $5k, $10k, $15k or $20k buy at a particular point in time?
In previous editions of our Market Reports, we have identified different trends taking place within the Manheim used vehicle market. Trends for age, kilometres, price, % sold online, buyer types and more have all been considered.
However one more interesting way to look at our data is from the perspective
of relative purchasing power. For instance, “What does $5k, $10k, $15k or $20k” buy you at a particular point in time? We analysed sales results right back to 2004 to find the answer. In Quarter one we took an in depth look at trends for age, kilometres and the sale prices of used vehicles over the past ten years. Obviously these variables influence a vehicle’s value and demand in the used vehicle marketplace.
While the condition of a vehicle, previous ownership, service history, new car affordability and the location of a vehicle are just some of the other factors affecting its market price, the three aforementioned variables no doubt have the greatest impact on the price buyers are prepared to pay.
To frame this exercise, it is worthwhile revisiting the top level findings of this previous study. Vehicles sold in 2014 were on average 61% older than those sold in 2006. They had 43% higher kilometres. As a result of the increased age and distances travelled, buyers were making new assessments of vehicle’s values. Despite the average age of vehicles rising a full two years and the average kilometres increasing by almost 30,000 compared to vehicles in 2006, buyers were still paying 80% of the prices paid 8 years ago.
Looking at this data a different way gives us a view on what the stipulated price points could buy you since 2004. Our analysis shows some distinct movements in the average kilometres of vehicles worth $15k and $20k, which are not evident in the $5k and $10k ranges. While the price is influenced by the aforementioned variables as well as the exact model specification being sold, the exercise still unearths some interesting findings. >
Spending $15k today will buy you a car on average with 93,000km, which is a 70% increase on the 2004 figure.
What $5k, 10k, 15k, 20k will buy $5k $10k $15k $20k
0
20,000
40,000
60,000
80,000
100,000
120,000
140,000
160,000
180,000
2004
2005
2006
2007
2008
2009
2010
2011
2012
2013
2014
2015
Odometer
200,000
17

manheim.com.au
Manheim InsightsWhat does $5k, $10k, $15k or $20k buy at a particular point in time?
In 2004, the average distance travelled of a vehicle purchased for $5,000 was 186,000 km. Some 10 years later, the average is 163,000 km which is actually a fall of 12%. One may have expected that $5k, being worth more in 2004 than in 2015, might have meant being able to buy a car with less km ten years ago. However the opposite is in fact true.
The top selling vehicles in this price category are shown below in the accompanying table with the Holden Commodore standing out as a car that could be regularly purchased for $5,000 in our lanes. Deeper investigation reveals these were base models and typically older vehicles as the years pro-gressed.
It is a similar story as far as average km goes in the $10k price range. The average km of a $10,000 car sold in 2015 was 103,000km, while in 2004 it was 107,000km. While the average km has fluctu-ated throughout the years as the graph shows, the drop of 3.7% still goes against the expected trend.
The top selling vehicles in this price category show more diversity than in the $5k group. The Commodore, Falcon and Camry were popular buys for people spending $10,000 on a used car and again average ages grew through the time under consideration.
With new car affordability at an all time high, the flow on effect is clearly being seen in our auction lanes as used car affordability in the $5k and $10k price points is also at a high. In 2015 you can buy a much safer, better equipped car with less km on the clock than you could a decade ago in these price ranges.
Compared to their more affordable counterparts, it is a different story in the $15k and $20k price ranges. In 2004, $15,000 would buy you a car with an average 54,500 km on the clock. For $20,000 it would buy you a car with slightly less km – 51,000 on average.
Fast forward ten years and the average km has risen steadily for both groups of vehicles. It was only in about 2013 when a gap began to open up between the average km of $15k and $20k vehicles. Spending $15k today will buy you a car on average with 93,000km, which is a 70% increase on the 2004 figure.>
5000
10,000 20,000
15,000
Holden Commodore
Holden Commodore
Ford Falcon Ford Falcon
Ford Falcon
Toyota Camry Toyota Camry
Toyota Camry
Toyota Corolla
Holden Rodeo Holden Rodeo
Mitsubishi Mirage Hyundai i30
Hyundai i30
Kia Rio
Q35000
10,000 20,000
15,000
2004 2009 2014
Holden Commodore
Holden Commodore
Holden Commodore
Holden Astra
Holden AstraFord Falcon
Ford Falcon
Toyota Camry Toyota Camry
Hyundai Excel Ford TerritoryHolden Rodeo
Holden Rodeo
Mazda 626 BMW 3 Series
1 6 3 0 0 0
1 6 3 0 0 0
In 2004, average vehicle distance purchased for $5,000 was 186,000 km. 10 years later, the average is 163,000 km which is actually a fall of 12%.
Top Selling Cars costing $5,000
Top Selling Cars costing $10,000
1
2
3
4
5
1
2
3
4
5
2004 2009 2014
18

manheim.com.au
Although the $20k average fell back a little in the last few years before rising again, the average km are up to 73,000 which is an increase of 43% on 2004.
The top selling vehicles for both price categories are shown in the accompanying tables. The Camry and Commodore are well represented as is the Ford Falcon. In line with new car sales, it is interesting to see that in 2014 commercial vehicles and SUV’s are also amongst the top selling used vehicles.
We know from our earlier analysis that post GFC, vehicles were getting older as they were kept on fleets for longer periods and leases were extended. On average across all price points average km increased by 43% since 2006 so it is not surprising to see the increases recorded in the higher value vehicle groups. Vehicles in these price brackets tended to be those makes and models usually seen on government, rental and corporate fleets, as well as popular leasing choices.
While the average km has risen, the type and the quality of vehicle able to be purchased for $15k or $20k has improved over the years.
Perhaps most surprising in this exercise was that the average km has fallen for vehicles which can be purchased for around the $5k and $10k mark. On face value one would expect the diminished purchasing power of a dollar in 2015 compared to a dollar in 2004, to restrict purchases of cars of this value to higher km than 10 years ago.
In future editions we will consider the average age of the vehicles in these price brackets and explore the intrinsic link between km, age and price at a deeper level.
Manheim InsightsWhat does $5k, $10k, $15k or $20k buy at a particular point in time?
5000
10,000 20,000
15,000
5000
10,000 20,000
15,000
Top Selling Cars costing $15,000
Top Selling Cars costing $20,000
Toyota Camry
Toyota Camry
Ford Falcon
Ford Falcon
Holden Astra
Holden Astra
Holden Commodore
Holden Commodore
Toyota Aurion
Subaru Forester
Subaru Forester
Toyota Aurion
Mitsubishi Triton
Nissan X-Trail
Toyota Hilux
Mitsubishi Magna
Toyota Camry
Toyota Camry
Toyota Hilux
Volkswagen Golf
Ford RangerFord Falcon
Toyota Corolla
Toyota Corolla
Toyota Corolla
Holden Rodeo
Holden Commodore Holden Commodore
Holden Commodore
Mitsubishi Magna
Source: Manheim Used Car Market Report
Q3
1 6 3 0 0 0
1 6 3 0 0 0
Although the $20k average fell back a little in the last few years before rising again, the average km are up to 73,000 which is an increase of 43% on 2004.
1
2
3
4
5
1
2
3
4
5
2004 2009 2014
2004 2009 2014
19

manheim.com.au
Manheim Initiatives Manheim Initiatives – Simulcast 2 launched
As the first remarketing services company in Australasia to introduce
online buying platforms and to broadcast in-lane auctions over the internet, Manheim has been a pioneer in online automotive and industrial asset sales.
Our technology platforms have evolved over the years to better facilitate the way buyers are researching and purchasing from Manheim.
Our technology platforms have evolved over the years to better facilitate the way buyers are researching and purchasing from Manheim.
Simulcast and website upgrades, new inspection and imaging capabilities and enhanced online presentation of vehicles and assets available for sale, have all improved with the trend towards increased website use for purchasing activities.
Online sales account for over 40% of all transactions at Manheim, a figure that is steadily rising and one we expect to continue to grow.
Our Salvage division leads the way for online sales, with online purchases accounting for 55% on average of the volume sold over the last 3.5 years. In our other divisions the trend has also been one of steady growth.
Online Passenger and Commercial vehicle sales account for 30% of the total volume, while in Truck and Machinery the figure is 20%.
In order to expand our online sales capacity and to be ready for the increasing numbers of buyers who are becoming more and more comfortable to make online purchases, especially using Simulcast, we recently built and launched a new version of our online auction system.
In a staggered launch program, new Simulcast was introduced on a state by state basis during a carefully managed 6 week program.
With each state coming on line, the number of auctions being run on the new software increased every week, as did the number of users online. New Simulcast coped perfectly and users have been positive in their response to the enhancements.
With a fresh new look and some great new features, it ensures an even easier and better online buying experience.
As the importance of online buying grows, Manheim is continuing to invest in our digital products and services to support online sales. Simulcast 2 is the next enhancement from our technology pipeline of innovations.
First car sold on new Manheim Simulcast
Some of the enhanced features are the ability for trade buyers and our sellers to instant message the auctioneer, the ability to view multiple auctions from one screen and being able to review your auction purchases, as well as viewing all the vehicles on offer from within the Simulcast system.
For more information about new Simulcast and to download the user guide, please click here.
Perhaps the best news for buyers is the fact that our new Simulcast system is compatible with all browser types and offers full mobile compatibility. Users will can access Simulcast from their smart phone or tablet as well as their PC, for even better access to our auction programs no matter where they are.
The first ever car sold to an online buyer on our new Simulcast system 2 in Australia was purchased within five minutes of the first auction using the new software.
Bought for $2,000 in Adelaide’s Salvage auction, the vehicle was a 2000 Holden Calais, with 222,475 km on the clock as pictured. The car is now part of our folklore.
Our new Simulcast can now be used on PC’s, tablets and smart phones.
Q3
20