Australian heart disease statistics - The Heart Foundation · PDF file‘Effect of...
124
Australian heart disease statistics Overweight, obesity and cardiovascular disease – past, present and future
Transcript of Australian heart disease statistics - The Heart Foundation · PDF file‘Effect of...

Australian heart disease statisticsOverweight, obesity and cardiovascular disease – past, present and future

Australian heart disease statistics 2014 National Heart Foundation of AustraliaB Australian Heart Disease Statistics 2014 The National Heart Foundation of AustraliaB
Suggested citation: Nichols M, Peterson K, Herbert J, Allender S. Australian heart disease statistics. Overweight, obesity and cardiovascular disease – past, present and future. Melbourne: National Heart Foundation of Australia, 2015.
ISBN 978-1-74345-108-3
© 2015 National Heart Foundation of Australia ABN 98 008 419 761
This work is copyright. No part of this publication may be reproduced in any form or language without prior written permission from the National Heart Foundation of Australia (national office). Enquiries concerning permissions should be directed to [email protected].
Disclaimer
This document has been produced by the National Heart Foundation of Australia for the information of health professionals. The statements and recommendations it contains are, unless labelled as ‘expert opinion’, based on independent review of the available evidence. Interpretation of this document by those without appropriate medical and/or clinical training is not recommended, other than at the request of, or in consultation with, a relevant health professional.
While care has been taken in preparing the content of this material, the Heart Foundation and its employees cannot accept any liability, including for any loss or damage, resulting from the reliance on the content, or for its accuracy, currency and completeness. The information is obtained and developed from a variety of sources including, but not limited to, collaborations with third parties and information provided by third parties under licence. It is not an endorsement of any organisation, product or service.
This material may be found in third parties’ programs or materials (including, but not limited to, show bags or advertising kits). This does not imply an endorsement or recommendation by the National Heart Foundation of Australia for such third parties’ organisations, products or services, including their materials or information. Any use of National Heart Foundation of Australia materials or information by another person or organisation is at the user’s own risk.
RES-114

National Heart Foundation of Australia Australian heart disease statistics
HeartStats – The National Heart Foundation of Australia/ Deakin University Heart Disease Statistics ProjectMelanie Nichols, Karen Peterson, Jessica Herbert and Steven Allender
‘Effect of overweight and obesity on health expenditure’ feature by John Goss, Centre for Research and Action in Public Health, Health Research Institute, University of Canberra
Australian heart disease statisticsOverweight, obesity and cardiovascular disease – past, present and future
i

Australian heart disease statistics National Heart Foundation of Australiaii
At last! We have needed a single, authoritative compilation of the facts on overweight and obesity in Australia for many years, and now it has arrived in the form of this special supplement to the annual Australian heart disease statistics report from the HeartStats team. Almost all countries are suffering under the increasing burden
of overweight and obesity and, in Australia, this, along with unhealthy diets, has now overtaken tobacco as the leading preventable health burden. To sensibly address any problem, it needs to be closely measured and monitored – the old sayings that ‘what gets measured gets done’ and ‘with no data, you are flying blind’ apply exactly to overweight and obesity.
While many sources of data have been brought together to compile this excellent compendium of facts, there is clearly an enormous gap in Australia of having no monitoring systems to routinely measure and report on the heights and weights of children. This is such a fundamental, easy and accurate way to assess progress on the healthy growth of Australia’s most precious assets: its future generations. Other wealthy countries like the UK, Scandinavian countries and many states in the USA have routine anthropometric monitoring of children, which tells a very fine-grained and nuanced story of their obesity epidemics.
Routine monitoring of children’s height and weight also provides an excellent tool to test the effectiveness of policies and large scale interventions. Evaluation of the impact of the recent National Partnership Agreement on Preventive Health would have been greatly enhanced by such a monitoring system.
Australia is leading the way in some strategies to improve nutrition and reduce obesity. The standout examples are Healthy Together Victoria and South Australia’s Obesity Prevention and Lifestyle (OPAL) programs at the state and community levels and the Health Star Rating system at the national policy level. Monitoring and evaluation systems for these initiatives are essential to assessing their population health impacts. In other areas, such as restricting unhealthy food marketing to children and taxing sugary drinks, Australia is lagging far behind other parts of the world. The Second Lancet Series on Obesity highlighted these and other cost-effective strategies as top priorities for reducing obesity. The series also noted the importance of strengthening accountability systems for action. The collection and dissemination of HeartStats reports are essential elements of the ‘Take the account’ and ‘Share the account’ steps in the accountability cycle.
Congratulations to the Heart Foundation, Deakin University HeartStats team and the University of Canberra for investing in the creation of this essential report on obesity – it will be quoted for many years to come.
Professor Boyd Swinburn
Professor of Population Nutrition and Global Health, University of Auckland, New Zealand
Alfred Deakin Professor and Co-Director of the World Health Organization (WHO) Collaborating Centre for Obesity Prevention, Deakin University, Australia
Co-Chair, World Obesity Federation – Policy & Prevention Section (formerly International Obesity Taskforce)
Foreword
National Heart Foundation of Australia Australian heart disease statistics iii
ContentsForeword . . . . . . . . . . . . . . . . . . . . . . . . . . . . . . . . . . . . . . . . . . . . . . . . . . . . . . . . . . . . . . . . . . . . . . . . . . . . . . . . . . . . . . .ii
Tables and figures. . . . . . . . . . . . . . . . . . . . . . . . . . . . . . . . . . . . . . . . . . . . . . . . . . . . . . . . . . . . . . . . . . . . . . . . . . . . . . . . iv
Preface . . . . . . . . . . . . . . . . . . . . . . . . . . . . . . . . . . . . . . . . . . . . . . . . . . . . . . . . . . . . . . . . . . . . . . . . . . . . . . . . . . . . . . . . ix
Acknowledgements . . . . . . . . . . . . . . . . . . . . . . . . . . . . . . . . . . . . . . . . . . . . . . . . . . . . . . . . . . . . . . . . . . . . . . . . . . . . . . .x
Summary of key facts . . . . . . . . . . . . . . . . . . . . . . . . . . . . . . . . . . . . . . . . . . . . . . . . . . . . . . . . . . . . . . . . . . . . . . . . . . . . . xi
Introduction . . . . . . . . . . . . . . . . . . . . . . . . . . . . . . . . . . . . . . . . . . . . . . . . . . . . . . . . . . . . . . . . . . . . . . . . . . . . . . . . . . . . .1
Chapter 1 – Prevalence . . . . . . . . . . . . . . . . . . . . . . . . . . . . . . . . . . . . . . . . . . . . . . . . . . . . . . . . . . . . . . . . . . . . . . . . . . . .3
Chapter 2 – Burden of cardiovascular diseases . . . . . . . . . . . . . . . . . . . . . . . . . . . . . . . . . . . . . . . . . . . . . . . . . . . . . . . . 13
Chapter 3 – Time trends . . . . . . . . . . . . . . . . . . . . . . . . . . . . . . . . . . . . . . . . . . . . . . . . . . . . . . . . . . . . . . . . . . . . . . . . . . 25
Feature – Effect of overweight and obesity on health expenditure . . . . . . . . . . . . . . . . . . . . . . . . . . . . . . . . . . . . . . . . . . 33
Chapter 4 – Socioeconomic variation . . . . . . . . . . . . . . . . . . . . . . . . . . . . . . . . . . . . . . . . . . . . . . . . . . . . . . . . . . . . . . . 39
Chapter 5 – Geographic variation . . . . . . . . . . . . . . . . . . . . . . . . . . . . . . . . . . . . . . . . . . . . . . . . . . . . . . . . . . . . . . . . . . 49
Chapter 6 – Aboriginal and Torres Strait Islander peoples . . . . . . . . . . . . . . . . . . . . . . . . . . . . . . . . . . . . . . . . . . . . . . . . . 57
Chapter 7 – International comparisons. . . . . . . . . . . . . . . . . . . . . . . . . . . . . . . . . . . . . . . . . . . . . . . . . . . . . . . . . . . . . . . 67
Chapter 8 – Behavioural risk factors . . . . . . . . . . . . . . . . . . . . . . . . . . . . . . . . . . . . . . . . . . . . . . . . . . . . . . . . . . . . . . . . . 79
Chapter 9 – Development and tracking . . . . . . . . . . . . . . . . . . . . . . . . . . . . . . . . . . . . . . . . . . . . . . . . . . . . . . . . . . . . . . 91
Abbreviations and acronyms . . . . . . . . . . . . . . . . . . . . . . . . . . . . . . . . . . . . . . . . . . . . . . . . . . . . . . . . . . . . . . . . . . . . . . 98
References . . . . . . . . . . . . . . . . . . . . . . . . . . . . . . . . . . . . . . . . . . . . . . . . . . . . . . . . . . . . . . . . . . . . . . . . . . . . . . . . . . . . 99
Appendix 1 – Health expenditure study and methods . . . . . . . . . . . . . . . . . . . . . . . . . . . . . . . . . . . . . . . . . . . . . . . . . . 100

Australian heart disease statistics National Heart Foundation of Australiaiv
Tables and figuresChapter 1 – Prevalence
Table 1.1 Prevalence of BMI categories and waist circumference risk categories, adults, by sex and age, 2011–12 . . . . 5
Figure 1.1a Prevalence of overweight and obesity, adults, by age, 2011–12 . . . . . . . . . . . . . . . . . . . . . . . . . . . . . . . . . . 6
Figure 1.1b Prevalence of risky waist circumference, adults, by age, 2011–12 . . . . . . . . . . . . . . . . . . . . . . . . . . . . . . . . 6
Table 1.2 Prevalence of BMI categories and waist circumference risk categories, adults, by sex and state or territory, 2011–12 . . . . . . . . . . . . . . . . . . . . . . . . . . . . . . . . . . . . . . . . . . . . . . . . . . . . . . . . . . 7
Figure 1.2 Prevalence of high BMI and high waist circumference, by sex and state or territory, 2011–12. a Men – Overweight or obese, b Women – Overweight or obese, c Men – High waist circumference, d Women – High waist circumference . . . . . . . . . . . . . . . . . . . . . . . . . . . . . . . . . . . . . . . . . . . . . . . . . . . . . . . . . . . . . . . 8
Table 1.3 Prevalence of BMI categories, children, by sex and age, 2011–12 . . . . . . . . . . . . . . . . . . . . . . . . . . . . . . . . . 10
Figure 1.3 Prevalence of overweight and obesity, children, by sex and age, 2011–12 . . . . . . . . . . . . . . . . . . . . . . . . . . 10
Table 1.4 Prevalence of BMI categories, children, by sex and state or territory, 2011–12 . . . . . . . . . . . . . . . . . . . . . . . . 11
Figure 1.4a Prevalence of overweight and obesity, boys, by state or territory, 2011–12 . . . . . . . . . . . . . . . . . . . . . . . . . 12
Figure 1.4b Prevalence of overweight and obesity, girls, by state or territory, 2011–12 . . . . . . . . . . . . . . . . . . . . . . . . . 12
Chapter 2 – Burden of cardiovascular diseases
Table 2.1 Prevalence of self-reported chronic disease, adults, by sex and BMI category, 2011–12 . . . . . . . . . . . . . . . . 15
Figure 2.1a Prevalence of self-reported chronic disease, men, by BMI category, 2011–12 . . . . . . . . . . . . . . . . . . . . . . . 15
Figure 2.1b Prevalence of self-reported chronic disease, women, by BMI category, 2011–12 . . . . . . . . . . . . . . . . . . . . 16
Table 2.2 Prevalence of clinical risk factors for chronic disease, adults, by sex and BMI category, 2011–12 . . . . . . . . . 16
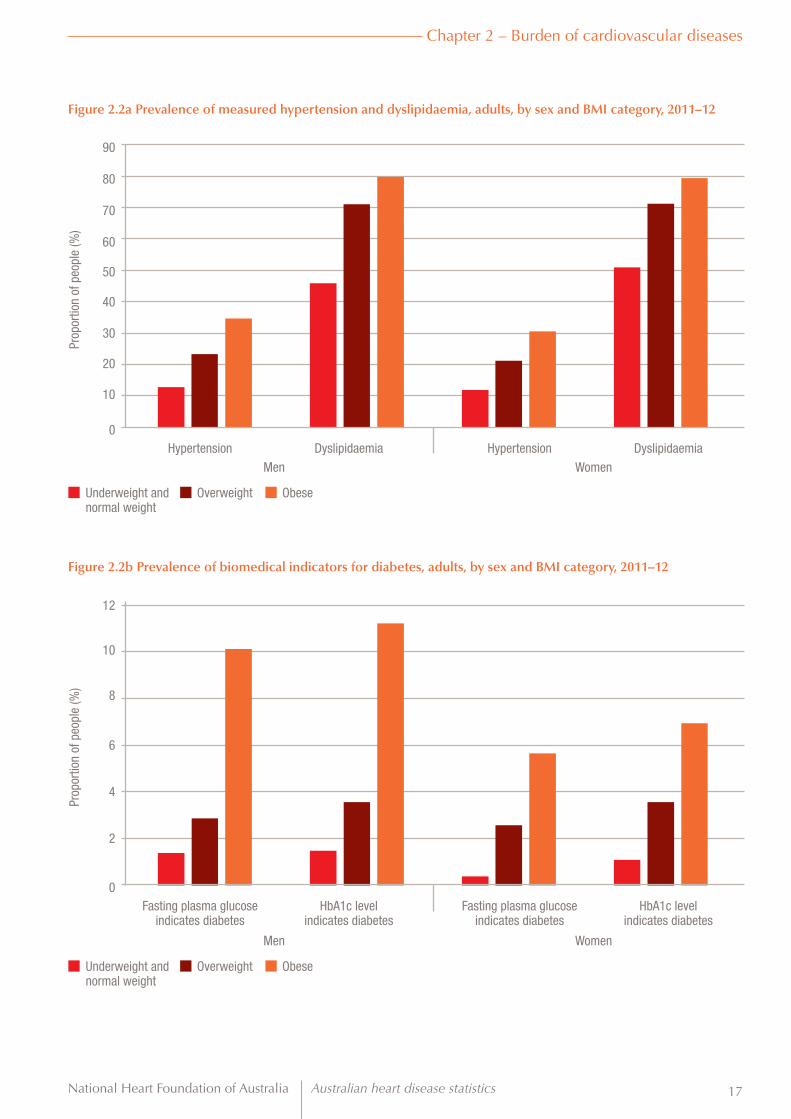
Figure 2.2a Prevalence of measured hypertension and dyslipidaemia, adults, by sex and BMI category, 2011–12 . . . . 17
Figure 2.2b Prevalence of biomedical indicators for diabetes, adults, by sex and BMI category, 2011–12 . . . . . . . . . . . 17
Table 2.3a Prevalence of hypertension according to smoking status and alcohol risk level, adults, by age group and BMI category, 2011–12 . . . . . . . . . . . . . . . . . . . . . . . . . . . . . . . . . . . . . . . . . . . . . . . . . . . . . 18
Table 2.3b Prevalence of dyslipidaemia according to smoking status and alcohol risk level, adults, by age group and BMI category, 2011–12 . . . . . . . . . . . . . . . . . . . . . . . . . . . . . . . . . . . . . . . . . . . . . . . . . . . . . 18
Table 2.4 Burden of disease (in disability-adjusted life years) contributed by high BMI, adults aged 25 years and over, by sex and age, Australia, 2010 . . . . . . . . . . . . . . . . . . . . . . . . . . . . . . . . . . . . . . . . . . . 19
Figure 2.4 Burden of disease (proportion of disability-adjusted life years) attributable to high BMI, adults aged 25 years and over, by sex and age, Australia, 2010 . . . . . . . . . . . . . . . . . . . . . . . . . . . . . . . . . 19
Table 2.5 Burden of cardiovascular disease (proportion of disability-adjusted life years) attributable to main risk factors, adults aged 25 years and over, by sex and age, Australia, 2010 . . . . . . . . . . . . . . . . . . . . . . . . . . . 20
Figure 2.5 Burden of cardiovascular disease (proportion of disability-adjusted life years) attributable to main risk factors, adults aged 25 years and over, by age, Australia, 2010 . . . . . . . . . . . . . . . . . . . . . . . . . . . . . . . . . 21
Table 2.6 Burden of ischaemic heart disease (proportion of disability-adjusted life years) attributable to main risk factors, adults aged 25 years and over, by sex and age, Australia, 2010 . . . . . . . . . . . . . . . . . . . . . . . . . . . 22
Figure 2.6 Burden of ischaemic heart disease (proportion of disability-adjusted life years) attributable to main risk factors, adults aged 25 years and over, by age, Australia, 2010 . . . . . . . . . . . . . . . . . . . . . . . . . . . . . . . . . 23

National Heart Foundation of Australia Australian heart disease statistics v
Chapter 3 – Time trends
Table 3.1 Trends in prevalence of overweight and obesity, adults, by sex and age, 1995 to 2011–12 . . . . . . . . . . . . . . 27
Figure 3.1a Trends in prevalence of combined overweight and obesity, men, by age, 1995 to 2011–12 . . . . . . . . . . . . 28
Figure 3.1b Trends in prevalence of combined overweight and obesity, women, by age, 1995 to 2011–12 . . . . . . . . . 28
Table 3.2 Trends in age-standardised prevalence of overweight and obesity, modelled estimates, adults aged 20 years and over, by sex, Australia, 1990 to 2013 . . . . . . . . . . . . . . . . . . . . . . . . . . . . . . . . . . . . . . . . . . . 29
Figure 3.2 Trends in age-standardised prevalence of overweight and obesity, modelled estimates, adults aged 20 years and over, by sex, Australia, 1990 to 2013 . . . . . . . . . . . . . . . . . . . . . . . . . . . 30
Table 3.3 Trends in prevalence of overweight and obesity, children aged 5–17 years, by sex and age, 1995 to 2011–12 . . . . . . . . . . . . . . . . . . . . . . . . . . . . . . . . . . . . . . . . . . . . . . . . . . . . . . . . . . . . . . . . . 30
Figure 3.3a Trends in prevalence of combined overweight and obesity, boys aged 5–17 years, by age, 1995 to 2011–12 . . . . . . . . . . . . . . . . . . . . . . . . . . . . . . . . . . . . . . . . . . . . . . . . . . . . . . . . . . . . . . . . . . . . . . . . 31
Figure 3.3b Trends in prevalence of combined overweight and obesity, girls aged 5–17 years, by age, 1995 to 2011–12 . . . . . . . . . . . . . . . . . . . . . . . . . . . . . . . . . . . . . . . . . . . . . . . . . . . . . . . . . . . . . . . . . . . . . . . . 31
Table 3.4 Trends in age-standardised prevalence of combined overweight and obesity, modelled estimates, children aged 2–19 years, by sex, Australia, 1990 to 2013 . . . . . . . . . . . . . . . . . . . . . . . . . . . . . . 32
Figure 3.4 Trends in age-standardised prevalence of combined overweight and obesity, modelled estimates, children aged 2–19 years, by sex, Australia, 1990 to 2013 . . . . . . . . . . . . . . . . . . . . . . . . . . . . . . 32
Feature – Effect of overweight and obesity on health expenditure
Table F.1 People 20 years and over in each BMI group, 2011–12 to 2031–32 . . . . . . . . . . . . . . . . . . . . . . . . . . . . . . . . 35
Figure F.1 Forecast average BMI for Australian men and women from 2011–12 to 2031–32 . . . . . . . . . . . . . . . . . . . . . 35
Table F.2 Health expenditure in Australia, 2011–12 to 2031–32 at 2011–12 constant prices . . . . . . . . . . . . . . . . . . . . 36
Table F.3 Summary of total health expenditure in Australia by disease, 2011–12 to 2031–32 at 2011–12 constant prices . . . . . . . . . . . . . . . . . . . . . . . . . . . . . . . . . . . . . . . . . . . . . . . . . . . . . . . . . . . . . . . . . . . . . . . . 36
Table F.4 Expenditure on cardiovascular disease and type 2 diabetes from elevated BMI, 2011–12 to 2031–32 at 2011–12 constant prices . . . . . . . . . . . . . . . . . . . . . . . . . . . . . . . . . . . . . . . . . . . . . . . . . . . . . 37
Figure F.4 Health expenditure attributable to elevated BMI . . . . . . . . . . . . . . . . . . . . . . . . . . . . . . . . . . . . . . . . . . . . . . 38
Table F.5 Expenditure on cardiovascular disease and type 2 diabetes per person aged over 20 years attributable to elevated BMI . . . . . . . . . . . . . . . . . . . . . . . . . . . . . . . . . . . . . . . . . . . . . . . . . . . . . . . 38
Chapter 4 – Socioeconomic variation
Table 4.1 Prevalence of overweight and obesity, adults, by decile of area-level socioeconomic status and sex, 2011–12 . . . . . . . . . . . . . . . . . . . . . . . . . . . . . . . . . . . . . . . . . . . . . . . . . . . . . . . . . . . . 41
Figure 4.1a Prevalence of overweight and obesity, men, by decile of area-level socioeconomic status, 2011–12 . . . . . . . . . . . . . . . . . . . . . . . . . . . . . . . . . . . . . . . . . . . . . . . . . . . . . . . . . . . . . . . . . . . 41
Figure 4.1b Prevalence of overweight and obesity, women, by decile of area-level socioeconomic status, 2011–12 . . . . . . . . . . . . . . . . . . . . . . . . . . . . . . . . . . . . . . . . . . . . . . . . . . . . . . . . . . . . . . . . . . . 42
Table 4.2 Prevalence of combined overweight and obesity, children, by decile of area-level socioeconomic status and sex, 2011–12 . . . . . . . . . . . . . . . . . . . . . . . . . . . . . . . . . . . . . . . . . . . . . . . . . . . . . . . . . . . . 43
Figure 4.2 Prevalence of combined overweight and obesity, children, by decile of area-level socioeconomic status and sex, 2011–12 . . . . . . . . . . . . . . . . . . . . . . . . . . . . . . . . . . . . . . . . . . . . . . . . . . . . . . . . . . . . 43
Table 4.3 Prevalence of overweight and obesity, adults, by equivalised household income and sex, 2011–12 . . . . . . . 44
Figure 4.3 Prevalence of combined overweight and obesity, adults, by equivalised household income and sex, 2011–12 . . . . . . . . . . . . . . . . . . . . . . . . . . . . . . . . . . . . . . . . . . . . . . . . . . . . . . . . . . . . . . . . . . . . . . . 44
Table 4.4 Prevalence of overweight and obesity, adults, by region of birth and sex, 2011–12 . . . . . . . . . . . . . . . . . . . . 45

Australian heart disease statistics National Heart Foundation of Australiavi
Figure 4.4 Prevalence of combined overweight and obesity, adults, by region of birth and sex, 2011–12 . . . . . . . . . . . 45
Table 4.5 Prevalence of overweight and obesity, adults, by highest year of school completed and sex, 2011–12 . . . . . . . . . . . . . . . . . . . . . . . . . . . . . . . . . . . . . . . . . . . . . . . . . . . . . . . . . . . . . 46
Figure 4.5 Prevalence of overweight and obesity, adults, by highest year of school completed and sex, 2011–12 . . . . . 46
Table 4.6 Prevalence of overweight and obesity, children aged 8–9 and 12–13 years, by family socioeconomic position and sex, 2011–12 . . . . . . . . . . . . . . . . . . . . . . . . . . . . . . . . . . . . . . . . . . . . . . . . . . 47
Figure 4.6 Prevalence of combined overweight and obesity, children aged 8–9 and 12–13 years, by family socioeconomic position and sex, 2011–12 . . . . . . . . . . . . . . . . . . . . . . . . . . . . . . . . . . . . . . . . . . . . . . . . . . . . . . . . . . 47
Chapter 5 – Geographic variation
Table 5.1 Prevalence of overweight and obesity, adults, by statistical area level 4, 2011–12 . . . . . . . . . . . . . . . . . . . . . 51
Figure 5.1a Prevalence of overweight and obesity, adults, Australia, by statistical area level 4, 2011–12. . . . . . . . . . . . 52
Figure 5.1b Prevalence of combined overweight and obesity, adults, Australian Capital Territory, by statistical area level 3, 2011–12 . . . . . . . . . . . . . . . . . . . . . . . . . . . . . . . . . . . . . . . . . . . . . . . . . . . . . . . . . . . . . . . . 53
Figure 5.1c Prevalence of combined overweight and obesity, adults, New South Wales, by statistical area level 4, 2011–12 . . . . . . . . . . . . . . . . . . . . . . . . . . . . . . . . . . . . . . . . . . . . . . . . . . . . . . . . . . . . . . . . 53
Figure 5.1d Prevalence of combined overweight and obesity, adults, Northern Territory, by statistical area level 4, 2011–12 . . . . . . . . . . . . . . . . . . . . . . . . . . . . . . . . . . . . . . . . . . . . . . . . . . . . . . . . . . . . . . . . 53
Figure 5.1e Prevalence of combined overweight and obesity, adults, Queensland, by statistical area level 4, 2011–12 . . . . . . . . . . . . . . . . . . . . . . . . . . . . . . . . . . . . . . . . . . . . . . . . . . . . . . . . . . . . . . . . 53
Figure 5.1f Prevalence of combined overweight and obesity, adults, South Australia, by statistical area level 4, 2011–12 . . . . . . . . . . . . . . . . . . . . . . . . . . . . . . . . . . . . . . . . . . . . . . . . . . . . . . . . . . . . . . . . 54
Figure 5.1g Prevalence of combined overweight and obesity, adults, Tasmania, by statistical area level 4, 2011–12 . . . . . . . . . . . . . . . . . . . . . . . . . . . . . . . . . . . . . . . . . . . . . . . . . . . . . . . . . . . . . . . . 54
Figure 5.1h Prevalence of combined overweight and obesity, adults, Victoria, by statistical area level 4, 2011–12 . . . . . . . . . . . . . . . . . . . . . . . . . . . . . . . . . . . . . . . . . . . . . . . . . . . . . . . . . . . . . . . . 54
Figure 5.1i Prevalence of combined overweight and obesity, adults, Western Australia, by statistical area level 4, 2011–12 . . . . . . . . . . . . . . . . . . . . . . . . . . . . . . . . . . . . . . . . . . . . . . . . . . . . . . . . . . . . . . . . 54
Table 5.2 Prevalence of BMI categories, adults, by sex and remoteness area categories, 2011–12 . . . . . . . . . . . . . . . . 55
Figure 5.2a Prevalence of BMI categories, men, by remoteness area categories, 2011–12. . . . . . . . . . . . . . . . . . . . . . . 56
Figure 5.2b Prevalence of BMI categories, women, by remoteness area categories, 2011–12 . . . . . . . . . . . . . . . . . . . . 56
Chapter 6 – Aboriginal and Torres Strait Islander peoples
Table 6.1 Prevalence of BMI categories and waist circumference risk categories, Aboriginal and Torres Strait Islander adults, by sex and age, 2012–13 . . . . . . . . . . . . . . . . . . . . . . . . . . . . . . . . . . . . . . 59
Figure 6.1a Prevalence of overweight and obesity, Aboriginal and Torres Strait Islander adults, by age, 2012–13 . . . . . 60
Figure 6.1b Prevalence of risky waist circumference, Aboriginal and Torres Strait Islander adults, by age, 2012–13 . . . 60
Table 6.2 Trends in prevalence of overweight and obesity, Aboriginal and Torres Strait Islander adults, by sex and age, 2004–05 and 2012–13 . . . . . . . . . . . . . . . . . . . . . . . . . . . . . . . . . . . . . . . . . . . . . . . . . . . . . . . . . . . . . 61
Figure 6.2a Trends in prevalence of obesity, Aboriginal and Torres Strait Islander men, by age, 2004–05 and 2012–13 61
Figure 6.2b Trends in prevalence of obesity, Aboriginal and Torres Strait Islander women, by age, 2004–05 and 2012–13 62
Table 6.3 Prevalence of BMI categories, Aboriginal and Torres Strait Islander children, by sex and age, 2012–13 . . . . . 63
Figure 6.3 Prevalence of overweight and obesity, Aboriginal and Torres Strait Islander children, by sex and age, 2012–13 . . . . . . . . . . . . . . . . . . . . . . . . . . . . . . . . . . . . . . . . . . . . . . . . . . . . . . . . . . . . . . . . . . . . . . . . 63
Table 6.4 Prevalence of combined overweight and obesity, Aboriginal and Torres Strait Islander adults, by decile of area-level socioeconomic status and sex, 2012–13 . . . . . . . . . . . . . . . . . . . . . . . . . . . . . . . . . . . . . . . . . . 64

National Heart Foundation of Australia Australian heart disease statistics vii
Figure 6.4 Prevalence of combined overweight and obesity, Aboriginal and Torres Strait Islander adults, by decile of area-level socioeconomic status and sex, 2012–13 . . . . . . . . . . . . . . . . . . . . . . . . . . . . . . . . . . . . . . . . . . 64
Table 6.5 Prevalence of combined overweight and obesity, Aboriginal and Torres Strait Islander adults, by equivalised household income and sex, 2012–13 . . . . . . . . . . . . . . . . . . . . . . . . . . . . . . . . . . . . . . . . . . . . . . . . . . . 65
Figure 6.5 Prevalence of combined overweight and obesity, Aboriginal and Torres Strait Islander adults, by equivalised household income and sex, 2012–13 . . . . . . . . . . . . . . . . . . . . . . . . . . . . . . . . . . . . . . . . . . . . . . . . . . . 65
Table 6.6 Prevalence of overweight and obesity, Aboriginal and Torres Strait Islander adults, by highest year of school completed and sex, 2012–13 . . . . . . . . . . . . . . . . . . . . . . . . . . . . . . . . . . . . . . . . . . . . . . . . . 66
Table 6.7 Prevalence of overweight and obesity, Aboriginal and Torres Strait Islander adults, by remoteness area categories and sex, 2012–13 . . . . . . . . . . . . . . . . . . . . . . . . . . . . . . . . . . . . . . . . . . . . . . . . . . . . . . 66
Chapter 7 – International comparisons
Table 7.1 Trends in age-standardised prevalence of combined overweight and obesity, modelled estimates, adults aged 20 years and over, by sex and world region, 1990 to 2013 . . . . . . . . . . . . . . . . . . . . . . . . . . . . . . . . . . . . . 69
Figure 7.1a Trends in age-standardised prevalence of combined overweight and obesity, modelled estimates, men aged 20 years and over, by world region, 1990 to 2013 . . . . . . . . . . . . . . . . . . . . . . . . . . . . . . . . . . . . . . . . . . . . 70
Figure 7.1b Trends in age-standardised prevalence of combined overweight and obesity, modelled estimates, women aged 20 years and over, by world region, 1990 to 2013 . . . . . . . . . . . . . . . . . . . . . . . . . . . . . . . . . . . . . . . . . . 70
Table 7.2 Trends in age-standardised prevalence of combined overweight and obesity, modelled estimates, adults aged 20 years and over, by sex, Australia and selected countries, 1990 to 2013 . . . . . . . . . . . . . . . . . . . . . . . . . 71
Figure 7.2a Trends in prevalence of combined overweight and obesity, modelled estimates, men aged 20 years and over, Australia and selected countries, 1990 to 2013 . . . . . . . . . . . . . . . . . . . . . . . . . . . . . . . . 72
Figure 7.2b Trends in prevalence of combined overweight and obesity, modelled estimates, women aged 20 years and over, Australia and selected countries, 1990 to 2013 . . . . . . . . . . . . . . . . . . . . . . . . . . . . . . 72
Figure 7.2c Trends in age-standardised prevalence of combined overweight and obesity, by country, men aged 20 years and over, 1993 and 2013 . . . . . . . . . . . . . . . . . . . . . . . . . . . . . . . . . . . . . . . . . . . . . . . 73
Figure 7.2d Trends in age-standardised prevalence of combined overweight and obesity, by country, women aged 20 years and over, 1993 and 2013 . . . . . . . . . . . . . . . . . . . . . . . . . . . . . . . . . . . . . . . . . . . . . 73
Table 7.3 Trends in age-standardised prevalence of combined overweight and obesity, modelled estimates, children aged 2–19 years, by sex and world region, 1990 to 2013 . . . . . . . . . . . . . . . . . . . . . . . . 74
Table 7.4 Trends in age-standardised prevalence of combined overweight and obesity, modelled estimates, children aged 2–19 years, by sex, Australia and selected countries, 1990 to 2013 . . . . . . . . . . . . 75
Figure 7.4a Age-standardised prevalence of combined overweight and obesity, modelled estimates, boys aged 2–19 years, Australia and selected countries, 1990 to 2013 . . . . . . . . . . . . . . . . . . . . . . . . . . . . . . . . . . . . . 76
Figure 7.4b Age-standardised prevalence of combined overweight and obesity, modelled estimates, girls aged 2–19 years, Australia and selected countries, 1990 to 2013 . . . . . . . . . . . . . . . . . . . . . . . . . . . . . . . . . . . . . . 76
Figure 7.4c Trends in age-standardised prevalence of combined overweight and obesity, by country, boys aged 2–19 years, 1993 and 2013 . . . . . . . . . . . . . . . . . . . . . . . . . . . . . . . . . . . . . . . . . . . . . . . . . . . . 77
Figure 7.4d Trends in age-standardised prevalence of combined overweight and obesity, by country, girls aged 2–19 years, 1993 and 2013 . . . . . . . . . . . . . . . . . . . . . . . . . . . . . . . . . . . . . . . . . . . . . . . . . . . . . 77
Chapter 8 – Behavioural risk factorsTable 8.1 Prevalence of meeting physical activity guidelines, adults, by sex, age and BMI category, 2011–12 . . . . . . . 81
Figure 8.1 Prevalence of meeting physical activity guidelines, adults, by sex and BMI category, 2011–12 . . . . . . . . . . 82
Table 8.2 Mean hours spent sitting or lying down in past week, adults, by sex, age and BMI category, 2011–12 . . . . . 83
Figure 8.2 Mean hours spent sitting or lying down in past week, adults, by sex and BMI category, 2011–12 . . . . . . . . 84
Table 8.3 Mean number of pedometer steps taken on survey day, people aged 5 years and over, by sex, age and BMI category, 2011–12 . . . . . . . . . . . . . . . . . . . . . . . . . . . . . . . . . . . . . . . . . . . . . . . . . . . . . . . . . . . . . 85

Australian heart disease statistics National Heart Foundation of Australiaviii
Figure 8.3 Mean number of pedometer steps taken on survey day, people aged 5 years and over, by sex and BMI category, 2011–12 . . . . . . . . . . . . . . . . . . . . . . . . . . . . . . . . . . . . . . . . . . . . . . . . . . . . . . . . . . . . . . . . 86
Table 8.4 Usual daily vegetable and fruit consumption, by sex and BMI category, adults, 2011–12 . . . . . . . . . . . . . . . 87
Figure 8.4a Usual daily vegetable consumption, adults, by sex and BMI category, 2011–12 . . . . . . . . . . . . . . . . . . . . . 88
Figure 8.4b Usual daily fruit consumption, adults, by sex and BMI category, 2011–12 . . . . . . . . . . . . . . . . . . . . . . . . . 88
Table 8.5 Mean daily intake of fibre, total fat and saturated fat, adults, by age, sex and BMI category, 2011–12 . . . . . . 89
Figure 8.5 Mean daily intake of fibre, total fat and saturated fat, adults, by sex and BMI category, 2011–12 . . . . . . . . . 90
Chapter 9 – Development and tracking
Table 9.1 Prevalence of BMI categories, by baseline BMI category, adults aged 25 years and over, 2011–12 . . . . . . . . 93
Figure 9.1 Prevalence of BMI categories, by baseline BMI category, adults aged 25 years and over, 2011–12. . . . . . . . 93
Table 9.2 Prevalence of waist circumference risk, by baseline waist circumference risk, adults aged 25 years and over, 2011–12 . . . . . . . . . . . . . . . . . . . . . . . . . . . . . . . . . . . . . . . . . . . . . . . . . . . . . . . . . . . . 94
Figure 9.2 Prevalence of waist circumference risk, by baseline waist circumference risk, adults aged 25 years and over, 2011–12 . . . . . . . . . . . . . . . . . . . . . . . . . . . . . . . . . . . . . . . . . . . . . . . . . . . . . . . . . . . . 94
Table 9.3 Prevalence of BMI categories between 4 and 12 years of age, by sex, 2004 to 2012 . . . . . . . . . . . . . . . . . . . 94
Figure 9.3a Prevalence of BMI categories between 4 and 12 years of age, boys, 2004 to 2012 . . . . . . . . . . . . . . . . . . . 95
Figure 9.3b Prevalence of BMI categories between 4 and 12 years of age, girls, 2004 to 2012 . . . . . . . . . . . . . . . . . . . 95
Table 9.4 Tracking of BMI categories from age 4 to age 12 years, by sex, 2004 to 2012 . . . . . . . . . . . . . . . . . . . . . . . . 96
Figure 9.4a Tracking of BMI categories from age 4 to age 12 years, boys, 2004 to 2012 . . . . . . . . . . . . . . . . . . . . . . . . 97
Figure 9.4b Tracking of BMI categories from age 4 to age 12 years, girls, 2004 to 2012 . . . . . . . . . . . . . . . . . . . . . . . . 97
Appendix 1 – Health expenditure study and methods
Table A1.1 Relative risk of developing disease by selected BMI points and age . . . . . . . . . . . . . . . . . . . . . . . . . . . . . . 102

National Heart Foundation of Australia Australian heart disease statistics ix
PrefaceThis supplement to our annual compendium, Australian heart disease statistics, presents data that paint a very grim picture of the nation’s growing problem with weight.
Our project partners at Deakin University and the University of Canberra have diligently brought
together data from numerous sources to provide a comprehensive overview of the cardiovascular and other health impacts of overweight and obesity in Australia. These data tell us we are facing a likely public health crisis that is unfolding slowly, but steadily, year after year. Today, 63% of Australian adults are overweight or obese, compared with approximately 56% in 1995. Only one in three adults (35%) are healthy weight. The picture for children is also alarming. One in four children aged 2–17 years (25%) is overweight or obese.
The rise in the rates of overweight and obesity over the past two decades has very serious implications for the future burden of disease. Overweight and obesity are major modifiable risk factors for heart disease and stroke, as well as for type 2 diabetes, chronic kidney disease, some cancers and osteoarthritis, among others.
For this reason, this report does more than document the overweight and obesity crisis. The feature ‘Effect of overweight and obesity on health expenditure’ considers the future impact of overweight and obesity, especially on disease rates and future healthcare costs. It reveals that the number of obese adults is expected to nearly double by 2031–32, which means 41% of the adult population will be obese. This will result in expenditure of $11.5 billion, or 22% of the $51.1 billion cardiovascular expenditure, will be attributable to elevated body mass index (BMI) in 2031–32.
Armed with this information, we would expect all Australian governments to take decisive action to bring the overweight and obesity crisis under control. To date, however, little has been done.
This is not a problem unique to Australia. As the World Health Organization notes, ‘Obesity is one of today’s most blatantly visible – yet most neglected – public health problems.’
The challenge that faces the Heart Foundation, and our public health allies, is no longer exclusively one of data and research. It is also one of advocacy and action.
Contrary to the views of some, great gains are within reach. We should start by looking at policies that:
• curb marketing of energy-dense, nutrient-poor food and beverages to children
• reduce demand for energy-dense, nutrient-poor foods, such as tax and pricing options for sugar-sweetened beverages
• supercharge the national food reformulation program
• make nutrition labelling in fast food outlets mandatory
• give greater support to the Health Star Rating system, and move to make it mandatory
• invest in education campaigns such as LiveLighter
• develop a funded, national physical activity action plan to get us all to ‘Move more, sit less’.
These policies and others are needed to bring this crisis under control. This will take time and effort. Most importantly, however, it will take strong political leadership. But it needs to happen now.
We no longer have time on our side.
Mary Barry – CEO National National Heart Foundation of Australia

Australian heart disease statistics National Heart Foundation of Australiax
AcknowledgementsThis report, although primarily the work of the authors, would not have happened without contributions from the HeartStats Executive Committee and Heart Foundation staff.
The HeartStats Executive Committee provided strategic oversight, advice and support for the report. In addition to the report’s authors, the committee included the following people:
Professor Lee Astheimer, Deputy Vice-Chancellor (Research), Deakin University
Professor Rachel Davey, Director, Centre for Research and Action in Public Health, University of Canberra
Dr Akiko Ono, National Director – Research, Heart Foundation
Mr Bill Stavreski, National Director – Data and Evaluation, Heart Foundation
The following people also provided valuable contributions to this project, either by supporting the Executive Committee or during the production of the report:
Mr Rohan Greenland, National Director – Government Relations, Heart Foundation
Dr Rob Grenfell, National Director – Cardiovascular Health, Heart Foundation
Mr Frank Anastasopoulos, Research Program Manager, Heart Foundation
Ms Hayley Hawkins, National Publications and Content Editor, Heart Foundation
Ms Laura Alston, PhD candidate, Deakin University
The HeartStats team gratefully acknowledges all individuals and organisations involved in collecting and managing the various datasets referenced in this report.
National Heart Foundation of Australia Australian heart disease statistics xi
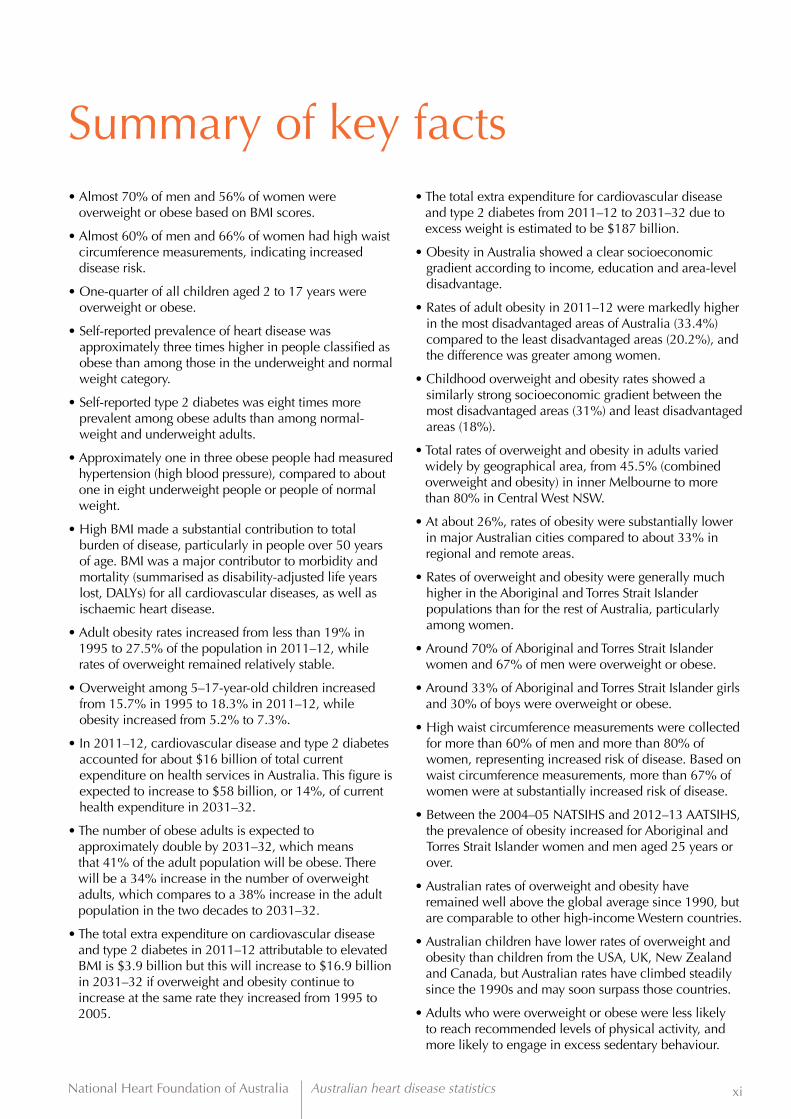
Summary of key facts• Almost 70% of men and 56% of women were
overweight or obese based on BMI scores.
• Almost 60% of men and 66% of women had high waist circumference measurements, indicating increased disease risk.
• One-quarter of all children aged 2 to 17 years were overweight or obese.
• Self-reported prevalence of heart disease was approximately three times higher in people classified as obese than among those in the underweight and normal weight category.
• Self-reported type 2 diabetes was eight times more prevalent among obese adults than among normal-weight and underweight adults.
• Approximately one in three obese people had measured hypertension (high blood pressure), compared to about one in eight underweight people or people of normal weight.
• High BMI made a substantial contribution to total burden of disease, particularly in people over 50 years of age. BMI was a major contributor to morbidity and mortality (summarised as disability-adjusted life years lost, DALYs) for all cardiovascular diseases, as well as ischaemic heart disease.
• Adult obesity rates increased from less than 19% in 1995 to 27.5% of the population in 2011–12, while rates of overweight remained relatively stable.
• Overweight among 5–17-year-old children increased from 15.7% in 1995 to 18.3% in 2011–12, while obesity increased from 5.2% to 7.3%.
• In 2011–12, cardiovascular disease and type 2 diabetes accounted for about $16 billion of total current expenditure on health services in Australia. This figure is expected to increase to $58 billion, or 14%, of current health expenditure in 2031–32.
• The number of obese adults is expected to approximately double by 2031–32, which means that 41% of the adult population will be obese. There will be a 34% increase in the number of overweight adults, which compares to a 38% increase in the adult population in the two decades to 2031–32.
• The total extra expenditure on cardiovascular disease and type 2 diabetes in 2011–12 attributable to elevated BMI is $3.9 billion but this will increase to $16.9 billion in 2031–32 if overweight and obesity continue to increase at the same rate they increased from 1995 to 2005.
• The total extra expenditure for cardiovascular disease and type 2 diabetes from 2011–12 to 2031–32 due to excess weight is estimated to be $187 billion.
• Obesity in Australia showed a clear socioeconomic gradient according to income, education and area-level disadvantage.
• Rates of adult obesity in 2011–12 were markedly higher in the most disadvantaged areas of Australia (33.4%) compared to the least disadvantaged areas (20.2%), and the difference was greater among women.
• Childhood overweight and obesity rates showed a similarly strong socioeconomic gradient between the most disadvantaged areas (31%) and least disadvantaged areas (18%).
• Total rates of overweight and obesity in adults varied widely by geographical area, from 45.5% (combined overweight and obesity) in inner Melbourne to more than 80% in Central West NSW.
• At about 26%, rates of obesity were substantially lower in major Australian cities compared to about 33% in regional and remote areas.
• Rates of overweight and obesity were generally much higher in the Aboriginal and Torres Strait Islander populations than for the rest of Australia, particularly among women.
• Around 70% of Aboriginal and Torres Strait Islander women and 67% of men were overweight or obese.
• Around 33% of Aboriginal and Torres Strait Islander girls and 30% of boys were overweight or obese.
• High waist circumference measurements were collected for more than 60% of men and more than 80% of women, representing increased risk of disease. Based on waist circumference measurements, more than 67% of women were at substantially increased risk of disease.
• Between the 2004–05 NATSIHS and 2012–13 AATSIHS, the prevalence of obesity increased for Aboriginal and Torres Strait Islander women and men aged 25 years or over.
• Australian rates of overweight and obesity have remained well above the global average since 1990, but are comparable to other high-income Western countries.
• Australian children have lower rates of overweight and obesity than children from the USA, UK, New Zealand and Canada, but Australian rates have climbed steadily since the 1990s and may soon surpass those countries.
• Adults who were overweight or obese were less likely to reach recommended levels of physical activity, and more likely to engage in excess sedentary behaviour.

Australian heart disease statistics National Heart Foundation of Australiaxii
• In both adults and children, the number of pedometer-measured steps per day was lower among those with higher BMI scores.
• Obese respondents had lower daily fibre intake and higher total fat and saturated fat intakes than those classified as normal weight.
• In the AusDiab longitudinal study, about 87% of people who were obese at baseline (1999–2000) were still obese at follow-up in 2011–12. An additional 24% of people who were overweight at baseline were obese at follow-up.
• Of AusDiab respondents who had high-risk waist circumferences at baseline, 93% were still at high risk 12 years later. Further, 47% of those who were low risk at baseline had become high risk by 2011–12.
• In the Longitudinal Study of Australian Children, 48% of children who were obese at age 4 years were still obese at age 12 years. Additionally, 17% of children who were overweight at age 4 years had become obese by age 12 years.
National Heart Foundation of Australia Australian heart disease statistics 1
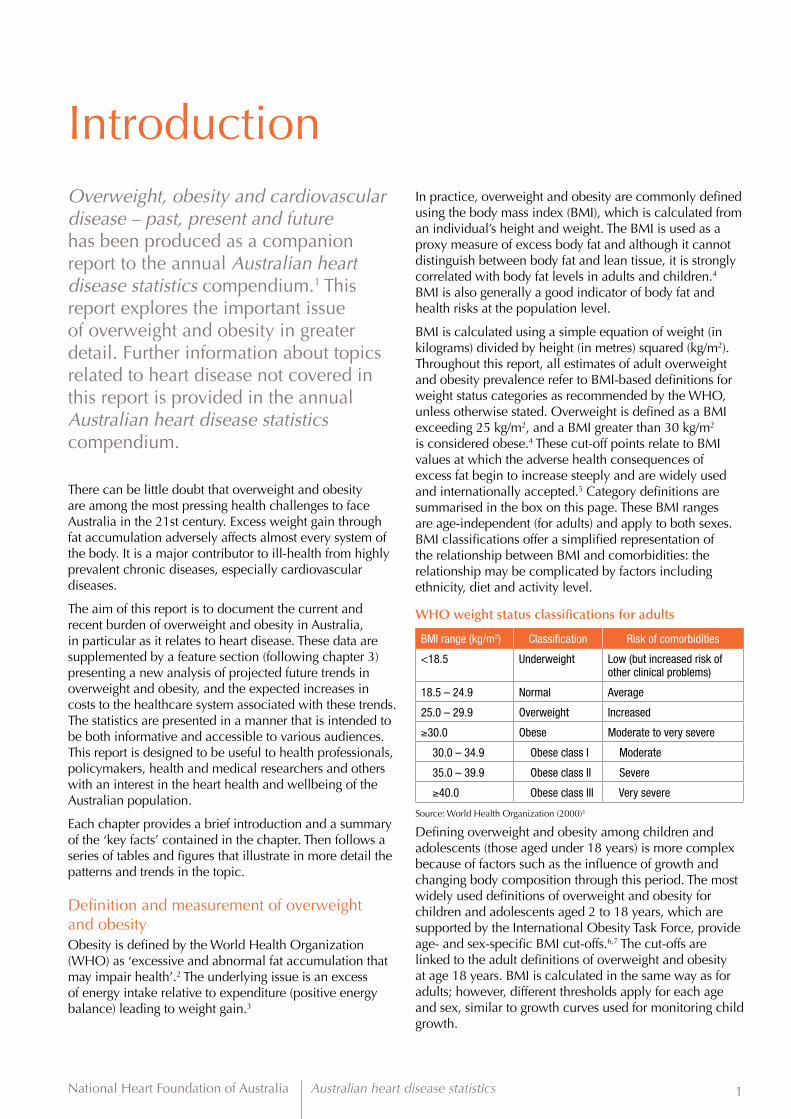
IntroductionOverweight, obesity and cardiovascular disease – past, present and future has been produced as a companion report to the annual Australian heart disease statistics compendium.1 This report explores the important issue of overweight and obesity in greater detail. Further information about topics related to heart disease not covered in this report is provided in the annual Australian heart disease statistics compendium.
There can be little doubt that overweight and obesity are among the most pressing health challenges to face Australia in the 21st century. Excess weight gain through fat accumulation adversely affects almost every system of the body. It is a major contributor to ill-health from highly prevalent chronic diseases, especially cardiovascular diseases.
The aim of this report is to document the current and recent burden of overweight and obesity in Australia, in particular as it relates to heart disease. These data are supplemented by a feature section (following chapter 3) presenting a new analysis of projected future trends in overweight and obesity, and the expected increases in costs to the healthcare system associated with these trends. The statistics are presented in a manner that is intended to be both informative and accessible to various audiences. This report is designed to be useful to health professionals, policymakers, health and medical researchers and others with an interest in the heart health and wellbeing of the Australian population.
Each chapter provides a brief introduction and a summary of the ‘key facts’ contained in the chapter. Then follows a series of tables and figures that illustrate in more detail the patterns and trends in the topic.
Definition and measurement of overweight and obesityObesity is defined by the World Health Organization (WHO) as ‘excessive and abnormal fat accumulation that may impair health’.2 The underlying issue is an excess of energy intake relative to expenditure (positive energy balance) leading to weight gain.3
In practice, overweight and obesity are commonly defined using the body mass index (BMI), which is calculated from an individual’s height and weight. The BMI is used as a proxy measure of excess body fat and although it cannot distinguish between body fat and lean tissue, it is strongly correlated with body fat levels in adults and children.4 BMI is also generally a good indicator of body fat and health risks at the population level.
BMI is calculated using a simple equation of weight (in kilograms) divided by height (in metres) squared (kg/m2). Throughout this report, all estimates of adult overweight and obesity prevalence refer to BMI-based definitions for weight status categories as recommended by the WHO, unless otherwise stated. Overweight is defined as a BMI exceeding 25 kg/m2, and a BMI greater than 30 kg/m2 is considered obese.4 These cut-off points relate to BMI values at which the adverse health consequences of excess fat begin to increase steeply and are widely used and internationally accepted.5 Category definitions are summarised in the box on this page. These BMI ranges are age-independent (for adults) and apply to both sexes. BMI classifications offer a simplified representation of the relationship between BMI and comorbidities: the relationship may be complicated by factors including ethnicity, diet and activity level.
WHO weight status classifications for adults
BMI range (kg/m2) Classification Risk of comorbidities
<18.5 Underweight Low (but increased risk of other clinical problems)
18.5 – 24.9 Normal Average
25.0 – 29.9 Overweight Increased
≥30.0 Obese Moderate to very severe
30.0 – 34.9 Obese class I Moderate
35.0 – 39.9 Obese class II Severe
≥40.0 Obese class III Very severe
Source: World Health Organization (2000)3
Defining overweight and obesity among children and adolescents (those aged under 18 years) is more complex because of factors such as the influence of growth and changing body composition through this period. The most widely used definitions of overweight and obesity for children and adolescents aged 2 to 18 years, which are supported by the International Obesity Task Force, provide age- and sex-specific BMI cut-offs.6,7 The cut-offs are linked to the adult definitions of overweight and obesity at age 18 years. BMI is calculated in the same way as for adults; however, different thresholds apply for each age and sex, similar to growth curves used for monitoring child growth.

Australian heart disease statistics National Heart Foundation of Australia2
Overweight and obesity in AustraliaObesity became prominent as a major health issue in Australia around the 1980s. Before this time, there was somewhat limited public awareness of the health effects of obesity, and the prevalence across the population was relatively low. Indeed, even during the 1980s as rates of obesity began to rise, awareness and action were limited by a lack of routine monitoring systems in place to detect the changes in population prevalence.8 Into the 1990s, the issue became more apparent, especially among children.9,10 It was not until the 2000s that awareness and action began to spike.8
Since this time, a large number of authoritative government reports and recommendations have presented approaches to prevent and reduce obesity at a population level. There has been increased public investment in programs and activities aimed at preventing and reducing the burden of obesity in Australia. In particular, funding has been provided for large-scale social marketing campaigns and implementation of community-based obesity prevention programs, many focused on children.8 Although the evidence for the impact of these programs on population health remains scarce, it is important to note that there have been some actions in place that have attempted to address the rising prevalence of obesity. Without these efforts, it is plausible that the situation may have been worse than it currently is. In addition, as with many aspects of health and wellbeing in Australia, there remains no ongoing, routine national monitoring system that includes measurements of overweight and obesity. Researchers, clinicians and policymakers alike are left without clear evidence of the ways that the obesity ‘epidemic’ has spread through populations, or regular timely updates on progress.
Data sources and interpretationIn Overweight, obesity and cardiovascular disease – past, present and future, we present a detailed national analysis of overweight and obesity in Australia. We have used the most up-to-date and high-quality data available from a number of Australian and international sources to report on patterns and variations in overweight and obesity by age, sex, sociodemographic characteristics and geography, and over time. Every effort has been made to ensure that the data are presented accurately, and that major limitations or caveats to the interpretation are highlighted; however the original sources should be consulted for further information.
In all sections of this report we have focused on overweight and obesity data that are derived from measured (rather than self-reported) height and weight. There is strong evidence that self-reporting of measurements results in participants under-reporting
their weight and over-reporting their height, leading to an underestimation of BMI and obesity prevalence.11 Further, the magnitude of the misreporting varies widely, depending on the characteristics of the population.11 As a result, data gathered through self-reported surveys should not, generally, be directly compared with direct measurements of height and weight.
The purpose of this report is to present the best and most up-to-date data in a clear and factual manner. Where possible and appropriate, data have been presented according to sex, age group, state or territory of residence and other sociodemographic groupings. This format allows some comparisons among groups; however no statistical tests have been applied to these data and as a result, differences, especially small differences, may be a result of variations in data collection methods or sample sizes rather than true differences in the underlying population. The notes accompanying each data table contain important information about data quality, comparability and limitations.
Print copies of this report can be obtained by contacting the Heart Foundation Research Program on (03) 9321 1581 or emailing [email protected].
Electronic copies are available on the Heart Foundation website at www.heartfoundation.org.au.

National Heart Foundation of Australia Australian heart disease statistics 3
Chapter 1 Prevalence
Key facts
• Almost 70% of men and 56% of women were overweight or obese based on BMI scores.
• Almost 60% of men and 66% of women had high waist circumference measurements, indicating increased disease risk.
• One-quarter of all children aged 2 to 17 years were overweight or obese.

Australian heart disease statistics National Heart Foundation of Australia4
IntroductionThis chapter presents the most current data for the prevalence of overweight and obesity among adults and children in Australia. The data presented are drawn from the recent Australian Health Survey 2011–12† (AHS). The tables and figures in this chapter show how the prevalence of overweight and obesity vary according to age, sex and state or territory. The AHS collected height, weight and waist circumference measurements, as well as a wide range of other health and wellbeing indicators, from a nationally representative sample of Australian adults and children in 2011–12.
Overweight and obesity are determined using body mass index (BMI)-based categories. At a population level, these categories provide a good indication of the proportion of the population at risk of ill-health caused by excess weight. As outlined in the definition and measurement of overweight and obesity on page 1 of this report, BMI categories for underweight, normal weight, overweight and obesity are based on cut-off values recommended by the World Health Organization (WHO) for adults3 and by the International Obesity Task Force for children and adolescents.6,7 The WHO weight status classifications for adults are outlined on page 1.
Risk categories for adults based on waist circumference are also presented in this chapter. There is evidence that increased waist circumference provides a more direct representation of cardio-metabolic health risk than BMI. This is because waist circumference measures fat that has accumulated around the centre of the body, and it is this fat, near the vital organs, that is thought to have the greatest impact on metabolism and health.12
All prevalence data in this chapter are based on measured (rather than self-reported) data.
Chapter 1 – Prevalence
† In this report, year spans (including spans that cover complete as well as incomplete years) are written in full; e.g. 2011–2012, except where owners and authors of the reports and data report it in elided format; e.g. 2011–12. Financial years are elided; e.g. 2011–12.

National Heart Foundation of Australia Australian heart disease statistics 5
Chapter 1 – Prevalence
Tables and figures
Table 1.1 Prevalence of BMI categories and waist circumference risk categories, adults, by sex and age, 2011–12
BMI categories Waist circumference risk categories
Underweight Normal weight Overweight Obese Not at risk Increased risk Substantially increased risk
Men
18–24 4.4 54.8 27.5 13.5 75.2 11.8 12.8
25–34 *1.5 34.3 43.7 21.1 53.0 23.4 23.8
35–44 *0.6 24.7 45.7 29.3 38.9 28.7 32.2
45–54 *0.9 20.8 45.0 33.5 31.3 27.6 41.3
55–64 *0.4 20.9 40.5 37.8 23.9 26.4 49.6
65–74 0.0 19.0 46.5 34.1 18.9 25.8 55.1
75+ **0.5 28.9 48.3 22.2 28.3 24.9 46.5
All men 1.2 29.1 42.2 27.5 40.4 24.3 35.3
Women
18–24 7.0 61.2 14.6 16.9 59.5 17.6 22.7
25–34 2.6 54.0 23.0 20.1 48.5 21.0 30.3
35–44 *0.9 44.5 27.3 27.3 33.9 23.2 43.0
45–54 *1.1 35.5 33.1 30.6 27.3 22.5 50.3
55–64 *0.9 29.9 33.6 35.3 20.0 19.8 60.4
65–74 *1.0 29.7 33.3 35.8 16.8 21.9 61.4
75+ *2.5 31.7 37.3 27.9 18.3 22.5 59.4
All women 2.2 42.2 28.2 27.5 33.7 21.3 45.0
Persons
18–24 5.6 58.1 21.4 15.1 67.7 14.6 17.5
25–34 2.0 43.5 34.0 20.6 50.9 22.2 26.9
35–44 0.7 34.3 36.6 28.4 36.4 26.0 37.5
45–54 0.9 28.0 39.1 32.0 29.3 25.1 45.8
55–64 *0.6 25.6 37.2 36.7 22.0 23.2 54.9
65–74 *0.6 24.6 39.8 35.2 17.9 23.8 58.2
75+ 1.9 30.5 42.5 25.4 23.0 23.6 53.4
All persons 1.6 35.5 35.3 27.5 37.2 22.8 40.0
* Estimate has a relative standard error of 25–50% and should be used with caution.** Estimate has a standard error >50% and is considered too unreliable for general use.Source: Australian Bureau of Statistics, 4324.0.55.003 - Microdata: Australian Health Survey, Core Content - Risk Factors and Selected Health Conditions, 2011–12Notes: Proportion of people aged 18 years and over. Survey participants were measured for height, weight and waist circumference, and BMI categories were calculated based on height and weight. BMI categories are based on the WHO definitions for people aged 18 years and over. For men, a waist circumference greater than 94 cm represents increased risk, and a circumference greater than 102 cm represents substantially increased risk. For women, a waist circumference greater than 80 cm represents increased risk, and a circumference greater than 88 cm represents substantially increased risk. Estimates of prevalence of waist circumference categories for persons have been calculated manually from ABS-generated raw estimates for each sex.

Australian heart disease statistics National Heart Foundation of Australia6
Figure 1.1a Prevalence of overweight and obesity, adults, by age, 2011–12
Figure 1.1b Prevalence of risky waist circumference, adults, by age, 2011–12
0
0
10
10
20
20
30
30
40
40
50
50
60
60
70
70
80
80
90
90
18–24
18–24
25–34
25–34
35–44
35–44
45–54
45–54
55–64
55–64
65–74
65–74
75+
75+
All persons
All persons
Obese
Substantially increased risk
Overweight
Increased risk
Prop
ortio
n of
peo
ple
(%)
Prop
ortio
n of
peo
ple
(%)
Age (years)
Age (years)
Chapter 1 – Prevalence

National Heart Foundation of Australia Australian heart disease statistics 7
Table 1.2 Prevalence of BMI categories and waist circumference risk categories, adults, by sex and state or territory, 2011–12
BMI categories Waist circumference risk categories
Underweight and normal weight Overweight Obese Not at risk Increased risk Substantially
increased risk
MenAustralian Capital Territory 30.2 45.1 24.5 43.3 24.5 32.7
New South Wales 31.8 41.7 26.5 41.2 24.8 33.8
Northern Territory 31.5 40.7 26.7 42.0 23.5 34.5
Queensland 27.6 40.9 31.6 34.8 22.6 42.9
South Australia 27.6 42.6 29.5 34.4 25.1 40.4
Tasmania 30.0 44.4 25.4 42.7 23.6 34.2
Victoria 32.5 43.5 24.3 45.4 23.6 30.6
Western Australia 28.6 42.4 29.5 40.2 26.4 33.6
All men 30.3 42.2 27.5 40.4 24.3 35.3
WomenAustralian Capital Territory 45.5 29.1 25.6 34.4 21.6 44.3
New South Wales 46.3 27.3 26.4 35.8 21.6 42.8
Northern Territory 44.2 27.8 28.0 31.1 21.3 48.1
Queensland 43.0 28.1 29.0 30.2 20.8 48.9
South Australia 39.0 30.9 29.7 26.2 22.0 51.7
Tasmania 40.6 29.6 30.2 30.2 21.1 48.4
Victoria 45.8 27.2 26.9 36.8 21.2 41.7
Western Australia 41.5 31.6 27.0 32.9 21.3 45.5
All women 44.3 28.2 27.5 33.7 21.3 45.0
PersonsAustralian Capital Territory 37.7 37.1 25.3 39.0 23.1 38.4
New South Wales 38.8 34.8 26.4 38.6 23.2 38.1
Northern Territory 37.9 34.9 27.0 36.7 22.4 41.1
Queensland 35.1 34.6 30.3 32.5 21.7 45.9
South Australia 33.4 36.8 29.6 30.3 23.5 46.0
Tasmania 35.3 36.8 28.0 36.4 22.4 41.3
Victoria 38.9 35.2 25.6 41.2 22.4 36.0
Western Australia 34.7 37.1 28.2 36.7 23.9 39.3
All persons 37.2 35.3 27.5 37.2 22.8 40.0
Source: Australian Bureau of Statistics, 4324.0.55.003 - Microdata: Australian Health Survey, Core Content - Risk Factors and Selected Health Conditions, 2011–12Notes: Proportion of people aged 18 years and over. Survey participants were measured for height, weight and waist circumference, and BMI categories were calculated based on height and weight. BMI categories are based on the WHO definitions for people aged 18 years and over. Underweight and normal weight categories have been combined and include respondents with BMI < 25 kg/m2. For men, a waist circumference greater than 94 cm represents increased risk, and a circumference greater than 102 cm represents substantially increased risk. For women, a waist circumference greater than 80 cm represents increased risk, and a circumference greater than 88 cm represents substantially increased risk. Estimates of prevalence of waist circumference categories for persons have been calculated manually from ABS-generated raw estimates for each sex.
Chapter 1 – Prevalence

Australian heart disease statistics National Heart Foundation of Australia8
45.1 – 50%
50.1 – 55%
55.1 – 60%
60.1 – 65%
65.1 – 70%
>70%
45.1 – 50%
50.1 – 55%
55.1 – 60%
60.1 – 65%
65.1 – 70%
>70%
Figure 1.2 Prevalence of high BMI and high waist circumference, by sex and state or territory, 2011–12
1.2a Men – Overweight or obese
1.2b Women – Overweight or obese
Chapter 1 – Prevalence

National Heart Foundation of Australia Australian heart disease statistics 9
45.1 – 50%
50.1 – 55%
55.1 – 60%
60.1 – 65%
65.1 – 70%
>70%
45.1 – 50%
50.1 – 55%
55.1 – 60%
60.1 – 65%
65.1 – 70%
>70%
1.2c Men – High waist circumference
1.2d Women – High waist circumference
Chapter 1 – Prevalence

Australian heart disease statistics National Heart Foundation of Australia10
Table 1.3 Prevalence of BMI categories, children, by sex and age, 2011–12
Underweight Normal weight Overweight Obese
Boys
2–5 *3.2 73.1 17.5 4.8
6–9 3.9 74.0 14.8 8.3
10–13 4.2 68.4 21.5 5.0
14–17 5.4 69.0 18.4 7.8
All boys 4.4 71.0 18.1 6.4
Girls
2–5 5.7 70.7 17.0 7.0
6–9 *4.1 68.8 19.4 7.4
10–13 7.0 66.0 20.0 7.3
14–17 6.2 68.2 17.4 8.0
All girls 6.0 68.3 18.3 7.3
Children
2–5 4.6 72.1 17.2 6.1
6–9 3.9 71.3 16.7 7.8
10–13 5.7 67.1 20.6 6.2
14–17 5.8 68.7 17.4 7.8
All children 5.1 69.8 18.2 6.9
* Estimate has a relative standard error of 25–50% and should be used with caution.Source: Australian Bureau of Statistics, 4324.0.55.003 - Microdata: Australian Health Survey, Core Content - Risk Factors and Selected Health Conditions, 2011–12Notes: Proportion of people aged 2–17 years. BMI categories were calculated from measured height and weight based on the IOTF definitions for people under age 18 years.
Figure 1.3 Prevalence of overweight and obesity, children, by sex and age, 2011–12
0
5
10
15
20
25
30
2–5 6–9 10–13 14–17 2–5 6–9 10–13 14–17
Prop
ortio
n of
peo
ple
(%)
Boys Girls
Obese Overweight
Chapter 1 – Prevalence

National Heart Foundation of Australia Australian heart disease statistics 11
Table 1.4 Prevalence of BMI categories, children, by sex and state or territory, 2011–12
Underweight and normal weight Overweight Obese
Boys
Australian Capital Territory 74.7 19.7 *3.3
New South Wales 74.9 18.4 6.2
Northern Territory 78.9 *10.5 *9.0
Queensland 76.0 15.3 8.1
South Australia 74.6 15.9 7.7
Tasmania 75.6 15.8 *6.3
Victoria 76.7 18.0 4.9
Western Australia 71.8 21.1 6.2
All boys 75.4 18.1 6.4
Girls
Australian Capital Territory 73.3 18.1 7.5
New South Wales 74.7 17.6 7.6
Northern Territory 67.4 24.0 **3.9
Queensland 71.6 18.3 8.6
South Australia 78.0 16.3 *6.7
Tasmania 74.5 18.6 11.3
Victoria 75.7 17.0 7.6
Western Australia 73.2 20.7 6.1
All girls 74.2 18.3 7.3
Children
Australian Capital Territory 74.4 19.6 5.9
New South Wales 74.7 18.1 6.6
Northern Territory 75.0 17.7 *7.3
Queensland 73.9 16.9 8.5
South Australia 76.4 16.2 7.0
Tasmania 75.1 16.7 8.8
Victoria 76.6 17.6 6.2
Western Australia 71.9 21.1 6.6
All children 74.9 18.2 6.9
* Estimate has a relative standard error of 25–50% and should be used with caution.** Estimate has a standard error >50% and is considered too unreliable for general use.Source: Australian Bureau of Statistics, 4324.0.55.003 - Microdata: Australian Health Survey, Core Content - Risk Factors and Selected Health Conditions, 2011–12Notes: Proportion of people aged 2–17 years. Survey participants were measured for height and weight, and BMI categories were calculated from those measurements based on the IOTF definitions for people under age 18 years.
Chapter 1 – Prevalence

Australian heart disease statistics National Heart Foundation of Australia12
Figure 1.4a Prevalence of overweight and obesity, boys, by state or territory, 2011–12
Figure 1.4b Prevalence of overweight and obesity, girls, by state or territory, 2011–12
Chapter 1 – Prevalence
Combined prevalence of overweight and obesity
<24%
24.1 – 26%
26.1 – 28%
>28%
Combined prevalence of overweight and obesity
<24%
24.1 – 26%
26.1 – 28%
>28%

National Heart Foundation of Australia Australian heart disease statistics 13
Chapter 2 Burden of cardiovascular diseases
Key facts
• Self-reported prevalence of heart disease was approximately three times higher in people classified as obese than among those in the underweight and normal weight category.
• Self-reported type 2 diabetes was eight times more prevalent among obese adults than among normal-weight and underweight adults.
• Approximately one in three obese people had measured hypertension (high blood pressure), compared to about one in eight underweight people or people of normal weight.
• High BMI made a substantial contribution to total burden of disease, particularly in people over 50 years of age. BMI was a major contributor to morbidity and mortality (summarised as disability-adjusted life years lost, DALY) for all cardiovascular diseases, as well as ischaemic heart disease.

Australian heart disease statistics National Heart Foundation of Australia14
IntroductionOverweight and obesity have major impacts on health, affecting nearly every system of the body. They are among the most important risk factors for the most prevalent chronic diseases, in particular heart disease and other cardiovascular diseases. For this reason, overweight and obesity are major contributors to the total burden of disease in Australia, and form an important focus for efforts to reduce heart disease and other chronic diseases.
This chapter reports on the consequences of overweight and obesity, including their association with higher rates of cardiovascular and other chronic diseases and increased metabolic risk factors. This chapter also reports on the contribution of high body mass index (BMI) to the total burden of disease, and to the disease-specific burden of cardiovascular disease including ischaemic heart disease.
Chapter 2 – Burden of cardiovascular diseases

National Heart Foundation of Australia Australian heart disease statistics 15
Chapter 2 – Burden of cardiovascular diseases
Tables and figures
Table 2.1 Prevalence of self-reported chronic disease, adults, by sex and BMI category, 2011–12
Type 2 diabetes Ischaemic heart disease
Cerebrovascular disease
Diseases of the circulatory system
Mental and behavioural problems
Men
Underweight and normal weight *1.2 2.1 1.7 11.6 11.9
Overweight 3.7 4.8 1.2 19.7 12.1
Obese 9.4 5.7 1.7 28.7 16.2
All men 4.6 4.2 1.6 19.8 13.2
Women
Underweight and normal weight 1.1 1.2 0.8 15.7 15.3
Overweight 4.4 2.6 *0.9 23.4 17.8
Obese 7.9 3.7 2.1 32.5 23.6
All women 3.9 2.3 1.2 22.6 18.3
Persons
Underweight and normal weight 1.1 1.6 1.2 14.0 13.8
Overweight 3.9 3.9 1.1 21.3 14.4
Obese 8.7 4.7 1.9 30.6 20.1
All persons 4.2 3.3 1.4 21.2 15.7
* Estimate has a relative standard error of 25–50% and should be used with caution.Source: Australian Bureau of Statistics, 4324.0.55.001 - Microdata: Australian Health Survey, National Health Survey, 2011–12Notes: Proportion of people aged 18 years and over. Estimates are not age-standardised. BMI categories were calculated from measured height and weight based on the WHO definitions for people aged 18 years and over. For type 2 diabetes, ischaemic heart disease and cerebrovascular diseases only self-reported diagnosed disease which is both current and long-term was included. All participants who reported having mental and behavioural problems, whether diagnosed or not, were included. Underweight and normal weight categories have been combined and include respondents with BMI < 25 kg/m2. The category ‘diseases of the circulatory system’ includes the categories ‘Ischaemic heart disease’ and ‘Cerebrovascular disease’, along with all other circulatory diseases.
Figure 2.1a Prevalence of self-reported chronic disease, men, by BMI category, 2011–12
35
25
30
15
20
10
5
0Type 2 diabetes Ischaemic heart
diseaseCerebrovascular
diseaseDiseases of the
circulatory systemMental and behavioural
problems
Prop
ortio
n of
peo
ple
(%)
Underweight and normal weight
Overweight Obese

Australian heart disease statistics National Heart Foundation of Australia16
Chapter 2 – Burden of cardiovascular diseases
Figure 2.1b Prevalence of self-reported chronic disease, women, by BMI category, 2011–12
35
25
30
15
20
10
5
0Type 2 diabetes Ischaemic heart
diseaseCerebrovascular
diseaseDiseases of the
circulatory systemMental and behavioural
problems
Prop
ortio
n of
peo
ple
(%)
Underweight and normal weight
Overweight Obese
Table 2.2 Prevalence of clinical risk factors for chronic disease, adults, by sex and BMI category, 2011–12
Hypertension Dyslipidaemia Fasting plasma glucose indicates diabetes
HbA1c level indicates diabetes
Men
Underweight and normal weight 12.7 45.6 *1.4 *1.5
Overweight 23.1 70.5 2.9 3.6
Obese 34.6 79.6 10.2 11.3
All men 23.1 64.7 4.3 4.9
Women
Underweight and normal weight 11.8 50.6 *0.4 *1.1
Overweight 21.0 70.7 *2.6 3.6
Obese 30.5 79.2 5.7 7.0
All women 19.5 63.4 2.3 3.4
Persons
Underweight and normal weight 12.2 48.2 0.9 1.4
Overweight 22.2 70.5 2.6 3.5
Obese 32.6 79.3 8.0 9.3
All persons 21.3 64.1 3.3 4.1
* Estimate has a relative standard error of 25–50% and should be used with caution.Source: Australian Bureau of Statistics, 4324.0.55.003 - Microdata: Australian Health Survey, Core Content - Risk Factors and Selected Health Conditions, 2011–12Notes: Proportion of people aged 18 years and over. BMI categories were calculated from measured height and weight based on the WHO definitions for people aged 18 years and over. Underweight and normal weight categories have been combined and include respondents with BMI < 25 kg/m2. Hypertension is here defined as a measured blood pressure reading ≥140/90 mmHg. Blood pressure was measured in all participants in the Australian Health Survey, while lipids, fasting plasma glucose and HbA1c levels were measured as part of the National Health Measures Survey component. Dyslipidaemia is here defined as having abnormal blood lipid levels, whether on lipid-lowering medication or not, or having normal blood lipid levels while being on lipid-lowering medication. Fasting plasma glucose indicates diabetes at a concentration ≥7.0 mmol/L. HbA1c indicates diabetes at a concentration ≥48 mmol/mol.
National Heart Foundation of Australia Australian heart disease statistics 17
Chapter 2 – Burden of cardiovascular diseases
Underweight and normal weight
Underweight and normal weight
Overweight
Overweight
Obese
Obese
Figure 2.2a Prevalence of measured hypertension and dyslipidaemia, adults, by sex and BMI category, 2011–12
Figure 2.2b Prevalence of biomedical indicators for diabetes, adults, by sex and BMI category, 2011–12
0
0
10
2
20
4
30
6
40
8
50
10
60
12
70
80
90
Hypertension
Fasting plasma glucose indicates diabetes
Hypertension
Fasting plasma glucose indicates diabetes
Dyslipidaemia
HbA1c level indicates diabetes
Dyslipidaemia
HbA1c level indicates diabetes
Prop
ortio
n of
peo
ple
(%)
Prop
ortio
n of
peo
ple
(%)
Men
Men
Women
Women

Australian heart disease statistics National Heart Foundation of Australia18
Chapter 2 – Burden of cardiovascular diseases
Table 2.3a Prevalence of hypertension according to smoking status and alcohol risk level, adults, by age group and BMI category, 2011–12
Smoking status Risky alcohol consumption in past week
Not current smoker Current smoker Did not exceed guidelines
Exceeded guidelines
Did not drink in past week
18–44 years
Underweight and normal weight 3.5 6.1 2.7 7.8 3.2
Overweight 9.8 15.5 10.0 15.0 8.7
Obese 22.2 22.9 22.2 28.4 20.7
Persons 9.7 12.8 9.0 15.1 9.2
45 years and over
Underweight and normal weight 24.4 27.0 21.6 24.5 29.1
Overweight 31.0 36.8 26.2 40.1 33.1
Obese 38.9 41.2 38.5 44.2 38.0
Persons 32.0 35.6 28.6 37.4 34.0
Source: Australian Bureau of Statistics, 4324.0.55.001 - Microdata: Australian Health Survey, National Health Survey, 2011–12Notes: Proportion of people aged 18 years and over with hypertension. BMI categories were calculated from measured height and weight based on the WHO definitions for people aged 18 years and over. Underweight and normal weight categories have been combined and include respondents with BMI < 25 kg/m2. Hypertension is here defined as a measured blood pressure reading ≥140/90 mmHg. Blood pressure was measured in all participants in the Australian Health Survey. Current smokers included people who currently smoke daily, weekly or less than weekly. Respondents reported alcohol drinking patterns for each of the most recent three days in the last week on which they had consumed alcohol, and these data were used to calculate a 7-day average consumption. Those who had not consumed alcohol in the past week, including people who had never consumed alcohol or for whom risk level or time since last consumed alcohol was not known, were included in the category ‘did not drink in past week’. Alcohol consumption risk levels were based on the 2009 NHMRC guidelines, which call for no more than two standard drinks per day for healthy men and women.
Table 2.3b Prevalence of dyslipidaemia according to smoking status and alcohol risk level, adults, by age group and BMI category, 2011–12
Smoking status Risky alcohol consumption in past week
Not current smoker Current smoker Did not exceed guidelines
Exceeded guidelines
Did not drink in past week
18–44 years
Underweight and normal weight 35.9 51.3 30.6 46.7 42.0
Overweight 59.4 77.5 58.7 63.6 63.5
Obese 75.3 72.9 76.0 68.8 75.6
Persons 51.0 64.4 48.1 58.3 56.0
45 years and over
Underweight and normal weight 70.0 66.4 64.6 67.7 74.9
Overweight 75.3 85.3 71.7 78.8 78.5
Obese 83.2 89.7 83.1 76.0 86.9
Persons 76.4 81.5 73.9 77.4 80.5
Source: Australian Bureau of Statistics, 4324.0.55.001 - Microdata: Australian Health Survey, National Health Survey, 2011–12Notes: Proportion of people aged 18 years and over with dyslipidaemia. BMI categories were calculated from measured height and weight based on the WHO definitions for people aged 18 years and over. Underweight and normal weight categories have been combined and include respondents with BMI < 25 kg/m2. Blood lipid levels were measured as part of the National Health Measures Survey component of the Australian Health Survey. Dyslipidaemia is here defined as having abnormal blood lipid levels, whether on lipid-lowering medication or not, or having normal blood lipid levels while being on lipid-lowering medication. Current smokers included people who currently smoke daily, weekly or less than weekly. Respondents reported alcohol drinking patterns for each of the most recent three days in the last week on which they had consumed alcohol, and these data were used to calculate a 7-day average consumption. Those who had not consumed alcohol in the past week, including people who had never consumed alcohol or for whom risk level or time since last consumed alcohol was not known, were included in the category ‘did not drink in past week’. Alcohol consumption risk levels were based on the 2009 NHMRC guidelines, which call for no more than two standard drinks per day for healthy men and women.

National Heart Foundation of Australia Australian heart disease statistics 19
Chapter 2 – Burden of cardiovascular diseases
Table 2.4 Burden of disease (in disability-adjusted life years) contributed by high BMI, adults aged 25 years and over, by sex and age, Australia, 2010
No. of DALYs %DALYs
Men Women Persons Men Women Persons
25–29 2,763 1,724 4,487 2.3 1.7 2.0
30–34 4,037 2,438 6,476 3.4 2.3 2.9
35–39 7,959 3,505 13,264 5.8 4.3 5.1
40–44 11,664 7,388 19,052 8.0 5.5 6.8
45–49 18,755 12,965 31,721 11 8.3 9.5
50–54 23,770 15,668 39,439 12 9.4 11
55–59 27,618 18,843 46,461 13 11 12
60–64 31,858 21,659 53,518 13 12 13
65–69 28,929 19,489 48,419 13 12 12
70–74 26,081 19,311 45,392 12 12 12
75–79 22,631 19,540 42,171 11 12 11
Source: Institute for Health Metrics and Evaluation (IHME). GBD Cause Patterns. Seattle, WA: IHME, University of Washington, 2013. Available from http://vizhub.healthdata.org/gbd-cause-patterns/. Accessed 9 January 2015.Notes: Number and attributable percent of disability-adjusted life years (DALYs) in people aged 25 years and over. All-cause morbidity.
Men Women
Figure 2.4 Burden of disease (proportion of disability-adjusted life years) attributable to high BMI, adults aged 25 years and over, by sex and age, Australia, 2010
0
2
4
6
8
10
14
12
25–29 30–34 35–39 40–44 45–49 50–54 55–59 60–64 65–69 70–74 75–79
Attri
buta
ble
%DA
LYs
Age (years)

Australian heart disease statistics National Heart Foundation of Australia20
Chapter 2 – Burden of cardiovascular diseases
Table 2.5 Burden of cardiovascular disease (proportion of disability-adjusted life years) attributable to main risk factors, adults aged 25 years and over, by sex and age, Australia, 2010
High BMI Dietary risks Smoking High blood pressure
High total cholesterol
Physical inactivity
High fasting plasma glucose
Other
Men
25–29 45 57 1.7 35 19 22 7.5 7.4
30–34 44 64 41 34 21 25 8.1 9.2
35–39 49 70 41 40 32 28 11 11
40–44 46 75 39 39 33 29 11 11
45–49 48 76 36 51 36 29 15 12
50–54 45 76 33 48 35 28 14 11
55–59 43 73 28 58 32 27 16 11
60–64 39 71 25 54 29 25 14 10.0
65–69 34 67 20 58 25 23 13 9.2
70–74 30 64 16 54 21 21 12 8.3
75–79 26 59 11 53 16 19 10.0 7.4
Women
25–29 35 49 1.7 2.7 14 17 3.1 6.4
30–34 34 53 45 2.5 16 21 3.2 6.5
35–39 40 61 45 12 17 21 5.8 13
40–44 38 63 42 11 19 22 5.7 13
45–49 42 65 38 33 24 22 8.9 11
50–54 40 65 35 31 24 22 8.4 11
55–59 41 64 29 45 29 22 11 9.8
60–64 38 64 25 42 28 22 9.9 9.6
65–69 34 62 20 53 28 21 10.0 8.8
70–74 31 59 15 49 25 20 9.0 8.1
75–79 26 55 10.0 51 22 19 8.1 7.3
Persons
25–29 41 54 1.7 22 17 20 5.7 7.1
30–34 41 61 43 23 19 24 6.4 8.3
35–39 46 67 42 31 27 26 9.4 12
40–44 44 71 40 30 29 27 9.4 12
45–49 46 73 37 45 33 27 14 11
50–54 44 73 34 43 32 26 13 11
55–59 43 71 29 54 31 25 14 10.0
60–64 39 69 25 50 29 24 13 9.9
65–69 34 66 20 57 26 22 12 9.1
70–74 31 62 16 52 23 21 11 8.2
75–79 26 57 11 52 19 19 9.4 7.3
Source: Institute for Health Metrics and Evaluation (IHME). GBD Cause Patterns. Seattle, WA: IHME, University of Washington, 2013. Available from http://vizhub.healthdata.org/gbd-cause-patterns/. Accessed 9 January 2015.Notes: Percent of disability-adjusted life years (DALYs) attributable to each risk factor. People aged 25 years and over. Multiple risk factors can contribute to cardiovascular diseases in a given person, and some of the given risk factors contribute to the prevalence of other risk factors. For this reason, the percent contributions to DALYs of each risk factor will total more than 100%.

National Heart Foundation of Australia Australian heart disease statistics 21
Chapter 2 – Burden of cardiovascular diseases
Figure 2.5 Burden of cardiovascular disease (proportion of disability-adjusted life years) attributable to main risk factors, adults aged 25 years and over, by age, Australia, 2010
0
50
100
150
200
250
350
300
25–29 30–34 35–39 40–44 45–49 50–54 55–59 60–64 65–69 70–74 75–79
Attri
buta
ble
%DA
LYs
High BMI Dietary risks
Smoking High blood pressure
High total cholesterol
Physical inactivity
High fasting plasma glucose
Other
Age (years)

Australian heart disease statistics National Heart Foundation of Australia22
Chapter 2 – Burden of cardiovascular diseases
Table 2.6 Burden of ischaemic heart disease (proportion of disability-adjusted life years) attributable to main risk factors, adults aged 25 years and over, by sex and age, Australia, 2010
High BMI Dietary risks Smoking High blood pressure
High total cholesterol
Physical inactivity
High fasting plasma glucose
Other
Men
25–29 53 97 3.2 37 43 51 13 13
30–34 50 96 51 35 41 49 12 13
35–39 55 96 49 41 52 47 15 14
40–44 52 95 44 38 50 44 14 13
45–49 53 93 40 50 52 42 19 14
50–54 49 92 36 47 49 39 18 13
55–59 47 90 31 57 46 38 20 12
60–64 44 87 27 53 43 36 18 11
65–69 38 84 22 58 37 33 17 10.0
70–74 34 81 17 53 34 31 15 9.4
75–79 28 77 12 51 27 28 13 8.3
Women
25–29 43 96 3.7 2.7 43 55 6 12
30–34 41 95 60 2.5 41 52 5.6 11
35–39 50 94 57 11 42 50 9.1 17
40–44 47 93 51 11 40 48 8.4 16
45–49 51 92 45 32 51 45 13 14
50–54 48 90 41 29 48 42 12 14
55–59 48 88 34 44 53 40 15 12
60–64 44 86 29 40 50 38 13 11
65–69 39 83 22 51 49 36 13 10.0
70–74 35 79 17 46 45 33 12 9.3
75–79 28 75 11 49 40 30 10 8.1
Persons
25–29 50 97 3.4 26 43 52 11 12
30–34 48 96 54 26 41 50 11 13
35–39 54 95 50 34 50 47 14 15
40–44 51 94 46 32 48 45 13 14
45–49 52 93 41 46 51 42 18 14
50–54 49 91 37 43 49 40 16 13
55–59 47 89 32 54 47 38 18 12
60–64 44 87 27 50 44 36 17 11
65–69 38 84 22 56 41 34 16 10.0
70–74 34 80 17 51 38 32 14 9.3
75–79 28 76 12 50 50 29 12 8.3
Source: Institute for Health Metrics and Evaluation (IHME). GBD Cause Patterns. Seattle, WA: IHME, University of Washington, 2013. Available from http://vizhub.healthdata.org/gbd-cause-patterns/. Accessed 9 January 2015.Notes: Percent of disability-adjusted life years (DALYs) attributable to each risk factor. People aged 25 years and over. Multiple risk factors can contribute to ischaemic heart disease in a given person, and some of the given risk factors contribute to the prevalence of other risk factors. For this reason, the percent contributions to DALYs of each risk factor will total more than 100%.

National Heart Foundation of Australia Australian heart disease statistics 23
Chapter 2 – Burden of cardiovascular diseases
Figure 2.6 Burden of ischaemic heart disease (proportion of disability-adjusted life years) attributable to main risk factors, adults aged 25 years and over, by age, Australia, 2010
0
50
100
150
200
250
350
400
300
25–29 30–34 35–39 40–44 45–49 50–54 55–59 60–64 65–69 70–74 75–79
Attri
buta
ble
%DA
LYs
High BMI Dietary risks
Smoking High blood pressure
High total cholesterol
Physical inactivity
High fasting plasma glucose
Other
Age (years)

Australian heart disease statistics National Heart Foundation of Australia24
Chapter 2 – Burden of cardiovascular diseases

National Heart Foundation of Australia Australian heart disease statistics 25
Chapter 3 Time trends
Key facts
• Adult obesity rates increased from less than 19% in 1995 to 27.5% of the population in 2011–12, while rates of overweight remained relatively stable.
• Overweight among 5–17-year-old children increased from 15.7% in 1995 to 18.3% in 2011–12, while obesity increased from 5.2% to 7.3%.

Australian heart disease statistics National Heart Foundation of Australia26
Chapter 3 – Time trends
IntroductionThis chapter examines trends over time in the prevalence of overweight and obesity in Australia. These trends, which have shown consistent and striking increases in prevalence over several decades, are of great concern for the current and future burden of obesity-related ill-health in Australia.
Australia’s National Health Surveys included measured height and weight data in 1995, 2007–08 and 2011–12. These surveys provide the most comprehensive national snapshots of weight status. However the small number of time points precludes more detailed analysis of national trends in overweight and obesity. The 2013 Global Burden of Disease study, through the Institute for Health Metrics and Evaluation (IHME), produced detailed modelled estimates based on the best available data from a range of sources for many risk factors and illnesses, including obesity. The IHME estimates for Australia are also included in this chapter to demonstrate trends over time in age-standardised overweight and obesity rates in adults and children, and also provide useful international comparisons (see chapter 7).

National Heart Foundation of Australia Australian heart disease statistics 27
Chapter 3 – Time trends
Tables and figures
Table 3.1 Trends in prevalence of overweight and obesity, adults, by sex and age, 1995 to 2011–12
1995 2007–08 2011–12
Overweight Obese Overweight Obese Overweight Obese
Men
18–24 26.5 10.2 28.0 11.9 27.5 13.5
25–34 44.3 14.5 42.5 19.5 43.7 21.1
35–44 48.1 18.3 44.2 26.6 45.7 29.3
45–54 51.2 25.7 47.0 29.7 45.0 33.5
55–64 50.6 25.6 40.0 34.9 40.5 37.8
65–74 51.7 21.4 44.9 34.0 46.5 34.1
75+ 48.7 17.3 52.8 21.5 48.3 22.2
All men 45.2 18.6 42.2 25.5 42.2 27.5
Women
18–24 17.7 8.6 20.7 14.2 14.6 16.9
25–34 23.1 15.0 26.4 18.0 23.0 20.1
35–44 29.4 16.1 32.4 22.7 27.3 27.3
45–54 32.6 24.7 32.5 26.3 33.1 30.6
55–64 41.8 26.6 34.7 33.2 33.6 35.3
65–74 36.1 27.7 42.0 29.4 33.3 35.8
75+ 40.9 18.9 32.6 24.3 37.3 27.9
All women 29.9 18.9 31.0 23.6 28.2 27.5
Persons
18–24 22.2 9.4 24.3 13.0 21.4 15.1
25–34 34.2 14.7 34.8 18.8 34.0 20.6
35–44 38.8 17.2 38.2 24.6 36.6 28.4
45–54 42.1 25.2 39.8 28.0 39.1 32.0
55–64 46.3 26.1 37.4 34.1 37.2 36.7
65–74 43.3 24.8 43.5 31.6 39.8 35.2
75+ 43.9 18.3 41.8 23.0 42.5 25.4
All persons 37.6 18.7 36.7 24.6 35.3 27.5
Source: Australian Bureau of Statistics, 4364.0 - National Health Survey: Summary of Results, 2007–08 (includes measured data from the 1995 National Nutrition Survey, Cat. no. 4805.0), and 4324.0.55.003 - Microdata: Australian Health Survey, Core Content - Risk Factors and Selected Health Conditions, 2011–12Notes: Proportion of people aged 18 years and over. Estimates are not age-standardised. For all survey years, participants were measured for height and weight, and BMI categories were calculated from those measurements based on the WHO definitions for people aged 18 years and over.

Australian heart disease statistics National Heart Foundation of Australia28
Figure 3.1a Trends in prevalence of combined overweight and obesity, men, by age, 1995 to 2011–12
Figure 3.1b Trends in prevalence of combined overweight and obesity, women, by age, 1995 to 2011–12
60
60
70
70
80
80
90
90
40
40
50
50
30
30
10
10
20
20
0
0
1995
1995
1997
1997
1999
1999
2001
2001
2003
2003
2005
2005
2007
2007
2009
2009
2011
2011
2013
2013
18–24
18–24
25–34
25–34
35–44
35–44
45–54
45–54
55–64
55–64
65–74
65–74
75+
75+
All men
All women
Prop
ortio
n of
peo
ple
(%)
Prop
ortio
n of
peo
ple
(%)
Chapter 3 – Time trends

National Heart Foundation of Australia Australian heart disease statistics 29
Chapter 3 – Time trends
Table 3.2 Trends in age-standardised prevalence of overweight and obesity, modelled estimates, adults aged 20 years and over, by sex, Australia, 1990 to 2013
Overweight Obese
Men Women Persons Men Women Persons
Year
1990 40.2 25.0 32.6 15.1 16.1 15.6
1991 39.6 24.5 31.9 15.4 16.4 16.0
1992 38.9 23.8 31.2 15.9 16.9 16.5
1993 38.1 23.3 30.6 16.5 17.4 17.0
1994 37.7 22.9 30.2 17.1 18.0 17.6
1995 37.6 22.7 30.0 17.7 18.8 18.3
1996 37.8 22.9 30.3 18.4 19.6 19.0
1997 38.5 23.5 30.9 19.2 20.6 19.9
1998 39.2 24.1 31.6 20.0 21.6 20.8
1999 39.7 24.6 32.0 20.7 22.6 21.7
2000 40.1 25.0 32.5 21.4 23.5 22.5
2001 40.5 25.4 32.8 22.1 24.4 23.3
2002 40.6 25.7 33.1 22.7 25.1 23.9
2003 40.7 25.9 33.2 23.3 25.8 24.6
2004 40.7 26.0 33.3 23.8 26.3 25.1
2005 40.7 26.1 33.3 24.4 26.9 25.7
2006 40.7 26.0 33.2 25.0 27.5 26.3
2007 40.7 26.0 33.2 25.5 28.0 26.8
2008 40.6 26.1 33.3 26.0 28.4 27.2
2009 40.6 26.0 33.2 26.3 28.8 27.6
2010 40.6 26.1 33.3 26.7 29.1 27.9
2011 40.7 26.2 33.4 27.0 29.4 28.2
2012 40.6 26.3 33.4 27.3 29.6 28.5
2013 40.7 26.3 33.4 27.5 29.8 28.7
Source: Global Burden of Disease Study 2013 (GBD 2013) Obesity Prevalence 1990–2013. Seattle, United States: Institute for Health Metrics and Evaluation (IHME), 2014.Notes: Proportion of people aged 20 years and over. Modelled estimates of age-standardised prevalence. BMI categories are based on the WHO definitions for people aged 18 years and over.

Australian heart disease statistics National Heart Foundation of Australia30
Figure 3.2 Trends in age-standardised prevalence of overweight and obesity, modelled estimates, adults aged 20 years and over, by sex, Australia, 1990 to 2013
30
35
40
45
20
25
15
5
10
01990 1995 2000 2005 2010
Men (overweight) Women (overweight) Men (obese) Women (obese)
Prop
ortio
n of
peo
ple
(%)
Chapter 3 – Time trends
Table 3.3 Trends in prevalence of overweight and obesity, children aged 5–17 years, by sex and age, 1995 to 2011–12
1995 2007–08 2011–12
Overweight Obese Overweight Obese Overweight Obese
Boys
5–12 14.4 3.6 14.7 7.1 17.0 7.5
13–17 18.6 6.1 18.8 13.0 19.8 6.9
All boys 16.0 4.5 16.2 9.3 17.8 7.0
Girls
5–12 17.1 6.5 17.2 5.8 19.8 7.5
13–17 12.3 4.7 20.0 5.4 17.6 8.2
All girls 15.3 5.8 18.2 5.6 18.7 7.5
Children
5–12 15.7 5.0 15.9 6.5 18.2 7.1
13–17 15.5 5.4 19.4 9.2 18.4 7.5
All children 15.7 5.2 17.2 7.5 18.3 7.3
Source: Australian Bureau of Statistics, 4364.0 - National Health Survey: Summary of Results, 2007–08 (includes measured data from the 1995 National Nutrition Survey, Cat. no. 4805.0), and 4324.0.55.003 - Microdata: Australian Health Survey, Core Content - Risk Factors and Selected Health Conditions, 2011–12 Notes: Proportion of people aged 5–17 years. For all survey years, participants were measured for height and weight, and BMI categories were calculated based on these measurements. BMI categories are based on the IOTF definitions for people under age 18 years.

National Heart Foundation of Australia Australian heart disease statistics 31
Chapter 3 – Time trends
Figure 3.3a Trends in prevalence of combined overweight and obesity, boys aged 5–17 years, by age, 1995 to 2011–12
Figure 3.3b Trends in prevalence of combined overweight and obesity, girls aged 5–17 years, by age, 1995 to 2011–12
30
30
35
35
20
20
25
25
15
15
5
5
10
10
0
0
1995
1995
1997
1997
1999
1999
2001
2001
2003
2003
2005
2005
2007
2007
2009
2009
2011
2011
5–12
5–12
13–17 All boys
Prop
ortio
n of
peo
ple
(%)
Prop
ortio
n of
peo
ple
(%)
13–17 All boys

Australian heart disease statistics National Heart Foundation of Australia32
Chapter 3 – Time trends
Table 3.4 Trends in age-standardised prevalence of combined overweight and obesity, modelled estimates, children aged 2–19 years, by sex, Australia, 1990 to 2013
Boys Girls Children
Year
1990 17.3 17.2 17.3
1991 17.7 17.4 17.6
1992 18.1 17.7 17.9
1993 18.4 17.9 18.1
1994 18.7 18.1 18.4
1995 19.1 18.4 18.7
1996 19.3 18.6 19.0
1997 19.6 18.8 19.2
1998 19.8 19.0 19.4
1999 20.0 19.1 19.6
2000 20.2 19.3 19.8
2001 20.5 19.5 20.0
2002 20.7 19.7 20.2
2003 21.0 19.9 20.5
2004 21.2 20.2 20.7
2005 21.6 20.5 21.1
2006 22.1 20.9 21.5
2007 22.5 21.3 21.9
2008 22.8 21.6 22.2
2009 23.1 21.9 22.6
2010 23.5 22.2 22.9
2011 23.8 22.5 23.2
2012 24.1 22.8 23.5
2013 24.4 23.0 23.7
Source: Global Burden of Disease Study 2013 (GBD 2013) Obesity Prevalence 1990–2013. Seattle, US: Institute for Health Metrics and Evaluation (IHME), 2014.Notes: Proportion of people aged 2–19 years. Modelled estimates of age-standardised prevalence. BMI categories are based on the IOTF definitions for people under age 18 years, and on the WHO definitions for people aged 18 years and over. Overweight and obesity have been combined.
Figure 3.4 Trends in age-standardised prevalence of combined overweight and obesity, modelled estimates, children aged 2–19 years, by sex, Australia, 1990 to 2013
30
20
25
15
5
10
01990 1995 2000 2005 2010
Boys Girls
Prop
ortio
n of
peo
ple
(%)

National Heart Foundation of Australia Australian heart disease statistics 33
Feature Effect of overweight and obesity on health expenditure
by John Goss
Centre for Research and Action in Public Health, Health Research Institute, University of Canberra

Australian heart disease statistics National Heart Foundation of Australia34
Feature – Effect of overweight and obesity on health expenditure
IntroductionThis feature section within Overweight, obesity and cardiovascular disease – past, present and future presents data from a new study undertaken for the Heart Foundation to analyse the effects of overweight and obesity on health spending on cardiovascular disease and type 2 diabetes in 2011–12. The study also investigated the effect of increased overweight and obesity in 2021–22 and 2031–32 on spending on cardiovascular disease and type 2 diabetes.
Having an elevated body mass index (BMI) has a major effect on a person’s health and wellbeing, because it is associated with diseases such as cardiovascular disease, diabetes, stroke and several cancers. It is not surprising therefore that elevated BMI has a significant effect on health costs for governments and the private sector.
Rates of overweight and obesity continue to increase across Australia. Average BMI is forecast to increase from 26.9 in 2011–12 to 28.5 in 2031–32 for men 20 years and over and from 25.9 to 27.9 for women 20 years and over. The average adult BMI is estimated to increase from 26.4 to 28.2 in the same period. The number of adults who are obese would approximately double to 9.6 million and the number overweight would increase by about one-third to 8.4 million. The proportion of the population 20 years and over who are obese is expected to increase from 28% in 2011–1213 to 41% in 2031–32, with the proportion overweight expected to decrease slightly from 37% in 2011–1213 to 36% in 2031–32.
Overall, current expenditure for cardiovascular disease and type 2 diabetes is expected to increase by more than two and a half times by 2031–32, while current health expenditure for all diseases is projected to increase by 221% by 2031–32. Expenditure for admitted patient services is expected to increase by 274%, out-of-hospital medical services by 162% and pharmaceuticals by 108%.
Of the cardiovascular expenditure of $14.2 billion in 2011–12, about one-fifth ($2.7 billion) is estimated to be attributable to elevated BMI. In 2031–32, $11.5 billion of cardiovascular expenditure of $51.1 billion will be attributable to elevated BMI. This is an extra $8.8 billion or an increase of 322% from 2011–12 to 2031–32.
Of the type 2 diabetes expenditure of $1.7 billion in 2011–12, over two-thirds ($1.2 billion) is attributable to elevated BMI. In 2031–32, $5.4 billion of the type 2 diabetes expenditure of $6.8 billion will be attributable to elevated BMI, an increase of $4.2 billion, or 352% from 2011–12 to 2031–32.
For cardiovascular disease, overweight people contribute about one-third of costs attributable to BMI and obese people contribute about two-thirds. In 2011–12, cardiovascular expenditure attributable to elevated BMI per overweight person was $141 and per obese person it was $369.
For type 2 diabetes, overweight people contribute about one-fifth of costs attributable to BMI and obese people contribute nearly four-fifths. Type 2 diabetes expenditure attributable to elevated BMI per overweight person is $38 and per obese person is $198.
Further details of the study, and the methods used to calculate expenditure, are presented in Appendix 1.
Key facts• In 2011–12, cardiovascular disease and type 2 diabetes
accounted for about $16 billion of total current expenditure on health services in Australia. This figure is expected to increase to $58 billion, or 14%, of current health expenditure in 2031–32.
• The number of obese adults is expected to approximately double by 2031–32, which means that 41% of the adult population will be obese. There will be a 34% increase in the number of overweight adults, which compares to a 38% increase in the adult population in the two decades to 2031–32.
• The total extra expenditure on cardiovascular disease and type 2 diabetes in 2011–12 attributable to elevated BMI is $3.9 billion but this will increase to $16.9 billion in 2031–32 if overweight and obesity continue to increase at the same rate they increased from 1995 to 2005.
• The total extra expenditure for cardiovascular disease and type 2 diabetes from 2011–12 to 2031–32 due to excess weight is estimated to be $187 billion.
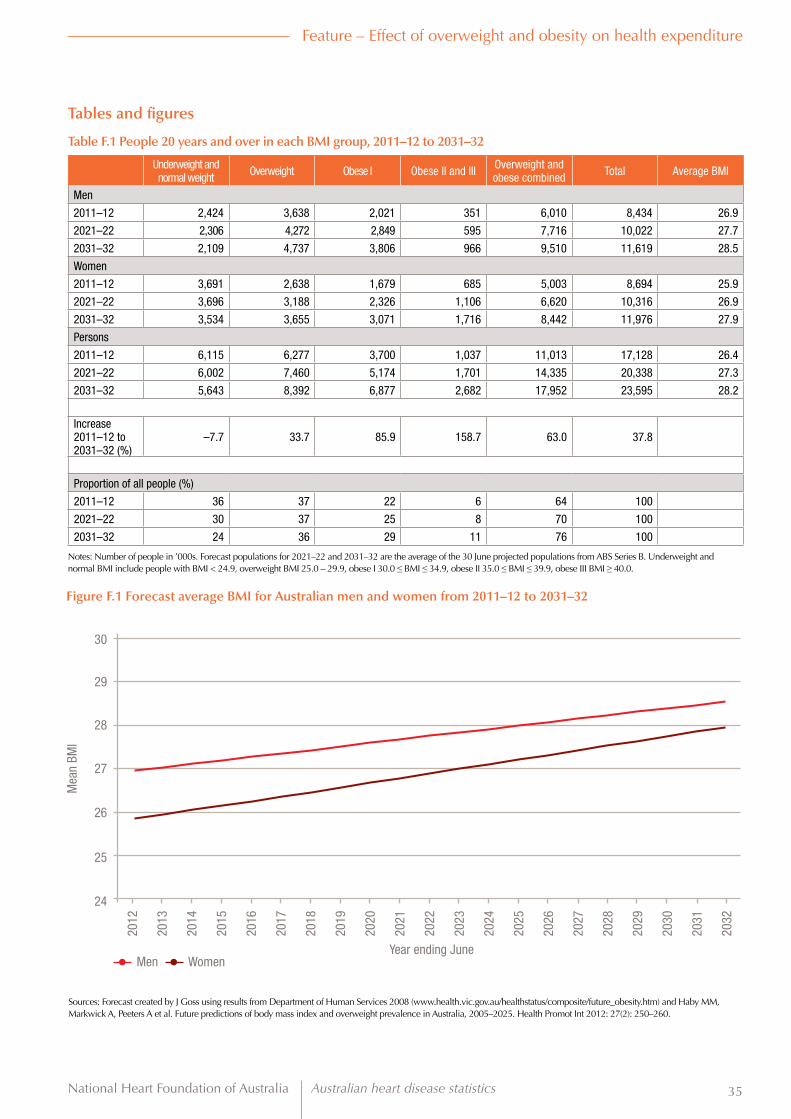
National Heart Foundation of Australia Australian heart disease statistics 35
Feature – Effect of overweight and obesity on health expenditure
Tables and figures
Table F.1 People 20 years and over in each BMI group, 2011–12 to 2031–32
Underweight and normal weight Overweight Obese I Obese II and III Overweight and
obese combined Total Average BMI
Men
2011–12 2,424 3,638 2,021 351 6,010 8,434 26.9
2021–22 2,306 4,272 2,849 595 7,716 10,022 27.7
2031–32 2,109 4,737 3,806 966 9,510 11,619 28.5
Women
2011–12 3,691 2,638 1,679 685 5,003 8,694 25.9
2021–22 3,696 3,188 2,326 1,106 6,620 10,316 26.9
2031–32 3,534 3,655 3,071 1,716 8,442 11,976 27.9
Persons
2011–12 6,115 6,277 3,700 1,037 11,013 17,128 26.4
2021–22 6,002 7,460 5,174 1,701 14,335 20,338 27.3
2031–32 5,643 8,392 6,877 2,682 17,952 23,595 28.2
Increase 2011–12 to 2031–32 (%)
–7.7 33.7 85.9 158.7 63.0 37.8
Proportion of all people (%)
2011–12 36 37 22 6 64 100
2021–22 30 37 25 8 70 100
2031–32 24 36 29 11 76 100
Notes: Number of people in ’000s. Forecast populations for 2021–22 and 2031–32 are the average of the 30 June projected populations from ABS Series B. Underweight and normal BMI include people with BMI < 24.9, overweight BMI 25.0 – 29.9, obese I 30.0 ≤ BMI ≤ 34.9, obese II 35.0 ≤ BMI ≤ 39.9, obese III BMI ≥ 40.0.
Figure F.1 Forecast average BMI for Australian men and women from 2011–12 to 2031–32
30
28
29
27
25
26
24
2012
2020
2016
2024
2029
2013
2021
2017
2025
2030
2014
2022
2018
2026
2031
2015
2023
2028
2019
2027
2032
Men Women
Mea
n BM
I
Year ending June
Sources: Forecast created by J Goss using results from Department of Human Services 2008 (www.health.vic.gov.au/healthstatus/composite/future_obesity.htm) and Haby MM, Markwick A, Peeters A et al. Future predictions of body mass index and overweight prevalence in Australia, 2005–2025. Health Promot Int 2012: 27(2): 250–260.

Australian heart disease statistics National Heart Foundation of Australia36
Table F.2 Health expenditure in Australia, 2011–12 to 2031–32 at 2011–12 constant prices
Admitted patient services
Out-of-hospital medical services
Prescription pharmaceuticals Other Total
2011–12 48,334 20,018 12,376 49,001 129,728
2021–22 94,649 32,955 18,138 88,464 234,206
2031–32 180,875 52,389 25,776 157,234 416,274
Change (%)
2011–12 to 2021–22 96 65 47 81 81
2021–22 to 2031–32 91 59 42 78 78
2011–12 to 2031–32 274 162 108 221 221
Source: Estimated by J Goss using methods described in Appendix 1 and in Goss J. Projection of Australian health care expenditure by disease, 2003 to 2033. Canberra: Australia Institute of Health and Welfare, Cat. no. HWE 43, 2008.Note: Expenditure in $ million
Table F.3 Summary of total health expenditure in Australia by disease, 2011–12 to 2031–32 at 2011–12 constant prices
Cardiovascular disease IHD Ischaemic stroke Other cardiovascular Type 2 diabetes Total all diseases
2011–12 14,166 3,778 1,016 9,373 1,684 129,728
Proportion of total (%) 10.9 2.9 0.8 7.2 1.3 100
2021–22 27,125 7,525 2,132 17,468 3,403 234,206
Proportion of total (%) 11.6 3.2 0.9 7.5 1.5 100
2031–32 51,084 14,572 4,477 32,036 6,830 416,274
Proportion of total (%) 12.3 3.5 1.1 7.7 1.6 100
Change (%)
2011–12 to 2021–22 91.5 99.2 109.8 86.4 102.1 80.5
2021–22 to 2031–32 88.3 93.6 110.0 83.4 100.7 77.7
2011–12 to 2031–32 260.6 285.7 340.7 241.8 305.6 220.9
Source: Estimated by J Goss as described in Appendix 1Notes: Expenditure in $ million. IHD, ischaemic heart disease
Feature – Effect of overweight and obesity on health expenditure

National Heart Foundation of Australia Australian heart disease statistics 37
Table F.4 Expenditure on cardiovascular disease and type 2 diabetes from elevated BMI, 2011–12 to 2031–32 at 2011–12 constant prices
2011–12 2021–22 2031–32
Total from elevated
BMI
Total expenditure
Proportion (of total) of expenditure
from elevated BMI (%)
Total from elevated
BMI
Total expenditure
Proportion (of total) of expenditure
from elevated BMI (%)
Total from elevated
BMI
Total expenditure
Proportion (of total) of expenditure
from elevated BMI (%)
Cardiovascular disease (CVD)Admitted patient services 1,172 5,649 20.8 2,619 11,663 22.5 5,530 23,633 23.4
Out-of-hospital medical services 287 1,866 15.4 563 3,293 17.1 1,033 5,555 18.6
Prescription pharmaceuticals 323 1,960 16.5 573 3,133 18.3 915 4,778 19.1
Other 939 4,691 20.0 1,990 9,036 22.0 3,996 17,119 23.3Total CVD 2,721 14,166 19.2 5,745 27,125 21.2 11,474 51,084 22.5Ischaemic heart disease (IHD)Admitted patient services 491 1,703 28.8 1,084 3,564 30.4 2,281 7,218 31.6
Out-of-hospital medical services 55 228 24.1 108 417 25.8 199 721 27.6
Prescription pharmaceuticals 91 375 24.1 160 614 26.1 260 958 27.1
Other 406 1,471 27.6 862 2,930 29.4 1747 5,674 30.8
Total IHD 1,042 3,778 27.6 2,214 7,525 29.4 4,487 14,572 30.8
Ischaemic stroke (IS)Admitted patient services 133 527 25.3 312 1,120 27.8 686 2,385 28.7
Out-of-hospital medical services 5 23 21.8 11 44 24.0 20 79 25.6
Prescription pharmaceuticals 5 24 21.4 10 40 24.5 16 65 25.2
Other 111 442 25.0 256 927 27.6 556 1,948 28.6Total IS 254 1,016 25.0 588 2,132 27.6 1,278 4,477 28.6Other cardiovascular (CV)Admitted patient services 548 3,419 16.0 1,223 6,980 17.5 2,564 14,030 18.3
Out-of-hospital medical services 227 1,614 14.1 445 2,832 15.7 814 4,755 17.1
Prescription pharmaceuticals 228 1,561 14.6 402 2,478 16.2 639 3,754 17.0
Other 422 2,778 15.2 872 5,178 16.8 1,692 9,496 17.8
Total other CV 1,425 9,373 15.2 2,942 17,468 16.8 5,708 32,036 17.8
Type 2 diabetesAdmitted patient services 444 580 76.6 1,073 1,347 79.7 2,521 3,067 82.2
Out-of-hospital medical services 149 220 67.5 313 435 71.9 632 834 75.8
Prescription pharmaceuticals 390 583 66.8 725 1,014 71.5 1,288 1,709 75.4
Other 214 301 71.0 459 608 75.5 966 1,220 79.2
Total type 2 diabetes 1,196 1,684 71.0 2,570 3,403 75.5 5,407 6,830 79.2
Total cardiovascular and type 2 diabetes expenditureAdmitted patient services 1,616 6,229 26.0 3,692 13,010 28.4 8,051 26,700 30.2
Out-of-hospital medical services 436 2,086 20.9 876 3,728 23.5 1,665 6,389 26.1
Prescription pharmaceuticals 713 2,543 28.0 1,297 4,146 31.3 2,203 6,487 34.0
Other 1,152 4,992 23.1 2,449 9,644 25.4 4,962 18,339 27.1
Total 3,917 15,850 24.7 8,314 30,528 27.2 16,881 57,914 29.1
Source: Numbers estimated by J Goss as described in Appendix 1. Notes: Non-ischaemic stroke is included as part of ‘Other cardiovascular disease’. Expenditure in $million
Feature – Effect of overweight and obesity on health expenditure

Australian heart disease statistics National Heart Foundation of Australia38
2011–12 2021–22 2031–32
Figure F.4 Health expenditure attributable to elevated BMI
0
2,000
4,000
6,000
8,000
10,000
12,000
14,000
16,000
18,000
Ischaemic heart disease Total cardiovascular + type 2 diabetes
Ischaemic stroke Type 2 diabetes
Expe
nditu
re ($
mill
ion)
Other cardiovascular diseases
Table F.5 Expenditure on cardiovascular disease and type 2 diabetes per person >20 years attributable to elevated BMI
Underweight and normal weight Overweight Obese Total
Cardiovascular disease, 2011–12
Expenditure ($ million) 90 882 1,749 2,721
Persons (million) 6.11 6.28 4.74 17.13
Expenditure/person ($) 15 141 369 159
Type 2 diabetes, 2011–12
Expenditure ($ million) 18 239 938 1,196
Persons (million) 6.11 6.28 4.74 17.13
Expenditure/person ($) 3 38 198 70
Cardiovascular disease, 2031–32
Expenditure ($ million) 194 2,788 8,492 11,474
Persons (million) 5.64 8.39 9.56 23.60
Expenditure/person ($) 34 332 888 486
Type 2 diabetes, 2031–32
Expenditure ($ million) 43 769 4,594 5,407
Persons (million) 5.64 8.39 9.56 23.60
Expenditure/person ($) 8 92 481 229
Source: Numbers estimated by J Goss as described in Appendix 1Notes: Underweight and normal BMI include people with BMI < 24.9, overweight included people with BMI 25.0 – 29.9, obese included people with BMI ≥ 30.
Feature – Effect of overweight and obesity on health expenditure

National Heart Foundation of Australia Australian heart disease statistics 39
Chapter 4 Socioeconomic variation
Key facts
• Obesity in Australia showed a clear socioeconomic gradient according to income, education and area-level disadvantage.
• Rates of adult obesity in 2011–12 were markedly higher in the most disadvantaged areas of Australia (33.4%) compared to the least disadvantaged areas (20.2%), and the difference was greater among women.
• Childhood overweight and obesity rates showed a similarly strong socioeconomic gradient between the most disadvantaged areas (31%) and least disadvantaged areas (18%).
Australian heart disease statistics National Heart Foundation of Australia40
Chapter 4 – Socioeconomic variation
IntroductionThe burden of obesity is not equally shared among all sections of the Australian community. In high-income countries such as Australia, obesity tends to disproportionately affect people who are socially and economically disadvantaged, live in rural and regional areas, or are Indigenous.3,14
This chapter explores the socioeconomic inequalities in obesity according to several individual and area-level factors. Many indicators can be used to represent an individual’s socioeconomic status, and it is likely that each of these (for example, household income, employment status and education level) can affect the likelihood of becoming overweight or obese. Further, the local area in which a person lives may affect access to services such as healthcare facilities, and environments that support physical activity and healthy eating (such as greengrocers, parks and gardens, and walking and cycling infrastructure). Local areas may also affect sociocultural norms around diet and physical activity.
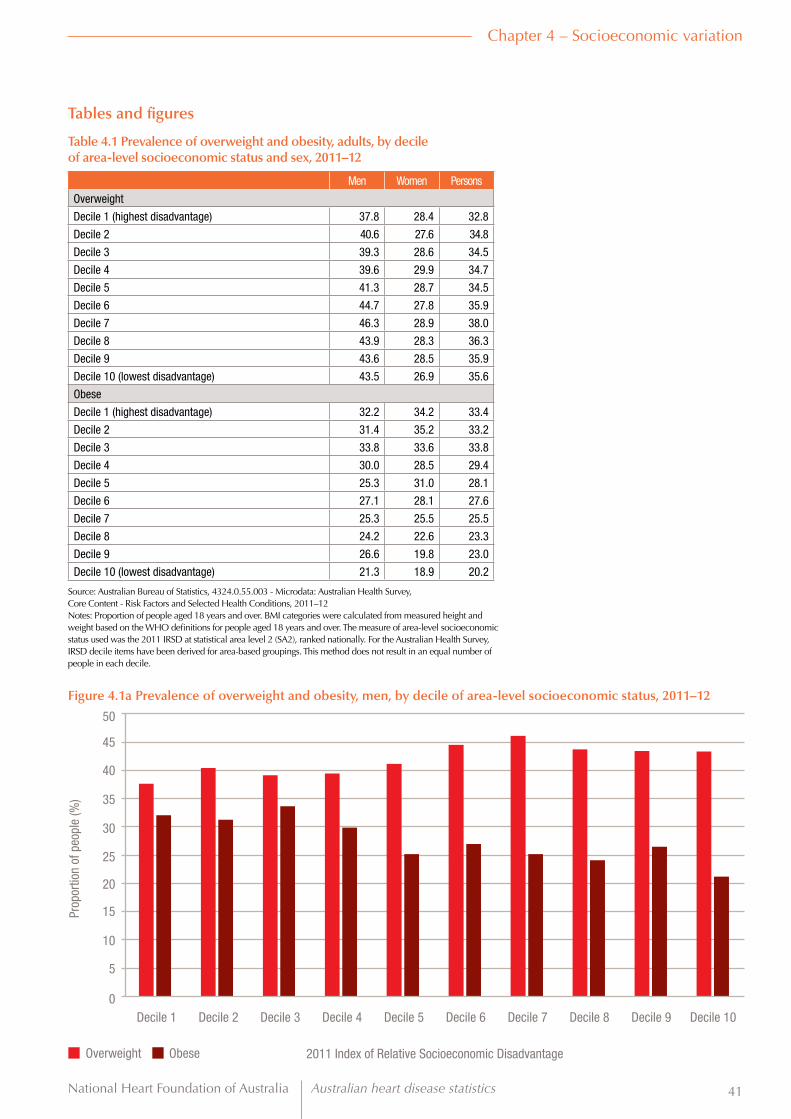
National Heart Foundation of Australia Australian heart disease statistics 41
Chapter 4 – Socioeconomic variation
Tables and figures
Table 4.1 Prevalence of overweight and obesity, adults, by decile of area-level socioeconomic status and sex, 2011–12
Men Women Persons
Overweight
Decile 1 (highest disadvantage) 37.8 28.4 32.8
Decile 2 40.6 27.6 34.8
Decile 3 39.3 28.6 34.5
Decile 4 39.6 29.9 34.7
Decile 5 41.3 28.7 34.5
Decile 6 44.7 27.8 35.9
Decile 7 46.3 28.9 38.0
Decile 8 43.9 28.3 36.3
Decile 9 43.6 28.5 35.9
Decile 10 (lowest disadvantage) 43.5 26.9 35.6
Obese
Decile 1 (highest disadvantage) 32.2 34.2 33.4
Decile 2 31.4 35.2 33.2
Decile 3 33.8 33.6 33.8
Decile 4 30.0 28.5 29.4
Decile 5 25.3 31.0 28.1
Decile 6 27.1 28.1 27.6
Decile 7 25.3 25.5 25.5
Decile 8 24.2 22.6 23.3
Decile 9 26.6 19.8 23.0
Decile 10 (lowest disadvantage) 21.3 18.9 20.2
Source: Australian Bureau of Statistics, 4324.0.55.003 - Microdata: Australian Health Survey, Core Content - Risk Factors and Selected Health Conditions, 2011–12Notes: Proportion of people aged 18 years and over. BMI categories were calculated from measured height and weight based on the WHO definitions for people aged 18 years and over. The measure of area-level socioeconomic status used was the 2011 IRSD at statistical area level 2 (SA2), ranked nationally. For the Australian Health Survey, IRSD decile items have been derived for area-based groupings. This method does not result in an equal number of people in each decile.
Overweight Obese
Figure 4.1a Prevalence of overweight and obesity, men, by decile of area-level socioeconomic status, 2011–12
0
5
10
15
20
25
30
35
40
50
45
Decile 1 Decile 2 Decile 3 Decile 4 Decile 5 Decile 6 Decile 7 Decile 8 Decile 9 Decile 10
Prop
ortio
n of
peo
ple
(%)
2011 Index of Relative Socioeconomic Disadvantage

Australian heart disease statistics National Heart Foundation of Australia42
Chapter 4 – Socioeconomic variation
Overweight Obese
Figure 4.1b Prevalence of overweight and obesity, women, by decile of area-level socioeconomic status, 2011–12
0
5
10
15
20
25
30
35
40
50
45
Decile 1 Decile 2 Decile 3 Decile 4 Decile 5 Decile 6 Decile 7 Decile 8 Decile 9 Decile 10
Prop
ortio
n of
peo
ple
(%)
2011 Index of Relative Socioeconomic Disadvantage
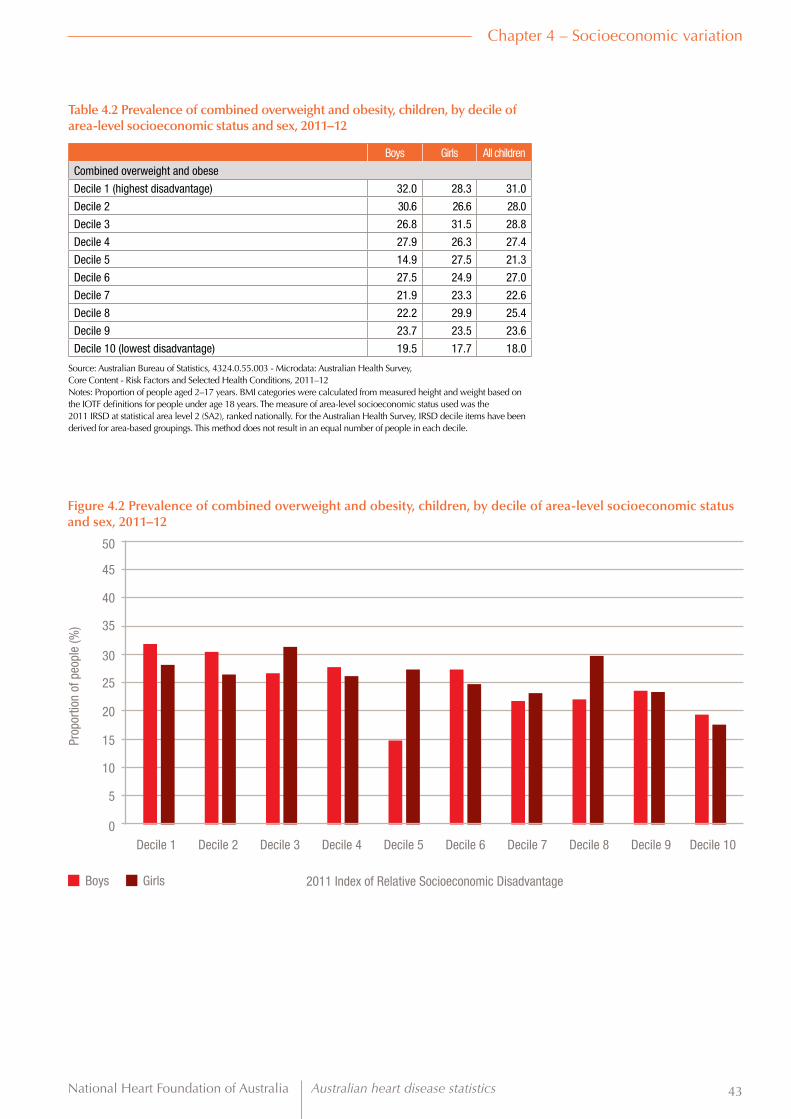
National Heart Foundation of Australia Australian heart disease statistics 43
Chapter 4 – Socioeconomic variation
Boys Girls
Figure 4.2 Prevalence of combined overweight and obesity, children, by decile of area-level socioeconomic status and sex, 2011–12
0
5
10
15
20
25
30
35
40
50
45
Decile 1 Decile 2 Decile 3 Decile 4 Decile 5 Decile 6 Decile 7 Decile 8 Decile 9 Decile 10
Prop
ortio
n of
peo
ple
(%)
2011 Index of Relative Socioeconomic Disadvantage
Table 4.2 Prevalence of combined overweight and obesity, children, by decile of area-level socioeconomic status and sex, 2011–12
Boys Girls All children
Combined overweight and obese
Decile 1 (highest disadvantage) 32.0 28.3 31.0
Decile 2 30.6 26.6 28.0
Decile 3 26.8 31.5 28.8
Decile 4 27.9 26.3 27.4
Decile 5 14.9 27.5 21.3
Decile 6 27.5 24.9 27.0
Decile 7 21.9 23.3 22.6
Decile 8 22.2 29.9 25.4
Decile 9 23.7 23.5 23.6
Decile 10 (lowest disadvantage) 19.5 17.7 18.0
Source: Australian Bureau of Statistics, 4324.0.55.003 - Microdata: Australian Health Survey, Core Content - Risk Factors and Selected Health Conditions, 2011–12Notes: Proportion of people aged 2–17 years. BMI categories were calculated from measured height and weight based on the IOTF definitions for people under age 18 years. The measure of area-level socioeconomic status used was the 2011 IRSD at statistical area level 2 (SA2), ranked nationally. For the Australian Health Survey, IRSD decile items have been derived for area-based groupings. This method does not result in an equal number of people in each decile.

Australian heart disease statistics National Heart Foundation of Australia44
Chapter 4 – Socioeconomic variation
Men Women
Figure 4.3 Prevalence of combined overweight and obesity, adults, by equivalised household income and sex, 2011–12
0
10
20
30
40
50
60
70
80
90
Decile 1 Decile 2 Decile 3 Decile 4 Decile 5 Decile 6 Decile 7 Decile 8 Decile 9 Decile 10
Prop
ortio
n of
peo
ple
(%)
Equivalised household income
Table 4.3 Prevalence of overweight and obesity, adults, by equivalised household income and sex, 2011–12
Men Women Persons
Overweight
Decile 1 (lowest income) 37.3 25.3 31.5
Decile 2 37.1 30.6 33.5
Decile 3 38.1 33.3 35.9
Decile 4 41.9 28.1 35.0
Decile 5 40.8 30.0 35.7
Decile 6 41.6 28.7 35.5
Decile 7 43.9 27.6 36.3
Decile 8 45.1 27.6 36.7
Decile 9 45.0 29.8 38.1
Decile 10 (highest income) 51.7 30.4 42.9
Obese
Decile 1 (lowest income) 29.2 32.0 30.4
Decile 2 34.3 36.0 35.1
Decile 3 27.3 32.4 30.4
Decile 4 29.1 32.1 30.1
Decile 5 27.3 29.6 28.8
Decile 6 27.4 26.4 27.0
Decile 7 27.9 27.0 27.4
Decile 8 26.6 24.1 25.3
Decile 9 27.7 21.9 24.9
Decile 10 (highest income) 24.9 18.6 22.5
Source: Australian Bureau of Statistics, 4324.0.55.003 - Microdata: Australian Health Survey, Core Content - Risk Factors and Selected Health Conditions, 2011–12Notes: Proportion of people aged 18 years and over. BMI categories were calculated from measured height and weight based on the WHO definitions for people aged 18 years and over. Reported household income is adjusted to take account of the size and composition of the household in order to calculate equivalised income. Income deciles resulted from ranking all households by income, then dividing the population into equal groups, each comprising 10% of the estimated population.

National Heart Foundation of Australia Australian heart disease statistics 45
Chapter 4 – Socioeconomic variation
Men Women
Figure 4.4 Prevalence of combined overweight and obesity, adults, by region of birth and sex, 2011–12
0
10
20
30
40
50
60
70
80
90
Southern and Eastern
Europe
North Africa and the
Middle East
Oceania (including Australia)
Northwest Europe
AmericasSub-Saharan Africa
Southern and Central Asia
South- East Asia
North- East Asia
Prop
ortio
n of
peo
ple
(%)
Region of birth
Table 4.4 Prevalence of overweight and obesity, adults, by region of birth and sex, 2011–12
Men Women Persons
Overweight
Oceania (including Australia) 42.0 28.1 35.2
Southern and Eastern Europe 46.0 35.3 40.4
North Africa and the Middle East 48.4 39.0 40.7
Northwest Europe 44.5 33.3 38.9
Sub-Saharan Africa 51.3 26.3 39.4
Americas 39.5 25.2 31.8
Southern and Central Asia 39.9 28.2 35.5
South-East Asia 42.1 23.0 31.9
North-East Asia 28.6 12.5 22.4
Obese
Oceania (including Australia) 29.9 30.0 30.0
Southern and Eastern Europe 33.9 35.1 35.2
North Africa and the Middle East 27.2 33.6 32.1
Northwest Europe 26.1 22.1 24.3
Sub-Saharan Africa 15.1 25.9 21.7
Americas 36.6 20.7 26.9
Southern and Central Asia 13.7 13.9 13.5
South-East Asia *6.5 12.0 9.8
North-East Asia *6.6 **1.9 *5.1
* Estimate has a relative standard error of 25–50% and should be used with caution.** Estimate has a standard error >50% and is considered too unreliable for general use.Source: Australian Bureau of Statistics, 4324.0.55.003 - Microdata: Australian Health Survey, Core Content - Risk Factors and Selected Health Conditions, 2011–12Notes: Proportion of persons aged 18 years and over. Estimates are not age-standardised. BMI categories were calculated from measured height and weight based on the WHO definitions for people aged 18 years and over.

Australian heart disease statistics National Heart Foundation of Australia46
Chapter 4 – Socioeconomic variation
Year 9 or below Year 10 or equivalent Year 11 or equivalent Year 12 or equivalent
Figure 4.5 Prevalence of overweight and obesity, adults, by highest year of school completed and sex, 2011–12
0
5
10
15
20
25
30
35
40
45
Overweight OverweightObese Obese
Prop
ortio
n of
peo
ple
(%)
Men Women
Table 4.5 Prevalence of overweight and obesity, adults, by highest year of school completed and sex, 2011–12
Men Women Persons
Overweight
Year 9 or below 40.0 31.7 35.9
Year 10 or equivalent 44.0 31.1 37.8
Year 11 or equivalent 41.8 31.9 37.3
Year 12 or equivalent 42.0 25.6 33.9
Obese
Year 9 or below 38.6 39.4 39.3
Year 10 or equivalent 32.4 33.8 33.2
Year 11 or equivalent 30.7 31.6 31.1
Year 12 or equivalent 22.0 21.2 21.6
Source: Australian Bureau of Statistics, 4324.0.55.003 - Microdata: Australian Health Survey, Core Content - Risk Factors and Selected Health Conditions, 2011–12Notes: Proportion of persons aged 18 years and over. BMI categories were calculated from measured height and weight based on the WHO definitions for people aged 18 years and over. The category ‘Year 9 or below’ includes people who reported never having attended school. For Year 12, ‘completed’ requires only attendance for the full year.

National Heart Foundation of Australia Australian heart disease statistics 47
Chapter 4 – Socioeconomic variation
Boys Girls
Figure 4.6 Prevalence of combined overweight and obesity, children aged 8–9 and 12–13 years, by family socioeconomic position and sex, 2011–12
0
5
10
15
20
25
30
35
40
Quintile 1 Quintile 1Quintile 2 Quintile 2Quintile 3 Quintile 3Quintile 4 Quintile 4Quintile 5 Quintile 5
Prop
ortio
n of
peo
ple
(%)
8–9 year olds 12–13 year olds
Table 4.6 Prevalence of overweight and obesity, children aged 8–9 and 12–13 years, by family socioeconomic position and sex, 2011–12
Ages 8 to 9 years Ages 12 to 13 years
Boys Girls Children Boys Girls Children
Overweight
Quintile 1 (lowest position) 19.8 21.3 20.5 24.0 25.9 25.0
Quintile 2 17.5 19.5 18.5 24.1 20.1 22.2
Quintile 3 15.1 17.1 16.1 18.2 20.7 19.4
Quintile 4 13.3 15.5 14.3 17.2 16.4 16.8
Quintile 5 (highest position) 10.8 12.6 11.7 16.6 12.4 14.5
All quintiles 15.3 17.2 16.2 20.0 19.1 19.5
Obese
Quintile 1 (lowest position) 10.1 11.2 10.6 10.1 11.4 10.7
Quintile 2 9.5 5.4 7.5 7.7 7.4 7.6
Quintile 3 5.9 5.9 5.9 7.8 6.4 7.2
Quintile 4 5.5 3.4 4.5 7.6 3.3 5.5
Quintile 5 (highest position) 2.0 3.3 2.6 1.2 2.3 2.0
All quintiles 6.6 5.8 6.2 7.0 6.2 6.6
Source: Australian Government Department of Social Services, Australian Institute of Family Studies and Australian Bureau of Statistics, Longitudinal Study of Australian Children, Wave 5, B- and K-cohortsNotes: Proportion of people aged 8–9 or 12–13 years. BMI categories were calculated from measured height and weight based on the IOTF definitions for people under age 18 years. The summary measure of family socioeconomic position was based on that of the Canadian National Longitudinal Study of Children and Youth (NLSCY).

Australian heart disease statistics National Heart Foundation of Australia48
Chapter 4 – Socioeconomic variation

National Heart Foundation of Australia Australian heart disease statistics 49
Chapter 5 Geographic variation
Key facts
• Total rates of overweight and obesity in adults varied widely by geographical area, from 45.5% (combined overweight and obesity) in inner Melbourne to more than 80% in Central West NSW.
• At about 26%, rates of obesity were substantially lower in major Australian cities compared to about 33% in regional and remote areas.

Australian heart disease statistics National Heart Foundation of Australia50
Chapter 5 – Geographic variation
IntroductionThere is a great deal of geographic variation across Australia in the prevalence of overweight and obesity. This chapter presents tables, figures and maps to visualise these differences.
The Australian Bureau of Statistics (ABS) supports a standard geographical framework called the Australian Statistical Geography Standard (ASGS). The ABS geographical structures form a hierarchy of regions, ranging from ‘mesh blocks’, which represent areas containing just 30 to 60 dwellings, up to states and territories. In this chapter, overweight and obesity data are presented according to statistical area level 4 (SA4). SA4 regions are the largest ‘substate’ regions in the ABS structure.15 There are 88 SA4 regions in Australia, which together cover the whole country without overlap or gaps. SA4s contain a minimum population of 100,000 (up to 500,000); therefore, reliable estimates can be derived from the Australian Health Survey’s randomly sampled survey population.
Data are also presented in this chapter on overweight and obesity prevalence according to the ABS Remoteness Structure. The Remoteness Structure is based on the Accessibility/Remoteness Index of Australia (ARIA+), which measures the remoteness of a point based on proximity, by road, to urban centres of various sizes. Areas are classified as Major cities, Inner regional, Outer regional, Remote and Very remote.

National Heart Foundation of Australia Australian heart disease statistics 51
Chapter 5 – Geographic variation
Tables and figures
Table 5.1 Prevalence of overweight and obesity, adults, by statistical area level 4, 2011–12
Overweight ObeseAustralian Capital TerritoryBelconnen 35.9 25.6Gungahlin 40.8 24.5North Canberra 36.9 18.6South Canberra 36.0 20.4Tuggeranong 35.1 30.0Weston Creek 35.1 23.9Woden 44.1 23.3New South WalesCapital Region 44.9 23.0Central Coast 31.4 35.0Central West 50.2 30.1Coffs Harbour – Grafton 27.2 31.7Far West and Orana (remote) 37.8 35.7Hunter Valley excluding Newcastle 40.5 33.6Illawarra 32.7 26.9Mid North Coast 31.7 36.5Murray 32.4 38.1New England and North West 37.2 27.6Newcastle and Lake Macquarie 35.1 31.5Richmond – Tweed 30.0 26.9Riverina 33.9 33.2Southern Highlands and Shoalhaven 42.3 33.6Sydney – Baulkham Hills and Hawkesbury 45.1 30.5Sydney – Blacktown 36.4 28.8Sydney – City and Inner South 33.4 16.5Sydney – Eastern Suburbs 35.9 13.7Sydney – Inner South West 36.0 26.1Sydney – Inner West 32.1 22.3Sydney – North Sydney and Hornsby 38.1 17.0Sydney – Northern Beaches 35.1 17.5Sydney – Outer South West 23.5 39.0Sydney – Outer West and Blue Mountains 34.2 30.5Sydney – Parramatta 27.9 21.9Sydney – Ryde 31.9 19.0Sydney – South West 31.8 25.2Sydney – Sutherland 28.7 30.0Northern TerritoryDarwin 34.6 26.8Northery Territory – Outback 35.9 28.9QueenslandBrisbane – East 33.4 31.9Brisbane – North 31.7 28.6Brisbane – South 32.9 25.7Brisbane – West 42.8 14.1Brisbane Inner City 37.6 20.2Cairns 32.3 30.5Darling Downs – Maranoa 33.2 44.2Fitzroy 30.1 39.0Gold Coast 37.6 26.0Ipswich 34.4 38.9Logan – Beaudesert 30.8 35.0Mackay 35.7 41.0Moreton Bay – North 32.1 33.2
Overweight ObeseMoreton Bay – South 24.0 34.1Sunshine Coast 38.6 21.1Toowoomba 34.3 35.6Townsville 37.9 36.3Wide Bay 37.0 28.5South AustraliaAdelaide – Central and Hills 39.2 21.5Adelaide – North 34.5 34.5Adelaide – South 38.6 26.4Adelaide – West 35.0 29.8Barossa – Yorke – Mid North 34.8 28.8South Australia – Outback 41.8 36.8South Australia – South East 37.8 36.9TasmaniaHobart 36.9 25.6Launceston and North East 37.0 27.3South East 40.9 33.0West and North West 35.6 31.2VictoriaBallarat 37.8 32.9Bendigo 38.1 29.4Geelong 36.5 32.2Hume 32.9 34.0Latrobe – Gippsland 40.2 35.1Melbourne – Inner 31.6 13.9Melbourne – Inner East 42.4 13.4Melbourne – Inner South 32.9 21.8Melbourne – North East 31.8 31.6Melbourne – North West 39.8 24.7Melbourne – Outer East 32.5 24.6Melbourne – South East 33.4 24.4Melbourne – West 34.5 31.1Mornington Peninsula 39.7 27.1North West 27.0 30.9Shepparton 36.7 36.1Warrnambool and South West 44.0 21.2Western AustraliaBunbury 37.9 34.3Mandurah 45.3 29.2Perth – Inner 36.6 14.2Perth – North East 38.9 28.7Perth – North West 38.0 24.3Perth – South East 37.9 27.4Perth – South West 32.1 32.4Western Australia – Outback 35.3 32.4Western Australia – Wheat Belt 37.1 34.2Australia 35.3 27.5
Source: Australian Bureau of Statistics, 4324.0.55.003 – Microdata: Australian Health Survey, Core Content – Risk Factors and Selected Health Conditions, 2011–12 (custom data analysis) for the Heart Foundation.Notes: Proportion of people aged 18 years and over. Estimates are not age-standardised. BMI categories were calculated from measured height and weight based on the WHO definitions for people aged 18 years and over. Data are presented at statistical area level 4 (SA4) for all states and territories except the Australian Capital Territory, for which data are at SA3 level. Very remote areas were not sampled and as a result, some SA4 regions are not included.

Australian heart disease statistics National Heart Foundation of Australia52
Chapter 5 – Geographic variation
Figure 5.1a Prevalence of overweight and obesity, adults, Australia, by statistical area level 4, 2011–12
Prevalence of overweight (BMI 25 to <30)
20.1 – 25%
25.1 – 30%
30.1 – 35%
35.1 – 40%
40.1 – 45%
45.1 – 50%
>50
Data not available
Prevalence of obesity (BMI >30)
10.1 – 15%
15.1 – 20%
20.1 – 25%
25.1 – 30%
30.1 – 35%
35.1 – 40%
>40
Data not available
Combined prevalence of overweight and obesity (BMI >20)
45.1 – 50%
50.1 – 55%
55.1 – 60%
60.1 – 65%
65.1 – 70%
70.1 – 75%
75.1 – 80%
>80%
Data not available

National Heart Foundation of Australia Australian heart disease statistics 53
Chapter 5 – Geographic variation
Figure 5.1c Prevalence of combined overweight and obesity, adults, New South Wales, by statistical area level 4, 2011–12
Figure 5.1b Prevalence of combined overweight and obesity, adults, Australian Capital Territory, by statistical area level 4, 2011–12
Figure 5.1d Prevalence of combined overweight and obesity, adults, Northern Territory, by statistical area level 4, 2011–12
Total prevalence of overweight and obesity
45.1 – 50%
50.1 – 55%
55.1 – 60%
60.1 – 65%
65.1 – 70%
70.1 – 75%
75.1 – 80%
>80%
Total prevalence of overweight and obesity
45.1 – 50%
50.1 – 55%
55.1 – 60%
60.1 – 65%
65.1 – 70%
70.1 – 75%
75.1 – 80%
>80%
Total prevalence of overweight and obesity
45.1 – 50%
50.1 – 55%
55.1 – 60%
60.1 – 65%
65.1 – 70%
70.1 – 75%
75.1 – 80%
>80%
Total prevalence of overweight and obesity
45.1 – 50%
50.1 – 55%
55.1 – 60%
60.1 – 65%
65.1 – 70%
70.1 – 75%
75.1 – 80%
>80%
Metropolitan Sydney
Metropolitan Brisbane
Figure 5.1e Prevalence of combined overweight and obesity, adults, Queensland, by statistical area level 4, 2011–1

Australian heart disease statistics National Heart Foundation of Australia54
Chapter 5 – Geographic variation
Figure 5.1g Prevalence of combined overweight and obesity, adults, Tasmania, by statistical area level 4, 2011–12
Figure 5.1f Prevalence of combined overweight and obesity, adults, South Australia, by statistical area level 4, 2011–12
Figure 5.1h Prevalence of combined overweight and obesity, adults, Victoria, by statistical area level 4, 2011–12
Total prevalence of overweight and obesity
45.1 – 50%
50.1 – 55%
55.1 – 60%
60.1 – 65%
65.1 – 70%
70.1 – 75%
75.1 – 80%
>80%
Total prevalence of overweight and obesity
45.1 – 50%
50.1 – 55%
55.1 – 60%
60.1 – 65%
65.1 – 70%
70.1 – 75%
75.1 – 80%
>80%
Total prevalence of overweight and obesity
45.1 – 50%
50.1 – 55%
55.1 – 60%
60.1 – 65%
65.1 – 70%
70.1 – 75%
75.1 – 80%
>80%
Total prevalence of overweight and obesity
45.1 – 50%
50.1 – 55%
55.1 – 60%
60.1 – 65%
65.1 – 70%
70.1 – 75%
75.1 – 80%
>80%
Metropolitan Adelaide
Figure 5.1i Prevalence of combined overweight and obesity, adults, Western Australia, by statistical area level 4, 2011–12
Metropolitan Melbourne
Metropolitan Perth

National Heart Foundation of Australia Australian heart disease statistics 55
Chapter 5 – Geographic variation
Table 5.2 Prevalence of BMI categories, adults, by sex and remoteness area categories, 2011–12
Underweight and normal weight Overweight Obese
Men
Major cities 32.3 41.9 25.9
Inner regional 25.2 42.6 32.2
Outer regional 26.5 44.1 29.1
Remote 22.5 40.4 35.5
Women
Major cities 47.5 27.4 25.1
Inner regional 37.1 30.5 32.1
Outer regional 35.0 29.1 36.0
Remote 37.2 28.9 32.4
Persons
Major cities 39.8 34.7 25.5
Inner regional 30.9 36.8 32.2
Outer regional 30.8 36.8 32.5
Remote 30.6 35.4 33.4
Source: Australian Bureau of Statistics, 4324.0.55.003 - Microdata: Australian Health Survey, Core Content - Risk Factors and Selected Health Conditions, 2011–12Notes: Proportion of people aged 18 years and over. BMI categories were calculated from measured height and weight based on the WHO definitions for people aged 18 years and over. No data were available for very remote regions. Underweight and normal weight categories have been combined and include respondents with BMI < 25 kg/m2.

Australian heart disease statistics National Heart Foundation of Australia56
Chapter 5 – Geographic variation
Underweight and normal weight
Underweight and normal weight
Overweight
Overweight
Obese
Obese
Figure 5.2a Prevalence of BMI categories, men, by remoteness area categories, 2011–12
Figure 5.2b Prevalence of BMI categories, women, by remoteness area categories, 2011–12
0
0
5
5
10
10
15
15
20
20
25
25
30
30
35
35
40
40
45
45
50
50
Major cities
Major cities
Outer regional
Outer regional
Inner regional
Inner regional
Remote
Remote
Prop
ortio
n of
peo
ple
(%)
Prop
ortio
n of
peo
ple
(%)

National Heart Foundation of Australia Australian heart disease statistics 57
Chapter 6 Aboriginal and Torres Strait Islander peoples
Key facts
• Rates of obesity were much higher in the Aboriginal and Torres Strait Islander populations than for the rest of Australia, particularly among women.
• Around 70% of Aboriginal and Torres Strait Islander women and 67% of men were overweight or obese.
• Around 33% of Aboriginal and Torres Strait Islander girls and 30% of boys were overweight or obese.
• High waist circumference measurements were collected for more than 60% of men and more than 80% of women, representing increased risk of disease. Based on waist circumference measurements, more than 67% of women were at substantially increased risk of disease.
• Between the 2004–05 NATSIHS and 2012–13 AATSIHS, the prevalence of obesity increased for Aboriginal and Torres Strait Islander women and men aged 25 years or over.

Australian heart disease statistics National Heart Foundation of Australia58
Chapter 6 – Aboriginal and Torres Strait Islander peoples
IntroductionSubstantial health inequalities exist between Aboriginal and Torres Strait Islander peoples and non-Indigenous Australians, particularly for prevalence of heart disease. In 2011, after adjusting for differences in age, heart attack rates and rates of hospitalisation for ischaemic heart disease (IHD) among Aboriginal and Torres Strait Islander adults were more than twice the rates for other Australians.16 Differences in a range of risk factors and circumstances contribute to these inequalities in health outcomes, in particular smoking and psychological distress, but differences in the prevalence of overweight and obesity between the two groups play an important role.16
This chapter presents data on overweight and obesity among Aboriginal and Torres Strait Islander peoples. The data and figures are primarily based on the National Aboriginal and Torres Strait Islander Health Survey (NATSIHS) component of the recent 2012–13 Australian Aboriginal and Torres Strait Islander Health Survey (AATSIHS). The AATSIHS collected height, weight and waist and hip circumference measurements, as well as other health and wellbeing indicators, from a nationally representative sample of Indigenous Australian adults and children in 2012–13. Although standard (World Health Organization) definitions of overweight and obesity have been used throughout this report, the relationships between body mass index (BMI), waist circumference and body fat levels, and between BMI and health risks, are known to be different for Indigenous Australians and Australians of European descent.17

National Heart Foundation of Australia Australian heart disease statistics 59
Chapter 6 – Aboriginal and Torres Strait Islander peoples
Tables and figures
Table 6.1 Prevalence of BMI categories and waist circumference risk categories, Aboriginal and Torres Strait Islander adults, by sex and age, 2012–13
BMI categories Waist circumference risk categories
Normal weight and
underweightOverweight Obese Not at risk Increased risk Substantially
increased risk
Men
18–24 48.6 28.9 24.2 62.1 12.3 26.4
25–34 32.8 31.7 36.1 44.9 21.9 34.4
35–44 25.1 30.9 43.1 27.9 20.2 49.7
45–54 25.6 39.0 34.3 30.0 20.8 50.4
55–64 29.6 27.5 42.3 23.3 20.3 57.1
65+ 25.9 30.9 43.2 *12.2 29.7 58.1
All men 33.1 31.3 35.7 39.5 19.1 41.1
Women
18–24 41.5 28.1 29.5 31.8 20.8 47.8
25–34 35.6 27.2 37.0 21.9 16.1 61.1
35–44 21.7 26.8 51.2 14.7 10.1 75.5
45–54 25.6 24.4 49.6 9.4 11.3 78.5
55–64 20.6 28.4 50.4 *10.9 *10.9 81.0
65+ *15.7 34.8 48.3 *7.1 *8.2 87.1
All women 29.8 27.5 42.8 18.4 13.8 67.4
Persons
18–24 45.3 28.1 27.4 47.6 16.3 36.6
25–34 34.7 29.1 36.3 33.3 19.0 47.9
35–44 23.9 28.9 46.8 21.3 15.2 62.6
45–54 25.9 32.3 42.0 19.4 15.9 64.9
55–64 25.0 28.2 47.1 17.0 15.6 69.3
65+ 20.7 32.5 47.9 9.4 18.2 73.6
All persons 31.4 29.4 39.2 28.9 16.4 54.3
* Estimate has a relative standard error of 25–50% and should be used with caution.Source: Australian Bureau of Statistics, 4715.0.30.001 - Microdata: Australian Aboriginal and Torres Strait Islander Health Survey, Detailed Conditions and Other Health Data, 2012–13Notes: Proportion of people aged 18 years and over. Survey participants were measured for height, weight and waist circumference, and BMI categories were calculated based on height and weight. BMI categories are based on the WHO definitions for people aged 18 years and over. Underweight and normal weight categories have been combined and include respondents with BMI < 25 kg/m2. For men, a waist circumference ≥94 cm represents increased risk, and a circumference ≥102 cm represents substantially increased risk. For women, a waist circumference ≥80 cm represents increased risk, and a circumference ≥88 cm represents substantially increased risk. Estimates of prevalence of waist circumference categories for persons have been calculated manually from ABS-generated raw estimates for each sex.
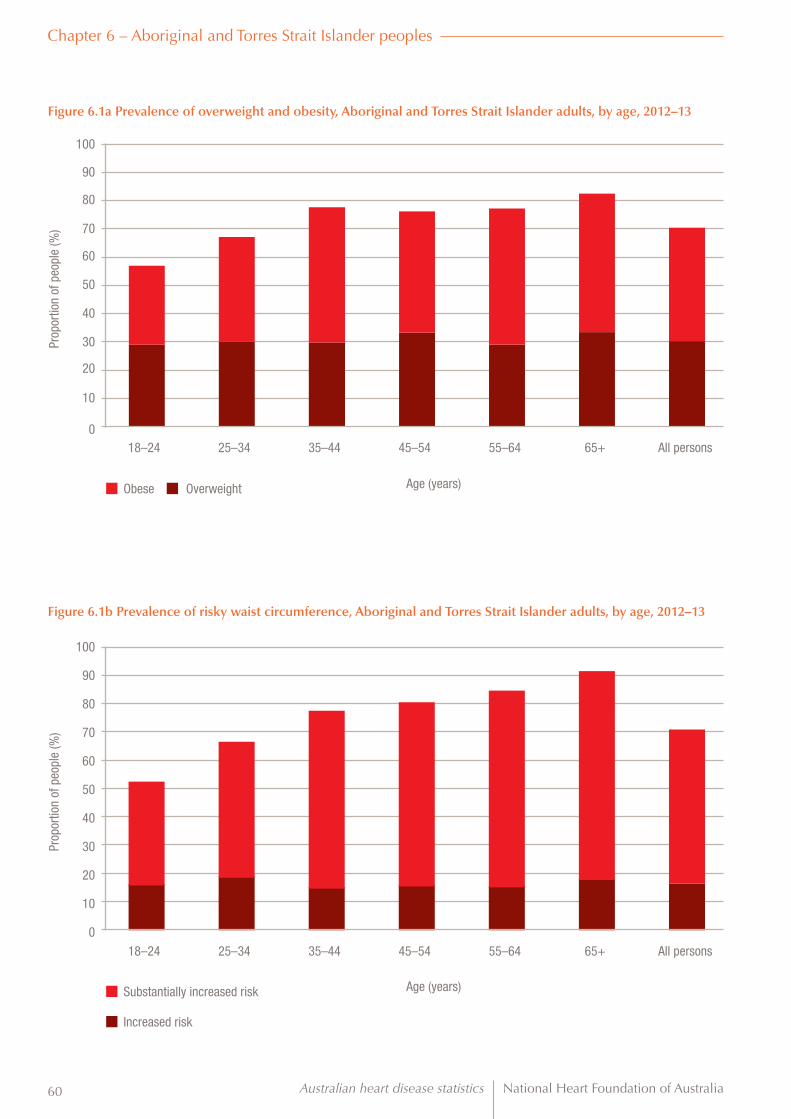
Australian heart disease statistics National Heart Foundation of Australia60
Figure 6.1a Prevalence of overweight and obesity, Aboriginal and Torres Strait Islander adults, by age, 2012–13
Figure 6.1b Prevalence of risky waist circumference, Aboriginal and Torres Strait Islander adults, by age, 2012–13
0
0
10
10
20
20
30
30
40
40
50
50
60
60
70
70
80
80
90
100
100
90
18–24
18–24
25–34
25–34
35–44
35–44
45–54
45–54
55–64
55–64
65+
65+
All persons
All persons
Obese
Substantially increased risk
Overweight
Increased risk
Prop
ortio
n of
peo
ple
(%)
Prop
ortio
n of
peo
ple
(%)
Age (years)
Age (years)
Chapter 6 – Aboriginal and Torres Strait Islander peoples
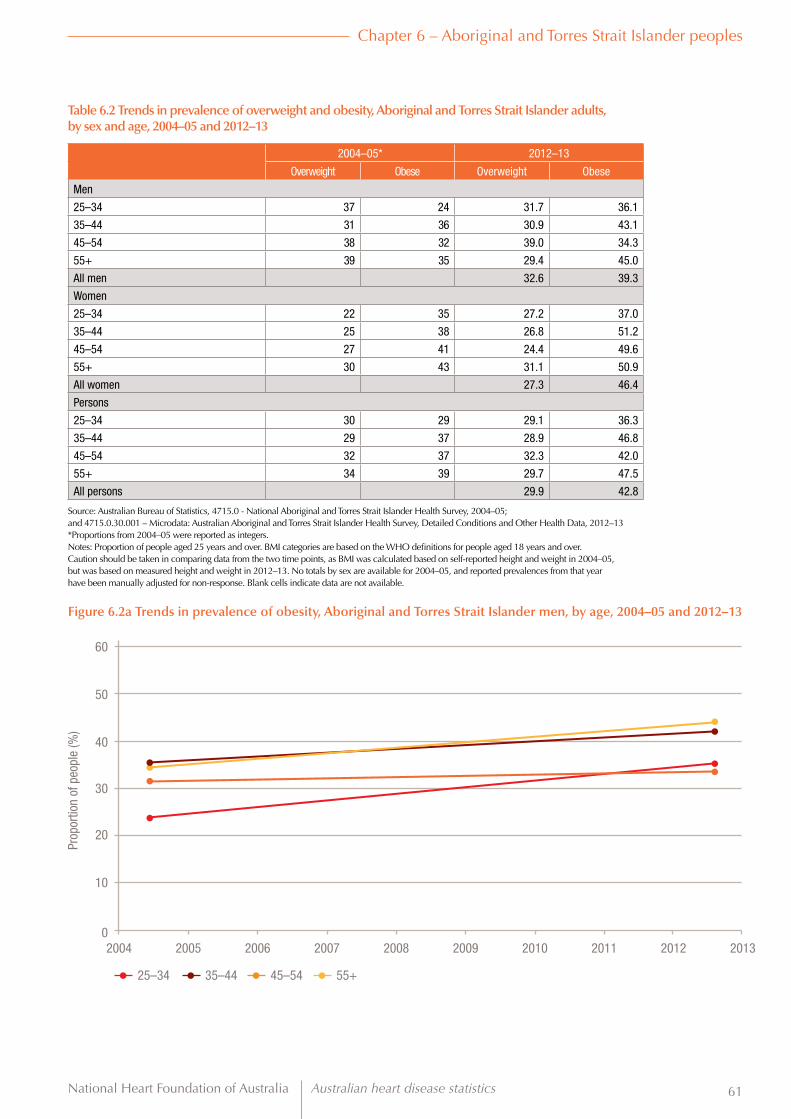
National Heart Foundation of Australia Australian heart disease statistics 61
Figure 6.2a Trends in prevalence of obesity, Aboriginal and Torres Strait Islander men, by age, 2004–05 and 2012–13
Table 6.2 Trends in prevalence of overweight and obesity, Aboriginal and Torres Strait Islander adults, by sex and age, 2004–05 and 2012–13
2004–05* 2012–13
Overweight Obese Overweight Obese
Men
25–34 37 24 31.7 36.1
35–44 31 36 30.9 43.1
45–54 38 32 39.0 34.3
55+ 39 35 29.4 45.0
All men 32.6 39.3
Women
25–34 22 35 27.2 37.0
35–44 25 38 26.8 51.2
45–54 27 41 24.4 49.6
55+ 30 43 31.1 50.9
All women 27.3 46.4
Persons
25–34 30 29 29.1 36.3
35–44 29 37 28.9 46.8
45–54 32 37 32.3 42.0
55+ 34 39 29.7 47.5
All persons 29.9 42.8
Source: Australian Bureau of Statistics, 4715.0 - National Aboriginal and Torres Strait Islander Health Survey, 2004–05; and 4715.0.30.001 – Microdata: Australian Aboriginal and Torres Strait Islander Health Survey, Detailed Conditions and Other Health Data, 2012–13*Proportions from 2004–05 were reported as integers.Notes: Proportion of people aged 25 years and over. BMI categories are based on the WHO definitions for people aged 18 years and over. Caution should be taken in comparing data from the two time points, as BMI was calculated based on self-reported height and weight in 2004–05, but was based on measured height and weight in 2012–13. No totals by sex are available for 2004–05, and reported prevalences from that year have been manually adjusted for non-response. Blank cells indicate data are not available.
60
40
50
30
10
20
02004 2005 2006 2007 2008 2009 2010 2011 2012 2013
25–34 35–44 45–54 55+
Prop
ortio
n of
peo
ple
(%)
Chapter 6 – Aboriginal and Torres Strait Islander peoples

Australian heart disease statistics National Heart Foundation of Australia62
Chapter 6 – Aboriginal and Torres Strait Islander peoples
Figure 6.2b Trends in prevalence of obesity, Aboriginal and Torres Strait Islander women, by age, 2004–05 and 2012–13
60
40
50
30
10
20
02004 2005 2006 2007 2008 2009 2010 2011 2012 2013
25–34 35–44 45–54 55+
Prop
ortio
n of
peo
ple
(%)
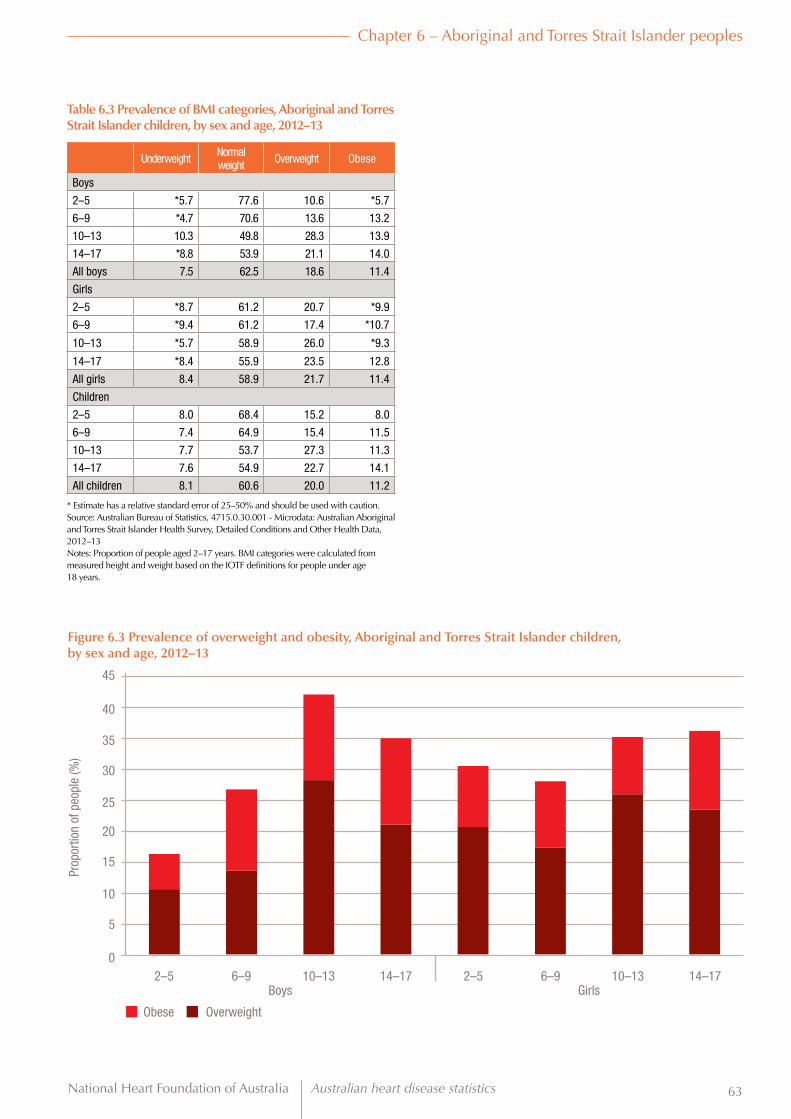
National Heart Foundation of Australia Australian heart disease statistics 63
Chapter 6 – Aboriginal and Torres Strait Islander peoples
Table 6.3 Prevalence of BMI categories, Aboriginal and Torres Strait Islander children, by sex and age, 2012–13
Underweight Normal weight Overweight Obese
Boys
2–5 *5.7 77.6 10.6 *5.7
6–9 *4.7 70.6 13.6 13.2
10–13 10.3 49.8 28.3 13.9
14–17 *8.8 53.9 21.1 14.0
All boys 7.5 62.5 18.6 11.4
Girls
2–5 *8.7 61.2 20.7 *9.9
6–9 *9.4 61.2 17.4 *10.7
10–13 *5.7 58.9 26.0 *9.3
14–17 *8.4 55.9 23.5 12.8
All girls 8.4 58.9 21.7 11.4
Children
2–5 8.0 68.4 15.2 8.0
6–9 7.4 64.9 15.4 11.5
10–13 7.7 53.7 27.3 11.3
14–17 7.6 54.9 22.7 14.1
All children 8.1 60.6 20.0 11.2
* Estimate has a relative standard error of 25–50% and should be used with caution.Source: Australian Bureau of Statistics, 4715.0.30.001 - Microdata: Australian Aboriginal and Torres Strait Islander Health Survey, Detailed Conditions and Other Health Data, 2012–13Notes: Proportion of people aged 2–17 years. BMI categories were calculated from measured height and weight based on the IOTF definitions for people under age 18 years.
Figure 6.3 Prevalence of overweight and obesity, Aboriginal and Torres Strait Islander children, by sex and age, 2012–13
0
5
10
15
20
25
30
40
45
35
2–5 6–9 10–13 14–17 2–5 6–9 10–13 14–17
Prop
ortio
n of
peo
ple
(%)
Boys Girls
Obese Overweight

Australian heart disease statistics National Heart Foundation of Australia64
Chapter 6 – Aboriginal and Torres Strait Islander peoples
Men Women
Figure 6.4 Prevalence of combined overweight and obesity, Aboriginal and Torres Strait Islander adults, by decile of area-level socioeconomic status and sex, 2012–13
0
10
20
30
40
50
60
70
80
90
100
Decile 1 Decile 2 Decile 3 Decile 4 Decile 5 Decile 6 Decile 7 Decile 8 Decile 9 Decile 10
Prop
ortio
n of
peo
ple
(%)
2011 Index of Relative Socioeconomic Disadvantage
Table 6.4 Prevalence of combined overweight and obesity, Aboriginal and Torres Strait Islander adults, by decile of area-level socioeconomic status and sex, 2012–13
Men Women Persons
Combined overweight and obese
Decile 1 (highest disadvantage) 63.9 67.8 65.9
Decile 2 58.8 66.3 62.4
Decile 3 68.3 74.5 72.5
Decile 4 70.0 71.2 69.9
Decile 5 73.7 70.4 70.9
Decile 6 80.0 77.0 76.8
Decile 7 69.1 66.7 73.3
Decile 8 63.5 63.2 63.8
Decile 9 66.7 60.6 71.2
Decile 10 (lowest disadvantage) *77.8 *60.0 *57.8
* Estimate has a relative standard error of 25–50% and should be used with caution.Source: Australian Bureau of Statistics, 4715.0.30.001 - Microdata: Australian Aboriginal and Torres Strait Islander Health Survey, Detailed Conditions and Other Health Data, 2012–13Notes: Proportion of people aged 18 years and over. BMI categories were calculated from measured height and weight based on the WHO definitions for people aged 18 years and over. The measure of area-level socioeconomic status used was the 2011 IRSD, at statistical area 2 level, ranked nationally. For the Australian Aboriginal and Torres Strait Islander Health Survey, IRSD decile items have been derived for area-based groupings. This method does not result in an equal number of people in each decile. Overweight and obesity have been combined to include all people with BMI ≥ 25 kg/m2.

National Heart Foundation of Australia Australian heart disease statistics 65
Chapter 6 – Aboriginal and Torres Strait Islander peoples
Men Women
Figure 6.5 Prevalence of combined overweight and obesity, Aboriginal and Torres Strait Islander adults, by equivalised household income and sex, 2012–13
0
10
20
30
40
50
60
70
80
90
100
Decile 1 Decile 2 Decile 3 Decile 4 Decile 5 Decile 6 Decile 7 Decile 8 Decile 9 Decile 10
Prop
ortio
n of
peo
ple
(%)
Equivalised household income
Table 6.5 Prevalence of combined overweight and obesity, Aboriginal and Torres Strait Islander adults, by equivalised household income and sex, 2012–13
Men Women Persons
Combined overweight and obese
Decile 1 (lowest income) 59.7 67.4 63.6
Decile 2 58.5 68.2 64.3
Decile 3 61.0 69.7 65.1
Decile 4 73.5 74.0 73.7
Decile 5 72.3 74.7 72.9
Decile 6 71.4 72.2 72.0
Decile 7 83.7 72.9 78.9
Decile 8 74.1 72.4 73.6
Decile 9 81.8 86.7 76.0
Decile 10 (highest income) 87.5 *77.8 79.0
* Estimate has a relative standard error of 25–50% and should be used with caution.Source: Australian Bureau of Statistics, 4715.0.30.001 - Microdata: Australian Aboriginal and Torres Strait Islander Health Survey, Detailed Conditions and Other Health Data, 2012–13Notes: Proportion of people aged 18 years and over. BMI categories were calculated from measured height and weight based on the WHO definitions for people aged 18 years and over. Overweight and obesity have been combined to include all people with BMI ≥ 25 kg/m2.

Australian heart disease statistics National Heart Foundation of Australia66
Chapter 6 – Aboriginal and Torres Strait Islander peoples
Table 6.7 Prevalence of overweight and obesity, Aboriginal and Torres Strait Islander adults, by remoteness area categories and sex, 2012–13
Men Women Persons
Overweight
Major cities 31.5 25.6 28.4
Inner regional 31.3 29.7 29.6
Outer regional 34.0 28.4 30.9
Remote 33.6 29.8 31.9
Very remote 28.8 25.9 27.5
Obese
Major cities 38.3 42.3 40.1
Inner regional 38.6 50.0 43.4
Outer regional 35.9 40.8 38.2
Remote 32.8 38.2 35.0
Very remote 27.1 40.1 33.8
Source: Australian Bureau of Statistics, 4715.0.30.001 - Microdata: Australian Aboriginal and Torres Strait Islander Health Survey, Detailed Conditions and Other Health Data, 2012–13Notes: Proportion of people aged 18 years and over. BMI categories were calculated from measured height and weight based on the WHO definitions for people aged 18 years and over. The category ‘Very remote’ also includes respondents with no usual address.
Table 6.6 Prevalence of overweight and obesity, Aboriginal and Torres Strait Islander adults, by highest year of school completed and sex, 2012–13
Men Women Persons
Overweight
Year 6 or below 27.9 *20.0 25.8
Year 7 or equivalent *29.1 *23.5 28.0
Year 8 or equivalent 20.7 22.3 20.5
Year 9 or equivalent 29.5 26.9 29.2
Year 10 or equivalent 32.2 28.4 30.1
Year 11 or equivalent 31.9 26.1 30.0
Year 12 or equivalent 34.5 28.2 31.5
Obese
Year 6 or below 34.9 43.1 39.7
Year 7 or equivalent 40.0 51.0 43.0
Year 8 or equivalent 41.4 54.3 45.9
Year 9 or equivalent 35.8 44.0 40.7
Year 10 or equivalent 36.2 45.6 41.4
Year 11 or equivalent 33.5 36.7 35.0
Year 12 or equivalent 34.2 37.3 36.0
* Estimate has a relative standard error of 25–50% and should be used with caution.Source: Australian Bureau of Statistics, 4715.0.30.001 - Microdata: Australian Aboriginal and Torres Strait Islander Health Survey, Detailed Conditions and Other Health Data, 2012–13Notes: Proportion of people aged 18 years and over. BMI categories were calculated from measured height and weight based on the WHO definitions for people aged 18 years and over. The category ‘Year 6 or below’ includes people who reported never having attended school.

National Heart Foundation of Australia Australian heart disease statistics 67
Chapter 7 International comparisons
Key facts
• Australian rates of overweight and obesity have remained well above the global average since 1990, but are comparable to other high-income Western countries.
• Australian children have lower rates of overweight and obesity than children from the USA, UK, New Zealand and Canada, but Australian rates have climbed steadily since the 1990s and may soon surpass those countries.
Australian heart disease statistics National Heart Foundation of Australia68
Chapter 7 – International comparisons
IntroductionAustralia has one of the highest rates of overweight and obesity in the world for both adults and children. While rates of overweight and obesity tend to be higher in high-income countries, there is a great deal of variability among countries, as well as within (as detailed in chapters 4 and 5). Further, there is an emerging ‘double burden’ in lower and middle-income countries, where overweight and underweight (malnutrition) co-exist.
This chapter focuses on estimates of overweight and obesity prevalence modelled for the Global Burden of Disease Study 2013,18 compares Australia’s rates to similar countries and shows our overall place compared to the rest of the world.

National Heart Foundation of Australia Australian heart disease statistics 69
Chapter 7 – International comparisons
Tables and figures
Tabl
e 7.
1 Tr
ends
in a
ge-s
tand
ardi
sed
prev
alen
ce o
f com
bine
d ov
erw
eigh
t and
obe
sity
, mod
elle
d es
timat
es, a
dults
age
d 20
yea
rs a
nd o
ver,
by s
ex a
nd w
orld
regi
on,
1990
to 2
013
1990
1991
1992
1993
1994
1995
1996
1997
1998
1999
2000
2001
2002
2003
2004
2005
2006
2007
2008
2009
2010
2011
2012
2013M
enCe
ntra
l Eur
ope,
Eas
tern
Eur
ope
and
Cent
ral A
sia
51.1
51.1
51.4
51.5
51.5
51.6
51.8
52.0
52.3
52.7
53.1
53.6
54.1
54.5
55.0
55.4
55.8
56.1
56.4
56.6
56.9
57.1
57.3
57.4
High
-inco
me
(incl
udin
g Au
stra
lia)
53.7
54.2
54.6
55.0
55.5
56.0
56.7
57.3
57.8
58.2
58.5
58.8
58.9
59.0
59.1
59.2
59.3
59.4
59.5
59.6
59.7
59.8
59.8
59.9
Latin
Am
eric
a an
d Ca
ribbe
an41
.741
.842
.042
.242
.542
.843
.143
.644
.445
.145
.846
.547
.147
.848
.448
.949
.450
.050
.651
.151
.551
.852
.152
.3
North
Afri
ca a
nd M
iddl
e Ea
st54
.254
.554
.754
.854
.955
.155
.255
.355
.455
.455
.455
.455
.555
.655
.856
.156
.456
.757
.057
.357
.657
.858
.158
.5
Sout
h As
ia17
.417
.617
.817
.818
.118
.318
.518
.718
.919
.119
.319
.419
.519
.719
.819
.920
.120
.120
.120
.120
.120
.120
.120
.2
Sout
h-Ea
st A
sia,
Eas
t Asi
a an
d Oc
eani
a12
.612
.813
.113
.514
.114
.615
.316
.016
.817
.518
.218
.819
.420
.020
.521
.121
.722
.322
.923
.423
.824
.224
.524
.7
Sub-
Saha
ran
Afric
a19
.620
.020
.320
.621
.021
.421
.922
.422
.823
.023
.223
.423
.523
.723
.924
.124
.224
.324
.424
.524
.624
.724
.824
.9
Glob
al29
.830
.030
.330
.530
.831
.231
.632
.132
.633
.133
.533
.834
.234
.534
.835
.135
.435
.736
.036
.236
.436
.636
.736
.9
Wom
enCe
ntra
l Eur
ope,
Eas
tern
Eur
ope
and
Cent
ral A
sia
50.1
50.2
50.5
50.6
50.7
50.9
51.1
51.3
51.6
51.8
52.1
52.4
52.7
52.9
53.1
53.3
53.4
53.5
53.6
53.6
53.7
53.8
53.9
54.0
High
-inco
me
(incl
udin
g Au
stra
lia)
40.7
41.1
41.5
41.9
42.4
42.9
43.5
44.1
44.6
44.9
45.2
45.4
45.5
45.5
45.6
45.6
45.7
45.8
46.0
46.2
46.3
46.5
46.6
46.8
Latin
Am
eric
a an
d Ca
ribbe
an49
.249
.750
.350
.951
.752
.453
.153
.854
.555
.155
.756
.356
.757
.257
.858
.358
.859
.460
.060
.560
.961
.361
.661
.8
North
Afri
ca a
nd M
iddl
e Ea
st58
.859
.259
.459
.659
.960
.260
.661
.161
.662
.062
.462
.763
.063
.463
.763
.964
.264
.464
.664
.764
.965
.065
.265
.5
Sout
h As
ia17
.417
.617
.817
.918
.218
.518
.819
.219
.720
.320
.821
.221
.521
.721
.721
.821
.821
.821
.821
.822
.022
.122
.322
.5
Sout
h-Ea
st A
sia,
Eas
t Asi
a an
d Oc
eani
a17
.017
.217
.518
.018
.619
.320
.020
.821
.622
.323
.023
.624
.224
.725
.225
.626
.126
.426
.827
.127
.327
.627
.828
.1
Sub-
Saha
ran
Afric
a21
.521
.822
.022
.322
.623
.023
.524
.225
.025
.726
.326
.927
.427
.928
.428
.829
.229
.529
.830
.130
.330
.530
.730
.9
Glob
al30
.830
.931
.231
.531
.832
.332
.833
.333
.934
.534
.935
.335
.635
.936
.136
.336
.636
.837
.037
.237
.437
.637
.838
.0
Pers
ons
Cent
ral E
urop
e, E
aste
rn E
urop
e an
d Ce
ntra
l Asi
a50
.850
.851
.151
.251
.351
.451
.651
.952
.252
.452
.853
.253
.553
.954
.254
.554
.755
.055
.255
.355
.455
.555
.755
.8
High
-inco
me
(incl
udin
g Au
stra
lia)
47.1
47.6
48.0
48.4
48.9
49.4
50.1
50.6
51.1
51.5
51.8
52.0
52.1
52.2
52.3
52.4
52.5
52.6
52.7
52.9
53.0
53.1
53.2
53.3
Latin
Am
eric
a an
d Ca
ribbe
an45
.645
.946
.346
.847
.347
.848
.349
.049
.750
.451
.051
.652
.252
.753
.353
.854
.454
.955
.556
.056
.556
.857
.157
.3
North
Afri
ca a
nd M
iddl
e Ea
st56
.556
.957
.157
.357
.457
.758
.058
.258
.558
.758
.959
.159
.359
.559
.760
.060
.360
.660
.861
.061
.261
.561
.762
.0
Sout
h As
ia17
.417
.717
.817
.918
.118
.418
.719
.019
.319
.720
.020
.320
.520
.720
.820
.920
.920
.920
.920
.921
.021
.121
.221
.3
Sout
h-Ea
st A
sia,
Eas
t Asi
a an
d Oc
eani
a14
.815
.015
.315
.816
.317
.017
.618
.419
.219
.920
.621
.221
.822
.422
.923
.423
.924
.424
.925
.325
.625
.926
.226
.4
Sub-
Saha
ran
Afric
a20
.720
.921
.221
.521
.922
.322
.823
.424
.024
.524
.925
.325
.625
.926
.326
.526
.827
.027
.227
.427
.627
.727
.928
.0
Glob
al30
.430
.630
.831
.131
.431
.832
.332
.833
.333
.834
.334
.634
.935
.235
.535
.836
.036
.336
.636
.837
.037
.237
.337
.5
Sour
ce: G
loba
l Bur
den
of D
isea
se S
tudy
201
3 (G
BD 2
013)
Obe
sity
Pre
vale
nce
1990
–201
3. S
eattl
e, U
SA: I
nstit
ute
for H
ealth
Met
rics
and
Eval
uatio
n (IH
ME)
, 201
4.N
otes
: Pro
porti
on o
f peo
ple
aged
20
year
s an
d ov
er. B
MI c
ateg
orie
s ar
e ba
sed
on th
e W
HO
defi
nitio
ns fo
r peo
ple
aged
18
year
s an
d ov
er. O
verw
eigh
t and
obe
sity
hav
e be
en c
ombi
ned
to in
clud
e al
l peo
ple
with
BM
I ≥ 2
5 kg
/m2 .
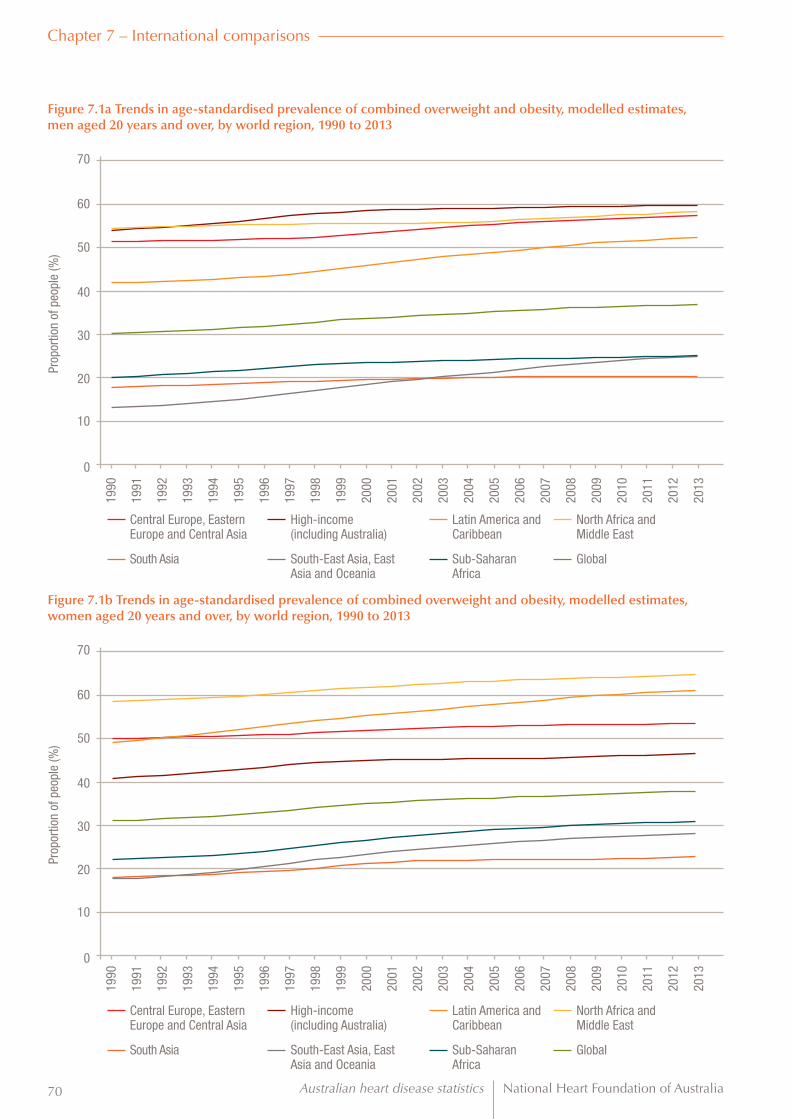
Australian heart disease statistics National Heart Foundation of Australia70
Chapter 7 – International comparisons
Figure 7.1a Trends in age-standardised prevalence of combined overweight and obesity, modelled estimates, men aged 20 years and over, by world region, 1990 to 2013
Figure 7.1b Trends in age-standardised prevalence of combined overweight and obesity, modelled estimates, women aged 20 years and over, by world region, 1990 to 2013
60
60
70
70
40
40
50
50
30
30
10
10
20
20
0
0
1990
1991
1992
1993
1994
1995
1996
1997
1998
1999
2000
2001
2002
2003
2004
2005
2006
2007
2008
2009
2010
2011
2012
2013
1990
1991
1992
1993
1994
1995
1996
1997
1998
1999
2000
2001
2002
2003
2004
2005
2006
2007
2008
2009
2010
2011
2012
2013
Central Europe, Eastern Europe and Central Asia
Central Europe, Eastern Europe and Central Asia
South Asia
South Asia
High-income (including Australia)
High-income (including Australia)
South-East Asia, East Asia and Oceania
South-East Asia, East Asia and Oceania
Latin America and Caribbean
Latin America and Caribbean
Sub-Saharan Africa
Sub-Saharan Africa
North Africa and Middle East
North Africa and Middle East
Global
Global
Prop
ortio
n of
peo
ple
(%)
Prop
ortio
n of
peo
ple
(%)

National Heart Foundation of Australia Australian heart disease statistics 71
Chapter 7 – International comparisons
Tabl
e 7.
2 Tr
ends
in a
ge-s
tand
ardi
sed
prev
alen
ce o
f com
bine
d ov
erw
eigh
t and
obe
sity
, mod
elle
d es
timat
es, a
dults
age
d 20
yea
rs a
nd o
ver,
by s
ex,
Aus
tral
ia a
nd s
elec
ted
coun
trie
s, 1
990
to 2
013
1990
1991
1992
1993
1994
1995
1996
1997
1998
1999
2000
2001
2002
2003
2004
2005
2006
2007
2008
2009
2010
2011
2012
2013M
en
Aust
ralia
55.3
55.0
54.8
54.6
54.8
55.3
56.2
57.7
59.2
60.4
61.5
62.6
63.3
64.0
64.5
65.1
65.7
66.2
66.6
66.9
67.3
67.7
67.9
68.2
Cana
da58
.959
.360
.060
.661
.362
.062
.763
.463
.764
.064
.164
.264
.464
.464
.464
.364
.364
.264
.264
.164
.164
.264
.464
.5
Fran
ce50
.150
.550
.951
.251
.652
.052
.653
.253
.854
.354
.654
.955
.155
.255
.355
.455
.455
.555
.655
.655
.755
.755
.855
.9
Germ
any
60.3
60.7
61.1
61.2
61.7
62.3
63.0
63.3
63.6
63.7
63.8
63.9
64.0
64.0
64.1
64.1
64.1
64.2
64.2
64.3
64.3
64.3
64.3
64.3
Japa
n21
.522
.022
.422
.723
.023
.423
.924
.424
.925
.526
.126
.627
.027
.427
.828
.028
.328
.528
.628
.728
.828
.828
.828
.9
New
Zea
land
57.8
58.0
58.2
58.5
58.7
59.0
59.5
60.4
61.5
62.6
63.5
64.2
65.1
66.1
67.0
68.0
68.8
69.6
70.3
70.7
71.0
71.2
71.4
71.4
UK55
.956
.657
.558
.359
.260
.261
.362
.463
.364
.064
.464
.664
.764
.764
.865
.065
.265
.665
.966
.166
.466
.566
.666
.6
USA
60.7
61.3
61.9
62.5
63.1
63.6
64.3
65.1
66.0
66.8
67.7
68.4
69.1
69.7
70.3
70.7
71.0
71.3
71.4
71.4
71.4
71.2
71.1
70.9
Glob
al29
.830
.030
.330
.530
.831
.231
.632
.132
.633
.133
.533
.834
.234
.534
.835
.135
.435
.736
.036
.236
.436
.636
.736
.9
Wom
en
Aust
ralia
41.1
40.9
40.7
40.7
40.9
41.5
42.5
44.1
45.7
47.2
48.5
49.8
50.8
51.7
52.3
53.0
53.5
54.0
54.5
54.8
55.2
55.6
55.9
56.1
Cana
da42
.843
.244
.044
.645
.245
.846
.547
.047
.347
.447
.347
.147
.146
.846
.546
.246
.146
.146
.246
.446
.847
.447
.948
.5
Fran
ce35
.435
.936
.436
.937
.538
.238
.939
.740
.440
.941
.341
.641
.841
.942
.042
.142
.142
.242
.442
.442
.542
.642
.742
.8
Germ
any
42.7
43.3
43.9
44.3
45.0
45.8
46.7
47.2
47.6
47.8
48.0
48.0
48.1
48.1
48.1
48.2
48.2
48.4
48.5
48.6
48.7
48.8
48.9
49.0
Japa
n18
.518
.518
.618
.518
.418
.418
.318
.218
.118
.018
.017
.917
.817
.717
.617
.517
.317
.317
.217
.217
.317
.317
.517
.6
New
Zea
land
46.7
47.1
47.7
48.3
48.8
49.4
50.0
50.6
51.2
51.8
52.2
52.6
53.3
54.3
55.3
56.5
57.5
58.5
59.3
59.7
60.0
60.1
60.2
60.0
UK45
.346
.047
.047
.949
.050
.051
.052
.052
.853
.453
.753
.953
.953
.953
.954
.054
.454
.855
.355
.856
.356
.757
.057
.2
USA
49.1
49.2
49.4
49.7
50.3
51.0
52.1
53.8
55.4
57.0
58.4
59.3
60.1
60.6
61.0
61.2
61.5
61.7
61.9
62.1
62.2
62.2
62.1
61.9
Glob
al30
.830
.931
.231
.531
.832
.332
.833
.333
.934
.534
.935
.335
.635
.936
.136
.336
.636
.837
.037
.237
.437
.637
.838
.0
Pers
ons
Aust
ralia
48.2
47.9
47.7
47.6
47.8
48.3
49.3
50.8
52.4
53.7
55.0
56.1
57.0
57.8
58.4
59.0
59.5
60.0
60.5
60.8
61.2
61.6
61.9
62.1
Cana
da50
.851
.151
.952
.553
.253
.854
.555
.155
.455
.655
.655
.655
.755
.655
.455
.255
.155
.155
.155
.255
.555
.856
.156
.5
Fran
ce42
.643
.043
.543
.944
.444
.945
.546
.346
.947
.447
.748
.048
.348
.348
.448
.548
.648
.648
.848
.848
.949
.049
.149
.2
Germ
any
51.4
51.9
52.5
52.8
53.4
54.1
54.8
55.2
55.6
55.7
55.9
56.0
56.1
56.0
56.1
56.1
56.2
56.3
56.4
56.4
56.5
56.6
56.6
56.7
Japa
n20
.220
.420
.620
.820
.921
.021
.221
.521
.721
.922
.122
.322
.522
.622
.822
.822
.923
.023
.023
.023
.123
.223
.223
.3
New
Zea
land
52.1
52.5
52.9
53.3
53.7
54.1
54.7
55.4
56.2
57.0
57.6
58.2
59.0
60.0
61.0
62.1
63.0
63.9
64.6
65.0
65.3
65.5
65.6
65.5
UK50
.551
.252
.253
.054
.055
.056
.157
.258
.058
.658
.959
.259
.259
.259
.259
.459
.760
.160
.560
.961
.361
.561
.761
.8
USA
54.8
55.1
55.5
56.0
56.6
57.1
58.1
59.3
60.6
61.8
62.9
63.8
64.5
65.1
65.5
65.8
66.1
66.4
66.5
66.7
66.7
66.6
66.5
66.3
Glob
al30
.430
.630
.831
.131
.431
.832
.332
.833
.333
.834
.334
.634
.935
.235
.535
.836
.036
.336
.636
.837
.037
.237
.337
.5
Sour
ce: G
loba
l Bur
den
of D
isea
se S
tudy
201
3 (G
BD 2
013)
Obe
sity
Pre
vale
nce
1990
–201
3. S
eattl
e, U
SA: I
nstit
ute
for H
ealth
Met
rics
and
Eval
uatio
n (IH
ME)
, 201
4.N
otes
: Pro
porti
on o
f peo
ple
aged
20
year
s an
d ov
er. B
MI c
ateg
orie
s ar
e ba
sed
on th
e W
HO
defi
nitio
ns fo
r peo
ple
aged
18
year
s an
d ov
er. O
verw
eigh
t and
obe
sity
hav
e be
en c
ombi
ned
to in
clud
e al
l peo
ple
with
BM
I ≥ 2
5 kg
/m2 .

Australian heart disease statistics National Heart Foundation of Australia72
Chapter 7 – International comparisons
Figure 7.2a Trends in prevalence of combined overweight and obesity, modelled estimates, men aged 20 years and over, Australia and selected countries, 1990 to 2013
Figure 7.2b Trends in prevalence of combined overweight and obesity, modelled estimates, women aged 20 years and over, Australia and selected countries, 1990 to 2013
60
60
80
80
70
70
40
40
50
50
30
30
10
10
20
20
0
0
1990
1991
1992
1993
1994
1995
1996
1997
1998
1999
2000
2001
2002
2003
2004
2005
2006
2007
2008
2009
2010
2011
2012
2013
1990
1991
1992
1993
1994
1995
1996
1997
1998
1999
2000
2001
2002
2003
2004
2005
2006
2007
2008
2009
2010
2011
2012
2013
Australia
Australia
Japan
Japan
Canada
Canada
New Zealand
New Zealand
France
France
UK
UK
Germany
Germany
USA
USA
Global
Global
Prop
ortio
n of
peo
ple
(%)
Prop
ortio
n of
peo
ple
(%)

National Heart Foundation of Australia Australian heart disease statistics 73
Chapter 7 – International comparisons
Figure 7.2d Trends in age-standardised prevalence of combined overweight and obesity, by country, women aged 20 years and over, 1993 and 2013
Figure 7.2c Trends in age-standardised prevalence of combined overweight and obesity, by country, men aged 20 years and over, 1993 and 2013
1993
1993
2013
2013
Total prevalence of overweight and obesity
<5%
5.1 – 10%
10.1 – 15%
15.1 – 20%
20.1 – 25%
25.1 – 30%
30.1 – 35%
35.1 – 40%
45.1 – 50%
50.1 – 55%
55.1 – 60%
60.1 – 65%
65.1 – 70%
75.1 – 80%
80.1 – 85%
>85%
Data not available
Total prevalence of overweight and obesity
<5%
5.1 – 10%
10.1 – 15%
15.1 – 20%
20.1 – 25%
25.1 – 30%
30.1 – 35%
35.1 – 40%
45.1 – 50%
50.1 – 55%
55.1 – 60%
60.1 – 65%
65.1 – 70%
75.1 – 80%
80.1 – 85%
>85%
Data not available

Australian heart disease statistics National Heart Foundation of Australia74
Chapter 7 – International comparisonsTa
ble
7.3
Tren
ds in
age
-sta
ndar
dise
d pr
eval
ence
of c
ombi
ned
over
wei
ght a
nd o
besi
ty, m
odel
led
estim
ates
, chi
ldre
n ag
ed 2
–19
year
s, b
y se
x an
d w
orld
regi
on,
1990
to 2
013
1990
1991
1992
1993
1994
1995
1996
1997
1998
1999
2000
2001
2002
2003
2004
2005
2006
2007
2008
2009
2010
2011
2012
2013
Boys
Cent
ral E
urop
e, E
aste
rn E
urop
e an
d Ce
ntra
l Asi
a16
.616
.716
.916
.916
.816
.917
.017
.117
.317
.517
.718
.018
.418
.719
.019
.219
.419
.619
.719
.819
.920
.020
.120
.2
High
-inco
me
(incl
udin
g Au
stra
lia)
20.2
20.4
20.5
20.6
20.8
21.0
21.3
21.7
22.1
22.4
22.7
22.9
23.2
23.3
23.5
23.6
23.7
23.8
23.9
24.0
24.0
24.1
24.2
24.3
Latin
Am
eric
a an
d Ca
ribbe
an16
.816
.916
.916
.916
.917
.017
.017
.117
.217
.317
.517
.717
.818
.018
.218
.318
.518
.719
.019
.219
.419
.719
.920
.1
North
Afri
ca a
nd M
iddl
e Ea
st19
.319
.619
.820
.020
.120
.220
.320
.320
.220
.220
.220
.220
.220
.320
.420
.620
.821
.021
.221
.321
.521
.721
.922
.2
Sout
h As
ia5.
75.
75.
85.
85.
96.
06.
05.
95.
75.
65.
55.
45.
45.
35.
35.
35.
35.
45.
45.
55.
55.
65.
65.
7
Sout
h-Ea
st A
sia,
Eas
t Asi
a an
d Oc
eani
a6.
36.
56.
77.
07.
37.
57.
88.
08.
38.
68.
89.
19.
39.
59.
79.
910
.110
.310
.610
.811
.111
.311
.511
.7
Sub-
Saha
ran
Afric
a8.
38.
48.
58.
68.
89.
09.
29.
39.
49.
59.
59.
69.
69.
79.
89.
99.
99.
99.
99.
89.
89.
89.
89.
9
Glob
al10
.911
.111
.211
.411
.611
.812
.012
.112
.312
.512
.612
.712
.913
.013
.113
.213
.313
.413
.613
.713
.813
.914
.014
.2
Girls
Cent
ral E
urop
e, E
aste
rn E
urop
e an
d Ce
ntra
l Asi
a17
.217
.217
.417
.317
.217
.217
.217
.217
.217
.417
.617
.818
.118
.418
.718
.919
.119
.319
.419
.519
.619
.719
.819
.9
High
-inco
me
(incl
udin
g Au
stra
lia)
18.1
18.3
18.4
18.5
18.7
19.0
19.3
19.7
20.1
20.5
20.8
21.0
21.2
21.3
21.4
21.5
21.6
21.7
21.7
21.8
21.9
22.0
22.0
22.1
Latin
Am
eric
a an
d Ca
ribbe
an18
.418
.719
.019
.319
.620
.020
.320
.520
.821
.021
.321
.621
.822
.022
.322
.522
.823
.023
.323
.623
.824
.024
.324
.5
North
Afri
ca a
nd M
iddl
e Ea
st24
.825
.225
.425
.625
.725
.926
.026
.126
.126
.126
.126
.226
.226
.326
.426
.626
.726
.927
.027
.127
.327
.527
.727
.9
Sout
h As
ia5.
65.
75.
75.
75.
85.
85.
85.
75.
65.
55.
55.
55.
65.
65.
65.
75.
75.
85.
95.
96.
06.
06.
16.
2
Sout
h-Ea
st A
sia,
Eas
t Asi
a an
d Oc
eani
a6.
66.
87.
07.
27.
57.
67.
87.
98.
08.
18.
38.
58.
68.
89.
09.
29.
49.
59.
79.
910
.010
.210
.310
.5
Sub-
Saha
ran
Afric
a9.
89.
910
.010
.110
.310
.510
.710
.911
.211
.411
.611
.812
.012
.212
.412
.612
.712
.712
.712
.612
.512
.412
.512
.5
Glob
al11
.411
.611
.811
.912
.112
.212
.312
.512
.612
.712
.913
.013
.213
.313
.513
.613
.713
.914
.014
.114
.214
.314
.414
.5
Child
ren
Cent
ral E
urop
e, E
aste
rn E
urop
e an
d Ce
ntra
l Asi
a16
.917
.017
.117
.117
.017
.017
.117
.117
.317
.417
.717
.918
.218
.518
.819
.119
.319
.419
.619
.619
.719
.819
.920
.0
High
-inco
me
(incl
udin
g Au
stra
lia)
19.2
19.4
19.5
19.6
19.8
20.0
20.4
20.7
21.1
21.5
21.7
22.0
22.2
22.4
22.5
22.6
22.7
22.8
22.8
22.9
23.0
23.1
23.1
23.2
Latin
Am
eric
a an
d Ca
ribbe
an17
.617
.817
.918
.118
.318
.418
.618
.819
.019
.219
.419
.619
.820
.020
.220
.420
.620
.821
.121
.421
.621
.822
.022
.3
North
Afri
ca a
nd M
iddl
e Ea
st22
.022
.422
.622
.722
.823
.023
.123
.123
.123
.123
.123
.123
.123
.223
.323
.523
.723
.924
.024
.224
.324
.524
.725
.0
Sout
h As
ia5.
65.
75.
85.
85.
85.
95.
95.
85.
75.
65.
55.
55.
55.
55.
55.
55.
55.
65.
65.
75.
75.
85.
85.
9
Sout
h-Ea
st A
sia,
Eas
t Asi
a an
d Oc
eani
a6.
56.
76.
97.
17.
47.
67.
88.
08.
28.
48.
68.
89.
09.
29.
49.
69.
810
.010
.210
.410
.610
.810
.911
.1
Sub-
Saha
ran
Afric
a9.
09.
19.
29.
49.
59.
79.
910
.110
.310
.410
.510
.710
.810
.911
.111
.211
.311
.311
.211
.211
.111
.111
.111
.2
Glob
al11
.211
.311
.511
.711
.812
.012
.212
.312
.412
.612
.712
.913
.013
.213
.313
.413
.513
.613
.813
.914
.014
.114
.214
.3
Sour
ce: G
loba
l Bur
den
of D
isea
se S
tudy
201
3 (G
BD 2
013)
Obe
sity
Pre
vale
nce
1990
–201
3. S
eattl
e, U
SA: I
nstit
ute
for H
ealth
Met
rics
and
Eval
uatio
n (IH
ME)
, 201
4.N
otes
: Pro
porti
on o
f peo
ple
aged
2–1
9 ye
ars.
BM
I cat
egor
ies
are
base
d on
the
IOTF
defi
nitio
ns fo
r peo
ple
unde
r age
18
year
s, a
nd th
e W
HO
defi
nitio
ns fo
r peo
ple
aged
18
year
s an
d ov
er. O
verw
eigh
t and
obe
sity
hav
e be
en c
ombi
ned.

National Heart Foundation of Australia Australian heart disease statistics 75
Chapter 7 – International comparisons
Tabl
e 7.
4 Tr
ends
in a
ge-s
tand
ardi
sed
prev
alen
ce o
f com
bine
d ov
erw
eigh
t and
obe
sity
, mod
elle
d es
timat
es, c
hild
ren
aged
2–1
9 ye
ars,
by
sex,
Aus
tral
ia a
nd
sele
cted
cou
ntri
es, 1
990
to 2
013
1990
1991
1992
1993
1994
1995
1996
1997
1998
1999
2000
2001
2002
2003
2004
2005
2006
2007
2008
2009
2010
2011
2012
2013Bo
ys
Aust
ralia
17.3
17.7
18.1
18.4
18.7
19.1
19.3
19.6
19.8
20.0
20.2
20.5
20.7
21.0
21.2
21.6
22.1
22.5
22.8
23.1
23.5
23.8
24.1
24.4
Cana
da19
.720
.020
.721
.322
.022
.723
.524
.325
.025
.626
.126
.526
.826
.926
.826
.526
.326
.025
.725
.525
.425
.325
.425
.5
Fran
ce19
.719
.920
.220
.320
.520
.721
.021
.121
.221
.221
.221
.121
.020
.720
.420
.220
.019
.819
.819
.719
.719
.819
.819
.9
Germ
any
16.9
16.9
16.9
16.8
17.0
17.2
17.5
17.7
18.1
18.5
18.8
19.1
19.4
19.5
19.7
19.8
19.9
20.0
20.0
20.1
20.2
20.3
20.4
20.5
Japa
n12
.012
.212
.512
.713
.013
.213
.614
.014
.515
.015
.616
.216
.717
.017
.116
.916
.516
.215
.815
.515
.315
.215
.215
.3
New
Zea
land
21.4
21.9
22.5
23.1
23.7
24.4
25.0
25.6
26.0
26.3
26.5
26.5
26.5
26.5
26.6
26.8
27.1
27.5
28.0
28.3
28.7
29.0
29.3
29.6
UK17
.517
.617
.918
.118
.418
.819
.420
.120
.821
.521
.922
.422
.923
.323
.723
.924
.124
.324
.625
.025
.425
.826
.026
.1
USA
21.2
21.6
21.9
22.2
22.4
22.8
23.4
24.5
25.6
26.8
28.0
28.9
29.7
30.1
30.2
30.1
30.0
29.8
29.6
29.4
29.2
29.0
28.9
28.8
Glob
al10
.911
.111
.211
.411
.611
.812
.012
.112
.312
.512
.612
.712
.913
.013
.113
.213
.313
.413
.613
.713
.813
.914
.014
.2
Girls
Aust
ralia
17.2
17.4
17.7
17.9
18.1
18.4
18.6
18.8
19.0
19.1
19.3
19.5
19.7
19.9
20.2
20.5
20.9
21.3
21.6
21.9
22.2
22.5
22.8
23.0
Cana
da17
.617
.818
.318
.719
.219
.720
.220
.921
.522
.022
.422
.823
.123
.323
.223
.022
.822
.622
.322
.122
.021
.922
.022
.0
Fran
ce15
.715
.916
.116
.216
.316
.516
.616
.716
.816
.816
.716
.616
.516
.416
.216
.115
.915
.815
.815
.815
.815
.915
.916
.0
Germ
any
15.8
15.9
16.1
16.1
16.4
16.7
17.1
17.3
17.6
17.8
18.0
18.2
18.3
18.4
18.5
18.6
18.6
18.8
18.9
19.0
19.1
19.2
19.3
19.4
Japa
n10
.210
.410
.610
.811
.111
.612
.112
.813
.514
.214
.715
.215
.515
.615
.615
.414
.914
.413
.813
.312
.912
.612
.412
.4
New
Zea
land
20.3
20.9
21.5
22.3
22.9
23.6
24.3
24.9
25.2
25.6
25.8
25.9
26.0
26.2
26.3
26.6
26.9
27.3
27.7
27.9
28.2
28.5
28.7
28.7
UK21
.021
.121
.521
.722
.222
.723
.524
.525
.325
.926
.226
.526
.827
.027
.227
.227
.227
.427
.728
.228
.729
.029
.229
.2
USA
22.4
22.5
22.4
22.2
22.2
22.3
22.9
24.0
25.3
26.9
28.4
29.6
30.4
30.7
30.7
30.5
30.4
30.2
30.1
30.1
30.0
30.0
29.8
29.7
Glob
al11
.411
.611
.811
.912
.112
.212
.312
.512
.612
.712
.913
.013
.213
.313
.513
.613
.713
.914
.014
.114
.214
.314
.414
.5
Child
ren
Aust
ralia
17.3
17.6
17.9
18.1
18.4
18.7
19.0
19.2
19.4
19.6
19.8
20.0
20.2
20.5
20.7
21.1
21.5
21.9
22.2
22.6
22.9
23.2
23.5
23.7
Cana
da18
.618
.919
.520
.120
.621
.221
.922
.723
.323
.924
.324
.725
.025
.125
.024
.824
.624
.324
.123
.823
.723
.723
.723
.8
Fran
ce17
.818
.018
.218
.318
.518
.718
.919
.019
.119
.119
.018
.918
.818
.618
.418
.218
.017
.917
.917
.817
.817
.917
.918
.0
Germ
any
16.4
16.4
16.5
16.5
16.7
17.0
17.3
17.5
17.9
18.2
18.4
18.7
18.9
19.0
19.1
19.2
19.3
19.4
19.5
19.6
19.7
19.8
19.9
20.0
Japa
n11
.111
.311
.611
.812
.112
.412
.913
.414
.014
.615
.215
.716
.116
.316
.416
.115
.715
.314
.814
.414
.114
.013
.913
.9
New
Zea
land
20.9
21.4
22.0
22.7
23.3
24.0
24.7
25.3
25.6
26.0
26.1
26.2
26.2
26.4
26.5
26.7
27.0
27.4
27.8
28.1
28.5
28.7
29.0
29.2
UK19
.219
.319
.619
.920
.320
.721
.422
.223
.023
.624
.024
.424
.825
.125
.425
.525
.625
.826
.226
.627
.027
.327
.527
.6
USA
21.8
22.0
22.2
22.2
22.3
22.5
23.2
24.2
25.5
26.8
28.2
29.2
30.0
30.4
30.5
30.3
30.2
30.0
29.9
29.7
29.6
29.5
29.3
29.2
Glob
al11
.211
.311
.511
.711
.812
.012
.212
.312
.412
.612
.712
.913
.013
.213
.313
.413
.513
.613
.813
.914
.014
.114
.214
.3
Sour
ce: G
loba
l Bur
den
of D
isea
se S
tudy
201
3 (G
BD 2
013)
Obe
sity
Pre
vale
nce
1990
–201
3. S
eattl
e, U
SA: I
nstit
ute
for H
ealth
Met
rics
and
Eval
uatio
n (IH
ME)
, 201
4.N
otes
: Pro
porti
on o
f peo
ple
aged
2–1
9 ye
ars.
BM
I cat
egor
ies
are
base
d on
the
IOTF
defi
nitio
ns fo
r peo
ple
unde
r age
18
year
s, a
nd th
e W
HO
defi
nitio
ns fo
r peo
ple
aged
18
year
s an
d ov
er. O
verw
eigh
t and
obe
sity
hav
e be
en c
ombi
ned.

Australian heart disease statistics National Heart Foundation of Australia76
Chapter 7 – International comparisons
Figure 7.4a Age-standardised prevalence of combined overweight and obesity, modelled estimates, boys aged 2–19 years, Australia and selected countries, 1990 to 2013
Figure 7.4b Age-standardised prevalence of combined overweight and obesity, modelled estimates, girls aged 2–19 years, Australia and selected countries, 1990 to 2013
30
30
35
35
20
20
25
25
15
15
5
5
10
10
0
0
1990
1991
1992
1993
1994
1995
1996
1997
1998
1999
2000
2001
2002
2003
2004
2005
2006
2007
2008
2009
2010
2011
2012
2013
1990
1991
1992
1993
1994
1995
1996
1997
1998
1999
2000
2001
2002
2003
2004
2005
2006
2007
2008
2009
2010
2011
2012
2013
Australia
Australia
Japan
Japan
Canada
Canada
New Zealand
New Zealand
France
France
UK
UK
Germany
Germany
USA
USA
Global
Global
Prop
ortio
n of
peo
ple
(%)
Prop
ortio
n of
peo
ple
(%)

National Heart Foundation of Australia Australian heart disease statistics 77
Chapter 7 – International comparisons
Figure 7.4d Trends in age-standardised prevalence of combined overweight and obesity, by country, girls aged 2–19 years, 1993 and 2013
Figure 7.4c Trends in age-standardised prevalence of combined overweight and obesity, by country, boys aged 2–19 years, 1993 and 2013
1993
1993
2013
2013
Total prevalence of overweight and obesity
< 2.5%
2.51 – 5%
5.01 – 7.5%
7.51 – 10%
10.01 – 12.5%
12.51 – 15%
15.01 – 17.5%
17.51 – 20%
20.01 – 22.5%
22.51 – 25%
25.01 – 27.5%
27.51 – 30%
30.01 – 32.5%
32.51 – 35%
>35%
Data not available
Total prevalence of overweight and obesity
< 2.5%
2.51 – 5%
5.01 – 7.5%
7.51 – 10%
10.01 – 12.5%
12.51 – 15%
15.01 – 17.5%
17.51 – 20%
20.01 – 22.5%
22.51 – 25%
25.01 – 27.5%
27.51 – 30%
30.01 – 32.5%
32.51 – 35%
>35%
Data not available

Australian heart disease statistics National Heart Foundation of Australia78
Chapter 7 – International comparisons

79
Chapter 8 Behavioural risk factors
National Heart Foundation of Australia Australian heart disease statistics
Key facts
• Adults who were overweight or obese were less likely to reach recommended levels of physical activity, and more likely to engage in excess sedentary behaviour.
• In both adults and children, the number of pedometer-measured steps per day was lower among those with higher BMI scores.
• Obese respondents had lower daily fibre intake and slightly higher total fat and saturated fat intakes than those classified as normal weight.
Australian heart disease statistics National Heart Foundation of Australia80
Chapter 8 – Behavioural risk factors
IntroductionBehaviours such as poor diet and low physical activity may cause overweight and obesity, leading to ischaemic heart disease. A diet high in energy-dense, high-fat foods and low in fruit and vegetables, along with physical inactivity, are key risk factors for overweight and obesity. This chapter looks at several key diet and activity risk factors, and how rates of these behaviours vary according to weight status. More detail on these two topics can be found in Australian heart disease statistics 2014,1 which includes a chapter on each of diet and physical activity.

National Heart Foundation of Australia Australian heart disease statistics 81
Chapter 8 – Behavioural risk factors
Tables and figures
Table 8.1 Prevalence of meeting physical activity guidelines, adults, by sex, age and BMI category, 2011–12
Underweight and normal weight Overweight Obese
Men
18–24 57.3 61.4 55.2
25–34 53.1 55.9 43.2
35–44 44.9 50.1 37.2
45–54 47.6 46.2 40.3
55–64 44.5 47.4 36.2
65–74 39.9 40.6 38.4
75+ 35.8 36.3 31.8
All men 49.3 49.2 39.7
Women
18–24 51.6 49.5 56.1
25–34 48.3 50.5 41.2
35–44 52.9 41.1 33.0
45–54 52.5 46.0 32.6
55–64 49.2 45.4 28.7
65–74 47.4 39.5 26.4
75+ 24.1 17.9 15.0
All women 49.1 42.6 32.7
Persons
18–24 54.1 59.6 52.1
25–34 50.3 53.7 43.3
35–44 50.2 46.9 35.4
45–54 51.4 46.1 37.0
55–64 47.6 46.3 32.2
65–74 44.8 41.0 32.1
75+ 28.7 28.0 21.4
All persons 49.2 46.7 36.1
Source: Australian Bureau of Statistics, 4324.0.55.003 - Microdata: Australian Health Survey, Core Content - Risk Factors and Selected Health Conditions, 2011–12Notes: Proportion of people aged 18 years and over. BMI categories were calculated from measured height and weight based on the WHO definitions for people aged 18 years and over. Underweight and normal weight categories have been combined and include respondents with BMI < 25 kg/m2. Australia’s Physical Activity and Sedentary Behaviour Guidelines for Adults (Department of Health) recommend at least 150 minutes and at least five sessions of moderate-intensity physical activity each week.

Australian heart disease statistics National Heart Foundation of Australia82
Chapter 8 – Behavioural risk factors
Underweight and normal weight Overweight Obese
Figure 8.1 Prevalence of meeting physical activity guidelines, adults, by sex and BMI category, 2011–12
0
10
20
30
40
60
50
Men Women
Prop
ortio
n of
peo
ple
(%)

National Heart Foundation of Australia Australian heart disease statistics 83
Chapter 8 – Behavioural risk factors
Table 8.2 Mean hours spent sitting or lying down in past week, adults, by sex, age and BMI category, 2011–12
Underweight and normal weight Overweight Obese
Men
18–24 37.2 37.3 40.3
25–34 43.8 45.5 47.2
35–44 43.8 45.5 47.3
45–54 38.7 44.1 45.8
55–64 38.7 41.9 44.9
65–74 31.9 35.5 34.2
75+ 24.3 32.8 30.8
All men 39.1 42.1 43.7
Women
18–24 39.2 38.2 37.1
25–34 40.9 38.7 37.5
35–44 35.3 33.4 36.1
45–54 32.2 34.7 40.4
55–64 30.9 37.0 35.9
65–74 33.5 34.6 32.6
75+ 28.9 28.6 37.0
All women 36.1 35.5 36.9
Persons
18–24 38.3 38.0 39.3
25–34 42.1 44.0 42.5
35–44 38.4 41.4 42.2
45–54 34.8 40.1 43.2
55–64 34.5 39.6 40.5
65–74 32.9 35.2 33.5
75+ 27.3 31.1 34.2
All persons 37.4 39.6 40.4
Source: Australian Bureau of Statistics, 4324.0.55.002 - Microdata: Australian Health Survey: Nutrition and Physical Activity, 2011–12Notes: Mean hours per week. People aged 18 years and over. Calculated from minutes per week spent sitting or lying down for work, transport and leisure activities. Excludes lying down for sleeping. BMI categories were calculated from measured height and weight based on the WHO definitions for people aged 18 years and over. Underweight and normal weight categories have been combined and include respondents with BMI < 25 kg/m2. Australia’s Physical Activity and Sedentary Behaviour Guidelines for Adults (Department of Health) recommend minimising the amount of time spent in prolonged sitting, as well as breaking up long periods of sitting as often as possible.

Australian heart disease statistics National Heart Foundation of Australia84
Chapter 8 – Behavioural risk factors
Underweight and normal weight Overweight Obese
Figure 8.2 Mean hours spent sitting or lying down in past week, adults, by sex and BMI category, 2011–12
0
10
5
20
25
15
30
35
40
45
50
Men Women
Mea
n ho
urs
per w
eek
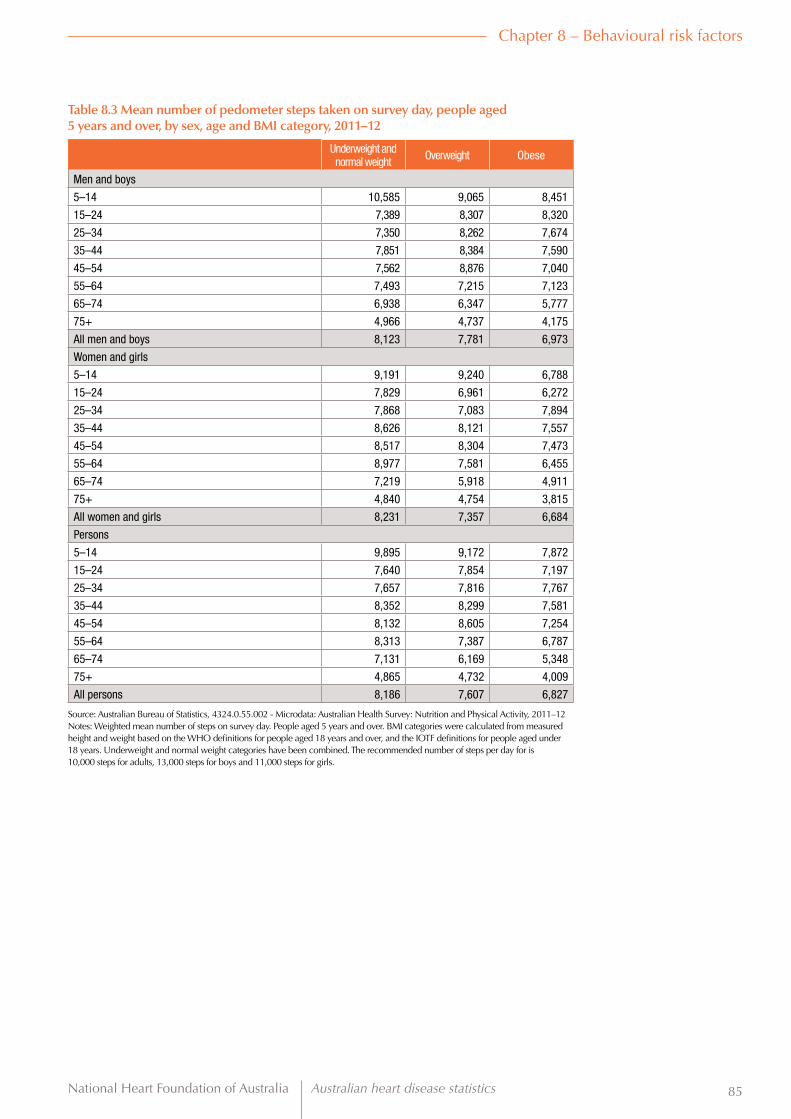
National Heart Foundation of Australia Australian heart disease statistics 85
Chapter 8 – Behavioural risk factors
Table 8.3 Mean number of pedometer steps taken on survey day, people aged 5 years and over, by sex, age and BMI category, 2011–12
Underweight and normal weight Overweight Obese
Men and boys
5–14 10,585 9,065 8,451
15–24 7,389 8,307 8,320
25–34 7,350 8,262 7,674
35–44 7,851 8,384 7,590
45–54 7,562 8,876 7,040
55–64 7,493 7,215 7,123
65–74 6,938 6,347 5,777
75+ 4,966 4,737 4,175
All men and boys 8,123 7,781 6,973
Women and girls
5–14 9,191 9,240 6,788
15–24 7,829 6,961 6,272
25–34 7,868 7,083 7,894
35–44 8,626 8,121 7,557
45–54 8,517 8,304 7,473
55–64 8,977 7,581 6,455
65–74 7,219 5,918 4,911
75+ 4,840 4,754 3,815
All women and girls 8,231 7,357 6,684
Persons
5–14 9,895 9,172 7,872
15–24 7,640 7,854 7,197
25–34 7,657 7,816 7,767
35–44 8,352 8,299 7,581
45–54 8,132 8,605 7,254
55–64 8,313 7,387 6,787
65–74 7,131 6,169 5,348
75+ 4,865 4,732 4,009
All persons 8,186 7,607 6,827
Source: Australian Bureau of Statistics, 4324.0.55.002 - Microdata: Australian Health Survey: Nutrition and Physical Activity, 2011–12Notes: Weighted mean number of steps on survey day. People aged 5 years and over. BMI categories were calculated from measured height and weight based on the WHO definitions for people aged 18 years and over, and the IOTF definitions for people aged under 18 years. Underweight and normal weight categories have been combined. The recommended number of steps per day for is 10,000 steps for adults, 13,000 steps for boys and 11,000 steps for girls.

Australian heart disease statistics National Heart Foundation of Australia86
Chapter 8 – Behavioural risk factors
Underweight and normal weight Overweight Obese
Figure 8.3 Mean number of pedometer steps taken on survey day, people aged 5 years and over, by sex and BMI category, 2011–12
0
9,000
7,000
8,000
6,000
5,000
4,000
3,000
2,000
1,000
Men and boys Women and girls
Mea
n st
eps
take
n pe
r day

National Heart Foundation of Australia Australian heart disease statistics 87
Chapter 8 – Behavioural risk factors
Table 8.4 Usual daily vegetable and fruit consumption, by sex and BMI category, adults, 2011–12
Underweight and normal weight Overweight Obese All BMI
categories
Usual daily vegetable consumption
Men
Less than 1 serve 6.5 7.0 7.3 7.0
1 to 2 serves 61.2 55.8 53.5 57.0
3 to 4 serves 27.4 28.7 32.6 29.3
5 or more serves 4.9 7.9 7.4 6.9
Women
Less than 1 serve 3.7 3.3 4.7 3.7
1 to 2 serves 54.9 49.3 45.9 50.9
3 to 4 serves 34.0 38.1 40.4 36.8
5 or more serves 7.8 9.1 9.3 8.6
Persons
Less than 1 serve 4.7 5.6 5.8 5.4
1 to 2 serves 57.6 53.2 49.3 54.0
3 to 4 serves 31.1 32.4 36.4 33.0
5 or more serves 6.6 8.5 8.1 7.7
Usual daily fruit consumption
Men
Less than 1 serve 22.3 22.0 25.7 23.0
1 serve 36.0 34.7 34.6 35.0
2 serves 26.1 26.9 23.3 25.9
3 or more serves 15.4 15.9 17.2 16.1
Women
Less than 1 serve 13.8 13.6 20.1 15.3
1 serve 32.8 32.1 27.9 31.3
2 serves 33.3 33.9 30.4 32.8
3 or more serves 20.1 20.8 20.8 20.4
Persons
Less than 1 serve 17.3 18.7 23.0 19.3
1 serve 34.2 33.7 31.3 33.2
2 serves 30.6 29.7 26.8 29.3
3 or more serves 18.3 17.7 19.0 18.3
Source: Australian Bureau of Statistics, 4324.0.55.002 - Microdata: Australian Health Survey: Nutrition and Physical Activity, 2011–2012Notes: Proportion of people aged 18 years and over. BMI categories were calculated from measured height and weight based on the WHO definitions for people aged 18 years and over. Average number of serves per day approximated from categorical responses (0 to 6 or more serves per day) to a question about usual consumption of vegetables or fruit. One serve is equivalent to 150 g fresh fruit or 75 g of cooked vegetables or salad. ‘Less than 1 serve’ includes people who do not eat vegetables and/or fruit. The ‘Underweight’ and ‘Normal weight’ categories have been combined and include respondents with BMI < 25 kg/m2.

Australian heart disease statistics National Heart Foundation of Australia88
Chapter 8 – Behavioural risk factors
Less than 1 serve
Less than 1 serve
1 to 2 serves
1 serve
3 to 4 serves
2 serves
5 or more serves
3 or more serves
Figure 8.4a Usual daily vegetable consumption, adults, by sex and BMI category, 2011–12
Figure 8.4b Usual daily fruit consumption, adults, by sex and BMI category, 2011–12
0
0
10
10
20
20
30
30
40
40
50
50
60
60
70
70
Underweight and normal weight
Underweight and normal weight
Underweight and normal weight
Underweight and normal weight
Overweight
Overweight
Overweight
Overweight
Obese
Obese
Obese
Obese
Prop
ortio
n of
peo
ple
(%)
Prop
ortio
n of
peo
ple
(%)
Men
Men
Women
Women
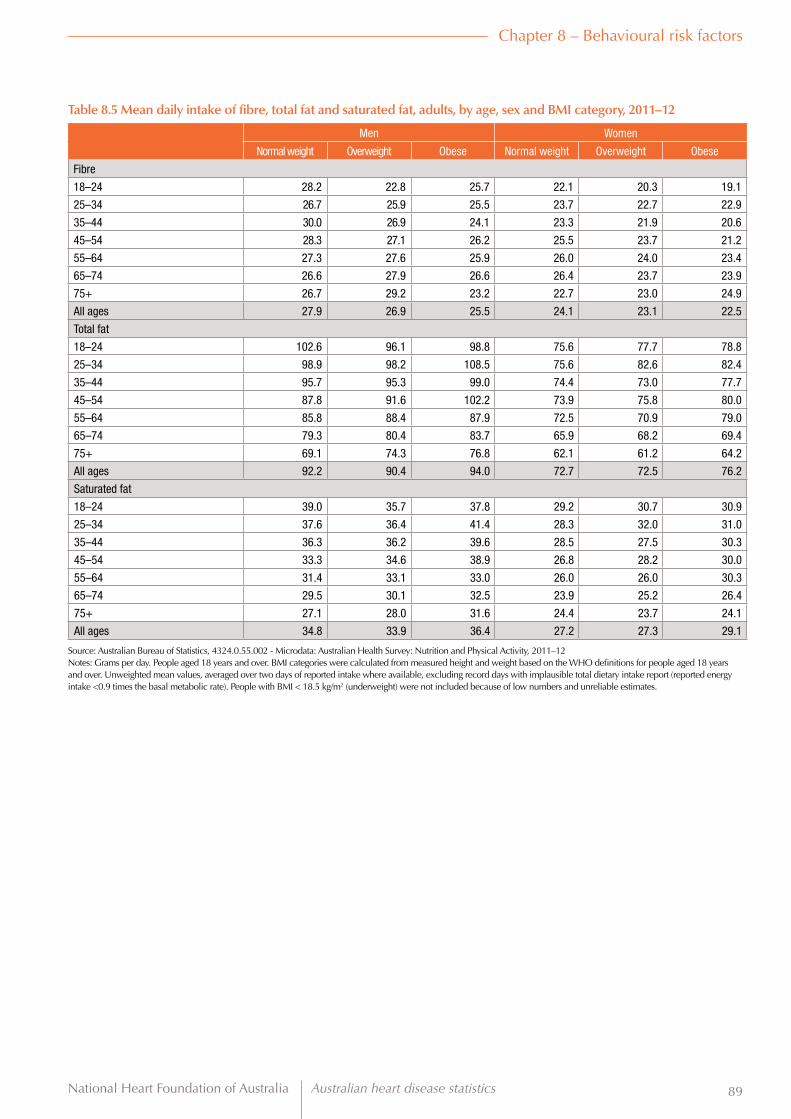
National Heart Foundation of Australia Australian heart disease statistics 89
Chapter 8 – Behavioural risk factors
Table 8.5 Mean daily intake of fibre, total fat and saturated fat, adults, by age, sex and BMI category, 2011–12
Men Women
Normal weight Overweight Obese Normal weight Overweight Obese
Fibre
18–24 28.2 22.8 25.7 22.1 20.3 19.1
25–34 26.7 25.9 25.5 23.7 22.7 22.9
35–44 30.0 26.9 24.1 23.3 21.9 20.6
45–54 28.3 27.1 26.2 25.5 23.7 21.2
55–64 27.3 27.6 25.9 26.0 24.0 23.4
65–74 26.6 27.9 26.6 26.4 23.7 23.9
75+ 26.7 29.2 23.2 22.7 23.0 24.9
All ages 27.9 26.9 25.5 24.1 23.1 22.5
Total fat
18–24 102.6 96.1 98.8 75.6 77.7 78.8
25–34 98.9 98.2 108.5 75.6 82.6 82.4
35–44 95.7 95.3 99.0 74.4 73.0 77.7
45–54 87.8 91.6 102.2 73.9 75.8 80.0
55–64 85.8 88.4 87.9 72.5 70.9 79.0
65–74 79.3 80.4 83.7 65.9 68.2 69.4
75+ 69.1 74.3 76.8 62.1 61.2 64.2
All ages 92.2 90.4 94.0 72.7 72.5 76.2
Saturated fat
18–24 39.0 35.7 37.8 29.2 30.7 30.9
25–34 37.6 36.4 41.4 28.3 32.0 31.0
35–44 36.3 36.2 39.6 28.5 27.5 30.3
45–54 33.3 34.6 38.9 26.8 28.2 30.0
55–64 31.4 33.1 33.0 26.0 26.0 30.3
65–74 29.5 30.1 32.5 23.9 25.2 26.4
75+ 27.1 28.0 31.6 24.4 23.7 24.1
All ages 34.8 33.9 36.4 27.2 27.3 29.1
Source: Australian Bureau of Statistics, 4324.0.55.002 - Microdata: Australian Health Survey: Nutrition and Physical Activity, 2011–12Notes: Grams per day. People aged 18 years and over. BMI categories were calculated from measured height and weight based on the WHO definitions for people aged 18 years and over. Unweighted mean values, averaged over two days of reported intake where available, excluding record days with implausible total dietary intake report (reported energy intake <0.9 times the basal metabolic rate). People with BMI < 18.5 kg/m2 (underweight) were not included because of low numbers and unreliable estimates.

Australian heart disease statistics National Heart Foundation of Australia90
Chapter 8 – Behavioural risk factors
Normal weight Overweight Obese
Figure 8.5 Mean daily intake of fibre, total fat and saturated fat, adults, by sex and BMI category, 2011–12
0
10
20
30
40
50
70
60
100
80
90
Men WomenWomen MenMen Women
Gram
s pe
r day
Fibre Total fat Saturated fat

National Heart Foundation of Australia Australian heart disease statistics 91
Chapter 9 Development and tracking
Key facts
• In the AusDiab longitudinal study, about 87% of people who were obese at baseline (1999–2000) were still obese at follow-up in 2011–12. An additional 24% of people who were overweight at baseline were obese at follow-up.
• Of AusDiab respondents who had high-risk waist circumferences at baseline, 93% were still at high risk 12 years later. Further, 47% of those who were low risk at baseline had become high risk by 2011–12.
• In the Longitudinal Study of Australian Children, 48% of children who were obese at age 4 years were still obese at age 12 years. Additionally, 17% of children who were overweight at age 4 years had become obese by age 12 years.

Australian heart disease statistics National Heart Foundation of Australia92
Chapter 9 – Development and tracking
IntroductionOne of the most important concerns about obesity is that once established it is likely to persist, particularly during childhood. Primary prevention remains the most important strategy to control obesity in the population because excess weight gain can be difficult to reverse. Children who become obese have a much higher chance of going on to be obese as adults, and it appears likely that the health effects are amplified for individuals who carry excess weight for long periods of their lives.19
The data presented in this chapter show the development and persistence of obesity, and the strength to which weight status ‘tracks’ or is maintained over time. This evidence comes from longitudinal studies where the same individuals are measured at two or more time points.

National Heart Foundation of Australia Australian heart disease statistics 93
Chapter 9 – Development and tracking
Tables and figures
Table 9.1 Prevalence of BMI categories, by baseline BMI category, adults aged 25 years and over, 2011–12
BMI category in 2011–12
Baseline BMI category (1999–2000) Underweight and normal weight Overweight Obese
Underweight and normal weight 67.3 31.1 1.6
Overweight 10.0 65.8 24.2
Obese 0.8 12.0 87.3
Source: Baker IDI Heart & Diabetes Institute, Australian Diabetes, Obesity and Lifestyle study, AusDiab 2012 reportNotes: Proportion of people aged 25 years and over who participated in both the 1999–2000 baseline study and the 2011–12 follow-up. Survey participants were measured for height, weight and waist circumference, and BMI categories were calculated from height and weight measurements based on the WHO definitions for people aged 18 years and over. Underweight and normal weight categories have been combined and include respondents with BMI < 25 kg/m2.
Underweight and normal weight
Overweight Obese
Figure 9.1 Prevalence of BMI categories, by baseline BMI category, adults aged 25 years and over, 2011–12
0
10
20
30
40
50
70
60
100
80
90
Underweight and normal weight Overweight Obese
Prop
ortio
n of
peo
ple
(%)
Baseline BMI category (1999–2000)
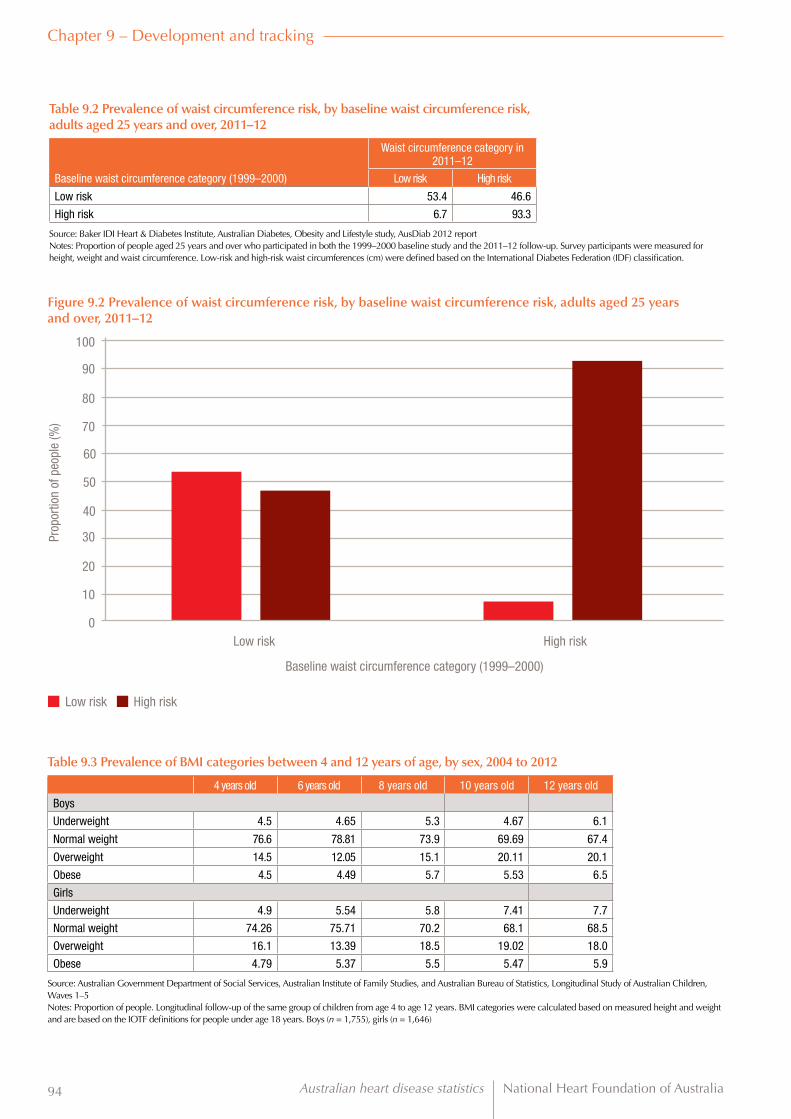
Australian heart disease statistics National Heart Foundation of Australia94
Chapter 9 – Development and tracking
Low risk High risk
Figure 9.2 Prevalence of waist circumference risk, by baseline waist circumference risk, adults aged 25 years and over, 2011–12
0
10
20
30
40
50
70
60
100
80
90
Low risk High risk
Prop
ortio
n of
peo
ple
(%)
Baseline waist circumference category (1999–2000)
Table 9.3 Prevalence of BMI categories between 4 and 12 years of age, by sex, 2004 to 2012
4 years old 6 years old 8 years old 10 years old 12 years old
Boys
Underweight 4.5 4.65 5.3 4.67 6.1
Normal weight 76.6 78.81 73.9 69.69 67.4
Overweight 14.5 12.05 15.1 20.11 20.1
Obese 4.5 4.49 5.7 5.53 6.5
Girls
Underweight 4.9 5.54 5.8 7.41 7.7
Normal weight 74.26 75.71 70.2 68.1 68.5
Overweight 16.1 13.39 18.5 19.02 18.0
Obese 4.79 5.37 5.5 5.47 5.9
Source: Australian Government Department of Social Services, Australian Institute of Family Studies, and Australian Bureau of Statistics, Longitudinal Study of Australian Children, Waves 1–5Notes: Proportion of people. Longitudinal follow-up of the same group of children from age 4 to age 12 years. BMI categories were calculated based on measured height and weight and are based on the IOTF definitions for people under age 18 years. Boys (n = 1,755), girls (n = 1,646)
Table 9.2 Prevalence of waist circumference risk, by baseline waist circumference risk, adults aged 25 years and over, 2011–12
Waist circumference category in 2011–12
Baseline waist circumference category (1999–2000) Low risk High risk
Low risk 53.4 46.6
High risk 6.7 93.3
Source: Baker IDI Heart & Diabetes Institute, Australian Diabetes, Obesity and Lifestyle study, AusDiab 2012 reportNotes: Proportion of people aged 25 years and over who participated in both the 1999–2000 baseline study and the 2011–12 follow-up. Survey participants were measured for height, weight and waist circumference. Low-risk and high-risk waist circumferences (cm) were defined based on the International Diabetes Federation (IDF) classification.

National Heart Foundation of Australia Australian heart disease statistics 95
Chapter 9 – Development and tracking
4 years old
4 years old
6 years old
6 years old
8 years old
8 years old
10 years old
10 years old
12 years old
12 years old
Figure 9.3a Prevalence of BMI categories between 4 and 12 years of age, boys, 2004 to 2012
Figure 9.3b Prevalence of BMI categories between 4 and 12 years of age, girls, 2004 to 2012
0
0
10
10
20
20
30
30
40
40
50
50
60
60
80
80
70
70
Underweight
Underweight
Obese
Obese
Normal weight
Normal weight
Overweight
Overweight
Prop
ortio
n of
peo
ple
(%)
Prop
ortio
n of
peo
ple
(%)

Australian heart disease statistics National Heart Foundation of Australia96
Chapter 9 – Development and tracking
Table 9.4 Tracking of BMI categories from age 4 to age 12 years, by sex, 2004 to 2012
Weight status at age 12 years
Weight status at age 4 years Underweight Normal weight Overweight Obese
Boys
Underweight (4.5% at age 4) 38.2 52.8 9.0 0.0
Normal (76.6% at age 4) 5.7 75.6 16.1 2.6
Overweight (14.5% at age 4) 0.7 39.6 40.7 18.9
Obese (4.5% at age 4) 0.0 14.8 35.2 50.0
All boys 6.1 67.4 20.1 6.5
Girls
Underweight (4.9% at age 4) 42.6 50.0 5.3 2.1
Normal (74.3% at age 4) 7.0 76.8 14.3 1.9
Overweight (16.1% at age 4) 0.3 45.6 39.5 14.6
Obese (4.8% at age 4) 1.1 12.5 39.8 46.6
All girls 7.7 68.5 18.0 5.9
Source: Australian Government Department of Social Services, Australian Institute of Family Studies, and Australian Bureau of Statistics, Longitudinal Study of Australian Children, Waves 1–5Notes: Proportion of people. This table shows longitudinal tracking of weight status categories in the same group of children from age 4 to age 12 years. BMI categories were calculated based on measured height and weight and are based on the IOTF definitions for people under age 18 years. Boys (n = 1,755), girls (n = 1,646)
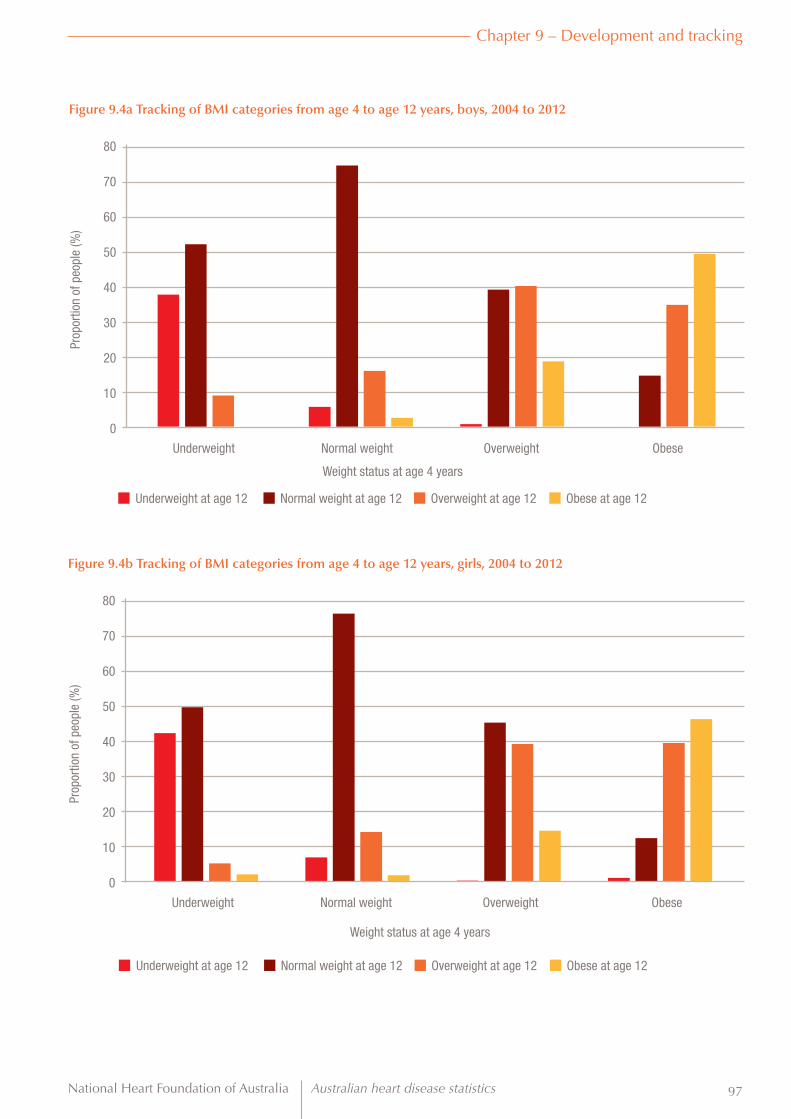
National Heart Foundation of Australia Australian heart disease statistics 97
Chapter 9 – Development and tracking
Underweight at age 12
Underweight at age 12
Normal weight at age 12
Normal weight at age 12
Overweight at age 12
Overweight at age 12
Obese at age 12
Obese at age 12
Figure 9.4a Tracking of BMI categories from age 4 to age 12 years, boys, 2004 to 2012
Figure 9.4b Tracking of BMI categories from age 4 to age 12 years, girls, 2004 to 2012
0
0
10
10
20
20
30
30
40
40
50
50
60
60
80
80
70
70
Underweight
Underweight
Obese
Obese
Normal weight
Normal weight
Overweight
Overweight
Prop
ortio
n of
peo
ple
(%)
Prop
ortio
n of
peo
ple
(%)
Weight status at age 4 years
Weight status at age 4 years

Australian heart disease statistics National Heart Foundation of Australia98
Abbreviations and acronymsAATSIHS Australian Aboriginal and Torres Strait Islander Health Survey
ABS Australian Bureau of Statistics
AHS Australian Health Survey
AIHW Australian Institute of Health and Welfare
ARIA+ Accessibility/Remoteness Index of Australia
ASGS Australian Statistical Geography Standard
AusDiab Australian Diabetes, Obesity and Lifestyle study
BMI body mass index
DALY disability-adjusted life year
GBD Global Burden of Disease study
HbA1c haemoglobin A1c, or glycosylated haemoglobin
IDF International Diabetes Federation
IHD ischaemic heart disease
IHME Institute for Health Metrics and Evaluation, University of Washington
IOTF International Obesity Task Force
IRSD Index of Relative Socioeconomic Disadvantage
NATSIHS National Aboriginal and Torres Strait Islander Health Survey
NHMRC National Health and Medical Research Council
NLSCY National Longitudinal Study of Children and Youth (Canada)
OPAL Obesity Prevention and Lifestyle
SA4 statistical area level 4
WHO World Health Organization

National Heart Foundation of Australia Australian heart disease statistics 99
References1. Nichols M, Peterson K, Alston L et al., Australian Heart Disease Statistics 2014. Melbourne: National Heart Foundation of Australia, 2014.
2. World Health Organization. Obesity and overweight. WHO fact sheet 311. Geneva: WHO, 2013. Available from: www.who.int/mediacentre/factsheets/fs311/en/. Accessed 4 March 2015.
3. World Health Organization. Obesity: preventing and managing the global epidemic. WHO technical report series 894. Geneva: WHO, 2000.
4. World Health Organization. Physical status: the use and interpretation of anthropometry. Report of a WHO Expert Committee. WHO technical report series 854. Geneva: WHO, 1995.
5. World Health Organization. Obesity: preventing and managing the global epidemic. Report of a WHO consultation. Geneva: WHO, 2000.
6. Cole TJ, Bellizzi MC, Flegal KM et al. Establishing a standard definition for child overweight and obesity worldwide: international survey. BMJ 2000; 320(7244):1240–1243.
7. Cole TJ, Flegal KM, Nicholls D et al. Body mass index cut offs to define thinness in children and adolescents: international survey. BMJ 2007; 335(7612):194–202.
8. Swinburn B, Wood A. Progress on obesity prevention over 20 years in Australia and New Zealand. Obes Rev 2013; 14 Suppl 2: 60–68.
9. Booth ML, Dobbins T, Okely AD et al. Trends in the prevalence of overweight and obesity among young Australians, 1985, 1997, and 2004. Obesity (Silver Spring) 2007; 15(5):1089–1095.
10. Ng M, Fleming T, Robinson M et al. Global, regional, and national prevalence of overweight and obesity in children and adults during 1980–2013: a systematic analysis for the Global Burden of Disease Study 2013. Lancet 2014; 384(9945):766–781.
11. Connor Gorber S, Tremblay M, Moher D et al. A comparison of direct vs. self-report measures for assessing height, weight and body mass index: a systematic review. Obes Rev 2007; 8(4):307–326.
12. Després J-P. Body fat distribution and risk of cardiovascular disease: an update. Circulation 2012; 126(10):1301–1313.
13. Australian Bureau of Statistics. 4364.0.55.003 - Australian Health Survey: Updated Results, 2011–2012, Canberra, Australia, 2013. Available from www.abs.gov.au/AUSSTATS/[email protected]/DetailsPage/4364.0.55.0032011-2012?OpenDocument. Accessed 30 January 2015.
14. Devaux M, Sassi F. Social inequalities in obesity and overweight in 11 OECD countries. Eur J Public Health 2013; 23(3):464–469.
15. Australian Bureau of Statistics. Australian Statistical Geography Standard (ASGS) 2014. Available from: www.abs.gov.au/websitedbs/D3310114.nsf/home/Australian+Statistical+Geography+Standard+(ASGS). Accessed 5 January 2015.
16. Australian Institute of Health and Welfare. Coronary heart disease and chronic obstructive pulmonary disease in Indigenous Australians. Canberra: AIHW, 2014.
17. Piers LS, Rowley KG, Soares MJ et al. Relation of adiposity and body fat distribution to body mass index in Australians of Aboriginal and European ancestry. Eur J Clin Nutr 2003; 57(8):956–963.
18. Institute for Health Metrics and Evaluation. GBD Compare Database. Seattle, Washington: University of Washington, 2014.
19. Singh AS, Mulder C, Twisk JW et al. Tracking of childhood overweight into adulthood: a systematic review of the literature. Obes Rev 2008; 9(5):474–488.
20. Haby MM, Markwick A, Peeters A et al. Future predictions of body mass index and overweight prevalence in Australia, 2005–2025. Health Promot Int 2012; 27(2):250–260.
21. James WPT, Jackson-Leach R, Mhurchu CN, et al. Overweight and obesity (high body mass index), Comp Qualif Health Risks, Geneva: World Health Organization, 497–596, 2004.
22. Australian Institute of Health and Welfare. Health expenditure Australia 2012–13. Canberra: AIHW, 2014.
23. Flegal KM, Kit BK, Orpana H et al. Association of all-cause mortality with overweight and obesity using standard body mass index categories: a systematic review and meta-analysis. JAMA 2013; January 2: 309(1):71–72.
24. Department of Human Services. Future prevalence of overweight and obesity in Australian children and adolescents, 2005–2025: Health status of Victorians, Department of Human Services, Victoria, Australia, 2008. Available from: www.health.vic.gov.au/healthstatus/composite/future_obesity.htm. Accessed 18 November 2013.
25. Finkelstein EA, Fiebelkorn IC, Wang G. National medical spending attributable to overweight and obesity: how much, and who’s paying? Health Aff 2013; Jan–Jun:Suppl Web Exclusives:W3-219–226.

Australian heart disease statistics National Heart Foundation of Australia100
Appendix 1 Health expenditure study and methodsby John Goss Centre for Research and Action in Public Health, Health Research Institute, University of Canberra
This appendix contains further information on how overweight and obesity are affecting health spending in Australia, which is described in this report in the feature section ‘Effect on health expenditure’.
The first part of this appendix contains further detail on the study of current and projected expenditure to 2032–32. The second part outlines methods used for estimating health expenditure, BMI and health expenditure attributable to BMI for Australia from 2011–12 to 2031–32.
This study builds on work that was done for the ACT Government’s Healthy Weight Initiative which estimated the proportion of ACT Government acute health expenditure that was due to elevated BMI.
Study on health expenditure for increased BMIThe feature ‘Effect of overweight and obesity on health expenditure’ refers to a new study that was undertaken for the Heart Foundation to analyse the effects of:
1. overweight and obesity on expenditure on cardiovascular disease and type 2 diabetes in 2011–12
2. increased overweight and obesity in 2021–22 and 2031–32 on projected cardiovascular disease and type 2 diabetes expenditure in those years.
The study projects cardiovascular diseases and type 2 diabetes expenditure to 2031–32 based on trends in expenditure on these diseases from 2000–01 to 2008–09, and projects increases in BMI based on trends from 1969 to 2004.20
The proportion of cardiovascular disease and type 2 diabetes expenditure from elevated BMI is calculated by first estimating the extra number of disease cases that arise from elevated BMI, and then estimating the expenditure necessary because of this greater incidence of disease.21
Health system expenditure
In 2011–12, Australian people spent about $130 billion on current health services. Of this, the Australian Government funded $56.7 billion (44%), state and territory governments funded $32.4 billion (25%) and the private sector funded $39.4 billion (31%).22
Of this total, it was estimated that $14.2 billion (10.9%) was spent for cardiovascular disease and $1.7 billion (1.3%) for type 2 diabetes.
Increase in overweight and obesity rates
Rates of overweight and obesity have been increasing across Australia in recent decades and are projected to increase further over the next 20 years. Average BMI is forecast to increase from 26.9 in 2011–12 to 28.5 in 2031–32 for men 20 years and over and from 25.9 (all 2011–12 figures estimated by J Goss from ABS data13) to 27.9 over the same period for women older than 20 years (estimated by J Goss). Therefore, the average BMI for the adult population is estimated to increase from 26.4 to 28.2. Thus, the number of adults who are obese would increase from 4.7 million to 9.6 million people (a 102% increase, or approximately double), and the number who are overweight would increase from 6.3 million to 8.4 million people (a 34%, or more than one-third, increase).
The proportion of the population 20 years and over who are obese is expected to increase from 28% of the population in 2011–1213 to 41% of the population in 2031–32, with the proportion overweight expected to decline slightly from 37% in 2011–1213 to 36% in 2031–32.
Current and future health costs for cardiovascular disease and type 2 diabetes
The disease costs for cardiovascular disease in 2011–12 were estimated to be $14.2 billion. This is 10.9% of total current expenditure in 2011–12. Cardiovascular expenditure is expected to increase by 260.6% in these two decades as compared to a 220.9% increase in total current health expenditure.
The health system costs of type 2 diabetes in 2011–12 were estimated to be $1.7 billion, which is 1.3% of total current expenditure. Expenditure for type 2 diabetes is expected to increase by 305.6% in the next two decades.

National Heart Foundation of Australia Australian heart disease statistics 101
Overall expenditure for cardiovascular disease and type 2 diabetes is expected to increase by 265% in the two decades to 2031–32 to $58 billion, which is 13.9% of expected current expenditure in 2031–32.
Current health expenditure for all disease is projected to grow 220.9% in constant prices in the next two decades, to $416 billion in 2031–32. Expenditure for admitted patient services is expected to grow 274%, for out-of-hospital medical services the growth in expenditure is expected to be 162% and for pharmaceuticals the expenditure growth is expected to be only 108%.
Cardiovascular and type 2 diabetes expenditure attributable to elevated BMI
Of the cardiovascular expenditure of $14.2 billion in 2011–12, $2.7 billion (or 19%) is estimated to be attributable to elevated BMI. In 2031–32, $11.4 billion of cardiovascular expenditure of $51.1 billion is attributable to elevated BMI. This is an extra $8.8 billion over the two decades, an increase of 322% from 2011–12.
Of the type 2 diabetes expenditure of $1.7 billion in 2011–12, $1.2 billion (or 71%) is attributable to elevated BMI. In 2031–32, $5.4 billion of the type 2 diabetes expenditure of $6.8 billion is attributable to elevated BMI. This is an increase of $4.2 billion over the two decades, an increase of 352%.
Effect of overweight compared to obesity
Elevated BMI has health consequences for overweight and obese people. Those in the overweight category (25 ≤ BMI ≤ 29.9) have elevated risk of disease, and those in the obese category (BMI ≥ 30) have much higher risks. However, there are more people overweight than obese, so although overweight people have lower risks of disease from elevated BMI, overweight is still responsible for a significant proportion of Australian health costs from elevated BMI.
For cardiovascular disease, 32% of costs attributable to BMI are from overweight people while 64% of these costs are attributable to those who are obese. Cardiovascular expenditure attributable to elevated BMI per overweight person is $141 and per obese person it was $369 in 2011–12.
For type 2 diabetes, only 20% of costs attributable to BMI are from overweight people but 78% of costs are attributable to obese people. Type 2 diabetes expenditure attributable to elevated BMI per overweight person is $38 and per obese person is $198.
Health expenditure estimation methods
Demographic data
Projections forward to financial year 2031–32 came from the Australian Bureau of Statistics Series B population projections.
The population data used in this study are estimates for the financial year. As the ABS estimates are for 30 June of each
year, financial year estimates are produced by averaging the 30 June population at the end of the year and the 30 June population at the end of the previous year.
BMI data
Data from the ABS Australian Health Survey for 2011–12 on measured height and weight and calculated BMI are used for the baseline estimates of BMI. For each age group and sex the ABS provides the proportions of the population who are underweight, normal weight, overweight and obese. From these numbers, the average BMI and standard deviation for each age sex group were estimated, and the resultant distribution of BMI by single unit of BMI was calculated for 2011–12.
Estimating health expenditure attributable to BMI
In estimating health expenditure attributable to BMI, the model first calculates the amount that elevated BMI contributes to the risk of each disease. It then calculates how much increasing the risk of disease increases service use. The cost of the increased services required because of the extra disease incidence is the extra expenditure attributable to elevated BMI.
The relative risk (hazard ratios) of developing disease for selected BMI points is set out below. Thus, the relative risk of 1.59 for BMI = 32 and age group 60–69 years for ischaemic heart disease means that the chance of a 60–69-year-old person with BMI = 32 experiencing a cardiac event is 59% higher than that of a 60–69-year-old person with BMI = 23 experiencing such an event.
The key assumption of the modelling is that this 59% higher chance of heart disease (cardiac events) translates into 59% higher admissions to hospital for ischaemic heart disease, resulting in 59% higher ischaemic heart disease inpatient treatment costs for the person with BMI = 32 than for a person in that age–sex group with BMI = 23. The 59% higher costs are then the costs attributable to elevated BMI.
Similar assumptions about the relationship between the chance of disease and the medical services and pharmaceutical prescription rate are made in order to estimate the proportion of medical services and pharmaceutical expenditure attributable to elevated BMI.
The relationship between disease incidence and BMI is controversial in the epidemiological literature.23 It was beyond the scope of this study to undertake a comprehensive and exhaustive epidemiological review of the major studies that investigate the relationship between BMI and disease. Therefore, the hazard ratios used in this model are derived from a study21 as part of the World Health Organization’s comprehensive assessment of health risks.

Australian heart disease statistics National Heart Foundation of Australia102
Table A1.1 Relative risk of developing disease by selected BMI points and age
BMI
23 27 32 35 38 ≥41
Ischaemic heart disease
45–59 1.00 1.46 2.34 3.10 3.10 3.10
60–69 1.00 1.23 1.59 1.85 2.05 2.05
70–79 1.00 1.18 1.44 1.63 1.77 1.77
80+ 1.00 1.13 1.32 1.44 1.53 1.53
Ischaemic stroke
45–59 1.00 1.40 2.12 2.72 2.72 2.72
60–69 1.00 1.28 1.75 2.10 2.38 2.38
70–79 1.00 1.28 1.75 2.10 2.38 2.38
80+ 1.00 1.08 1.20 1.27 1.33 1.33
Hypertensive disease
45–59 1.00 1.40 2.12 2.72 2.72 2.72
60–69 1.00 1.28 1.75 2.10 2.38 2.38
70–79 1.00 1.28 1.75 2.10 2.38 2.38
80+ 1.00 1.08 1.20 1.27 1.33 1.33
Type 2 diabetes
45–59 1.00 1.91 5.59 10.66 16.39 16.39
60–69 1.00 1.64 3.76 6.18 8.60 8.60
70–79 1.00 2.05 6.77 13.86 22.36 22.36
80+ 1.00 2.05 6.77 13.86 22.36 22.36
Source: Data on increase in chance of disease with a one-unit increase in BMI from James WPT, Jackson-Leach R, Mhurchu CN, et al. Overweight and obesity (high body mass index), Comp Qualif Health Risks, Geneva: World Health Organization, 497–596, 2004.
Projection of BMI
Mean BMI is assumed to increase from 2011–12 to 2031–32 at the rate estimated20,24 for 2015 to 2025; that is, an annual average increase in mean BMI of 0.27% for men and 0.38% for women.
Projection of expenditure
Cardiovascular and type 2 diabetes expenditure in 2011–12 is estimated by applying the growth rates in real cost per separation, medical service or pharmaceutical in the Australian health system from 2008–09 to 2011–12 to the 2008–09 disease-specific expenditure data. Total 2011–12 current health expenditure is from AIHW data.22
Current health expenditure is total health expenditure minus research expenditure and capital expenditure.
Expenditures for 2021–22 and 2031–32 by disease and total are estimated assuming that the real non-demographic growth rates of admitted patient, out-of-hospital medical service and prescribed pharmaceutical expenditure from 2000–01 to 2011–12 continue into the future. The period 2000–01 to 2011–12 was one of high health expenditure growth for Australia, underwritten by favourable economic growth. This high rate of health expenditure growth is unlikely to continue into the future unless high economic growth rates return.
Limitations of modelling approach
The modelling approach estimates the effects on costs of elevated BMI by estimating the cost of the extra cases of disease that are attributable to elevated BMI. The model does not estimate the extra treatment cost per case for obese people compared to people of normal weight. For example, it does not estimate the extra hospital costs of treating an obese person with heart disease compared to treating a normal-weight person with heart disease. Such costs can be significant.
Work in the USA using regression techniques estimates that total health spending attributable to overweight and obesity is greater than just the cost of the extra cases of disease arising from elevated BMI.25
The scope of this report does not extend beyond the monetary health system costs of elevated BMI. There are other direct and indirect costs including primary care costs, loss of productivity and social costs.
The overwhelming cost of overweight and obesity not measured here is the detriment to the health of people who live with overweight and obesity. Diabetes resulting from obesity causes some significant health system costs, but the effect on human health from impaired vision, neuropathy, circulatory problems and kidney disease is a much greater burden.

National Heart Foundation of Australia Australian heart disease statistics 103
Further reading on health expenditure study and methods• Asia Pacific Cohort Studies Collaboration. Body mass
index and cardiovascular disease in the Asia-Pacific Region: an overview of 33 cohorts involving 310 000 participants. Int J Epidemiol 2004; 33(4):751–758.
• Allman-Farinelli MA, Chey T, Bauman AE et al. Age, period and birth cohort effects on prevalence of overweight and obesity in Australian adults from 1990 to 2000. Eur J Clin Nutr 2008; 62(7):898–907.
• Australian Bureau of Statistics. 4364.0.55.003 - Australian Health Survey: Updated Results, 2011–2012, Canberra, Australia, 2013. Available from: www.abs.gov.au/AUSSTATS/[email protected]/DetailsPage/4364.0.55.0032011-2012?OpenDocument. Accessed 30 January 2015.
• Australian Institute of Health and Welfare. Health care expenditure on cardiovascular diseases 2000–01. Cat. no. AIHW 10046. Canberra: AIHW, 2004.
• Australian Institute of Health and Welfare. Costs of diabetes in Australia, 2000–01. Issue 26. Canberra: AIHW, 2005.
• Australian Institute of Health and Welfare. Health system expenditure on disease and injury in Australia, 2004–05. Health and welfare expenditure series no. 36. Cat. no. HSE 87. Canberra: AIHW, 2010.
• Australian Institute of Health and Welfare. Australian hospital statistics 2011–12. Health services series no. 50. Cat. no. HSE 134. Canberra: AIHW, 2013.
• Australian Institute of Health and Welfare. Diabetes expenditure in Australia 2008–09. Cat. no. CVD 62. Canberra: AIHW, 2013.
• Australian Institute of Health and Welfare. Health care expenditure on cardiovascular diseases 2008–09. Cat. no. CVD 65. Canberra: AIHW, 2014.
• Commonwealth of Australia. 2015 Intergenerational Report: Australia in 2055. Canberra: Australian Government, 2015.
• Department of Human Services. Future prevalence of overweight and obesity in Australian children and adolescents, 2005–2025: Health status of Victorians, Department of Human Services, Victoria, Australia, 2008. Available from: www.health.vic.gov.au/healthstatus/composite/future_obesity.htm. Accessed 18 November 2013.
• Ezzati M, Lopez AD, Rodgers A et al. Selected major risk factors and global and regional burden of disease. Lancet 2002; 360(9343):1347–1360.
• Finkelstein EA, Fiebelkorn IC, Wang G. National medical spending attributable to overweight and obesity: how much, and who’s paying? Health Aff 2013; Jan–Jun:Suppl Web Exclusives:W3-219–226.
• Flegal KM, Graubard BI, Williamson DF et al. Excess deaths associated with underweight, overweight and obesity. JAMA 2005; April 20:1861–1867.
• Flegal KM, Kit BK, Orpana H et al. Association of all-cause mortality with overweight and obesity using standard body mass index categories: a systematic review and meta-analysis. JAMA 2013; January 2: 309(1):71–72.
• Finucane MM, Stevens GA, Cowan MJ et al. National, regional, and global trends in body-mass index since 1980: systematic analysis of health examination surveys and epidemiological studies with 960 country-years and 9.1 million participants. Lancet 2011; 377(9765):557–567.
• Goss J. Projection of Australian health care expenditure by disease, 2003 to 2033. Australia Institute of Health and Welfare, Cat. no. HWE 43. Canberra: AIHW, 2008.
• Haby MM, Markwick A, Peeters A et al. Future predictions of body mass index and overweight prevalence in Australia, 2005–2025. Health Promot Int 2012; 27(2):250–260.
• Institute for Health Metrics and Evaluation 2012, Global burden of disease data base. Available from: www.healthdata.org/gbd/data. Accessed October 2014.
• James WPT, Jackson-Leach R, Mhurchu CN, et al. Overweight and obesity (high body mass index). Comp Qualif Health Risks. Geneva: World Health Organization, 497–596, 2004.
• Prospective Studies Collaboration. Body-mass index and cause-specific mortality in 900 000 adults: collaborative analyses of 57 prospective studies. Lancet 2009; 373(9669) 1083–1096.
• Walls HL, Wolfe R, Haby MM et al. Trends in BMI of urban Australian adults, 1980–2000. Public Health Nutr 2010; 13(5):631–638.

Australian heart disease statistics National Heart Foundation of Australia104
Notes

National Heart Foundation of Australia Australian heart disease statistics 105
Notes

Australian heart disease statistics National Heart Foundation of Australia106
Notes

National Heart Foundation of Australia Australian heart disease statistics 107
Notes

Australian heart disease statistics National Heart Foundation of Australia108
Notes


Suggested citation: Nichols M, Peterson K, Herbert J, Allender S. Australian heart disease statistics. Overweight, obesity and cardiovascular disease – past, present and future. Melbourne: National Heart Foundation of Australia, 2015.
ISBN 978-1-74345-108-3
© 2015 National Heart Foundation of Australia ABN 98 008 419 761
This work is copyright. No part of this publication may be reproduced in any form or language without prior written permission from the National Heart Foundation of Australia (national office). Enquiries concerning permissions should be directed to [email protected].
Disclaimer
This document has been produced by the National Heart Foundation of Australia for the information of health professionals. The statements and recommendations it contains are, unless labelled as ‘expert opinion’, based on independent review of the available evidence. Interpretation of this document by those without appropriate medical and/or clinical training is not recommended, other than at the request of, or in consultation with, a relevant health professional.
While care has been taken in preparing the content of this material, the Heart Foundation and its employees cannot accept any liability, including for any loss or damage, resulting from the reliance on the content, or for its accuracy, currency and completeness. The information is obtained and developed from a variety of sources including, but not limited to, collaborations with third parties and information provided by third parties under licence. It is not an endorsement of any organisation, product or service.
This material may be found in third parties’ programs or materials (including, but not limited to, show bags or advertising kits). This does not imply an endorsement or recommendation by the National Heart Foundation of Australia for such third parties’ organisations, products or services, including their materials or information. Any use of National Heart Foundation of Australia materials or information by another person or organisation is at the user’s own risk.
RES-114