
Australian Greenhouse Office - Global Islands Greenhouse Office Hydro Tasmania No 114419 October...
19
HYDRO ELECTRIC CORPORATION ARBN 072 377 158 ABN 48 072 377 158 4 Elizabeth Street, Hobart Tasmania, Australia Report for Australian Greenhouse Office Hydro Tasmania No 114419 October 2003 Contact: Andrew Wagner, 02 6274 1779 [email protected] Norfolk Island Renewable Energy Pre-Feasibility Study, Stage 1 Project Summary Final The concepts and information contained in this document are the property of the Hydro Tasmania. This document may only be used for the purposes of assessing our offer of services and for inclusion in documentation for the engagement of the Hydro Tasmania. Use or copying of this document in whole or in part for any other purpose without the written permission of the Hydro Tasmania constitutes an infringement of copyright.
Transcript of Australian Greenhouse Office - Global Islands Greenhouse Office Hydro Tasmania No 114419 October...

HYDRO ELECTRIC CORPORATION ARBN 072 377 158 ABN 48 072 377 158 4 Elizabeth Street, Hobart Tasmania, Australia
Report for
Australian Greenhouse Office
Hydro Tasmania No 114419 October 2003
Contact: Andrew Wagner, 02 6274 1779
Norfolk Island Renewable Energy Pre-Feasibility Study, Stage 1
Project Summary Final
The concepts and information contained in this document are the property of the Hydro Tasmania. This document may only be used for the purposes of assessing our offer of services and for inclusion in documentation for the engagement of the Hydro Tasmania. Use or copying of this document in whole or in part for any other purpose without the written permission of the Hydro Tasmania constitutes an infringement of copyright.

AGO – Norfolk Island Renewable Energy Pre- Feasibility Study, Stage One October 2003
DOCUMENT INFORMATION
TITLE:
NORFOLK ISLAND RENEWABLE ENERGY PRE-FEASIBILITY STUDY STAGE 1
– SUMMARY REPORT
DOCUMENT ID NUMBER: REVISION STATUS: Revision 9 DATE: October 2003
PREPARED BY:
Craig Morgan / Harry Andrews / Martin Grose / Narelle Jenkins/
Stewart Craine (Hydro Tasmania)
Stephen Schuck
(Bioenergy Australia)
Andrew McCowan (Water Technologies)
Brian White
(East Harbour Management Company, NZ)
REVIEWED BY:
Mark Rayner Damian Vermey
Stephen Schuck (Bioenergy Australia)
APPROVED BY: Simon Gamble
Hydro Tasmania i

AGO – Norfolk Island Renewable Energy Pre- Feasibility Study, Stage One October 2003
TABLE OF CONTENTS
1 EXECUTIVE SUMMARY..................................................................1
2 INTRODUCTION .........................................................................3 2.1 Existing Power System 3 2.2 Data Sources & Previous Studies 3 2.3 Future Energy Requirements 3 2.4 Resource Maps 4 2.5 Resource Quantities & Availability 5
3 PROJECT SUITABILITY .................................................................6 3.1 Project Scoring 7 3.2 Projects Assessed 7
3.2.1 Other Projects Not Assessed 8 3.2.2 Base Case Information 8
3.3 Decision Matrix Results 9 3.3.3 Discussion 9
3.4 Two Most Viable Technologies & Recommendations 13 3.4.4 Wind Project at Headstone 13 3.4.5 Biomass Gasification 15
4 STRATEGIC DIRECTIONS & RECOMMENDATIONSERROR! BOOKMARK NOT DEFINED.
5 RENEWABLE ENERGY RESOURCE MAPS........................................... 16
Hydro Tasmania ii
AGO – Norfolk Island Renewable Energy Pre- Feasibility Study, Stage One October 2003
1 EXECUTIVE SUMMARY
There are three Renewable Energy resources indigenous to Norfolk Island that could be used to generate in excess of 100% of the Island’s electricity needs: Wind, Wave, and Solar energy. Biomass could potentially deliver up to 24%, Hydroelectricity around 1%, and geothermal energy practically 0% under present conditions.
A number of projects have been assessed as suitable to Norfolk Island to harness these resources in the short term, with three rising to prominence. Two wind projects are located at Headstone and Steeles Point respectively, which appear viable for Wind turbine installations. They would deliver: cost-effective electricity; provide up to 33% of the Islands electricity; require minimal changes to the existing system; and potentially increase annual revenues to the government. The current diesel engines would continue to provide a significant proportion of the Island’s electricity. The third project is a small biomass plant that would run on screened green waste and wood processing waste. This project may be viable if the quantity and quality of the fuel source can be guaranteed into the future. Given the limitations of the decision matrix approach used in this study, the wind and biomass projects have roughly equivalent potential at this stage.
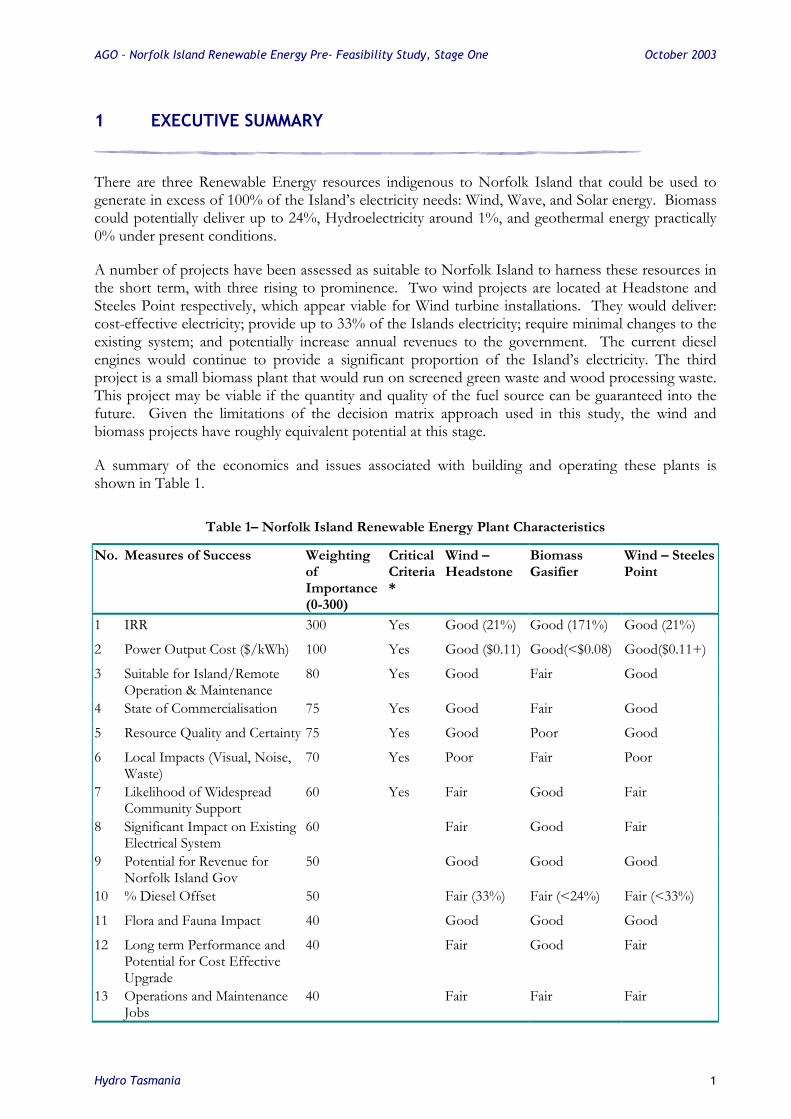
A summary of the economics and issues associated with building and operating these plants is shown in Table 1.
Table 1– Norfolk Island Renewable Energy Plant Characteristics
No. Measures of Success Weighting of Importance (0-300)
Critical Criteria*
Wind – Headstone
Biomass Gasifier
Wind – Steeles Point
1 IRR 300 Yes Good (21%) Good (171%) Good (21%)
2 Power Output Cost ($/kWh) 100 Yes Good ($0.11) Good(<$0.08) Good($0.11+)
3 Suitable for Island/Remote Operation & Maintenance
80 Yes Good Fair Good
4 State of Commercialisation 75 Yes Good Fair Good
5 Resource Quality and Certainty 75 Yes Good Poor Good
6 Local Impacts (Visual, Noise, Waste)
70 Yes Poor Fair Poor
7 Likelihood of Widespread Community Support
60 Yes Fair Good Fair
8 Significant Impact on Existing Electrical System
60 Fair Good Fair
9 Potential for Revenue for Norfolk Island Gov
50 Good Good Good
10 % Diesel Offset 50 Fair (33%) Fair (<24%) Fair (<33%)
11 Flora and Fauna Impact 40 Good Good Good
12 Long term Performance and Potential for Cost Effective Upgrade
40 Fair Good Fair
13 Operations and Maintenance Jobs
40 Fair Fair Fair
Hydro Tasmania 1

AGO – Norfolk Island Renewable Energy Pre- Feasibility Study, Stage One October 2003
Table 1 – Norfolk Island Renewable Energy Plant Characteristics Cont.
No. Measures of Success Weighting
of Importance (0-300)
Critical Criteria*
Wind – Headstone
Biomass Gasifier
Wind – Steeles Point
14 Impact on Tourism Industry 40 Good Good Good
15 Capital Cost (Unsubsidised) 35 Good($4.2m) Good(<$0.5m) Good(<$4.2m)
16 Time to full Commercialisation 30 Good Good Good
17 Meets Planning Requirements 30 Fair Good Poor
18 Construction Jobs 10 Poor Poor Poor
* Failure to meet one of these key criteria renders project unviable.
Ownership options have not been discussed in detail, but it would appear feasible for either the Community or the Norfolk Island Government to own the power station in the scenarios described above, as well as third parties. The station could be designed, built, installed and commissioned by third parties before handing it over to the Norfolk Island Government for ownership and operation.
Hydro Tasmania 2

AGO – Norfolk Island Renewable Energy Pre- Feasibility Study, Stage One October 2003
2 INTRODUCTION
Norfolk Island, located1 in the West Pacific Ocean, currently relies on diesel engines for its electricity needs. The Australian Greenhouse Office commissioned this study to investigate the potential for cost-effective reduction of diesel consumption through supply side options such as renewable energy, or demand side reductions through energy efficiency.
2.1 Existing Power System
Six 1MW diesel engines in a centrally located power station currently service the island’s electricity needs via a 6.6 kV distribution system. At any one time, only two engines are required to meet the system peak demand of 1.4 – 1.6 MW. There is a history of highly reliable power supply on the island and the load pattern is regularly diurnal, with little variation between summer and winter.
Power is currently sold at 38c/kWh to the consumer - the fuel component of this price is currently 18.6c/kWh. The remainder of the revenue is spent on the operation and maintenance of the network and power supply system, capital works, debt servicing, and other necessary functions.
The electricity supply system is owned and operated by the Norfolk Island Government and currently it returns a profit. In recent years rising fuel prices has eroded this return.
2.2 Data Sources & Previous Studies A large volume of previous work focussed specifically on Norfolk Island was made available to this assessment including studies on:
Electricity supply system;
Hydrology;
Biomass;
Solar project proposals;
Geography and geology;
Waste management; and
Others
As well as this, international data was sourced to complete the assessments of biomass, wind, wave geothermal, hydro and solar resources.
A site visit to Norfolk Island was conducted in June 2003 to gain an understanding of local conditions and opportunities, identify barriers to the implementation of renewable and other technologies and quantify some of the locally available resources.
2.3 Future Energy Requirements
Power consumption & demand has been relatively constant over the last four to six years. There have been legislative constraints on air conditioning and no real growth in tourism. Anecdotally,
1 Norfolk Island is located at a latitude and longitude of approximately 29o south and 168o east
Hydro Tasmania 3

AGO – Norfolk Island Renewable Energy Pre- Feasibility Study, Stage One October 2003
system reliability has been high with most operation and maintenance functions managed by the staff at the power station.
Any alterations to the power supply system should ideally maintain simplicity and reliability, reduce the generation cost, and increase the financial return to the Government. Furthermore, a renewable energy system should minimise its impact on the environment and the community.
2.4 Resource Maps
Each of the Renewable energy resources has been studied in some detail and documented in the attached appendices. An A1 “Norfolk Island Renewable Energy Resources Map” has also been developed as part of this study, and graphically represents the resource available to Norfolk Island.
Hydro Tasmania 4

AGO – Norfolk Island Renewable Energy Pre- Feasibility Study, Stage One October 2003
2.5 Resource Quantities & Availability The renewable energy resources assessed in this study included:
Biomass (farming, wet wastes, horticultural, solid waste, sewage, and others);
Solar insolation;
Wind Power;
Wave Power;
Geothermal reserves (high, medium and low temperature); and
Hydropower.
Results from the analysis are illustrated in Table 2. This table illustrates that only solar, wind and wave has the potential to supply all of the Island’s needs, however, a contribution may be made by biomass under the right circumstances. The analysis was of a preliminary nature and therefore more detailed reviews would need to be done prior to installing physical plant.
Table 2– Renewable Energy Resources available to Norfolk Island
Resource Indicator Area Required for generation facility Max contribution to Elect Supply (%)
Biomass Total available resource around 30,000 GJ/annum. (Green Waste up to 3,330 tonnes/annum & Wood Processing Waste up to 700 tonnes per annum).
Small plant footprint, some area required for biomass stockpile.
24%
Solar Insolation = 4.3 kWh/m2.day (equiv to Peak Sun Hours/day)
Land Area required for (18-20% renewable penetration*) = 10,000 m2
100%
Wind Wind speed = 6.5 m/s at Headstone, 7.4 m/s at Steeles Point
Footprint of turbines (at 33% renewable penetration*) = ~14m diameter .
Construction area of ~50m x 30 m required. May be up to 90m tall.
100%
Wave Median Wave Power = 14 – 20 kW/m of wave front. Higher at selected locations.
Shoreline required for shore-based oscillating water columns (at 30-40% penetration*) = ~600m
Area required for floating devices (at 30-40% penetration) = ~200 x 50m
100%
Geo-thermal
No high temperature resource likely Low temperature suitable for geothermal heat pumps only, small areas or vertical bores required.
0%
Hydro-power
Minor resources scattered across the island. Largest catchment 463 ML/annum at potential of 30m head.
Small footprint required to house turbine. Some trenching may be required for power cables or water piping.
1%
*Renewable penetration means that the renewable energy system would contribute around XX% of the electricity supply to the island.
Hydro Tasmania 5

AGO – Norfolk Island Renewable Energy Pre- Feasibility Study, Stage One October 2003
3 PROJECT SUITABILITY
Not all renewable energy technologies are suitable or desirable for application on Norfolk Island (irrespective of whether the resource is plentiful). In this study a “Decision Matrix” was used to filter and prioritise projects, with the objective of identifying two opportunities most likely to be applicable to Norfolk Island.
Firstly, the critical measures of success were identified and weighted in terms of importance based on our understanding of the environmental, social and political frameworks that may affect energy projects on Norfolk Island. These “Measures of Success” are described in Table 3. The weighting for each of these factors has been established on a scale of zero to three hundred, which allows significant factors to have influence over the final outcome.
The background discussion relating to the development of the ‘Measures of Success’ and their respective weighting can be found in Appendix 2. While every attempt was made to ensure that outcomes were not biased, the weighting system, scoring system, and measures of success remain subjective. Ultimately, the Norfolk Island Administration and Government will determine project suitability.
Table 3– Decision Matrix Assessment Factors & Weighting
No. Measures of Success Scores Allocated
Weighting of Importance
(0-300)
Critical or Key Criteria*
1 IRR 1,3 or 9 300 Yes 2 Power Output Cost 1,3 or 9 100 Yes 3 Suitable for Island/Remote Operation & Maintenance 1,3 or 9 80 Yes 4 State of Commercialisation 1,3 or 9 75 Yes 5 Resource Quality and Certainty 1,3 or 9 75 Yes 6 Local Impacts (Visual, Noise, Waste) 1,3 or 9 70 Yes 7 Likelihood of Widespread Community Support 1,3 or 9 60 Yes 8 Significant Impact on Existing Electrical System 1,3 or 9 60 9 Potential for Revenue for Norfolk Island Gov 1,3 or 9 50 10 % Diesel Offset 1,3 or 9 50 11 Flora and Fauna Impact 1,3 or 9 40 12 Long term Performance and Potential for Cost
Effective Upgrade 1,3 or 9 40
13 Operations and Maintenance Jobs 1,3 or 9 40 14 Impact on Tourism Industry 1,3 or 9 40 15 Capital Cost (Unsubsidised) 1,3 or 9 35 16 Time to full Commercialisation 1,3 or 9 30 17 Meets Planning Requirements 1,3 or 9 30 18 Construction Jobs 1,3 or 9 10
* Failure to meet one of these key criteria renders project unviable.
Hydro Tasmania 6

AGO – Norfolk Island Renewable Energy Pre- Feasibility Study, Stage One October 2003
3.1 Project Scoring
All projects identified in this study were found to have positive features, as well as drawbacks. Good performance against the criteria was given a score of nine (9), average performance was given a score of three (3), and poor performance was given a score of one (1). The levels at which projects were given a nine, three, or one are defined in detail in Appendix 2.
The scoring system was conducted according to a geometric progression score of 1, 3 or 9. When multiplied by the weighting factors, this allows important or positive project features to gain prominence amongst the eighteen Measures of Success. Table 6 summarises the scores that each project received.
In some cases, certain critical issues may render a project completely unviable. These issues are dealt with by using a zero (0) score where a project failed to meet one of the key Criteria (Measure of Success no. 1 to 7). A zero score in these cases would deem the project unviable.
3.2 Projects Assessed
Analysis of the major technologies and site conditions at Norfolk Island resulted in the following project list. A more detailed project description is attached in the appendices.
Table 4– Project List
Project Description
Wind - Headstone 1.2 MW of wind turbines located at Headstone (two turbines).
Wind - Steeles Point 1.2 MW of wind turbines located at Steeles Point (two turbines).
Biomass Gasifier & Diesel engine A 500 kWthermal biomass gasifier would need to be located near the powerhouse, with gas fed into one of the existing diesel engines.
Hydro - Cascade 5-10kW micro hydro turbine located at near Cascade Bay.
Hydro - Cascade & Stockyard 5-10kW micro hydro turbine located at near Cascade Bay, with flows coming from Stockyard and Cascade Creeks.
Wind - Headstone, Pump Storage Hydro
4.2 to 6 MW of wind would be located at Headstone (2-3 turbines), along with a seawater pump storage system at Headstone.
Solar Photovoltaic Panels 1MW of flat panel solar photovoltaic panels would be located centrally at the airport, Headstone, or distributed across the island.
Wind - Steeles Pt, Pump Storage Hydro
4.2 to 6 MW of wind would be located at Steeles Point (2-3 turbines), along with a seawater pump storage system at Headstone.
Wind - Headstone, Steeles Pt, Pump Storage Hydro
4.2 to 6 MW of wind would be located at Headstone and Steeles Point, along with a seawater pump storage system at Headstone.
Wave - OPT 500 kW Wave “Power buoy” system
Wave - OPT 750 kW Wave “Power buoy” system
Solar Photovoltaic Concentrator (Solar Systems)
TBA – Details not received in time for this report.
Wave - Waveplane & Ocean-based TAPCHAN's
No formal project identified
Wave - Marine Current Turbine No formal project identified
Wave - Oscillating Water Column No formal project identified
Wave - Land-based TAPCHAN No formal project identified
Hydro Tasmania 7

AGO – Norfolk Island Renewable Energy Pre- Feasibility Study, Stage One October 2003
3.2.1 Other Projects Not Assessed
Several other potential projects were identified but not studied in detail. These projects fell outside the scope of the existing study or were related to future energy consumption rather than existing energy consumption. These included:
Solar-Diesel-Pump-Storage systems;
Vanadium Redox Batteries, Hydrogen or Zinc Bromide Battery forms of energy storage;
Using waste heat from the diesel engines for desalination; and
Privately owned, grid connected Photovoltaic systems.
It is worth noting that commercial desalination plants that utilise waste heat from diesel engines exist e.g. on Nauru Island. Information on this plant was sought from the manufacturers but has not been received by the Study Team.
It is also worth noting that the current resistance by the Norfolk Island Government to allow privately owned Photovoltaic (PV) systems appears to originate from a concern for continued grid stability. It would seem appropriate to conduct a review of the impact of multiple small PV installations on the system and establish a defined limit (for example 100 kW in total) below which the impact on the system is negligible. While the Study Team has not assessed the level of a limit, it would allow enthusiasts and the Government to install systems that in turn would develop community support and awareness of renewable energy systems. Furthermore, the high capital cost of PV systems is expected to limit the uptake of private grid connected PV systems.
3.2.2 Base Case Information
In assessing the benefits of any renewable energy project, the following assumptions have been made based on information received from the Norfolk Island Government and Administration.
Table 5– Summary of Existing Electricity Supply
Assumptions (Approximations used)
Current average load of system 900 kW
Peak load 1,400 – 1,600 kW
Annual energy requirements 7,000,000 kWh/year
Current diesel system 6000 kW capacity
Operating efficiency 3.6 kWh/ltr
Annual fuel consumption 2,000,000 litres
Fuel costs 67 c/ltr
Annual fuel costs $1.34 million
Current marginal cost of generation (fuel only) $186/MWh (18.6 c/kWh)
Hydro Tasmania 8

AGO – Norfolk Island Renewable Energy Pre- Feasibility Study, Stage One October 2003
3.3 Decision Matrix Results
Figure 1 illustrates that the three most viable projects for Norfolk Island would appear to be:
Wind - located at Headstone
Wind – located at Steeles Point
Biomass Gasifier – located near the power house.
Figure 1 – Most Viable Renewable Energy Projects for Norfolk Island
3.3.3 Discussion
Biomass
The project outlining use of Biomass for energy production shows exceptional results. Green Waste and Wood Processing Waste could be gasified, and the resulting gas used in one of the existing diesel engines. A biomass plant for this purpose would have relatively low visual and noise impact when sited next to the existing powerhouse and would most likely deliver a strong financial return to the Government. The project, however, is reliant on one critical condition - that the biomass fuel quality and quantity could be guaranteed for the life of the project. Discussions with the Waste Management personnel on Norfolk Island have yet to establish the certainty or quality of biomass fuel supplies into the future. Competing uses for green waste is critical and if biomass is used for composting in the future or mulching is expanded, then the biomass project may become unviable. The level of fuel cost and availability require further detailed analysis.
Wind
Results from the decision matrix assessment show that Wind projects would be quite suitable for Norfolk Island in the short to medium term. Wind projects are able to meet 33% of electricity
Hydro Tasmania 9

AGO – Norfolk Island Renewable Energy Pre- Feasibility Study, Stage One October 2003
supplies and would achieve a strong economic benefit. A Wind project in conjunction with an energy storage system could supply 95% of the electricity requirement with a moderate economic benefit. A combined wind and energy storage project could be further extended to theoretically supply 100% of the island’s electricity needs, but this solution is not deemed practical at this point in time. Further investigation would need to be made into the ability for diesel engines to operate lightly loaded for a significant amount of time. There is some current research being conducted by Australian entities into this issue.
A wind project (not including storage) would reduce power costs and return good revenue for the Government using commercial technology with a proven track record. Wind power would be produced intermittently from wind turbines during all times of the day. The additional power required by the Norfolk Island system would be supplied from a potential energy storage system or the existing diesel engines. The potential for community opposition and high visual impact were the main weaknesses of a wind project.
Solar
While solar projects scored very highly against most “Measures of Success” they produce power at around twice the cost of current diesel supplies, fail to meet the critical IRR criteria and therefore, scored worse than the aforementioned wind and biomass projects. Merits of solar projects include noiseless operation, proven technology, relatively benign visual impact and the potential to be distributed across the island using existing roofing infrastructure. Solar energy could supply up to 60% of daytime electricity needs and combined with energy storage (to store energy captured during the day) solar could theoretically provide 100% of electricity needs. If the solar technology costs decrease significantly over time the technology could make a useful contribution to the Norfolk Island electricity supplies in the future.
Wave
In the longer term, wave energy could supply a substantial proportion of the island’s energy needs, (up to 100% with energy storage) however wave power technologies have two key barriers to overcome: (a) cost; and (b) long term operational experience. As a consequence, wave power projects did not score highly in the decision matrix. Wave power generation would, theoretically, have low visual impact (depending on the technology deployed) and due to the exceptional wave resource it would provide a significant amount of electricity to Norfolk Island. As the cost of wave power reduces and operational experience grows, this technology may replace or augment other electricity supply sources in the future.
Hydro
The catchment areas on Norfolk Island create water flows sufficient to supply no more than 1% of the Islands current electricity demand from hydroelectric sources. However, one or two very small projects could make a useful and innovative contribution to the electricity supply on the island. Two projects at Cascade and Stockyard scored relatively well due to the fact that these projects use proven technology; provide adequate economic returns; and do not have significant environmental impacts.
Geothermal
There is no substantial geothermal resource found on Norfolk Island useful for energy production. Therefore no projects were investigated.
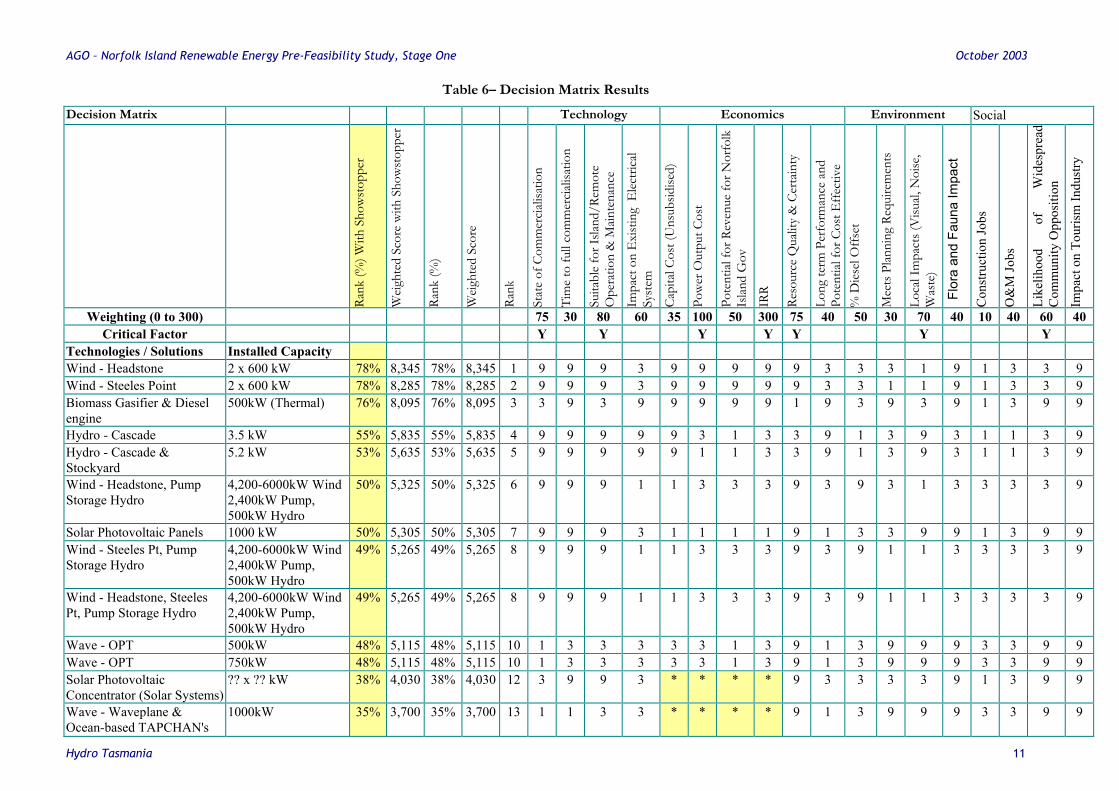
Results for all projects are shown in Table 6
Hydro Tasmania 10
AGO – Norfolk Island Renewable Energy Pre-Feasibility Study, Stage One October 2003
Table 6– Decision Matrix Results
Decision Matrix Technology Economics Environment Social
Rank
(%) W
ith S
how
stop
per
Wei
ghte
d Sc
ore
with
Sho
wst
oppe
r
Rank
(%)
Wei
ghte
d Sc
ore
Rank
Stat
e of
Com
mer
ciali
satio
n
Tim
e to
full
com
mer
ciali
satio
n
Suita
ble
for I
sland
/Rem
ote
Ope
ratio
n &
Main
tena
nce
Impa
ct o
n E
xist
ing
Ele
ctric
al Sy
stem
Capi
tal C
ost (
Uns
ubsid
ised)
Pow
er O
utpu
t Cos
t
Pote
ntial
for R
even
ue fo
r Nor
folk
Is
land
Gov
IRR
Reso
urce
Qua
lity
& C
erta
inty
Long
term
Per
form
ance
and
Po
tent
ial fo
r Cos
t Eff
ectiv
e %
Die
sel O
ffse
t
Mee
ts P
lanni
ng R
equi
rem
ents
Loca
l Im
pact
s (V
isual,
Noi
se,
Was
te)
Flor
a an
d Fa
una
Impa
ct
Con
stru
ctio
n Jo
bs
O&
M Jo
bs
Like
lihoo
d of
W
ides
prea
d C
omm
unity
Opp
ositi
on
Impa
ct o
n To
uris
m In
dust
ry
Weighting (0 to 300) 75 30 80 60 35 100 50 300 75 40 50 30 70 40 10 40 60 40 Critical Factor Y Y Y Y Y Y Y
Technologies / Solutions Installed Capacity Wind - Headstone 2 x 600 kW 78% 8,345 78% 8,345 1 9 9 9 3 9 9 9 9 9 3 3 3 1 9 1 3 3 9Wind - Steeles Point 2 x 600 kW 78% 8,285 78% 8,285 2 9 9 9 3 9 9 9 9 9 3 3 1 1 9 1 3 3 9Biomass Gasifier & Diesel engine
500kW (Thermal) 76% 8,095 76% 8,095 3 3 9 3 9 9 9 9 9 1 9 3 9 3 9 1 3 9 9
Hydro - Cascade 3.5 kW 55% 5,835 55% 5,835 4 9 9 9 9 9 3 1 3 3 9 1 3 9 3 1 1 3 9Hydro - Cascade & Stockyard
5.2 kW 53% 5,635 53% 5,635 5 9 9 9 9 9 1 1 3 3 9 1 3 9 3 1 1 3 9
Wind - Headstone, Pump Storage Hydro
4,200-6000kW Wind 2,400kW Pump, 500kW Hydro
50% 5,325 50% 5,325 6 9 9 9 1 1 3 3 3 9 3 9 3 1 3 3 3 3 9
Solar Photovoltaic Panels 1000 kW 50% 5,305 50% 5,305 7 9 9 9 3 1 1 1 1 9 1 3 3 9 9 1 3 9 9Wind - Steeles Pt, Pump Storage Hydro
4,200-6000kW Wind 2,400kW Pump, 500kW Hydro
49% 5,265 49% 5,265 8 9 9 9 1 1 3 3 3 9 3 9 1 1 3 3 3 3 9
Wind - Headstone, Steeles Pt, Pump Storage Hydro
4,200-6000kW Wind 2,400kW Pump, 500kW Hydro
49% 5,265 49% 5,265 8 9 9 9 1 1 3 3 3 9 3 9 1 1 3 3 3 3 9
Wave - OPT 500kW 48% 5,115 48% 5,115 10 1 3 3 3 3 3 1 3 9 1 3 9 9 9 3 3 9 9Wave - OPT 750kW 48% 5,115 48% 5,115 10 1 3 3 3 3 3 1 3 9 1 3 9 9 9 3 3 9 9Solar Photovoltaic Concentrator (Solar Systems)
?? x ?? kW 38% 4,030 38% 4,030 12 3 9 9 3 * * * * 9 3 3 3 3 9 1 3 9 9
Wave - Waveplane & Ocean-based TAPCHAN's
1000kW 35% 3,700 35% 3,700 13 1 1 3 3 * * * * 9 1 3 9 9 9 3 3 9 9
Hydro Tasmania 11

AGO – Norfolk Island Renewable Energy Pre-Feasibility Study, Stage One October 2003 Decision Matrix Technology Economics Environment Social
Rank
(%) W
ith S
how
stop
per
Wei
ghte
d Sc
ore
with
Sho
wst
oppe
r
Rank
(%)
Wei
ghte
d Sc
ore
Rank
Stat
e of
Com
mer
ciali
satio
n
Tim
e to
full
com
mer
ciali
satio
n
Suita
ble
for I
sland
/Rem
ote
Ope
ratio
n &
Main
tena
nce
Impa
ct o
n E
xist
ing
Ele
ctric
al Sy
stem
Capi
tal C
ost (
Uns
ubsid
ised)
Pow
er O
utpu
t Cos
t
Pote
ntial
for R
even
ue fo
r Nor
folk
Is
land
Gov
IRR
Reso
urce
Qua
lity
& C
erta
inty
Long
term
Per
form
ance
and
Po
tent
ial fo
r Cos
t Eff
ectiv
e %
Die
sel O
ffse
t
Mee
ts P
lanni
ng R
equi
rem
ents
Loca
l Im
pact
s (V
isual,
Noi
se,
Was
te)
Flor
a an
d Fa
una
Impa
ct
Con
stru
ctio
n Jo
bs
O&
M Jo
bs
Like
lihoo
d of
W
ides
prea
d C
omm
unity
Opp
ositi
on
Impa
ct o
n To
uris
m In
dust
ry
Weighting (0 to 300) 75 30 80 60 35 100 50 300 75 40 50 30 70 40 10 40 60 40 Critical Factor Y Y Y Y Y Y Y
Technologies / Solutions Installed Capacity Wave - Marine Current Turbine
750kW 0% 0 30% 3,205 14 0 1 3 3 * * * * 9 1 3 9 3 9 3 3 9 9
Wave - Oscillating Water Column
750kW 28% 3,030 28% 3,030 15 3 1 3 3 * * * * 9 3 3 1 3 3 3 3 9 9
Wave - Land-based Tapchan 750kW 28% 3,010 28% 3,010 16 3 3 3 3 * * * * 9 3 3 1 1 3 9 3 9 9*Shaded Cells = No reliable data available Rank (%) With Showstopper = If there is a zero for any score, then equals 0% Weighted Score With Showstopper = If there is a zero for any score, then equals zero Rank (%) = Weighted Score ÷ Highest Possible Weighted Score (used to illustrate relative performance) Weighted Score = (Score x Weighting)1 + (Score x Weighting)2 + … +(Score x Weighting)18 Rank = Highest to lowest “Weighted score”
Hydro Tasmania 12

AGO – Norfolk Island Renewable Energy Pre- Feasibility Study, Stage One October 2003
3.4 Two Most Viable Technologies & Recommendations
The three most viable technologies established by the decision matrix are wind projects at Headstone and Steeles Point, and a biomass project. Figure 1 illustrates that these three projects stand apart from the other projects that were assessed. It should also be noted that the difference between the projects is probably within the bounds of uncertainty and limitations of the decision matrix approach. Therefore several key factors could be considered in choosing the two projects for further investigation.
Two critical issues exist for Steeles Point Wind project and the bio-energy plant. In regard to Steeles Point the noise from the wind turbines may be at a significant level for houses located within 800 m of the turbines. In regard to a bio-energy plant the fuel supply certainty and fuel quality needs to be better established. We therefore recommend the following approach:
A 1.2 MW wind project located at Headstone should be investigated further (Stage 2 of this study). A project at Steeles Point could use some of the same data and could be conducted relatively easily at a later stage.
The second project should be a Biomass Gasifier project. A key aspect of the study would be establishing fuel requirement and capital costs for such a system.
3.4.4 Wind Project at Headstone
A relatively small wind project at Headstone would reduce power costs and provide increasing financial returns to the Government. Furthermore, the project is costed on a 20-year project life and does not preclude expanding the installation using wind, wave, solar or other technologies in the future; adding an energy storage system at a later date; or decommissioning at the end of the project life.
The preliminary economic analysis results are illustrated in Table 7 This demonstrates that the project, on a financial basis, is definitely worth investigating further due to the projected power supply price.
Table 7– Headstone Wind Project Parameters
Item Wind project at an average wind speed of 7 m/s
Installed Wind Turbines 1.2 MW (2 x 600 kW)
Wind System costs $4.2m
RE system capital costs (Without subsidy)
$4.2m
RE System Capital costs (With 50% subsidy)
$2.1m
IRR 21.1%
Hydro Tasmania 13

AGO – Norfolk Island Renewable Energy Pre- Feasibility Study, Stage One October 2003
Table 7 – Headstone Wind Project Parameters
Cont.
Item Wind project at an average wind speed of 7
m/s
NPV $2.01 M
NPV/Subsidised Capital Costs 84%
Renewable Energy Penetration 33%
Renewable Energy Certificate Revenue $0.03/kWh
Power Supply Price at discount rate of 8.5%, and project life of 20 years
$0.11/kWh
A wind project is unlikely to be economic if the average wind speed at hub height is less than 6.0 m/s, furthermore actual measured data would be required to support a business case for a wind energy project. To progress a wind energy development, a wind-monitoring tower with measuring equipment at hub height (40-50 m) would need to be installed on the most acceptable site and a pre-feasibility study initiated.
Figure 2 illustrates the extent of an 800 m noise buffer zone around a wind turbine located at Steeles Point and at Headstone.
!
!
Point HowePoint Vincent
Duncombe Bay
Cascade Bay
Steels Point
Point Blackbourne
Ball Bay
Collins Head
Sydney Bay
Point Ross
Cemetry Bay
Rocky Point
HeadstonePoint
AnsonPoint
Burnt Pine
Norfolk Island Airport
Kingston
Point Hunter
LegendCreeks
800m buffer of potential wind turbine locations
Headstone Water Reservoir
Oscillating Water Column Power Generators
Offshore Floating or Subsurface Power Generators
N
Figure 2 – Potential Wind Turbine Sites & Maximum 800m Noise Buffer Zones
Hydro Tasmania 14

AGO – Norfolk Island Renewable Energy Pre- Feasibility Study, Stage One October 2003
3.4.5 Biomass Gasification2
A gasification plant that produced combustible gas from biomass would ideally be co-located at the existing power station. The combustible gas would be used in its own spark ignition gas engine, or can be co-fired with diesel in one of the existing engines. A 100-200 kW electric system may be viable given the estimated wood waste on the Island. While this is not a large project, it could supply a proportion of the base-load if 24-hour operation was acceptable.
The preliminary economic analysis results are illustrated in Table 8 This demonstrates that the project, on a financial basis, is worth investigating further due to the projected low power supply price, and low installed capital costs.
Table 8– Biomass Gasifier Project parameters
Item Case A
Installed Biomass Gasifier 200 kW electrical
RE system capital costs (Without subsidy)
$326,600
RE System Capital costs (With 50% subsidy)
$163,300
IRR 163%
NPV $1.88 million
NPV/Subsidised Capital Costs >1100%
Renewable Energy Penetration 22%
Power Supply Price at discount rate of 8.5%, and project life of 15 years
<$0.08/kWh
2 Gasification operates by starving the heating process of oxygen, to produce a combustible gas rich in carbon monoxide and hydrogen. For gasifiers operating using air as the gasification medium, a low calorific gas is produced with a heating value of approximately 5 MJ/Nm3. This gas may be cleaned and used in spark ignition engines, or may be dual-fired with diesel.
Hydro Tasmania 15

AGO – Norfolk Island Renewable Energy Pre- Feasibility Study, Stage One October 2003
Hydro Tasmania 16
4 RENEWABLE ENERGY RESOURCE MAPS
The renewable energy resource map for Norfolk Island is a separate document.