Australian Ganoderma: Identification, Growth ... · 2.4.1 Cultivation of Ganoderma to Produce...
271
Australian Ganoderma: Identification, Growth & Antibacterial Properties Submitted in total fulfilment of the requirements for the degree of Doctor of Philosophy By Lyndal Margaret Roberts Environment and Biotechnology Centre School of Engineering and Science Swinburne University of Technology July 2004
-
Upload
trinhxuyen -
Category
Documents
-
view
220 -
download
3
Transcript of Australian Ganoderma: Identification, Growth ... · 2.4.1 Cultivation of Ganoderma to Produce...

Australian Ganoderma:
Identification, Growth & Antibacterial
Properties
Submitted in total fulfilment of the requirements for the degree of
Doctor of Philosophy By
Lyndal Margaret Roberts
Environment and Biotechnology Centre School of Engineering and Science
Swinburne University of Technology
July 2004

Abstract
i
Abstract
Ganoderma species are one of the most widely researched fungi because of their
reported potent bioactive properties. Although there is much information related to
American, European and Asian isolates, little research has been conducted on
Australian Ganoderma isolates. Ganoderma may only be imported into Australia under
strict quarantine conditions, therefore, the isolation of a native strain that possesses
bioactivity may be industrially and commercially significant. Three Australian species
of this wood-decomposing fungus were isolated in northern Queensland. In this study,
they have been identified as three separate species. Further, they have been studied to
determine their optimal growth conditions in liquid culture and assessed for their
antibacterial properties.
Phylogeny inferred from the Internal Transcribed Spacer Regions (ITS) from the DNA
sequences resolved the three Australian Ganoderma species into separate clades. Two
isolates were identified to be isolates of Ganoderma cupreum (H1) and Ganoderma
weberianum (H2). The third isolate could only be identified to the genus level,
Ganoderma species, due to the lack of informative data that could be used for
comparison.
The effects of short term and long term storage on the viability of the fungi were
investigated on agar plates, agar slants and balsa wood at varying temperatures ranging
from 10 to 45°C. The most appropriate storage conditions were determined to be –80ºC
on balsa wood chips for periods of up to 2 years without subculture, and on agar slants
at 4°C for up to a maximum of eight weeks. Light was observed to be detrimental to the
survival of Ganoderma H1 and Ganoderma H2 during storage. Growth trials using
potato dextrose agar plates determined the optimal temperature and pH for mycelial
growth to be 30°C and a pH of 6, for all isolates. Subsequent growth trials in liquid
media found that glucose, as the carbohydrate source, supported the greatest mycelial
growth of Ganoderma H1 and Ganoderma H2 and that galactose and fructose supported
the greatest growth of Ganoderma H3.

Abstract
ii
Aqueous (hot water) and organic (hexane (HEX), dichloromethane (DCM), ethyl
acetate (EtOAc), methanol (MeOH)) extracts from the liquid cultivated mycelium were
assessed for their antibacterial activity using disc diffusion assays. Extracts from the
mycelium of Ganoderma H1 exhibited activity against a greater number of Gram
positive bacteria than those from Ganoderma H2 and H3. Subsequent studies on the
DCM and EtOAc extracts from Ganoderma H1 determined the MIC and MBC against a
number of Gram positive bacteria, including Bacillus cereus, B. subtilis, Enterococcus
faecalis, Streptococcus pyogenes, Staphylococcus aureus, S. epidermidis and Listeria
monocytogenes, as well as Clostridium species, including Clostridium perfringens, C.
sporogenes and C. difficile, and some methicillin resistant Staphylococcus aureus
(MRSA) strains. Time course growth assays confirmed that the DCM and EtOAc
extracts predominantly exhibited bactericidal activity. Finally, the active compounds
were determined to be terpenoid in structure with some phenolic groups attached.

Acknowledgements
iii
Acknowledgements
A number of people have been instrumental in providing me with help, direction and
support throughout this PhD journey. My principle supervisor, Professor Greg
Lonergan, thank you for giving me the opportunity to discover the amazing world of
fungi. Associate Professor Russell Crawford, your continued support and
encouragement has been a source of inspiration. Thank you for not only being a
fabulous supervisor but also for being a friend. Dr Enzo Palombo, you have been a
fantastic mentor and I sincerely appreciate all your efforts in helping me achieve this
goal. I also thank you for providing me with the opportunity to teach, an invaluable and
rewarding experience. Thank you to all my colleagues and friends within the
Environment and Biotechnology Centre, particularly Danni Tilmanis, you have all
contributed in making this journey an enjoyable one.
I would like to thank the CRC for International Food Manufacture and Packaging
Science who awarded me my stipend, Mr Henk Voogt (Karunda, Queensland) who
found these wild specimens growing in the Cairns State forest and Dr Brendan Smith
(Division of Forestry Products, CSIRO, Canberra) who kindly offered with the
identification and confirmation of the species.
I send my love and many a thank you to all my wonderful friends, those friends I have
known for a long time and those who I have made along the way. Thankyou for being
so patient. Finally, I am ready to Party! My dear family, Mum, Dad, Karen, Sarah and
Catherine. Thank you for your encouragement and for being so proud of my efforts.
Your love and excitement has helped me believe in myself. The Gibbs family,
especially Sandra and Phil, thank you also for the love and support that you have given
me throughout this process.
Finally, I would like to thank the most beautiful, gorgeous partner a person can have,
Gerard Gibbs. Your constant love, patience and understanding have been my strength
throughout this long journey. At last….. time will be our time.

Declaration
iv
Declaration
I hereby declare, that to the best of my knowledge, this thesis contains neither material
which has been accepted for the award to the candidate of any other degree or diploma,
or any material previously published or written by another person, except where due
reference is made in the text of the thesis, and; Where the work is based on joint
research or publications, the thesis discloses the relative contributions of the respective
workers or authors; I also declare that this thesis has been professionally edited,
however, the extent of the editing addressed only the style and grammar of the thesis,
and not its substantive content.
-----------------------------------------
Lyndal M. Roberts

Table of Contents
v
Table of Contents
ABSTRACT………………………………………………………………...i
ACKNOWLEDGEMENTS………………………………………...……..iii
DECLARATION……………………………………………………… … iv
TABLE OF CONTENTS…………………………………………………..v
LIST OF TABLES…………………………………………………….. ….xi
LIST OF FIGURES…………………………………………………… .. xiii
ANNOTATION……………………………………………………….. ...xvi
CHAPTER ONE............................................................................................1 Introduction ...................................................................................................1 1.1 NATURAL PRODUCTS INDUSTRY ..........................................................................2 1.2 KINGDOM FUNGI ..................................................................................................3 1.3 BASIDIOMYCETES AS SOURCES OF BIOACTIVE SUBSTANCES................................4 1.3.1 Medicinal Basidiomycetous Fungi ..................................................................5 1.3.2 Australian Ganoderma ....................................................................................6 1.4 AIMS OF THIS INVESTIGATION..............................................................................7
CHAPTER TWO...........................................................................................9 Literature Review ..........................................................................................9 2.1 GANODERMATACEAE .........................................................................................10 2.1.1 Classification of Ganoderma.........................................................................10 2.1.2 History of Ganoderma...................................................................................11 2.1.3 Medicinal Ganoderma...................................................................................11 2.2 SYSTEMATICS OF GANODERMA ...........................................................................12 2.2.1 Molecular Systematics of Ganoderma ..........................................................14 2.2.1.1 Internal Transcribed Spacer (ITS) Regions.............................................15 2.2.1.2 Endonuclease Restriction Digestions ......................................................16 2.2.1.3 Isoenzymes ..............................................................................................17 2.2.2 Phylogenetic Analysis ...................................................................................17 2.3 PRESERVATION AND MAINTENANCE OF FUNGAL CULTURES..............................19 2.4 CULTIVATION OF GANODERMA SPECIES..............................................................20 2.4.1 Cultivation of Ganoderma to Produce Fruiting Bodies ................................20 2.4.2 Cultivation on a Solid Agar Medium ............................................................21 2.4.3 Cultivation of Ganoderma in Liquid Medium ..............................................22 2.4.3.1 Investigation of Growth Parameters in Liquid Culture ...........................23

Table of Contents
vi
2.4.3.2 Effect of Culture Medium on Mycelial Biomass ....................................23 2.4.3.3 Effect of the Environment on Mycelial Biomass ....................................24 2.4.4 Investigation of Growth Parameters for Bioactive Compounds....................26 2.4.5 Effect of Species and Strain on Ganoderma Growth ....................................27 2.5 BIOACTIVE SUBSTANCES IN GANODERMA SPECIES .............................................28 2.5.1 Polysaccharides from Ganoderma ................................................................30 2.5.1.1 Structure of Polysaccharides ...................................................................30 2.5.1.2 Isolation of Mushroom Polysaccharides .................................................31 2.5.1.3 Polysaccharide Mode of Action ..............................................................32 2.5.2 Triterpenoids, Sterols and Related Compounds ............................................32 2.5.2.1 Structure and Naming of Triterpenoids...................................................33 2.5.2.2 Isolation of Triterpenes ...........................................................................33 2.5.2.3 Triterpenoid Mode of Action ..................................................................35 2.5.2.4 Bitter Triterpenoids .................................................................................35 2.5.2.5 Other Steroidal Constituents ...................................................................35 2.5.3 Proteins ..........................................................................................................36 2.5.4 Lectins ...........................................................................................................36 2.6 BIOMEDICAL APPLICATIONS ..............................................................................37 2.6.1 Cytotoxic Antitumour Activity .....................................................................37 2.6.2 Hypoglycaemic Activity................................................................................38 2.6.3 Inhibition of DNA Polymerases and Other Enzymes ...................................38 2.6.4 Influence on Aggregation of Platelets ...........................................................39 2.6.5 Hypolipidimic Activity..................................................................................40 2.6.6 Inhibition of Histamine Release ....................................................................40 2.6.7 Hepatoprotective ...........................................................................................40 2.6.8 Antioxidants ..................................................................................................41 2.6.9 Wound Management .....................................................................................41 2.7 ANTIMICROBIAL COMPOUNDS............................................................................42 2.7.1 Antibacterial Activity ....................................................................................43 2.7.1.1 Activity of Mushroom Extracts ...............................................................43 2.7.1.2 Antibacterial Extracts from Ganoderma .................................................45 2.7.2 Antifungal Activity........................................................................................46 2.7.3 Antiviral Activity ..........................................................................................46 2.8 OVERVIEW .........................................................................................................47
CHAPTER THREE.....................................................................................49 Materials and Methods ................................................................................49 3.1 CHEMICALS AND REAGENTS ..............................................................................50 3.1.1 Chemicals ......................................................................................................50 3.1.2 Enzymes ........................................................................................................50 3.1.3 Buffers ...........................................................................................................50 3.2 STERILISATION...................................................................................................51 3.3 FREEZE DRYING .................................................................................................51 3.4 PH DETERMINATION AND ADJUSTMENT.............................................................51 3.5 ORGANISMS........................................................................................................51 3.5.1 Basidiomycetous Fungi .................................................................................51

Table of Contents
vii
3.5.2 Storage of Basidiomycetous Fungi................................................................51 3.5.3 Test Organisms..............................................................................................52 3.5.3.1 Bacteria and Culture Conditions .............................................................52 3.5.3.2 Storage of Bacterial Organisms...............................................................52 3.5.3.3 Test Fungi................................................................................................54 3.6 NUTRIENT MEDIA ..............................................................................................54 3.6.1 Fungal Growth Media ...................................................................................55 3.6.2 Bacterial Growth Media ................................................................................56 3.6.3 Media used to Propagate E. coli Carrying Recombinant Plasmids...............56 3.7 FUNGAL MAINTENANCE.....................................................................................56 3.7.1 Storage on Slants ...........................................................................................56 3.7.2 Storage under Mineral Oil .............................................................................57 3.7.3 Storage in Water ............................................................................................57 3.7.4 Storage on Wood ...........................................................................................57 3.8 INCUBATION OF FUNGAL CULTURES ..................................................................57 3.8.1 Static Cultures ...............................................................................................57 3.8.2 Shaker Flasks Cultures ..................................................................................57 3.9 AGAR CULTIVATION TECHNIQUES .....................................................................58 3.9.1 Slant Preparation ...........................................................................................58 3.9.2 Plate Preparation............................................................................................58 3.9.3 Sub Culturing ................................................................................................58 3.9.4 Radial Growth Zone Measurements..............................................................58 3.9.5 Mycelial Growth Rate ...................................................................................59 3.10 BROTH CULTIVATION TECHNIQUES....................................................................59 3.10.1 Shaker Flask Preparation...............................................................................59 3.10.2 Mycelial Mat and Fragment Inoculation .......................................................59 3.10.3 Separation of Biomass from the Culture Medium.........................................60 3.11 LIQUID - SOLID EXTRACTIONS ...........................................................................60 3.11.1 Hot Water Aqueous Extraction .....................................................................60 3.11.2 Organic Extraction ........................................................................................60 3.12 CHROMATOGRAPHY ...........................................................................................61 3.12.1 Gravity Column Chromatography.................................................................61 3.12.2 Thin Layer Chromatography (TLC)..............................................................61 3.12.3 Preparative TLC ............................................................................................62 3.13 ANTIBACTERIAL ASSAYS ...................................................................................62 3.13.1 Disc Diffusion Assay.....................................................................................62 3.13.2 Minimum Inhibitory Concentration (MIC) ...................................................62 3.13.3 Minimum Bactericidal Concentration (MBC) ..............................................63 3.13.4 Time Kill Assay.............................................................................................63 3.13.5 Bioautography Agar-Overlay ........................................................................64 3.14 PHYTOCHEMISTRY .............................................................................................64 3.14.1 Detection Reagents........................................................................................65 3.14.1.1 Anisaldehyde – Sulphuric Acid (AS) ......................................................65 3.14.1.2 Vanillin Sulphuric Acid (VS)..................................................................65 3.14.1.3 Liebermann – Burchard Reagent (LBr)...................................................65 3.14.1.4 Potassium Hydroxide (KOH) ..................................................................65 3.14.1.5 Kedde Reagent ........................................................................................65
Table of Contents
viii
3.14.1.6 Natural Products - Polyethylene Glycol (NP-PEG) ................................66 3.14.1.7 Fast Blue Salt (FBS)................................................................................66 3.14.1.8 Berlin Blue Reagent (BB) .......................................................................66 3.14.1.9 Fluorescein ..............................................................................................66 3.14.1.10 Iodine.......................................................................................................66 3.14.1.11 Folin-Ciocalteu Reagent..........................................................................67 3.14.1.12 Aluminium Chloride................................................................................67 3.14.1.13 Dragendorff Reagent ...............................................................................67 3.15 EXTRACTION OF DNA FROM FUNGI...................................................................67 3.16 OLIGONUCLEOTIDE PRIMERS FOR PCR AND SEQUENCING.................................68 3.17 ELECTROPHORESIS OF DNA...............................................................................69 3.17.1 Agarose Gel Electrophoresis .........................................................................69 3.17.2 Polyacrylamide Gel Electrophoresis (PAGE) ...............................................69 3.18 POLYMERASE CHAIN REACTION (PCR) OF FUNGAL DNA REGIONS..................69 3.19 PURIFICATION OF DNA ......................................................................................70 3.19.1 Purification of DNA from Agarose Gels.......................................................70 3.19.2 Purification of Recombinant DNA from E. coli............................................71 3.20 ENZYMATIC MODIFICATIONS OF DNA...............................................................71 3.20.1 Restriction Digest of Recombinant DNA......................................................71 3.20.2 Restriction Enzyme Digestion of PCR DNA ................................................72 3.21 CLONING OF THE FUNGAL ITS I AND ITS II REGION .........................................72 3.21.1 Plasmids used for Cloning.............................................................................72 3.21.2 Cloning into pT7Blue-3.................................................................................72 3.21.3 Cloning into pGEM®-T Easy ........................................................................73 3.21.4 Blue / White Screening for Recombinant Plasmids ......................................73 3.22 DNA SEQUENCING ............................................................................................74 3.23 SEQUENCE DATA ANALYSIS...............................................................................74
CHAPTER FOUR .......................................................................................77 Molecular and Phylogenetic Analysis.........................................................77 4.1 INTRODUCTION...................................................................................................78 4.2 OVERVIEW .........................................................................................................78 4.3 RESULTS AND DISCUSSION.................................................................................79 4.3.1 Isolation of Three Australian Ganoderma Species .......................................79 4.3.2 Molecular Analysis........................................................................................80 4.3.2.1 DNA Extraction and Amplification by Polymerase Chain Reaction
(PCR).......................................................................................................80 4.3.2.2 Restriction Fragment Length Polymorphism (RFLP) .............................81 4.3.2.3 Sequencing of the Purified PCR Fragment .............................................87 4.3.2.4 Cloning of the Purified PCR Fragment ...................................................88 4.3.2.4.1. Cloning into pGEM-T Easy Vector System..........................................88
4.3.2.4.2. Restriction Digest Analysis of the Recombinant Plasmids .....................88
4.3.2.5 Sequencing of the Recombinant Vectors ................................................93 4.3.3 Phylogenetic Analysis ...................................................................................95

Table of Contents
ix
4.3.3.1 Sequence Alignment................................................................................96 4.3.3.2 Evolutionary Trees ..................................................................................96 4.3.3.3 Intraspecies Sequence Divergence ........................................................102 4.3.3.4 Taxonomic Conclusion..........................................................................105 4.4 SUMMARY ........................................................................................................106
CHAPTER FIVE.......................................................................................109 Preservation and Mycelial Growth Optimisation......................................109 5.1 INTRODUCTION.................................................................................................110 5.2 OVERVIEW .......................................................................................................110 5.3 RESULTS AND DISCUSSION...............................................................................111 5.3.1 Preservation and Viability of Ganoderma H1, H2 and H3 .........................111 5.3.1.1 Long Term Preservation ........................................................................111 5.3.1.2 Short Term Preservation........................................................................114 5.3.2 Examination of Standard Growing Conditions ...........................................117 5.3.2.1 Effect of pH and Temperature on the Radial Growth of
Fungal Mycelia......................................................................................118 5.3.2.2 Growth Rate of Fungal Mycelia on PDA Plates ...................................122 5.3.2.3 Effect of Growth Media on Fungal Biomass in Shaker Flask Cultures 123 5.3.2.4 Effect of Carbohydrate Source on Mycelial Biomass Production.........128 5.4 SUMMARY ........................................................................................................132
CHAPTER SIX .........................................................................................135 Mycelial Extraction and Antibacterial Activity ........................................135 6.1 INTRODUCTION.................................................................................................136 6.2 OVERVIEW .......................................................................................................136 6.3 RESULTS & DISCUSSION ..................................................................................137 6.3.1 Preliminary Antibacterial Investigations of Ganoderma H1, H2 & H3......137 6.3.1.1 Aqueous Extraction of the Mycelium from Ganoderma H1,
H2 & H3 ................................................................................................137 6.3.1.2 Antibacterial Activity Screening of the Aqueous Extracts from
Ganoderma H1, H2 and H3 ..................................................................139 6.3.1.3 Organic Extraction of the Mycelium from Ganoderma H1, H2 & H3 .142 6.3.1.4 Antibacterial Activity Screening of the Organic Extracts from
Ganoderma H1, H2 and H3 ..................................................................145 6.3.2 Investigation of the Antibacterial Activity of Ganoderma H1 Organic
Extracts ..................................................................................................148 6.3.2.1 Organic Extraction of the Mycelium Cultivated in Three Different
Growth Media........................................................................................148 6.3.2.2 Antibacterial Activity of the Organic Extracts from the Mycelium
Grown in Different Cultivation Media ..................................................151 6.3.2.3 Antibacterial Activity of the Organic Extracts Against Clinical
MRSA and VRE Isolates.......................................................................155 6.3.2.4 Comparison of Crude Extracts from the Liquid Cultivated Mycelium
of Ganoderma H1..................................................................................157

Table of Contents
x
6.3.2.5 Antibacterial Activity of the Organic Extracts Against Clostridium isolates ...................................................................................................158
6.3.2.6 Minimum Inhibitory Concentration (MIC) and Minimum Bactericidal Concentration (MBC) of the Organic Extracts .................161
6.3.2.7 Time Kill Assay.....................................................................................171 6.3.3 Antifungal Activity......................................................................................175 6.4 SUMMARY ........................................................................................................176
CHAPTER SEVEN...................................................................................181 Preliminary Identification of Bioactive Components ...............................181 7.1 INTRODUCTION.................................................................................................182 7.2 OVERVIEW .......................................................................................................183 7.3 RESULTS & DISCUSSION ..................................................................................183 7.3.1 Crude Extract Composition and Active Components .................................183 7.3.2 Bioassay-Guided Fractionation of the DCM Extract ..................................188 7.3.2.1 Fractionation No. 1................................................................................189 7.3.2.2 Fractionation No. 2................................................................................191 7.3.3 Detection of Classes of Compounds ...........................................................198 7.3.3.1 Alkaloids and Lipids .............................................................................200 7.3.3.2 Phenols ..................................................................................................201 7.3.3.3 Flavonoids and Coumarins ....................................................................201 7.3.3.4 Anthracene Derivatives .........................................................................202 7.3.3.5 Terpenoids .............................................................................................202 7.3.3.6 Preliminary Identification of the Active Components ..........................204 7.4 SUMMARY ........................................................................................................206
CHAPTER EIGHT....................................................................................209 Conclusion.................................................................................................209 8.1 IDENTIFICATION OF THREE AUSTRALIAN GANODERMA ISOLATES ....................210 8.2 STORAGE AND GROWTH OF THREE AUSTRALIAN GANODERMA ISOLATES ........210 8.3 ANTIBACTERIAL PROPERTIES ...........................................................................212 8.4 IDENTIFICATION OF ACTIVE COMPONENTS.......................................................213 8.5 CLOSE ..............................................................................................................214
GLOSSARY..............................................................................................215
REFERENCES..........................................................................................221
APPENDIX 1 ............................................................................................246
APPENDIX 2 ............................................................................................249
APPENDIX 3 ............................................................................................252

List of Tables
xi
List of Tables
Table 2.1 Major bioactive constituents in Ganoderma species and their function…………………………………………………………….... ...29
Table 3.1 Buffer reagents used in this investigation………………………….. ….50
Table 3.2 Basidiomycetous fungi used in this investigation………………….. ….52
Table 3.3 Bacteria used in this investigation………………………………….…..53
Table 3.4 Yeast and test fungi used in this investigation…………………………54
Table 3.5 Nutrient media prepared to manufacturer specifications……………….55
Table 3.6 Basal medium for the investigation of carbohydrate source……….. ….55
Table 3.7 Organic solvents used in this investigation………………….………....61
Table 3.8 Oligonucleotides used in this investigation……………………….……68
Table 3.9 Thermo-cycling conditions for the amplification of the ITS I and ITS II regions………………………………………………………70
Table 3.10 Ganoderma isolates used for the phylogenetic analysis in this investigation……………………………………………………………75
Table 4.1 Comparison of the RFLP fragments of three Australian Ganoderma isolates and an American type G. lucidum……………………………..84
Table 4.2 Percentage of nucleotide difference between different Ganoderma isolates…………………………………………………...103
Table 4.3 Nucleotide difference between groups of Ganoderma taxa…………..105
Table 5.1 The effect of thawing and refreezing at –80ºC on the viability of Australian Ganoderma isolates……………………………………….112
Table 5.2 The effect of long term preservation at –80ºC on the mycelial growth of Australian Ganoderma isolates…………………………….114
Table 5.3 Growth Rates of Ganoderma species at 25 and 30ºC…………………123
Table 5.4 Final pH of culture medium after 10, 20 and 30 days cultivation….…124
Table 6.1 Hot water extraction yield of three Australian Ganoderma isolates, H1, H2 and H3…………………………………………….…138
Table 6.2 Preliminary antibacterial screening of the aqueous extracts from the liquid cultivated mycelium of Ganoderma H1, H2 and H3……. ...140
Table 6.3 Organic extraction yield of Ganoderma isolates H1, H2 and H3 …. ...144
Table 6.4 The appearance and consistency of the organic extracts from Ganoderma H1, H2 and H3…………………………………….……..144
Table 6.5 Preliminary antibacterial screening of the organic extracts from the liquid cultivated mycelium of Ganoderma H1, H2 and H3………146

List of Tables
xii
Table 6.6 Organic extract yield of Ganoderma H1 grown in different cultivation media……………………………………………………...149
Table 6.7 The appearance and consistency of organic extracts from Ganoderma H1 grown in different media…………………………….150
Table 6.8 The antibacterial activity of the crude organic extracts from the mycelium of Ganoderma H1 against a range of bacteria……………..152
Table 6.8 cont. The antibacterial activity of the crude organic extracts from the mycelium of Ganoderma H1 against a range of bacteria……………..153
Table 6.9 Total extract obtainable in 250 mL culture flasks…………………….158
Table 6.10 Antibacterial activity of Ganoderma H1 organic extracts against some anaerobic Clostridium bacteria…………………………………160
Table 6.11 The MIC and MBC of the crude organic extracts from Ganoderma H1………………………………………………………..162
Table 7.1 TLC of the crude DCM extract………………………………………..187
Table 7.2 TLC of the DCM fractions B1 to B5………………………………….194
Table 7.3 TLC of the DCM fractions C1 to C7………………………………….196
Table 7.4 Spray reagent detection of active components in the DCM extract…..200
Table 7.5 Summary of the class of compounds for the active components present in the DCM extract…………………………………………....205

List of Figures
xiii
List of Figures
Figure 2.1 A ribosomal DNA repeat unit showing the internal transcribed spacer regions and intergenic spacer regions……………………….….14
Figure 2.2 Structure of lanosterol……………………….……………….………...33
Figure 3.1 One major rRNA transcript showing the ITS I and ITS II regions…….69
Figure 4.1 Representative photos of the three Australian Ganoderma species isolated from the Cairns State Forest………………….……….79
Figure 4.2 PCR and purification of the DNA from four Ganoderma isolates...…...81
Figure 4.3 RFLP-PAGE of Ganoderma H1, Ganoderma H2, Ganoderma H3 and G. lucidum using the enzymes AluI, HaeIII, HindIII and HhaI………………………………………………………...…. ….83
Figure 4.4 Comparison of the restriction enzyme sites on the sequences of: Ganoderma H1, Ganoderma H2 and Ganoderma H3………………....85
Figure 4.5 A vector map of pGEM® -T Easy showing the original pGEM®-T Easy vector and the vector with the Ganoderma H1 PCR insert, pGEM-H1 plasmid…………………………………. .. 89
Figure 4.6 Restriction digest of a number of recombinant plasmids, pGEM-H1, using ApaI and SacI, and EcoRI………………………... ...90
Figure 4.7 Restriction digest of a number of recombinant plasmids, pGEM-H2, using ApaI and SacI, and EcoRI……………………….…..91
Figure 4.8 Restriction digest of a number of recombinant plasmids, pGEM-H3, using ApaI and SacI, and EcoRI……………………….…..92
Figure 4.9 Typical dsDNA sequence data obtained from sequence analysis of recombinant plasmid……………………………….…… ...93
Figure 4.10 The consensus sequence for Ganoderma H1, Ganoderma H2 and Ganoderma H3…………………………………………………………94
Figure 4.11 Phylogenetic relationship of Ganoderma species inferred from nucleotide sequences of the internal transcribed spacer region, ITS I…98
Figure 4.12 Phylogenetic relationship of Ganoderma species inferred from nucleotide sequences of the internal transcribed spacer region, ITS II...99
Figure 4.13 Phylogenetic relationship of Ganoderma species inferred from nucleotide sequences of the internal transcribed spacer regions, ITS I and ITS II regions combined…………………………….. …. ...100
Figure 5.1 Short term viability of Ganoderma H1, Ganoderma H2 and Ganoderma H3 on different media…………………………….……...116

List of Figures
xiv
Figure 5.2 The pH and temperature growth profile of Ganoderma H1, Ganoderma H2, Ganoderma H3, Ganoderma lucidum and Ganoderma applanatum on PDA…………………………………… 120
Figure 5.3 The pH and temperature growth profiles of Ganoderma applanatum and Pycnoporus cinnabarinus on PDA……………….…121
Figure 5.4 Mycelial biomass of Ganoderma H1, Ganoderma H2 and Ganoderma H3 cultivated in MEB, PDB and Basal-G growth media………………………………………………………………... .125
Figure 5.5 The effect of carbohydrate source on mycelial biomass production and culture medium pH of Ganoderma H1, Ganoderma H2 and Ganoderma H3……………………………….…129
Figure 6.1 Aqueous extracts from the mycelial biomass of Ganoderma H1, H2 and H3 that had been cultivated in MEB for a period of 30 days ….…138
Figure 6.2 Representative photos of the disc diffusion assay showing complete inhibition of S. pyogenes by the aqueous extract of Ganoderma H1 after a 24 h incubation period………………………………….……...141
Figure 6.3 Representative diagram of the reduction of MTT by living bacteria after 24 hours incubation……………………………………………...142
Figure 6.4 Ganoderma H1 crude organic extracts, extracted from mycelium that had been cultivated in Basal-G growth medium for a period of 30 days……………………………………………….……..149
Figure 6.5 Representative photos of the disc diffusion assay showing complete inhibition of S. aureus by the EtOAc(PDB) extract and complete inhibition of the B. cereus by the DCM(PDB) extract………………..151
Figure 6.6 Representative photos of the disc diffusion assay showing incomplete inhibition and a weak incomplete inhibition towards an MRSA isolate……………………………………………….……...155
Figure 6.7 Representative photos of the disc diffusion assay showing Ganoderma H1 extracts exhibiting complete inhibition against some Clostridium isolates………………………………………….….159
Figure 6.8 a-e MIC concentration response graphs of the organic extracts (DCM and EtOAc) from the mycelium of Ganoderma H1, against B. cereus, B. subtilis, L. monocytogenes and S. epidermidis……….…164
Figure 6.8 f-k MIC concentration response graphs of the organic extracts (DCM and EtOAc) from the mycelium of Ganoderma H1 against S. pyogenes, C. perfringens (cp8) and C. perfringens (cp9)………….165
Figure 6.8 l-q MIC concentration response graphs of the organic extracts (DCM and EtOAc) from the mycelium of Ganoderma H1 against C. perfringens (SUT), C. butyricum and C. sporogenes……...166
Figure 6.8 r-w MIC concentration response graphs of the organic extracts (DCM and EtOAc) from the mycelium of Ganoderma H1 against three C. difficile isolates (cd1), (cd8) and (cd14)……………..167

List of Figures
xv
Figure 6.9 Time kill curves for the DCM extract against Bacillus cereus, Bacillus subtilis, Listeria monocytogenes and Staphylococcus epidermidis, and both the DCM extract and EtOAc extract against Streptococcus pyogenes. …………………………..…... …. ...173
Figure 6.10 Time kill curves for the DCM extract and EtOAc extract against Clostridium perfringens (cp8), Clostridium perfringens (SUT), Clostridium sporogenes (SUT) and Clostridium difficile (cd1), and the DCM extract against Clostridium perfringens (cp9) and Clostridium butyricum……………………………………………174
Figure 7.1 TLC and bioautography of the DCM extract developed in a CHCl3:EtOAc solvent system………………………………….……...186
Figure 7.2 Diagram of the fractionation process of the DCM extract……………189
Figure 7.3 Bioautography of the DCM extract fractionation; Thirty fractions in total; 10 μL of each 5 mL fraction was spotted onto the TLC plate……………………………………………………….....190
Figure 7.4 TLC separations of fractions B1 to B5………………………………. 193
Figure 7.5 TLC of DCM fractions C1 to C7……………………………………...196
Figure 7.6 Bioautography agar overlay of the B series and C series fractions from the DCM extract………………………………………….……...199

Annotation
xvi
Annotation Standard chemical symbols and SI units are used without definition.
ºC Degrees Celsius Ampr Ampicillin resistant AR Analytical reagent AS Anisaldehyde-sulphuric acid ATCC American Type Culture Collection Basal-G Basal glucose medium BB Berlin blue BHI Brain heart infusion BHI-Cdiff Brain heart infusion for Clostridium difficile bp Base pair BSA Bovine serum albumin cfu Colony forming units CNI Close neighbourhood interchange dsDNA Double strand DNA DCM Dichloromethane DNA Deoxyribonucleic acid DTT DL-Dithiothreitol EDTA Ethylenediaminetetraacetic acid EtOAc Ethyl acetate FBS Fast blue salt FTG Fluid thioglycollate medium hr Hour H1 Ganoderma cupreum (isolate H1) H2 Ganoderma weberianum (isolate H2) H3 Ganoderma species (isolate H3) HEX Hexane IGS Intergenic spacer IPTG Isopropyl-β-D-thiogalactopyranoside ITS Internal transcribed spacer LB Luria-Bertani medium LBr Leibermann Burchard reagent MBC Minimum bactericidal concentration ME Malt extract MEA Malt extract agar MEB Malt extract broth MEGA Molecular Evolutionary Genetics software MEv Minimum Evolution MHA Mueller Hinton agar MHB Mueller Hinton broth MeOH Methanol MIC Minimum inhibitory concentration

Annotation
xvii
MIC100 100 % inhibition MIC90 90 % inhibition MIC50 50 % inhibition min Minute/s MIRD Monash Institute of Reproduction and Development MP Maximum parsimony MRSA Methicillin resistant Staphylococcus aureus MTT Thiazolyl blue tetrazolium bromide NA Nutrient Agar NB Nutrient broth NaCl Sodium chloride nd not done NP-PEG Natural products - polyethylene glycol nt nucleotide OD595 Optical density at 595 nm PAGE Polyacrylamide gel electrophoresis PCR Polymerase chain reaction PDA Potato dextrose agar PDB Potato dextrose broth rDNA Ribosomal DNA RE Restriction enzyme Rf Retention factor RFLP Restriction fragment length polymorphism RNA Ribonucleic acid rpm Revolutions per minute s Second/s SDS Sodium dodecyl sulphate TAE Tris acetate buffer TBE Tris borate buffer TLC Thin layer chromatography TSA Tryptic soy agar TSB Tryptic soy broth UV Ultra-Violet VIS Visible VRE Vancomycin resistant enterococci VS Vanillin sulphuric acid X-Gal 5-bromo-4-chloro-3-indolyl-β-D-galactoside YE Yeast extract

1 Chapter One
IInnttrroodduuccttiioonn

Chapter 1 - Introduction
2
1.1 Natural Products Industry The natural products and herbal medicine industry has become increasingly popular
over the past three decades (Hamburger & Hostettmann, 1991; Shu, 1998). The
recognition of the value of traditional medical systems, particularly of Asian origin, and
the identification of indigenous medicinal plants that have shown to have healing power
(Elvin-Lewis, 2001), are factors that have had significant influence in the expansion of
the natural products industry. Furthermore, there is a constant search for new and
effective drugs, which has been driven by the number of pathogenic organisms reported
to have multi-resistance against many of the therapeutic products that are currently
available on the market (Lipsitch & Samore, 2002; McGowan, 2001; Swartz, 2000; van
der Waaij & Nord, 2000).
Many clinically useful drugs have been obtained through the screening of natural
products (Shu, 1998). It is reported on average that two or three antibiotics derived
from microorganisms are launched every year (Clark, 1996), and over 60% of
antitumour and antiinfective agents that have been approved or are in late stages of
clinical trials, are of natural product origin (Cragg et al., 1997). Eight of the world’s top
selling drugs are either natural products or derived from natural products, including:
simvastatin, enalapril, pravastatin, the combination of amoxicillin and calvulanate,
lovastatin, cyclosporin, clarithomycin and captopril (Quinn, 1999).
Plants have been a major focus of investigations for novel biologically active
compounds from natural resources and in recent years pharmaceutical companies have
spent a lot of time developing these natural products to produce more affordable and
cost effective remedies (Farnsworth, 1994). However, due to exploitation, some
traditionally used plants are disappearing and the sustainable usage of natural resources
is currently questioned by ecologists (Cragg et al., 1993; Nigg & Seigler, 1992).
Filamentous fungi have been the producers of some of the most powerful secondary
metabolites, and these metabolites have been researched and developed into therapeutic
agents. Two such major classes of compounds from filamentous fungi that have been
developed into drugs are the β-lactam antibiotics and statin drugs.

Chapter 1 - Introduction
3
β-lactam antibiotics have stemmed from the discovery of the first antimicrobial agent
from a species of Penicillium by Sir Alexander Fleming in the 1920s (Fleming, 1929).
This led to the research and development of the antibiotic (penicillin) by Florey and his
team (Florey et al., 1949) and opened the way for the development of other antibiotics
and therapeutic compounds. Penicillin still remains among the most active and least
toxic antibiotics (Demain & Elander, 1999).
Statins, another example of natural products successfully developed as drugs, are
currently used in reducing the risks for hypercholesterolaemia and coronary heart
disease (Quinn, 1999; Shu, 1998). The first statin, mevastatin (compactin), was
discovered from a species of fungus Penicillium (Endo et al., 1976a, 1976b). Since
then, other statin inhibitors have been isolated from different sources, such as lovastatin
from Aspergillus terrus (Alberts et al., 1980), or by the conversion of statins into more
active analogues, such as pravastatin (Haruyama et al., 1986) and simvastatin (Hoffman
et al., 1986).
1.2 Kingdom Fungi In 1969, fungi were classified into their own separate kingdom from plants (Whittaker,
1969). This was established on the basis that not one fungus is photosynthetic, fungi
must absorb nutrients produced by other organisms and they differ from plants in their
cell wall composition, in their body structure and in their modes of reproduction
(Whittaker, 1969). The kingdom of Fungi was further classified into four different
divisions: 1) Deuteromycota (imperfect fungi), 2) Basidiomycota (club fungi), 3)
Ascomycota (sac fungi), and 4) Zygomycota. Since the discovery of Penicillin from the
fungus Penicillium (Fleming, 1929), which belongs to the imperfect fungi, there has
been much focus on the production of antibacterial agents from the filamentous fungi
within this division (al-Hilli & Smith, 1992; Fischer et al., 2000; Florianowicz, 1998;
Larena & Melgarejo, 1996; Mayordomo et al., 2000; Rodrigues et al., 2000). Although
there is early reference to the antibacterial activities exhibited by fungi that belong to
the division, Basidiomycota (Brian, 1951; Robbins et al., 1947; Takeuchi, 1969), it is
only within the last ten years that a broader range of genera, species and isolates from
within this division has been explored in more detail for antibiotic properties (Anke et
al., 1980; Colleto & Mondino, 1991; Lorenzen & Anke, 1998; Rosecke & Konig, 2000;

Chapter 1 - Introduction
4
Wasser & Weis, 1999c; Wasser, 2002). Fungi from the latter two divisions,
Ascomycota and Zygomycota, are not mentioned further in this study, and from this
point there is little reference to the division of Deuteromycota. The focus of this
investigation was on fungi from the genus Ganoderma, which belongs to the division of
Basidiomycota.
1.3 Basidiomycetes as Sources of Bioactive Substances Fungi from the division Basidiomycota have been of interest recently due to the number
of biological active compounds that have been isolated from them (Eo et al., 1999b;
Gan et al., 1998a; Haak-Frendscho et al., 1993; Hatvani, 2001). Fungal fruiting bodies,
fungal mycelium or the culture fluid in which the mycelium has been cultivated may all
be explored for biological activity. Some advantages of using filamentous fungi over
plants as sources of bioactive compounds are that often the fruiting body can be
produced in much less time, the mycelium may also be rapidly produced in liquid
culture and the culture medium can be manipulated to produce optimal quantities of
active products.
When considering natural substances for investigation of medicinal properties, Baker et
al. (1995) suggested that one should consider the evidence suggesting the traditional
usage of the substance by indigenous populations, the abundance of the species in
nature and the sustainable utilisation of the species. These criteria were suggested for
the discovery of natural products from the Plant Kingdom. However, fungi (a separate
Kingdom from plants as mentioned earlier), also fulfil these criteria and most
importantly, the sustainability of fungi can be achieved by using artificial cultivation
techniques. Another extremely important criterion when searching for novel bioactive
compounds is the uniqueness of the organism and its potential to produce secondary
metabolites (Donadio et al., 2002b). Many cellular biological responses of natural
products are generally associated with inherent properties of secondary metabolites
(Shu, 1998) and therefore, represent a large source of compounds that may have potent
biological activities.
One of the major rationales for the for antimicrobial compounds from basidiomycetes is
that humans (and animals) share common microbial pathogens with fungi, such as

Chapter 1 - Introduction
5
Escherichia coli and Staphylococcus aureus, and therefore we can benefit from defence
strategies used by fungi against microorganisms (Zjawiony, 2004).
1.3.1 Medicinal Basidiomycetous Fungi Basidiomycetous fungi (mushrooms) can be defined as “macrofungi" with distinctive
fruiting bodies that are large enough to be seen by the naked eye and to be picked by
hand (Chang & Miles, 1992). It is estimated that there are approximately 1.5 million
species of mushrooms in the world of which approximately 70,000 species are
described (Hawksworth, 1991). About 10,000 of the known species belong to the
macro fungi (Kendrick, 1985), of which about 5,000 species are edible and over 1,800
species are considered to have medicinal properties (Chang, 1995). The macro fungi
can be divided into four groups: (1) edible flesh, e.g. Agaricus; (2) medicinal, e.g.
Ganoderma; (3) poisonous, e.g. Amanita; and (4) miscellaneous, where the properties
are less well defined (Chang, 1995). Of edible mushroom species, Agaricus represents
the leader in world production and in non-edible medicinal species, Ganoderma, which
belongs to the polypores (mushrooms that contain pores that hold reproductive spores,
rather than gills) is the leader in terms of production (Chang, 1995). In recent years,
more varieties of mushrooms have been isolated and identified, and the number of
mushrooms being cultivated for food or medicinal purposes has been increasing rapidly
(Chang, 1995). Several mushroom species belonging to the Polyporaceae family are
now being regarded as the next candidate producers of valuable medicines (Mizuno et
al., 1995a).
Mushroom “nutriceuticals" are bioactive compounds that are extractable from
mushrooms, and they have nutritional and medicinal features that may be used in the
prevention and treatment of diseases (Chang & Buswell, 1996). Several nutriceutical
products have been isolated from medicinal mushrooms and three of these, which are
carcinostatic polysaccharide drugs, have been developed from mushrooms in Japan.
These are “Krestin” (PSK), from the cultured mycelium of Kawaratake (Trametes
versicolor), “Lentinan” from the fruiting bodies of Shiitake (Lentinus edodes) and
“Schizophyllan” (Sonifilan) from the culture fluid of Suehirotake (Schizophyllum
commune) (Mizuno, 1993). Lentinan and schizophyllan are pure β-glucans whereas
PSK is a protein bound polysaccharide (Ooi, 2000). These type compounds are

Chapter 1 - Introduction
6
discussed in more detail in Chapter 2. The biological activity of these three products is
related to their immunomodulating properties, which enhance the host’s defence against
various forms of infectious disease. These immunopotentiators, or immunoinitiators,
are also referred to as “biological response modifiers” (BRM).
There have been a number of reviews published on the bioactive substances found in
mushrooms, and their medicinal properties (Borchers et al., 1999; Jong et al., 1991;
Lorenzen & Anke, 1998; McAfee & Taylor, 1999; Mizuno, 1995; Mizuno et al., 1995c;
Ooi & Liu, 1999; Wasser & Weis, 1999b, 1999c). With particular focus on Ganoderma
species, it is apparent that most of the available data on active extracts and compounds
relates to the pharmacological effects on tumour cells, which appear to be based on the
enhancement of the host’s immune system. A further observation is that there seems to
be much less research being performed on the antibacterial action of Ganoderma
extracts (Mothana et al., 2000; Smania et al., 1999).
1.3.2 Australian Ganoderma The majority of medicinal investigations on Ganoderma species have been performed
on species that have been isolated from other parts of the world and there have been few
reports on Australian Ganoderma. Australian Quarantine Inspection Service (AQIS)
have prohibited the importation of the fungus into the country because some species are
known to be pathogenic to native trees by causing basal-stem rot (Miller et al., 1999).
However, there are numerous Ganoderma species that are native to Australia and if
these species are examined, quarantine laws are not an issue. Since species within the
Ganodermataceae family all evolved from one species, it is then most likely that
Australian Ganoderma contain similar compounds to Ganoderma that have been
isolated elsewhere.
Fungi within the same family can produce a different variety of secondary metabolites
as a result of stress (Pointing & Hyde, 2001) or from exposure to different
environmental conditions (Kim et al., 2002b, 2003). Therefore, the different
environmental conditions that Australia has to offer, as well as the different native trees
on which the fungi grow, might potentially produce secondary metabolites with
interesting biological activities. In addition, there have been reports of different

Chapter 1 - Introduction
7
Ganoderma species possessing different biologically active compounds (Gao et al.,
2000a; Mothana et al., 2003; Smania et al., 2003). Since the majority of medicinal
research within the Ganodermataceae has been performed on G. lucidum, and it has
been reported that this species does not exist in Australia (Moncalvo et al., 1995a), then
the investigation of local species may yield compounds with novel medicinal qualities.
An important aspect of the search for natural products with medicinal properties is that
the correct identification of the source species is carried out. With the introduction of
molecular tools, it has become apparent that the classification of Ganodermataceae is in
a state of taxonomic chaos (Ryvarden, 1991; Smith & Sivasithamparam, 2003). This is
partially because there has never been a standard nomenclatural system established
when using the traditional morphological studies to identify them. As a result, past
investigators have unknowingly reported medicinal properties from wrongly identified
isolates. In addition, reports that G. lucidum is not conspecific to the Australasian
pacific region (Moncalvo et al., 1995a, 1995b) and the number of investigations that
have reported medicinal activities from Asian G. lucidum isolates, confuses the matter
further. Thus, the correct identification of new species or isolates will help in clarifying
some of the taxonomic confusion that exists for Ganoderma. Smith & Sivasithamparam
(2000a, 2000b) have addressed the identification of a number of Australian Ganoderma
species using molecular techniques. However, there is limited sequence data available
for Australian species such that additional data would assist in the identification of new
species, as well as confirming the classification of existing ones.
1.4 Aims of This Investigation There were four main aims of this investigation. The first was to classify three
Australian Ganoderma isolates that had been isolated from the Cairns State Forest
(Chapter 4) using modern molecular techniques rather than traditional morphological
taxonomic techniques. Although a number of Ganoderma sequences were available
from the GenBank database, the data generated in this study would increase the number
of available sequences from Australian Ganoderma species.
The second aim was to determine suitable storage and growth conditions of the three
isolates (Chapter 5). The importance of suitable short term and long term storage of the

Chapter 1 - Introduction
8
fungi was to ensure the fungi remained viable throughout this investigation, as well as
for future reference and use. It was also desirable to obtain maximum growth of the
fungal mycelium in a liquid cultivation medium so that sufficient material was available
to pursue further studies on its biological activity. Therefore, optimal growth of the
mycelium was investigated by variation of the environmental parameters, pH and
temperature, as well as the nutrient medium and sugar source.
The third aim of this investigation was to investigate the hot water and organic extracts
from the three Australian isolates for their antibacterial activity (Chapter 6).
Preliminary investigations were performed to assess the three isolates for their
antibacterial activity, and then additional studies of the most active isolate could be
performed. The chosen isolate was investigated further for its antibacterial effect on a
number of bacteria, including some clinically important Clostridium strains.
The fourth and final aim of this investigation was to identify, to a certain class of
compound, the components within the mycelial extracts that exhibited antibacterial
activity (Chapter 7). Partial purification using a bioassay guided fractionation process
was performed so that the active components could then be assessed for the class of
compound to which they belonged. The identification, as well as the process which
identified suitable solvents systems, provided a framework for further studies on the
exact identification of the active compounds.
The following review (Chapter 2) focuses on medicinal compounds that have been
isolated from mushrooms, and in turn, the therapeutic effects that many of these
compounds have shown to possess. Since Ganoderma are the fungi under investigation
in this study, there is a strong emphasis on the research of fungi from within the family,
Ganodermataceae. However, fungi from other families are included for comparison
where required, as well as the occasional comparison to biologically active compounds
extracted from plants. The classification of Ganoderma species is also reviewed, as
well as current cultivation techniques using both solid and liquid growth media, with
particular focus on the latter.

2 Chapter Two
LLiitteerraattuurree RReevviieeww

Chapter 2 – Literature Review
10
2.1 Ganodermataceae 2.1.1 Classification of Ganoderma Ganoderma species belong to the kingdom of Fungi, the division of Basidiomycota, the
class of Homobasidiomycetes, the order of Aphyllophorales, the family of Polyporaceae
(Ganodermataceae) and the genus of Ganoderma (Chang, 1995; Wasser & Weis,
1999a). Fungi from the family of Polyporaceae are classified as such as they have many
tiny holes on the underside of the fruiting body, which are pores that contain the
reproductive spores. They have a woody or leathery feel and the presence of these
pores are obvious characteristics that distinguish polypores from other common types of
mushrooms. Polypores, like other fungi, grow on wood as an expansive network of
microscopic tubes known as mycelium. They degrade the wood over time and produce
a fruiting body (or conk) on the surface of the wood. Ganoderma species are among
those fungi that can thrive under hot and humid conditions and are usually found in
subtropical and tropical regions (Moncalvo & Ryvarden, 1998).
Ganoderma species are not classified as edible mushrooms, as the fruiting bodies are
always thick, corky and tough and do not have the fleshy texture characteristic of true
edible mushrooms such as the common white button mushroom, Agaricus bisporus.
Although they are not classified as edible, several types of Ganoderma products are
available on the market including; ground fruiting bodies or mycelium processed into
capsule or tablet form; extracts from the fruiting body or mycelium dried and processed
into capsule or tablet form or tea, Ganoderma beer and Ganoderma hair tonics (Jong &
Birmingham, 1992).
Within the genus Ganoderma, over 250 taxonomic names have been reported
worldwide (Moncalvo et al., 1994; Ryvarden, 1994) including: G. adspersum, G.
applanatum, G. australe, G. boninense, G. cupreum, G. incrassatum, G. lipsiense, G.
lobatum, G. lucidum, G. oerstedii, G. oregonense, G. pfeifferi G. platense, G.
resinaceum, G. sessile, G. sinense, G. tornatum, G. tsugae and G. weberianum, to name
a few. However, the majority of reports in the literature appear to be on the one species,
G. lucidum.

Chapter 2 – Literature Review
11
2.1.2 History of Ganoderma Ganoderma lucidum has been treasured in China and Japan for many thousands of years
(Willard, 1990). In Chinese, the mushroom is called "Ling Zhi", in Japanese “Reishi,
Mannentake or Sachitake”, and “Youngzhi” in Korean. Chinese tradition proclaims that
Ganoderma is also called “miraculous zhi”, or “auspicious herb” and is usually
considered to “symbolise happy augury, and to bespeak good fortune, good health and
longevity, even immortality” (Wasson, 1968).
As early as 800 years ago in the Yuan Dynasty (A.D., 1280 – 1368) G. lucidum has
been represented in paintings, carvings, furniture, carpet design, jewellery, perfume
bottles and many more creative artworks (Wasser & Weis, 1999a). According to the
two famous Chinese herb medical books, Shen Nong Ben Cao Jing (25-220 A.D.,
Eastern Han Dynasty) and Ben Cao Gang Mu (1590 A.D., Ming Dynasty), there were
six know species of Ganoderma (Ling Zhi) in China at that time, whereas now more
than 250 species have been described (Moncalvo et al., 1994; Ryvarden, 1994).
2.1.3 Medicinal Ganoderma G. lucidum (Ling Zhi) was the most sought after species within the Ganodermataceae
family, as it was believed to be the only mushroom to contain therapeutic properties
(Willard, 1990). In the literature today there is much confusion as to which is the true
Ganoderma species. The Japanese believed that the true Ganoderma was red and that a
Ganoderma species with a different colour was a red Ganoderma that had become
discoloured due changes in environmental conditions such as temperature, humidity and
light (Mayzumi et al., 1997). In China, they believed that the true Ganoderma was
black as there were reports of a black Ganoderma that had unusual medicinal benefits
not produced by the red mushroom (Mayzumi et al., 1997).
Chang (1995) suggested that Ganoderma (Ling Zhi) encompassed several Ganoderma
species, although most investigations and therapeutic practices refer to the species, G.
lucidum. More recently, other species, e.g.: G. tsugae, G. boninense, G. capense, G.
sinense, G. japonicum, G. applanatum, G. tropicum, G. tenue and G. luteum, have
become increasingly popular for the investigation of medicinal properties. A number of
reviews have described the bioactive substances, medicinal effects and health benefits

Chapter 2 – Literature Review
12
of Ganoderma species (Chang, 1995; Chang & Buswell, 1999; Chen & Miles, 1996a;
Jong & Birmingham, 1992; Mizuno et al., 1995b). It is also noted that the majority of
the studies concerning the Ganodermataceae family relate to the antitumour and
antiviral effects, while the antioxidant properties associated with this fungus have only
recently become apparent (Mau et al., 2002; Yen & Wu, 1999; Zhu et al., 1999). There
appears to be limited information available that reports the antimicrobial properties of
Ganoderma species.
2.2 Systematics of Ganoderma The genus Ganoderma was established by Karsten in 1881. Correct citation of the type
species is written as G. lucidum (Curt.: Fr.) P. Karst. This genus was later divided into
two distinct groups, the laccate (cutex layer on the outer surface of the fruiting body that
rendered it waxy/shiny) (G. lucidum complex) and the non-laccate (G. applanatum
complex) species, which refer to the subgenera Ganoderma and Elfvingia respectively.
Since then, over 290 taxonomic names in the genus of Ganoderma (Ryvarden, 2000)
have been published, indicating that this genus is morphologically complex.
The taxonomy of Ganoderma species is not clear and it has been noted that the genus is
in a state of taxonomic crisis (Ryvarden, 1991). Traditional identification of
Ganoderma species has been based on morphological features, physiological and
developmental characters, and chemical components such as secondary metabolites
(Takamatsu, 1998). As a result, the concept of species in this genus is not well
established nor universally accepted (Gottlieb et al., 2000).
Over the last few decades, it has been shown that the morphology and culture
characteristics of species from the same genus can be greatly affected by growth
conditions. This signifies that a large number of synonyms may exist due to the number
of species that have been identified based on morphology (Moncalvo, 2000). The shape
of the basidiocarp (fruiting body) has been demonstrated to be greatly influenced by the
environment (Chen, 1993), the basidiospores by latitude and altitude (Steyaert, 1975)
and in some species, the context colour was darker in collections from more southern
latitudes on the European continent (Steyaert, 1972). More recently, the age and
environment have been shown to have a marked effect on the colour, size and

Chapter 2 – Literature Review
13
brightness of the fruiting body, and the presence, absence or length of the stipe (stem)
(Moncalvo, 2000). Identification of Ganoderma based on these characteristics have
contributed greatly to the confusion of the naming of species within this genus, and
have resulted in traditional taxonomic methods being inconclusive for establishing a
stable classification system for Ganoderma species (Hong et al., 2002; Hseu et al.,
1996).
Traditional identification parameters are rapidly becoming outdated and new
identification methods are being investigated. Alternative approaches that have been
used to identify Ganoderma species include restriction fragment length polymorphism
(RFLP) (Miller et al., 1999), sequence analysis (Hong et al., 2002; Moncalvo et al.,
1995a, 1995c; Smith & Sivasithamparam, 2000a) and isoenzyme electrophoresis
(Gottlieb et al., 1998; Gottlieb & Wright, 1999b; Smith & Sivasithamparam, 2000b). It
is the phylogenetic analysis of amino acid or DNA sequences that is known to have the
highest resolving power (Bruns et al., 1991). These modern techniques have helped to
clarify the distribution of the different species complexes in the genus Ganoderma and
in some cases, it has become apparent that species have been misidentified (Gottlieb et
al., 1998; Moncalvo et al., 1995a, 1995c). Taxonomic confusion between G. lucidum
and G. tsugae appears to have resulted in one of the greatest misidentification of species
within the genus Ganoderma (Hseu & Wang, 1991).
Classification of Ganoderma using molecular methods has shown that G. lucidum is
most likely confined to Europe and does not actually exist in the Australasia Pacific
region (Moncalvo et al., 1995a, 1995c). These findings appear to contradict much of
the published work in Asia on medicinal G. lucidum. In addition, this suggests that
documentation of G. lucidum in some of the early Chinese and Japanese books, such as
Shen Nong Ben Cao Jing (25-220 A.D., Eastern Han Dynasty) and Ben Cao Gang Mu
(1590 A.D., Ming Dynasty), has been cited incorrectly. It appears that this confusion
exists because the first botanical specimen was described from Europe in the late
eighteenth century (Karsten, 1881) and not from an Asian specimen. This type G.
lucidum species has been the basis for identification of new species and with the
introduction of molecular taxonomy, is observed to be different at the molecular level to

Chapter 2 – Literature Review
14
those species reported in Asian countries. This appears to be one of the major reasons
why the taxonomy of this species is in a state of crisis.
2.2.1 Molecular Systematics of Ganoderma Nuclear-encoded ribosomal RNA genes (rDNA) have been the primary focus of
investigation for new taxonomic approaches in fungal molecular systematics. These
genes (rDNA) are arranged in tandemly repeated units (Figure 2.1) with each unit
containing the genes for the small subunit (18S), 5.8S, and large subunit (25-28S).
Each unit is separated by one or more intergenic spacer (IGS) regions and these IGS
regions may contain a separately transcribed coding region for 5S RNA.
Figure 2.1. A ribosomal DNA repeat unit showing the internal transcribed spacer regions and intergenic spacer regions. The diagram shows the location of the ribosomal subunits within the repeat unit. The small subunit (18S RNA) to the large subunit (25-28S RNA) consists of one major rRNA transcript (Bruns et al., 1991).
The coding regions of the 18S, 5.8S and 28S nuclear rDNA genes are highly conserved
among fungi and they show little sequence divergence between closely related species
and are useful for phylogenetic studies among distantly related organisms (Berbee &
Taylor, 1992; Binder & Hibbett, 2001; Swann & Taylor, 1993, 1995). Within each
repeat unit, the conserved regions are separated by two internal transcribed spacers, ITS
I and ITS II, which show higher rates of divergence (Moncalvo et al., 1995c; Perlin &
Park, 2001). It is these ITS regions that are now the most widely sequenced DNA
regions in fungi. Variable sequence regions in both the small (18S) and large (25S)
Internal transcribed spacer regions
Intergenic spacer regions
SSU (18S RNA) 5.8S RNA
LSU (25-28S RNA) 5S RNA SSU (18S RNA)
1 rDNA repeat unit

Chapter 2 – Literature Review
15
subunits of rDNA genes have also led to numerous molecular approaches that provide
rapid identification of fungal species (Perlin & Park, 2001).
Molecular taxonomy of the Ganodermataceae family was first performed by Moncalvo
et al. (1995a, 1995c). They believed that most of the controversy which has been
associated with Ganoderma systematics in the past might be resolved with the use of
molecular techniques to generate novel taxonomic characters and with the use of
phylogenetically based classification methods.
2.2.1.1 Internal Transcribed Spacer (ITS) Regions
The ITS regions are probably the most important regions in fungi for molecular
systematics within a genus. The highly conserved ribosomal genes, which flank the ITS
regions, are ideal for universal primer targeting and as a result the ITS regions can be
amplified by polymerase chain reaction (PCR), the sequences analysed and compared,
and evolutionary trees produced. The ITS regions in fungi are highly variable and for
this reason are useful in distinguishing between Ganoderma species (Moncalvo et al.,
1995a, 1995c). In contrast, the nucleotide sequence data from nuclear and
mitochondrial rDNA coding regions do not offer enough variation to infer phylogenetic
relationships between Ganoderma species (Moncalvo, 2000) and therefore are only
useful at the genus level. There have been many reports published on the analysis of the
ITS regions to establish taxonomic relationships within the Ganoderma species
(Gottlieb et al., 2000; Moncalvo et al., 1995a, 1995c; Smith & Sivasithamparam,
2000a).
There are specific segments in the ITS regions which have greater variability than other
segments. Moncalvo et al. (1995a) observed that the frequency of nucleotide
substitutions was similar in both ITS regions but found that variations were mostly
located in the central region of ITS I and close to the termini in ITS II. They also
reported that nucleotide divergence between recently diverged taxa was usually in the
ITS II region. This was also observed by Gottlieb et al. (2000), who reported that a
lower level of resolution of internal phylogenetic branches was obtained from the ITS I
data set.
Chapter 2 – Literature Review
16
2.2.1.2 Endonuclease Restriction Digestions
Two important techniques that involve digestion of DNA with restriction endonucleases
are restriction fragment length polymorphism (RFLP) and random amplified
polymorphic DNA (RAPD). While restriction enzyme treatment of the PCR amplified
ITS regions can discriminate between most Ganoderma species (Park et al., 1996),
RAPDs can be used to differentiate between isolates having identical ITS sequences
(Hseu et al., 1996).
PCR coupled with RFLP has been a useful tool in phylogenetic studies and is now
widely used for fungal phylogeny and taxonomy (Hughes et al., 1998; Magee et al.,
1987; Miller et al., 1999). PCR-RFLP was one of the first molecular approaches to
approximate the differences in species. This technique, which cleaves chromosomal
DNA using restriction endonucleases followed by separation of the fragments by gel
electrophoresis, provides a measure of the genetic difference or relatedness between
organisms (Perlin & Park, 2001).
RAPD is also another useful tool in molecular biology. Park et al. (1996) analysed
twenty eight isolates of Ganoderma by PCR-RFLP and RAPD and found that the
resulting phenograms of genetic relatedness showed similar patterns by the two
different methods, although slightly different bands were observed within the G.
lucidum group by RAPD. Hseu et al. (1996) further attempted to differentiate isolates
of the G. lucidum complex using RAPD analysis and found that groupings based on this
technique did not distinguish the same clades as ITS data and they suggested that RAPD
might be helpful for systematics at the lower taxonomic level that are unresolved by ITS
sequence data.
Single stranded conformational polymorphism (SSCP) is another technique that has
been used for taxonomic analysis of Ganoderma species. It is advantageous over
restriction analysis because it is less time consuming and more economical (Gottlieb et
al., 2000). In spite of being useful in determining variability, taxonomic names
determined using SSCP does not correspond with the current taxonomic status of some
taxa, particularly within the subgenus Elfvingia. These groupings were found to be
almost the same as those obtained with isoenzyme data (Gottlieb et al., 1998).
Chapter 2 – Literature Review
17
2.2.1.3 Isoenzymes
Isoenzymes have been investigated as a means of taxonomic identification of
Ganoderma species, although this method is not as popular as DNA based techniques
because of the need to use comparatively large amounts of fresh material (Smith &
Sivasithamparam, 2000b).
Gottlieb et al. (1999a, 1999b) used isoenzymic data to distinguish between groups of
Ganoderma from the subgenus Ganoderma and Elfvingia, from South America. They
observed that many isolates belonging to the same taxa failed to cluster together in the
gene trees and in general, correlation between morphological features and isoenzymic
patterns could not be established, and therefore the groupings determined by both sets
was different (Gottlieb & Wright, 1999a). They concluded that some Ganoderma
species were misidentified (Gottlieb et al., 1998). Interestingly, groupings obtained by
phylogenetic analyses of the ITS regions by Gottlieb et al. (2000) were almost the same
as those determined using isoenzyme data (Gottlieb et al., 1998).
Smith & Sivasithamparam (2000b) also used phenetic analysis of isoenzymes to
examine population and species relationships of Ganoderma species in Australia. Their
results confirmed the same taxonomic conclusion derived upon analysis of the ITS
region (Smith & Sivasithamparam, 2000a), although, two species could not be
distinguished from each other highlighting the limitations of using limited numbers of
enzyme systems to distinguish taxa (Smith & Sivasithamparam, 2000b).
2.2.2 Phylogenetic Analysis Taxonomy aims to reflect a natural classification of taxa, and molecular data offer a set
of objective characters on which to base taxonomic decisions (Buchanan, 2001). The
use of phylogenetic programs to analyse such molecular data has rapidly become
popular and it is the resulting phylograms (genetic evolutionary trees) that display
monophyletic groups, the members of which share a common ancestor (Buchanan,
2001). The practice of phylogenetic analysis should be conceived as a search for a
correct model, as much as a search for the correct tree (Brinkman & Leipe, 2001).

Chapter 2 – Literature Review
18
The method of phylogenetic inference currently can be classified into three major
groups: distance methods, maximum likelihood methods and parsimony methods (Nei,
1996). In distance methods, an evolutionary distance is computed from all pairs of
sequences, and a phylogenetic tree (phylogram) is constructed from the pairwise
distances (Nei, 1996). In maximum likelihood methods, maximisation of the likelihood
is performed for each topology separately and the topology with the highest likelihood
is chosen as an estimate of the true tree topology (Nei, 1996). In maximum parsimony
methods, a given set of nucleotide sequences are considered, and the nucleotides of
ancestral sequences for a hypothetical topology are inferred under the assumption that
mutational changes occur in all directions among the four different nucleotides. The
smallest number of nucleotide substitutions that explain the entire evolutionary process
for the given topology is then computed. The computation is done for all topologies,
and the topology that requires the smallest number of substitutions is chosen to be the
best tree (Nei, 1996).
There are reviews available on the statistical methods developed for different models
and how these models may affect data sets (Brinkman & Leipe, 2001; Nei, 1996).
Although numerous phylogenetic algorithms, procedures and computer programs have
been devised, their reliability and practicality are, in all cases, dependent on the
structure and size of the data (Brinkman & Leipe, 2001). The field of phylogenetic
analysis is controversial. Some of the debates have been summarised in reviews
(Saitou, 1996; Swafford et al., 1996). Of particular importance is the issue of
phylogenetic analysis of large molecular data sets (Graybeal, 1998; Hillis, 1996; Poe,
1998), and the suggestions that statistical reliability is sensitive to sample size (Bremer,
1994; Farris et al., 1996; Felsenstein, 1985; Sanderson & Donoghue, 1989). In contrast,
evidence from various studies suggests that increasing sample size generally increases
phylogenetic accuracy (Hillis, 1996; Moncalvo et al., 2000).
A matter of concern in the classification of Ganoderma is that, frequently, evolution at
the morphological and molecular levels is uncoupled and as a consequence studies
reveal discordant patterns between them (Gottlieb & Wright, 1999b). In addition, the
genus is young in terms of evolution and the speciation process is complex (Moncalvo
et al., 1995c; Ryvarden, 1991) and some recently diverged monophyletic groups may

Chapter 2 – Literature Review
19
not align with one or more morphologically distinguished taxa and thus, may challenge
existing classifications based on features such as fruiting body size and form, cutis
microstructure, spore dimensions, host and geographical distribution (Buchanan, 2001).
Knowledge of the physiology and extent of DNA variation of Ganoderma species is
still only partial (Gottlieb et al., 2000) and the current sequence database for
Ganoderma species includes about 300 taxa (Moncalvo, 2000). It is clear that a greater
sequence database is required to support preliminary research findings and validate
phylogenetic hypotheses.
2.3 Preservation and Maintenance of Fungal Cultures In any study of fungi, it is important to preserve and maintain the fungus throughout the
period of investigation. In addition, it is important to retain some form of the reference
material as a permanent record and to have stable starter cultures to obtain repeatable
results. Cells in fungi can degenerate due to lack of nutrients or oxygen, infections
(viruses), a change in substrate pH or the accumulation of unfavourable metabolites
(Oei, 1996). If a strain is cultivated for some time it may eventually lose some of the
genetic characteristics that it possessed originally (Oei, 1996). Often, the optimal
storage conditions are similar for fungi within the same genus. However, there have
been cases reported where storage conditions are unique for different fungal strains
within the same species (Mayzumi et al., 1997).
There are several techniques used for long term preservation of fungi, each with specific
advantages and disadvantages. Such techniques include agar to agar transfer, mineral
oil storage on an agar slant, deep freeze, lyophilisation and cryogenic freezing. The
agar to agar method is used for ‘short term’ storage and in laboratories that have simple
facilities. It is a relatively cheap method of storage, with little time required for the
production of new mycelial growth. Most fungal cultures can be maintained on agar by
subculturing at two to six month intervals (Ando, 1997), although, some fungi have the
requirements to be sub-cultured as frequently as every two to four weeks (Onions,
1983). A disadvantage of this technique is that it can be unreliable, as storage of the
mycelium under refrigeration may result in degeneration of the mycelium, since the
fungus can still be growing under these low temperature conditions (Oei, 1996). The

Chapter 2 – Literature Review
20
subculturing process of transferring from agar to agar is also thought to be
unsatisfactory in terms of ‘long term’ preservation due to possible contamination, or the
possibility of alteration of the fungal characteristics due to, for example, spore
production, productivity, pathogenicity and metabolite production (Ando, 1997).
Cultures grown on agar slants and stored under mineral oil, or medicinal paraffin oil,
can be stored for periods ranging from one and twenty five years (Onions, 1983). An
advantage of this method is that the cultures can be kept at either room temperature or
under refrigeration at 4ºC (Oei, 1996). A disadvantage of this method is that the depth
of the oil layer applied is critical. Too shallow a layer may leave hyphae exposed and
these can act as wicks to dry the culture. Too deep a layer restricts the diffusion of
oxygen and carbon dioxide (Onions, 1983). In addition, the revival of cultures after
extended storage can be a slow process.
Lyophilization and liquid drying methods are difficult to use for the preservation of
fungal mycelium (Ando, 1997) and are predominantly used for the preservation of
spores that can remain viable for up to 20 years (Oei, 1996). The preferred methods for
the preservation of fungal mycelia are to freeze and store the mycelium at liquid
nitrogen temperature or, to freeze the mycelium at -80ºC in a deep freezer. The most
suitable technique is cryogenic freezing because growth is retarded completely,
resulting in a stable mother culture (Croan et al., 1999; Oei, 1996). Although cryogenic
freezing is thought to be the most effective method for preservation, it has been shown
that a successful cryogenic preservation may be difficult due to the large taxonomic
variety of fungi and the variability of response between strains of the same species
(Smith, 1993). Hence, the stability of each new strain should be thoroughly investigated
first. Since cryogenic freezing is expensive and requires constant surveillance (Ando,
1997), freezing at low temperatures is the preferred method for preservation in a small
scale laboratory.
2.4 Cultivation of Ganoderma Species 2.4.1 Cultivation of Ganoderma to Produce Fruiting Bodies Artificial cultivation of Ganoderma fruiting bodies on solid substrates was successfully
achieved in mass production in the 1970’s by Y. Naoi (Mizuno, 1997) and the process

Chapter 2 – Literature Review
21
has been developing rapidly ever since. Solid artificial cultivation is widely adopted by
many growers for the commercial production of mushrooms, which is commonly
carried out on wood logs and tree stumps (Mayzumi et al., 1997; Naoi, 1997) and in
sawdust bags and bottles (Chang & Miles, 1989a; Quimio, 1986; Tong & Chen, 1990).
An advantage of using the latter two techniques is that the production time is shortened
and higher mushroom yields are achieved (Chang & Miles, 1989a). In addition to this,
the substrate may be modified. Triratana et al. (1991) investigated the growth using
agricultural waste products, such as sugar beet and corncobs, as alternate substrates.
Ganoderma has also been cultivated for its aesthetic beauty to produce Ganoderma
bonsai (Chen & Miles, 1996b).
Methods of artificial cultivation typically involve five stages: (1) Spawn run, (2)
Primordia (“Antler”) formation, (3) Primordia (“Young conk”) formation, (4) Fruiting
body development, and (5) Cropping Cycle (Chen, 1999; Stamets, 1993). Briefly,
spawn is distributed onto a sterile solid substrate, which frequently consists of a mixture
of hardwood sawdust and wood chip, and is incubated until colonisation of the substrate
is achieved. After this, incubation at decreased temperatures and high carbon dioxide
levels is carried out to develop the stalk or antler. Once the desired stalk length is
achieved, the conditions are again altered to aid in the fruiting body development. The
entire growth cycle from spawn run to cropping in artificial cultivation takes on average
approximately 90 to 120 days (Stamets, 1993), but this also depends highly on the
method of cultivation used.
2.4.2 Cultivation on a Solid Agar Medium To examine the preliminary growth patterns of fungi, many researchers have
investigated the growth of fungi on various agar media. Bilay et al. (2000) investigated
the growth rate of thirty mushroom cultures on a variety of media preparations and their
pH-modified varieties. They found that the commercial malt extract agar (MEA) and
potato dextrose agar (PDA) provided the maximum growth rate for G. lucidum and
Agaricus maskae respectively, whilst an experimental medium, that contained glucose,
potassium phosphate and corn steep liquor, provided maximum growth for fifteen
cultures. This highlighted the fact that different fungal species have different nutrient
requirements.
Chapter 2 – Literature Review
22
The diameter of the colony as a reliable measure of growth has been a topic of
controversy amongst investigators (Brancato & Golding, 1953; Worley, 1939). It has
been noted that under uniform environmental conditions, there is a high degree of radial
symmetry in fungal colonies, with all portions of the mycelial front extending at the
same rate (Edelstein & Segel, 1983) with no acceleration of growth over time (Brancato
& Golding, 1953). Hence, it can be assumed that the growth rate of fungi is constant
(Trinci, 1971). As a result, the rate and extent of growth (radii or diameter) has been a
useful criterion for comparison of fungi (Lonergan et al., 1993). The ratio of the area of
growth over time has also been used as a measure of fungal growth. Worley (1939)
suggested a third measurement, the sector area method, which takes into consideration:
(1) growth in both radial direction and tangential direction, (2) the number of units
contributing to growth, (3) the relationship between initial and total growth, and (4) the
relative importance of radial and tangential growth quantities depending on previous
conditions.
2.4.3 Cultivation of Ganoderma in Liquid Medium Propagation of mushroom mycelium in submerged culture was initially developed
during the 1950’s. This method was very successful in growing lower fungi (fungi that
do not form basidiocarps) in fermenters for economical production of various natural
products (Yang & Liau, 1998). A review by Fang & Zhong (2002c) indicated that there
were few investigations into the development of higher fungi (basidiomycetes)
bioprocesses.
Since it generally takes several months to cultivate the fruiting body of the fungus and it
is also difficult to control the quality of the product during cultivation, researchers are
turning to the liquid cultivation of mycelium to obtain useful cellular material or to
produce effective active substances. Liquid or submerged culture has the potential
advantage over solid substrate cultivation because it requires minimal space, there is
less chance of contamination (Bae et al., 2000), the mycelium can be dispersed within
the substrate more uniformly, the media parameters can be easily manipulated and the
time taken to produce the first crop may be shortened.
Chapter 2 – Literature Review
23
2.4.3.1 Investigation of Growth Parameters in Liquid Culture
Different growth factors can influence the quality and quantity of mycelial production.
Two important factors that should be considered when cultivating in liquid culture are
the components of the culture medium (e.g. nitrogen, carbon and inorganic salts) and
the environment (e.g. temperature, pH, aeration and stirring, illumination and inoculum
amount). These factors have minimum and maximum enhancing effects and
quantification of these limits is necessary in order to model and predict effects on
growth of the fungus (Knudsen & Stack, 1991). The quantity, quality, morphology and
the nutrient consumption of the mycelium are considered important criteria for
determining the optimal conditions for fungal growth (Yang & Liau, 1998). However,
in the case where the accumulation and synthesis of an effective component is of
interest, these criteria may alter, as some biological components may not exhibit a
parallel relationship with the optimal growth parameters.
Although many workers have attempted to grow G. lucidum in submerged culture to
produce mycelium, only few have investigated the influence of environmental factors
(Lin et al., 1973; Yang & Liau, 1998; Zhong et al., 2002) and the effects of the culture
medium (Kim et al., 2002a; Lee et al., 1999; Lin et al., 1973; Tseng et al., 1984).
2.4.3.2 Effect of Culture Medium on Mycelial Biomass
The culture medium is extremely important as it provides the nutrients for growth of the
mycelium. There have been few investigations reporting the effect that different
carbohydrates have on the growth of the mycelium (Lin et al., 1973; Tseng et al., 1984).
Lin et al. (1973) reported that there was no difference in the production of biomass
when glucose or sucrose was used, while Sone et al. (1985) who examined the growth
of G. lucidum in a suite of different carbohydrates, including galactose, glucose, lactose,
maltose, mannose, sucrose and xylose, found that lactose produced the highest dry
weight of mycelium after seven days, and glucose and glucitol produced the least. In
addition, they observed that the mass of mycelium produced in the lactose medium was
approximately 1.5 times greater than that in the glucose medium.
The presence of nitrogen in the culture medium is another important factor and it has
been observed that no mycelial growth occurs in its absence (Lin et al., 1973). On

Chapter 2 – Literature Review
24
review of the literature there appears to be little information on the investigation of
different nitrogen sources and how they affect the mycelial growth and formation of
Ganoderma species.
Culture media buffered with inorganic salts (Lin et al., 1973) and with low
concentrations of ammonium phosphate (Lee et al., 1999) have also been reported to
result in good mycelial growth.
More recently, researchers have been investigating alternate materials which could
increase biomass production including fatty acids (Yang et al., 2000) and plant oils
(Schisler & Volkoff, 1977), which have both been found to have a stimulatory effect on
the mycelial growth of some mushrooms.
2.4.3.3 Effect of the Environment on Mycelial Biomass
Temperature is one of the most important environmental factors in mycelial growth
requiring careful control (Brancato & Golding, 1953). G. lucidum isolated from
different regions generally has an optimal growth temperature of 30 ± 2ºC (Lin et al.,
1973; Mayzumi et al., 1997; Yang & Liau, 1998), which explains why Ganoderma
species are often found in hot climates and tropical regions. G. japonicum has been
observed to grow at an optimal temperature of 25ºC (Mayzumi et al., 1997).
The initial pH of the growth medium is another important factor that may affect cell
membrane function, cell morphology and structure, the uptake of various nutrients and
product biosynthesis (Fang & Zhong, 2002b). It is well known that fungi generally
metabolise acids to decrease the pH (Lin et al., 1973) and that during the cultivation of
mycelia, the media becomes acidic and when it reaches this acidic level (pH 3 to 4) the
growth of the mycelia is retarded (Lin et al., 1973). In contrast to this, Kim et al.
(2002a) found that the pH of the liquid medium in which Ganoderma was grown
increased, while the other fungi tested caused a decrease in the medium pH.
It has been demonstrated that the mycelium from a number of fungal species can grow
over a wide range of pH values (Lonergan et al., 1993; Yang & Liau, 1998). Yang &
Liau (1998) observed that for G. lucidum grown in a glucose ammonium chloride

Chapter 2 – Literature Review
25
medium the optimal pH for mycelial growth was 4, however, when it was grown in a
glucose malt extract medium they observed that the optimal pH for mycelial growth was
5. They concluded that the optimal initial pH for the growth of the mycelium could
change depending on the cultivation medium used. Fang & Zhong (2002b) also
observed that the initial pH of the cultivation medium affected the production of
mycelial biomass. They reported that as the initial pH of the medium decreased from
6.5 to 3.5, the production of mycelial biomass decreased. Earlier, Lin et al. (1973)
noted the morphology and size of the mycelial pellet varied as the pH of the culture
medium changed for a range of Ganoderma species. At acidic pH (4), colonies of
Ganoderma species were covered with ‘feather like hairs’, whereas at pH 7, the
colonies appeared small, with or without short hair like structures.
Shear stress as a result of agitation can affect the morphology of the mycelium, which
can directly reduce the cell growth and bioactive compound production (Pace, 1980).
Too low an agitation speed may limit the oxygen transfer in the medium, reducing
mycelial biomass production, whilst too high an agitation speed has been shown to
increase the sheer stress on the mycelium, which in turn, also decreases biomass
production (Yang & Liau, 1998). It has been reported that a favourable agitation speed
for Ganoderma is approximately 100 rpm (Lin et al., 1973; Yang & Liau, 1998).
Zhong et al. (2002) investigated the production of mycelial biomass with respect to
available oxygen. They observed that a high initial oxygen supply increased mycelial
biomass production.
Inoculation density has been shown to be an important factor for many cell culture
processes (Johansen et al., 1998; Wang et al., 1997a) including the submerged culture
process of Ganoderma (Fang et al., 2002; Yang & Liau, 1998). Fang et al. (2002)
observed that a large inoculation density led to a small pellet size while a low
inoculation density led to a larger pellet size. The mycelial pellet size has been reported
to be another factor of importance in mycelial cultivation (Fang & Zhong, 2002a). Lin
et al. (1973) suggested that it was best to select a three to four day old culture, when
liquid culture is used as the inoculum for mycelial growth, as the fungal mycelium has
just started to enter the logarithmic growth phase.
Chapter 2 – Literature Review
26
Light is not necessary for the growth of mycelia in liquid cultures or on an agar
medium. Submerged cultivation experiments with Ganoderma species and many other
fungi show that strong light can inhibit the mycelial growth (Lin et al., 1973).
2.4.4 Investigation of Growth Parameters for Bioactive Compounds More recently, environmental and culture media have been investigated with regards to
the effect they have on the extracellular or intracellular bioactive components found in
the mycelium of G. lucidum (Fang et al., 2002; Fang & Zhong, 2002a, 2002b, 2002c;
Kim et al., 2002a; Lee et al., 1999; Tang & Zhong, 2002; Yang et al., 2000; Zhong et
al., 2002). Since many metabolites are produced only in minute amounts, it is often an
advantage if the medium can be manipulated to ensure that the highest quantity and
quality of bioactive components are produced.
The majority of biologically active compounds reported from Ganoderma species can
be attributed to two major groups of metabolites, the polysaccharides or ganoderic acids
(lanostane type compounds, triterpenes). The activity of compounds from within these
two groups and their therapeutic effects are discussed in the latter part of this review
(Sections 2.5.1 and 2.5.2, respectively). These two classes of metabolites have been
used frequently in investigations as markers to determine the effect that different
environmental and nutrient conditions can have on the production of valuable
metabolites.
It has been observed that good mycelial growth does not ensure that a high production
of polysaccharides is achieved (Sone et al., 1985; Tang & Zhong, 2002). The carbon
source, in the growth medium, was observed to play an important role in polysaccharide
production (Kim et al., 2002a). Tang & Zhong (2002) noted that, while sucrose was
suitable for extracellular polysaccharide production but not for cell growth, lactose was
a more suitable carbon source for cell growth and intracellular polysaccharide
production. Park et al. (1994) reported that high levels of mycelial growth were closely
related to high production levels of a protein-bound polysaccharide from the mushroom
C. versicolor. It has also been reported that extracellular polysaccharide production is
affected by the pH of the culture medium (Wang & McNeil, 1995) and that lowering the

Chapter 2 – Literature Review
27
pH of the medium increases the extracellular and intracellular polysaccharide
production in submerged culture (Fang & Zhong, 2002b).
Inoculum size has also been shown to have a marked effect on polysaccharide and
ganoderic acid formation (an important secondary metabolite in Ganoderma species) in
submerged cultures of G. lucidum (Fang et al., 2002). A large inoculation density (670
mg L-1 dry weight) was found to lead to a small pellet size and high production of
extracellular and intracellular polysaccharides, whilst a low inoculation density (70 mg
L-1) led to a relatively large pellet size and high accumulation of ganoderic acid.
Oxygen supply within the medium has also been shown to have a marked effect on
polysaccharide and ganoderic acid production (Zhong et al., 2002).
2.4.5 Effect of Species and Strain on Ganoderma Growth It is recognised by researchers that the growth and dispersal of fungi in natural
environments varies among fungal genera, species and strains (Knudsen & Stack, 1991).
It is also well known that different strains can produce different compounds (Nishitoba
et al., 1986). Consequently, the methods employed in mushroom cultivation, whether it
be solid substrate or liquid cultivation, may require modification from one geographical
region to another due to different environmental conditions and the presence of different
species of microorganisms (Chang, 1999).
The quantity of mycelial biomass produced varies widely depending on the mushroom,
substrate and conditions used for cultivation (Yang & Liau, 1998). Kim et al. (2002a)
studied a number of fungi, which included two Ganoderma species, in liquid culture
and observed that the rate of mycelial growth was different between genera and some
species. It was concluded that two Ganoderma isolates, initially thought to be the same
species, were actually unique. Not only do cultivation conditions differ between species
and strains but storage conditions may vary too. The black Ganoderma found in China
have been reported to have an extreme intolerance to low temperatures. Mayzumi et al.
(1997) observed that cultures from the black Ganoderma died when frozen for two days
or stored at 20°C for twenty days. They also reported the red Ganoderma from Japan to
be cold tolerant (temperature not reported) (Mayzumi et al., 1997).

Chapter 2 – Literature Review
28
Ganoderma species isolated from Asian, European and Northern and Southern
American countries have been investigated for their optimal environmental and culture
medium conditions. However, there appears to be little information of this type that has
been published in peer reviewed journals. There is evidence to suggest that growth data
is dependant on the species and the region from which the fungus was originally
isolated (Moncalvo et al., 1995a). As a result, a local cultivator would need to
investigate the optimal growth conditions for each species and strain they are working
with, rather than simply use the conditions reported as optimal for a different
environmental region.
2.5 Bioactive Substances in Ganoderma Species Many bioactive compounds have been found in mushrooms, some of which inhibit the
growth of cancer cells in vitro, have antiviral activity in vitro, or have other health
benefits in vivo. These substances may be useful as starting materials for the
development of chemical therapeutic agents in cancer treatment and for other ailments
(Mizuno, 1995). Many investigations are currently underway to maximise the
production and the utilisation of these functional molecules (Fang & Zhong, 2002b;
Kim et al., 2003; Lee et al., 1999; Wang & McNeil, 1995). In addition, the modes of
action of these compounds are being investigated (Eo et al., 2000; Gao et al., 2002b;
Lei & Lin, 1992; Zhang et al., 2002a).
Polysaccharides, triterpenes, sterols, lectins and proteins are some of the major active
constituents that have been isolated from G. lucidum and its closely related species, with
the first two compounds being the most extensively investigated. A list of the important
bioactive components and their biological functions found in Ganoderma species is
given in Table 2.1.

Chapter 2 – Literature Review
29
Table 2.1 Major bioactive constituents in Ganoderma species and their function
Bioactive Constituent
Effects (in vitro) Source
Immunomodulatory - antitumour (Gao et al., 2000a, 2000b; Lei & Lin, 1992; Li et al., 2000; Li & Zhang, 2000; Lieu et al., 1992; Ooi et al., 2002; Sasaki et al., 1971; Sone et al., 1985; Wang et al., 1997b; Zhang & Lin, 1999)
Hepatoprotective (Zhang et al., 2002a) Hypoglycaemic (Hikino et al., 19985, 1989; Hikino &
Mizuno, 1989; Tomoda et al., 1986; Zhang & Lin, 2004)
Antifibriotic (Park et al., 1997) Antiinflammatory (Ukai et al., 1983) Radiation protective and DNA damage, antioxidant, DNA strand breakage
(Kim & Kim, 1999b; Lee et al., 2001; Liu et al., 1997)
Polysaccharidesa
Antiherpetic (Eo et al., 1999a, 2000; Kim et al., 2000; Oh et al., 2000)
Cytotoxicity (Gan et al., 1998a; Gao et al., 2002a; Gonzalez et al., 2002; Kimura et al., 2002; Lin et al., 1991, 2003; Min et al., 2000; Su et al., 2000; Wu et al., 2001)
Antiviral (El-Mekkawy et al., 1998; Min et al., 1998; Mothana et al., 2003)
Anticomplement activity (Min et al., 2001) Hypolipidemic (cholesterol inhibitors)
(Komoda et al., 1989; Shiao, 1992)
Hypotensive (ACE) (Morigiwa et al., 1986) Antiplatelet aggregation activity (Shiao, 1992; Wang et al., 1991) Hepatoprotective (Chen & Yu, 1999; Kim et al., 1999) Antioxidant (Zhu et al., 1999) Antiinflammatory (Giner-Larza et al., 2000) Enzyme inhibitors (Lee et al., 1998)
Terpenoids and related compoundsb
Antibacterial (Smania et al., 1999) Immunomodulatory (Haak-Frendscho et al., 1993; Miyasaka et
al., 1992; van der Hem et al., 1995) LZ-8c
Immunosuppressive (antibody production)
(Kino et al., 1989, 1990, 1991; van der Hem et al., 1995)
Lectinsd Unknown Mitogenic activity
(Kawagishi et al., 1997) (Ngai & Ng, 2004)
Adenosine Antiplatelet aggregation activity (Kawagishi et al., 1993; Shimizu et al., 1985)
a Polysaccharides, one of the main bioactive constituents isolated from Ganoderma, discussed in detail in Section 2.5.1; b Terpenoids and related compounds, discussed in Section 2.5.2; c LZ-8, a protein with biological activity, discussed in Section 2.5.3; d Lectins, carbohydrate type proteins, discussed in Section 2.5.4.
Chapter 2 – Literature Review
30
There are many biologically active metabolites present in the mycelium of mushrooms
grown in submerged cultures (Lorenzen & Anke, 1998), however, it is apparent that
many researchers have a principal interest in the fruiting body in the search for bioactive
substances. Lorenzen & Anke (1998) noted that the metabolites of fruiting bodies often
are not similar to those of mycelia from submerged cultures, which may be influenced
by the different stages of development. Therefore, it is useful to investigate all stages of
growth of the mushroom for the presence of bioactive molecules. Researchers
investigating Ganoderma for bioactivity have found active compounds in the liquid
cultivated mycelium (Chen et al., 2000; Gao et al., 2000b; Lin & Shiao, 1988; Sone et
al., 1985) and in the culture medium (Song et al., 1998; Tasaka et al., 1988a). The
spores have also been found to be a valuable source of bioactive compounds (Min et al.,
2001; Zhu et al., 2000).
2.5.1 Polysaccharides from Ganoderma Attention has recently focused on the development of immunotherapeutic compounds
that can identify and eliminate cancer cells as foreign matter (non-self), or be able to act
on substances such as immunopotentiators, immunoinitiators and biological response
modifiers (BRM) (Zhou & Gao, 2002). It is generally accepted that mushroom
polysaccharides have a mode of action that enhances the body’s immune response,
rather than having direct cytotoxicity towards the tumour cells. Therefore, they are
known to be BRM and it is these polysaccharides that have the potential to be
developed into medicines that are not only carcinostatic, but also have
antiinflammatory, antiviral, hypoglycaemic, hypotensive, and antithrombotic properties
(Mizuno et al., 1995c). The development in research on antitumour polysaccharides in
fungi has been extensively reviewed (Mizuno, 1996, 1999; Ooi & Liu, 1999; Wasser,
2002).
2.5.1.1 Structure of Polysaccharides
The major bioactive polysaccharides isolated from Ganoderma species are glucans, β-1-
3 and β-1-6 D-glucan. The basic structure is β-1-3 D-glucopyronan with 1 to 15 units
of β-1-6 monoglucosyl side chains (Mizuno, 1991). Other antitumour polysaccharides
of G. lucidum are heteropolysaccharides, glycoproteins (polysaccharides connected to
proteins), or a group of polysaccharides known as ganoderans A, B and C (Lindequist,

Chapter 2 – Literature Review
31
1995). The antitumour polysaccharides differ greatly in their sugar composition and
consequently in chemical structure, but one common feature is their relatively high
molecular weight (Kim et al., 1993). It has been reported that polyglucans with a higher
molecular weight (104-6 Daltons) tend to have greater water solubilities and therefore
have a more effective antitumour activity (Mizuno, 1991), although some water
insoluble polysaccharides in Ganoderma species, known as diet fibres, also have
displayed antitumour activity (Wang et al., 1993). Antitumour activity in vitro has also
been linked to the frequency of polysaccharide branching, which changes with each
stage of mycelial growth (Chen & Miles, 1996a).
2.5.1.2 Isolation of Mushroom Polysaccharides
Bioactive polyglycans (polysaccharides) are found in all parts of the mushroom,
including the mycelium, or they may be secreted into the growth medium and become
extracellular. Bioactive polysaccharides undergo structural changes at different growth
stages of the mushroom (Chen & Miles, 1996a). It is also known that different
polysaccharides can be extracted from the fruiting bodies and mycelia (Mizuno, 1999),
nevertheless, antitumour polysaccharides appear to exist in both the fruiting bodies and
the mycelium of Ganoderma species. Of the polysaccharides characterised from
Ganoderma species, most have been isolated from the fruiting body of the mushroom
(Bao et al., 2002; Wang et al., 1996; Zhang & Lin, 1999a, 1999b, 2004) and from the
mycelial biomass cultivated in liquid culture (Chen et al., 2000; Kim et al., 1993; Zhang
et al., 1994; Zhao & He, 2002), and only few from the culture medium (Kim et al.,
2003; Sone et al., 1985). Polysaccharides that have been characterised from
Ganoderma species include: β-D-glucans (Sasaki et al., 1971; Sone et al., 1985; Usui et
al., 1983), glycans (Hikino et al., 1985; Tomoda et al., 1986), protein bound
polysaccharides (Cheong et al., 1999; Eo et al., 1999a; Kim et al., 1993) and
heterogalactans (Miyazaki & Nishijima, 1982; Usui et al., 1981).
According to folklore, G. lucidum is the type species that possess the most potent
therapeutic properties (Willard, 1990). Hence, only few investigations have been
performed on polysaccharides from G. applanatum (Nakashima et al., 1979; Sasaki et
al., 1971; Usui et al., 1981, 1983), G. japonicum (Ukai et al., 1983), G. tsugae (Gao et
al., 2000a, 2000b; Wang et al., 1993; Zhang et al., 1994) and other Ganoderma species.

Chapter 2 – Literature Review
32
2.5.1.3 Polysaccharide Mode of Action
It has been widely reported that antitumour and anticancer effects of polysaccharides
arise from the enhancement of the host’s immune system rather than direct cytocidal
effects (Gao et al., 2000a, 2000b; Lieu et al., 1992; Wang et al., 1997b). The
mechanisms by which antitumour activity is achieved still remain unclear, and it has
only been in the last five years that there have there been reports investigating their
mode of action (Cao & Lin, 2003; Eo et al., 2000; Gao et al., 2002b; Ooi et al., 2002;
Zhang & Lin, 1999a, 2004; Zhang et al., 2002b). It should also be noted that the effect
of cytotoxicity might be dependent on the extract concentration. Cao et al. (1993)
reported that low concentrations (0.1 or 0.5 mg per mouse) of a polysaccharide from G.
lucidum had immunostimulating activities but higher concentrations (2 or 4 mg per
mouse) were found to be immunosuppressive.
2.5.2 Triterpenoids, Sterols and Related Compounds Terpenes or terpenoids are amongst the compounds responsible for the medicinal,
culinary and fragrant uses of aromatic and medicinal plants (Dorman & Deans, 2000).
Terpenoids can be classified into four main groups, 1) the volatile mono- and
sesquiterpenes (C10 and C15), which are commonly known as essential oils; 2) the less
volatile diterpenes, (C20); 3) the involatile triterpenoids and sterols (C30); and, 4) the
carotenoid pigments (C40) (Harbourne, 1973). The majority of investigations reporting
terpenoids from Ganoderma have been on the less volatile triterpenoid (triterpene) and
sterol type compounds, thus, this review focuses only on compounds from within these
classes.
An extensive review by Mahato et al. (1992) described the isolation, characterisation
and biological activity of triterpenoids found in fungi and plants. Within the kingdom
Fungi, most of the triterpenoids and steroids that have been isolated are from G.
lucidum, although in recent years, other Ganoderma species have become a source of
interest due to the bioactive constituents they have been found to possess. Triterpenes
are thought to be potential anticancer agents due to the biological activity they have
exhibited against actively growing tumours in vitro (Lin et al., 2003).

Chapter 2 – Literature Review
33
2.5.2.1 Structure and Naming of Triterpenoids
There is some confusion over the designated names of Ganoderma triterpenoids.
Lindequist (1995) suggested that when studying the different triterpenes, one should
include the systematic IUC name that indicates the chemical structure of the compound.
A summary of most of the triterpenoid components of G. lucidum according to their
structural relationship has been reported (Kim & Kim, 1999a), but there is still a need
for a thorough investigation and coordination of the designated names of triterpenoid
constituents within the Ganoderma family.
The triterpene chemical structure is based on the ground structure of lanosterol (Figure
2.2), which is an important intermediate in the biosynthetic pathway for steroids and
triterpenes in microorganisms and animals (Chang & Buswell, 1999). Stereochemical
variation of the structure produces the diversity of triterpenes.
Figure 2.2. Structure of lanosterol (C30H50O) (Moss, 2004).
2.5.2.2 Isolation of Triterpenes
Strigina et al. (1971) and Protiva et al. (1979) were the first to report the isolation of
triterpenes and steroids from G. applanatum and two of the most widely investigated
triterpenes, ganodermic acid A and B from G. lucidum, were first isolated by Kubota et
al. (1982). Since then, the physiochemical properties of over 100 lanostane-type
triterpenoids have been described (Kim & Kim, 1999a).

Chapter 2 – Literature Review
34
Later in 1986, Nishitoba et al. suggested that triterpenes are specific to G. lucidum.
Since then, there have been reports of triterpenes isolated from other Ganoderma
species, including G. colossum (Kleinwachter et al., 2001), G. applanatum (Chairul &
Hayashi, 1994; Chairul et al., 1991; Gan et al., 1998b), Ganoderma sp. (Chairul et al.,
1990), G. tsugae (Chen & Chen, 2003; Gan et al., 1998a; Su et al., 2000), G. concinna
(Gonzalez et al., 2002), G. tropicum (Aryantha et al., 2002) and G. pfeifferi (Mothana et
al., 2003).
Over the last two decades, the isolation of triterpenes from the fruiting body of
Ganoderma species has been well documented (Chairul & Hayashi, 1994; Chairul et al.,
1991; Gonzalez et al., 1999, 2002; Kikuchi et al., 1986a, 1986b, 1986c; Luo & Lin,
2001; Luo et al., 2002; Ma et al., 2002; Protiva et al., 1979; Rosecke & Konig, 2000).
Many of these isolated triterpenes have shown biological activity (El-Mekkawy et al.,
1998; Gao et al., 2002a; Kimura et al., 2002) and therefore these compounds represent
promising candidates as new antitumour and antiviral agents. Investigators have also
become interested in isolating triterpenes from the spores of Ganoderma (Chen & Yu,
1991, 1999). These compounds have been shown to possess strong antitumour and
antiviral activity (Min et al., 1988, 2000, 2001) and have been shown to have higher
concentration of ganoderic alcohol and acid content than the fruiting bodies of G.
lucidum (Min et al., 1998). It was suggested that there is little triterpene formed in the
mycelial pellets of liquid shaking cultures (Su, 1991), however, there have been other
reports indicating the isolation of triterpenes from the liquid cultivated mycelial biomass
of Ganoderma (Hirotani et al., 1986; Lin & Shiao, 1988; Shiao et al., 1987, 1988a,
1988b). More recently, there have been investigations into the molecular mechanism of
antitumour triterpenes from the mycelium of G. lucidum (Lin et al., 2003).
An HPLC procedure has been developed for the isolation and purification of
oxygenated triterpenoids from crude extracts (Lin & Shiao, 1987) and this procedure
has proved to be an invaluable tool in investigating the triterpenoid patterns within
Ganoderma species. Using HPLC, Nishitoba et al. (1986) investigated the strain
specific terpenoid patterns of G. lucidum and found that there was a clear difference in
terpenoid patterns between the strains, while Hirotani et al. (1993) examined the
terpenoid patterns of three strains of G. lucidum and found that two were similar. Chen
Chapter 2 – Literature Review
35
et al. (1999) showed that HPLC analysis of the triterpenoids of different G. lucidum
strains showed different HPLC patterns, indicating the presence of different
triterpenoids, while different G. tsugae strains showed similar patterns. They concluded
that the spectral patterns between the two mushroom species were different. In addition
to this, it has been suggested that HPLC analysis of Ganoderma triterpenoids is a simple
and easy way to differentiate among different species of the genus (Su et al., 2001).
2.5.2.3 Triterpenoid Mode of Action
Recently, the mode of action of triterpenes has been of interest to many researchers
(Gonzalez et al., 2002; Kimura et al., 2002; Lin et al., 2003). The mode of action of
triterpenes is different to the mode of action of polysaccharides. Rather than enhancing
the immune system, as polysaccharides do, triterpenes have been shown to have direct
cytotoxicity against tumour cells (Gonzalez et al., 2002). An investigation by Gonzalez
et al. (2002) found that three triterpenes induced cell death by apoptosis in human
promyelocytic leukaemia HL-60 cells, in vitro, while Kimura et al. (2002) suggested
that the antitumour and antimetatstatic activities of the triterpenoid fraction of G.
lucidum might be due to the inhibition of tumour-induced angiogenesis.
2.5.2.4 Bitter Triterpenoids
The fruiting bodies of G. lucidum contain some intensely bitter compounds (Lindequist,
1995) and this characteristic bitterness of Ganoderma is not found in any other
mushroom (Mizuno et al., 1995b). It has been suggested that the fruiting body (and not
the mycelium) of G. lucidum is the only species to contain bitter triterpenoids (Mizuno,
1995). It has also been suggested that the bioactivity is related to the bitterness (i.e. the
more bitter, the greater the bioactivity), although the relationship is not fully understood
(Mizuno, 1997). Nishitoba et al. (1988) investigated the relationship between the
chemical structures and bitterness and concluded that the spatial relationship of the
hydrophobic methyl groups to the three functional oxygen atoms plays a significant role
in generating bitterness.
2.5.2.5 Other Steroidal Constituents
Sterols, compounds closely related to triterpenoids, are also found in Ganoderma
(Yokokawa & Mitsuhashi, 1981). They have been isolated from the fruiting body and

Chapter 2 – Literature Review
36
mycelium (Chen & Yu, 1991; Hirotani et al., 1987; Protiva et al., 1979; Strigina et al.,
1971) and have also been shown to exhibit potent cytotoxic activity (Lin et al., 1991).
A specific sterol, ergosterolperoxide, was isolated from G. lucidum (Arisawa et al.,
1986) and has been shown to enhance the inhibitory effect of linoleic acid on the
inhibition of mammalian DNA polymerase β (Mizushina et al., 1998b).
2.5.3 Proteins One of the most important proteins isolated from the mycelium of G. lucidum is Ling
Zhi-8 (LZ-8) (Kino et al., 1989). LZ-8 is a polypeptide consisting of 110 amino acid
residues with an acetylated amino terminus and has a molecular mass of 12 kDaltons
(Tanaka et al., 1989). The native form of LZ-8, with a molecular mass of 24 kDaltons
is a homodimer of the LZ-8 polypeptide (Tanaka et al., 1989). This protein has been
shown to have mitogenic activity in vitro and immunomodulating activity in vivo
(Haak-Frendscho et al., 1993; Kino et al., 1989; van der Hem et al., 1995).
2.5.4 Lectins Lectins are found in plants, animals, microorganisms and fungi. They are carbohydrate-
proteins of non-immune origin, which agglutinate cells or precipitate polysaccharides or
glycoconjugates (Goldstein et al., 1980). Reviews by Wang et al. (1998) and
Kawagishi (1995) highlight that there have been relatively few studies conducted on
mushroom lectins. The protein LZ-8 displays many biological characteristics of lectins
including mitogenic and haemagglutinating activities, although it is not claimed as a
lectin per se (Wang et al., 1998). Kawagishi et al. (1997) isolated a lectin from the
mycelium and fruiting body of G. lucidum that was distinctly different from the LZ-8
protein isolated by Tanaka et al. (1989) and Wang et al. (1998). Of the lectins that have
been isolated from mushrooms, many have yet to be assessed for their biological
activity.
More recently, Ngai & Ng (2004) isolated a lectin from G. capense that exhibited potent
mitogenic activity toward mouse splenocytes and antiproliferative activity toward
leukaemia cells and hepatoma cells in vitro. They also observed the lectin to exhibit
more potent mitogenic activity than that of concanavalin A (Con A), which is a lectin

Chapter 2 – Literature Review
37
extracted from the jack bean (Oxford, 1997) and one of the most widely used and well
characterised lectins (Haufe et al., 2004; Martinez-Cruz et al., 1999).
2.6 Biomedical Applications There have been a number of reviews published on the biomedical applications of
mushrooms in general (Borchers et al., 1999; Mizuno, 1995; Mizuno et al., 1995a,
1995c; Wasser & Weis, 1999b, 1999c) and Ganoderma species in particular (Mizuno et
al., 1995b; Su, 1991). Recently, a review was published on the immunomodulating
effects of G. lucidum, which outlined the mode of actions of a number of biologically
extracted compounds (Zhou & Gao, 2002). Ganoderma is best known for its
immunostimulatory effects in aiding cancer treatment and for its anti-HIV activity.
Over the last decade, there has been an increasing amount of research to investigate
Ganoderma species for new biomedical applications. Some of the applications that the
mushroom extracts and constituents have been found to play important roles in include:
hepatoprotective activity, hypoglycaemic activity, hypolipidimic activity, antihistamine
release, antiinflammatory properties, antiplatelet aggregation activity, anticomplement
activity, antiviral activity, enzyme inhibition and in the healing of open skin wounds.
2.6.1 Cytotoxic Antitumour Activity Fractions from G. lucidum have been shown to inhibit tumour growth through activation
of host-mediated immune responses by stimulating the production of inducing cytokines
(or cytotoxic T lymphocytes) by mononuclear leukocytes (Lieu et al., 1992) and
promoting the production of interleukin 2 (Lei & Lin, 1992; Ooi et al., 2002). The
activity and mechanism of these polysaccharides is still a major area of research. Zhang
& Lin (1999) suggested that the antitumour activity of the polysaccharide extract from
G. lucidum was related to apoptosis induced by TNF-α release from macrophages and
IFN-γ release from T lymphocytes. Wang et al. (1997b) supported this conclusion and
also found that the two cytokines acted synergistically on the inhibition of leukemic cell
growth. It has also been observed that the host mediated antitumour effect is increased
by the attachment of polyol groups to glucans (Sone et al., 1985).
Antitumour activity against transplanted sarcoma 180 in mice has been exhibited by the
β-D-glucan polysaccharides from the fruiting body of G. applanatum (Sasaki et al.,
1971), G. lucidum (Sone et al., 1985) and the culture fluid of G. lucidum (Sone et al.,

Chapter 2 – Literature Review
38
1985). Ooi et al. (2002) also observed the suppression of growth of Sarcoma 180 solid
tumour in mice and also observed a marked increase in the expression levels of seven
immunomodulatory cytokines when in the presence of a hot water extracted G. lucidum
polysaccharide. In contrast to this, there was no cytotoxic effect observed for a water-
insoluble glucan from G. japonicum against sarcoma 180 in mice (Ukai et al., 1983) or
for the mycelial extract from G. lucidum on oral tumour cells in vitro (Chen et al.,
1991).
Triterpenoids from the fruiting bodies of G. lucidum and G. applanatum, and malonate
half-esters from the fruiting body of Ganoderma sp., have shown biological activity as
inhibitors against tumour promotion (Chairul & Hayashi, 1994; Chairul et al., 1991; Lin
et al., 1991), however, some esters showed toxicity at high concentrations (Chairul et
al., 1990). Su et al. (2000) examined the cytotoxic activity of lanostanoids from G.
tsugae in vitro and found them to exhibit significant activity against T-24, HT-3, and
CaSKi cells (three cancer cell lines). Further to this, Gan et al. (1998a) isolated a
lanostanoid and sterol from the same fungus, which caused cell death by apoptosis and
suggested that the sterol possessed the activity of cell cycle inhibition. Gonzalez et al.
(2002) also observed apoptosis in human promyelocytic leukaemia HL-60 cells exposed
to three lanostanoids isolated from G. concinna.
2.6.2 Hypoglycaemic Activity Zhang & Lin (2004) observed a polysaccharide isolated from the fruiting body of G.
lucidum to possess a hypoglycaemic effect in mice, by its insulin-releasing activity due
to facilitation of Ca2+ inflow to the pancreatic β cells. Earlier, Hikino et al. (1985)
observed two different glycans from the same species to also have significant
hypoglycaemic activity in mice (Hikino et al., 1985). The mechanisms of the glycans
were further investigated by Hikino et al. (1989) and Hikino & Mizuno (1989). Further
studies by Tomoda et al. (1986) found that they were not glycans but were
peptidoglycans.
2.6.3 Inhibition of DNA Polymerases and Other Enzymes Polysaccharides have been shown to enhance the activity of DNA polymerases (Lei &
Lin, 1993). Lei and Lin (1993) observed the activity of DNA polymerase α (a DNA

Chapter 2 – Literature Review
39
polymerase required for nuclear DNA replication) to increase in the splenocytes of 24-
month-old mice, after they had administered Ganoderma polysaccharides (GL-B)
intraperitoneally, once a day for 4 days. In contrast, three triterpenoids isolated from
the same fungal species were reported to inhibit the activity of calf DNA polymerase α,
as well as rat DNA polymerase β (a DNA polymerase implicated to be involved in
DNA repair, recombination and DNA replication) (Mizushina et al., 1999). Mizushina
et al. (1999) also observed that two of the terpenes, lucidenic acid O and lucidenic
lactone, inhibited the human immunodeficiency virus type 1 (HIV-1) reverse
transcriptase. Earlier, two cerebroside compounds were also isolated from G. lucidum
that selectively inhibited the activities of replicative DNA polymerases in mammals
(Mizushina et al., 1998a). These cerebrosides were observed to have little effect on the
activities of eukaryotic DNA polymerase β, prokaryotic DNA polymerases, terminal
deoxynucleotidyl transferase, HIV reverse transcriptase, RNA polymerase,
deoxyribonuclease I and ATPase.
Morigawa et al. (1986) observed that the 70% methanol extract from the fruiting body
of G. lucidum inhibited angiotensin converting enzyme (ACE) in vitro, which is an
enzyme involved in the control of hypertension. From this extract they identified ten
lanostane triterpenes, of which eight exhibited activity.
2.6.4 Influence on Aggregation of Platelets Blood platelets play an important role in thrombosis and haemostasis and the
aggregation of platelets occurs when the cells respond to agonist stimulation.
Ganodermic acid S, from G. lucidum, has been shown to induce platelet aggregation by
stimulating the hydrolysis of phosphatidylinositol 4,5-bisphosphate (Shiao, 1992). Wen
et al. (1997) found that G. japonicum exhibited an antithrombotic effect and the
inhibition of blood coagulation and platelet activation. Tao & Feng (1990) showed that
a Chinese herbal medicine made from G. lucidum inhibited platelet aggregation when
given to patients with atherosclerotic diseases. Adenosine has also been shown to
inhibit platelet aggregation (Shimizu et al., 1985). In contrast to this, Gau et al. (1990)
found that the administration of crude Ganoderma extracts, known to have a high
content of adenosine, had no effect on platelet aggregation in haemophiliac patients who

Chapter 2 – Literature Review
40
were HIV positive. An epimer of 5’-deoxy-5’-methylsulphinyladenosine was found to
inhibit platelet aggregation in vitro (Kawagishi et al., 1993).
2.6.5 Hypolipidimic Activity Elevation of cholesterol level in plasma is a main risk factor for the development of
atherosclerosis and heart disease. Therefore, agents with hypolipidemic activity, for
instance inhibitors of cholesterol biosynthesis and of cholesterol absorption, are of great
therapeutical value. The powdered fruiting bodies of G. lucidum were reported to lower
plasma cholesterol levels in spontaneously hypertensive rats (Kabir et al., 1988). In
particular, sterols (Komoda et al., 1989) and oxygenated triterpenes (Shiao, 1992) have
been shown to inhibit cholesterol synthesis in vitro. In contrast, a polysaccharide,
ganoderan B, was shown to have no inhibitory effect (Hikino et al., 1989).
2.6.6 Inhibition of Histamine Release Histamine release from mast cells is an important step in the pathogenesis of
inflammation, allergies and anaphylactic shock. An ethanolic extract from the
mycelium of G. lucidum has been shown to exhibit significant antiinflammatory effects
(Kendrick, 1985). In addition, the compounds cyclooctasulfur (Tasaka et al., 1988b)
and oleic acid (Tasaka et al., 1988a), isolated from the culture broth of G. lucidum, were
both found to inhibit histamine release from rat peritoneal mast cells and impede
calcium uptake into these cells without affecting the cyclic AMP content.
2.6.7 Hepatoprotective Polysaccharides from G. lucidum have been reported to have potent hepatoprotective
activity (Kim et al., 1999; Zhang et al., 2002a). Song et al. (1998) isolated an
extracellular polymer from the culture fluid of G. lucidum that exhibited
hepatoprotective properties by lowering the glutamic pyruvic transaminase (GPT)
activity in the serum of intoxicated rats. This mechanism was also observed by Chen &
Yu (1999) who studied the effects of ganosporeric acid A, a triterpene from the spores
of G. lucidum, in mice with liver injury. Shieh et al. (2001) concluded that the hepatic
and renal protective mechanism of G. lucidum might be due at least in part to its
prominent superoxide scavenging effect, because the Ganoderma extract could protect
the liver and kidney from superoxide induced hepatic and renal damages. In addition,

Chapter 2 – Literature Review
41
Lin et al. (1995) observed that the greatest antihepatotoxic activity also exhibited the
greatest free radical scavenging activity.
2.6.8 Antioxidants Reactive oxygen species (ROS), such as superoxide anions and hydroxyl radicals, can
induce carcinogenesis and other pathological diseases by acting as initiating or
promoting agents (Lakshmi et al., 2003; Lee et al., 2001). Therefore, the inactivation or
elimination of ROS may be critical in preventing these diseases.
Protein bound polysaccharides from G. lucidum (Lee et al., 2001; Liu et al., 1997; You
& Lin, 2002), methanolic extracts from G. tsugae (Yen & Wu, 1999) and ethanolic
extracts from G. lucidum (Lakshmi et al., 2003) have exhibited superoxide and
hydroxyl radical scavenging activity. A hot water extract of G. lucidum has exhibited
antioxidative effect on mouse liver and kidney lipid peroxidation (Shieh et al., 2001)
and extracts have also been found to reduce strand breakage in DNA caused by UV
induced photolysis of hydrogen peroxide (Kim & Kim, 1999b; Lee et al., 2001). Liu et
al. (1997) concluded that the lower the polysaccharide/protein ratio in protein bound
polysaccharides, the greater the activity. Phenols have also been identified as a major
constituent in methanolic extracts of mushrooms as naturally occurring antioxidants
(Mau et al., 2002). Ganoderma species were also found to possess higher antioxidant
activity, reducing power, and scavenging and chelating abilities than the other
mushrooms studied. There have been few investigations of the antioxidant activities of
triterpenes from Ganoderma species (Zhu et al., 1999).
2.6.9 Wound Management Fungi are an attractive source of chitin for medical application because the chitin is
produced in a filamentous form and it can be manufactured under standard conditions
(Hamlyn & Schmidt, 1994). The use of chitin to promote wound healing has been
reported (Balassa & Prudden, 1978) and it has been suggested that chitin accelerates the
healing process (Olsen et al., 1989). A chitin membrane, known as “sacchachitin”, was
prepared and developed from the residue of the fruiting body of G. tsugae (Su & Hsu,
1995). The membrane was shown to enhance the proliferation and migration of
fibroblasts around wounds when applied as skin substitutes (Su et al., 1996, 1997,

Chapter 2 – Literature Review
42
1999). Further, it was reported by Hung et al. (2001) that sacchachitin showed no
cytotoxicity and its action in promoting wound healing may have been due to its
chemotactic effect for inflammatory cells, which in turn may facilitate subsequent
angiogenesis, granulation tissue formation, and faster new tissue formation, leading to
faster wound healing. Chemical analysis of the sacchachitin membrane revealed that
the treated residue was a copolymer of beta-1,3-glucan (ca 60%) and N-
acetylglucosamine (ca 40%) (Su et al., 1997).
2.7 Antimicrobial Compounds In recent years, there have been a significant number of human pathogenic bacteria
becoming resistant to antimicrobial drugs (Davis, 1994; Donadio et al., 2002a;
Lorenzen & Anke, 1998; Mulligen et al., 1993) and this is in part due to the misuse and
overuse of current antibiotics (Monroe & Polk, 2000). Antimicrobial drug resistance is
of major economic concern having an impact on physicians, patients, health care
administrators, pharmaceutical producers and the public (McGowan, 2001). In addition,
bacteria and fungal pathogens have complicated the treatment of infectious diseases
(Baratta et al., 1998; Diamond, 1993). Given the increase in multiple drug resistance of
human pathogenic microorganisms, it is imperative that new and effective therapeutic
agents are developed.
Traditional tribal communities, indigenous people and the eastern world have been
using plants, spices and fungi for thousands of years as therapeutic agents. For the past
two decades attention has turned to the extracts and biologically active compounds used
in traditional herbal medicine to uncover the scientific basis of their remedial effects
and to seek new lead compounds for development into therapeutic drugs (Cragg et al.,
1997).
Plant extracts as antimicrobial agents have been investigated (Dorman & Deans, 2000;
Palombo & Sempe, 2001, 2002; Vlietinck et al., 1995) and have been found to contain
many biologically active components (Cowan, 1999). An extensive review by Cowan
(1999) reported the major groups of antimicrobial compounds found in plants and the
important experimental methods required in determining new active compounds.

Chapter 2 – Literature Review
43
In addition to plants extracts as sources of antimicrobial agents, research is being
performed on fungi for their ability to mobilize the body’s humoral immunity and in
turn prevent bacterial, viral, or fungal pathogens that are resistant to current therapeutic
agents (Wasser & Weis, 1999c). Fungi are well known for the production of important
antibiotic compounds such as penicillin, however, the occurrence of antibiotics in the
class of fungi known as Basidiomycetes (the mushrooms) is less well documented
(Miles & Chang, 1997) and there are only few reviews that summarise the antibacterial
activity from these type mushrooms (Gao et al., 2003; Wasser & Weis, 1999b, 1999c;
Zjawiony, 2004). The following section (Section 2.7.1) reports the antibacterial activity
of fungi from the division Basidiomycota, with particular focus on the antibacterial
activity of Ganoderma extracts. Other antibiotic and drug producing filamentous fungi,
such as Penicillium and Aspergillus species, are not covered in this review as they are
from a different division to that of Ganoderma.
2.7.1 Antibacterial Activity 2.7.1.1 Activity of Mushroom Extracts
There appear to be an increasing number of reports on Gram-positive bacteria
developing resistance to virtually every clinically available drug (Donadio et al.,
2002a), and basidiomycetous mushrooms have been shown to possess antibacterial
activity against this group of bacteria. The mycelium of Flammulina velutipes was
shown to have bacterial activity against the Gram-positive bacteria Bacillus subtilis and
Staphylococcus aureus (Ishikawa et al., 2001). In addition to these two bacteria, the
fruiting body extract from Armillariella mellea also exhibited activity against B. cereus,
in vitro (Obuchi et al., 1990). The antibiotics, Psalliotin and Coriolin, from Agaricus
xanthoderma and Trametes sp., respectively, have also been shown to inhibit Gram-
positive bacteria (Dornberger et al., 1986; Takeuchi, 1969).
Early studies proposed that most antibacterial components from basidiomycetous fungi
were potent against Gram-positive bacteria only (Lee et al., 1982; Robbins et al., 1947)
but more recent work showed that extracts were also active against Gram-negative
organisms, Proteus vulgaris and Escherichia coli, in vitro (Yoon et al., 1994). Some
Agaricus species (A. campestis, A. bisporus and A. arvensis) have been shown to
produce compounds active against both Gram-positive and Gram-negative bacteria

Chapter 2 – Literature Review
44
(Wasser & Weis, 1999b) and, extracts from Lentinus edodes have also been shown to be
active against both types of bacteria (Hirasawa et al., 1999). Overall, extracts from
mushrooms are observed to be more active against Gram-positive bacteria than Gram-
negative bacteria (Smania et al., 1999).
The cell walls and inner cell membrane of Gram-positive bacteria are thick and consist
primarily of peptidoglycan, while the cell walls of Gram-negative bacteria consists of an
inner cell membrane, a peptidoglycan layer and a thick outer layer of a lipid-
polysaccharide complex (Villee et al., 1989). The greater resistance of Gram-negative
bacteria is most likely to be the result the Gram-negative bacteria having this outer
membrane acting as a barrier to many environmental substances, including antibiotics
(Tortora et al., 2001).
An aqueous extract of Dendropolyporus umbellatus demonstrated antibiotic action in
vitro against S. aureus and E. coli (Chang & But, 1986). A polysaccharide
Schizophyllan from Schizophyllum commune exhibited protective effects against S.
aureus, E. coli, Pseudomonas aeruginosa and Klebsiella pneumoniae infections in mice
(Komatsu et al., 1973) and against an infection in yellowtail fish caused by a
Streptococcus species (Matsuyama et al., 1992). Other polysaccharides that have
exhibited antibacterial activity are the commercial products, Lentinan and Krestin, from
the cultivated fruiting body of L. edodes (Jong & Birmingham, 1993) and the cultured
mycelium of Trametes versicolor, respectively (Sakagami et al., 1991; Tsukagoshi et
al., 1984).
The less polar organic extracts from mushrooms have also been shown to exhibit strong
antibacterial activity (Beltran-Garcia et al., 1997; Hirasawa et al., 1999; Mothana et al.,
2000) and most of these have been extracted with a chlorinated organic solvent. In
addition, the dichloromethane (DCM) extract from the fungus Formitopsis pinicola
(Swartz ex Fr.) Karst. exhibited antibacterial activity against the Gram-positive
bacterium, B. subtilis (Keller et al., 1996).
There have been reports showing that triterpenes have a great antibacterial effect
(Pinducciu et al., 1995; Wilkens et al., 2002) and it is well documented that triterpenes

Chapter 2 – Literature Review
45
are one of the major constituents isolated from Ganoderma. Armillaric acid, isolated
from A. mellea, is one such terpenoid that inhibits Gram-positive bacteria (Obuchi et al.,
1990). Sesquiterpenes have also been shown to be one of the antibacterial agents in
mushrooms (Donnelly et al., 1985; Ishikawa et al., 2001). Interestingly, Anke &
Sterner (1991) observed that derivatisation of sesquiterpenes to less polar compounds
increased the antimicrobial and cytotoxic affects.
Many researchers investigating the antibacterial activity of mushrooms focus on the
fruiting bodies and only a few have investigated the liquid cultivated mycelium for
activity. Donnelly et al. (1985), Donnelly & Hutchinson (1990) and Ishikawa et al.
(2001) investigated the mycelial extracts from the fungi, A. mellea and F. velutipes, and
found the extracts to possess antibacterial activity against Gram-positive bacteria. In
addition, Hatvani (2001) found the culture fluid of L. edodes to possess antibacterial
activity.
2.7.1.2 Antibacterial Extracts from Ganoderma
Ganoderma species have been widely investigated for their therapeutic properties as
antitumour and antiviral agents but have been far less investigated as a source of new
antibacterial agents. A review by Gao et al. (2003) on the antibacterial and antiviral
value of Ganoderma species supported this observation, as there were few citings on
research in this area.
Antibacterial activity has been observed against Gram-positive bacteria from the
fruiting body extracts of G. lucidum (Kim et al., 1993) and G. orgonense (Brian, 1951).
Furthermore, Sudirman & Mujiyati (1997) observed that seven Indonesian Ganoderma
species inhibited the growth of B. subtilis. Yoon et al. (1994) investigated the additive
effect on the activity of an aqueous extract of G. lucidum with four known antibiotics
and observed that the antibacterial activity increased. It is interesting to note that the
majority of antibacterial investigations on Ganoderma species have been performed on
the fruiting body and there are relatively few on extracts from the liquid cultivated
mycelium. Coletto & Mondino (1991) observed that methanolic extracts of the mycelia
and culture extracts of G. recinaceum and G. lucidum inhibited B. subtilis and G.
recinaceum also inhibited Staphylococcus aureus.

Chapter 2 – Literature Review
46
Compounds shown to have an antibacterial effect include steroidal compounds from the
fruiting body of G. applanatum, which were found to have a broad spectrum
antibacterial activity with bactericidal effects (Smania et al., 1999), as well as two
ganomycins, namely A and B, from the fruiting body of G. pfeifferi, which exhibited
antibacterial activity against both Gram-negative and Gram-positive bacteria (Mothana
et al., 2000).
2.7.2 Antifungal Activity Antifungal drugs available today are not always successful in treating
immunocompromised patients due to the ineffectiveness or toxicity that many of them
have on the host (Seltrennikoff, 1995), and hence, there is a need for the identification
of novel antifungal agents. Plant extracts have been under investigation for their
antifungal properties and many have been found to possess activity (Binns et al., 2000;
Diallo et al., 2001; Feresin et al., 2001). Since basidiomycetes belong to the kingdom
of Fungi, they are thought to have weak antifungal activities (Mizuno, 1995) and
therefore have rarely been investigated for their bioactivity as antifungal agents. It is
only recently that they have become of interest due to their secondary metabolites
exhibiting a wide range of antimicrobial activities.
Ishikawa et al. (2001) isolated two cuparene-type sesquiterpenes from the culture
medium of F. velutipes, and observed both to have antifungal activity against the fungus
Cladosporium herbarum. Hatvani (2001) tested the culture fluid of the mushroom L.
edodes and found that it exhibited poor activity against the yeast Candida albicans.
Earlier, Anke et al. (1980) isolated an antibiotic from the submerged culture of the
mushroom Marasmius scorodonius (Fr.) Fr., which exhibited activity against bacteria,
yeasts and filamentous fungi. Antifungal compounds have also been found in the
extracts of L. edodes (Takazawa et al., 1982).
2.7.3 Antiviral Activity The propagation of viruses depends on the metabolic activity of the host cells (Eo et al.,
1999b). The goal of antiviral chemotherapy is the discovery of antiviral agents that are
specific for the inhibition of viral multiplication without affecting normal cell
Chapter 2 – Literature Review
47
metabolism (Eo et al., 1999b). Herpes simplex virus (HSV) and human
immunodeficiency virus (HIV) are important viruses being investigated. Recently, a
review by Gao et al. (2003) was published on the antiviral value of the genus
Ganoderma, which summarised the major biologically active constituents and their
effect or mode of action toward a number of viruses.
Herpes simplex virus type 1 (HSV-1) and type 2 (HSV-2) are responsible for a broad
range of human infectious diseases. HSV-2 is also known as an oncogenic virus that
has the ability to convert cells into tumour cells. In addition, HSV infections are
recognised as risk factors for the human immunodeficiency virus (HIV) infection (Hook
III et al., 1992). Polysaccharide fractions from G. lucidum exhibited activity against
HSV-1 and HSV-2 (Eo et al., 1999b, 2000; Kim et al., 2000; Oh et al., 2000).
Lanostane type triterpenes from G. pfeifferi have also been shown to exhibit activity
against HSV-1, as well as inhibit the influenza A virus (Mothana et al., 2003).
There have been reports of low molecular weight aqueous fractions strongly inhibiting
multiplication of HIV-1 (Kim et al., 1997) and, of triterpenes inhibiting both HIV-1
protease (Min et al., 1998) and HIV-2 protease (El-Mekkawy et al., 1998).
2.8 Overview This review summarised important areas of investigation being performed on
Ganoderma species around the world, with particular emphasis in areas of research that
have been focused on this investigation.
Firstly, this review highlighted the state of taxonomic confusion that the
Ganodermataceae family is currently in, thus, emphasising the importance of correctly
identifying new species. With the establishment of a modern classification system
using molecular tools and evolutionary studies, misidentification of species should
become a thing of the past.
In the search for active compounds from Ganoderma species, the majority of research
has been performed on extracts from the fruiting body and there has been far less
studies on extracts from the liquid cultivated mycelium. It appears that there are a

Chapter 2 – Literature Review
48
number of biologically active compounds to be found in the mycelium and the benefits
of liquid cultivation over solid cultivation include: the ability to manipulate the
cultivation medium to optimise mycelial growth; a shorter cultivation time; less
contamination; and, less space is required. This review also brought attention to the fact
that the manipulation of environmental or nutrient variables during the liquid cultivation
process can greatly affect the production of mycelial biomass or biologically active
constituents, or both.
In addition to the focus of research that has been put on the fruiting body of
Ganoderma, it is also apparent that most of the research has been performed on the type
species, G. lucidum. However, other species, such as G. tsugae and G. applanatum
have also shown to possess biologically active components, some of which are similar
to those found in G. lucidum.
The medicinal activities of a number of major classes of compounds that have been
extracted from Ganoderma, namely triterpenoids and polysaccharides, were reviewed in
detail. Other major compounds that have been shown to have pharmacological
properties, such as lectins and proteins, were also reviewed. However, these have been
far less investigated than terpenoids and polysaccharides. The review also demonstrated
that only recently has the mode of action of these compounds been of interest, and that
further studies need to be performed to establish mechanisms.
Lastly, this review reported the antimicrobial activities exhibited by Ganoderma
extracts. It highlighted that there are a number of investigations into the antiviral
activities of Ganoderma, however, there appears to be only few studies that have
reported the antibacterial and antifungal activity of Ganoderma extracts. Since
preliminary studies on some Ganoderma extracts have shown antibacterial activity, this
appears to be a promising area of research.

3 Chapter Three
MMaatteerriiaallss aanndd MMeetthhooddss

Chapter 3 – Materials and Methods
50
3.1 Chemicals and Reagents 3.1.1 Chemicals All chemicals used in this investigation were of analytical reagent (AR) grade and were
purchased from Sigma Aldrich Chemical Company (St. Louis, MO, USA), unless
otherwise specified. Components of fungal and bacterial growth media were purchased
from Oxoid (Basingstoke, Hampshire, UK) or Difco (Becton Dickinson, Maryland,
USA). Analytical grade agarose was purchased from Promega Corporation (Madison,
USA). All water used was deionised, unless otherwise stated.
3.1.2 Enzymes All enzymes used in the manipulation of DNA were from Promega Corporation
(Madison, USA) or Novagen (Madison, USA).
3.1.3 Buffers Buffers used in the extraction of DNA (AP1, AP2, AP3/E, AW and AE) were supplied
with the DNeasy® Plant Mini Kit (QIAGEN, Germany). Buffers used in the
manipulation of DNA (Taq DNA polymerase 10X reaction buffer without MgCl2,
Buffer B, Buffer C and Multicore™) were purchased from Promega Corporation
(Madison, USA). The 2X rapid ligation buffer containing T4 DNA ligase was supplied
with the pGEM®-T Easy Vector System (Promega Corporation, Madison, USA).
Methods used to prepare reagent buffers used throughout this investigation are
described in Table 3.1.
Table 3.1 Buffer reagents used in this investigation
Buffer Preparation 10 X Tris Borate (TBE)
108 g of tris base, 55 g of boric acid and 20 mL of 0.5 M EDTA (pH 8) were made up to 1 L with water.
10 X Tris Acetate (TAE)
48.4 g of tris base, 11.42 mL of glacial acetic acid and 20 mL of 0.5 M EDTA (pH 8) were made up to 1 L with water.

Chapter 3 – Materials and Methods
51
3.2 Sterilisation All glassware and equipment used for the handling of fungal and bacterial cultures were
sterilised prior to use. Unless otherwise specified, all sterilisation procedures were
performed by autoclaving at 121ºC (101 kPa) for 15 minutes.
3.3 Freeze Drying Dehydration of organisms and mycelial biomass was performed under reduced pressure
at –50ºC in a Dynavac Freeze Drying Unit (Dynavac, Burwood, Australia).
3.4 pH Determination and Adjustment The pH of all solutions was measured using an Activon ACE69 model pH meter, which
had been calibrated prior to use using a two point buffering system at pH 4 and 7.
Adjustment of the pH of solutions was achieved using sterile HCl (1 M or 6 M) (Section
3.2), sterile NaOH (1 M or 6 M) (Section 3.2), or filter sterilised 10% (w/v) tartaric acid
solution. Media required to be at pH levels of 5, 6 or 7, were adjusted prior to
sterilisation. Media required to be at pH levels of 3, 4 8 or 9, were adjusted after
sterilisation due to hydrolysis of the agar at low pH values and a change in pH at high
pH values during the autoclaving process.
3.5 Organisms 3.5.1 Basidiomycetous Fungi A range of fungi was used throughout this study. Three wood rotting fungal species of
Ganoderma were isolated in the Cairns State Forest, Northern Queensland, Australia.
These have been designated Ganoderma H1, Ganoderma H2 and Ganoderma H3
throughout this investigation. The other fungal organisms were used to allow a direct
comparison of growth trends for white-rot fungi are listed in Table 3.2.
3.5.2 Storage of Basidiomycetous Fungi Frozen stocks of fungi were stored on balsa wood at –70ºC. Sub-sampling was
performed at appropriate time intervals (described in Chapter 5.3.1) to ensure that the
organisms remained viable. Frozen stocks were thawed, aseptically transferred to fresh

Chapter 3 – Materials and Methods
52
agar medium and then incubated at the appropriate temperature until confluent growth
was achieved. Mycelial plugs were then used for subculture.
Table 3.2 Basidiomycetous fungi used in this investigation
Fungi Sourcea /Strain No. Ganoderma sp. SUT / H1 Ganoderma sp. SUT / H2 Ganoderma sp. SUT / H3 Ganoderma lucidum ATCC / 46755 Ganoderma applanatum ITBB / app Pycnoporus cinnabarinus CBS / 101046
a SUT, Swinburne University of Technology, Hawthorn, Australia; ATCC, American Type Culture Collection, Manassas, VA, USA; ITBB, Institut Teknologi Bandung, Bandung, Indonesia; CBS, Centraalbureau voor Schimmelcultures, Utrecht, The Netherlands.
3.5.3 Test Organisms 3.5.3.1 Bacteria and Culture Conditions
Table 3.3 lists the range of bacterial organisms used throughout this study. These were
used for the investigation of antibacterial activity of fungal extracts. The bacteria were
propagated using the conditions described in Table 3.3 according to the
recommendations of the supplier. All bacteria were grown aerobically except
Clostridium, which was grown anaerobically using a BBL GasPak (Becton Dickinson,
Cockeysville, Maryland, USA) in airtight anaerobic jars with anaerobic indicators
(Oxoid, Hampshire, UK).
3.5.3.2 Storage of Bacterial Organisms
‘Long term’ frozen stocks of bacteria were stored at –70ºC in a bead storage system in
nutrient medium (Technical Service Consultants Ltd., Lancashire, UK). ‘Short term’
stocks were prepared by transferring previously isolated single colonies to fresh agar
slants and then incubating at the appropriate temperature (Table 3.3). These slants were
stored at 4ºC for up to six months.

Chapter 3 – Materials and Methods
53
Table 3.3 Bacteria used in this investigation
Bacterial species Liquid
Medium a Solid Medium b
Temp (°C) Sourcec /Strain No.
Bacillus cereus NB NA 37 ACMO / 2997 B. subtilis NB NA 37 ACMO / 40 Clostridium butyricum FTG/BHI CMG 37 An d ACMO /2646 C. difficile FTG/BHIm CMG 37 An MU / JIR1166 C. difficile FTG/BHIm CMG 37 An RCH / cd1g C. difficile FTG/BHIm CMG 37 An RCH / cd8g C. difficile FTG/BHIm CMG 37 An RCH / cd14h C. perfringens FTG/BHI CMG 37 An ACMO / 3902 C. perfringens FTG/BHI CMG 37 An MU / JIR248 C. perfringens FTG/BHI CMG 37 An MU / JIR235e C. sporogenes FTG/BHI CMG 37 An ACMO / 354 Enterococcus faecalis BHI HBA 37 ATCC / 19433 E. faecalis # BHI HBA 37 MU / M259849 E. faecalis # BHI HBA 37 MU / M233165 E. faecalis # BHI HBA 37 MU / M252807 E. faecalis # BHI HBA 37 MU / M193292 E. faecalis # BHI HBA 37 MU / M169600 E. faecalis # BHI HBA 37 MU / M255048 Escherichia coli K12 NB NA 37 ACMO / 2641 Klebsiella pneumoniae NB NA 37 ACMO / 9 Listeria monocytogenes 4B BHI HBA 37 ACMO / 98 Micrococcus luteus NB NA 28 ACMO / 975 Proteus vulgaris NB NA 37 SUT / pv1 Pseudomonas aeruginosa NB NA 37 ACMO / 495 Salmonella typhimurium NB NA 37 SUT/ st1 Shigella sonnei NB NA 37 SUT / ss7 Staphylococcus aureus NB NA 37 SUT / sa8 S. aureus NB NA 37 ATCC / 25923 S. aureus * NB NA 37 MU / M67638 S. aureus * NB NA 37 MU / M67783 S. aureus * NB NA 37 MU / M99320 S. aureus * NB NA 37 MU / M173525 S. aureus * NB NA 37 MU / M180920 S. aureus * NB NA 37 MU / M183909 S. epidermidis NB NA 37 SUT / S10 Streptococcus pyogenes BHI HBA 37 ACMO / 178
a NB, nutrient broth; FTG, fluid thioglycollate medium; BHI, brain heart infusion; BHIm, modified brain heart infusion; b NA, nutrient agar; CMG, cooked meat glucose; HBA, horse blood agar; c ACMO, Australian Collection of Microorganisms, Department of Microbiology, University of Queensland; MU, Department of Microbiology, Monash University, Melbourne; RCH, Royal Childrens Hospital, Parkville, Melbourne; SUT, Environment and Biotechnology Centre, Swinburne University of Technology, Melbourne; ATCC, American Type Culture Collection, Manassas, VA, USA; d An, anaerobic growth; e Plasmid carrying strain, TcRCmREmR; g C. difficile clinical isolate resistant to 32 μg mL-1 tetracycline; h C. difficile clinical isolate with no resistant genes; * Methicillin resistant Staphylococcus aureus; # Vancomycin resistant Enterococcus faecalis.

Chapter 3 – Materials and Methods
54
3.5.3.3 Test Fungi
Table 3.4 lists the range of test fungi, including some yeast strains, used throughout this
study. They were used for the investigation of antifungal activity of the Ganoderma
extracts. All yeast and test fungi were grown on MEA (Table 3.4) at 37ºC. Yeast were
grown for a period of 24 hours and fungi were grown for either a period of 24 hours to
produce mycelia, or a period of 72 hours to produce spores.
Table 3.4 Yeast and test fungi used in this investigation
Organism Sourcea /Strain No.
Candida sp. SUT / cs1 Saccharomyces cerevisiae SUT / sc Yeast SUT/ 2906 Yeast SUT / 6034
Yeast
Yeast SUT / 2119 Rhizopus sp. SUT / rs1 Aspergillus niger ATCC / 16404 Mucor sp. + SUT / ms+ Mucor sp. - SUT / ms- Penicillium sp. SUT / ps1
Fungi
Fusarium oxysporium SUT / fo1 a ATCC, American Type Culture Collection, Marysville, USA; SUT, Swinburne University of Technology, Hawthorn, Australia.
3.6 Nutrient Media All solid and liquid culture media were sterilised after preparation according to the
method described in Section 3.2, unless stated otherwise. Nutrient media were prepared
to the manufacturer specifications and are listed in Table 3.5, on the following page.

Chapter 3 – Materials and Methods
55
Table 3.5 Nutrient media prepared to manufacturer specifications
Medium Mass (g) per 1 L
of water Natural pH
Brain Heart Infusion (BHI) 37.0 7.4 ± 0.2 Malt Extract Agar (MEA) a 50.0 5.4 ± 0.2 Malt Extract Broth (MEB) a 20.0 5.4 ± 0.2 Mueller Hinton Agar (MHA) 38.0 7.3 ± 0.1 Mueller Hinton Broth (MHB) 21.0 7.4 ± 0.2 Nutrient Agar (NA) 28.0 7.4 ± 0.2 Nutrient Broth (NB) 13.0 7.4 ± 0.2 Potato Dextrose Agar (PDA) 39.0 5.6 ± 0.2 Potato Dextrose Broth (PDB) 24.0 5.1 ± 0.2 Fluid Thioglycollate Medium (FTG) 29.5 7.1 ± 0.2 Tryptic Soy broth (TSB) 30.0 7.3 ± 0.2
a Sterilisation by autoclaving at 115ºC (101kP) for 10 min, as per the manufacturer specification.
3.6.1 Fungal Growth Media Media prepared to the manufacturer specifications are listed in Table 3.5. To
investigate the effect of carbohydrate source on fungal growth, media were prepared
according to the method described by Kawagashi et al. (1997) with minor modifications
(Table 3.6). Modification was by addition of different carbohydrate sources to the base
medium. This medium has been designated "Basal" or “Basal-G”, (where the “G”
denotes glucose) throughout this investigation.
Table 3.6 Basal medium for the investigation of carbohydrate source
Medium Amount Carbohydrate source a 50.0 g Malt extract (ME) 10.0 g Yeast extract (YE) 2.0 g Bacto-peptone 2.0 g KH2PO4 5.0 g MgSO4 2.5 g Water to 1000 mL
a Carbohydrate source was: glucose, lactose, sucrose, fructose, xylose, galactose, mannose or cellobiose; The natural pH of all media was 5.1 ± 0.1, except galactose (4.8 ± 0.7) and fructose (5.2 ± 0.1).
Chapter 3 – Materials and Methods
56
3.6.2 Bacterial Growth Media Media prepared to manufacturer’s specifications are listed in Table 3.5. BHIm for C.
difficile was prepared by adding 18.5 g of BHI, 2.5 g of yeast extract (YE) in 500 mL of
water. The mixture was shaken and sterilised by autoclaving at 116°C for 15 minutes.
The medium was left to cool in a 55ºC water bath and then 5 mL of filter sterilised 10%
(w/v) L-cysteine, 7.5 mL of filter sterilised 25% (w/v) glucose and a few grains of
FeSO4·H2O were added. BHIm agar medium for C. difficile was prepared in the same
way, except 7.5 g of bacteriological agar was added to the mixture prior to autoclaving.
FTG medium for C. perfringens was prepared by the addition of 14.5 g of FTG medium
and 2.5 g of K2HPO4 to 500 mL of water. The medium was sterilised by autoclaving at
121ºC for 20 minutes.
3.6.3 Media used to Propagate E. coli Carrying Recombinant Plasmids Luria-Bertani (LB) broth was prepared according to Sambrook & Russell (2001).
Briefly, 2.5 g of NaCl, 5.0 g of tryptone and 2.5 g of yeast extract were dissolved in 500
mL of water. The mixture was sterilised by autoclaving at 121ºC for 15 minutes. LB
ampicillin (LBAmp) agar was prepared by cooling 500 mL of LB broth to 50ºC after
sterilisation and then adding 750 µL of filter sterile ampicillin (40 mg mL-1).
SOC medium was prepared according to Sambrook & Russell (2001). Briefly, 20 g of
tryptone, 5 g of yeast extract (YE) and 0.5 g of NaCl were added to 950 mL of
deionized water. The solution was shaken until all solutes dissolved and then 10 mL of
250 mM KCl was added. The pH was adjusted to 7 using 5 M NaOH (~ 0.2 mL) and
then made up to 1 L with water. The solution was then sterilised by autoclaving at
121ºC for 20 minutes. Immediately before use, 5 mL of sterile 2 M MgCl2 and 20 mL
of sterile 1 M glucose were added.
3.7 Fungal Maintenance 3.7.1 Storage on Slants Fungal samples were inoculated onto MEA or PDA slants in clear glass McCartney
bottles (or Universal bottles) and incubated for 5 to 6 days, in darkness, at the desired
Chapter 3 – Materials and Methods
57
temperature. After incubation, the bottles were wrapped in aluminium foil to protect the
samples from light and then stored at 4ºC.
3.7.2 Storage under Mineral Oil Fungal samples were inoculated onto agar slants in clear glass containers and incubated
for 5 to 6 days at the desired temperature. Sterilised medicinal paraffin oil (specific
gravity 0.865 – 0.890) was then poured over the mycelium on the agar slants to a depth
of no more than 1 cm from the top of the slant. The samples were stored at 4ºC.
3.7.3 Storage in Water Fungal samples were inoculated into 4 mL of sterile water and stored at 4ºC or at room
temperature.
3.7.4 Storage on Wood Fungal samples were inoculated onto sterile balsa wood (5mm x 5mm x 1mm) and
incubated for 5 to 6 days at the desired temperature. The samples were then stored at
room temperature, 4ºC or at –80ºC.
3.8 Incubation of Fungal Cultures 3.8.1 Static Cultures Culture plates were placed on large, plastic trays. To maintain a humid atmosphere, a
small jar of water was placed onto the tray and the trays were then wrapped in plastic
film. The trays were subsequently placed in incubators at the desired temperature.
3.8.2 Shaker Flasks Cultures Polycarbonate shaker flasks that contained four baffles were securely tightened in a
Bioline shaker incubator. They were shaken at 30ºC and at 100 rpm for 30 days, unless
otherwise stated.
Chapter 3 – Materials and Methods
58
3.9 Agar Cultivation Techniques 3.9.1 Slant Preparation Agar slants were prepared by dispensing 10 mL aliquots of molten medium into 30 mL
McCartney bottles and sterilising as described in Section 3.2. The bottles were then laid
on a 30° angle and allowed to set.
3.9.2 Plate Preparation Using sterile technique, 20 mL aliquots of sterile molten medium were transferred to
gamma sterilised Petri dishes, 90 mm x 15 mm (Biotech) with an automatic liquid
dispenser. After solidifying, the plates were dried in a 40ºC oven for 15 minutes and
subsequently subjected to UV radiation for 20 minutes.
3.9.3 Sub Culturing Sub cultures were prepared by excising small pieces of mycelium (1 cm x 1 cm) from
culture slants and placing them on freshly prepared agar plates. These were incubated
at the desired temperature until the mycelium was approximately 10 mm from the outer
edge of the plate. These have been designated as "working cultures" throughout this
investigation. A second sub-culture step was performed by cutting 6 mm round plugs
from the growing mycelial edge of the working cultures using a sterile plug borer and
transferring them onto the centre of the experimental agar plates. These have been
designated the "experimental cultures" throughout this investigation.
3.9.4 Radial Growth Zone Measurements Radial growth measurements were performed following the method of Lonergan et al.
(1993). Briefly, radial zone measurements were performed in triplicate on the different
fungal colonies grown on PDA. PDA was used in preference to MEA because of its
translucent nature, which enabled the growing edge to be seen and measured clearly.
Growth assays were performed on all the plates by measuring the mycelial radius
(minus the plug radius) of the colony in mm. The measurements were taken from four
different points and the average radius was recorded. Measurements were taken at 24
hours intervals over a period of 6 days. A light box fitted with a magnifying glass was
used to facilitate viewing and enabled accurate measurement of the fungi.

Chapter 3 – Materials and Methods
59
3.9.5 Mycelial Growth Rate The rate of mycelial growth was performed subsequently to the completion of the radial
growth zone measurements (Section 3.9.4). The average rate of mycelial growth (mm
day-1) was determined over a four day period. To determine this, the following
calculation was employed:
{[G(d6) – G(d5)] + [G(d5) – G(d4)] + [G(d4) – G(d3)] + [G(d3) – G(d2)]} ÷÷÷÷ 4
Where: G(d6) is equal to the average mycelial growth (in mm) on day 6 and G(d5) is
equal to the average mycelial growth (in mm) on day 5.
If the mycelial growth had reached the perimeter of the plate before day 6, then day five
was used as the starting point for the calculation.
3.10 Broth Cultivation Techniques 3.10.1 Shaker Flask Preparation Plastic polypropylene shaker flasks containing four baffles were used. Liquid medium,
125 mL, 250 mL or 1000 mL, was prepared into 250 mL, 500 mL or 2000 mL shaker
flasks, respectively. The flasks were plugged with non-absorbent cotton wool (Smith
and Nephew, Australia) and then sterilised as described in Section 3.2.
3.10.2 Mycelial Mat and Fragment Inoculation A conical flask containing 50 mL of MEB was prepared, plugged with non-absorbent
cotton wool and sterilised. Once the medium had cooled to room temperature, two 6
mm plugs were taken from the growing edge of a 5 day culture and transferred to the
culture medium. The flask was then incubated without shaking for a period of 7 days.
The mycelial mat culture was homogenised using an Ystral GmbH homogeniser with a
sterile blade (2 mm) for 40 seconds. A 1, 2.5 or 10 mL aliquot of the homogenised
sample was then transferred to a 250, 500 or 1000 mL shaker flask, respectively,
containing the experimental medium.

Chapter 3 – Materials and Methods
60
3.10.3 Separation of Biomass from the Culture Medium The mycelial biomass was separated from the culture medium by vacuum filtration
through No. 54 type Whatman filter paper. The mycelial biomass was then rinsed with
water until the water ran clear (approx. 3 volumes) and the resulting biomass freeze
dried as described in Section 3.3.
3.11 Liquid - Solid Extractions 3.11.1 Hot Water Aqueous Extraction Four to 5 g of freeze dried mycelial biomass, which had been ground to a fine powder
using a mortar and pestle, was accurately weighed into a 250 mL beaker containing a
magnetic stirrer. After addition of 100 mL of water, the mixture was heated at 95 to
100ºC for 2 hours, whilst stirring. After this time, the hot water extract (filtrate) was
separated from the mycelial biomass by vacuum filtration using No. 54 type Whatman
filter paper. The biomass was rinsed with water until the water ran clear (approx. 3
volumes). The biomass was placed into a fresh 250 mL beaker and another 100 mL
volume of water was added. The process of heating, stirring and filtration was repeated.
The combined filtrates were collected and evaporated to dryness by freeze drying
(Section 3.3). The mass of extract per gram of mycelium was determined.
3.11.2 Organic Extraction Four to 5 g of freeze dried mycelial biomass, which had been ground to a fine powder
using a mortar and pestle, was accurately weighed into a 20 x 80 mm cellulose
extraction thimble (Whatman, Maidstone, UK). The extraction solvent (100 mL) was
added to a 500 mL round bottom flask. Soxhlet extraction was carried out in a hot
water bath for a period of 6 hours. Consecutive organic solvents used in the extraction
process, boiling points and the bath temperatures are listed in Table 3.7. After the
extraction process was complete, the solvent was evaporated to dryness under reduced
pressure by rotary evaporation. The mass of the extract was calculated per gram of
mycelium.

Chapter 3 – Materials and Methods
61
Table 3.7 Organic solvents used in this investigation
Organic Solvent Boiling Point (ºC) a Bath Temperature (ºC) Hexane 68.5 90 Dichloromethane 42.0 60 Ethyl Acetate 76-77 95 Methanol 64.5 90
a Boiling points taken from Vogel (1948).
3.12 Chromatography 3.12.1 Gravity Column Chromatography Gravity column chromatography was performed using silica gel 60 Å, 70 to 230 mesh.
The column had an internal diameter of 15 mm and a length of 260 mm. The column
was packed using the slurry method and equilibrated with CHCl3 for eight column
volumes. A gradient step elution was required to elute all compounds from the column.
Twenty mL volumes of each eluant starting with CHCl3:MeOH (99:1) and ending with
CHCl3:MeOH (2:8) was added to the column. Fractions were collected in 5 mL
volumes and the flow rate was 1 mL min-1. Approximately 10 μL of each fraction was
spotted onto TLC plates and developed in an appropriate solvent system (Section
3.12.2). Like fractions were combined and then subjected to further analysis.
3.12.2 Thin Layer Chromatography (TLC) TLC was performed on silica gel, 60 F254, aluminium backed plates (Darmstadt,
Germany). They were cut to the appropriate size using a sharp scalpel. Volumes, in μL
of the extract to be examined, were spotted onto the TLC plate approximately 1 cm
from the bottom of the plate. The spots were dried with a warm current of air and then
the plate was developed in a saturated glass TLC tank using the appropriate solvent
system. The solvent systems differed for the different extracts and extract fractions.
Optimisation of the solvent system for the different fractions from the dichloromethane
(DCM) extract was investigated in Chapter 7. When the mobile phase had travelled the
required distance, the plates were removed from the TLC tank and allowed to dry. In
some cases, the developing procedure was repeated in the same mobile phase.
Compounds were viewed under Visible and UV light (254 and 365 nm), or were

Chapter 3 – Materials and Methods
62
subjected to further chemical analysis (as described in Section 3.14) for the
identification of classes of compounds.
3.12.3 Preparative TLC Preparative TLC plates were prepared as follows. A slurry was made using 60 g of
silica G60 F254 in 150 mL of distilled water. The slurry was allowed to sit for 1 hour
and then poured onto glass plates in a TLC plate maker. The plates were made to 1 mm
thickness and allowed to dry for 2 days. Before use, impurities were removed from
plates by running the plates in a slightly more polar phase than the anticipated mobile
phase. The plates were activated at 120ºC for 2 hours and then used as described in
Section 3.12.2. Spots of interest were scraped from the plate and like spots combined.
An appropriate solvent was used to redissolve the compound and the silica gel removed
by centrifugation. The silica gel was washed with the solvent three times to ensure
maximum removal of the compound of interest.
3.13 Antibacterial Assays 3.13.1 Disc Diffusion Assay A 4 mL volume of the propagation broth was inoculated with bacteria from a stock
culture and incubated overnight at the appropriate temperature. The overnight broth
culture was then adjusted to a 0.5 McFarland standard in 3 mL of a 0.85% (w/v) saline
solution. Four mL of molten MHA kept at 50ºC in a water bath was inoculated with
200 μL of the bacterial saline suspension, mixed and poured evenly into a Petri dish
containing a bottom layer of solid MHA (16 mL). Blank sterile discs (6 mm) (Oxoid,
Hampshire, UK) were impregnated with a known amount of extract and placed gently
onto the agar overlay. The plates were incubated at 37ºC overnight or 48 hours, or 28ºC
for 2 days, depending on the growth requirements of the bacterium. Negative controls
of the solvent only and positive controls of antibiotics (e.g. tetracycline, ampicillin)
were also prepared. The antibacterial activity was recorded by measuring any zones of
growth inhibition around the disc.
3.13.2 Minimum Inhibitory Concentration (MIC) MIC determinations were performed in gamma sterilised 96 well microtitre plates
(Cellstar, Greiner Bio-One). A two-fold serial dilution containing the growth medium

Chapter 3 – Materials and Methods
63
and extract was prepared to a volume of 100 μL per well. To this, a 10 μL aliquot of the
test organism (adjusted to a 0.5 McFarland standard in 0.85% (w/v) saline solution)
was added to each well. A second two-fold serial dilution containing the growth
medium and extract was also prepared. To this, a 10 μL aliquot of 0.85% (w/v) saline
solution was added. This second serial dilution served as a negative turbidity control.
Positive controls were also prepared. All two-fold dilutions and controls were prepared
in triplicate. The plates were incubated under aerobic or anaerobic conditions for 24 or
48 hours, depending on the bacterium used. After the appropriate incubation time, the
wells were mixed thoroughly and the optical density measured at 595 nm (OD595), in
triplicate, using an Emax Precision Microplate Reader (Molecular Devices). The OD595
due to the growth of the test organism was calculated by subtracting the OD595 of the
turbidity control solutions (Second two-fold serial dilutions) from the corresponding
OD595 of the sample solutions (First two-fold serial dilution). The MIC was then
determined to be at the concentration where there was no increase in the OD595, or at the
concentration where the OD595 was zero. The experiment was repeated in triplicate to
check for reproducibility.
3.13.3 Minimum Bactericidal Concentration (MBC) The MBC was determined for samples that previously exhibited an MIC. Directly after
the MIC was determined (Section 3.13.2), a sample was taken from each well that
exhibited no increase in OD595 (no bacterial growth) and was streaked onto freshly
prepared agar plates. The fresh agar plates were then incubated at the appropriate
growth temperature for either 24 or 48 hours. After this time, the plates were inspected
for growth of the bacteria. The MBC was determined to be the concentration at which
no bacterial growth was observed.
3.13.4 Time Kill Assay Time course growth assays were determined at the MBC for the extract against the test
bacteria. If no MBC was previously detected then the MIC was used instead. For each
bacterium, the extract was prepared in a total volume of 2 mL in the appropriate growth
medium to give a final concentration equal to that of the MBC. At time zero, a 100 μL
aliquot of the test bacteria (which had been previously adjusted to 0.5 McFarland
standard in 0.85% (w/v) saline solution) was added to the sample and incubated

Chapter 3 – Materials and Methods
64
aerobically or anaerobically, depending on the bacterium, for up to 48 hours. At time 0,
1, 2 or 3 and 4 hours, a 100 μL aliquot was taken from the sample and a ten-fold
dilution series prepared. A sample from each dilution (100 μL) was spread onto the
surface of fresh agar plates. The plates were allowed to dry and then incubated under
the appropriate conditions, depending on the bacterium used. The plates were then
inspected for growth and the number of colony forming units (cfu) per mL determined.
A control assay was also performed for comparison of growth. The growth was also
checked at 24 or 48 hours, for some organisms.
3.13.5 Bioautography Agar-Overlay Bioautography was performed using TLC plates (Section 3.12.2) that contained spots of
interest. The TLC plates were cut to size and placed into square Petri dishes (10 x 10
cm). A volume of 12 mL of molten agar, kept at 50ºC, was inoculated with 200 μL of
an overnight bacterial culture, mixed thoroughly, and then poured over the TLC plate in
the Petri dish. The agar was spread uniformly over the plate to give an agar overlay
thickness of approximately 1 mm. The surface of the agar was flamed briefly to remove
any air bubbles. Once the agar was set, the plates were inverted and incubated
overnight at 37ºC. The plates were sprayed with MTT (thiazolyl blue tetrazolium
bromide) (2 mg mL-1) and reincubated for 30 minutes at 37ºC. The plates were then
observed for spots that exhibited clear zones of growth inhibition against a purple
background of live bacteria.
3.14 Phytochemistry Photochemistry was performed on TLC plates that had been spotted with extract and
allowed to develop (Section 3.12.2). For each detection reagent, two identical plates
were prepared along side each other. The first plate was used as the reference whilst the
second plate was subjected to spray reagents and detection. Methods for detection were
performed as described in Wagner et al. (1984) and Krebs et al. (1969). Detection of
compounds was by: 1) visualisation under visible or UV light (254 or 395 nm), 2)
gently heating the TLC plate and then visualisation of spots under visible or UV light
(254 or 395 nm), or 3) lightly spraying (using a Preval Sprayer purchased from Sigma-
Aldrich) the TLC plates with detection reagents and observing under visible or UV
light.

Chapter 3 – Materials and Methods
65
3.14.1 Detection Reagents 3.14.1.1 Anisaldehyde – Sulphuric Acid (AS)
AS reagent was used for the unspecific detection of steroids, terpenes, essential oils,
bitter principles and saponin drugs. The reagent was prepared by mixing 0.5 mL of
anisaldehyde with 10 mL of acetic acid, followed by 85 mL of MeOH and 5 mL of
concentrated H2SO4. A TLC plate was then sprayed with 10 mL of AS reagent, warmed
at 100ºC for 5 to 10 minutes and evaluated under UV (365 nm) or visible light.
3.14.1.2 Vanillin Sulphuric Acid (VS)
VS reagent was used for the unspecific detection of essential oils, bitter and pungent
principles, and saponin drugs. This reagent consisted of two parts. a) A 5% (w/v)
ethanolic H2SO4 solution, and b) a 1% (w/v) ethanolic vanillin solution. The TLC plate
was sprayed with 10 mL of (a) followed by 5 to 10 mL of (b), warmed at 100ºC for 5 to
10 minutes and evaluated under visible light.
3.14.1.3 Liebermann – Burchard Reagent (LBr)
Freshly prepared LBr reagent was used for the detection of triterpenes, steroids
(saponins and bitter principles) and sterols (cholesterol and esters). The reagent was
prepared by carefully adding 5 mL of acetic anhydride and 5 mL of conc. H2SO4 to 50
mL of absolute ethanol on ice. The TLC plate was sprayed with 5 to 10 mL of LBr
reagent, warmed at 100ºC for 5 to 10 minutes and evaluated under visible or UV (365
nm) light.
3.14.1.4 Potassium Hydroxide (KOH)
Freshly prepared KOH reagent was used for the detection of anthraquinones, anthrones
and coumarins and arbutin drugs. The TLC plate was sprayed with 10 mL of a 10%
(w/v) ethanolic KOH solution, dried and then observed under UV (365 nm) or visible
light, with or without warming.
3.14.1.5 Kedde Reagent
Freshly prepared Kedde reagent was used for the detection of cardiac glycoside drugs.
The reagent was prepared by mixing 5 mL of a 3% (w/v) ethanolic 3,5-dinitrobenzoic
acid solution with 5 mL of 2 M NaOH. A volume of 5 to 8 mL of the reagent was

Chapter 3 – Materials and Methods
66
sprayed onto the TLC plate and then observed under visible light for the presence of
pink zones.
3.14.1.6 Natural Products - Polyethylene Glycol (NP-PEG)
NP-PEG was used for the detection of anthracene derivatives, coumarins, arbutin drugs,
bitter principle and flavonoids. Ten mL of NP (1% (w/v) methanolic
diphenylboryloxyethylamine) followed by 8 mL of PEG (5% (w/v) ethanolic
polyethyleneglycol-4000) was sprayed onto the TLC plate. The plate was then
observed under UV light at 365 nm.
3.14.1.7 Fast Blue Salt (FBS)
Fast blue salt was used for the detection of flavonoids and phenolic compounds. A TLC
plate was sprayed with 6 to 8 mL of a 0.5% (w/v) solution of FBS in water, dried and
then observed under visible light for the presence of red to brown zones, with or without
warming.
3.14.1.8 Berlin Blue Reagent (BB)
Freshly prepared Berlin blue reagent was used for the detection of arbutin drugs. The
reagent was prepared by adding 10 g of FeCl3 and 0.5 g of K3[Fe(CN)6] in 100 mL of
H2O. The TLC plate was then sprayed with 5 to 8 mL of BB and evaluated in visible
light for the presence of blue zones.
3.14.1.9 Fluorescein
Fluorescein was used for the detection of lipids. A TLC plate was lightly sprayed with
a 0.01% (w/v) ethanolic solution of fluorescein and dried in warm air. The plate was
then lightly sprayed with water and evaluated in visible light for the presence of yellow
zones.
3.14.1.10 Iodine
Iodine vapour was used for the detection of compounds with conjugated double bonds.
A TLC plate was placed into a TLC tank, which had been previously saturated with
iodine vapour by the addition of iodine crystals. The TLC plate was removed and
evaluated in visible light.

Chapter 3 – Materials and Methods
67
3.14.1.11 Folin-Ciocalteu Reagent
Folin-Ciocalteu reagent was used for the detection of phenolic compounds and was
purchased ready made from Merck (Darmstadt, Germany). The TLC plate was sprayed
with 5 to 10 mL and then evaluated in visible light for the presence of blue zones.
3.14.1.12 Aluminium Chloride
AlCl3 was used for the detection of flavonoids. A TLC plate was sprayed with 5 to 10
mL of a 1% (w/v) ethanolic AlCl3 solution and evaluated under UV (365 nm) light.
3.14.1.13 Dragendorff Reagent
Freshly prepared Dragendorff reagent was used for the detection of alkaloids. The
reagent was prepared by dissolving 8 g of KI in 20 mL of H2O. This solution was then
added to a second solution containing 0.85 g of basic bismuth nitrate in 40 mL of H20
and 10 mL of acetic acid. The TLC plate was sprayed with 10 mL and observed under
visible light for the presence of yellow zones.
3.15 Extraction of DNA from Fungi The extraction of DNA from fungal matter was performed using a DNeasy® Plant Mini
Kit (QIAGEN, Germany). Briefly, 20 mg of freeze dried mycelium was ground to a
fine powder under liquid nitrogen. The mycelium was transferred to a 1.5 mL
microtube and 400 μL of buffer AP1 and 4 µL of RNase were added and the mixture
and vortexed. The sample was then incubated for 10 minutes at 65ºC, mixing three to
four times during the incubation. Buffer AP2 (130 μL) was added and the sample was
vortexed then incubated on ice for 5 minutes. The sample was centrifuged for 5 minutes
at 11,000 rpm in a M-24 centrifuge (Boec, Germany) to separate the lysate from the cell
debris. The lysate was then applied to the QIAshredder spin column sitting in a 2 mL
collection tube and centrifuged for 2 minutes at 11,000 rpm. The flow through fraction
was transferred to a new 1.5 mL microtube. A volume of buffer AP3/E, one and a half
times greater than the lysate, was then added and mixed by pipetting. The lysate
mixture was then applied to the DNeasy spin column sitting in a 2 mL collection tube
and was centrifuged for 1 minute at 10,000 rpm. The DNeasy column was then placed
into a new 2 mL collection tube and 500 μL of buffer AW was added, mixed and
centrifuged for 1 minute at a speed greater than 8,000 rpm. Another 500 μL of buffer
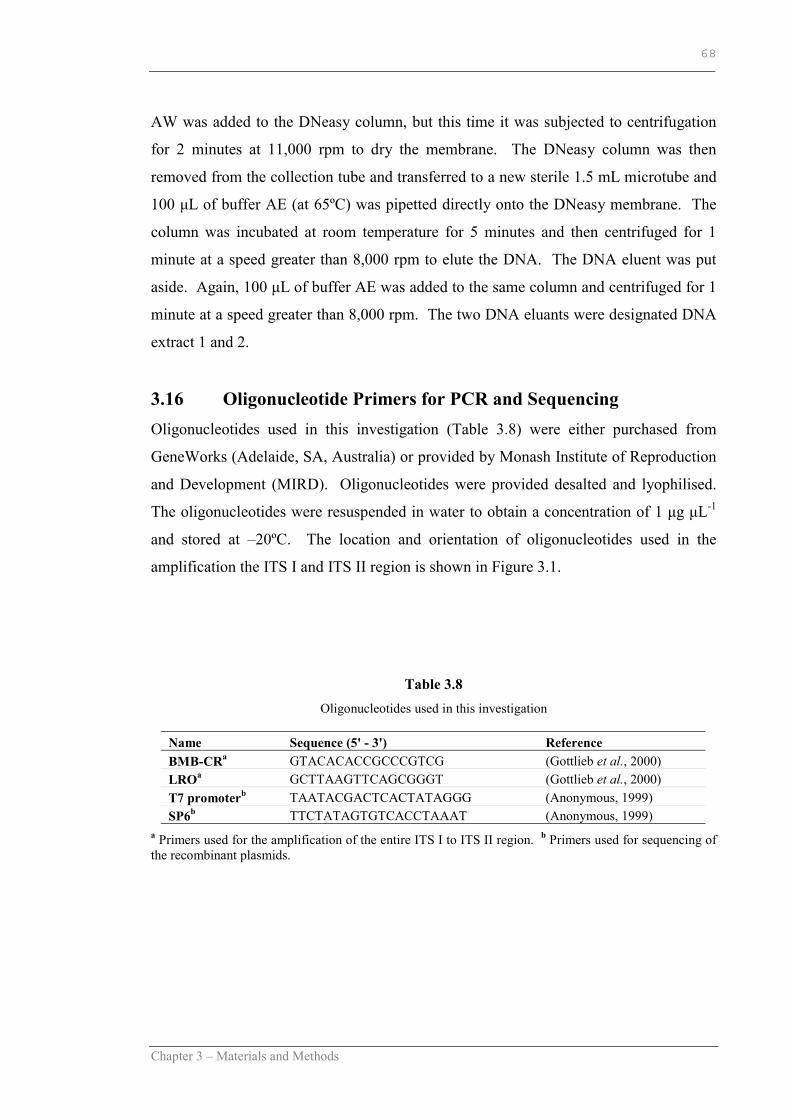
Chapter 3 – Materials and Methods
68
AW was added to the DNeasy column, but this time it was subjected to centrifugation
for 2 minutes at 11,000 rpm to dry the membrane. The DNeasy column was then
removed from the collection tube and transferred to a new sterile 1.5 mL microtube and
100 μL of buffer AE (at 65ºC) was pipetted directly onto the DNeasy membrane. The
column was incubated at room temperature for 5 minutes and then centrifuged for 1
minute at a speed greater than 8,000 rpm to elute the DNA. The DNA eluent was put
aside. Again, 100 μL of buffer AE was added to the same column and centrifuged for 1
minute at a speed greater than 8,000 rpm. The two DNA eluants were designated DNA
extract 1 and 2.
3.16 Oligonucleotide Primers for PCR and Sequencing Oligonucleotides used in this investigation (Table 3.8) were either purchased from
GeneWorks (Adelaide, SA, Australia) or provided by Monash Institute of Reproduction
and Development (MIRD). Oligonucleotides were provided desalted and lyophilised.
The oligonucleotides were resuspended in water to obtain a concentration of 1 μg μL-1
and stored at –20ºC. The location and orientation of oligonucleotides used in the
amplification the ITS I and ITS II region is shown in Figure 3.1.
Table 3.8 Oligonucleotides used in this investigation
Name Sequence (5' - 3') Reference BMB-CRa GTACACACCGCCCGTCG (Gottlieb et al., 2000) LROa GCTTAAGTTCAGCGGGT (Gottlieb et al., 2000) T7 promoterb TAATACGACTCACTATAGGG (Anonymous, 1999) SP6b TTCTATAGTGTCACCTAAAT (Anonymous, 1999)
a Primers used for the amplification of the entire ITS I to ITS II region. b Primers used for sequencing of the recombinant plasmids.

Chapter 3 – Materials and Methods
69
Figure 3.1. One major rRNA transcript showing the ITS I and ITS II regions. The ITS regions are the most widely sequenced region in fungal DNA. The diagram displays the orientation and location of oligonucleotides primers used during the PCR amplification in this investigation (Bruns et al., 1991).
3.17 Electrophoresis of DNA 3.17.1 Agarose Gel Electrophoresis Electrophoresis of DNA through agarose was performed as described in Sambrook &
Russell (2001). Agarose (0.7 to 2.0% (w/v)) was prepared in 1 X TBE or 1 X TAE
buffer (Section 3.1.3) and electrophoresis was performed in the same buffer at 100 V.
Samples containing a tracking dye (ratio 5:1) were loaded into the wells of the agarose
gel. A sample of DNA standards (100 bp ladder) was also loaded to allow comparison
of DNA band size. The agarose gel contained 1 µL of aqueous ethidium bromide (10
mg mL-1) and the DNA was visualised by UV trans-illumination.
3.17.2 Polyacrylamide Gel Electrophoresis (PAGE) Electrophoresis of DNA through polyacrylamide was performed as described by
Sambrook and Russell (2001) with some minor modifications. A polyacrylamide gel
(8% stacking gel and 10% resolving gel) was prepared in a 1 X TBE buffer solution.
Samples containing a tracking dye (ratio 5:1) were loaded into the wells. A sample of
DNA standards (50 bp ladder) was also loaded. Electrophoresis was carried out at 25
mA until the tracking dye reached the bottom of the gel. The gel was removed,
carefully rinsed with water and then soaked in an ethidium bromide solution (1 μg per
100 mL-1 water). The DNA fragments were visualised by UV trans-illumination.
3.18 Polymerase Chain Reaction (PCR) of Fungal DNA Regions PCR was performed using standard procedures as described in Sambrook and Russell
(2001) with minor modifications. Each 25 µL reaction contained final concentration of
SSU (18S RNA) 5.8S RNA LSU (25-28S RNA) 5S RNA
ITS I ITS II Intergenic spacer regions
BMB-CR LRO

Chapter 3 – Materials and Methods
70
4 μM deoxy nucleotide tri-phosphates (dNTP’s, Promega), 1.5 mM MgCl2, 1 X reaction
buffer (Promega, final concentrations in buffer 10 mM Tris-HCl (pH 9), 50 mM KCl,
and 1% Triton®X-1000), 2.5 units of Taq DNA polymerase (Promega), 1 μM of each
oligonucleotide template and approximately 0.2 ng of DNA template. Control reactions
without DNA template were also prepared. The amplification of the ITS I and ITS II
regions of the fungal DNA was performed using a PTC-150 MiniCycler thermocycler
with a heated lid under the conditions shown in Table 3.9.
Table 3.9 Thermo-cycling conditions for the amplification of the ITS I and ITS II regions
Step No. of cycles Temperature (ºC) Time (min) Denaturation 1 95 2.0 Amplification 30 50
72 95
0.5 2.0 1.0
Extension 1 72 7.0 Stop 1 4 ∞
3.19 Purification of DNA 3.19.1 Purification of DNA from Agarose Gels DNA to be purified was electrophoresed through 1% (w/v) agarose in 1 X TAE buffer
containing ethidium bromide. DNA was visualised by UV trans-illumination and the
expected size DNA band was excised from the gel using a sterile scalpel and placed into
a 1.5 mL microtube. The DNA was then purified using an UltraCleanTM DNA
Purification Kit (Mo Bio laboratories, Inc., CA, USA) according to the manufacturer’s
specifications. Briefly, the mass of the gel slice was calculated and three volumes of
ULTRA SALT were added. The microtube was suspended in a water bath at 65°C until
the gel was completely dissolved. For the recovery of 1 μg of DNA, 6 μL of ULTRA
BIND was added. The sample was incubated at room temperature for 5 min, mixing
several times. The sample was then centrifuged for 5 seconds and the supernatant
removed and discarded. The pellet was resuspended in 1 mL of ULTRA WASH, mixed
thoroughly and centrifuged for 5 seconds. The supernatant was removed. The sample
was again centrifuged and carefully aspirated to remove any left over traces of
supernatant. The DNA pellet was resuspended in 12 μL of TE, mixed by pipetting and

Chapter 3 – Materials and Methods
71
incubated for 5 minutes at room temperature. The sample was then centrifuged for 1
minute and the supernatant carefully removed, without disturbing the pellet, and
transferred to a new microtube. The purified DNA was stored at –20°C.
3.19.2 Purification of Recombinant DNA from E. coli Recombinant plasmid DNA was purified from a 2 mL overnight E. coli culture using
the alkaline lysis method (Sambrook & Russell, 2001). A 1.5 mL sample of the
overnight culture was transferred to a sterile microtube and centrifuged at 11,000 rpm.
The pellet was resuspended in 200 μL of TE plus RNase (100 μg mL-1) and mixed by
pipetting. Subsequently, 100 µL of ice cold Solution I (50 mM glucose, 25 mM Tris-Cl
(pH 8), 10 mM EDTA (pH 8)) was added. An aliquot (200 μL) of freshly prepared
Solution II (0.2 N NaOH, 1% SDS) was then pipetted with force into the microtube.
The mixture was incubated for 5 minutes at room temperature and then a 200 μL aliquot
of Solution III (60 mL of 5 M CH3COOK, 11.5 mL of glacial CH3COOH and 28.5 mL
of H2O) was gently added to the side of the sample tube. The microtube was inverted
three times and centrifuged for 8 minutes at 11,000 rpm. The supernatant (600 μL) was
carefully transferred to a new tube and the pellet discarded. A 150 μL sample of
phenol:chloroform (50:50) was added to the tube, the mixture vortexed for 5 seconds
and then centrifuged for 3 minutes at 11,000 rpm. The top layer (approx. 500 μL) was
carefully transferred to a new tube. One mL of 100% EtOH was then added, mixed and
allowed to incubate for 5 minutes at room temperature. The mixture was then
centrifuged at 11,000 rpm for 10 minutes to obtain a white pellet. The EtOH was
aspirated from the microtube and the pellet carefully washed twice in 70% EtOH. The
ethanol was removed and the microtubes inverted to dry. The recombinant plasmid
DNA was then redissolved in 40 μL of TE (pH 8) and stored at –20°C.
3.20 Enzymatic Modifications of DNA 3.20.1 Restriction Digest of Recombinant DNA Digestion of the purified recombinant DNA plasmid by endonucleases was performed
by adding 4.4 μL of sterile water, 1 μL of 10X Multicore™ buffer (Promega, 1X final
concentration was 25mM tris acetate pH 7.8 (25°C), 100 mM potassium acetate, 10 mM
DL-dithiothreitol (DTT)), 0.1 μL of Bovine serum albumin (BSA) (10 mg mL-1) and 4
Chapter 3 – Materials and Methods
72
μL of the purified recombinant DNA into a 0.6 mL microtube. A 0.5 μL sample of the
appropriate restriction enzyme was added to the microtube and mixed by pipetting.
Two enzyme systems were used. The first system used two enzymes, SacI (10 units
μL-1) and ApaI (10 units μL-1), and the second only one enzyme, EcoRI (12 units μL-1).
A negative control was also prepared in the same manner omitting the restriction
enzyme. The samples were incubated for 1 hour at 37°C. The resulting digests were
analysed by agarose gel electrophoresis (Section 3.17.1) on a 1% (w/v) agarose gel.
3.20.2 Restriction Enzyme Digestion of PCR DNA Restriction endonuclease digestion of the purified PCR DNA was performed in 0.6 mL
PCR tubes. Separate digestions were prepared using the restrictions enzymes, ApaI,
HaeIII, HhaI and HindIII. Each 20 μL reaction contained a final concentration of 20
μg BSA (10mg mL-1), 1 X reaction Buffer B (AluI and HindIII) or C (HaeIII and HhaI)
(Promega) (1X final concentrations in: Buffer B, 6 mM tris-HCl, 6 mM MgCl2, 50 μM
NaCl, 1 mM DTT, pH 7.5 at 37°C; Buffer C, 10 mM tris-HCl, 10 mM MgCl2, 50 mM
NaCl, 1 mM DTT, pH 7.9 at 37°C), 5 units of restriction enzyme (Promega) and
approximately 750 ng of DNA template. Samples were incubated for 6 hours at 37°.
The resulting restriction digests were analysed by PAGE (Section 3.17.2).
3.21 Cloning of the Fungal ITS I and ITS II Region 3.21.1 Plasmids used for Cloning The pT7Blue-3 Perfectly Blunt Vector (Novagen, Madison, WI, USA) was used for
blunt end cloning and the pGEM®-T Easy Vector system (Promega Corporation,
Madison, WI, USA) was used for cohesive end cloning in this investigation.
3.21.2 Cloning into pT7Blue-3 The cloning of purified PCR DNA into the pT7Blue-3 vector was performed using a
Perfectly Blunt Cloning Kit (Promega Corporation, Madison, U.S.A.). Briefly, end
conversion of the DNA was performed by mixing 0.2 µL of the purified PCR product,
5.0 μL of the end conversion mix and 0.3 μL of nuclease free water in a 0.6 mL
microtube. The solutions were mixed and incubated for 15 minutes at 22°C. The
sample was then heated at 75°C for 5 minutes and then cooled on ice for 2 minutes.
Chapter 3 – Materials and Methods
73
The ligation proceeded by adding 1 μL of Blunt Vector and 1 μL of T4 DNA ligase to
the end conversion mix. The solutions were mixed and incubated at 22ºC overnight.
Transformation of the ligation mix was performed by the addition of 1 to 12 μL of the
ligation mix to a microtube containing 50 μL NovaBlue singles competent E. coli cells,
which were supplied with the cloning kit. The solution was mixed gently and kept on
ice for 5 to 30 minutes. A heat shock was performed by incubation for 30 seconds in a
42ºC water bath. The microtube was again placed on ice for 2 minutes and 250 μL of
SOC medium was added.
3.21.3 Cloning into pGEM®-T Easy Cloning of purified PCR DNA into the pGEM®-T Easy vector was performed using a
cloning kit obtained from Promega Corporation (Madison, U.S.A.). A ligation reaction
was prepared by adding 2 μL of deionised water, 5 μL of 2X rapid ligation buffer, 1 μL
of the vector (50 ng), 1 μL of the purified PCR product (36.5 ng) and 1 μL of T4 DNA
ligase into a 0.6 mL microtube. The sample was mixed and incubated at 4ºC overnight.
The microtubes were then centrifuged briefly and 2 μL of the sample was transferred to
a new 1.5 mL microtube on ice. The transformation mix was prepared by transferring
50 μL of E. coli JM109 competent cells into the ligation mix and gently mixing. The
microtube was left on ice for 20 min, heat shocked for 45 to 50 seconds in a water bath
at 42ºC and then returned to the ice for 2 minutes. A 950 μL sample of SOC medium
was then added to the transformation mix and left to incubate at 37ºC for 1.5 hours, with
shaking at a speed of 150 rpm.
3.21.4 Blue / White Screening for Recombinant Plasmids Using a sterile glass spreader, the surface of freshly prepared LB agar plates was spread
with 35 μL of 50 mg mL-1 X-gal in dimethylformamide and 20 μL of 100 mM IPTG in
water. Once the plates were dry, the transformation mix was spread over the surface of
the plates. The plates were incubated overnight at 37°C and then inspected for growth.
White colonies were indicative of the bacteria carrying the recombinant plasmid, whilst
blue colonies were indicative of the bacteria carrying the vector that contained no insert.
To produce large amounts of recombinant plasmid for further purification, single white
colonies were selected and grown in 2 mL of LB broth at 37ºC overnight.

Chapter 3 – Materials and Methods
74
3.22 DNA Sequencing Recombinant DNA was sequenced at the Wellcome Trust Sequencing Centre, MIRD.
Sequences were determined by the chain termination method with the use of the
DyeDeoxy Terminator Cycle Sequencing Kit (Perkin Elmer Applied Biosystems, UK),
using an AVI377 automated DNA sequencer. A typical reaction consisted of 400 ng of
plasmid DNA together with 3.2 pmol of primer. Primers used for sequencing are listed
in Table 3.8. For each sample under investigation, three recombinant clones were
chosen and sequenced in the forward and reverse direction. DNA sequence data were
compiled and analysed using the program Sequencher version 3.0 (Genecodes, Ann
Arbor, MI, U.S.A.).
3.23 Sequence Data Analysis Sequence data was compared to some Australian isolates (Smith & Sivasithamparam,
2000a) and some isolates used by Moncalvo et al. (1995a) and are listed in Table 3.10.
DNA Sequences (ITS I, ITS II and ITS I + ITS II) were aligned using ClustalW
program in Biology Workbench version 3.2 (Subramaniam, 1999). Final alignments
were visually examined and adjusted manually. Phylogenetic analysis was conducted
using the program MEGA version 2.1 (Kumar et al., 2001). Maximum parsimony (MP)
analysis was performed on separate ITS I, ITS II data sets and on the combined data set.
Missing data/gaps were treated as pairwise deletions. A heuristic search was performed
using close neighbourhood interchange (CNI) branch swapping on starting trees
generated with twenty random addition sequences. A strict consensus tree was derived
from the results. The robustness of the internal branches was evaluated by 100
bootstrap replications using a heuristic search starting with twenty random addition
sequences. Also evaluated were MP trees set to complete deletion (all gaps/missing
data were removed from the analysis) and Minimum Evolution Trees (MEv). Pairwise
nucleotide differences were calculated using Pairwise distance options in MEGA.

Chapter 3 – Materials and Methods
75
Table 3.10 Ganoderma isolates used for the phylogenetic analysis in this investigation
Groupa Ganoderma Speciesb Collection No.c Isolationd ITSI/ITSII Accession No.e - G. cupreum (H1) SUT H1 QLD AY569450 - G. weberianum (H2) SUT H2 QLD AY569451 - Ganoderma sp. (H3) SUT H3 QLD AY569452 - Ganoderma sp. SE1 BS ? - 5.1 G. weberianum CBS 219.36 Philippines X78734/X78755 5.1 G. weberianum CCRC 37081 Taiwan Z37064/Z37086 5.1 G. weberianum* RSH 0821 Taiwan X78751/X78772 5.2 G. weberianum** DFP4483 QLD - 5.2 G. weberianum DFP 8401 NSW - 5.2 G. weberianum** DFP 8405 NSW - 6.3 Grp. 6.3### UWA 8 WA - 6.3 Grp. 6.3### QFRI 8147.1 QLD - 6.3 Grp. 6.3### QFRI 8647.1 QLD - 6.3 Grp. 6.3### DAR 73779 WA - 7 Grp. 7++ RSH 1109 Japan X78747/x78768 7 Grp. 7++ RSH BLC Taiwan Z37097/z37078 7 Grp. 7++ RSH J2 Japan X78746/x78767 7 Grp. 7** HMAS 60537 China Z37050/Z37074 8.1 G. sinense ZHANG 1734 China Z37066/Z37103 8.1 G. sinense# RSH 0109 Taiwan X78752/X78773 8.2 G. cupreum DFP 3896 QLD - 8.2 G. cupreum DFP 4336 NSW - 8.2 G. cupreum*** QFRI 8678.1 QLD - 11.3 G. australe DAR 73781 WA - 11.3 G. australe## DFP 3386 TAS - 11.3 G. australe UWA 92 WA - 11.3 G. australe UWA 108 QLD - 10 G. incrassatum DAR 73783 NT - 10 G. incrassatum SE3 Thailand - 11.2 G. adspersum CBS 351.74 Belgium X78742/X78763 11.2 G. adspersum## IMI157816 UK - - G. lucidum ATCC 46755 USA Z37052/Z37076 - Fomitopsis cf. roseaf JMM T92-10 Taiwan X78754/X78775
Shaded rows are Ganoderma species determined in this investigation; a Classification from Smith & Sivasithamparam (2000a); b Identification at time of isolation: *G. microsporum, **G. lucidum, ***G. chalceum, #G. Formosan, ##G. applanatum, ### Ganoderma sp. aff. lucidum, ++G. tsugae, and were renamed by Smith & Sivasithamparam (2000a); c ATCC, American Type Culture Collection, Maryland, USA; CBS, Centraalbureau voor Schimmelcultures, Baarn, The Netherlands; CCRC, Culture Collection and Research Centre of Hsinchu, Taiwan; CSIRO, Melbourne, Australia; IMI, International Mycological Institute, Egham, Surrey, UK; DAR, Orange Agricultural Institute, Orange, Australia; DFP, Division of Forest Products; HMAS, Herbarium Mycologicum Academiae Sinicae, Institute of Microbiology, Academia Sinica, Beijing, China; QFRI, Queensland Forest Research Institute, Department of primary industries, forestry, Indooroopilly, Queensland; RSH, Collection of J. M. Moncalvo, Duke University, Durham, NC, USA; SUT, Swinburne University of Technology, Hawthorn , Australia; UWA, personal collection of B. J. Smith; ZHANG, X. Q. Zhang, Beijing, China; d Australian state or territory abbreviations, NSW, New South Wales; NT, Northern Territory; QLD, Queensland; TAS, Tasmania; VIC, Victoria; WA, Western Australia; e Accession numbers obtained from the National Centre for
Chapter 3 – Materials and Methods
76
Biotechnology Information (NCBI) database, all other sequence data was obtained from Smith & Sivasithamparam (2000a). F Fomitopsis cf. rosea (not a Ganoderma species) was used as an outgroup in the phylogenetic analysis.

4 Chapter Four
MMoolleeccuullaarr aanndd PPhhyyllooggeenneettiicc AAnnaallyyssiiss
Chapter 4 – Molecular and Phylogenetic Analysis
78
4.1 Introduction The taxonomic identification of an organism is an essential part of the investigation of a
new species or isolate of a known species. It is imperative that the organism is correctly
identified so that when reference is made to published material, the experimental data
becomes valid and may be used and compared by other investigators. Classical
identification techniques used in the identification of fungi include the macroscopic and
microscopic comparison of morphological features such as the fruiting body colour,
spore size, pore size and cutex. With the progress in molecular genetics, these
identification techniques are now being replaced by more modern methods that analyse
and compare the ribosomal RNA (rRNA) genes from different fungal isolates. Such
molecular techniques used for fungal identification to date include PCR coupled with
RFLP (Miller et al., 1999), isozyme analysis (Gottlieb et al., 1998; Gottlieb & Wright,
1999b; Smith & Sivasithamparam, 2000b) and direct sequencing of the rRNA genes
(Hong et al., 2002; Moncalvo et al., 1995a, 1995c; Smith & Sivasithamparam, 2000a).
In addition, developments in the field of bioinformatics have enabled the interpretation
of this sequence information to yield information about the evolutionary relationships
between new and existing fungal species. This chapter reports the identification of three
Australian Ganoderma isolates using molecular techniques and bioinformatic tools.
4.2 Overview The identification of the three Australian Ganoderma isolates using molecular
techniques and tools was performed. DNA was extracted from the fungal mycelium of
the three isolates. Specific ITS regions were amplified using PCR and analysed by
RFLP. The specific regions were also cloned into the pGEM® -T Easy vector to
produce recombinant DNA. Sequence analysis of the recombinant plasmids afforded
sequence data, which in turn, were examined to produce consensus sequences for each
isolate. Consensus sequences were then compared against sequence data from other
known Ganoderma species using sequence analysis software.

Chapter 4 – Molecular and Phylogenetic Analysis
79
4.3 Results and Discussion 4.3.1 Isolation of Three Australian Ganoderma Species Three Ganoderma species were isolated from the Cairns State Forest in Queensland,
Australia, by a local mushroom cultivator, Mr. Henk Voogt. At the time of isolation,
the three fungi were identified to be from the Ganodermataceae family because of
typical characteristics they had in common with other members of this family. For this
reason, the three isolates have been designated Ganoderma H1, Ganoderma H2 and
Ganoderma H3 in this investigation. Both Ganoderma H1 and H3 were isolated from
the trunks of dead trees, whilst Ganoderma H2 was isolated from the soil. Ganoderma
H2 appeared to be growing on the matter in the soil, such as rotting branches and roots.
The exact coordinates from where they were isolated are 16.59’51”S, 145.40’01”E
(H1), 16.48’06”S, 145.36’59” (H2) and 16.56’04”, 145.36’56” (H3). Figure 4.1 shows
photos taken at the time of isolation of the three living fungal isolates.
Figure 4.1. Representative photos of the three Australian Ganoderma species isolated from the Cairns State Forest. (a) Ganoderma H1, (b) Ganoderma H2, and, (c) Ganoderma H3. All three isolates were living at the time of photography and can be seen growing on either wood or organic matter.
a. b.
c.

Chapter 4 – Molecular and Phylogenetic Analysis
80
Attempting to identify new fungi based on traditional classification methods could
possibly lead to misidentification, especially if one is not a mycological taxonomist.
Ultimately, this would contribute to the taxonomic crisis in the classification of
Ganoderma species (Ryvarden, 1991). Therefore, traditional identification techniques
were not employed and only the molecular identification was considered in this
investigation.
4.3.2 Molecular Analysis Molecular techniques are becoming increasingly popular in the identification of new
fungal species. In this section the identification of the Ganoderma isolates was
performed using modern molecular techniques including PCR, RFLP and the cloning
and sequencing of DNA fragments. DNA was extracted from the mycelium of the three
isolates and the ITS I and ITS II regions of the rRNA genes amplified using specific
primers. This specific region, which contains fungal evolutionary information, was then
subjected to analysis by RFLP. A type G. lucidum specimen was also included for
comparison against the three isolates. The specific ITS regions were also cloned,
subjected to sequence analysis and in turn, the sequence data analysed and compared
against other Ganoderma isolates using appropriate software.
4.3.2.1 DNA Extraction and Amplification by Polymerase Chain Reaction
(PCR)
DNA was extracted from the dried fungal mycelium of Ganoderma H1, H2, H3 and G.
lucidum, which had been cultivated in MEB in shaker flasks (Section 3.10.1). The
extraction process employed a commercial extraction kit and is described in Section
3.15. The resulting DNA was electrophoresed through a 1% (w/v) agar gel (Section
3.17.1) and it was observed that good yields of fungal DNA were obtained (results not
shown).
PCR of Ganoderma H1, H2, H3 and G. lucidum (Section 3.18) DNA, using the primer
pairs BMB-CR/LR0, amplified the internal transcribed spacer (ITS I and ITS II)
regions, the 5.8S region and a small portion of the 18S and 25S rDNA genes (Figure
3.1). All four isolates yielded an amplified product of approximately 750 to 800 bp, as
well as some impurities (Figure 4.2a). These impurities were removed upon gel

Chapter 4 – Molecular and Phylogenetic Analysis
81
purification (Section 3.19.1) and again electrophoresed through a 1% (w/v) agarose gel.
Figure 4.2 depicts two typical agarose gels showing the PCR product obtained from
each isolate before (Figure 4.2a) and after purification (Figure 4.2b).
Figure 4.2. PCR and purification of DNA from four Ganoderma isolates. (a) PCR DNA before purification and (b) purified PCR DNA. Lanes 1, 2, 3 and 4 contain DNA from Ganoderma H1, Ganoderma H2, Ganoderma H3 and G. lucidum, respectively. Lane 5 in (a) is a blank, and lane M contains a standard DNA ladder consisting of fragments ranging from 100 to 1500 bp;
The purified PCR product, for all four isolates, corresponds to the single DNA fragment
that can be seen at approximately 800 bp (Figure 4.2b), indicating that the size of the
combined ITS I and ITS II region was close to that observed by Moncalvo et al. (1995c)
and Gottlieb et al. (2000). The exact size of the PCR fragments that had been generated
with the primer pair LRO/BMB-CR was determined after sequence analysis and is
described later in Section 4.3.2.5. This was found to be 774 bp, 770 bp and 758 bp for
Ganoderma H1, H2 and H3 respectively. The exact size of the G. lucidum fragment
was not determined in this investigation.
4.3.2.2 Restriction Fragment Length Polymorphism (RFLP)
Restriction fragment length polymorphism (RFLP) analysis was performed on the
Ganoderma isolates to establish that they were different species, as different
Ganoderma species generally display different restriction patterns (Gottlieb et al.,
2000). One G. lucidum isolate was also included in the RFLP analysis for comparison
against a type species. The single restriction digestions were performed on the purified
300 bp
1000 bp
500 bp
1500 bp
400 bp
700 bp 800 bp
4
2
lane 1
3
M
1000 bp
300 bp
1500 bp
400 bp
800 bp 700 bp 500 bp
a. b. 4
2
lane 1
3
M
5

Chapter 4 – Molecular and Phylogenetic Analysis
82
PCR product of each isolate as described in Section 3.20.2. The digests were then
analysed by polyacrylamide gel electrophoresis (PAGE) using an 8% stacking and 10%
resolving gel (Section 3.17.2). The restriction patterns seen on the polyacrylamide gel
are shown in Figure 4.3. To enable accurate estimation of fragments, a theoretical
restriction digest was performed on the sequence data obtained from sequence analysis
of the three Australian isolates determined later in this Chapter (Section 4.3.2.5). This
was used for comparison against the experimental data. No theoretical digest was
possible on G. lucidum, as GenBank only held sequence data for the separate ITS
regions and not the entire ITS I to ITS II region, which incorporates the 5.8S rRNA. A
restriction map showing the location of sites on the sequences of the three Australian
Ganoderma isolates is also presented in Figure 4.4. This map gives a clear indication of
where each fragment came from within the sequence.
Suitable enzymes for the RFLP analysis were ones that recognised many restriction sites
on the sequences to be analysed. Six restriction enzymes were tested in a preliminary
study (results not shown) and the four that gave the best restriction patterns were
selected for comparative analysis. The patterns observed for the four restriction
enzymes, AluI, HaeIII, HhaI (CfoI) and HindIII, were also compared to patterns that
have been published for some known Ganoderma species (Gottlieb et al., 2000).
Digestion using the enzyme AluI gave different restriction patterns for the three
Australian Ganoderma isolates and G. lucidum (Figure 4.3a). A fragment of
approximately 350 bp was seen for all four isolates. This corresponded to the
theoretical fragment of 336/335 bp for Ganoderma H2 and Ganoderma H3 (Table 4.1).
However, this fragment was not expected for Ganoderma H1 and was thought to be a
result of some incomplete digestion at the site located at nucleotide (nt) 551 (Figure
4.4). Subsequent digestions of Ganoderma H1 using AluI confirmed this (results not
shown). Ganoderma H1 also produced a fragment of 260 bp, which was not observed
for any of the other Ganoderma isolates (Figure 4.3a). The fragment seen at 195 bp for
the three Australian Ganoderma isolates in the experimental digests was also seen in the
theoretical digests (Table 4.1). This fragment was the result of a digestion at the site at
nt 195 (or nt 196 for Ganoderma H1) for each of the sequences (Figure 4.4).

Chapter 4 – Molecular and Phylogenetic Analysis
83
Figure 4.3. RFLP-PAGE of Ganoderma H1, Ganoderma H2, Ganoderma H3 and G. lucidum using the enzymes: (a) AluI, (b) HaeIII, (c) HindIII and, (d) HhaI. Lanes 1 to 4 contain Ganoderma H1, H2, H3 and G. lucidum, respectively. Lane M contains the DNA standards. Fragment sizes are shown for the DNA standard. The inset of (c) shows the results of a subsequent digestion of Ganoderma H3 using the restriction enzyme HindIII.
The four smallest fragments observed in the AluI restriction digest of Ganoderma H1
(72, 75, 76 and 95 bp) and three smallest fragments seen for Ganoderma H2 (69, 75 and
97 bp) corresponded with those for the theoretical digest (Table 4.1). Two of the
similar sized fragments (75 and 76 bp) for Ganoderma H1 were just resolved (Figure
4.3a). The theoretical digest of Ganoderma H3 displayed three small fragments, one of
70 bp and two of 79 bp, whilst the experimental digest only displayed two small
fragments at 70 and 80 bp (Figure 4.3a). This was a result of the two fragments of equal
size (79 bp) migrating through the gel as the same fragment. On close inspection of the
gel it could be seen that the fragment at 80 bp was thicker than the other fragments,
indicating a doublet band (Figure 4.3a). G. lucidum only showed two smaller sized
fragments at 70 and 50 bp. The digestion pattern exhibited by G. lucidum using AluI
50 bp
100 bp
800 bp
150 bp
300 bp 200 bp
a. AluI b. HaeIII
1 2 M 3 4 M 1 4 2 3
c. HindIII d. HhaI 800 bp
350 bp
100 bp
200 bp
150 bp
250 bp
750 bp
M 1 4 2 3
1
2 M 3 4 M 3
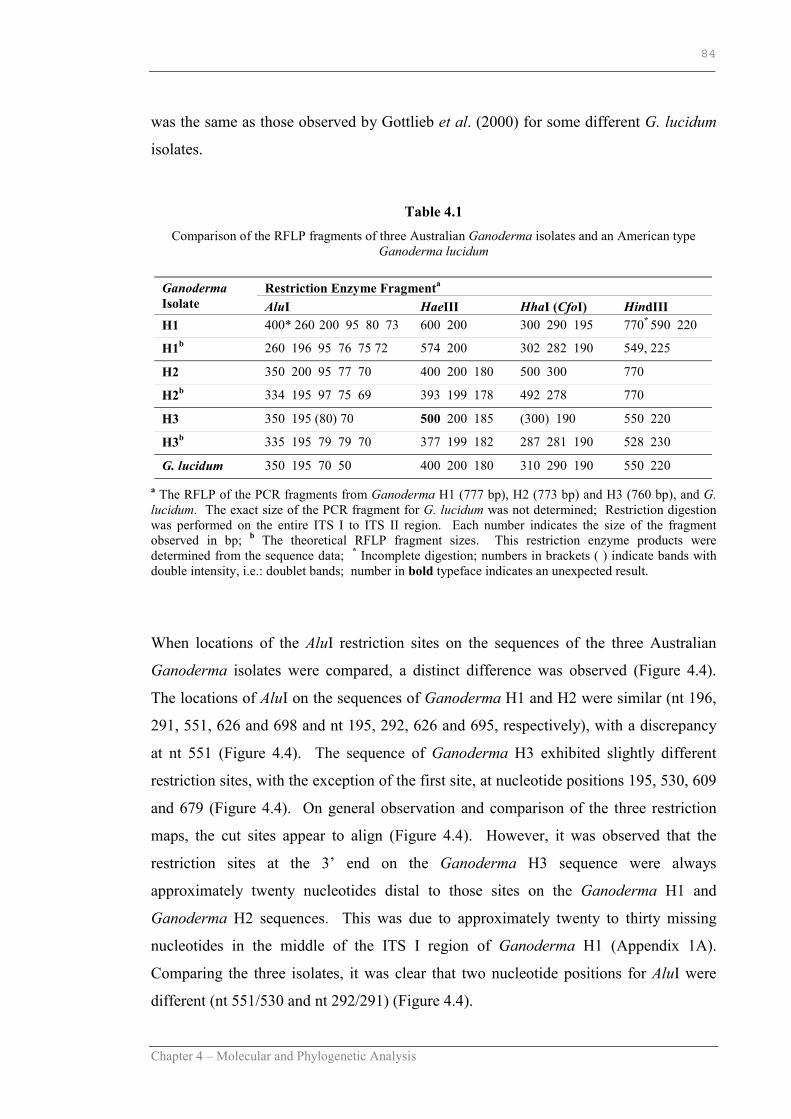
Chapter 4 – Molecular and Phylogenetic Analysis
84
was the same as those observed by Gottlieb et al. (2000) for some different G. lucidum
isolates.
Table 4.1 Comparison of the RFLP fragments of three Australian Ganoderma isolates and an American type
Ganoderma lucidum
a The RFLP of the PCR fragments from Ganoderma H1 (777 bp), H2 (773 bp) and H3 (760 bp), and G. lucidum. The exact size of the PCR fragment for G. lucidum was not determined; Restriction digestion was performed on the entire ITS I to ITS II region. Each number indicates the size of the fragment observed in bp; b The theoretical RFLP fragment sizes. This restriction enzyme products were determined from the sequence data; * Incomplete digestion; numbers in brackets ( ) indicate bands with double intensity, i.e.: doublet bands; number in bold typeface indicates an unexpected result.
When locations of the AluI restriction sites on the sequences of the three Australian
Ganoderma isolates were compared, a distinct difference was observed (Figure 4.4).
The locations of AluI on the sequences of Ganoderma H1 and H2 were similar (nt 196,
291, 551, 626 and 698 and nt 195, 292, 626 and 695, respectively), with a discrepancy
at nt 551 (Figure 4.4). The sequence of Ganoderma H3 exhibited slightly different
restriction sites, with the exception of the first site, at nucleotide positions 195, 530, 609
and 679 (Figure 4.4). On general observation and comparison of the three restriction
maps, the cut sites appear to align (Figure 4.4). However, it was observed that the
restriction sites at the 3’ end on the Ganoderma H3 sequence were always
approximately twenty nucleotides distal to those sites on the Ganoderma H1 and
Ganoderma H2 sequences. This was due to approximately twenty to thirty missing
nucleotides in the middle of the ITS I region of Ganoderma H1 (Appendix 1A).
Comparing the three isolates, it was clear that two nucleotide positions for AluI were
different (nt 551/530 and nt 292/291) (Figure 4.4).
Restriction Enzyme Fragmenta Ganoderma Isolate AluI HaeIII HhaI (CfoI) HindIII H1 400* 260 200 95 80 73 600 200 300 290 195 770* 590 220
H1b 260 196 95 76 75 72 574 200 302 282 190 549, 225
H2 350 200 95 77 70 400 200 180 500 300 770
H2b 334 195 97 75 69 393 199 178 492 278 770
H3 350 195 (80) 70 500 200 185 (300) 190 550 220
H3b 335 195 79 79 70 377 199 182 287 281 190 528 230
G. lucidum 350 195 70 50 400 200 180 310 290 190 550 220

Chapter 4 – Molecular and Phylogenetic Analysis
85
a.
b.
c.
Figure 4.4. Comparison of the restriction enzyme sites on the sequences of: (a) Ganoderma H1 (774 bp), (b) Ganoderma H2 (770 bp) and (c) Ganoderma H3 (758 bp); The restriction digestion was performed on the combined ITS I to ITS II regions, which incorporated the 5.8S region; The four enzymes used were AluI, HaeIII, HindIII and HhaI. The location of the restriction site is the number of nucleotides along the sequence in the direction 5’ to 3’.
Ganoderma H1 had only one restriction site for the enzyme HaeIII at nt 199, whilst
both Ganoderma H2 and Ganoderma H3 had two restriction sites at nt 199 and 592 and
nt 199 and 576, respectively (Figure 4.4). As previously observed, the restriction site at
the 3’ end of the Ganoderma H3 sequence was approximately twenty nucleotides distal
to the corresponding position on the Ganoderma H2 sequence. Overall, restriction
digestion with HaeIII resulted in two fragments for Ganoderma H1 (600 and 200 bp)
AluI (195)
HaeIII (199)
AluI (292)
HhaI (492)HaeIII (592)
AluI (626)AluI (695)
HaeIII (592)
AluI (695) AluI
(626)
AluI(195)
HhaI (492)
HaeIII(199)
AluI (292)
1 770
AluI (196)
HaeIII (200)
AluI (291)
HhaI (302) HhaI (492)
HindIII (549)
AluI (551)AluI (626)
AluI (698)HindIII (549)
AluI (551)
AluI (698) AluI
(626)
AluI(196)
HhaI (492)
HhaI (302) HaeIII
(200)
AluI (291)
1 774
AluI (195)
HaeIII (199)HhaI (281) HhaI (471)
HindIII (528)AluI (530)
HaeIII (576)
AluI (609)AluI (679)
758 bpHindIII
(528) AluI (530)
AluI (679) AluI
(195)
HhaI (471)
HhaI (281)
HaeIII (199)
HaeIII (576) 1 758
AluI (609)

Chapter 4 – Molecular and Phylogenetic Analysis
86
and three fragments for Ganoderma H2, Ganoderma H3 and G. lucidum (400, 200 and
180 bp; 500, 200 and 185 bp; 400, 200 and 180, respectively) (Figure 4.3b). The sizes
of fragments in the experimental digests correlated with those in the theoretical digest,
with the exception of one fragment from Ganoderma H3, which was observed to be 500
bp instead of 377 bp (Table 4.1). This was not expected and could not be explained, as
the size of the Ganoderma H3 DNA analysed was 760 bp (Figure 4.3b) and not 885 bp,
as indicated by the results (Figure 4.3b and Table 4.1).
There were no HindIII restriction sites present in the sequence of Ganoderma H2,
resulting in only one fragment of 730 bp (the original fragment) on the polyacrylamide
gel (Figure 4.3c). Initial digestion with HindIII also did not cut the Ganoderma H3
sequences, however, subsequent digests yielded two fragments (inset of Figure 4.3c).
There was little difference between the restriction patterns of Ganoderma H1, H3 and
G. lucidum, as HindIII cut these isolates at one site of similar location resulting in two
fragments (Figure 4.3c and Figure 4.4). In contrast, the G. lucidum isolates investigated
by Gottlieb et al. (2000) did not contain any restriction sites for HindIII. In addition,
they found only one isolate within the subgenus Ganoderma, G. tuberculosum, was cut
with HindIII. Ganoderma H1 also displayed an additional band at 770 bp, which was
the undigested original fragment (Figure 4.3c). Overall the experimental digestions
corresponded with the theoretical digestions resulting in similar fragment sizes (Table
4.1).
The HhaI restriction enzyme cut at two sites of similar positions for both Ganoderma
H1 and H3 (nt 302 and 492 and nt 281 and 471, respectively), taking into consideration
the twenty nucleotide difference for Ganoderma H3 (Figure 4.1). This resulted in
similar restriction patterns with two fragments of slightly different sizes (300, 290 and
195 bp for Ganoderma H1, and 300, 300 and 190 bp for Ganoderma H3) (Figure 4.3d).
The 300 bp and 290 bp fragments of Ganoderma H1 were only just resolved on close
inspection of the polyacrylamide gel, whilst the two fragments at 300 bp for Ganoderma
H3 were unresolved, but the band was wide and therefore, indicative of a doublet
(Figure 4.3d). All fragments observed in the experimental digests corresponded to those
of the theoretical digest (Table 4.1). HhaI cut Ganoderma H2 at one position, nt 492
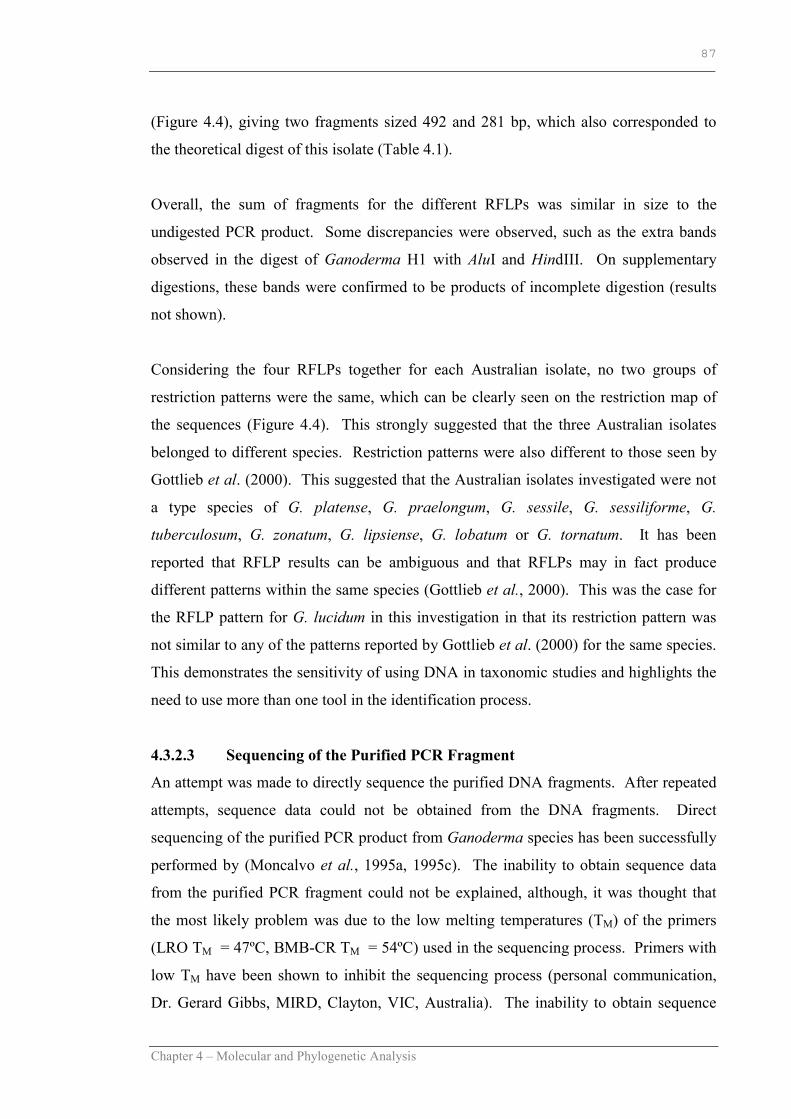
Chapter 4 – Molecular and Phylogenetic Analysis
87
(Figure 4.4), giving two fragments sized 492 and 281 bp, which also corresponded to
the theoretical digest of this isolate (Table 4.1).
Overall, the sum of fragments for the different RFLPs was similar in size to the
undigested PCR product. Some discrepancies were observed, such as the extra bands
observed in the digest of Ganoderma H1 with AluI and HindIII. On supplementary
digestions, these bands were confirmed to be products of incomplete digestion (results
not shown).
Considering the four RFLPs together for each Australian isolate, no two groups of
restriction patterns were the same, which can be clearly seen on the restriction map of
the sequences (Figure 4.4). This strongly suggested that the three Australian isolates
belonged to different species. Restriction patterns were also different to those seen by
Gottlieb et al. (2000). This suggested that the Australian isolates investigated were not
a type species of G. platense, G. praelongum, G. sessile, G. sessiliforme, G.
tuberculosum, G. zonatum, G. lipsiense, G. lobatum or G. tornatum. It has been
reported that RFLP results can be ambiguous and that RFLPs may in fact produce
different patterns within the same species (Gottlieb et al., 2000). This was the case for
the RFLP pattern for G. lucidum in this investigation in that its restriction pattern was
not similar to any of the patterns reported by Gottlieb et al. (2000) for the same species.
This demonstrates the sensitivity of using DNA in taxonomic studies and highlights the
need to use more than one tool in the identification process.
4.3.2.3 Sequencing of the Purified PCR Fragment
An attempt was made to directly sequence the purified DNA fragments. After repeated
attempts, sequence data could not be obtained from the DNA fragments. Direct
sequencing of the purified PCR product from Ganoderma species has been successfully
performed by (Moncalvo et al., 1995a, 1995c). The inability to obtain sequence data
from the purified PCR fragment could not be explained, although, it was thought that
the most likely problem was due to the low melting temperatures (TM) of the primers
(LRO TM = 47ºC, BMB-CR TM = 54ºC) used in the sequencing process. Primers with
low TM have been shown to inhibit the sequencing process (personal communication,
Dr. Gerard Gibbs, MIRD, Clayton, VIC, Australia). The inability to obtain sequence

Chapter 4 – Molecular and Phylogenetic Analysis
88
data directly from the PCR fragment prompted the decision to utilise alternative
methods such as the production of recombinant DNA (Section 4.3.2.4).
4.3.2.4 Cloning of the Purified PCR Fragment
The purified PCR fragments were cloned into two commonly used vectors to produce
recombinant plasmids. This enabled sequencing of the plasmids using universal
primers. Initially, the PCR product was cloned into the pT7Blue-3 blunt end vector.
Screening for transformants gave a low yield of colonies on a number of attempts
(approximately three white colonies were obtained on each attempt). Low yields of
white colonies were also observed after altering variables such as ligation reaction
volume and time, as well as transformation time. In addition, analysis of these white
colonies indicated that there were no PCR inserts of the expected size between 750 and
800 bp (results not shown). Therefore, a different vector system was employed,
pGEM-T Easy.
4.3.2.4.1. Cloning into pGEM-T Easy Vector System
The purified PCR fragment of Ganoderma H1, H2 and H3 was successfully cloned into
the pGEM-T Easy vector (Figure 4.5). Preparation, ligation and transformation of the
vector and DNA insert was performed as described in Section 3.21.3. A recombinant
vector of G. lucidum was not prepared, as sequence data for the ITS I and ITS II regions
were available in GenBank. Blue/white screening for recombinants gave a ratio of
40:60 (blue: white) (Section 3.21.4). White colonies were picked from the plate and
plasmid purification was performed as described in Section 3.19.2. The recombinant
plasmids carrying the Ganoderma H1, Ganoderma H2 and Ganoderma H3 PCR
products were designated pGEM-H1, pGEM-H2 and pGEM-H3, respectively.
4.3.2.4.2. Restriction Digest Analysis of the Recombinant Plasmids
The screening of the recombinant plasmids led to some valuable information about
restriction sites in the Ganoderma H1, H2 and H3 DNA fragments. A number of
purified plasmids were chosen and analysed further for the expected 750 to 800 bp
insert by restriction digestion (Section 3.20.1). The resulting digests were
electrophoresed through 1% (w/v) agarose gels (Section 3.17.1). Two different digest
systems were employed for the screening of the recombinant plasmids. The first system

Chapter 4 – Molecular and Phylogenetic Analysis
89
used the restriction enzymes ApaI and SacI, which cut at nt 15 and 110, respectively, in
the plasmid vector sequence. The second system used the restriction enzyme EcoRI.
There were two restriction sites in the plasmid vector for this enzyme at nt 53 and 71 in
the vector.
Figure 4.5. A vector map of pGEM® -T Easy showing: (a) the original pGEM®-T Easy vector (3015 bp) (b) the vector with the Ganoderma H1 PCR insert, pGEM-H1 plasmid (3789 bp); The diagrams show the ß-lactamase coding region, Ampr (aqua) and the lacZ region (green), which is split when the PCR product is inserted into the multiple cloning region (white).
ApaI (15)
EcoRI (53)
EcoRI (71)
SacI (110)
3015 bp
EcoRI (53) EcoRI (71)
SacI (110) ApaI (15)
Ampr
lacZ
ApaI (15)
EcoRI (53)
EcoRI (513)
EcoRI (845)
SacI (884)
3789 bp
EcoRI (513)
EcoRI (845)
EcoRI (53)
f1 ori
Ampr
lacZ H1 PCR
insert
b.
pGEM®-T Easy Vector
pGEM -H1 plasmid
ApaI (15)
f1 ori
SacI (884)

Chapter 4 – Molecular and Phylogenetic Analysis
90
The PCR products for Ganoderma H1, H2 and H3 were inserted into the region
between nucleotides 60 and 61 in the pGEM®-T Easy vector (Figure 4.5b). Therefore,
each plasmid increased in size by the insert PCR piece (i.e. vector (3015 bp) plus
Ganoderma H1 (774 bp) or Ganoderma H2 (770 bp) or Ganoderma H3 (758 bp)).
Figure 4.5b shows a representative plasmid with the Ganoderma H1 insert (774 bp),
which increases the plasmid to 3789 bp. Figure 4.5 also shows the location of the
restriction sites in the plasmid. This demonstrates that when the plasmid was cut with
the enzymes ApaI and SacI, the size of the insert fragment became slightly larger (869
bp) than the original insert (774 bp). This larger sized fragment was seen in the
following digests using the enzymes ApaI and SacI (Figures 4.6a, 4.7a, 4.8a). EcoRI
did not increase the size of the insert fragment, as the restriction sites for this enzyme
closely flanked the region of where the PCR product was inserted into the vector
(Figure 4.5b).
The screening process was primarily performed to select three recombinant plasmids to
be sequenced (Section 4.3.2.5), for each of the isolates. During PCR of the DNA
fragments, there is a small chance that the enzyme, taq DNA polymerase, may introduce
a base error into the sequence. For this reason, deriving a consensus sequence from
three clones reduces the chances of obtaining the DNA sequence with an incorrect base.
Figure 4.6. Restriction digests of a number of recombinant plasmids, pGEM-H1, using (a) ApaI and SacI, and (b) EcoRI. Lane M contains the 100 bp DNA marker, lanes 1 to 6 contain the purified recombinant plasmid, lane 7 has purified PCR DNA and lane 8 has the plasmid vector pGEM-T Easy.
a.
500 bp
800 bp
1500 bp
3000 bp
b.
500 bp
800 bp
1500 bp
3000 bp
8 3 5 M M6 7 4 2 1 8 3 5 6 7 4 2 1 M
Chapter 4 – Molecular and Phylogenetic Analysis
91
The two gels in Figure 4.6 show the products from the restriction digest of different
isolates of pGEM-H1, using the restriction enzymes (a) ApaI and SacI, and (b) EcoRI.
All recombinant plasmids in lanes 1 to 6, when cut with ApaI and SacI (Figure 4.6a)
produced a large plasmid fragment (3000 bp) and a smaller fragment. The expected
fragment size, providing the insert did not contain the restriction sites for the two
enzymes, was approximately 900 bp when taking into account the location of the
restriction sites on the vector (Figure 4.5). Lanes 1, 2 and 6 showed fragments
approximately 700 bp in size, whilst lanes 3, 4 and 5 showed the expected fragment size
(900 bp). When EcoRI was used as the restriction enzyme, the expected fragment size
of 800 bp was seen in lanes 1, 2, 5 and 6 (Figure 4.6b). Although the correct insert
fragment size was seen in lane 1 and 2 when cut with EcoRI (Figure 4.6b), the previous
digest using ApaI and SacI resulted in a fragment size that did not correspond with the
insert (Figure 4.6a). Therefore, plasmids in lanes 1 and 2 were identified as not
containing the correct insert. The digests in lanes 3 and 4 showed one large fragment
(3000 bp), which corresponded to the vector DNA, and two smaller fragments at 500
and 350 bp. This demonstrated that the Ganoderma H1 insert had an EcoRI site, as
indicated by the digestion of the pure DNA in lane 7. One of the fragments in lane 3
looked slightly smaller than that in lane 4, which suggested that the inserts were in
opposite directions in the two recombinant plasmids. From the results obtained,
recombinant plasmid in lanes 3, 4 and 5 for Ganoderma H1 contained the desired insert
and were chosen for further analysis.
Figure 4.7. Restriction digests of a number of recombinant plasmid, pGEM-H2, using (a) ApaI and SacI, and (b) EcoRI. Lane A contains the 100 bp DNA marker, lanes 1 to 6 contain the purified recombinant plasmid, lane 7 has purified PCR DNA and lane 8 has the plasmid vector pGEM-T Easy.
a. b.
500 bp
800 bp
1500 bp
3000 bp
3 5 M M6 7 4 2 1
500 bp
800 bp
1500 bp
3000 bp
8 3 5 M6 7 4 2 1

Chapter 4 – Molecular and Phylogenetic Analysis
92
The restriction digests of the pGEM-H2 isolates using the enzymes ApaI and SacI
(Figure 4.7a) resulted in two fragments in all lanes. The first fragment at 3000 bp
corresponded to the vector DNA and the second fragment at approximately 900 bp
corresponded to the Ganoderma H2 PCR insert. This second fragment suggested that
all recombinant plasmids contained the insert. The correct insert in all recombinant
plasmids was confirmed by the digestion with EcoRI (Figure 4.7b). All digests (lanes 1
to 6) yielded a plasmid fragment at 3000 bp and two smaller fragments at approximately
500 bp and 350 bp, which indicated that the Ganoderma H2 insert also had an EcoRI
site, as indicated in lane 7. Ganoderma H2 recombinant plasmids in lanes 3, 4 and 5
were chosen for further analysis.
Figure 4.8. Restriction digestion of a number of recombinant plasmids, pGEM-H3, using (a) ApaI and SacI, and (b) EcoRI. Lane A contains the 100 bp DNA marker, lanes 1 to 9 contain the purified recombinant plasmid, lane 10 has purified PCR DNA and lane 11 has the plasmid vector pGEM-T Easy.
Restriction digestion of pGEM-H3 using the enzymes ApaI and SacI (Figure 4.8a)
resulted in an assortment of fragment sizes in lanes 1 to 9. All lanes contained the
vector fragment at 3000 bp. Lanes 3, 4, 5, 6 and 9 displayed an insert fragment of the
expected size at approximately 900 bp. Lanes 1, 2 and 8 showed a fragment slightly
larger than 900 bp, but it was thought to be too large to be the correct insert. The
recombinant plasmid in lane 7 did not contain the correct insert, as the fragment size of
800 bp was too small. An EcoRI digest of the pGEM-H3 recombinant plasmids (Figure
4.8b) confirmed the correct insert in lanes 3, 4, 5 and 9. Lane 10 shows the digestion of
the purified PCR product, which exhibits two fragments of the sizes 450 and 350 bp.
Restriction digestion of the pGEM-H3 plasmids in lanes 3, 4, 5 and 9 yielded two
a. b.
500 bp
800 bp
1500 bp
3000 bp
500 bp
800 bp
1500 bp
3000 bp
5 M9 M 6 7 4 2 10 11 8 3 1 5 M9 6 7 4 2 10 11 8 3 1

Chapter 4 – Molecular and Phylogenetic Analysis
93
fragments of 450 and 350 bp, indicating that they were all the correct insert (Figure
4.8b). All other recombinant plasmids were determined to not contain the correct
plasmid. Ganoderma H3 recombinant plasmids in lanes 3, 4 and 5 were chosen for
further analysis.
Overall, the restriction analysis showed that the insert for each Ganoderma isolate,
which encompassed the ITS I, ITS II and 5.8S regions, contained one restriction site for
EcoRI, but no restriction sites for either ApaI or SacI. The sizes of the resulting two
EcoRI fragments suggested that this restriction site was located in the 5.8S region. This
is in agreement with published data (Vilgalys et al., 1994).
4.3.2.5 Sequencing of the Recombinant Vectors
Since the insert DNA was derived by PCR, it is possible that in vitro mutations may be
present as a result of the error prone nature of Taq polymerase (Sambrook & Russell,
2001). Therefore, three isolates of each recombinant plasmid, pGEM-H1, pGEM-H2
and pGEM-H3, were characterised by double strand DNA (dsDNA) sequencing
(Section 3.22). A representative chromatogram showing the sequence output is shown
in Figure 4.9. The set of sequence data for each isolate was aligned, compared and
constructed into a consensus sequence using the program Sequencher version 3.0
(Genecodes, Ann Arbor, MI, U.S.A.). The consensus sequences obtained for
Ganoderma H1, Ganoderma H2 and Ganoderma H3 are displayed in Figures 4.10a,b,c,
respectively. The consensus sequences yielded the exact size of the combined ITS I to
ITS II region, which were determined to be 774 bp for Ganoderma H1, 770 bp for
Ganoderma H2 and 758 bp for Ganoderma H3.
Figure 4.9. Typical dsDNA sequence data obtained from sequence analysis of recombinant plasmid.

Chapter 4 – Molecular and Phylogenetic Analysis
94
a. TGTACACACCGCCCGTCGCTACTACCGATTGAATGGCTTAGTGAGGTCTTGGGATTGGCTTCGGGGAGCCGGCAACGGCACCCTGTCG CTGAGAACTTGATCAAACTTGGTCATTTAGAGGAAGTAAAAGTCGTAACAAGGTTTCCGTAGGTGAACCTGCGGAAGGATCATTATCG AGTTTTGACTGGGTTGTAGCTGGCCTTACGAGGCATTGTGCACGCCCTGCTCATCCACTCTACACCTGTGCACTTACTGTGGGTTACG GATCGTGGAGCGGGCTCTTCGCGGAGCTTGTGAAGCGCTTCTGTGCCTGCGTTTTACAACAAACACTTTAAAAGTATTAGAATGTGTA TTGCGATGTAACGCATCTATATACAACTTTCAGCAACGGATCTCTTGGCTCTCGCATCGATGAAGAACGCAGCGAAATGCGATAAGTA ATGTGAATTGCAGAATTCAGTGAATCATCGAATCTTTGAACGCACCTTGCGCTCCTTGGTATTCCGAGGAGCATGCCTGTTTGAGTGT CATGAAATCTTCAACCTACAAGCTTTTTAATGGGTTTGTAGGCTTGGACTTGGAGGCTTGTCGGTCTTGATTGGTCGGCTCCTCTCAA ATGCATTAGCTTGGTTCCTTGCGGATCGGCTTGTCGGTGTGATAATGTCTACGCCGCGACCGAGAAGCGTTTTTGGGCGAGCTTCTAG TCGTCTCTGTATAGAGACAATCTTATGACCTCTGACCTCAAATCAGGTAGGACTACCCGCTGAACTTAAGCA
b. TGTACACACCGCCCGTCGCTACTACCGATTGAATGGCTTAGTGAGGTCTTGGGATTGGCTTCGGGGAGCCGGCAACGGCACCCTGTCG CTGAGAACTTGATCAAACTTGGTCATTTAGAGGAAGTAAAAGTCGTAACAAGGTTTCCGTAGGTGAACCTGCGGAAGGATCATTATCG AGTTTTGACTGGGTTGTAGCTGGCCTTCCGAGGCATGTGCACGCCCTGCTCATCCACTCTACACCTGTGCACTTACTGTGGGTTTCAA ACGTCGTAAAGCGGGTCTCTTCACCGAGCTTGTAGAGCGGCGTCTGTGCCTGCGTTTATCACAAACTCTATAAAGTATCAGAATGTGT ATTGCGATGTAACGCATCTATATACAACTTTCAGCAACGGATCTCTTGGCTCTCGCATCGATGAAGAACGCAGCGAAATGCGATAAGT AATGTGAATTGCAGAATTCAGTGAATCATCGAATCTTTGAACGCACCTTGCGCTCCTTGGTATTCCGAGGAGCATGCCTGTTTGAGTG TCATGAAATCTTCAACTTACAGACCTTTGCGGGTTTTGTAGGCTTGGACTTGGAGGCTTGTCGGCCGTGTTTCGGTCGGCTCCTCTTA AATGCATTAGCTTGATTCCTTGCGGATCGGCTCTCGGTGTGATAATGTCTACGCCGCGACCGTGAAGCGTTTTGGCGAGCTTCTAACC GTCCTTGTTTGGACAAATTTATGACCTCTGACCTCAAATCAGGTAGGACTACCCGCTGAACTTAAGCA
c. TGTACACACCGCCCGTCGCTACTACCGATTGAATGGCTTAGTGAGGTCTTGGGATTGGCTTCGGGGAGCCGGCAACGGCACCCTGTCG CTGAGAACTTGATCAAACTTGGTCATTTAGAGGAAGTAAAAGTCGTAACAAGGTTTCCGTAGGTGAACCTGCGGAAGGATCATTATCG AGTTTTGACTGGGTTGTAGCTGGCCTTCCGAGGCATCGTGCACGCCCTGCTCATCCACTCTACACCTGTGCACTTACTGTGGGTTATG GATTGCGTGTAAAAGCGCGTCCGTGCCTGCGTCTTACCACAAACACTATAAAAGTATCAGAATGTGTATTGCGATGTAACGCATCTAT ATACAACTTTCAGCAACGGATCTCTTGGCTCTCGCATCGATGAAGAACGCAGCGAAATGCGATAAGTAATGTGAATTGCAGAATTCAG TGAATCATCGAATCTTTGAACGCACCTTGCGCTCCTTGGTATTCCGAGGAGCATGCCTGTTTGAGTGTCATGAAATCTTCAACCTACA AGCTTTTGAAATAATGGCTTGTTAGGCTTGGACTTGGAGGCTTGTCGGCCTTTATCGGTCGGCTCCTCTCAAACGCATTAGCTTGGTT CCTTTGCGGATCGGCTTGTCGGTGTGATAATGTCTACGCCGCGACCGTGACGCGTTTGGCGAGCTTCTAATCGTCTCCGCTTTTGGGA CAACTTTTATGACCTCTGACCTCAAATCAGGTAGGACTACCCGCTGAACTTAAGCA
Figure 4.10. The consensus sequence for: (a) Ganoderma H1 (774 bp), (b) Ganoderma H2 (770 bp) and, (c) Ganoderma H3 (758 bp). Each consensus sequence starts at the ITS I region and finishes at the end of the ITS II region and are written in the 5’ to 3’ direction. Highlighted sections indicate sequences complementary to universal primers in fungal analysis in red (BMB-CR) and blue (LRO).
Chapter 4 – Molecular and Phylogenetic Analysis
95
The amplification of the ITS I and ITS II regions has been performed separately using
the primer pairs BMB-CR/5.8S and 5.8SR/LRO (Gottlieb et al., 2000). In this
investigation, the primers BMB-CR/LRO were used to amplify the entire ITS I to ITS II
region. Therefore, sequence data included the ITS I, ITS II and 5.8S region.
Organisation of the sequence data into separate regions was performed manually by
aligning against already published sequences and removing the non aligned regions.
Nucleotide sequences were deposited into GenBank and given accession numbers,
which are listed in Table 3.10 in Materials and Methods, Chapter 3.
4.3.3 Phylogenetic Analysis To determine the evolutionary relationships of the three Australian Ganoderma isolates
with each other and other Ganoderma species at the molecular level, and in turn identify
the species, a phylogenetic study was performed. Sequence data from the ITS I, ITS II
and combined ITS I + ITS II regions of the three Australian isolates (Section 4.3.2.5)
was aligned against published sequence data using the data analysis programs available
from Biology Workbench version 3.2 (Subramaniam, 1999). The aligned sequences
were then analysed for evolutionary relationships using MEGA version 2.1 (Kumar et
al., 2001). They were also subjected to pairwise distance analysis in MEGA.
As the outcome of an evolutionary study can vary depending on the input data
(Brinkman & Leipe, 2001; Nei, 1996), careful consideration was taken in choosing
appropriate taxa to include in the study. Initial analyses were performed on a large
number of closely related taxa (> 45) (results not shown). This gave an estimate of the
evolutionary relationships between Ganoderma H1, Ganoderma H2 and Ganoderma
H3 and a wide range of Ganoderma species. From these evolutionary relationships a
smaller number of taxa were selected to be included in the final analyses. It has been
shown that for highly variable regions such as the ITS I and ITS II region, the more
distant the species, the poorer the statistical support will be (Moncalvo et al., 2000).
Hence, it was important to select different species that were closely related so
conclusions would be reliable and statistically robust.
Chapter 4 – Molecular and Phylogenetic Analysis
96
A selection of Australian and Asian Ganoderma isolates that had been previously
analysed in a larger study by Smith & Sivasithamparam (2000a) and grouped according
to Moncalvo et al. (1995b) were included in the phylogenetic analysis. The groups and
subgroups previously assigned (Moncalvo et al., 1995b; Smith & Sivasithamparam,
2000a), as well as an additional group 12, have also been used in this investigation to
aid in discussion. Since the primary aim of this investigation was to identify the three
Australian Ganoderma isolates, the relationship between many of the species was not of
interest and therefore has not been discussed in depth. Overall, thirty three taxa were
included in the phylogenetic analysis. They have been listed in Table 3.10 in Materials
and Methods, Chapter 3.
4.3.3.1 Sequence Alignment
Sequence alignment of the thirty three taxa was carried out as described in Section 3.23.
The sequence alignment included the out group, Fomitopsis rosea JMM T92-10, which
was used to root the tree in the phylogenetic study (Section 4.3.3.2). Gaps were also
introduced into the sequences to increase their alignment similarity. Alignments of the
ITS I region and ITS II region have been included in Appendix 1 (1A and 1B).
Nucleotide sequences in the ITS I region aligned in 222 sites, with 85 (38.3%) variable
sites and 53 (23.9%) parsimony informative sites. The ITS II region aligned in 224
sites, with 98 (44.1%) variable sites and 70 (31.3%) parsimony informative sites. The
frequency of variable sites was similar in the two ITS regions, but variations were
mostly located in the central region of the ITS I alignment and the termini of the ITS II
alignment. This was also noted by Moncalvo et al. (1995c).
4.3.3.2 Evolutionary Trees
The data was analysed using maximum parsimony as described in Section 3.23.
Maximum parsimony only considers cladistically informative characters, which are sites
in the alignment with at least two different kinds of nucleotides each represented twice
(Kumar et al., 2001). Therefore, 23.9% of the ITS I region and 31.3% of the ITS II
region were used in the analysis.
Chapter 4 – Molecular and Phylogenetic Analysis
97
Maximum parsimony using both complete deletion and pairwise deletion was
investigated, as insertions and deletions can sometimes give important information
about the data set (Nei, 1996). The consensus trees produced by both models had the
same topology and only differed in the statistical support of internal branches (results
not shown). The strict consensus trees derived using pairwise deletion gave better
statistical support than complete deletion. Therefore, pairwise deletion phylogenies are
presented in this investigation. The evolutionary trees produced from the separate
datasets, ITS I and ITS II, and the combined dataset ITS I + ITS II, are shown in Figure
4.11, Figure 4.12 and Figure 4.13, respectively.
A number of analyses using different tree making and distance models were also
considered. These models included distance methods such as UPMGA, and NJ
methods and the tree building method maximum likelihood. Preliminary analyses using
these models produced topologically similar trees that varied slightly in statistical
support (data not shown). This indicated that the topology of the tree was close to the
true evolutionary tree (Brinkman & Leipe, 2001).
For the ITS I dataset, an heuristic search based on close neighbourhood interchange
(CNI) branch swapping starting with 20 random addition sequences produced 446
equally parsimonious trees, of 146 steps, with a consistency index of 0.7534 and a
retention index of 0.9043. The strict consensus tree for the ITS I dataset is shown in
Figure 4.11. Ganoderma H1 formed a statistically well supported clade (96% bootstrap
value) with G. cupreum (group 8.2). Ganoderma H2 clustered with the Australian G.
weberianum (subgroup 5.2), but the statistical support was poor (56% bootstrap value).
When the clade incorporated both the Australian and Asian G. weberianum isolates
(group 5) the statistical support of the clade was robust (98% bootstrap value).
Ganoderma H3 did not form a clade with any of the other isolates, although it was
grouped with the next closest isolate Ganoderma sp. SE 1. This other isolate
(Ganoderma sp. SE 1) had not yet been taxonomically identified but was thought to be
G. boninense (personal communication, Dr. Brendan J. Smith, CSIRO, Canberra, ACT,
Australia).

Chapter 4 – Molecular and Phylogenetic Analysis
98
Figure 4.11. Phylogenetic relationship of Ganoderma species inferred from nucleotide sequences of the internal transcribed spacer region, ITS I. The tree depicted is a strict consensus tree of 446 equally parsimonious trees obtained by an heuristic search in MEGA using CNI branch swapping and 20 random addition sequences (Kumar et al., 2001). Out group for the analysis was Fomitopsis cf. rosea JMM T92.10. Groups and subgroups are according to Smith & Sivasithamparam (2000a). Values displayed below branches are confidence levels after 100 bootstrap replications. Consistency Index = 0.75342; retention index = 0.904255; tree length = 146.
8.2 cupre 4336
G.spH1 ITS1
8.2 cupre 3896
8.2 cupre 8678.
8.1 sine 1734
8.1 sine 0109
G.spH3 ITS1
BS SE1
10 incras 3
10 incras 73783
11.2 adsper 351
11.2 adsper 157
11.3 austr 7378
11.3 austr 92
11.3 austr 108
11.3 austr 3386
5.1 weber 219.3
5.1 weber 37081
5.1 weber 0821
5.2 weber 8401
5.2 weber 4483
G.spH2 ITS1
5.2 weber 8405
6.3Gsp 73779
6.3 Gsp 8147.1
6.3 Gsp 8647.1
6.3 Gsp 8
7 tsuga J2
7 tsuga 1109
7 tsuga BLC
7 Gsp 60537
Frosea T92.10
99
99
99
79
77
67
56
98
68
92
91
71
96
96
72
93
90
67
65
F. rosea JMT92.1
G. sp. RSH 1109 G. sp. RSH BLC
G. sp. UWA 8
G. sp. QFRI 8647.1
G. sp. RSH J2
G. sp. HMAS 60537
G. sp. QFRI 8147.1
G. weberianum DFP 8405 G. sp. DAR 73779
G. weberianum DFP 8401
G. weberianum RSH 0821
G. weberianum DFP 4483 G. sp. SUT H2
G. weberianum CCRC 37081
G. australe DFP 3386 G. weberianum CBS 219.3
G. australe DAR 73781
G. adspersum IMI 157816
G. australe UWA 92 G. australe UWA 108
G. adspersum CBS 351.74
G. incrassatum SE 3 G. incrassatum DAR 73783
G. sinense RSH 0109
G. sinense ZHANG 1734
G. sp. SUT H3 G. sp. SE1 BS
G. cupreum QFRI 8678.1
G. cupreum DFP 3896 G. sp. SUT H1
G. cupreum DFP 4336
Grp 5.2
Grp 11.3
Grp 5.1
Grp 7
Grp 6.3
Grp 12
Grp 10
Grp 11.2
Grp 8.2
Grp 8.1

Chapter 4 – Molecular and Phylogenetic Analysis
99
Figure 4.12. Phylogenetic relationship of Ganoderma species inferred from nucleotide sequences of the internal transcribed spacer region, ITS II. The tree depicted is a strict consensus tree of 71 equally parsimonious trees obtained by an heuristic search in MEGA using CNI branch swapping and 20 random addition sequences (Kumar et al., 2001); Out group for the analysis was Fomitopsis cf. rosea JMM T92.10. Groups and subgroups are according to Smith & Sivasithamparam (2000a); Values displayed below branches are confidence levels after 100 bootstrap replications; Consistency index = 0.668394; Retention index = 0.849765; tree length = 193.
8.2cupre 4336
8.2 cupre 8678.
8.2 cupre 3896
G.sp H1 ITS2
G.sp H3 ITS2
BS SE1
8.1 sinen 1734
8.1 sinen 0109
11.2 adspers 35
11.2 adsper 157
10 incras 3
10 incras 73783
11.3 austr 7378
11.3 austr 92
11.3 austr 3386
11.3 austr 108
6.3 Gsp 8147.1
6.3 Gsp 8
6.3 Gsp 73779
6.3 Gsp 8647.1
5.1 weber 37081
5.1 weber 219.3
5.1 weber 0821
G.sp H2 ITS2
5.2weber 8401
5.2 weber 4483
5.2 weber 8405
7 tsuga J2
7 tsuga BLC
7 G.sp 60537
7 tsuga 1109
Frosea T92.10
99
99
99
99
72
99
54
98
56
98
73
82
79
87
66
86
76
51
50
F. rosea JMT92.1
G. sp. RSH 1109
G. sp. RSH BLC G. sp. RSH J2
G. sp. HMAS 60537
G. sp. UWA 8
G. sp. QFRI 8647.1
G. sp. QFRI 8147.1
G. sp. DAR 73779
G. weberianum DFP 8405
G. weberianum DFP 8401 G. weberianum DFP 4483
G. sp. SUT H2
G. weberianum RSH 0821
G. weberianum CCRC 37081 G. weberianum CBS 219.3
G. australe DFP 3386
G. australe DAR 73781
G. australe UWA 92
G. australe UWA 108
G. adspersum IMI 157816 G. adspersum CBS 351.74
G. incrassatum SE 3 G. incrassatum DAR 73783
G. sinense RSH 0109 G. sinense ZHANG 1734
G. cupreum DFP 3896
G. sp. SUT H3 G. sp. SE1 BS
G. sp. SUT H1
G. cupreum DFP 4336 G. cupreum QFRI 8678.1
Grp 6.3
Grp 11.3
Grp 5.1
Grp 7
Grp 5.2
Grp 8.1
Grp 11.2
Grp 10
Grp 8.2
Grp 12

Chapter 4 – Molecular and Phylogenetic Analysis
100
Figure 4.13. Phylogenetic relationship of Ganoderma species inferred from nucleotide sequences of the internal transcribed spacer regions, ITS I and ITS II regions combined. The tree depicted is a strict consensus tree of 293 equally parsimonious trees obtained by an heuristic search in MEGA using CNI branch swapping and 20 random addition sequences (Kumar et al., 2001); Out group for the analysis was Fomitopsis cf. rosea JMM T92.10. Groups and subgroups are according to Smith & Sivasithamparam (2000a); Values displayed at divergent branches are confidence levels after 100 bootstrap replications; Consistency index = 0.690751; retention index = 0.866584; tree length = 346.
8.2 cupre 4336
8.2 cupre 8678.
8.2 cupre 3896
G.spH1 ITS1
8.1 sine 1734
8.1 sine 0109
G.spH3 ITS1
SE BS
10 incras 3
10 incras 73783
11.2 adsper 351
11.2 adsper 157
11.3 austr 7378
11.3 austr 92
11.3 austr 108
11.3 austr 3386
7 tsuga J2
7 tsuga BLC
7 Gsp 60537
7 tsuga 1109
6.3 Gsp 73779
6.3 Gsp 8147.1
6.3 Gsp 8
6.3 Gsp 8647.1
5.1 weber 219.3
5.1 weber 37081
5.1 weber 0821
G.spH2 ITS1
5.2 weber 8401
5.2 weber 4483
5.2 weber 8405
Frosea T92.10
66
100
100
56
100
100
83
100
100
100
100
96
8372
58
99
64
92
80
68
86
F. rosea JMT92.1
G. sp. RSH 1109
G. sp. RSH BLC G. sp. RSH J2
G. sp. HMAS 60537
G. sp. UWA 8 G. sp. QFRI 8647.1
G. sp. QFRI 8147.1 G. sp. DAR 73779
G. weberianum DFP 8405
G. weberianum DFP 8401 G. weberianum DFP 4483
G. weberianum RSH 0821 G. sp. SUT H2
G. weberianum CCRC 37081 G. weberianum CBS 219.3
G. australe DFP 3386
G. australe DAR 73781
G. australe UWA 92 G. australe UWA 108
G. adspersum IMI 157816 G. adspersum CBS 351.74
G. incrassatum SE 3 G. incrassatum DAR 73783
G. sinense RSH 0109 G. sinense ZHANG 1734
G. sp. SUT H3 G. sp. SE1 BS
G. cupreum QFRI 8678.1 G. cupreum DFP 3896 G. sp. SUT H1
G. cupreum DFP 4336
Grp 6.3
Grp 11.3
Grp 5.2
Grp 7
Grp 12
Grp 10
Grp 11.2
Grp 8.2
Grp 8.1
Grp 5.1

Chapter 4 – Molecular and Phylogenetic Analysis
101
For the ITS II dataset, an heuristic search based on CNI branch swapping starting with
20 random addition sequences produced 71 equally parsimonious trees, of 193 steps,
with a consistency index of 0.6684 and a retention index of 0.8498. The strict
consensus tree for the ITS II dataset is shown in Figure 4.12. The phylogram for the
ITS II dataset (Figure 4.12) was of similar topology to the ITS I data set (Figure 4.11),
with a few minor differences. Ganoderma H2 clustered with the Asian G. weberianum
isolates (subgroup 5.1) with statistical support of 82%, as opposed to the ITS I clade
with the Australian isolates (subgroup 5.2) which had lower statistical support (56%)
(Figure 4.11). Statistical support for the larger clade that incorporated both Asian and
Australian G. weberianum isolates was slightly better (87%) than the subgroup 5.1
(82%) (Figure 4.12), indicating that ITS II phylogeny supported only one species of G.
weberianum. Ganoderma H3 formed a clade with Ganoderma sp. SE 1, although
statistical support of that branch was moderate (76%).
Maximum parsimony analysis of the combined data sets (ITS I + ITS II) is depicted in
Figure 4.13. An heuristic search based on CNI branch swapping starting with 20
random addition sequences produced 293 equally parsimonious trees, of 346 steps, with
a consistency index of 0.6908 and a retention index of 0.8666. The internal branches of
the combined datasets had greater statistical bootstrap support (Figure 4.13) than the
single data sets (Figure 4.11 and Figure 4.12). Like the ITS II phylogeny, Ganoderma
H2 clustered with group 5.1 (Asian G. weberianum isolates). However, the statistical
support of this branch was lower in the combined dataset (58%) than in the ITS II
phylogeny (82%). Overall, the larger clade (group 5), which included the two subsets
(5.1 and 5.2), had strong statistical support (99%), again supporting this clade as the one
species, and not separate species of G. weberianum. Ganoderma H3 formed a clade
with Ganoderma sp. SE 1, but again, statistical support was only moderate (80%).
Bootstrap analysis of the different phylogenies (ITS I, ITS II and ITS I + ITS II
datasets) gave a pattern of strong statistical support for: 1) Ganoderma H1 clustering
with G. cupreum (group 8.2) with 96%, 98% and 100% bootstrap values in the ITS I,
ITS II and ITS I + ITS II phylograms, respectively; and 2) Ganoderma H2 clustering
with G. weberianum (group 5) with 98%, 87% and 99% bootstrap values in the ITS I,
ITS II and ITS I + ITS II phylograms, respectively. Although Ganoderma H2 had the

Chapter 4 – Molecular and Phylogenetic Analysis
102
strongest statistical support with group 5 (that incorporated both Asian and Australian
subgroups), in this report it was grouped within subgroup 5.2 (Australian G.
weberianum isolates), as it was also an Australia isolate.
An important observation was the low statistical support of branches in this analysis
between the less closely related species. Terminal taxa resolved by Smith &
Sivasithamparam (2000a) was similar in our analysis, but they did not perform
bootstrap analysis so no comparisons could be made. Moncalvo et al. (1995c) also
observed low statistical support for the less closely related species and suggested that
the ITS I region is rapidly evolving. Therefore, to overcome low statistics in
evolutionary models one would need to use a number of closely related species. This
was a problem in the analysis of the Australian species, as there is only limited sequence
data available. Hence, this highlights the requirement for a larger number of Australian
and Asian Ganoderma sequences so that reliable evolutionary trees can be determined
4.3.3.3 Intraspecies Sequence Divergence
The percentage nucleotide divergence between taxa was calculated from the pairwise
distance data computed in MEGA (Kumar et al., 2001). Table 4.2 shows the nucleotide
divergence in the ITS I region (lower triangle) and the ITS II region (upper triangle). A
1% nucleotide divergence corresponds to two nucleotide substitutions between two
taxa, and the boxes indicate a group or clade as determined in the phylogenetic analysis
(Section 4.3.3.2). Only taxa or groups closely related to the three Australian
Ganoderma isolates are included in Table 4.2.
As determined in the phylogenetic analysis, Ganoderma H1 clustered with group 8.2, G.
cupreum (Section 4.3.3.2). The average nucleotide divergence of Ganoderma sp. H1
with the isolates within this group was 0.5% nucleotide divergence in the ITS I region
and 1.0% in the ITS II region. The average nucleotide variation (0.75% for combined
ITS regions) was within the less than the 2% intraspecific ITS variation allowed for
Ganoderma species (Moncalvo et al., 1995b, 1995c). This, combined with the strong
statistical support (> 95% bootstrap values) in the ITS I phylogram (Figure 4.11), ITS II
phylogram (Figure 4.12) and combined dataset phylogram (Figure 4.13) supported the
classification of Ganoderma H1 as a G. cupreum isolate.

Table 4.2
Percentage of nucleotide difference between different Ganoderma isolates
Percentage of Nucleotide Substitution Between Taxaa Grp 5.1 Group 5.2 Group 6.3 Group 8.1 Group 8.2 Group 10 Group 12 1 2 3 4 5 6 7 8 9 10 11 12 13 14 15 16 17 18 19 20 21
1 G. weberianum CBS 219.3 1.6 0.0 3.2 3.2 3.2 1.1 12.0 10.9 11.5 12.6 15.1 16.1 16.1 16.1 16.7 16.1 16.0 16.0 15.6 16.92 G. weberianum RSH 0821 0.0 1.6 4.3 4.3 4.3 2.1 11.5 10.4 11.0 12.1 16.2 17.3 16.8 16.8 17.3 16.8 16.1 16.1 15.6 17.03 G. weberianum CCRC 37081 0.0 0.0 3.7 3.8 3.7 1.6 12.5 11.4 12.0 13.0 15.0 16.0 16.0 16.0 16.7 16.0 16.0 16.0 15.5 17.44 G. weberianum DFP 8401 2.0 2.0 2.0 0.0 0.0 2.1 9.8 8.7 9.2 10.3 15.1 16.1 15.1 15.1 15.1 15.1 13.9 13.9 14.4 15.35 G. weberianum DFP 4483 2.0 2.0 2.0 1.0 0.0 2.2 9.9 8.8 9.3 10.4 15.2 16.3 14.6 14.6 14.7 14.6 14.0 14.0 14.5 15.46 G. weberianum DFP 8405 1.5 1.5 1.5 1.5 1.5 2.1 9.8 8.7 9.3 10.4 15.1 16.1 15.1 15.1 15.1 15.1 13.9 13.9 14.4 15.37 Ganoderma sp. SUT H2 1.5 1.5 1.5 1.5 1.5 0.0 10.9 9.8 10.3 11.4 14.9 16.0 14.9 14.9 15.0 14.9 15.3 15.3 14.8 15.78 Ganoderma sp. QFRI 8147.1 8.0 8.0 8.0 9.0 9.1 7.5 7.5 1.1 0.5 1.6 13.7 14.8 13.0 13.0 13.1 13.1 13.0 13.0 15.0 13.89 Ganoderma sp. QFRI 8647.1 8.0 8.0 8.0 9.0 9.1 7.5 7.5 0.0 0.5 1.6 13.7 14.8 13.0 13.0 13.1 13.1 13.0 13.0 13.9 12.710 Ganoderma sp. DAR 73779 7.5 7.5 7.5 8.5 8.6 7.0 7.0 0.5 0.5 1.1 13.1 14.2 12.5 12.5 12.6 12.6 12.4 12.4 14.4 13.311 Ganoderma sp. UWA 8 8.0 8.0 8.0 9.0 9.1 7.5 7.5 1.5 1.5 2.0 14.2 15.3 12.5 13.6 13.7 13.7 12.4 12.4 15.6 14.412 G. sinense ZHANG 1734 10.2 10.2 10.2 11.2 10.8 10.7 10.7 11.7 11.7 12.2 12.8 0.5 9.9 9.9 10.5 9.8 13.5 13.5 12.3 11.613 G. sinense RSH 0109 9.7 9.7 9.7 10.7 10.3 10.2 10.2 11.3 11.3 11.8 12.4 0.0 11.0 11.0 11.6 10.9 14.6 14.6 13.4 12.614 G. cupreum DFP 4336 11.1 11.1 11.1 11.1 10.7 10.6 10.6 12.1 12.1 11.6 13.7 5.1 5.1 1.0 1.6 1.6 10.4 10.4 11.3 11.215 G. cupreum QFRI 8678.1 11.1 11.1 11.1 11.1 10.7 10.6 10.6 12.1 12.1 11.6 13.7 5.1 5.1 0.0 0.5 0.5 10.4 10.4 11.3 10.616 G. cupreum DFP 3896 11.1 11.1 11.1 11.1 10.7 10.6 10.6 12.1 12.1 11.6 13.7 5.1 5.1 0.0 0.0 1.0 11.0 11.0 11.9 10.717 Ganoderma sp. SUT H1 11.6 11.6 11.6 11.6 11.2 11.1 11.1 12.6 12.6 12.1 14.2 5.6 5.6 0.5 0.5 0.5 10.9 10.9 11.2 10.518 G. incrassatum SE 3 12.5 12.5 12.5 13.0 13.1 11.5 11.5 11.0 11.0 10.5 12.6 10.7 10.3 9.5 9.5 9.5 10.1 0.0 12.2 14.119 G. incrassatum DAR 73783 12.0 12.0 12.0 12.5 12.6 11.0 11.0 10.5 10.5 10.0 12.1 10.2 9.7 9.5 9.5 9.5 10.1 1.5 12.2 14.120 Ganoderma sp. SE1 BS 11.4 11.4 11.4 13.4 13.5 12.9 12.9 12.0 12.0 11.5 13.6 8.5 8.6 8.0 8.0 8.0 8.5 11.9 11.4 9.821 Ganoderma sp. SUT H3 8.9 8.9 8.9 10.1 9.6 8.4 8.4 8.5 8.5 8.5 9.6 7.8 7.8 7.2 7.2 7.2 6.7 7.9 7.3 6.1
a Pairwise distance (MEGA) from the nucleotide sequences alignment between taxa, using pairwise deletion; 0.5 % of divergence between two taxa corresponds to approximately one nucleotide substitution; Lower and upper triangles correspond to the values obtained for the ITS 1 and ITS II regions, respectively.
Chapter 4 – Molecular and Phylogenetic Analysis
104
The next closest group to subgroup 8.2 (G. cupreum) was subgroup 8.1 (G. sinense),
which had a nucleotide divergence of 5.1% in the ITS I region and 10.1% in the ITS II
region (Table 4.2). These were clearly separate groups as the average nucleotide
difference (7.6% for the combined ITS regions) was greater than 6% allowed for
interspecific variation for Ganoderma species (Moncalvo et al., 1995c). In addition, the
ITS variation between Ganoderma H1 and subgroup 8.1 was 8.0% for the combined
ITS regions (Table 4.2), which confirmed that it was not an isolate of G. sinense.
Nucleotide variation between the Ganoderma H2 isolate and all other isolates in group
5 (G. weberianum) was observed to be 0 to 1.5% in the ITS I region and 1.1 to 2.1% in
the ITS II region (Table 4.2). The average nucleotide intraspecific variation between
Ganoderma H2 and the other isolates within group 5 (1.6% for the combined ITS
regions) was also within less than the allowable 2% intraspecific ITS variation in
Ganoderma species (Moncalvo et al., 1995b, 1995c). There were nucleotide
differences observed between Ganoderma H2 and the separate subgroups 5.1 and 5.2.
The average nucleotide variation in the ITS I region for subgroup 5.2 (1%) was less than
that for subgroup 5.1 (1.5%). Conversely, the average nucleotide variation in the ITS II
region for subgroup 5.2 (2.1%) was greater than that of subgroup 5.1 (1.6%). This was
reflected in the ITS I (Figure 4.11) and ITS II (Figure 4.12) phylogenies in that
Ganoderma sp. H2 clustered with the different subgroups in each phylogram. However,
bootstrap analysis of the phylograms (> 87%) supported a single species of G.
weberianum. This was in agreement with Smith & Sivasithamparam (2000a) who
analysed a larger number of Ganoderma species and suggested that the two clades
(subgroups 5.1 and 5.2) were allotropic forms of the single species G. weberianum.
The next closest group to G. weberianum (group 5) was group 6.3, which had been
designated Ganoderma sp. after being incorrectly identified as G. lucidum (Smith &
Sivasithamparam, 2000a). The sequence variation between group 6.3 and subgroup 5.1
(9.3% combined ITS regions) and subgroup 5.2 (8.6% combined ITS regions) (Table
4.3) was greater than the 6% level for interspecific variation of the ITS regions for
Ganoderma species (Moncalvo et al., 1995c).

Chapter 4 – Molecular and Phylogenetic Analysis
105
Ganoderma H3 and the unidentified Australian isolate, Ganoderma sp. SE 1, that was
thought to be the same species (group 12) had nucleotide variation of 6% and 9% in the
ITS I and ITS II regions, respectively (Table 4.2). The nucleotide difference between
these two isolates was strong evidence that they were separate species, as the combined
ITS regions (7.5%) was greater than the allowable 2% for intraspecific ITS variation in
Ganoderma species (Moncalvo et al., 1995c). In addition, the statistical support in the
phylogenies was not robust (< 80%) (Figures 4.11, 4.12 and 4.13). The next closest
groups to Ganoderma H3 were group 8.2, G. cupreum (8.9% nucleotide difference), and
group 10, G. incrassatum (10.9% ITS nucleotide difference). Both groups had an
interspecific ITS variation greater than 6% with Ganoderma H3, which demonstrated
that Ganoderma H3 was neither of these species. Since the classification of Ganoderma
H3 could not be certain, it has been designated Ganoderma sp. H3 until further
identification can be performed using a larger number of sequences.
Table 4.3 Nucleotide difference between groups of Ganoderma taxa
Percentage of nucleotide substitution between groupsa 1 2 3 4 5 6 7 8 9 10 1 Grp 5.1 3.00 10.75 9.25 14.83 15.29 15.00 13.00 13.13 14.83 2 Grp 5.2 1.75 9.00 7.25 14.50 13.88 13.38 13.50 10.75 13.63 3 Grp 6.3 7.88 8.13 7.22 13.00 11.94 11.75 11.50 10.38 12.75 4 Grp 7 10.13 10.88 8.25 12.31 10.50 9.38 10.44 7.88 11.06 5 Grp 8.1 9.75 10.38 11.63 14.88 10.13 13.50 11.00 11.38 11.75 6 Grp 8.2 11.13 10.75 12.38 14.25 5.13 10.25 9.75 11.88 10.38 7 Grp 10 12.25 12.00 11.00 13.38 10.00 9.63 10.00 9.38 12.50 8 Grp 11.2 13.00 13.25 12.25 13.63 11.25 10.63 5.50 7.88 12.75 9 Grp 11.3 12.63 12.38 12.13 13.50 8.88 9.75 3.88 4.38 14.38 10 Grp 12 9.75 10.69 10.00 11.88 7.75 7.25 9.25 11.13 9.88
a Values determined by Pairwise distance in MEGA from the nucleotide sequences alignment between taxa, using pairwise deletion; 0.5% of divergence between two taxa corresponds to approximately one nucleotide substitution; Lower triangle corresponds to values obtained for ITS I; Upper triangle corresponds to values obtained for ITS II.
4.3.3.4 Taxonomic Conclusion
Smith & Sivasithamparam (2000a) considered the phylogenetic classification inferred
from sequence data to be superior over the use of sequence variation statistics for
identifying taxa. In this study, both sequence variation statistics and phylogenies were

Chapter 4 – Molecular and Phylogenetic Analysis
106
in agreement on the classification of two of the unidentified Australian isolates,
Ganoderma H1 and Ganoderma H2. Phylogenetic analysis of the third isolate,
Ganoderma H3, grouped it with another Australian isolate (although bootstrap
confidence was moderate (76 to 80%)), but the results from the sequence variation
analysis conflicted with this grouping and indicated that they were distinctly different
species. It is likely that if there were a greater number of sequences available, then
results closer to the true tree and hence, true species, could have been achieved for this
particular taxon.
There was a higher nucleotide divergence observed in the ITS II region than in the ITS I
region (Table 4.2). This was also observed by Moncalvo et al. (1995a, 1995c) and
Gottlieb et al. (2000). In addition, a lower level of resolution of internal branches for
the ITS I phylogeny was seen by Gottlieb et al. (2000), as was the case in this
investigation.
Overall, the evolutionary trees and nucleotide sequence variation data supported the
molecular identification of Ganoderma H1 to be G. cupreum and Ganoderma H2 to be
G. weberianum. Ganoderma H3 was not identified to be an isolate of any defined
species used in the molecular identification and therefore was designated Ganoderma
sp. H3.
4.4 Summary In this Chapter, three new Ganoderma species were isolated from the Cairns state forest
and sent to Swinburne University of Technology to be analysed using modern molecular
techniques. They were tentatively named Ganoderma H1, Ganoderma H2 and
Ganoderma H3.
Ribosomal DNA was extracted from the fungal mycelium that had been grown in liquid
culture. The ITS I to ITS II region, was amplified using PCR and specific primers. The
PCR products were purified and estimated to be approximately 750 to 800 bp in size,
for all three isolates (Figure 4.2). The size of the entire ITS region was similar to that
reported by Moncalvo et al. (1995c).
Chapter 4 – Molecular and Phylogenetic Analysis
107
The purified product of the three isolates was analysed by RFLP-PAGE, using the
enzymes AluI, HindIII, HhaI (CfoI) and HaeIII (Section 4.3.2.2). Restriction patterns
were similar for some enzymes and Ganoderma isolates, but the overall restriction
pattern discriminated between the three different patterns (Table 4.1). This strongly
indicated that the three Australian isolates were in fact three different species. The
restriction patterns were also compared against those previously reported by Gottlieb et
al. (2000), of which none were similar.
Several attempts were made to directly sequence the purified PCR product of which
none were successful. The PCR product was then cloned into a vector to produce
recombinant DNA. The recombinant DNA was successfully sequenced and the
sequence data analysed to produce a consensus sequence for each Australian isolate.
The entire ITS I to ITS II region was determined to be 774, 770 and 758 bp for
Ganoderma H1, Ganoderma H2 and Ganoderma H3, respectively (Figure 4.10). The
actual size of the entire ITS region correlated well with the estimated size of the purified
PCR product.
To study the evolutionary relationship of the three Australian Ganoderma isolates, a
phylogenetic study was carried out using the molecular evolutionary program MEGA
(Kumar et al., 2001). Preliminary studies on a large number of taxa identified closely
related species in the geographic regions of Australia and Asia. A selection of the
closest related species and isolates were chosen for further analysis.
Maximum parsimony analysis was the model chosen to analyse the data as this has been
used frequently in the analysis of Ganoderma (Gottlieb et al., 2000; Smith &
Sivasithamparam, 2000a). An heuristic search using CNI branch swapping starting with
20 random addition trees was performed on the separate ITS I and ITS II region, as well
as the combined ITS I + ITS II region. The three phylograms produced from the
analysis had similar topology, which indicated good representation of the evolutionary
relationships (Figures 4.11, 4.12 and 4.13). Bootstrap analysis was also performed to
evaluate the robustness of the internal branches. Ganoderma H1 clustered with G.
cupreum in the three phylograms and had strong statistical support (> 95%).
Ganoderma H2 also had strong statistical support when it formed a clade with G.
Chapter 4 – Molecular and Phylogenetic Analysis
108
weberianum in the three phylograms (> 87%). Ganoderma H3 formed a clade with
another unknown Ganoderma sp. SE 1, thought to be G. boninense, in both the ITS II
and ITS I + ITS II phylograms, but the statistical support was only moderate (76 to
80%).
Nucleotide variation data was also resolved and used to support the results obtained
from the evolutionary trees. Moncalvo et al. (1995c) showed that intraspecific variation
in the combined ITS regions was < 2%, while interspecific variation was usually > 6%.
Less than 2% ITS variation was observed for Ganoderma H1 in the G. cupreum clade
(group 8.2) and Ganoderma H2 in the G. weberianum clade (group 5) (Table 4.2).
Ganoderma H3 and the unknown Ganoderma sp. SE 1, had nucleotide variation of
7.5% (Table 4.2). This, combined with the low statistical support of the clade in the
phylograms (Figure 4.11 and 4.12) suggested that it was not the same species as the
Ganoderma sp. SE 1.
In conclusion, Ganoderma H1 was identified as an isolate of G. cupreum and
Ganoderma H2 as an isolate of G. weberianum, while the species classification of
Ganoderma H3 was unable to be determined.

5 Chapter Five
PPrreesseerrvvaattiioonn aanndd MMyycceelliiaall GGrroowwtthh
OOppttiimmiissaattiioonn

Chapter 5 – Preservation and Mycelial Growth Optimisation
110
5.1 Introduction The type species, Ganoderma lucidum, has been the primary focus of investigation for
approximately the last twenty years and there has been relatively little attention paid to
the other species within this genus. This has led to large amounts of information being
produced on the growth, cultivation and medicinal effects of the type species, G.
lucidum. Due to this wealth of information, conditions employed for the growth and
preservation of G. lucidum have also been adopted for the growth of other species
within this genus. There is evidence, however, to suggest that closely related species
within the same genus might require different growth conditions and nutrient sources
(Mayzumi et al., 1997). Fungi isolated from various regions around the world may
adapt to different environmental factors and in turn require alternative growth
conditions (Bilay et al., 2000; Kim et al., 2002a). When investigating a new fungal
species or isolate, it is essential to understand the environment under which the fungus
can be stored, the environmental and nutritional factors necessary for development, and
factors that may affect the growth rate of the fungus. This Chapter reports the storage
and growth requirements of the three Australian Ganoderma isolates, G. cupreum (H1),
G. weberianum (H2) and Ganoderma sp. (H3), used in this study.
5.2 Overview The three Australian Ganoderma isolates, H1 (G. cupreum), H2 (G. weberianum) and
H3 (G. species), were investigated for their ability to survive in storage using a variety
of preservation techniques. These included slant and plate storage, mineral oil storage
and storage at –80ºC. This viability investigation was performed to establish the
appropriate long term preservation required to maintain a stable starter culture and short
term preservation for a stable working culture. The environmental factors, temperature
and pH, were also investigated to determine optimal working conditions for growth of
the mycelium. The three isolates were then cultivated in shaker flask cultures. A
variety of growth media was subsequently investigated for the production of mycelial
biomass and in turn, various carbohydrate sources were examined to observe which
source promoted the maximum production of mycelial biomass.

Chapter 5 – Preservation and Mycelial Growth Optimisation
111
5.3 Results and Discussion 5.3.1 Preservation and Viability of Ganoderma H1, H2 and H3 The three Ganoderma isolates, H1, H2 and H3, which had been identified as three
different species (Chapter 4), were investigated for their ability to be stored on agar
slants under mineral oil and at –80ºC, for long term preservation. The three isolates
were also examined for short term preservation on agar slants and plates and on agar
slants under mineral oil. In addition a study was performed to assess the effect that light
had on the storage of the fungi. The ability of the fungi to produce rapid subcultures
after storage in these conditions was investigated, since this has a major impact on the
time required for this study to take place.
5.3.1.1 Long Term Preservation
The isolates were examined for their ability to be preserved on agar slants under mineral
oil stored at both 4ºC and room temperature (Section 3.7.2), and on balsa wood at –80ºC
(Section 3.7.4). These two methods were chosen for long term preservation of the
fungal cultures because they were inexpensive and readily accessible at Swinburne
University of Technology.
Mineral oil storage of the isolates was performed as described in Section 3.7.2. PDA
and MEA slants were inoculated and incubated until there was confluent fungal growth
on the slant. The slant was then covered with mineral oil, to a depth of 1 cm from the
top of the slant. The slants were stored at room temperature and in the refrigerator at
4ºC. After repeated attempts with different samples, Ganoderma H1 and H3 could not
be recovered after being stored under mineral oil, both at room temperature and at 4ºC
(results not shown). However, the mycelium of Ganoderma H2 could be successively
recovered at monthly intervals for up to 1 year when stored in the same way (results not
shown). Ganoderma H1 and H3 exhibited either poor growth or did not survive when
stored in water at room temperature, 4ºC and –80ºC, and on balsa chips at 4ºC (results
not shown). Due to the non recovery of Ganoderma H1 and H3, the above methods of
storage were not used and the option of long term storage on balsa wood at –80ºC was
investigated.

Chapter 5 – Preservation and Mycelial Growth Optimisation
112
Storage on balsa wood at –80ºC was performed as described in Section 3.7.4.
Mycelium was grown on balsa wood and then frozen at –80ºC. When preserving fungal
cultures at –80ºC in vials, it is convenient in terms of space to store many balsa wood
chips in a few vials, rather than having one balsa chip per vial. When the mycelium was
required to be subcultured, a process of thawing the stored vial and then refreezing the
unused balsa chips was performed. The thawing and refreezing of mycelium in this
way has been known to create problems in the viability of fungi (Ando, 1997).
Therefore, this investigation studied the survival rate of the three Ganoderma isolates
after repeated thawing and refreezing at –80ºC. Three tubes of fifty balsa chips were
prepared. After the tubes were stored at –80ºC, five chips from each tube were removed
and placed on fresh agar and incubated at 30ºC. The remaining chips in the tubes were
replaced, to be stored again at –80ºC. This process was repeated at monthly intervals
(starting at day zero) up until the sixth month, and then every 6 months for up to 2
years.
Table 5.1 The effect of thawing and refreezing at –80ºC on the viability of Australian Ganoderma isolates
Preservation Period (months)a Fungi 0 1 2 3 4 5 6 12 12b 18 24 24b Ganoderma H1 5/5c 5/5 4/5 4/5 3/5 1/5 0/5 0/5 5/5 0/5 0/5 5/5 Ganoderma H2 5/5 5/5 5/5 5/5 5/5 5/5 5/5 5/5 5/5 5/5 5/5 5/5 Ganoderma H3 5/5 5/5 5/5 2/5 0/5 0/5 0/5 0/5 4/5 0/5 0/5 4/5
The fungi were stored on balsa wood chips (50 per vial) at –80ºC and checked for viability at monthly intervals for up to two years; a The number of thawing and refreezing cycles. Up to 6 months, 1 month equals one thawing/freezing cycle, after this, 6 months equals one thawing/freezing cycle; b Control maintained at –80ºC without thawing; c The numerator shows the number of chips from which viable fungi were recovered (the growth was checked on the tenth day) and the denominator shows the number of balsa chips tested.
Table 5.1 shows the survival rates of Ganoderma H1, H2 and H3, after repeated
thawing and refreezing. The isolate, Ganoderma H2, showed the greatest viability with
repeated thawing and refreezing in that it had a 100% survival rate (5/5) after 24
months. Ando (1997), who tested the viability of nine strains from two Ganoderma
species (species were not noted), that were stored at –80ºC for 1 year, found similar
results in that all nine strains had a 100% survival rate. In contrast, there was no
viability of Ganoderma H1 observed after month 6 and no viability of Ganoderma H3

Chapter 5 – Preservation and Mycelial Growth Optimisation
113
observed after month 4 (Table 5.1). These two isolates showed a similar viability
pattern in that the viability decreased with repeated thawing and refreezing. Ando
(1997) also found that the survival rates of repeated thawing and refreezing could
decrease the viability of some fungal cultures, although this was not observed of
Ganoderma species. Even though the Ganoderma isolates H1 and H3 could not
withstand continued thawing and refreezing, the results showed that they were still
viable after long periods of time when they were not subjected to thawing (Table 5.1).
The viability of the chips from the tubes that were opened after 1 and 2 years (with no
thawing and refreezing) was good, yielding a 100% (5/5) and 80% (4/5) viable chips for
Ganoderma H1 and H3, respectively.
Overall, the thawing and freezing of the cultures had a negative effect on the viability of
Ganoderma H1 and H3, and no effect on the viability of Ganoderma H2. Furthermore,
the storage of all three isolates, when no thawing and refreezing occurred, was good.
Based on these results, the long term preservation of the three Australian Ganoderma
isolates was achieved by preparing a minimum of 6 vials, each with 10 balsa chips, to
avoid the reduction of viability after repeated thawing and refreezing.
The growth of the mycelium after storage on the balsa chips at –80ºC was also
investigated. Samples were taken from fresh separate vials (which had not been thawed
and refrozen) so that the effect that the low temperature had on the mycelial growth
could be observed. The radial diameter of the mycelium was measured after thawing
and subculturing onto fresh agar plates, at 6 month intervals for up to 2 years.
Table 5.2 shows the mycelial radial diameter of the Ganoderma isolates after storage on
balsa chips after 6, 12, 18 and 24 months. It can be seen that on regrowth of the isolates
H1 and H3, the radial growth became slower after longer periods of storage (from an
initial radial diameter of 30 mm to 7 mm after 24 months for Ganoderma H1 and from
an initial radial diameter of 38 mm to 14 mm after 24 months for Ganoderma H3). The
storage at –80ºC appeared to have no effect on the mycelial growth of isolate H2, as the
initial radial diameter of 36 mm was comparable to that obtained after 24 months, 35
mm. There is no literature available that shows the radial growth of Ganoderma after
long periods of storage, so comparisons cannot be made and therefore, this method was

Chapter 5 – Preservation and Mycelial Growth Optimisation
114
adopted for the storage of the three Ganoderma isolates for up to 2 years. After this
time, transfer of the cultures to a fresh medium would need to be carried out. Due to
slower growth of Ganoderma H1 and H3 after longer terms of storage, further
investigations for short term storage were performed so that rapid growing working
cultures could be produced at short notice.
Table 5.2 The effect of long term preservation at –80ºC on the mycelial growth of Australian Ganoderma isolates
Preservation Period (months)a Fungal Organism 0 6 12 18 24 Ganoderma H1 38 ± 1 21 ± 1 9 ± 2 9 ± 1 7 ± 0 Ganoderma H2 36 ± 1 36 ± 1 35 ± 3 35 ± 2 35 ± 2 Ganoderma H3 38 ± 0 29 ± 1 18 ± 1 15 ± 1 14 ± 2
The fungi were grown on sterile moist balsa wood for 6 days and then stored in a deep freezer at –80ºC for up to two years. The mycelial diameter was calculated on the fifth day of growth; a The number of months the culture was stored at –80ºC; Growth of subcultures was performed in triplicate.
5.3.1.2 Short Term Preservation
The three Australian Ganoderma isolates were investigated for their ability to survive in
storage at 4ºC, both on slant and plate cultures, which were sealed to prevent drying.
The effect of light on the storage cultures was also examined. The growth media, MEA
and PDA, were chosen for investigation because they are commonly used for the growth
and storage of fungal species (Chen, 1999; Stamets, 1993). The viability was
determined by subculture of the stored fungi, at weekly intervals, onto fresh media and
measuring the radial growth on the fifth day. The storage viability at 4ºC was evaluated
for up to 12 weeks and the maximum radial growth was taken to be 40 mm.
The results of the storage viability for the Ganoderma isolates when stored on different
media at 4ºC are presented in Figure 5.1. They give a representation of the ability of the
fungi to be able to withstand low temperature, as well as a comparison of the differences
between the three isolates. Firstly, it must be noted that Ganoderma H2 had the greatest
viability when stored at 4ºC, and although not identical, Ganoderma H1 and H3 had
similar viability profiles. The similar profile was also observed in the examination of
the viability after thawing and refreezing (Table 5.1) and was in agreement with the
Chapter 5 – Preservation and Mycelial Growth Optimisation
115
phylogenetic analysis presented in Section 4.3.3, which showed that Ganoderma H1 and
H3 were more closely related to each other than to Ganoderma H2.
An interesting observation of isolate H2 was when it was stored on slants, the fungus
survived for the 12 week period with little to no decrease in the subculture growth rates
(Figure 5.1h,k). In contrast, when Ganoderma H2 was stored on plates, the cultures
survived for only 8 and 9 weeks on MEA and PDA plates, respectively (Figure 5.1b,e).
This suggested that the available nutrients in the plates were depleted more quickly than
those in the slants, enabling the longer survival of Ganoderma H2 on the slants. Slants,
rather than plates, have been a form of storage for a number of years (Oei, 1996;
Onions, 1971). This nutrient depletion effect was observed in both the slants and plates
for isolates H1 (Figure 5.1a,d,g,j) and H3 (Figure 5.1c,f,i,l), giving a similar subculture
growth pattern for both storage on slants and plates.
The overall survival of the three isolates when stored on plates at 4ºC declined over
time and resulted in the non-survival for Ganoderma H2 and H3 on both MEA and
PDA plates, respectively, and Ganoderma H1 on MEA plates (Figure 5.1a-f). The
exception was that H1 on the PDA plate was still viable after storage for 12 weeks
(Figure 5.1d). It was apparent that Ganoderma H3 had the lowest tolerance when stored
at 4ºC on the different media, surviving only for a maximum of 9 weeks in storage,
when stored on MEA slants (Figure 5.1c). Croan et al. (1999) also reported that most
tropical isolates when stored on MEA plates have not maintained viability after storage
for two months at 4°C.
The results obtained for the three isolates when stored on slants exposed to light show
that there was a distinct negative effect on the viability of both H1 and H3 (Figure
5.1m,o,p,r). Both these cultures died after week 1 and week 5, respectively, indicating
that they were sensitive to light. It has been previously reported that strong light can
inhibit the mycelial growth of Ganoderma species (Lin et al., 1973). There was no
detrimental effect by light on the viability of Ganoderma H2.

Chapter 5 – Preservation and Mycelial Growth Optimisation
116
Figure 5.1. Short term viability of Ganoderma H1 █, H2 █, and H3 █ on different media. Ganoderma was stored on MEA and PDA plates, MEA and PDA slants and MEA and PDA slants exposed to light, at 4oC. Graphs are labelled (a) to (r) for ease of discussion. Subcultures were taken at weekly intervals and the radial growth measurements were recorded on the fifth day of mycelial growth.
05
1015202530354045
05
10152025303540
05
10152025303540
05
10152025303540
05
10152025303540
0 1 2 3 4 5 6 7 8 9 1011 1205
10152025303540
0 1 2 3 4 5 6 7 8 9 1011 12 0 1 2 3 4 5 6 7 8 9 10 1112
Viability of H3 (week)
Rad
ial G
row
th
(mm
)
PDA
Sla
nts (
light
)
Rad
ial G
row
th
(mm
)
PDA
Sla
nts
Rad
ial G
row
th
(mm
)
MEA
Sla
nts
Rad
ial G
row
th
(mm
)
MEA
Pla
tes
Rad
ial G
row
th
(mm
)
PDA
Pla
tes
Viability of H2 (week)
Rad
ial G
row
th
(mm
)
MEA
Sla
nts (
light
)
a. c.b.
d.
g.
f.e.
i.h.
j. l.k.
m n. o.
p. r.q.
Viability of H1 (week)

Chapter 5 – Preservation and Mycelial Growth Optimisation
117
Another observation, when comparing the more similar species, H1 and H3, was that
they appeared to grow to some extent differently on the two storage media used. Isolate
H1 had a slightly better storage survival rate when PDA was the nutrient medium
(Figure 5.1d,j), while in contrast, isolate H3 survived for a longer period when MEA
was the nutrient medium (Figure 5.1c,i). This is indicative of the different nutrient
requirements of different fungi.
Overall, the information gained from the storage survival rates is informative in terms of
storage profile, temperature capabilities and light sensitivities for each of the three
isolates. It is clear that Ganoderma H1 and H3 are similar in their basic survival
requirements, whilst Ganoderma H2 appears to be more robust under the conditions
examined. This also demonstrates that the different fungal species from the same genus
can require different storage conditions as was demonstrated in the long term
preservation studies (Section 5.3.1.1).
For short term storage and rapid subculture growth it was determined that the three
Ganoderma isolates could be successively stored on plates for no longer than 4 weeks
and on slants for no longer than 6 weeks, away from direct light. Either PDA agar or
MEA was deemed suitable for storage for these time periods.
5.3.2 Examination of Standard Growing Conditions One aim of this investigation was to understand the growth conditions required by the
Australian isolates. This was performed with a view to obtaining large quantities of
mycelial biomass, which could then be investigated for any biological activity. Growth
requirements for other Ganoderma species, predominately G. lucidum, have been
published in the literature (Tseng et al., 1984; Yang & Liau, 1998). However, there is
no evidence to suggest that different species from the same genus require the same
growth and nutritional factors. In addition, isolates from a different region may not
necessarily grow under the same conditions, as illustrated by the variety in growth
conditions published for Ganoderma species around the world (Chen, 1999; Chen &
Miles, 1996b; Mayzumi et al., 1997; Stamets, 1993; Tong & Chen, 1990). The effect of
the environmental factors, pH and temperature, were examined and the optimal

Chapter 5 – Preservation and Mycelial Growth Optimisation
118
conditions determined. These optimal conditions were then used to examine other
variables, such as the mycelial growth rate, growth medium and nutrient source.
5.3.2.1 Effect of pH and Temperature on the Radial Growth of Fungal Mycelia
The three Australian Ganoderma isolates, H1, H2 and H3, were investigated for the
effect that pH and temperature had on the radial growth of the mycelium grown on agar
plates, as described in Section 3.9.4. The fungi were incubated at different temperatures
on PDA plates that had been altered to varying pH values, ranging from pH 3 to 9
(Section 3.4). The radial growth of the mycelium was measured on day 5 and the
results plotted to produce radial growth curves. Radial growth curves of an American
G. lucidum isolate and an Indonesian G. applanatum isolate were also investigated and
used for comparison against the three radial growth curves of Ganoderma H1, H2 and
H3.
It can be seen from Figure 5.2 that a wide variation in growth rate, as well as pH and
temperature tolerance, exists for the different species studied. From the range of
temperatures examined, the optimal growth temperature for the three Australian
Ganoderma isolates, H1, H2 and H3, was determined to be 30ºC (Figure 5.2a,b,c). This
temperature has also been shown to be optimal for other Ganoderma species (Lin et al.,
1973; Yang & Liau, 1998) and is frequently used for the cultivation of Ganoderma in
liquid culture (Fang & Zhong, 2002b; Lee et al., 1999; Yang et al., 2000). The
Indonesian isolate was also observed to grow best at 30ºC, but also grew well at 37ºC
(Figure 5.2e). The American Ganoderma isolate investigated in this study had a lower
optimal temperature at 25ºC (Figure 5.2d). Taking into consideration the region that the
different species were isolated from (Ganoderma H1, H2 and H3 isolated from a
tropical region of Australia whilst G. lucidum was isolated from a temperate region in
America) a relationship may exist between the geographical origin and the optimal
temperature. This region/temperature relationship has also been shown for other fungi
(Vidal et al., 1997).
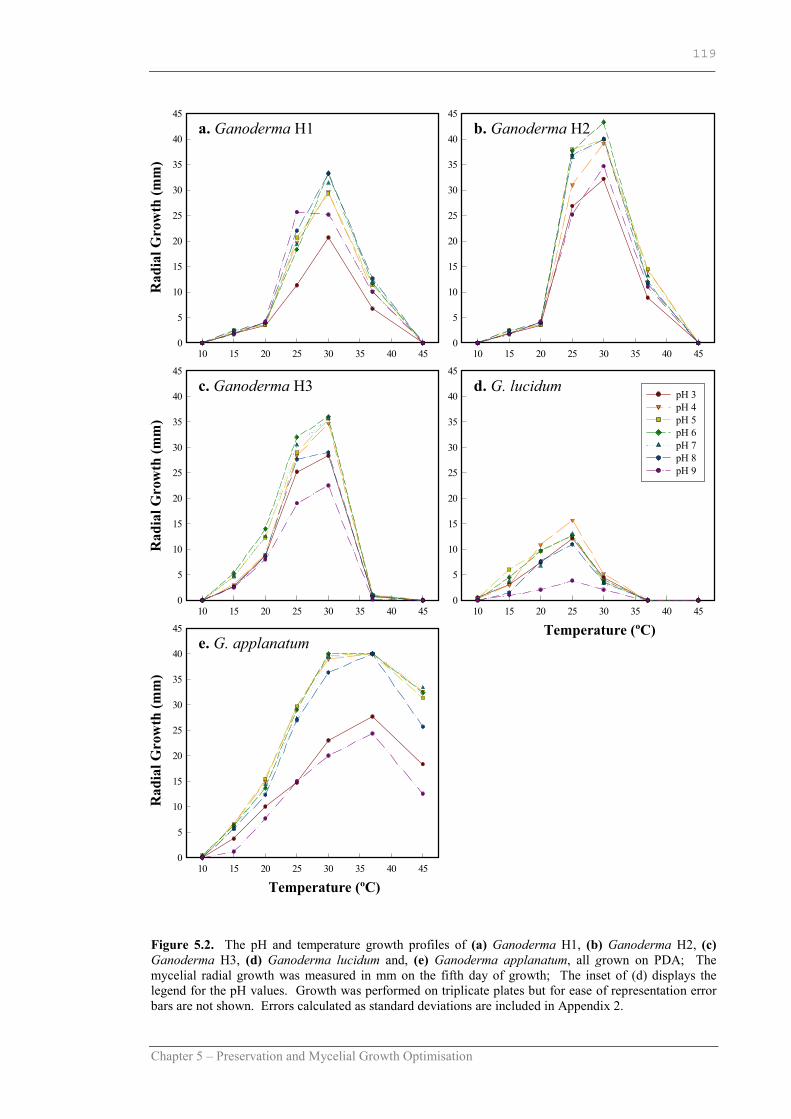
Chapter 5 – Preservation and Mycelial Growth Optimisation
119
Figure 5.2. The pH and temperature growth profiles of (a) Ganoderma H1, (b) Ganoderma H2, (c) Ganoderma H3, (d) Ganoderma lucidum and, (e) Ganoderma applanatum, all grown on PDA; The mycelial radial growth was measured in mm on the fifth day of growth; The inset of (d) displays the legend for the pH values. Growth was performed on triplicate plates but for ease of representation error bars are not shown. Errors calculated as standard deviations are included in Appendix 2.
Temperature (ºC)
10 15 20 25 30 35 40 450
5
10
15
20
25
30
35
40
45
10 15 20 25 30 35 40 450
5
10
15
20
25
30
35
40
45
10 15 20 25 30 35 40 450
5
10
15
20
25
30
35
40
45
10 15 20 25 30 35 40 450
5
10
15
20
25
30
35
40
45
10 15 20 25 30 35 40 450
5
10
15
20
25
30
35
40
45
Rad
ial G
row
th (m
m)
Rad
ial G
row
th (m
m)
Rad
ial G
row
th (m
m)
Temperature (ºC)
pH 3 pH 4 pH 5 pH 6 pH 7 pH 8 pH 9
e. G. applanatum
d. G. lucidum c. Ganoderma H3
b. Ganoderma H2 a. Ganoderma H1
Chapter 5 – Preservation and Mycelial Growth Optimisation
120
The pH/temperature profiles were observed to be a similar shape for the four isolates
Ganoderma H1, Ganoderma H2, Ganoderma H3 and G. lucidum (Figure 5.2a,b,c,d),
showing a range of temperatures in which growth was supported. The three Australian
isolates, H1, H2 and H3, that were all isolated from the same tropical region, exhibited
different growth rates at different temperatures (Figure 5.2a,b,c). Ganoderma H1 and
H2 had a higher growth rate between 25 to 37ºC, whilst Ganoderma H3 had a higher
growth rate between the lower range of 20 to 30ºC. This suggested that Ganoderma H1
and H2 had a greater tolerance for higher temperatures than Ganoderma H3. It was
expected that the growth profiles of Ganoderma H1 and H3 would be more similar, as
they were found to be more closely related in the phylogenetic studies in Chapter 4
(Section 4.3.3) and the viability studies earlier in this Chapter (Section 5.3.1).
The optimal growth temperature for G. applanatum, which was observed to be over the
range 30 to 37ºC, was higher than that of the three Australian isolates or that of the G.
lucidum. The growth profile of G. applanatum was not like any of the Ganoderma
isolates examined. The profile was more like that of an Australian white rot fungus,
Pycnoporus cinnabarinus, which is included for comparison in Figure 5.3. In addition,
orange mycelia rings were observed for the growth of G. applanatum, which is a typical
characteristic of the mycelium from Pycnoporus species (personal communication, Prof.
Greg Lonergan, SUT, Hawthorn, VIC, Australia). This demonstrates how easily species
can be misidentified when using traditional taxonomic methods and hence, the
significance of establishing a universal taxonomic system that can be employed
worldwide.
All the fungal isolates examined exhibited no growth at 10ºC (Figure 5.2). Little or
slow growth of fungi at temperatures of 10ºC or less is a common observation
(Lonergan et al., 1993; Vidal et al., 1997). It is this retardation of growth that is the
major factor in the choice of low temperatures for the storage of many fungal cultures.
The cultures that did not grow at low temperatures were not further investigated to see if
their growth was renewed at optimal temperatures, as the effect of low temperature on
Ganoderma H1 and H3 was previously found to be detrimental (Section 5.3.1.2). With
the exception of G. applanatum, none of the Ganoderma isolates grew at 45ºC. In
addition, there was no growth observed for Ganoderma H3 and G. lucidum at 37ºC. A
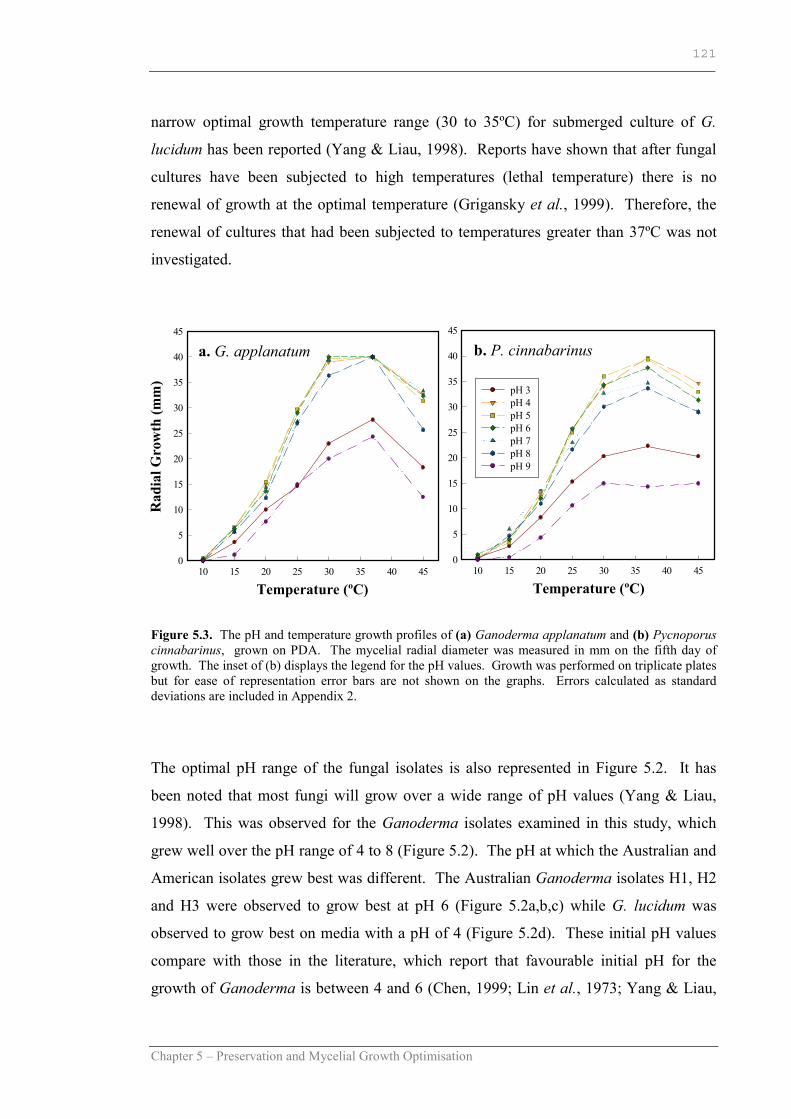
Chapter 5 – Preservation and Mycelial Growth Optimisation
121
narrow optimal growth temperature range (30 to 35ºC) for submerged culture of G.
lucidum has been reported (Yang & Liau, 1998). Reports have shown that after fungal
cultures have been subjected to high temperatures (lethal temperature) there is no
renewal of growth at the optimal temperature (Grigansky et al., 1999). Therefore, the
renewal of cultures that had been subjected to temperatures greater than 37ºC was not
investigated.
Figure 5.3. The pH and temperature growth profiles of (a) Ganoderma applanatum and (b) Pycnoporus cinnabarinus, grown on PDA. The mycelial radial diameter was measured in mm on the fifth day of growth. The inset of (b) displays the legend for the pH values. Growth was performed on triplicate plates but for ease of representation error bars are not shown on the graphs. Errors calculated as standard deviations are included in Appendix 2.
The optimal pH range of the fungal isolates is also represented in Figure 5.2. It has
been noted that most fungi will grow over a wide range of pH values (Yang & Liau,
1998). This was observed for the Ganoderma isolates examined in this study, which
grew well over the pH range of 4 to 8 (Figure 5.2). The pH at which the Australian and
American isolates grew best was different. The Australian Ganoderma isolates H1, H2
and H3 were observed to grow best at pH 6 (Figure 5.2a,b,c) while G. lucidum was
observed to grow best on media with a pH of 4 (Figure 5.2d). These initial pH values
compare with those in the literature, which report that favourable initial pH for the
growth of Ganoderma is between 4 and 6 (Chen, 1999; Lin et al., 1973; Yang & Liau,
10 15 20 25 30 35 40 450
5
10
15
20
25
30
35
40
45
10 15 20 25 30 35 40 450
5
10
15
20
25
30
35
40
45
Temperature (ºC) Temperature (ºC)
Rad
ial G
row
th (m
m)
pH 3 pH 4 pH 5 pH 6 pH 7 pH 8 pH 9
a. G. applanatum b. P. cinnabarinus

Chapter 5 – Preservation and Mycelial Growth Optimisation
122
1998) and optimal pH for some other basidiomycetous fungi has been reported around
pH 6 (Grigansky et al., 1999; Kim et al., 2002b).
The pH of the medium that supported the least growth for all isolates was found to be
pH 3 and 9 (Figure 5.2). Ganoderma H1 and H2 were observed to have the slowest
growth at pH 3, while in contrast, Ganoderma H3 had the slowest growth at pH 9. Lin
(1973) found that there was slow growth when the pH was 7 to 8. This was not
observed for the Australian Ganoderma isolates. In fact, growth at these two pH values
was comparable to the growth at the optimal pH determined for all three isolates.
5.3.2.2 Growth Rate of Fungal Mycelia on PDA Plates
The growth rate of the Ganoderma isolates, H1, H2 and H3, was investigated at the
optimal pH and at two favourable temperature values. The average rate of mycelial
growth was determined as described in Section 3.9.5. The fungi were grown on PDA
plates and incubated at 25 and 30ºC for up to 7 days. The average mycelial growth (mm
day-1) was then determined over a 4 day period (day 2 to day 6 of growth). The growth
rate of G. lucidum was also determined for comparison. The two incubation
temperatures, 25 and 30ºC, were chosen because they covered the optimal growth
temperatures for both the American isolate and the three Australian isolates, (Figure
5.2).
Mycelial growth rate has been shown to be a good means of comparing the growth of
different fungal species under different environmental conditions (Bilay et al., 2000;
Vidal et al., 1997). In this investigation, linear growth rates were observed for
Ganoderma H1, H2 and H3, and G. lucidum, at the different pH and temperatures
examined (results not shown). The growth rates (mm day-1) for each isolate grown on
PDA at either 25 or 30ºC are presented in Table 5.3.

Chapter 5 – Preservation and Mycelial Growth Optimisation
123
Table 5.3 Growth Rates of Ganoderma species at 25 and 30ºC
Mycelial Radial Growth Rate at the Optimal pHa Fungal Organism Optimal pH Growth/day @
25ºC (mm) Growth/day @
30ºC (mm) Ganoderma H1 6b, 8 4.7 ± 1.3 8.2 ± 1.6 Ganoderma H2 6 9.6 ± 0.1 10.8 ± 0.5 Ganoderma H3 6 8.2 ± 0.6 9.1 ± 1.6 G. lucidum 4 4.3 ± 0.6 1.3 ± 0.3
a The average radial growth rate was calculated by taking the average radial growth (mm) on day 2 to 6 of growth. PDA plates, which had been adjusted to the optimal pH, were employed as the growth medium and rates were measured at the temperatures of 25ºC and 30ºC for comparison; b indicates the pH at which growth rates were calculated.
There was a wide range of mycelial growth rates for the four isolates examined ranging
from 1.3 ± 0.3 to 10.8 ± 0.5 mm day-1 at 30ºC and 4.3 ± 0.6 to 9.6 ± 0.1 mm day-1 at
25ºC. Relative growth rates varied with temperature (Figure 5.2) and showed that the
Australian isolates had a faster growth rate than the American isolate (Table 5.3). This
is also evident in the growth profiles presented in Figure 5.2, which displayed smaller
growth curves for G. lucidum. Overall Ganoderma H1, H2 and H3, and G. lucidum had
a mycelial growth rate of 8.2 ± 1.6, 10.8 ± 0.5, 9.1 ± 1.6 and 4.3 ± 0.6 mm day-1,
respectively, when grown at their optimal pH and temperature (Table 5.3). Bilay et al.
(2000), who investigated the growth of one G. lucidum strain amongst other species,
observed a slow growth rate of 2.17 mm day-1 on the same PDA medium at a
temperature of 27ºC. This growth rate lies within the range of 4.3 ± 0.6 (at 25ºC) and
1.3 ± 0.3 (at 30ºC) mm day-1, which was also observed for G. lucidum in this study
(Table 5.3). Besides this comparison of growth rates, there is little information in the
literature on the growth rates of Ganoderma species grown on nutrient plates.
5.3.2.3 Effect of Growth Media on Fungal Biomass in Shaker Flask Cultures
The three Australian Ganoderma isolates were investigated for the effect that
cultivation media had on the production of mycelial biomass and final pH in shaker
flask cultures (Sections 3.10.1 and 3.8.2). Three cultivation media were chosen for
initial experimentation, which included the two undefined media, PDA and MEA, and a
medium used by Kawagishi (1995), which is referred to as Basal-G in this investigation.

Chapter 5 – Preservation and Mycelial Growth Optimisation
124
All media were left at their natural pH, as this was close to that determined as the
optimal pH for growth of Ganoderma H1, H2 and H3 (Section 5.3.2.1).
The mycelial biomass for Ganoderma H1, H2 and H3, cultivated in MEB, PDB and
Basal-G medium, over a period of 10, 20 and 30 days is shown in Figure 5.4. The
maximum amount of mycelial biomass produced by Ganoderma H1, H2 and H3 was
when cultivation occurred in Basal-G medium for 30 days. The biomass was 1.15 ±
0.13, 1.90 ± 0.05 and 1.10 ± 0.15 g, respectively, in 125 mL of cultivation medium.
The final pH of the culture medium was also recorded and is presented in Table 5.4.
When PDB was used as the cultivation medium, the amount of biomass increased up to
day 20 for all three isolates and then did not increase further (Figure 5.4). It was
observed that the fungal growth in PDB was slow and this resulted in a small amount of
mycelial biomass being produced. It was also noted that the amount of biomass at each
sampling point (10, 20 and 30 days) was lower than that produced in MEB and Basal-G
medium. A similar observation was also seen by Bilay et al. (2000), who found the
growth rate of G. lucidum on PDA (2.17 mm day-1) was less than the growth rate on
MEB (3.44 mm day-1).
Table 5.4 Final pH of culture medium after 10, 20 and 30 days cultivation
Final pH of Cultivation Mediuma Days Ganoderma
sp. MEBb PDBc Basal-Gd
10 H1 3.7 ± 0.0 3.7 ± 0.1 3.4 ± 0.0 H2 4.1 ± 0.1 4.2 ± 0.1 4.0 ± 0.0 H3 3.6 ± 0.0 4.4 ± 0.2 4.4 ± 0.1 20 H1 3.5 ± 0.1 3.9 ± 0.1 3.4 ± 0.0 H2 4.2 ± 0.1 4.7 ± 0.2 4.1 ± 0.0 H3 5.8 ± 0.1 3.4 ± 0.2 4.0 ± 0.1 30 H1 7.1 ± 0.8 4.2 ± 0.1 3.5 ± 0.1 H2 7.6 ± 0.0 5.4 ± 0.2 4.0 ± 0.0 H3 7.8 ± 0.5 4.5 ± 0.6 3.6 ± 0.2
a Final pH was calculated after growth of the mycelium in 125 mL of the culture medium in 250 mL shaker flasks. Growth was performed in triplicate shaker flasks and the average and STD calculated; b Initial pH of MEB is 5.4 ± 0.4; c Initial pH of PDB is 5.6 ± 0.2; d Initial pH of Basal-G medium is 5.1 ± 0.1.
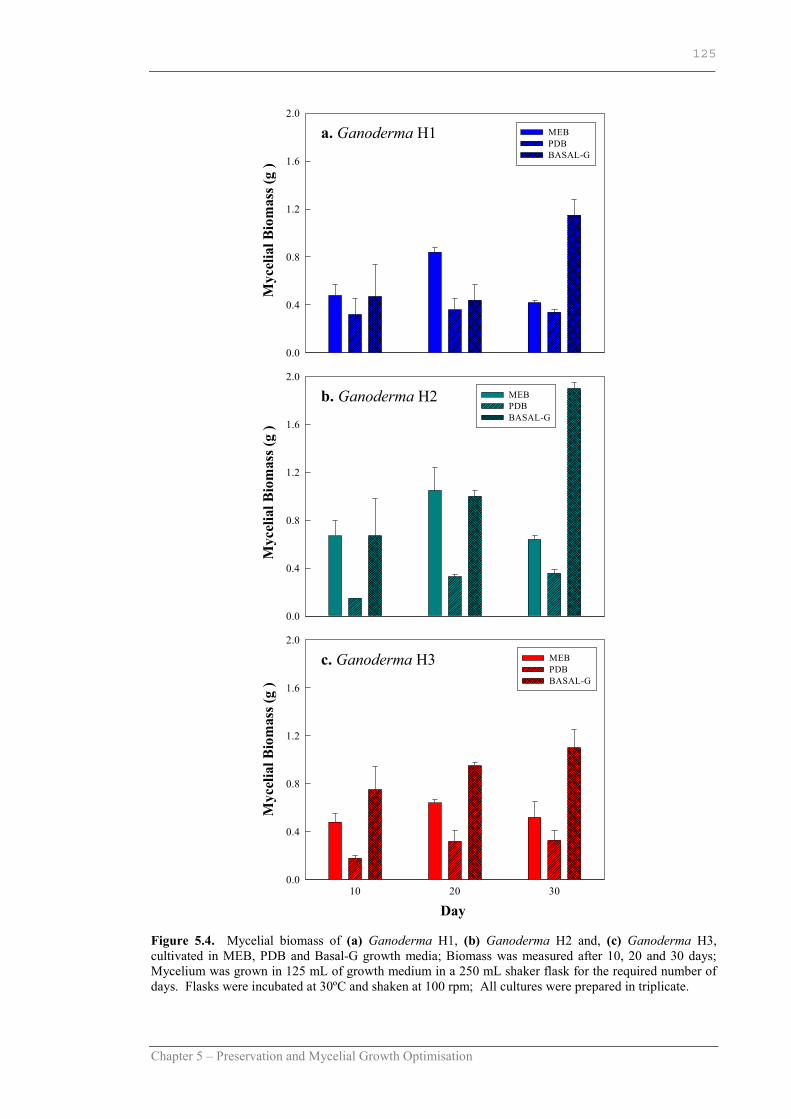
Chapter 5 – Preservation and Mycelial Growth Optimisation
125
Figure 5.4. Mycelial biomass of (a) Ganoderma H1, (b) Ganoderma H2 and, (c) Ganoderma H3, cultivated in MEB, PDB and Basal-G growth media; Biomass was measured after 10, 20 and 30 days; Mycelium was grown in 125 mL of growth medium in a 250 mL shaker flask for the required number of days. Flasks were incubated at 30ºC and shaken at 100 rpm; All cultures were prepared in triplicate.
10 20 300.0
0.4
0.8
1.2
1.6
2.0MEB PDB BASAL-G
0.0
0.4
0.8
1.2
1.6
2.0MEB PDB BASAL-G
0.0
0.4
0.8
1.2
1.6
2.0
MEB PDB BASAL-G
Myc
elia
l Bio
mas
s (g
) M
ycel
ial B
iom
ass (
g )
Myc
elia
l Bio
mas
s (g
)
c. Ganoderma H3
b. Ganoderma H2
a. Ganoderma H1
Day

Chapter 5 – Preservation and Mycelial Growth Optimisation
126
It is generally known that the by-products of fungal metabolic processes are acids,
which decrease the pH of the culture medium (Fang & Zhong, 2002b; Lin et al., 1973).
In addition, the utilization of some compounds in the medium may result in adverse
changes in pH (Griffin, 1994). The final pH of the media that was used for the
cultivation of the three Ganoderma isolates was found to have decreased to an acidic
level at day 10 (3.4 ± 0.0 to 4.4 ± 0.2) (Table 5.4). Over the course of the cultivation
period, the pH of the media was seen to remain around this acidic level with the
exception of the culture medium MEB, which increased to approximately pH 7. MEB
contains no buffering salts and it has been suggested that a buffer is required to control
the pH of the medium (Lin et al., 1973). PDB contains no buffers either, but there was
no increase in pH observed when the fungi were grown in this medium (Table 5.4).
This observation was thought to have been a function of the low yield of biomass
produced in PDB, which in turn resulted in slow consumption and hence, no depletion
of the nutrients in the medium.
It has been reported that when the pH of the culture medium reaches a low level (~ 3.8),
the growth of the mycelium ceases (Lin et al., 1973). This was not observed for any of
the isolates examined in the different media (Figure 5.4) and this is an observation
consistent with that of Kim et al. (2002a). When the pH of all media reached acidic
levels and remained at this level over a period of 30 days, the growth of the mycelium
actually increased over the course of the cultivation period (Figure 5.4 and Table 5.4).
This suggested that there were nutrients (energy sources) still available in the culture
medium that the fungi could metabolise. In fact, the opposite effect occurred, whereby,
when the pH of the culture medium increased, the mycelial growth either stopped or
decreased in mass, as was the case for cultivation in PDB and MEB after day 20 (Table
5.4 and Figure 5.4). This suggested that if the final pH of the cultivation medium was
low, then mycelial growth in that particular medium would be high. This observation
was similar to that of Yang and Liau (1998) who also observed that at lower pH levels
better growth of G. lucidum mycelia was achieved. Lin et al. (1973) reported that
discontinuation of mycelial growth took place after 7 days of cultivation at low pH.
However, longer incubation times were not investigated.
Chapter 5 – Preservation and Mycelial Growth Optimisation
127
Overall there appeared to be a general trend of increased biomass production over time
when the isolates were cultivated in both the Basal-G medium and PDB (Figure 5.4).
This was not the case when they were cultivated in MEB. When MEB was used as the
cultivation medium, a decline in the biomass for all isolates was observed between day
20 and day 30 of cultivation. As the biomass decreased between day 20 and 30 (Figure
5.4), there was a significant increase in the pH of the medium, changing to a slightly
alkaline pH ranging between 7.1 ± 0.8 to 7.8 ± 0.5 (Table 5.4). Generally, the
utilisation and exhaustion of compounds within the growth medium can lead to changes
in the pH and prevention of growth (Chang & Miles, 1989b; Griffin, 1994). Fang &
Zhong (2002b) reported that when the residual glucose was exhausted in the cultivation
medium of G. lucidum, an increase in pH (to a pH of 7) was observed. They determined
that the glucose consumption was directly related to cell growth.
Glucose, the sugar source in MEB, is the carbon source that provides for both the
structural and energy requirements of the fungal cell (Chang & Miles, 1989b). The
depletion of this source generally leads to an adverse affect on cell growth. When the
isolates were grown in MEB medium, the decrease in biomass and increase in pH
(Figure 5.4) may have been due to the depletion of the carbon source within the medium
before the completion of the 30 day incubation cycle. There are other nutrients present
in the medium, such as nitrogen, that if depleted, may also lead to an adverse effect on
the growth of the cell (Chang & Miles, 1989b; Griffin, 1994). However, this was not
investigated further as the aim of this investigation was to produce large enough
quantities of mycelial biomass for secondary metabolite investigation (antibacterial
activity) and not to investigate, in depth, the different nutrient requirements required by
the three isolates. In addition, it has been suggested that many secondary metabolite
pathways are negatively affected by nitrogen sources favourable for growth (Adrio &
Demain, 2003).
Due to the maximum amount of biomass being produced when all three isolates were
grown in the Basal-G medium (Figure 5.4), this medium was chosen for further
nutritional study in the following section.
Chapter 5 – Preservation and Mycelial Growth Optimisation
128
5.3.2.4 Effect of Carbohydrate Source on Mycelial Biomass Production
The three Australian Ganoderma isolates were investigated for the effect that different
carbohydrate sources had on the production of the mycelial biomass in shaker flask
cultures (Sections 3.10.1 and 3.8.2). The fungi were grown in Basal-G growth medium
(Section 3.6.1), substituting glucose with different carbohydrate sources for the
comparison of the mycelial growth. The carbohydrate sources investigated were the
monosaccharides; glucose, galactose, fructose, mannose and xylose, and the
disaccharides; lactose, sucrose and cellobiose. Shaker flasks were prepared in triplicate.
The mycelial biomass and final pH were determined after 30 days of growth at the
optimal growth temperature, 30ºC.
Figure 5.5 shows the effects of different carbohydrate sources on cell growth and the
final culture medium pH of Ganoderma H1, H2 and H3. Comparing the profiles of the
three isolates, it is evident that these fungi utilise different carbohydrate sources in
different ways, demonstrating that related species can have different growth needs.
When Ganoderma H1 was grown in a glucose supplemented medium (Figure 5.5a) the
maximum amount of mycelium was obtained (1.23 ± 0.10 g). Glucose has been also
observed to be the best energy source for biomass production for another medicinally
important fungus, Lentinus edodes (Song & Cho, 1987). A glucose supplemented
medium was also highly favourable to the growth of Ganoderma H2 (Figure 5.5b).
However, it was also noted that there was no difference between the amount of biomass
produced when glucose (1.91 ± 0.15 g), xylose (1.88 ± 0.21 g) and lactose (1.84 ± 0.09
g) were the carbohydrate source for Ganoderma H2. A similar observation reported by
Tang & Zhong (2002), also found that glucose and lactose (as well as maltose) were
comparable in the production of the mycelial biomass of G. lucidum, after 10 days of
cultivation.

Chapter 5 – Preserva
129
Figure 5.5. The effe(a) Ganoderma H1, monosaccharides: gland cellobiose. Thescale, final pH of thegrown in 125 mL of
0.0
0.5
1.0
1.5
2.0
2.5
3.0
0
1
2
3
4
5
Myc
elia
l Bio
mas
s (g
) M
ycel
ial B
iom
ass (
g )
Myc
elia
l Bio
mas
s (g
)
a.
Fina
l pH
tion and Mycelial Growth Optimisation
ct of carbohydrate source on mycelial biomass production and culture medium pH of (b) Ganoderma H2 and, (c) Ganoderma H3. Carbohydrate source was in the form of ucose, galactose, fructose, mannose and xylose; and disaccharides: lactose, sucrose scale on the left of the graph corresponds to the biomass in grams (bars). The right cultivation medium is represented on the graph by the scatter points. Cultures were medium in 250 mL shaker flasks for a period of 30 days.
0.0
0.5
1.0
1.5
2.0
2.5
3.0
0
1
2
3
4
5
Glucose
Galactose
Fructose
MannoseXylose
LactoseSucrose
Cellobiose0.0
0.5
1.0
1.5
2.0
2.5
3.0
0
1
2
3
4
5c.
b.
Carbohydrate Source
Fina
l pH
Fi
nal p
H
Chapter 5 – Preservation and Mycelial Growth Optimisation
130
The general concept that glucose, among all the hexoses, is biologically the most
effective energy source (Cochrane, 1958) was supported by the high levels of mycelial
growth of both Ganoderma H1 and H2 in media containing glucose. However, glucose
did not support the best mycelial growth for Ganoderma H3 (Figure 5.5c), and the more
complex sugars, galactose and fructose, resulted in larger amounts of mycelium being
produced. The amount of biomass produced when galactose (2.05 ± 0.30 g) and
fructose (2.02 ± 0.19 g) were the carbohydrate source was double that when glucose
(0.99 ± 0.24 g) was the carbohydrate source in the culture medium.
When cellobiose was used as the carbohydrate source, the least amount of biomass was
produced for all three isolates (Figure 5.5). This carbohydrate source gave a yield of
0.48 ±0.11, 1.08 ± 0.10 and 0.70 ± 0.10 g of mycelium in 125 mL of culture medium.
Bae et al. (2000) reported that cellobiose was one of the most favourable carbohydrate
sources for producing high biomass production of another higher fungus, Paecilomyces
japonica.
Glucose is the most widely utilised carbon source by fungi, most probably due to it
being the most commonly available sugar, found in cellulose, starches, and other
carbohydrates (Griffin, 1994). Fructose and mannose are the next most commonly
utilised sugars by fungi, followed by galactose (Griffin, 1994). Reports have shown that
different types of carbohydrate sources can aid the growth of Ganoderma species. Sone
et al. (1985), who studied the growth of G. lucidum, found lactose to support the
greatest amount of mycelial growth after 7 days of cultivation. The presence of lactose
was also favourable to the growth of the three Australian isolates, although other sugars
supported better growth (Figure 5.5). It must be noted that the Australian isolates were
cultivated for a longer period (30 days), which may largely affect the mycelial growth,
as was the case when the three isolates were cultivated in MEB (Figure 5.4).
Comparative studies by Lin (1973) on a different Ganoderma sp. showed that there was
no significant difference in biomass production when either glucose or sucrose was the
carbohydrate source in the culture medium. This was not found in the studies of the
three Australian isolates, as the growth of mycelium in a sucrose supplemented medium
was less than that in a glucose supplemented medium for all three isolates. Again, the

Chapter 5 – Preservation and Mycelial Growth Optimisation
131
cultivation time used by Lin (1973) was only 7 days while in the case of the three
Australian isolates, the cultivation time was 30 days.
It was shown previously that Ganoderma H2 had a faster growth rate than Ganoderma
H1 and H3 (Table 5.3). The ability of Ganoderma H2 to grow rapidly was also
apparent when comparing the three carbohydrate source graphs in Figure 5.5. They
showed that the overall biomass of Ganoderma H2 (Figure 5.5b) was much greater than
the overall biomass of Ganoderma H1 (Figure 5.5a) and Ganoderma H3 (Figure 5.5c)
when taking into account the growth in all of the cultivation media with different
carbohydrate sources. Overall, Ganoderma H1 produced the least amount of biomass
(Figure 5.5a), again demonstrating that Ganoderma H1 was the slowest growing isolate
out of the three isolates examined. The slow growth of Ganoderma H1 was also seen in
the comparison of growth rates in Section 5.3.2.2 (Table 5.3).
The final pH of the culture medium was another factor of interest since there have been
reports that suggest that the lower the final pH, the greater the mycelial growth obtained
(Yang & Liau, 1998). The final pH of the culture medium for the three Australian
isolates is also presented in Figure 5.5 and is represented by the points on the graphs.
The final pH of all the media investigated ranged from 3.5 to 4.8 for the three isolates,
showing that there was a drop in pH from the initial pH of 5.1 ± 0.1 (Table 3.6), which
is commonly observed when cultivating fungi in liquid culture (Chen, 1999; Fang &
Zhong, 2002b). Ganoderma H1 produced the least amount of biomass overall as
mentioned earlier (Figure 5.5). It also decreased the final pH of seven media out of
eight, to a pH below 4, (pH 3.46 ± 0.22 to 3.85 ± 0.13) (Figure 5.5a). In comparison,
Ganoderma H2 reduced four media out of eight to just below a pH of 4 (pH 3.86 ± 0.05
to 3.93 ± 0.01) (Figure 5.5b) and Ganoderma H3 decreased the pH of only one medium
(fructose) to a pH of 3.88 (Figure 5.5c) after 30 days of cultivation. The idea that a low
final culture medium pH gives a high yield of biomass does not hold up when
comparing different isolates against each other. However, there appeared to be a
general trend of a low final culture medium pH being proportional to a high biomass
yield, when comparing the growth of the same isolate in different media. In the case of
both Ganoderma H1 and H2, when biomass production was large, the final pH was

Chapter 5 – Preservation and Mycelial Growth Optimisation
132
observed to be lower than that when the biomass production was low (Figure 5.5a,b).
This pattern was not observed for Ganoderma H3 (Figure 5.5c).
Further investigations of the optimal carbohydrate concentration in the liquid medium
were not performed. Fang & Zhong (2002c) reported that the highest levels of biomass,
as well as intracellular polysaccharides and ganoderic acids, were obtained at an initial
glucose concentration of 50 g L-1. This concentration was used in the cultivation
medium in this investigation. In addition, nutrients such as nitrogen and inorganic salts
were not examined in this study, as at this point in the investigation, the production of
biomass was deemed sufficient to proceed with the examination of the biological
activity of the three isolates. In addition, growth factors such as yeast extract, peptone
and phosphate ions, which have been reported to promote good mycelial growth (Bae et
al., 2000; Fang & Zhong, 2002c; Song & Cho, 1987), were already incorporated into
the cultivation medium. For future studies, it would be recommended to examine all
nutrient sources and the effect they had on the biological activity (which has been
determined in the following Chapter) of the fungus.
Overall, glucose was determined to be the best carbohydrate source for Ganoderma H1,
glucose, xylose and lactose for Ganoderma H2, and both galactose and fructose for
Ganoderma H3. Fang and Zhong (2002c) observed that high biomass produced when
glucose was the carbohydrate source also produced a high ganoderic acid concentration
in the mycelium. This relationship of high ganoderic acids and high biomass production
was also seen by Tang & Zhong (2002), and Fang & Zhong (2002b). Because the
biological activity of the cultivated mycelium from the three Australian Ganoderma
isolates was of interest, in particular the organic extracts from the mycelium as
discussed in the following Chapter, the high biomass production using glucose as the
primary carbohydrate source appeared promising in the production of biologically
active compounds.
5.4 Summary In this Chapter, the three Australian Ganoderma isolates, H1, H2 and H3, were
investigated for their viability and their growth behaviour in selected environmental and
nutritional growth conditions. These factors were investigated to determine the optimal

Chapter 5 – Preservation and Mycelial Growth Optimisation
133
growth requirements of the fungi and to assess whether they were comparable to other
Ganoderma species that have been isolated from other parts of the world. In addition,
optimal growth conditions were established so that the rapid production of good quality
mycelium could be produced.
The viability of the three isolates was determined for both long and short term storage
(Section 5.3.1). It was determined that the best method for long term storage for the
three isolates was on balsa wood chips, stored at –80ºC for periods of up to 2 years
without subculture. Viability studies were not performed on the fungi after this time.
Long term storage resulted in the decrease of subculture growth for both Ganoderma
H1 and H3. This prompted further investigation on the short term storage of the fungi,
so that rapid subculture of the mycelium could be performed. It was determined that all
three isolates were to be stored on either, PDA or MEA slants at 4ºC for up to periods of
8 weeks before transferring to fresh slants. It was also important to store the slants
away from the direct light, in particular Ganoderma H1 and H3, as the light had a
detrimental effect on the viability of the mycelium.
The two important environmental factors, pH and temperature, were investigated
(Section 5.3.2.1). The isolates were found to grow best at a temperature and pH similar
to what has been reported for other Ganoderma species (Yang & Liau, 1998). From the
range of temperatures studied, it was determined that 30ºC was optimal for all three
isolates, although growth at 37ºC for Ganoderma H1 and H2, and growth at 25ºC for
Ganoderma H3 was also highly favourable. Under the growth conditions tested, an
initial cultivation medium of pH 6 was determined to be optimal for all three isolates,
although it must be noted that they grew well in the pH range of 4 to 8. The growth
rates of the three fungi were also studied (Section 5.3.2.2) and it was observed that at
the optimal pH and temperature, Ganoderma H2 had the fastest growth rate whilst
Ganoderma H1 had the slowest.
The type of cultivation medium and the carbohydrate source in the medium were
examined for the ability to provide the greatest amount of mycelial growth (Section
5.3.2.3 and Section 5.3.2.4). A defined growth medium, which contained phosphates,
organic nitrates and minerals, was found to support the best mycelial growth of the three

Chapter 5 – Preservation and Mycelial Growth Optimisation
134
Australian isolates. The growth of the fungi, in defined medium supplemented with
different carbohydrate sources, was explored and it was found that glucose supported
the greatest growth of both Ganoderma H1 and H2, and galactose and fructose
supported the greatest growth of Ganoderma H3.
Overall, the viability and growth studies examined in this Chapter gave some valuable
information about the preservation, growth and cultivation of the three Australian
Ganoderma isolates. Of particular interest was the observation that although
Ganoderma H1 and H3 had similar profiles in the viability studies (Section 5.3.1) and
were more closely related in the phylogenetic studies (Chapter 4, Section 4.3.3), there
appeared to be more similarities between Ganoderma H1 and H2 when some growth
requirements were investigated. This highlights the significance that closely related
species or strains may require different growth conditions and that it is important that
these optimal growth conditions be identified for each new isolate.

6 Chapter Six
MMyycceelliiaall EExxttrraaccttiioonn aanndd AAnnttiibbaacctteerriiaall
AAccttiivviittyy

Chapter 6 – Mycelial Extraction and Antibacterial Activity
136
6.1 Introduction The extraction process is an important step in the investigation of biologically active
compounds. When extracting compounds from fungi, or any living source, the type of
solvent used, the extraction process employed and the age, part or type of cultivation of
the living tissue, can all have a marked effect on the type of compound that can be
extracted. Aqueous extractions using hot water have been performed on the fruiting
bodies and mycelium of Ganoderma species and have resulted in the extraction of many
proteins, lectins and polysaccharides (Bao et al., 2002; Cheong et al., 1999; Kawagishi
et al., 1997). When the extraction process employs organic solvents such as chloroform
or methanol, which are non-polar and highly polar, respectively, different compounds
such as flavonoids, alkaloids, coumarins, fatty acids and triterpenes are commonly
extracted (Cowan, 1999; Lin & Shiao, 1988; Shiao et al., 1988b).
Many of the compounds extracted from both the mycelium and fruiting body of
Ganoderma have been found to exhibit biological activity towards tumours and virus
infected cells (Gao et al., 2000a; Kim et al., 2000; Kimura et al., 2002; Lin et al., 2003;
Mothana et al., 2003; Oh et al., 2000; Zhang & Lin, 1999a, 199b). In addition,
compounds from Ganoderma have also been reported to have hepatoprotective roles
against liver injury (Kim et al., 1999; Zhang et al., 2002a) and protective effects
towards organelles that are affected by reactive oxygen species (Lee et al., 2001; You &
Lin, 2002). On review of the literature, there appears to be fewer studies performed on
the antimicrobial activity of the aqueous or organic extracts from Ganoderma species.
This Chapter reports the extraction of compounds and their antibacterial activities from
the liquid cultivated mycelium of the three Australian Ganoderma isolates.
6.2 Overview Both aqueous and organic extracts from the liquid cultivated mycelium of the three
Australian Ganoderma isolates were investigated for antibacterial activity. Aqueous
extractions employed hot water. Organic extractions involved Soxhlet extraction using
four organic solvents ranging in polarity. Initial extractions were performed on the
mycelial biomass that had been cultivated in a commercially available nutrient medium,
MEB, for 30 days. The inhibitory activity of all crude aqueous and organic extracts was
investigated against a range of Gram positive and Gram negative bacteria. Preliminary

Chapter 6 – Mycelial Extraction and Antibacterial Activity
137
results indicated that both the aqueous and organic extracts from Ganoderma H1
possessed activity against a greater range of bacteria than the other Ganoderma isolates
and hence, this species was used for a more in-depth investigation. Crude organic
extracts from the mycelium of Ganoderma H1, which had been cultivated in three
different media, were examined for their activity against a range of aerobic and
anaerobic bacteria, including some clinically important pathogenic species. Effective
concentrations of the most active organic extracts were investigated by means of
minimum inhibitory concentration (MIC) and minimum bactericidal concentration
(MBC) assays. Finally, time course growth assays were studied to investigate the effect
that the extracts had on the different test bacteria.
6.3 Results & Discussion 6.3.1 Preliminary Antibacterial Investigations of Ganoderma
H1, H2 & H3 Preliminary antibacterial screening was performed early in this investigation to
determine whether the extracts possessed any biological activity. Both the aqueous
(Section 6.3.1.2) and organic extracts (Section 6.3.1.4) from the three isolates, H1, H2
and H3 were investigated for their antibacterial activity. At this stage, the biomass
productivity of the three isolates cultivated in different media, which was discussed in
the previous Chapter (Sections 5.3.2.3 and 5.3.2.4), had not yet been explored. It is
therefore important to note that the growth medium MEB, which was used for the
cultivation of the three isolates, was initially selected purely as a means of producing
mycelial biomass. Once activity was confirmed, further analysis was performed in an
alternative cultivation media and is discussed in the latter part of this Chapter. In
addition, antibacterial assays were initially performed to identify which isolate, if any,
contained the greatest antibacterial activity so a more in-depth study of only one isolate
could be performed. The Australian Ganoderma isolate H1, which was found to
possess the greatest activity under the initial growth conditions, is further explored and
discussed in the latter part of this Chapter and in Chapter 7.
6.3.1.1 Aqueous Extraction of the Mycelium from Ganoderma H1, H2 & H3
Aqueous extractions on the mycelial biomass of the three Ganoderma isolates H1, H2
and H3, were performed as described in Section 3.11.1. The mycelium was cultivated

Chapter 6 – Mycelial Extraction and Antibacterial Activity
138
in MEB for 30 days (Sections 3.10.1 and 3.8.2), freeze dried (Section 3.3) and then
subjected to aqueous extraction by boiling for 2 hours at 100ºC. Aqueous extracts were
then evaporated to dryness. The mass and appearance/consistency of the aqueous
extracts are presented in Table 6.1.
Table 6.1 Hot water extraction yield of three Australian Ganoderma isolates H1, H2 and H3
Hot Water Extractb Ganoderma isolatea mass (mg g-1) Appearance; Consistency H1 15 ± 3 Dark brown; Powder H2 22 ± 2 Dark orange/brown; Powder H3 15 ± 3 Dark brown; Powder
a Ganoderma isolates were cultivated in MEB for 30 days in shaker flasks; b Hot water extract yield was calculated in mg of extract per gram of mycelium and is a result of triplicate extractions.
Figure 6.1. Aqueous extracts from the mycelial biomass of Ganoderma H1, H2 and H3 that had been cultivated in MEB for a period of 30 days. (a) Dried and ground extract. (b) Extracts (10% w/v) resuspended in water.
The yield of aqueous extract for both Ganoderma H1 and H3 resulted in the same mass
(15 ± 3 mg g-1) after triplicate extractions (Table 6.1). Ganoderma H2 provided a larger
extract yield (22 ± 2 mg g-1). The appearance/consistency of the three extracts was
a.
b.

Chapter 6 – Mycelial Extraction and Antibacterial Activity
139
similar for both Ganoderma H1 and H3 (dark brown powder), however for Ganoderma
H2, the extract was a dark brown to orange powder. The dried and ground extracts, and
the 10% (w/v) solutions resuspended in water, are shown in Figure 6.1a,b. Yoon et al.
(1994), who investigated the aqueous extraction of the fruiting bodies of G. lucidum
also observed a similar colour.
6.3.1.2 Antibacterial Activity Screening of the Aqueous Extracts from
Ganoderma H1, H2 and H3
Preliminary screening for antibacterial activity was performed using a disc diffusion
assay (Section 3.13.1) and was performed for all aqueous extracts reported in Section
6.2.1.1. The extracts from Ganoderma H1, H2 and H3 were applied to separate discs
and the inhibitory effect was measured against a number of Gram positive and Gram
negative bacteria. The final amount of extract applied to each disc was 6000 μg. The
results of the preliminary investigation are presented in Table 6.2.
The data in Table 6.2 show that both Ganoderma H1 and H2 exhibited incomplete
inhibition against the Gram positive bacterium, B. cereus. Ganoderma H1 also
exhibited activity against B. subtilis. There was no activity observed for any of the
extracts against any of the Gram negative bacteria tested. It is difficult to compare these
results against literature values, as there appears to be little information available on the
antibacterial activity of aqueous extracts from the mycelium of Ganoderma. Yoon et al.
(1994) who investigated the bioactivity of aqueous extracts from the fruiting body of G.
lucidum found that the extracts also exhibited inhibitory activity towards the Bacillus
species. In addition, they found their aqueous extracts to have strong activity against
some other Gram positive and Gram negative bacteria. It has been suggested that there
can be variation in the bioactive component of fungal mycelium compared to the
fruiting body (Lindequist, 1995; Lorenzen & Anke, 1998) and that during the different
stages of growth, there can be structural change of the bioactive components (Chen &
Miles, 1996a). The aqueous extracts obtained by Yoon et al. (1994), from the fruiting
body of Ganoderma, were likely to have contained different active compounds to those
in the aqueous extracts from Ganoderma H1, H2 and H3. Therefore, the smaller range
of activity exhibited in this investigation (Table 6.2) could be attributed to the fact that
the extracts were from the mycelium and not the fruiting bodies of the fungi.

Chapter 6 – Mycelial Extraction and Antibacterial Activity
140
Table 6.2 Preliminary antibacterial screening of the aqueous extracts from the liquid cultivated mycelium of
Ganoderma H1, H2 and H3.
Antibacterial Activity of Crude Aqueous Extractsb Test Bacteriaa H1 H2 H3
Bacillus cereus [7] [6.5] - Bacillus subtilis [7] - - Enterococcus faecalis - - - Listeria monocytogenes - - - Micrococcus luteus - - - Streptococcus pyogenes 10 (19)* - (17)* 7 (14)* Staphylococcus aureus (SUT) - - -
Gram positive
Staphylococcus epidermidis - - - Escherichia coli - - - Klebsiella pneumoniae - - - Pseudomonas aeruginosa - - - Proteus vulgaris - - - Salmonella typhimurium - - -
Gram negative
Shigella sonnei - - - a Cultures were incubated at 37°C for 24 hours, except Micrococcus luteus, which was incubated at 30°C for 48 hours. Culture conditions and growth media are listed in Table 3.3 of Chapter 3; b Activity was determined by disc diffusion assays on lawn cultures. A zone of inhibition > 6mm was considered positive. [ ], incomplete inhibition was observed (i.e.; reduced growth, but not complete elimination of growth). -, no inhibition was observed. * Two zones were observed, the first complete zone of inhibition was observed prior to chemical treatment and after spraying with MTT, a larger second zone was observed which is shown in the brackets (); Results are the average of triplicate experiments; Blanks of solvent only (processed in the same way) were also tested for antibacterial activity, and gave no inhibition; Crude extracts were from fungi grown in MEB for 30 days. H1, H2 and H3 represent Ganoderma H1, Ganoderma H2 and Ganoderma H3 respectively.
Ganoderma H1 and H3 exhibited the strongest (and only complete) zone of inhibition
against S. pyogenes (Table 6.2 and Figure 6.2). There appears to be no literature
available that reports the sensitivity of S. pyogenes towards aqueous extracts from
Ganoderma species, although, Smania et al. (1999) found that organic extracts
displayed inhibitory activity towards this bacterium. To aid in the visual observation of
the zones of inhibition, the plates were sprayed with MTT. As a result of the spraying,
larger zones of inhibition were observed for Ganoderma H1 and H3 (giving a second
zone of inhibition) and a large zone of inhibition was also observed for Ganoderma H2
(Figure 6.2b). MTT is reduced by the metabolically active cells (i.e. live bacterial cells)
and results in an intracellular purple formazan product that accumulates in the cells
(Hostettmann, 1999). Hence, non-viable cells (or dead cells) do not reduce MTT and
will not produce a purple product. As a result, if a plate is sprayed with MTT, there will

Chapter 6 – Mycelial Extraction and Antibacterial Activity
141
be a non-coloured (clear) zone of inhibition (bacterial cells that have been killed by the
extract) clearly visible against the darker purple coloured viable cells. A representative
diagram of this process is shown in Figure 6.3. However, on close inspection of this
new larger zone of inhibition, there was a definite area where bacterial growth could be
seen. The bacteria within this area did not reduce the MTT to form a purple complex
indicating that the bacteria within this larger zone were not living (Figure 6.3) (and was
confirmed by the inability of the subcultured bacteria to grow during subsequent
incubation). One possibility of this observation is that S. pyogenes had time to grow
within this region before the extract fully diffused through the agar medium. It would
then appear that the extract continued to move through the agar medium and kill the
bacteria after growth occurred.
Figure 6.2. Representative photos of the disc diffusion assay showing complete inhibition of Streptococcus pyogenes by the aqueous extract of Ganoderma H1 after a 24 h incubation period. (a) Depicts the zone of inhibition (dark area) around the disc that contains the extract. The lighter area outside the zone of inhibition is the growth of the organism that is visible to the eye. (b) Depicts the larger zone of inhibition (clear zone) around the same disc with extract, after spraying with MTT. The area outside the zone of inhibition is a purple formazan complex formed from the reduction of MTT by the live bacteria.
There is much debate regarding the use of the diameter of zone of inhibition as a
reliable measure of antibacterial activity, as the size of the zone of inhibition is affected
by the rate of diffusion of the compound through the agar gel, and different compounds
diffuse at different rates (Barry & Thornsberry, 1985). The observation of the larger
zone highlighted this issue and illustrated that inhibition of each bacterium depends
largely on the ability of the extract to diffuse through the medium.
b. a.
10 mm 19 mm

Chapter 6 – Mycelial Extraction and Antibacterial Activity
142
Figure 6.3. Representative diagram of the reduction of MTT by living bacteria after 24 hours incubation. The plate is sprayed with MTT, which is reduced to form a purple complex by the living bacteria. Dead bacteria do not reduce MTT and therefore, leave a zone of inhibition. Bacteria that do not reduce MTT can be confirmed dead by performing a subculture.
Overall, the aqueous extracts from the mycelium of the three Australian Ganoderma
isolates exhibited a small range of antibacterial activity against some Gram positive
bacteria. This activity appeared to be much lower than that reported in the literature.
However, it must be noted that the aqueous extraction process employed in this
investigation (near boiling for 2 hours, Section 3.11.1) may inactivate some types of
potential antibacterial compounds, such as proteins. Nevertheless, this is the first
account of aqueous extracts from the mycelium of Ganoderma exhibiting antibacterial
activity. The small amount of activity exhibited by the aqueous extracts, combined with
the fact that the organic extracts exhibited antibacterial activity against a greater range
of bacteria (which is discussed in the following Sections in this Chapter), led to the
decision to not pursue the investigation of aqueous extracts any further.
6.3.1.3 Organic Extraction of the Mycelium from Ganoderma H1, H2 & H3
Organic extractions were performed on the mycelial biomass of Ganoderma H1, H2 and
H3 as described in Section 3.11.2. The fungal isolates were cultivated in MEB and
harvested on day 30 (Sections 3.8.2 and 3.10.3). The mycelial biomass was freeze dried
and then subjected to successive Soxhlet extractions using a range of organic solvents.
The solvents used were in the order of increasing polarity starting with hexane (HEX),
Spray with MTT
No living bacteria
Bacterial growth (living)
No bacterial growth
Bacterial growth
extractmovement

Chapter 6 – Mycelial Extraction and Antibacterial Activity
143
dichloromethane (DCM), ethyl acetate (EtOAc) and then methanol (MeOH). The
resulting solvent obtained from each extraction was evaporated to dryness under
reduced pressure and the mass (Table 6.3) and appearance/consistency (Table 6.4) of
the crude extracts noted.
Solvents of increasing polarity were used in the extraction process to try and extract
components of varying polarity into the different solvents. Generally, extraction using a
less polar solvent (e.g. hexane) will extract compounds of a similar polarity, and
extraction using a more polar compound (e.g. methanol) will then extract compounds
that have a greater polarity. Ideally, different compounds will be extracted into the
solvents at different phases in the Soxhlet process. However, one rarely achieves
complete separation of constituents and the same compound may be recovered (in
varying proportions) in several fractions (Harbourne, 1973). Nevertheless, using
solvents of increasing polarity in a Soxhlet apparatus is a classical chemical procedure
for obtaining chemical constituents from dried material.
The yield of the extracts for the three Ganoderma isolates grown in MEB are given in
Table 6.3. When comparing the mass of extracts between different successive solvents
within the same isolate, there was a wide range of extract masses obtained ranging from
13 ± 3 to 197 ± 54 mg g-1, 5 ± 2 to 69 ± 17 mg g-1 and 2 ± 1 to 119 ± 18 mg g-1 for H1,
H2 and H3, respectively. A wide range of extract mass was also observed between the
different isolates extracted using the same solvent. For example, the MeOH extract
yielded 197 ± 54 mg g-1, 69 ± 17 mg g-1 and 119 ± 18 mg g-1 for H1, H2 and H3,
respectively (Table 6.3). This large range of masses indicated that there were
differences in the mycelium of the three Ganoderma isolates. Rosecke & Konig (2000)
and Yen & Wu (1999) also observed differences in the extract mass obtained using
different isolates. They observed extract yields ranging from 2 to 25 mg g-1 (HEX
extract) and 40 to 103 mg g-1 (MeOH extract), from the fruiting bodies of different
Ganoderma isolates.

Chapter 6 – Mycelial Extraction and Antibacterial Activity
144
Table 6.3 Organic extraction yield of Ganoderma isolates H1, H2 and H3
Organic Extracts from Australian Ganoderma Isolatesa Extraction
Solvent H1 (mg g-1) H2 (mg g-1) H3 (mg g-1) HEX 54 ± 9b 16 ± 8 12 ± 6 DCM 45 ± 3 7 ± 2 4 ± 1 EtOAc 13 ± 3 5 ± 2 2 ± 1 MeOH 197 ± 54 69 ± 17 119 ± 18 Total crude extractc 309 ± 54 96 ± 17 137 ± 18
a Ganoderma isolates were cultivated in MEB for 30 days in 1 L shaker flasks; b Crude extract yield was calculated in mg of extract per gram of mycelium and is a result of triplicate extractions; c The total crude extract was calculated by addition of all successive extracts (HEX, DCM, EtOAc, MeOH) from the same isolate.
The extracts obtained from each species by the same solvent exhibited similar colours
and textures (Table 6.4). All HEX extracts were observed to be an orange oily
consistency. This observation was similar to that obtained by Rosecke and Konig
(2000), who noted their HEX extracts to be either a yellow or orange oily substance.
The DCM extract was observed to be an orange solid, EtOAc to be a
yellow/orange/brown solid and the MeOH to be a chunky brown to dark red solid
(Table 6.4). Again, the observation for the crude extracts were similar those obtained
by Rosecke and Konig (2000), who observed their MeOH and DCM extracts to consist
of a dark red solid and orange solid respectively.
Table 6.4 The appearance and consistency of the organic extracts from Ganoderma H1, H2 and H3
Organic Extracts from Australian Ganoderma Isolatesa H1 H2 H3
Extraction Solvent
Appearance; Consistency Appearance; Consistency Appearance; Consistency HEX Orange; Oily Orange; Oily Orange; Oily DCM Dark orange; Solid Dark orange; Solid Dark orange; Solid EtOAc Yellow/orange; Solid Orange/brown; Solid Orange/brown; Solid MeOH Brown/red; Solid Brown/red; Solid Brown/red; Solid
a Ganoderma isolates were cultivated in MEB for 30 days in 1 L shaker flasks.

Chapter 6 – Mycelial Extraction and Antibacterial Activity
145
6.3.1.4 Antibacterial Activity Screening of the Organic Extracts from
Ganoderma H1, H2 and H3
Preliminary screening for antibacterial activity was performed using the disc diffusion
assay (Section 3.13.1) and was carried out on all crude organic extracts. Initial
bioactivity experiments were performed on crude extracts from different Soxhlet
batches. Once bioactivity was confirmed, the Soxhlet batches were pooled to obtain
large amounts of crude extract for further analysis. As mentioned earlier, preliminary
screening was performed early in this investigation to assess the crude extracts for any
biological activity present. Therefore, preliminary extractions, and in turn antibacterial
assays, were performed on the mycelium that had been cultivated in a MEB medium.
Preliminary antibacterial testing of the crude organic extracts from the three Australian
Ganoderma isolates H1, H2 and H3 are shown in Table 6.5. Note that antibacterial
activity in Table 6.5 is reported as either a positive or negative result, and not as the
diameter of the zone of inhibition, as was reported for the aqueous extracts in the
previous section (Section 6.3.1.2, Table 6.2). Further antibacterial assays were
performed on the organic extracts (Section 6.3.2.1), thus, zones of inhibition are
reported and discussed later in this chapter. This section on the preliminary testing of
the organic extracts is primarily included to report the process of selection, of one
Ganoderma isolate, for further antibacterial analysis.
Table 6.5 shows that the crude HEX, DCM and EtOAc extracts of Ganoderma H1
exhibited activity against the Gram positive bacteria, B. cereus, B. subtilis, S. pyogenes,
S. aureus, S. epidermidis and L. monocytogenes. There was no inhibition observed for
the organic extracts from Ganoderma H2 or H3 against any of the bacteria, with the
exception of incomplete inhibition of B. cereus and complete inhibition of S. pyogenes,
exhibited by the DCM extract from Ganoderma H2.

Chapter 6 – Mycelial Extraction and Antibacterial Activity
146
Table 6.5 Preliminary antibacterial screening of the organic extracts from the liquid cultivated mycelium of
Ganoderma H1, H2 and H3
Antibacterial Activity of Crude Organic Extractsb HEX DCM EtOAc MeOH
Test Bacteriaa H1 H2 H3 H1 H2 H3 H1 H2 H3 H1 H2 H3 Bacillus cereus [+] - - + [+] - + - - - - - Bacillus subtilis + - - + - - + - - - - - Enterococcus faecalis - - - - - - - - - - - - Streptococcus pyogenes + - - + + - + - - - - - Staphylococcus aureus (SUT)
[+] - - + - - [+] - - - - -
Streptococcus epidermidis
- - - [+] - - - - - - - -
Listeria monocytogenes [+] NT NT [+] NT NT [+] NT NT - NT NT
Gra
m p
ositi
ve
Micrococcus luteus - - - - - - - - - - - - Escherichia coli - - - - - - - - - - - - Klebsiella pneumoniae - - - - - - - - - - - - Pseudomonas aeruginosa
- - - - - - - - - - - -
Proteus vulgaris - - - - - - - - - - - - Salmonella shigella - - - - - - - - - - - - G
ram
neg
ativ
e
Shigella sonnei - - - - - - - - - - - - a Cultures were incubated at 37°C for 24 hours, except M. luteus, which was incubated at 30°C for 48 hours. Culture conditions and growth media are listed in Table 3.3 of Chapter 3; b Activity was determined by disc diffusion assays. A zone of inhibition > 6mm was considered positive. + a zone of inhibition was observed; - no inhibition was observed; [+] incomplete inhibition was observed (i.e.; reduced growth, but not complete elimination of growth); NT, not tested; Results are the average of triplicate experiments; Blanks, consisting of the solvent without extract (which had been processed in the same way) were also tested for antibacterial activity and gave no zones of inhibition; Crude extracts are from fungi grown in MEB for 30 days. H1, H2 and H3 represent Ganoderma H1, Ganoderma H2 and Ganoderma H3, respectively.
Ganoderma H1 was observed to possess activity against the greatest range of bacteria
(Table 6.5). The DCM extract from Ganoderma H1 exhibited activity against six
bacteria, whilst the DCM extract from Ganoderma H2 and H3 exhibited activity against
two and zero bacteria, respectively. The yield of DCM extract for the three isolates H1,
H2 and H3 was also different (Table 6.3). The DCM extract from Ganoderma H1 (45 ±
3 mg g-1) was as much as six to fourteen times greater than the DCM extract obtained
from Ganoderma H2 (7 ± 2 mg g-1) and H3 (4 ± 1 mg g-1) respectively. Since the mass
of extract (6000 μg) assessed for activity was the same for all extracts, this suggested
that the active compound/s was/were not in the DCM extract of Ganoderma H3, or

Chapter 6 – Mycelial Extraction and Antibacterial Activity
147
was/were not in a concentration high enough to cause an antibacterial effect. A similar
case was also observed for the HEX and EtOAc extracts.
Like the aqueous extracts (Table 6.2), the organic extracts had no inhibitory effect
towards any of the Gram negative bacteria tested (Table 6.5). Other reports have shown
organic extracts from Ganoderma to have antibacterial activity against some selected
Gram negative bacteria (Mothana et al., 2003; Smania et al., 1999). It must be noted
however, this literature reports bioactivity of the organic extracts of the fruiting body of
the mushroom and not the liquid cultivated mycelium, as is the case in this
investigation. This again suggests that different compounds may be produced in the
liquid cultivated mycelium to that of the fruiting body.
All the MeOH extracts obtained from the three Australian isolates displayed no
inhibitory effects against all the bacteria tested. This was not expected as previous
studies have shown that the MeOH extract from a Ganoderma species has inhibited the
growth of Gram positive bacteria (Sudirman & Mujiyati, 1997). Again, these inhibitory
effects have been observed from extracts of the fruiting bodies of Ganoderma and not
the liquid cultivated mycelium. However, there appeared to have been no investigations
on MeOH extracts from the liquid cultivated mycelium, therefore warranting the
research of these extracts.
There appears to be no evidence in the literature of the antibacterial effect of organic
extracts of the liquid cultivated mycelium of Ganoderma species, with the exception of
one such paper, which explores the activity of ganoderic acids (extracted using orgnics)
against some bacteria (Li et al., 2000b) . Therefore, this is one of the first account of
antibacterial activity from Ganoderma mycelial extracts. Since the mycelium of
Ganoderma H1 produced the greatest yield of crude extract for each solvent (Table 6.3)
and these organic extracts displayed antibacterial activity against the greatest number of
bacteria (Table 6.5), it was decided that only the organic extracts from this isolate would
be further studied. This does not suggest that Ganoderma H2 and H3 did not possess
biological activity, however, time restrictions and the large number of variables that
could be explored on three isolates meant that this investigation would be limited to
only one Australian Ganoderma isolate from this point forward.

Chapter 6 – Mycelial Extraction and Antibacterial Activity
148
6.3.2 Investigation of the Antibacterial Activity of Ganoderma H1
Organic Extracts The Australian Ganoderma isolate H1 was further cultivated in different nutrient media.
Successive Soxhlet extractions were performed and the extracts were examined for
antibacterial activity against a range of bacteria. The nutrient media chosen for the
cultivation of Ganoderma H1 were two commercial based products, PDB and MEB,
and a defined medium, Basal-G. The investigation of mycelial growth in the three
media is reported in Chapter 5, and it was found that Basal-G medium supported the
maximum production of mycelial biomass for Ganoderma H1 (Section 5.3.2.3). It has
been reported that a linear relationship does not necessarily exist between maximum
biomass production and maximum biological activity (Lee et al., 1999). Therefore,
although the Basal-G medium resulted in the greatest growth of mycelial biomass
(Figures 5.4 and 5.5) it may not necessarily provide the greatest production of bioactive
compounds. For this reason, extracts from the mycelial biomass grown in different
cultivation media were investigated for antibacterial activity. For ease of discussion, a
crude organic extract sample that has been extracted using “solvent X” from the fungus
cultivated in “medium Y” has been denoted as “X(Y)”.
6.3.2.1 Organic Extraction of the Mycelium Cultivated in Three Different
Growth Media
The Australian Ganoderma isolate H1 was cultivated for 30 days in MEB, PDB and
Basal-G growth media (Sections 3.8.2 and 3.10.1). The mycelial biomass was
harvested (Section 3.10.3) and freeze dried (Section 3.3). The biomass was then
subjected to successive Soxhlet extractions (Section 3.11.2) using organic solvents in
the order of HEX, DCM, EtOAc and MeOH. The resulting solvent obtained from each
extraction was evaporated to dryness and the mass and appearance/consistency of the
crude extract noted. Representative extracts from the Basal-G medium are presented in
Figure 6.4, which show the difference in extract colour.
During the preparation of extracts, an insoluble layer formed at the bottom of the HEX,
EtOAc and MeOH extract, and as a top layer on the DCM extract (Figure 6.4a). These
layers were removed, prepared as separate extracts and tested against a suite of bacteria
for antibacterial activity. No antibacterial activity was observed (results not shown).

Chapter 6 – Mycelial Extraction and Antibacterial Activity
149
The soluble fraction, presented in Figure 6.4b as a 20% (v/v) solution, is the crude
extract referred to throughout this investigation.
Figure 6.4. Ganoderma H1 crude organic extracts, extracted from mycelium that had been cultivated in Basal-G growth medium for a period of 30 days. For each photo the extracts are from left to right: HEX, DCM, EtOAc and MeOH. (a) The extracts were prepared as a 20% (w/v) solution, into the same solvent used for the extraction process. A precipitate was observed for all extracts at the bottom of the vial, except for the DCM extract, which gave an oily/milky top layer on resuspension. (b) The soluble fractions of the samples from (a) were separated from the precipitate, concentrated to a solid and then prepared in the same solvent, 20% (w/v).
Table 6.6 Organic extract yield of Ganoderma H1 grown in different cultivation media
Organic Extracts from Ganoderma H1 a Extraction Solvent
Basal-G (mg g-1) PDB (mg g-1) MEB (mg g-1) HEX 41 ± 9b 17 ± 1 54 ± 9 DCM 18 ± 7 25 ± 9 45 ± 3 EtOAc 20 ± 4 7 ± 1 13 ± 3 MeOH 264 ± 26 326 ± 17 197 ± 54 Total crude extractc 344 ± 26 375 ± 17 309 ± 54
a Ganoderma H1 was cultivated in MEB, PDB and Basal-G at 30ºC for 30 days in shaker flasks; b The crude extract yield was calculated in mg of extract per gram of mycelium and is an average result of thirty extractions for HEX, DCM and EtOAc and five extractions for MEOH; c Total crude extract was calculated by the addition of successive extract masses (HEX, DCM, EtOAc, MeOH), from mycelium that had been cultivated in the same growth medium.
The yield of crude extracts from the mycelium of Ganoderma H1 grown in MEB, PDB
and Basal-G media are summarised in Table 6.6. The total amount of extractable
organic compounds (using the solvents HEX, DCM, EtOAc and MeOH), when grown
in PDB (375 mg g-1) and Basal-G medium (344 mg g-1) was found to be higher than that
when grown in MEB (308.8 mg g-1). This demonstrated that different growth media
could alter the production of extractable metabolites produced by Ganoderma H1. This
a. b.

Chapter 6 – Mycelial Extraction and Antibacterial Activity
150
was a similar observation to that reported in the previous Chapter 6, whereby the
different medium affected the production of mycelial biomass (Section 5.3.2.3). A
recent report has also shown that by manipulating the cultivation media, production of
the bioactive metabolite may be increased or decreased (Fang & Zhong, 2002c).
A range in yield was also observed for extracts from the same solvent, for the different
cultivation media (Table 6.6). This again highlighted the effect that different media can
have on the production of metabolites, suggesting that different concentrations of
metabolites were produced in the mycelium grown in different media. Comparing all
extracts, the results show that the MeOH extraction gave the largest yield of extract,
ranging from 197 ± 54 to 326 ± 17 mg g-1 for Ganoderma H1 cultivated in MEB and
PDB respectively (Table 6.6). However, there was little or no antibacterial activity
observed for any of the MeOH extracts when both preliminary testing (Table 6.5) and
further testing (Table 6.8) was performed. Of interest were the HEX, DCM and EtOAc
extracts, which exhibited antibacterial activity against a range of Gram positive
indicator organisms (Table 6.5). These extracts gave relatively low yields of extract
compared to the MeOH extraction, but were comparable to those who have used a
similar extraction system for Ganoderma isolates (Mothana et al., 2000; Smania et al.,
1999).
The extracts obtained from each medium ranged in colour and texture from a yellow
oily substance (HEX) to a dark red solid (MeOH) (Table 6.7). One difference noted
was that the HEX extract from the mycelium grown in PDB was much lighter in colour
than all the other HEX extracts.
Table 6.7 The appearance and consistency of organic extracts from Ganoderma H1 grown in different media
Organic Extracts from Ganoderma H1a Basal-G PDB MEB
Extraction Solvent
Appearance; Consistency Appearance; Consistency Appearance; Consistency HEX Orange; oily Yellow; Oily Orange; Oily DCM Dark orange; Solid Orange; Solid Orange: Solid EtOAc Dark orange; Solid Orange; Solid Orange; Solid MeOH Dark red; Solid Dark red; Solid Brown/red; Solid
a Ganoderma isolates were cultivated for 30 days in 1 L shaker flasks.

Chapter 6 – Mycelial Extraction and Antibacterial Activity
151
6.3.2.2 Antibacterial Activity of the Organic Extracts from the Mycelium
Grown in Different Cultivation Media
The organic extracts of Ganoderma H1 (Table 6.6) were assessed for their antibacterial
activity using the disc diffusion assay (Section 3.13.1). Prior to analysis, the amount of
extract to be applied to the discs was determined by a small optimisation experiment
(results not shown). This was performed to identify a suitable amount of extract that
would provide zones of inhibition that could be measured. Figure 6.5 displays two
examples of results obtained from the disc diffusion assay. Zones of complete
inhibition are exhibited by the EtOAc(PDB) and DCM(PDB) extracts against S. aureus
and B. cereus, respectively, and can be clearly identified surrounding each disc.
Table 6.8 displays the zones of inhibition measured for the different extracts against a
range of test bacteria. The HEX, DCM and EtOAc extracts exhibited inhibitory activity
against a range of Gram positive bacteria, whilst the MeOH extracts only displayed
incomplete inhibition and only slight inhibition against the Gram positive bacteria, E.
faecalis and S. pyogenes, respectively. The antibacterial activity of the HEX, DCM and
EtOAc extracts was not extended to activity against M. luteus. This result was thought
to be unusual, as the bacterium M. luteus is a highly sensitive microbe and is among the
most susceptible of the Gram positive bacteria (personal communication, Prof. Warren
Baker, SUT, Hawthorn, VIC, Australia). This was the case observed by Yoon et al.
(1994) who found that aqueous extracts from G. lucidum exhibited antibacterial activity
against a range of Gram positive bacteria and the greatest activity was seen towards M.
luteus.
Figure 6.5. Representative photos of the disc diffusion assay showing: (a) complete inhibition of Staphylococcus aureus by the EtOAc(PDB) extract (8 mm zone), and; (b) complete inhibition of the Bacillus cereus by the DCM(PDB) extract (7 mm zone).
b. a.
8 mm 7 mm

Chapter 6 – Mycelial Extraction and Antibacterial Activity
152
Table 6.8 The antibacterial activity of the crude organic extracts from the mycelium of Ganoderma H1 against a
range of bacteria
a Activity was determined by disc diffusion assays. 6000 µg of extract was applied to each disc. A zone of inhibition > 6 mm was considered positive; s a very slight zone of inhibition observed; [ ] incomplete inhibition was observed (i.e.; reduced growth, but not complete elimination of growth); # a double zone of inhibition was observed. The larger second zone, was a zone of incomplete inhibition, indicated by the value in parentheses [ ]; - no inhibition was observed; NT not tested; Negative solvent blanks were also tested. These showed no inhibition (results not shown); Positive blanks of either, Ampicillin, Tetracycline, Chloramphenicol or Streptomycin, were also tested (results not shown); * blank was recorded to be 6.5 mm; Numbers are the average of triplicate discs and triplicate experiments performed on different days; b Clinical MRSA, methicillin resistant Staphylococcus aureus isolates; c Clinical vancomycin resistant Enterococcus isolates; Crude extracts were from fungi grown in Basal-G, MEB and PDB for 30 days.
Antibacterial Activity of Ganoderma H1 Organic Extractsa HEX DCM
Test Bacteria Basal-G MEB PDB Basal-G MEB PDB Bacillus cereus [8] 7 - 7 7[8] # 7
Bacillus subtilis 7 7 - 7 7 7
Enterococcus faecalis [8] s s 7 s s
Streptococcus pyogenes 8[10] # 8[10] # 8 7 7 7
Staphylococcus aureus (SUT)
[8]* [7]* [7]* 9[10]# [8] 9[10] #
Staphylococcus aureus (25923)
7 - - 7 - [7]
Staphylococcus epidermidis
- NT NT 9[12] NT NT
Listeria monocytogenes [13] NT NT 7[8] NT NT
Gra
m p
ositi
ve
Micrococcus luteus - - - - - -
Escherichia coli - - - - - -
Klebsiella pneumoniae - - - - - -
Gra
m
nega
tive
Proteus vulgaris - - - - - -
S. aureus (M67638) - NT NT [8] [7] [15]
S. aureus (M67783) - NT NT [9] - [14]
S. aureus (M99320) - NT NT [9] - [16]
S. aureus (M173525) - NT NT [8] - [12]
S. aureus (M180920) - NT NT [9] - [16]
Clin
ical
MR
SA b
S. aureus (M183909) - NT NT [16] - [18]
E. faecalis (M259849) - - - - - -
E. faecalis (M233165) - - - - - -
E. faecalis (M252807) - - - - - -
E. faecalis (M193292) - - - - - -
E. faecalis (M169600) - - - - - - Clin
ical
VR
E c
E. faecalis (M255048) - - - - - -
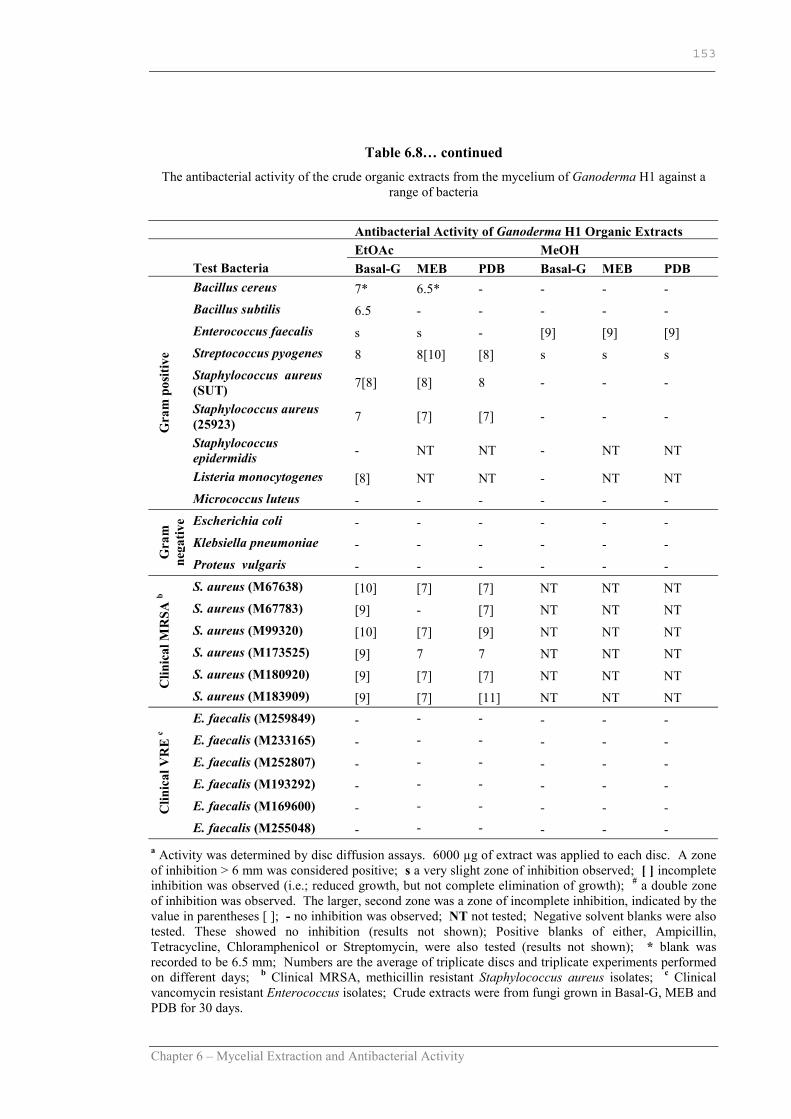
Chapter 6 – Mycelial Extraction and Antibacterial Activity
153
Table 6.8… continued The antibacterial activity of the crude organic extracts from the mycelium of Ganoderma H1 against a
range of bacteria
a Activity was determined by disc diffusion assays. 6000 µg of extract was applied to each disc. A zone of inhibition > 6 mm was considered positive; s a very slight zone of inhibition observed; [ ] incomplete inhibition was observed (i.e.; reduced growth, but not complete elimination of growth); # a double zone of inhibition was observed. The larger, second zone was a zone of incomplete inhibition, indicated by the value in parentheses [ ]; - no inhibition was observed; NT not tested; Negative solvent blanks were also tested. These showed no inhibition (results not shown); Positive blanks of either, Ampicillin, Tetracycline, Chloramphenicol or Streptomycin, were also tested (results not shown); * blank was recorded to be 6.5 mm; Numbers are the average of triplicate discs and triplicate experiments performed on different days; b Clinical MRSA, methicillin resistant Staphylococcus aureus isolates; c Clinical vancomycin resistant Enterococcus isolates; Crude extracts were from fungi grown in Basal-G, MEB and PDB for 30 days.
Antibacterial Activity of Ganoderma H1 Organic Extracts EtOAc MeOH Test Bacteria Basal-G MEB PDB Basal-G MEB PDB
Bacillus cereus 7* 6.5* - - - - Bacillus subtilis 6.5 - - - - - Enterococcus faecalis s s - [9] [9] [9] Streptococcus pyogenes 8 8[10] [8] s s s Staphylococcus aureus (SUT) 7[8] [8] 8 - - -
Staphylococcus aureus (25923) 7 [7] [7] - - -
Staphylococcus epidermidis - NT NT - NT NT
Listeria monocytogenes [8] NT NT - NT NT
Gra
m p
ositi
ve
Micrococcus luteus - - - - - - Escherichia coli - - - - - - Klebsiella pneumoniae - - - - - -
Gra
m
nega
tive
Proteus vulgaris - - - - - - S. aureus (M67638) [10] [7] [7] NT NT NT S. aureus (M67783) [9] - [7] NT NT NT S. aureus (M99320) [10] [7] [9] NT NT NT S. aureus (M173525) [9] 7 7 NT NT NT S. aureus (M180920) [9] [7] [7] NT NT NT C
linic
al M
RSA
b
S. aureus (M183909) [9] [7] [11] NT NT NT E. faecalis (M259849) - - - - - - E. faecalis (M233165) - - - - - - E. faecalis (M252807) - - - - - - E. faecalis (M193292) - - - - - - E. faecalis (M169600) - - - - - - C
linic
al V
RE
c
E. faecalis (M255048) - - - - - -
Chapter 6 – Mycelial Extraction and Antibacterial Activity
154
All the crude extracts from the mycelium of Ganoderma H1, cultivated in MEB, PDB
and Basal-G growth medium, displayed no inhibitory activity against the Gram negative
bacteria tested (Table 6.8). This was expected because there was no inhibitory activity
observed from the organic extracts in the preliminary investigation (Table 6.5). Extracts
from G. applanatum (Smania et al., 1999) and G. pfeifferi (Mothana et al., 2000) have
been shown to possess antibacterial activity against the Gram negative bacterial species,
E. coli. However, the extraction methods were different in either cases and biological
compounds found in the species G. applanatum and G. pfeifferi may not necessarily be
the same as those found in Ganoderma H1 (i.e. G. cupreum as determined in Chapter
4). In addition, the greater resistance of Gram negative bacteria is well documented and
similar observations have been reported in analysis of extracts from other fungal species
(Beltran-Garcia et al., 1997; Ishikawa et al., 2001; Smania et al., 1999). This greater
resistance by the Gram negative bacteria is reported to be because of the characteristics
of the outer membrane, which acts as a barrier to environmental substances, including
antibiotics (Tortora et al., 2001).
The overall activity of the different extracts (Table 6.8) shows that the DCM extracts
displayed antibacterial activity against the greatest range of bacteria. Strong
antibacterial activity of DCM extracts from other fungi has been reported. The
DCM(MEB), DCM(PDB) and DCM(Basal-G) extracts showed growth inhibition
against five or more aerobic bacteria, whilst extracts from within the HEX and EtOAc
group, namely HEX(PDB) and EtOAc(PDB), showed a lesser range of antibacterial
activity. Chlorinated extracts from different G. lucidum isolates have been investigated
and have been shown to possess biologically active compounds that can positively
affect the immune system (Koyama et al., 1997; Min et al., 2001). With specific
regards to antibacterial activity, there have also been reports of chlorinated extracts
from Ganoderma species (Mothana et al., 2000; Smania et al., 1999) and other
Basidiomycetous fungi (Beltran-Garcia et al., 1997; Hirasawa et al., 1999) that have
been shown to possess antibacterial activity. The antibacterial activity of the organic
extracts from the Ganoderma H1 is the first account of an Australian Ganoderma
isolate with antibacterial activity. In addition, it is the first report of the antibacterial
activity from this particular Ganoderma species (G. cupreum).

Chapter 6 – Mycelial Extraction and Antibacterial Activity
155
6.3.2.3 Antibacterial Activity of the Organic Extracts Against Clinical MRSA
and VRE Isolates
The HEX, DCM, EtOAc and MeOH extracts that exhibited activity against the growth
of the pathogenic organisms E. faecalis and S. aureus (Table 6.8), were further
investigated for their abilities to inhibit clinical isolates of vancomycin resistant
enterococci (VRE) and methicillin resistant Staphylococcus aureus (MRSA). The
results of the assay are also presented in Table 6.8. Two representative photos of the
disc diffusion assay showing zones of inhibition, one of complete and the other of
incomplete inhibition, are given in Figure 6.6.
Further examination of the organic extracts that inhibited E. faecalis against clinical
VRE indicated no inhibitory effects (Table 6.8). It was expected that the HEX(Basal-G)
and DCM(Basal-G) extracts were to exhibit some antibacterial activity towards the
VRE’s, as these two extracts exhibited zones of inhibition towards E. faecalis, whilst
the other extracts only showed slight inhibitory activity. However, there was no activity
observed. There have been no reports in the literature on the activity of Ganoderma
against enterococci, so no comparisons can be made.
Figure 6.6. Representative photos of the disc diffusion assay showing incomplete inhibition and a weak incomplete inhibition towards an MRSA isolate. (a) DCM (PDB) extract exhibiting strong incomplete inhibition against MRSA (M183909), and (b) DCM (Basal-G) extract exhibiting weak incomplete inhibition against MRSA (M183909).
Table 6.8 displays the sizes of the zones of inhibition of the extracts that had activity
towards the two strains of S. aureus examined. EtOAc(PDB) was the only extract to
exhibit a complete zone of inhibition against S. aureus (SUT). The other extracts tested
were observed to exhibit incomplete inhibition towards the same bacterium, with the
a. b.
18 mm 16 mm

Chapter 6 – Mycelial Extraction and Antibacterial Activity
156
exception of EtOAc(Basal-G), DCM(Basal-G) and DCM(PDB), which exhibited double
zones of inhibition. The double zones of inhibition consisted of a smaller zone of
complete inhibition and a second, larger zone of incomplete inhibition. The extracts
tested from the Basal-G medium (HEX, DCM and EtOAc) all exhibited complete zones
of inhibition against a different Staphylococcus isolate (S. aureus 25923). However, the
same solvent extracts from different media (MEB and PDB) did not inhibit this
bacterium. Further testing of the MeOH extracts against the MRSA isolates were not
performed, as there was no inhibitory activity observed for any of the MeOH extracts
towards either of the S. aureus strains.
The DCM(Basal-G), DCM(PDB), EtOAc(Basal-G) and EtOAc(PDB) extracts displayed
activity toward all six MRSA isolates, whilst the DCM(MEB) and EtOAc(MEB)
extracts exhibited activity towards only one isolate and five isolates, respectively. The
DCM(PDB) extracts displayed larger zones of incomplete inhibition than those of
DCM(Basal-G) extracts against all MRSA strains. This comparison of incomplete
inhibition is shown in Figure 6.6b. In contrast, the EtOAc(Basal-G) gave larger zones
of incomplete inhibition than the EtOAc(PDB) extracts against all MRSA. Overall, the
extracts from the mycelium grown in MEB were observed to be the least effective
against the MRSA isolates.
The extracts from the mycelium of Ganoderma H1 cultivated in both Basal-G and PDB
growth media appeared to have an inhibitory effect against the clinical MRSA isolates,
although the incomplete inhibition observed indicated that, at the concentration used the
crude extracts were bacteriostatic and not bactericidal against the MRSA isolates. To
confirm this, further evaluation via a different method would need to be conducted.
Additional testing of the extracts against the MRSA isolates was not performed, as only
bacteria that showed strong sensitivity (complete zones of inhibition) were chosen for
further analysis. Nevertheless, on review of the literature there appear to be no such
investigations reported on the antibacterial effect of Ganoderma extracts against MRSA
species and therefore, the findings here are the first report of the antibacterial activity of
a Ganoderma species against clinical MRSA isolates.

Chapter 6 – Mycelial Extraction and Antibacterial Activity
157
6.3.2.4 Comparison of Crude Extracts from the Liquid Cultivated Mycelium of
Ganoderma H1
To further explore the antibacterial activities of the crude extracts, a sufficient quantity
of mycelial biomass was required to enable maximum extraction of the crude extracts.
Therefore, a culture medium was required that could produce large amounts of
mycelium with bioactivity. Basal-G medium was identified as the medium that could
produce the largest amount of mycelial biomass in 30 days (Sections 5.3.2.3 and
5.3.2.4). In addition, Basal-G was also identified as the growth medium that produced
mycelium that contained bioactivity towards a number of test organisms (Table 6.8).
As a result, Basal-G was chosen as the growth medium for the further cultivation and
investigation of the mycelium from Ganoderma H1.
As mentioned previously, the DCM extracts exhibited strong antibacterial activity
against a range of Gram positive bacteria (Table 6.8) and therefore, the DCM extract
was of particular interest for further investigation. Previous observations (Section
6.3.2.1, Table 6.6) showed that the yield of extract for DCM(Basal-G) (18 ± 7 mg g-1)
was lower than that for the other two extracts, DCM(PDB) (25 ± 9 mg g-1) and
DCM(MEB) (45 ± 3 mg g-1) (Table 6.6). However, when considering the mycelial
biomass production of Ganoderma H1 in the three media (Section 5.3.2.3, Figure 5.4),
the quantity of mycelial biomass produced in the Basal-G medium was triple the
amount of biomass when cultivated in PDB or MEB. Therefore, taking into account the
amount of DCM extract from the mycelial biomass produced in a 250 mL shaker flask,
the overall mass of the DCM(Basal-G) extract would be greater than that of the
DCM(PDB) and DCM(MEB) extracts (20.70, 8.5 and 18.90 mg per 250 mL,
respectively) (Table 6.9). Thus, Basal-G was chosen as the growth medium for further
analysis of Ganoderma H1.
Table 6.9 shows the average mass of extract obtainable in a 250 mL shaker flask.
Mycelium grown in the Basal-G growth medium enables a larger mass of extract to be
obtained for the DCM, EtOAc, and MeOH extracts, than when grown in MEB or PDB.
The overall extract mass of the HEX(Basal-G) extract (47.15 mg) was greater than that
of the HEX(PDB) (5.78 mg) extract, but not that of the HEX(MEB) (54.42 mg).
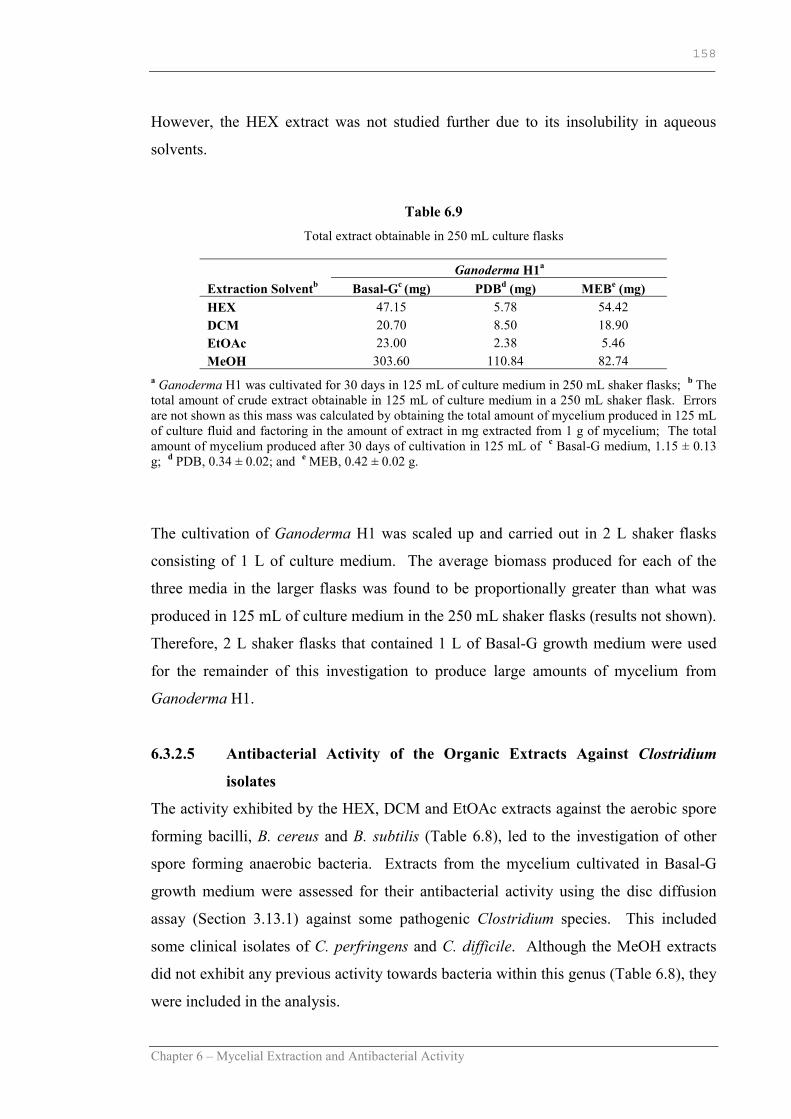
Chapter 6 – Mycelial Extraction and Antibacterial Activity
158
However, the HEX extract was not studied further due to its insolubility in aqueous
solvents.
Table 6.9 Total extract obtainable in 250 mL culture flasks
Ganoderma H1a Extraction Solventb Basal-Gc (mg) PDBd (mg) MEBe (mg) HEX 47.15 5.78 54.42 DCM 20.70 8.50 18.90 EtOAc 23.00 2.38 5.46 MeOH 303.60 110.84 82.74
a Ganoderma H1 was cultivated for 30 days in 125 mL of culture medium in 250 mL shaker flasks; b The total amount of crude extract obtainable in 125 mL of culture medium in a 250 mL shaker flask. Errors are not shown as this mass was calculated by obtaining the total amount of mycelium produced in 125 mL of culture fluid and factoring in the amount of extract in mg extracted from 1 g of mycelium; The total amount of mycelium produced after 30 days of cultivation in 125 mL of c Basal-G medium, 1.15 ± 0.13 g; d PDB, 0.34 ± 0.02; and e MEB, 0.42 ± 0.02 g.
The cultivation of Ganoderma H1 was scaled up and carried out in 2 L shaker flasks
consisting of 1 L of culture medium. The average biomass produced for each of the
three media in the larger flasks was found to be proportionally greater than what was
produced in 125 mL of culture medium in the 250 mL shaker flasks (results not shown).
Therefore, 2 L shaker flasks that contained 1 L of Basal-G growth medium were used
for the remainder of this investigation to produce large amounts of mycelium from
Ganoderma H1.
6.3.2.5 Antibacterial Activity of the Organic Extracts Against Clostridium
isolates
The activity exhibited by the HEX, DCM and EtOAc extracts against the aerobic spore
forming bacilli, B. cereus and B. subtilis (Table 6.8), led to the investigation of other
spore forming anaerobic bacteria. Extracts from the mycelium cultivated in Basal-G
growth medium were assessed for their antibacterial activity using the disc diffusion
assay (Section 3.13.1) against some pathogenic Clostridium species. This included
some clinical isolates of C. perfringens and C. difficile. Although the MeOH extracts
did not exhibit any previous activity towards bacteria within this genus (Table 6.8), they
were included in the analysis.
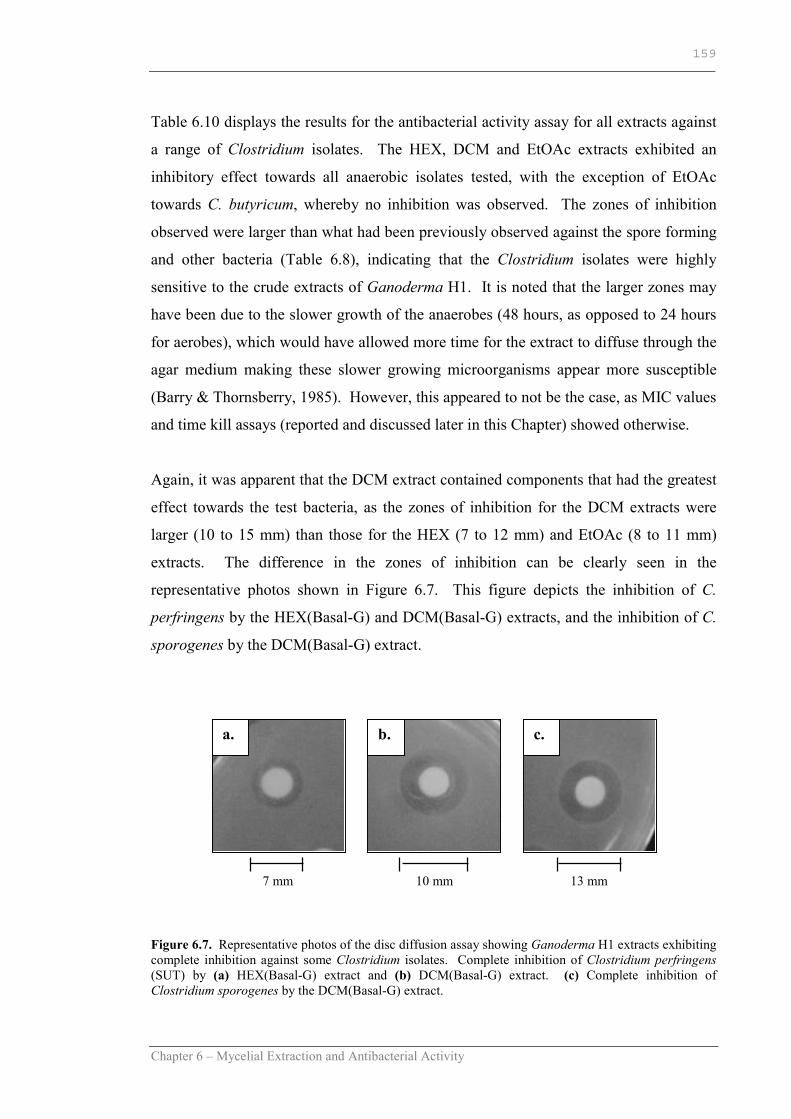
Chapter 6 – Mycelial Extraction and Antibacterial Activity
159
Table 6.10 displays the results for the antibacterial activity assay for all extracts against
a range of Clostridium isolates. The HEX, DCM and EtOAc extracts exhibited an
inhibitory effect towards all anaerobic isolates tested, with the exception of EtOAc
towards C. butyricum, whereby no inhibition was observed. The zones of inhibition
observed were larger than what had been previously observed against the spore forming
and other bacteria (Table 6.8), indicating that the Clostridium isolates were highly
sensitive to the crude extracts of Ganoderma H1. It is noted that the larger zones may
have been due to the slower growth of the anaerobes (48 hours, as opposed to 24 hours
for aerobes), which would have allowed more time for the extract to diffuse through the
agar medium making these slower growing microorganisms appear more susceptible
(Barry & Thornsberry, 1985). However, this appeared to not be the case, as MIC values
and time kill assays (reported and discussed later in this Chapter) showed otherwise.
Again, it was apparent that the DCM extract contained components that had the greatest
effect towards the test bacteria, as the zones of inhibition for the DCM extracts were
larger (10 to 15 mm) than those for the HEX (7 to 12 mm) and EtOAc (8 to 11 mm)
extracts. The difference in the zones of inhibition can be clearly seen in the
representative photos shown in Figure 6.7. This figure depicts the inhibition of C.
perfringens by the HEX(Basal-G) and DCM(Basal-G) extracts, and the inhibition of C.
sporogenes by the DCM(Basal-G) extract.
Figure 6.7. Representative photos of the disc diffusion assay showing Ganoderma H1 extracts exhibiting complete inhibition against some Clostridium isolates. Complete inhibition of Clostridium perfringens (SUT) by (a) HEX(Basal-G) extract and (b) DCM(Basal-G) extract. (c) Complete inhibition of Clostridium sporogenes by the DCM(Basal-G) extract.
13 mm
c. a. b.
7 mm 10 mm

Chapter 6 – Mycelial Extraction and Antibacterial Activity
160
Table 6.10 Antibacterial activity of Ganoderma H1 organic extracts against some anaerobic Clostridium bacteria
Zones of Inhibition Exhibited by the Crude Extracts
from Ganoderma H1a Test Bacteria HEX DCM EtOAc MeOH C. butyricum 7 10 - - C. sporogenes 10 13 10* - C. perfringens (SUT) 7 10 8 - C. perfringens (cp8)# 11 11 11 8 C. perfringens (cp9) # 9 11 10 8 C. difficile (cd1) # 12 15 11 - C. difficile (cd8) # 12* 15* 11 - C. difficile (cd14) # 11 14 11 -
a Crude organic extracts from the mycelium of Ganoderma H1 that had been cultivated for 30 days in Basal-G growth medium; 6000 μg of extract was applied to each disc; Assays were performed in triplicate; The diameter of the zone of inhibition was measured in mm; * solvent blank was recorded to have a slight inhibition of 7; # clinical isolate; – no inhibition was observed.
The MeOH extracts tested displayed no inhibitory activity towards the Clostridium
isolates, with the exception of the two clinical anaerobic C. perfringens isolates (Table
6.10). This was an unexpected result because in earlier assays (Table 6.8), little or no
activity had been observed for the MeOH extracts against the aerobic bacteria tested.
On review of the literature, there appear to be no reports on the inhibitory effects of
Ganoderma extracts against Clostridium isolates and therefore, no comparisons can be
made. However, one account of the extracts from the liquid cultivated mycelium from a
different basidiomycetous species, Cordyceps militaris, has shown to have potent
growth inhibitory activities towards a number of Clostridium species (Ahn et al., 2000).
There have been studies reporting the inhibitory activity of Ganoderma extracts against
the aerobic spore forming bacilli (Smania et al., 1999), but this is the first account of the
organic extracts from a Ganoderma species possessing activity toward the anaerobic
spore former, Clostridium.

Chapter 6 – Mycelial Extraction and Antibacterial Activity
161
6.3.2.6 Minimum Inhibitory Concentration (MIC) and Minimum Bactericidal
Concentration (MBC) of the Organic Extracts
Minimum inhibitory concentration (MIC) is defined as “the lowest concentration which
results in maintenance or reduction of inoculum viability” over a 24 h period (Carson et
al., 1995), and the minimum bactericidal concentration (MBC) is defined as the lowest
concentration that kills at least 99.9% of the original inoculum (Schoenknecht et al.,
1985). In this investigation, the MIC and MBC were determined for the DCM and
EtOAc extracts on a selection of test bacteria. Although the HEX extract displayed
activity against a range of bacteria, it was not investigated further for its MIC and MBC.
This was due to insolubility of the extract in the propagation media, as well as time
limitations, which did not allow for further investigations of this nature. The MeOH
extract was not investigated further, as this extract showed little to no inhibitory activity
towards the range of bacteria tested.
The MIC and MBC were investigated using a modified micro dilution method as
described in Sections 3.13.2 and 3.13.3, respectively. A two-fold serial dilution
containing the extract and test organism was prepared and analysed in triplicate at an
optical density of 595 nm (OD595). A second two-fold serial dilution containing only
the extract served as a negative turbidity control. To determine the OD595 due to the
growth of the test organism, the OD595 readings of the control solutions were subtracted
from the corresponding OD595 readings of the sample solutions. The MIC was then
determined to be at the concentration where there was no increase in the OD595, or at the
concentration where the OD595 was zero. The MBC was determined by monitoring the
viability of bacteria in each well that exhibited no increase in OD595, after a 24 h period.
The final extract concentration at which no growth was observed was recorded as the
MBC. The MIC and MBC results are presented in Table 6.11.
The DCM extract exhibited MIC values ranging from 750 to 6000 μg mL-1 against the
aerobic bacteria tested. The MBCs for the corresponding bacteria were found to be
two-fold higher in concentration than that of the MIC. No MBC was observed for the
DCM extract against L. monocytogenes and S. epidermidis, which correlated with
previous observations of incomplete inhibition in the disc diffusion assay (Table 6.8).
The MICs of an aqueous Ganoderma extract against B. subtilis (3500 μg mL-1), B.
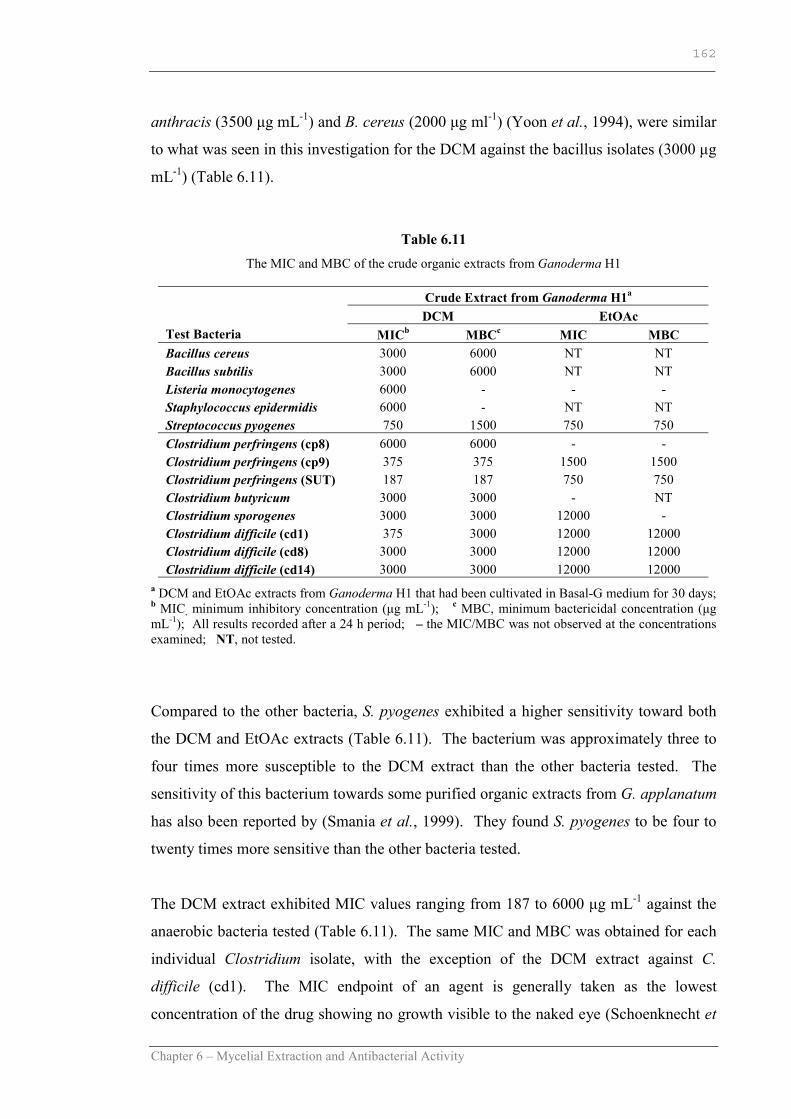
Chapter 6 – Mycelial Extraction and Antibacterial Activity
162
anthracis (3500 μg mL-1) and B. cereus (2000 μg ml-1) (Yoon et al., 1994), were similar
to what was seen in this investigation for the DCM against the bacillus isolates (3000 μg
mL-1) (Table 6.11).
Table 6.11 The MIC and MBC of the crude organic extracts from Ganoderma H1
Crude Extract from Ganoderma H1a DCM EtOAc
Test Bacteria MICb MBCc MIC MBC Bacillus cereus 3000 6000 NT NT Bacillus subtilis 3000 6000 NT NT Listeria monocytogenes 6000 - - - Staphylococcus epidermidis 6000 - NT NT Streptococcus pyogenes 750 1500 750 750 Clostridium perfringens (cp8) 6000 6000 - - Clostridium perfringens (cp9) 375 375 1500 1500 Clostridium perfringens (SUT) 187 187 750 750 Clostridium butyricum 3000 3000 - NT Clostridium sporogenes 3000 3000 12000 - Clostridium difficile (cd1) 375 3000 12000 12000 Clostridium difficile (cd8) 3000 3000 12000 12000 Clostridium difficile (cd14) 3000 3000 12000 12000
a DCM and EtOAc extracts from Ganoderma H1 that had been cultivated in Basal-G medium for 30 days; b MIC, minimum inhibitory concentration (μg mL-1); c MBC, minimum bactericidal concentration (μg mL-1); All results recorded after a 24 h period; – the MIC/MBC was not observed at the concentrations examined; NT, not tested.
Compared to the other bacteria, S. pyogenes exhibited a higher sensitivity toward both
the DCM and EtOAc extracts (Table 6.11). The bacterium was approximately three to
four times more susceptible to the DCM extract than the other bacteria tested. The
sensitivity of this bacterium towards some purified organic extracts from G. applanatum
has also been reported by (Smania et al., 1999). They found S. pyogenes to be four to
twenty times more sensitive than the other bacteria tested.
The DCM extract exhibited MIC values ranging from 187 to 6000 μg mL-1 against the
anaerobic bacteria tested (Table 6.11). The same MIC and MBC was obtained for each
individual Clostridium isolate, with the exception of the DCM extract against C.
difficile (cd1). The MIC endpoint of an agent is generally taken as the lowest
concentration of the drug showing no growth visible to the naked eye (Schoenknecht et

Chapter 6 – Mycelial Extraction and Antibacterial Activity
163
al., 1985). However, subculture can often show that some bacteria will be recoverable
at the MIC and only at a greater concentration will death have occurred (as was the case
for the DCM extract against the aerobes). This was not the case for the extract against
the Clostridium isolates, as at the MIC, 99.9% reduction of the inoculum was observed,
which is therefore, recorded as the MBC. This suggested that the extract had a strong
bactericidal effect towards these bacteria (at the MIC/MBC). However, at
concentrations lower than the MBC, a decreased inhibitory effect of the DCM extract
was observed (discussed in the latter part of this section). Overall, the DCM extract was
observed to have a stronger inhibitory effect against the anaerobic bacteria, as the MIC
and MBC were less than those for the aerobic bacteria. This was also evident in the
disc diffusion assays, whereby the largest zones of inhibition were observed against the
Clostridium isolates (Table 6.11).
The EtOAc extract exhibited MIC values ranging from 750 to 12000 μg mL-1 against
the range of bacteria tested (Table 6.11). For the different concentrations examined,
there was no MIC determined for the EtOAc extract against C. butyricum, L.
monocytogenes and C. perfringens (cp8) (Table 6.11). Previous assays, using the disc
diffusion method, also showed no inhibitory activity towards C. butyricum (Table 6.10).
However, previous assays showed that the EtOAc extract exhibited incomplete
inhibition against L. monocytogenes (Table 6.8) and complete inhibition against C.
perfringens (cp8) (Table 6.10).
Graphical presentation of the MIC assays, which displays the concentration response of
the DCM extract and EtOAc extract against the bacteria, are shown in Figure 6.8
((DCM) Figure 6.8 a,b,c,e,f,h,j,l,n,p,r,t,v and (EtOAc) Figure 6.8 d,g,i,l,k,m,o,q,s,u,w).
The graphs show the inhibitory activity of the extracts at concentrations below the MIC.
In addition, the graphs demonstrate that an extract may still have an inhibitory effect,
even if there was no MIC observed against a bacterium.

Chapter 6 – Mycelial Extraction and Antibacterial Activity
164
Figure 6.8a-e. MIC concentration response graphs of the organic extracts (DCM and EtOAc) from the mycelium of Ganoderma H1. (█) DCM extract against: (a) Bacillus cereus, (b) Bacillus subtilis, (c) Listeria monocytogenes and (e) Staphylococcus epidermidis, and (█) EtOAc extract against: (d) Listeria monocytogenes. Percent inhibition was calculated by comparing OD595 of the growth of the test organism with and without extract after a 24, 48 or 72 hour period. The MIC100 can be seen at 100% inhibition, and is marked on the graphs. MBCs are not shown, or calculated for the extracts.
12 23 47 94 188 375 7501500
30006000
120000
102030405060708090
100e. S. epidermidis
12 23 47 94 188 375 7501500
30006000
120000
102030405060708090
100
12 23 47 94 188 375 7501500
30006000
12000
12 23 47 94 188 375 7501500
30006000
120000
102030405060708090
100
12 23 47 94 188 375 7501500
30006000
12000
b. B. subtilis a. B. cereus
d. L. monocytogenes c. L. monocytogenes
Concentration (μg mL-1)
Concentration (μg mL-1)
Inhi
bitio
n (%
) In
hibi
tion
(%)
No MIC
MIC
MIC
M
IC
Inhi
bitio
n (%
)
MIC

Chapter 6 – Mycelial Extraction and Antibacterial Activity
165
Figure 6.8 (f-k). MIC concentration response graphs of the organic extracts (DCM and EtOAc) from the mycelium of Ganoderma H1. (█) DCM extract against: (f) Streptococcus pyogenes, (h) Clostridium perfringens (cp8), (j) Clostridium perfringens (cp9), and (█) EtOAc extract against: (g) Streptococcus pyogenes, (i) Clostridium perfringens (cp8), (k) Clostridium perfringens (cp9). Percent inhibition was calculated by comparing OD595 of the growth of the test organism with and without extract after a 24, 48 or 72 hour period. The MIC100 can be seen at 100% inhibition, and is marked on the graphs. MBCs are not shown, or calculated for the extracts
Concentration (μg mL-1) Concentration (μg mL-1)
12 23 47 94 188 375 7501500
30006000
120000
102030405060708090
100
12 23 47 94 188 375 7501500
30006000
12000
k. C. perfringens (cp9) j. C. perfringens (cp9)
12 23 47 94 188 375 7501500
30006000
120000
102030405060708090
100
12 23 47 94 188 375 7501500
30006000
12000
i. C. perfringens (cp8) h. C. perfringens (cp8)
12 23 47 94 188 375 7501500
30006000
120000
102030405060708090
100
12 23 47 94 188 375 7501500
30006000
12000
g. S. pyogenes f. S. pyogenes
No MIC
MIC
MIC
MIC
MIC
MIC
Inhi
bitio
n (%
) In
hibi
tion
(%)
Inhi
bitio
n (%
)
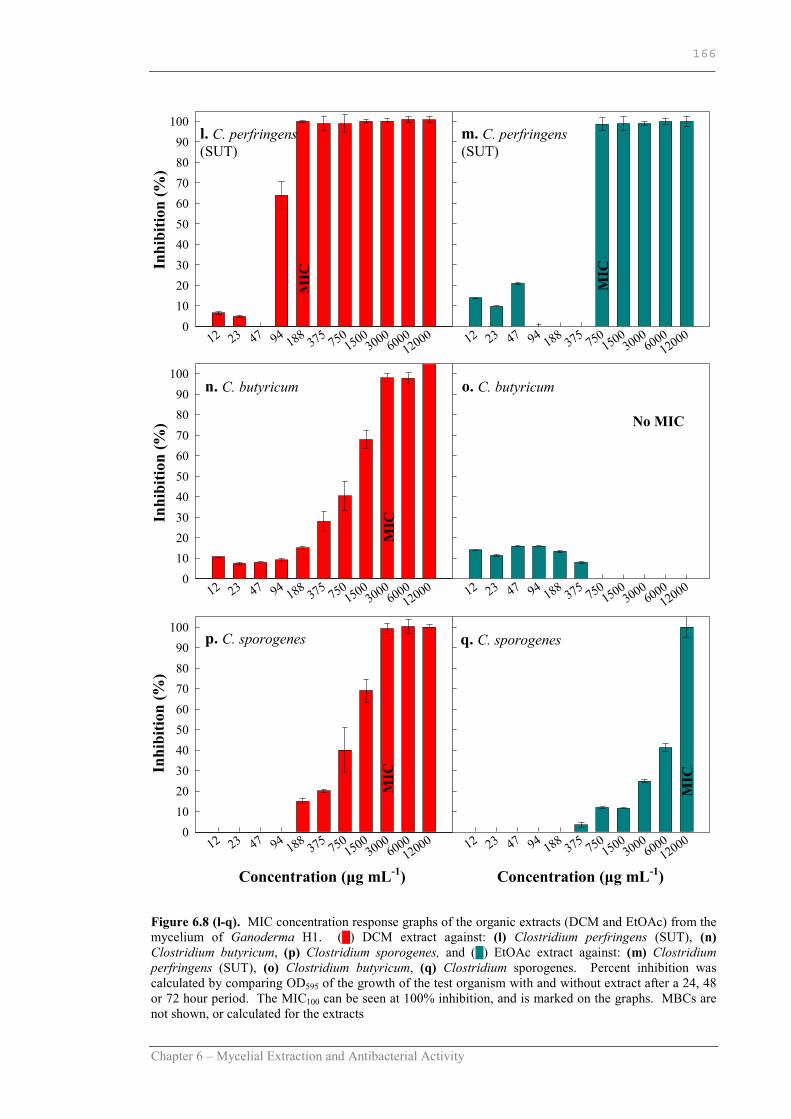
Chapter 6 – Mycelial Extraction and Antibacterial Activity
166
Figure 6.8 (l-q). MIC concentration response graphs of the organic extracts (DCM and EtOAc) from the mycelium of Ganoderma H1. (█) DCM extract against: (l) Clostridium perfringens (SUT), (n) Clostridium butyricum, (p) Clostridium sporogenes, and (█) EtOAc extract against: (m) Clostridium perfringens (SUT), (o) Clostridium butyricum, (q) Clostridium sporogenes. Percent inhibition was calculated by comparing OD595 of the growth of the test organism with and without extract after a 24, 48 or 72 hour period. The MIC100 can be seen at 100% inhibition, and is marked on the graphs. MBCs are not shown, or calculated for the extracts
12 23 47 94 188 375 7501500
30006000
120000
102030405060708090
100
12 23 47 94 188 375 7501500
30006000
12000
q. C. sporogenes p. C. sporogenes
12 23 47 94 188 375 7501500
30006000
120000
102030405060708090
100
12 23 47 94 188 375 7501500
30006000
12000
o. C. butyricum n. C. butyricum
12 23 47 94 188 375 7501500
30006000
120000
102030405060708090
100
12 23 47 94 188 375 7501500
30006000
12000
l. C. perfringens (SUT)
m. C. perfringens (SUT)
Concentration (μg mL-1) Concentration (μg mL-1)
Inhi
bitio
n (%
) In
hibi
tion
(%)
No MIC
MIC
MIC
MIC
Inhi
bitio
n (%
)
MIC
MIC

Chapter 6 – Mycelial Extraction and Antibacterial Activity
167
Figure 6.8 (r-w). MIC concentration response graphs of the organic extracts (DCM and EtOAc) from the mycelium of Ganoderma H1. (█) DCM extract against: (r) Clostridium difficile (cd1), (t) Clostridium difficile (cd8), (v) Clostridium difficile (cd14), and (█) EtOAc extract against: (s) Clostridium difficile (cd1), (u) Clostridium difficile (cd8), (w) Clostridium difficile (cd14). The percent inhibition was calculated by comparing OD595 of the growth of the test organism with and without extract after a 24, 48 or 72 hour period. The MIC100 can be seen at 100% inhibition, and is marked on the graphs. MBCs are not shown, or calculated for the extracts
12 23 47 94 188 375 7501500
30006000
120000
102030405060708090
100
12 23 47 94 188 375 7501500
30006000
12000
v. C. difficile (cd14) w. C. difficile (cd14)
12 23 47 94 188 375 7501500
30006000
120000
102030405060708090
100
12 23 47 94 188 375 7501500
30006000
12000
u. C. difficile (cd8) t. C. difficile (cd8)
12 23 47 94 188 375 7501500
30006000
120000
102030405060708090
100
12 23 47 94 188 375 7501500
30006000
12000
s. C. difficile (cd1) r. C. difficile (cd1)
Concentration (μg mL-1) Concentration (μg mL-1)
Inhi
bitio
n (%
) In
hibi
tion
(%)
MIC
MIC
MIC
Inhi
bitio
n (%
)
MIC
MIC

Chapter 6 – Mycelial Extraction and Antibacterial Activity
168
The concentration response of the EtOAc extract toward L. monocytogenes is shown in
Figure 6.8d. At the concentrations examined, the MIC cannot be determined (MIC =
MIC100 = 100% reduction or maintenance of the inoculum). However, the graph
displays 20 to 50% inhibitory activity of L. monocytogenes at EtOAc extract
concentrations ranging from 94 to 12000 μg mL-1. It is common in the discovery and
analysis of new antibiotics to discuss the minimum inhibitory concentrations in terms of
the percent inhibition, as concentrations below the MIC can also give important
information regarding the effectiveness of the compound at different concentrations.
Two inhibitory values that are commonly cited are the MIC50 (50% inhibition) and
MIC90 (90% inhibition) (Alhambra et al., 2004; Baykam et al., 2004). Although there
was no MIC100 (100% inhibition of the growth of the inoculum, MIC100) determined for
the EtOAc extract towards L. monocytogenes, a 40 to 50% inhibitory effect was
observed over an EtOAc extract concentration range of 750 to 12000 μg mL-1. This
inhibitory effect was seen in previous results as zones of incomplete inhibition towards
L. monocytogenes (Table 6.8).
There was also no MIC100 observed for the EtOAc extract against C. perfringens (cp8)
and C. butyricum, however, varying degrees of bacterial inhibition over the range of
extract concentrations was exhibited (Figure 6.8l,o). At the highest extract
concentrations examined (12000 μg mL-1), an 80 to 90% inhibitory activity against C.
perfringens (cp8) was observed (Figure 6.8l). Since a low percentage of bacterial
growth was determined at the high extract concentrations in the MIC assay, it was
hypothesised that the bacterial growth in the disc diffusion assay was not visible to the
eye. Therefore, in the disc diffusion assay a clear zone of inhibition was observed
against C. perfringens (cp8) rather than an incomplete zone of inhibition (Table 6.10).
Subculturing the zone of inhibition onto fresh agar would have possibly confirmed the
presence of live bacteria, however, this was not performed, as it was considered not
necessary at this point in the investigation. The low inhibitory activity of the EtOAc
extract toward C. butyricum, no greater than 10% inhibition (Figure 6.8o), was seen in
the disc diffusion assay as no zones of inhibition (Table 6.10). These concentration
response curves illustrate the usefulness of using two different methods to evaluate the
antibacterial activity of an extract.

Chapter 6 – Mycelial Extraction and Antibacterial Activity
169
The DCM extract exhibited a MIC100, with a concentration dependent inhibitory
response below the MIC100, toward all the bacteria tested (Figure 6.8). In particular,
there was a clear dose dependent response of the extract toward L. monocytogenes and
S. pyogenes (Figure 6.8c,e). The inhibition of L. monocytogenes increased from
approximately 10% to 85% inhibition, over the extract concentration range of 12 to
3000 μg mL-1 (Figure 6.8c), and an MIC observed at an extract concentration of 6000
μg mL-1. This gradual inhibitory activity was similar for the DCM extract against S.
pyogenes (Figure 6.8e), C. butyricum (Figure 6.8n). However, it must be noted that the
MIC was not the same and that the extract concentrations exhibited different degrees of
inhibition. A decrease in inhibition was also observed for the DCM against other
bacteria, B. cereus, B. subtilis, S. pyogenes, C. perfringens (cp8), C. perfringens (cp9),
C. perfringens (SUT) and S. sporogenes, however, the decrease appeared to be not as
proportional (Figure 6.8a,b,f,h,j,l,p).
The DCM extract also showed inhibitory activities at varying degrees toward the C.
difficile isolates below the MIC100 values (Figure 6.8r,t.v). The MIC100 for DCM
against C. difficile (cd1), C. difficile (cd8) and C. difficile (cd14) was 375, 3000 and
3000 µg mL-1, respectively. At DCM extract concentrations of 375 µg mL-1, and 750
µg mL-1, there was at least 80% inhibition of C. difficile (cd8) and C. difficile (cd14),
demonstrating that the extract still had the ability to inhibit the bacteria, however, these
Clostridium strains appeared to be slightly more resistant to the DCM extract.
The same MIC was observed for the EtOAc toward the three C. difficile isolates, at
12000 µg mL-1 (Table 6.10). At extract concentrations of 3000 µg mL-1 (C. difficile
(cd1) and C. difficile (cd8)) and 1500 µg mL-1 (C. difficile (cd14)), greater than 90%
inhibition of the bacteria was still observed (Figure 6.8s,v,w). T-tests were performed
on the results that gave close inhibitory values to that of the MIC (Appendix 3). All T-
tests showed that there was a significant difference between the MIC and the mean
value obtained for extract inhibitory concentrations below the MICs. Therefore, the
MIC was confirmed to be 12000 µg mL-1 for the EtOAc toward the C. difficile isolates.
The EtOAc extract also exhibited a dose dependent response towards S. pyogenes, C.
perfringens (cp9), C. perfringens (SUT) and C. sporogenes (Figures6.8g,k,m,q). The

Chapter 6 – Mycelial Extraction and Antibacterial Activity
170
EtOAc extract had a smaller range of concentrations than the DCM extract, which had
an inhibitory effect on the bacteria. In addition, the concentrations below the MIC that
were effective had a decreased inhibitory effect on the same test organisms. An
example of this is shown in Figure 6.8v,w, which depicts the inhibitory effect of the
EtOAc extract at different concentrations towards C. difficile (cd14).
Overall, the dose response was unique for each test organism, which suggested that the
inhibitory action by the extracts was concentration dependent and that the concentration
would depend on the target organism. This is similar to the observation that the extracts
have a different MIC against the different test organisms (Table 6.11). This difference
in inhibitory activity and MIC towards different bacteria is reported widely in literature
(Beltran-Garcia et al., 1997; Fakeye et al., 2000; Hirasawa et al., 1999; Yoon et al.,
1994). The MIC values of some aqueous G. lucidum extracts (Yoon et al., 1994) were
comparable to the MIC values obtained in this investigation.
At extract concentrations greater than or the same as the MIC, the cell density (OD595)
decreased to below ‘pre-extract addition’ cell density (results not shown). As cell lysis
is evident through a reduction in OD, this suggested that both the EtOAc and DCM
extracts had bacteriolytic activity. To determine the exact mode of action in regards to
disruption of the cell wall, further investigation would need to be performed, which is
beyond the scope of this investigation. This investigation was limited to determining
the bactericidal and/or bacteriostatic behaviour of the extracts, which is investigated and
discussed further in the following Section (Section 6.3.2.7).
To this point, the activity exhibited by the DCM extract indicated that it had a
bacteriostatic activity towards both L. monocytogenes and S. epidermidis and a
bactericidal activity towards some of the other bacteria tested. The EtOAc extract also
exhibited bactericidal activity towards a number of the test bacteria. In addition, the
concentrations required by the EtOAc extract to impart bactericidal activity were
observed to be far greater than the concentrations required by the DCM extract to have
an equivalent effect on the same test bacteria.

Chapter 6 – Mycelial Extraction and Antibacterial Activity
171
From the MIC and MBC results, it can be concluded that the DCM extract appears to
possess a greater biological activity towards the bacteria tested. Therefore, it is
hypothesised that: a) the active compound/s is/are more concentrated in the DCM
extract (assuming that the same compound is present in both the DCM and EtOAc
extracts), or b) the compound causing the antibacterial activity in the DCM extract is
more active than the compound that is causing the antibacterial activity in the EtOAc
extract (assuming that there are different compounds which possess activity in both
extracts). Further purification and preliminary identification of the active extracts is the
topic of investigation Chapter 7.
6.3.2.7 Time Kill Assay
The bactericidal activities of the DCM and EtOAc extracts were examined against a
selection of test organisms using time course growth assays as described in Section
3.13.4. Extract was added to the propagation broth, which contained the test organism,
to achieve a final concentration that was equal to the MBC. If no MBC was determined
for a particular bacterium, a final concentration that was equivalent to the MIC was used
instead. The cultures were incubated at 37ºC and the number of viable cells was
determined after 0, 1, 2 or 3, and 4 hours of incubation. Control cultures without extract
were also incubated under the same conditions.
Figure 6.9 displays the antibacterial effect of the DCM extracts on growing bacterial
cells of B. cereus, B. subtilis, L. monocytogenes, S. epidermidis, and S. pyogenes. The
DCM extract exhibited a bactericidal effect on both B. cereus and B. subtilis, reducing
the viability by approximately 3-log and 2-log units, respectively, after 4 hours (Figures
6.9a,b). There was no reduction in viability of L. monocytogenes and S. epidermidis
cells after 4 hours, as the log units were comparable to that at time zero (Figures 6.9c,d).
This indicated that the DCM extract exhibited a bacteriostatic effect towards both L.
monocytogenes and S. epidermidis and supported the conclusion of bacteriostatic
activity of this extract toward these bacteria, since no MBC could be determined in the
previous Section (Table 6.11).
Figure 6.9e shows the antibacterial effect of the EtOAc extract, as well as that of the
DCM extract, on the growing cells of S. pyogenes. Both extracts appeared to have an

Chapter 6 – Mycelial Extraction and Antibacterial Activity
172
inhibitory effect against S. pyogenes, which maintained, but did not kill the bacterial
cells over the 4 hour period examined. The time kill assay indicated that the DCM
extract had a bacteriostatic effect on S. pyogenes, as the number of viable cells was
comparable to that at time zero (the number of cells due to the inoculum). However, the
EtOAc extract exhibited a slight bactericidal effect showing a reduction in cell viability
of 0.5-log units after 4 hours. Previous results suggested that both extracts exhibited
strong bactericidal qualities towards S. pyogenes, which was in contradiction to the time
kill assay. The determination of an MBC (Table 6.11) and the observation of complete
zones of inhibition in the disc diffusion assay (Table 6.8) indicated bactericidal activity.
The viability of S. pyogenes after 24 hours of incubation was also determined in the
time kill assay. This showed no viable cells in the cultures that had the DCM or EtOAc
extract added (results not shown). It is hypothesised that the DCM and EtOAc extract
exhibited a bactericidal effect on S. pyogenes some time after 4 hours of incubation.
Prior to this, a bacteriostatic effect was exhibited by both extracts. To determine at
what stage the activity changed from bacteriostatic to bactericidal, a time kill assay over
a 24 hour period would need to be performed. This was not done in this investigation.
Figure 6.10 displays the antibacterial effect of the DCM and EtOAc extracts on growing
bacterial cells of a number of Clostridium species. A time kill assay for the EtOAc
extract against C. butyricum was not performed as this extract showed no inhibitory
activity towards this organism (Table 6.10). In addition, results for the EtOAc extract
against C. perfringens (cp9) are not shown. Problems were encountered in the
propagation of this bacterium, so only results that showed good growth have been
included. Such difficulty in growing Clostridium difficile dates back to the isolation
and naming of this species, Latin name ‘difficile’ meaning ‘difficult’, which referred to
the unusual difficulty that was encountered in its isolation and study (Bergey, 1986).
Both the DCM and EtOAc extracts exhibited bactericidal activity towards the bacteria
tested (Figure 6.10), although limited bactericidal activity towards C. sporogenes
(Figure 6.10d) was observed, where after 4 hours, there was a decrease in viability by
only 1-log unit for both extracts. After 24 hours, the viability had decreased to an
undetectable level (results not shown), which indicated a slow bactericidal activity
against C. sporogenes.

Chapter 6 – Mycelial Extraction and Antibacterial Activity
173
Figure 6.9. Time kill curves for the (▲) DCM extract against (a) Bacillus cereus, (b) Bacillus subtilis, (c) Listeria monocytogenes, (d) Staphylococcus epidermidis, and both the (▲) DCM extract and ( ) EtOAc extract against (e) Streptococcus pyogenes. Extracts from the mycelium of Ganoderma H1 that had been cultivated in Basal-G medium for 30 days. ( ) Growth of the organism in the absence of extract. The MBCs were used as the final concentration of extract in each assay and are listed in Table 6.11.
0 1 2 3 40
1
2
3
4
5
6
7
8
9
0 1 2 3 40
1
2
3
4
5
6
7
8
9
0 1 2 3 40
1
2
3
4
5
6
7
8
9
0 1 2 3 40
1
2
3
4
5
6
7
8
9
Time
Via
bilit
y (L
og10
cfu
mL
-1)
Via
bilit
y (L
og10
cfu
mL
-1)
Via
bilit
y (L
og10
cfu
mL
-1)
0 1 2 3 40
1
2
3
4
5
6
7
8
9
Time
a. B. cereus b. B. subtilis
c. L. monocytogenes d. S. epidermidis
e. S. pyogenes

Chapter 6 – Mycelial Extraction and Antibacterial Activity
174
Figure 6.10. Time kill curves for the (▲) DCM extract and ( ) EtOAc extract against: (a) Clostridium perfringens (cp8), (c) Clostridium perfringens (SUT), (d) Clostridium sporogenes (SUT) and (d) Clostridium difficile (cd1), and the (▲) DCM extract against (b) Clostridium perfringens (cp9) and (e) Clostridium butyricum. Extracts from the mycelium of Ganoderma H1 that had been cultivated in Basal-G medium for 30 days. ( ) Growth of the organism in the absence of extract. The MBCs were used as the final concentration of extract in each assay and are listed in Table 6.11.
0 1 2 3 40
1
2
3
4
5
6
7
8
9
0 1 2 3 40
1
2
3
4
5
6
7
8
9
0 1 2 3 40
1
2
3
4
5
6
7
8
9
0 1 2 3 40
1
2
3
4
5
6
7
8
9
0 1 2 3 40
1
2
3
4
5
6
7
8
9
0 1 2 3 40
1
2
3
4
5
6
7
8
9
Time (hours)
a. C. perfringens (cp8)
Time (hours)
b. C. perfringens (cp9)
c. C. perfringens (SUT) d. C. sporogenes
e. C. butyricum f. C. difficile (cd1)
Via
bilit
y (L
og10
cfu
mL
-1)
Via
bilit
y (L
og10
cfu
mL
-1)
Via
bilit
y (L
og10
cfu
mL
-1)

Chapter 6 – Mycelial Extraction and Antibacterial Activity
175
A strong bactericidal activity was exhibited by both extracts towards the C. perfringens
isolates tested. The DCM extract reduced the viability of C. butyricum by 2.5-log units
after 4 hours. A greater decrease in viability, by 3-log units and 4-log units, was
exhibited by both extracts against C. perfringens (cp8) (Figure 6.10a) and C.
perfringens (SUT) (Figure 6.10e), respectively. The DCM extract exhibited greater
activity against the C. perfringens isolate (cp9) in that a rapid decrease in viability, to an
undetectable level, was observed after 1 hour (Figure 6.10b). A similar, rapid
bactericidal effect was also exhibited by both extracts against the clinical isolate C.
difficile (cd1). Within 1 hour there was an undetectable level of viable cells (Figure
6.10f). Due to difficulties experienced in the propagation of the C. difficile isolates, as
mentioned earlier, only one representative isolate was chosen for analysis.
The bactericidal or bacteriostatic activity exhibited by the DCM and EtOAc extracts
were similar for the same bacterium. This suggested that the active compound was
present in both extracts and was the same compound. The MBC determined for the
extract against each test organism was used in the time course growth assays. Since the
results of the MBCs for the DCM extract were less than that for the EtOAc extract, this
led to the belief that the active compound was in a far greater concentration in the DCM
extract.
Overall, the results of the time kill experiments correlated with those of the disc
diffusion assays (Table 6.8 and Table 6.10) and the concentration response assays
(Figure 6.8). The extracts that exhibited rapid bactericidal activity also showed large
zones of inhibition (Table 6.10). The extracts that showed bacteriostatic behaviour were
observed to show zones of incomplete inhibition (Table 6.8) and have dose inhibitory
responses below the MIC100 (Figure 6.8).
6.3.3 Antifungal Activity The crude organic extracts, HEX, DCM, EtOAc and MeOH, from Ganoderma H1 were
assessed for their antifungal activity using the disc diffusion test as described in Section
3.13.1. The organisms tested included; Candida sp., Saccharomyces cerevisiae, three
yeast strains (2906, 6034 and 2119), Mucor sp. + and Mucor sp. -, Aspergillus niger,
Rhizopus sp, Penicillium sp. and Fusarium oxysporium (Chapter 3, Table 3.4). An

Chapter 6 – Mycelial Extraction and Antibacterial Activity
176
extract volume of 6000 μg was applied to each disc. No antifungal activity was
observed for any of the extracts tested. To date there appears to be only one report of a
Ganoderma species possessing antifungal activity. This is G. annulare, which was
found to possess activity against two fungal species, Microsporum canis and
Trichophyton mentagrophytes, at concentrations of 500 and 1000 μg mL-1, respectively
(Smania et al., 2003).
6.4 Summary The liquid cultivated mycelial biomass of three Australian Ganoderma isolates,
Ganoderma H1, Ganoderma H2 and Ganoderma H3, were investigated for their
antibacterial activity. Initially, the three isolates were cultivated for 30 days in a
standard fungal cultivation medium, MEB, to produce mycelial biomass. This biomass
was then extracted using two methods. The first method employed a hot aqueous
extraction technique (Section 3.11.1), while the second method employed extraction in a
Soxhlet apparatus using organic solvents, in order of increasing polarity (Section
3.11.2). Preliminary antibacterial investigations were then performed on all extracts and
an overall analysis of the active extracts performed.
The aqueous extracts from Ganoderma H1 and H2 were found to possess some
antibacterial activity in preliminary investigations (Section 6.3.1.2). Incomplete
inhibition was exhibited by Ganoderma H1 towards both B. cereus and B. subtilis, and
by Ganoderma H2 towards B. cereus. The aqueous extracts from all three Ganoderma
isolates exhibited strong antibacterial activity towards S. pyogenes. This is the first
investigation reporting antibacterial activity of aqueous extracts from the liquid
cultivated mycelium of Australian Ganoderma isolates.
Preliminary studies on the organic extracts from the three Ganoderma isolates found
them to possess antibacterial activity towards a greater range of bacteria than the
aqueous extracts (Section 6.3.1.3). Activity was observed for Ganoderma H1 and H2
against some Gram positive bacteria. However, there was no activity observed for any
of the extracts from Ganoderma H3. At the concentrations examined, the organic
extracts from Ganoderma H1 exhibited activity against a greater range of bacteria than
those from Ganoderma H2.

Chapter 6 – Mycelial Extraction and Antibacterial Activity
177
A more detailed investigation of the organic extracts from the mycelium of Ganoderma
H1 was performed (Section 6.3.2). This focus was prompted by the observation that the
extracts from Ganoderma H1 exhibited antibacterial activity towards the greatest
number of bacteria. A review by Cowan (1999) reported that the most active
components are generally water insoluble, hence, the expectation that low polarity
organic solvents would yield more active extracts. This was the case in this
investigation as the aqueous extracts exhibited less activity than the organic extracts. In
addition, the extracts obtained using the less polar solvents, such as HEX, DCM and
EtOAC, gave greater activity than those obtained using the highly polar solvent MEOH.
The mycelium of Ganoderma H1 was grown in three different cultivation media, PDB,
MEB and Basal-G, to investigate the effect, if any, the media would have on the
antibacterial activity. The HEX, DCM and EtOAc extracts exhibited activity against a
number of Gram positive bacteria, whilst the MEOH extracts showed activity towards
only two bacteria, namely E. faecalis and S. pyogenes (Table 6.8). There was no
activity exhibited against any of the Gram negative bacteria tested. This was thought to
be due to the difference in cell wall structure to Gram positive bacteria, which generally
makes Gram negative bacteria resistant to greater number of compounds (Villee et al.,
1989).
All the DCM extracts exhibited activity towards B. cereus, B. subtilis, E. faecalis, S.
pyogenes and S. aureus. In addition, the DCM(Basal-G) also inhibited S. epidermidis
and L. monocytogenes. Overall, the DCM extract appeared to have promising inhibitory
effects. Other reports within the literature have demonstrated that chlorinated extracts
from different Ganoderma species possess cytotoxicity towards tumour cells (Gan et
al., 1998a), anticomplement activities towards the complement pathway (Min et al.,
2001), antihistamine release activities (Tasaka et al., 1988a, 1988b), antinociceptive
activities (Koyama et al., 1997), as well as some antibacterial activity (Mothana et al.,
2003; Smania et al., 1999), all in vitro. In this investigation, activity was also observed
for the HEX and EtOAc extracts, but this activity was limited to one or two bacteria for
extracts from mycelium cultivated in PDB.

Chapter 6 – Mycelial Extraction and Antibacterial Activity
178
Further investigation of the active extracts against some clinical MRSA and VRE
isolates was investigated (Section 6.3.2.3). There was no inhibitory activity observed
for any of the extracts against the VRE isolates (Table 6.8). For the MRSAs, the
DCM(Basal-G), DCM(PDB), EtOAc(Basal-G) and EtOAc(PDB) extracts exhibited
activity towards six isolates, while the DCM(MEB) and EtOAC(MEB) exhibited
activity against one and five isolates, respectively (Table 6.8). This appears to be the
first report on the inhibitory activity of a Ganoderma isolate against these types of
clinical isolates.
Extracts from mycelium that had been grown in different cultivation medium exhibited
different sized zones of inhibitions. This suggested that the cultivation media had an
effect on the production of the active compound. Kim et al. (2002a) also found that the
manipulation of the cultivation medium had an effect on the biological activity. In this
study, the least amount of activity was exhibited from mycelium that had been grown in
PDB and the greatest amount of activity was exhibited from mycelium grown in Basal-
G medium (Table 6.8). This observation, combined with the outcome that Basal-G
supported the greatest growth of the mycelium (Section 5.3.2.4) resulted in the choice of
the Basal-G medium cultivation medium for further growth and examination of
Ganoderma H1.
The organic extracts from Ganoderma H1 mycelium, that had been cultivated in Basal-
G growth medium, were investigated further against some Clostridium species, which
included some clinical isolates (Section 6.3.2.5). The HEX, DCM and EtOAc extract
exhibited strong antibacterial activity against all strains tested. The zones of inhibition
against the anaerobic isolates were larger than the zones of inhibition against the aerobic
bacteria, including the spore forming aerobic bacteria. This indicated that the anaerobic
bacteria were more susceptible to the extracts than the aerobic bacteria.
Small changes in disk content can produce rather minor changes in zone diameters i.e.:
a two fold increase in disk potency generally increases zone sizes by 2 or 3 mm (Barry
& Thornsberry, 1985). As the diameter of the zone increases radially, the areas of the
zones increase by a much larger factor, which in turn, requires larger quantities of
extract. Because of this, a more appropriate means of measurement than the disc

Chapter 6 – Mycelial Extraction and Antibacterial Activity
179
diffusion assay would be to measure the area of the zone of inhibition, rather than the
diameter. However, the diameter of the zone of inhibition is used most frequently when
reporting inhibitory results using the disc diffusion assay (King & Brown, 2001). Since,
the full effect of the extracts activity may not have been observed using the disc
diffusion assays, other methods of analysis were used to determine the extract potency
towards the test bacteria.
One method commonly used to describe the antimicrobial effectiveness of a compound
is the MIC. A definition of the MIC is the lowest concentration of the compound
capable of inhibiting the growth of the challenging organism (Mann & Markham, 1998).
The MIC as well as the MBC was determined for the DCM and EtOAc extracts that
showed strong antibacterial testing. These MIC and MBC values (Table 6.11) along
with the concentration graphs (Figure 6.8) supported the idea that inhibitory action
exhibited by the extract was concentration dependent and that the concentration would
depend on the target bacteria. The MIC and MBC values determined were comparable
to some MIC and MBC values for Ganoderma extracts reported in the literature (Yoon
et al., 1994).
Time kill assays confirmed the bacteriostatic or bactericidal activity of the extracts
against the different test organisms. It was observed that the DCM and EtOAc extracts
were predominantly bactericidal against the range of bacteria tested (Figure 6.9 and
6.10). However, as previously mentioned, this was highly dependent on the
concentration of the extract and the target organism. The time kill assay also suggested
that the active compound in the EtOAc and DCM was similar, as the rate of decrease in
viability was the same for both extracts towards each bacterium.
The results reported in this Chapter indicate that the mycelium of the Australian
Ganoderma isolate H1 contains a compound or some compounds that have antibacterial
activity against some important Gram positive bacteria. The results also indicated that
cultivation in the growth medium, Basal-G, supported the greatest production of
mycelium and in turn, yielded the greatest quantity of active extract. It was observed
that the less polar organic extracts appeared to have the greatest activity, suggesting that
the active compound is organic and has a cyclic structure, as these type compounds are

Chapter 6 – Mycelial Extraction and Antibacterial Activity
180
nearly exclusively extracted by these solvents (Harbourne, 1973; Wagner et al., 1984).
To explore this further, additional testing and isolation of the organic compound was
performed and is discussed in the following Chapter.

7 Chapter Seven
PPrreelliimmiinnaarryy IIddeennttiiffiiccaattiioonn ooff
BBiiooaaccttiivvee CCoommppoonneennttss

Chapter 7 – Preliminary Identification of Bioactive Components
182
7.1 Introduction Thin layer chromatography (TLC) is one of the simplest and least expensive methods
for detecting natural product constituents because the method is easy to perform, is
reproducible and requires little equipment (Hostettmann, 1999). Advantages of TLC
over other chromatographic techniques are that, parallel runs can be carried out for a
series of spots on the origin line, and more complex mixtures with minimal purification
can be analysed (thus, no blocking of sophisticated chromatography columns) because
of the single use of a TLC plate (Sherma, 2002). Detection on TLC plates depends on
the chemical structure of the compound and is based on the natural colour, fluorescence
at UV-365 nm or UV absorption at UV-254 nm (fluorescence quenching on phosphor
impregnated layers) of separated zones (Sherma, 2002). The use of selective or
universal chemical spray reagents to determine classes of compounds is also widely
reported (Krebs et al., 1969; Wagner et al., 1984).
Isolation of pure, pharmacologically active constituents from natural sources remains a
long and tedious process (Hostettmann, 1999). A major focus for phytochemical
analysis is the characterisation of an active agent responsible for some toxic or
beneficial effect exhibited by a crude plant extract when tested against a living organism
(Harbourne, 1973). Chemical screening can be performed to allow the localisation and
targeted isolation of such constituents with potential activity. Bioassays are therefore
essential for monitoring each stage of the extraction and separation procedures in order
to follow the active material as it is purified (Harbourne, 1973). Bioautography is a
technique that combines TLC with a bioassay in situ, and therefore, allows the
localisation of active constituents in a complex matrix (Hamburger & Hostettmann,
1991). Such bioautographic methods include bioautography agar-overlay (Hostettmann,
1999) and direct bioautography (Horvath et al., 2002).
A number of secondary metabolites have been purified and identified from Ganoderma
species using column chromatography and HPLC/GC techniques (Gonzalez et al., 1999,
2002; Kleinwachter et al., 2001; Rosecke & Konig, 2000; Smania et al., 1999). These
secondary metabolites have generally been isolated, identified and then tested for
bioactivity. In contrast, this chapter reports the bioassay-guided fractionation and

Chapter 7 – Preliminary Identification of Bioactive Components
183
subsequent identification of the classes of compounds that exhibited antibacterial
activity in the DCM extract from Ganoderma H1 (G. cupreum).
7.2 Overview The components of the crude DCM extract of Ganoderma H1 were separated by TLC
and observed by visualisation at UV-254 nm and UV-365 nm. The components were
then assessed for antibacterial activity against B. cereus, using the bioautography agar-
overlay method. Components that exhibited antibacterial activity were then separated
by silica gel column chromatography following a bioassay-guided fractionation process.
Fractions were subjected to TLC and the classes of compounds determined using
universal and specific TLC detection reagents, UV-254 nm and UV-365 nm light.
Finally, bioautographic analysis and comparison of Rf values with reference
chromatograms provided information about the nature of the antibacterial constituents.
7.3 Results & Discussion 7.3.1 Crude Extract Composition and Active Components Initial TLC analysis was performed to determine the number of different components
within the crude DCM extract and to identify which component/s exhibited antibacterial
activity. As the number and identity of extract components were not known,
experimentation was required to determine: 1) a suitable solvent system, 2) time
required for development of the plate, and 3) an optimal concentration of extract to be
applied onto the TLC plate. Generally, these parameters were investigated
simultaneously.
TLC was performed as described in Section 3.12.2. A number of TLC plates were
spotted with increasing volumes (from 1 μL to 15 μL) of the DCM extract (2 μg μL-1).
Solvent systems investigated were HEX, CHCl3, CHCl3:EtOAc and CHCl3:MeOH in
varying ratios. The TLC plates were placed into solvent saturated TLC tanks,
developed in the different solvent systems and then observed for the separation of
components under UV-254 nm, UV-365 nm or visible light. CHCl3:EtOAc (95:5),
developed twice (TLC plate was developed once in the mobile phase, dried, and then
developed a second time to give a better separation), was found to be the most suitable
solvent system, yielding good separation of the different components in the DCM

Chapter 7 – Preliminary Identification of Bioactive Components
184
extract. TLC plates were also subjected to a bioautography overlay assay as described
in Section 3.13.5 and the specific components were observed for antibacterial activity.
B. cereus was used in the bioautography assays, as this bacterium had previously
displayed sensitivity to the crude DCM extract in the antibacterial assays (Chapter 6).
TLC plates developed using CHCl3:EtOAc (95:5 x 2) and observed at UV-254 and UV-
365 nm are presented in Figure 7.1a,b,c. Bioautography results are shown in Figure
7.1d.
The term retention factor, Rf, is commonly used to describe the chromatographic
behaviour of sample solutes. The Rf value for a given component is the distance it has
travelled from the origin divided by the distance travelled by the solvent front (mobile
phase) (Harbourne, 1973). The centre for each spot is the point taken for reference.
Rfx100 values (Rf x 100%) were calculated for comparison of spots and are reported in
Table 7.1 in the following pages. Since silica gel retains the more polar compounds, the
non-polar compounds were eluted first (and moved further up the TLC plate). Hence,
the more polar the component the lower the Rf value, and the less polar the component
the larger the Rf value. The Rf value of a component will not be the same when a
different solvent system is used. For this reason, the Rf value can only be compared if
the same mobile phase is used. Different mobile phases were employed throughout this
investigation as the fractionation proceeded. Therefore, results in this Chapter only
compare Rf values of components that have been separated in the same system at the
same time.
The mobile phase, CHCl3:EtOAc (95:5 x 2), resulted in the separation of eighteen
components in the DCM extract (Table 7.1). Fourteen of these components fluoresced
at UV-365 nm (Figure 7.1b) and an additional four components were observed to
quench fluorescence at UV-254 nm (Figure 7.1c). Two of these eighteen components
were seen in visible light (Table 7.1). The first, a yellow/orange spot (Rfx100 = 88) also
fluoresced green at UV-365 nm and the second, seen as a yellow arch (∩) (Rfx100 = 59)
also quenched fluorescence at UV-254 nm.
The intensity and size of the spot on the TLC plate is a measure of the concentration of
that component in a mixture (Harbourne, 1973). Therefore, relative concentrations of

Chapter 7 – Preliminary Identification of Bioactive Components
185
the components can be estimated. It was clear that the DCM extract had components
present in varying concentration, as different intensities of the components were
observed under UV light (Figures 7.1b and 7.1c). The component that was eluted at an
Rfx100 = 69, which fluoresced bright blue at UV-365 nm, was present in a much greater
concentration than any other component in the DCM extract (Figure 7.1a,b). In
addition, applying different volumes of the DCM extract onto TLC plates (1 µL, 2 µL, 5
µL, 10 µL, 15 µL, 20 µL and 30 µL (not all results shown)) and observing the intensity
and size of the components after development, allowed estimation of the relative
concentrations of the different components. This process also identified additional spots
that were present in the extract in small concentrations. When 1 μL of the DCM extract
was applied, ten components were observed (Figure 7.1a) and when a larger volume of
extract was applied (15 μL), four extra components were observed at UV-365 nm
(Figure 7.1b) and another four observed at UV-254 nm (Figure 7.1c). TLC plates
spotted with 20 µL or greater of the crude extract produced chromatograms with poorly
resolved components (results not shown).
Components that had Rfx100 values of 19, 8 and 6 were only just visible in UV-365 nm
light when a 15 μL sample was applied to the TLC plate (Figure 7.1b). The resolution
of these compounds was a little ambiguous and there may have been more compounds
present in this part of the TLC plate. However, applying a larger volume of the extract
(20 µL and 30 µL) decreased the resolution and smearing on the TLC plate was
observed (results not shown). This smearing was due to the overloading of components
that were present in high concentration (in this case the component that exhibited an
Rfx100 = 69), an effect commonly observed if some of the components in the mixture
are present in too high a concentration (Harbourne, 1973). As a result, the less polar
components eluted above this spot had good separation whilst the more polar
components eluted below this spot were affected by smearing and the separation of the
components was not as clear.

Chapter 7 – Preliminary Identification of Bioactive Components
186
Figure 7.1. TLC and bioautography of the DCM extract developed in a CHCl3:EtOAc (95:5 x 2) solvent system. A 1 μL sample of the DCM extract (2 μg μL-1) was spotted onto the TLC plate, developed and the components visualised under (a) UV light at 365 nm. A 15 μL sample of the DCM extract (2 μg μL-1) was spotted onto the TLC plate, developed and the components visualised under (b) UV light at 365 nm, and (c) UV light at 254 nm. (d) Bioautography of the DCM extract using Bacillus cereus as the test bacterium. Clear zones of inhibition can be observed at an Rfx100 = -2 to 24, 29 and 37 to 58. All plates are aligned and the Rfx100 values of visible components listed.
Bioautography of the TLC plates showed the range of components that exhibited
antibacterial activity (Figure 7.1d). The component present in the extract in the greatest
concentration exhibited no activity (Rfx100 = 69). In fact, there was no activity
observed above this component, which eliminated the less polar components as the
target compounds (Rfx100 = 90, 88, 80, 75, 71 and 69) (Table 7.1). Activity was
observed to be in components that had Rfx100 values of no higher than 58 in this mobile
phase, which corresponded with those beneath the component that quenched
fluorescence at UV-254 nm (half moon, Rfx100 = 59) (Figure 7.1c). It was difficult to
determine exactly which compounds were active as the zones of inhibition were spread
over a wide range (Rfx100 range = 58 to 37, 29, 24 to -2) that included a number of
components. Application of a smaller volume of extract gave clear zones of inhibition
but components were in a too low a concentration to be visualised at UV-254 or UV 366
nm, hence, exact comparison with smaller volumes of extract was not performed. Slight
b. c.
80
54
88
75 69
32
43
65
48
28
80
54
90 88
75 69
32
43
65
48
28
19 8 6
69
28
71
19 8
24
75
80
90
32
43
59
48
67
6
a. d.
Clear zones of inhibition

Chapter 7 – Preliminary Identification of Bioactive Components
187
smearing caused by the high concentration of the component that exhibited an Rfx100 =
69 affected the clear separation of the components in this active region. As a result,
zones of inhibition could not be matched to the corresponding components. In all, it
appeared that the antibacterial activity was due to components that caused distinct
fluorescence quenching at UV-254 nm and had little fluorescence at UV-365 nm (Table
7.1 and Figure 7.1b,c). The low Rfx100 values of the active components in this mobile
phase also suggested that they were slightly polar (Table 7.1).
Table 7.1 TLC of the crude DCM extract
Detection of Components in the DCM Extracta Rfx100 b UV-365 nm UV-254 nm Visible Bioactivityc 90 orange black 88 green - yellow/orange 80 blue black 75 green black 71 - black 69 bright blue light blue 67 - black 65 green - 59 - black (∩) orange (∩) 54 green - 48 green black 43 blue light blue 32 green black 28 blue light blue 24 - black 19 blue black 8 blue black 6 blue black
Activity appeared in
this region of Rfx100 values.
58 to 37, 29,
24 to -2
a Separation of the crude DCM extract was performed on silica gel TLC plates using the mobile phase CHCl3:EtOAc (95:5 x 2); b Rfx100, the distance the component traveled divided by the distance traveled by of the solvent front x 100; c The range of bioactivity was recorded over a number of Rf values.
It was apparent that the non-active compounds were present in a much higher
concentration than the active (target) compounds. To perform a preliminary
identification of the classes of compounds, a high enough concentration of the active
components was required to enable detection by spray reagents. In addition, clear
separation of the active components by TLC was also required, so that other
Chapter 7 – Preliminary Identification of Bioactive Components
188
components would not interfere in the identification process. Therefore, to obtain
sufficient quantities of active components and to remove the non-active less polar
compounds, bioassay-guided fractionation using silica gel column chromatography was
performed and is reported in the following sections. It is important to note that the aim
of this chapter was to report only the class of compounds that were exhibiting the
antibacterial activity and thus, full purification and identification of the active
components was not performed.
7.3.2 Bioassay-Guided Fractionation of the DCM Extract Bioassay-guided fractionation of the DCM extract was performed to remove
components in the mixture that exhibited no antibacterial activity. The fractionation
procedure was performed as described in Section 3.12.1. Crude DCM extract was
applied to the top of a silica gel column and the components eluted using a stepwise
gradient starting with CHCl3:MeOH (99:1) and ending with CHCl3:MeOH (2:8) (A
series, Figure 7.2). An insoluble layer on the extract was removed prior to fractionation.
This layer was also tested for bioactivity in the previous chapter (Section 6.3.2.1),
however, no activity was observed and it was the soluble layer that exhibited activity.
During the first step of the fractionation process, thirty fractions, each consisting of 5
mL, were collected, evaporated to dryness and then resuspended in an appropriate
solvent, depending on where the fraction was eluted from the column. Each fraction
was subjected to a preliminary bioautographic evaluation (Section 3.13.5) to observe
which fractions exhibited antibacterial activity. The fractions that exhibited
antibacterial activity were spotted onto a TLC plate, developed in an appropriate solvent
system (determined by trial and error) and then visualised at UV-365 nm and UV-254
nm. Fractions that contained the same components and exhibited antibacterial activity
were pooled. Active fractions that were of interest were subjected to the fractionation
process for a second time. This further purified the fractions so that a greater separation
could be achieved and, in turn, detection of the class of compound could be carried out
without the interference of some non-target compounds. A flow diagram representing
the fractionation process is presented in Figure 7.2.

Chapter 7 – Preliminary Identification of Bioactive Components
189
Figure 7.2. Diagram of the fractionation process of the DCM extract; Fr, fraction; * Fraction exhibited antibacterial activity.
7.3.2.1 Fractionation No. 1
The first fractionation of the crude DCM extract by column chromatography yielded
thirty fractions (Figure 7.2). A preliminary bioautographic evaluation was performed
on each fraction by spotting them onto a silica gel plate and evaluating their bioactivity
without development of the plate (Figure 7.3). This indicated which fractions contained
active components. As a result, the non-active fractions could be eliminated from
further TLC and bioautography analysis.
B1 B4* B2* B5* B3*
A1 A4* A2* A7 A6* A5 A3*
C1 C4* C2* C6 C5* C3*
DCM Extract
Insoluble layer Silica gel
CHCl3/MeOH 99:1 to 8:2
Fractions 1 to 30
Bioautography and TLC
Like extracts combined
Silica gel CHCl3:MeOH
(95:5 to 9:1) Silica gel CHCl3:MeOH
(9:1 to 8:2)
(B series)
(C series)
(A series)
No further fractionation

Chapter 7 – Preliminary Identification of Bioactive Components
190
Figure 7.3 displays the results of the preliminary bioautography assay. Zones of
inhibition were observed for thirteen fractions: 9, 10, 11, 12, 13, 14, 15, 16, 17, 18, 22,
23 and 24. Fractions 1 to 8, 25 to 27 and 28 to 30 exhibited no activity. Fraction 9
exhibited only slight activity. The largest zones were exhibited by fractions 10, 11 and
12, which suggested that there was either a concentrated amount of the active compound
or that there were a number of active compounds present. Although fractions 22 to 24
exhibited antibacterial activity, the zones of inhibition appeared be less intense when
compared to the other active fractions.
Figure 7.3. Bioautography of the DCM extract fractionation; Thirty fractions in total; 10 μL of each 5 mL fraction was spotted onto the TLC plate. The plate was overlayed with Bacillus cereus, incubated overnight and then sprayed with MTT; Fraction 1 to Fraction 30 are numbered on the plate; C, positive control consisting of the crude DCM extract; D1 - D4, DCM solvent blank.
In the previous chapter (Chapter 6), it was suggested that there might be more than one
active compound present in the crude DCM extract. The preliminary bioautography
assay supported this suggestion, as antibacterial activity was seen in a number of
fractions eluted at the start and end of the fractionation process, whereas there was no
activity in the fractions (compounds) that were eluted in the middle (Figure 7.3).
1 2 4 3 6 5
7 8 10 9 12 11
13 14 16 15 18 17
19 20 22 21 24 23
25 26 C 27 D2 D1
28 29 30 D4 D3

Chapter 7 – Preliminary Identification of Bioactive Components
191
Separation of the active (9 to 18, 22 to 24) and non active fractions (1 to 8, 19 to 21) on
TLC using different solvent systems were performed (results not shown). Fractions that
contained similar components were pooled into seven fractions (designated the ‘A
series’) (Figure 7.2). Of the A series, only four fractions exhibited antibacterial activity
(A2, A3, A4 and A6) (Figure 7.2). Fraction A6 exhibited weak antibacterial activity
compared to the other active fractions, thus, was not assessed further for the identity of
its components. Components within fractions A1, A5 and A7 exhibited no antibacterial
activity when examined via bioautography (results not shown). Fractions A2, A3 and
A4 displayed a number of components that showed zones of inhibition, which indicated
that there was more than one active component present in the crude DCM extract.
However, it was not possible to align the zones with the appropriate component, as there
appeared to be several new components (results not shown). These new active
components appeared to be present in a low concentration and either fluoresced at UV-
365 nm and/or quenched fluorescence at UV-254 nm. It is likely that there are many components present in crude extracts that are present in
very low concentration (Harbourne, 1973). Therefore, the process of fractionation will
separate and concentrate these components. As the fractionation proceeded in this
investigation, a greater number of components appeared in the crude extract than the
eighteen observed in the initial screening (Section 7.3.1). It also became apparent that
some of these new components exhibited antibacterial activity, although, some
exhibited only slight activity, which indicated either low antibacterial activity or simply
the presence of the component in a low concentration. Identification of the classes of all
the compounds that exhibited activity would be a time consuming task, since solvent
systems and spotting concentrations would need to be optimised, and fractionation
processes repeated a number of times. Therefore, a decision was made to focus on the
components that exhibited the strongest antibacterial activity, or appeared to be present
in greater concentration. Only classes of compounds from the components that
exhibited strong antibacterial activity were investigated further.
7.3.2.2 Fractionation No. 2
Three fractions from the A series (A2, A3 and A4) that exhibited the strongest activity
were subjected to silica gel column chromatography a second time (Section 3.12.1), to

Chapter 7 – Preliminary Identification of Bioactive Components
192
purify the components further so a better separation could be achieved. Fraction A2
was fractionated into five fractions (B1 to B5) (Figure 7.2) and have been designated
the ‘B series’ to aid in discussion. The fractionation of A3 and A4 yielded some similar
fractions with similar components (results not shown). These were pooled. In all, six
further fractions were produced from A3 and A4 (C1 to C6) and have been designated
the ‘C series’ (Figure 7.2) and are discussed in the latter half of this section.
Components in the new fractions were separated by TLC and visualised at UV-254 nm
and UV-365 nm (Figures 7.4a,b and 7.5a,b (discussed later)). Bioautography was also
performed on TLC plates alongside the reference TLC plates to determine which
components exhibited activity (Figure 7.4c and 7.5c (discussed later)). The same
amount of each fraction was spotted onto the TLC plates (100 μg) and relative
concentrations/activities of the active components were compared.
Suitable mobile phase conditions and appropriate fraction concentrations to be applied
to the TLC system were again determined by experimentation. Two different solvent
systems were employed for the different series. The B series used a mobile phase of
CHCl3:MeOH (97:3) and the C series used a mobile phase of CHCl3:MeOH (90:10).
Although separation of most of the components in the B series was achieved, the target
active components exhibited low Rf values and separated poorly from each other
(Figure 7.4). However, the primary purpose was to identify the number of components
within the fractions, and therefore, this mobile phase was determined to be the most
suitable. Since it is ideal that the components of interest should elute with an Rf value
equal to or greater than 0.25 to 0.40 (Harbourne, 1973; Wagner et al., 1984), a slightly
more polar mobile phase (CHCl3:MeOH (95:5)) was used for the identification of the
classes of compounds in the next section (Section 7.3.3). Rfx100 values for components
in the B series and the C series are presented in Table 7.2 and Table 7.3 (presented in
the latter part of this section), respectively.
The separation of fractions B1 to B5 using the mobile phase CHCl3:MeOH (97:3)
yielded a number of components that fluoresced at UV-365 nm (Figure 7.4a). However,
none of these fluorescent compounds exhibited antibacterial activity (Figure 7.4c). In
fact, it appeared that antibacterial activity was again limited to the components that
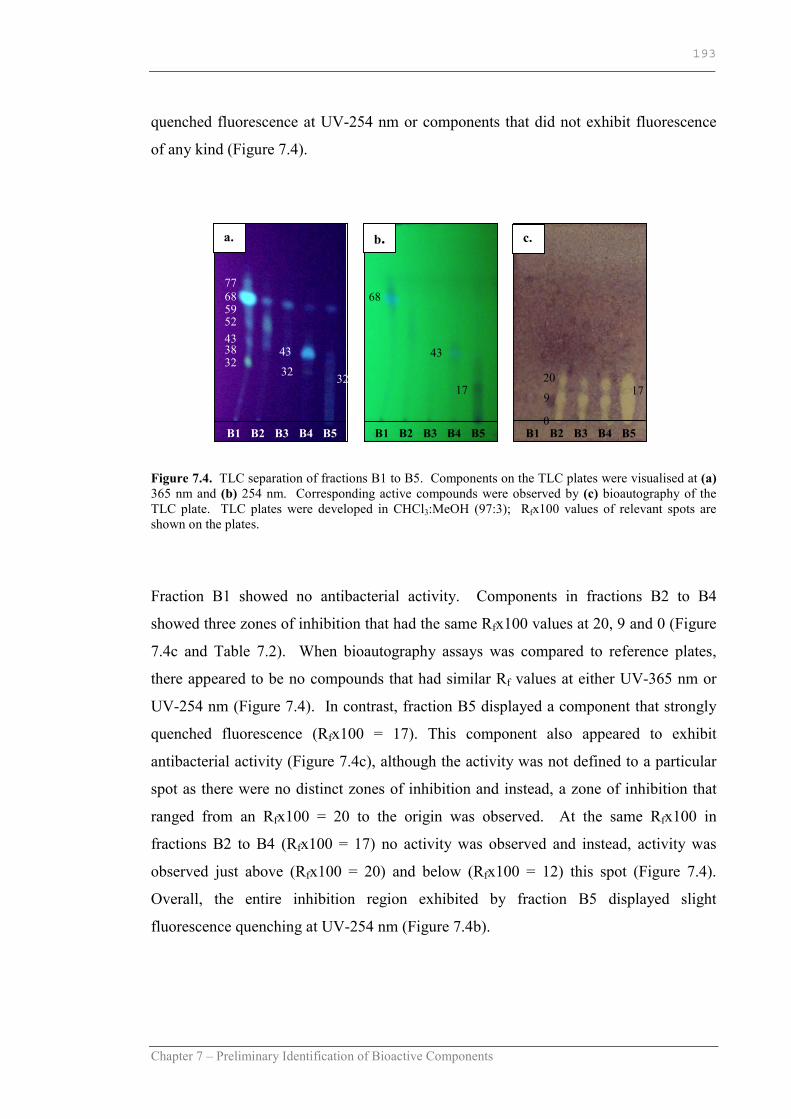
Chapter 7 – Preliminary Identification of Bioactive Components
193
quenched fluorescence at UV-254 nm or components that did not exhibit fluorescence
of any kind (Figure 7.4).
Figure 7.4. TLC separation of fractions B1 to B5. Components on the TLC plates were visualised at (a) 365 nm and (b) 254 nm. Corresponding active compounds were observed by (c) bioautography of the TLC plate. TLC plates were developed in CHCl3:MeOH (97:3); Rfx100 values of relevant spots are shown on the plates.
Fraction B1 showed no antibacterial activity. Components in fractions B2 to B4
showed three zones of inhibition that had the same Rfx100 values at 20, 9 and 0 (Figure
7.4c and Table 7.2). When bioautography assays was compared to reference plates,
there appeared to be no compounds that had similar Rf values at either UV-365 nm or
UV-254 nm (Figure 7.4). In contrast, fraction B5 displayed a component that strongly
quenched fluorescence (Rfx100 = 17). This component also appeared to exhibit
antibacterial activity (Figure 7.4c), although the activity was not defined to a particular
spot as there were no distinct zones of inhibition and instead, a zone of inhibition that
ranged from an Rfx100 = 20 to the origin was observed. At the same Rfx100 in
fractions B2 to B4 (Rfx100 = 17) no activity was observed and instead, activity was
observed just above (Rfx100 = 20) and below (Rfx100 = 12) this spot (Figure 7.4).
Overall, the entire inhibition region exhibited by fraction B5 displayed slight
fluorescence quenching at UV-254 nm (Figure 7.4b).
c.
20 17 9
0 B5 B1 B3 B4 B2 B5 B1 B3 B4 B2
b.
43
17
68
B5 B1 B3 B4 B2
a.
77
59
43
32 43
32 32
68
52
38
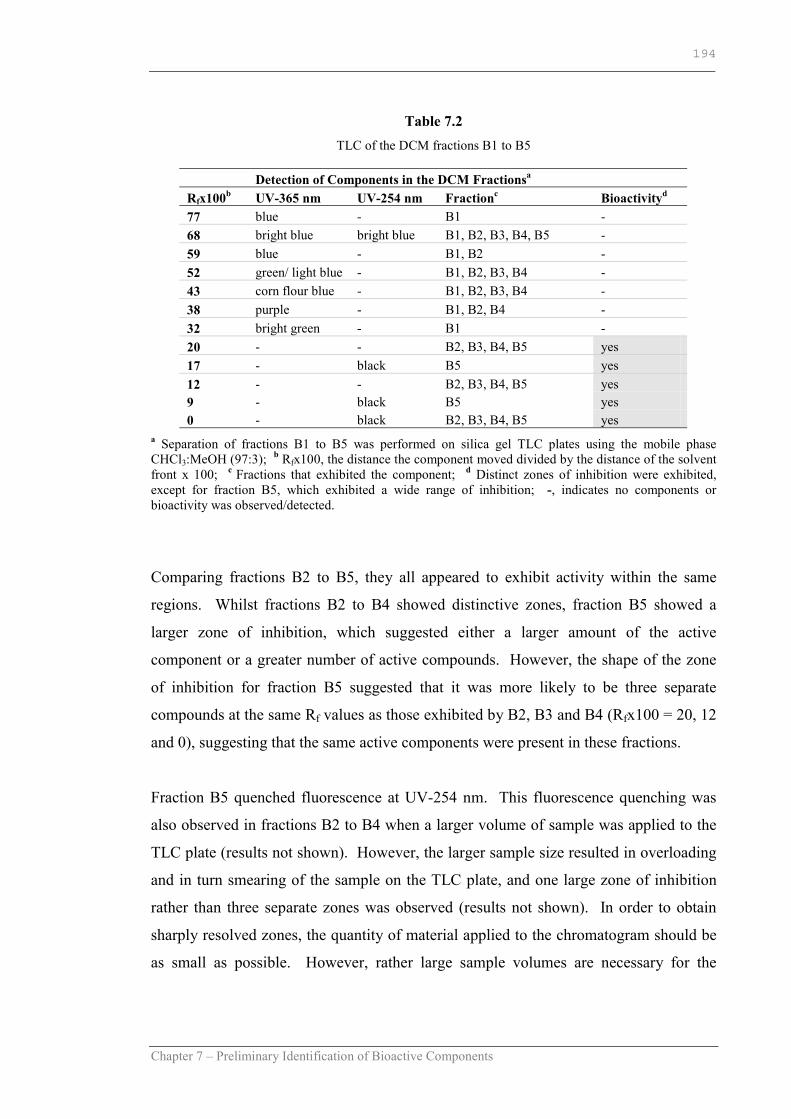
Chapter 7 – Preliminary Identification of Bioactive Components
194
Table 7.2 TLC of the DCM fractions B1 to B5
Detection of Components in the DCM Fractionsa Rfx100b UV-365 nm UV-254 nm Fractionc Bioactivityd 77 blue - B1 - 68 bright blue bright blue B1, B2, B3, B4, B5 - 59 blue - B1, B2 - 52 green/ light blue - B1, B2, B3, B4 - 43 corn flour blue - B1, B2, B3, B4 - 38 purple - B1, B2, B4 - 32 bright green - B1 - 20 - - B2, B3, B4, B5 yes 17 - black B5 yes 12 - - B2, B3, B4, B5 yes 9 - black B5 yes 0 - black B2, B3, B4, B5 yes
a Separation of fractions B1 to B5 was performed on silica gel TLC plates using the mobile phase CHCl3:MeOH (97:3); b Rfx100, the distance the component moved divided by the distance of the solvent front x 100; c Fractions that exhibited the component; d Distinct zones of inhibition were exhibited, except for fraction B5, which exhibited a wide range of inhibition; -, indicates no components or bioactivity was observed/detected.
Comparing fractions B2 to B5, they all appeared to exhibit activity within the same
regions. Whilst fractions B2 to B4 showed distinctive zones, fraction B5 showed a
larger zone of inhibition, which suggested either a larger amount of the active
component or a greater number of active compounds. However, the shape of the zone
of inhibition for fraction B5 suggested that it was more likely to be three separate
compounds at the same Rf values as those exhibited by B2, B3 and B4 (Rfx100 = 20, 12
and 0), suggesting that the same active components were present in these fractions.
Fraction B5 quenched fluorescence at UV-254 nm. This fluorescence quenching was
also observed in fractions B2 to B4 when a larger volume of sample was applied to the
TLC plate (results not shown). However, the larger sample size resulted in overloading
and in turn smearing of the sample on the TLC plate, and one large zone of inhibition
rather than three separate zones was observed (results not shown). In order to obtain
sharply resolved zones, the quantity of material applied to the chromatogram should be
as small as possible. However, rather large sample volumes are necessary for the

Chapter 7 – Preliminary Identification of Bioactive Components
195
detection of substances that are present in low concentrations, which inevitably results
in broadening and overlapping of zones (Wagner et al., 1984).
The mobile phase CHCl3:MeOH (97:3) effectively separated the less polar components
that fluoresced at UV-365 nm. The more polar active components, which did not
fluoresce and had lower Rf values, were not separated well from each other. It is known
that if components are similar in structure they will migrate close to each other on silica
gel and be difficult to separate (Harbourne, 1973). This appeared to be the case in this
investigation, as distances between active components did not change when a number of
different solvent systems were investigated (results not shown). In addition, when a
more polar solvent was used to separate fractions B1 to B5, they were eluted at Rf
values similar to that of the components that gave colour fluorescence at UV-365 nm,
which led to difficulty in assigning antibacterial activity to particular compounds.
Overall, it was observed that the active components in fractions B2 to B4 did not
fluoresce at UV-365 nm and exhibited little fluorescence quenching at UV-254 nm. It
is quite common for some natural plant and fungal compounds to neither fluoresce at
UV-365 nm nor quench fluorescence at UV- 254 nm (Harbourne, 1973; Wagner et al.,
1984). This makes detection and identification of such compounds difficult.
The C series fractions (C1 to C3) were separated using the solvent system
CHCl3:MeOH (90:10) (Figure 7.5). Bioautography of the TLC plate showed that the
concentration of the active components in fraction C1 was small, whilst fractions C2 to
C4 contained higher concentrations. This was indicated by a slight zone of inhibition
and strong zones of inhibition, respectively (Figure 7.5c). The components in fraction
C7 exhibited no antibacterial activity. The slight figure eight shape exhibited by the
zone of inhibition of fraction C2 suggested that there were two active components
present (Figure 7.5c). The first zone of inhibition (Rfx100 = 42) in fraction C2 also
quenched UV light at 254 nm (Figure 7.5b) and appeared as a blue crescent spot when
viewed under UV light at 365 nm (Figure 7.5a). There was also activity seen beneath
this component (Rfx100 = 32), which appeared to be the same as that observed for one
of the active components in fraction C4 (Figure 7.5c). However, at this Rfx100 (32),
fraction C2 did not fluoresce and quench fluorescence at UV-365 and UV-254 nm,

Chapter 7 – Preliminary Identification of Bioactive Components
196
respectively, as was exhibited by the same component in fraction C4 (Table 7.3). This
suggested that the active component was in a much greater concentration in fraction C4
than C2, or indeed a different component with identical Rf value. However,
bioautography zones suggested the active component was in a similar concentration
(Figure 7.5).
Figure 7.5. TLC of DCM fractions C1 to C7. Compounds on the TLC plates were visualised at (a) 365 nm and (b) 254 nm. Corresponding active compounds were observed by (c) bioautography of the TLC plate. TLC plates were developed in CHCl3:MeOH (90:10); Rfx100 values have been labelled to the left of spots of interest.
Table 7.3 TLC of the DCM fractions C1 to C7
Detection of Components in the DCM Fractionsa Rfx100b UV-365 nm UV-254 nm Fractionc Bioactivityd
0.70 bright blue Black C1 - 0.52 blue Black C3 yes 0.42 blue moon (∩ ) Black C2, C3 yes 0.32 blue Black C2, C4, C5 yes 0.25 blue Black C5, C6 yes 0.22 purple - C5, C6 - 0.18 green Black C5, C6 - 0.14 dark purple - C5, C6 -
a Separation of fractions C1 to C7 was performed on silica gel TLC plates using the mobile phase CHCl3:MeOH (90:10); b Rfx100, the distance the component moved divided by the distance of the solvent front x 100; c Fractions that contained the component; d Zones of inhibition exhibited. Note shaded components exhibited a zones of inhibition over a range; -, indicates no components or bioactivity was observed/detected.
C4 C1 C2 C5 C6 C7 C3
52
42
32 22 14
18
a.
C1 C6 C4 C2 C5 C7 C3
b.
42
25
52
32
C5 C4 C1 C2 C6 C7 C3
c.
52
42
32 32 25 25 25

Chapter 7 – Preliminary Identification of Bioactive Components
197
Fraction C3 exhibited strong activity at an Rfx100 = 52 (Figure 7.5c), which correlated
with a blue spot seen at UV-365 nm (Figure 7.5a). This active spot also quenched
fluorescence at UV-254 nm (Figure 7.5b). In addition, the shape of the zone of
inhibition exhibited by fraction C3 combined with the observation that the zone
overlapped that exhibited by fraction C2, suggested that there were two active
components present in this fraction. The second active component appeared to have an
Rfx100 = 42, the same as that seen in fraction C2. On repeat bioautographic analyses
using smaller concentrations of fraction C3, it was observed that the activity was
actually due to three components (results not shown). However, separation of these
three components was difficult and therefore, three distinct zones of inhibition were not
easily observed. Bioautography of fraction C3, which is discussed in the following
section with regards to compound identification, showed zones of inhibition that
suggested there were three active components present (Figure 7.6, in Section 7.3.3).
Fractions C5 and C6 were combined as they were observed to contain the same four
components seen at UV-365 nm, a blue spot (Rfx100 = 25), purple spot (Rfx100 = 22),
green spot (Rfx100 = 18) and a dark purple spot (Rfx100 = 14). The purple spots are
difficult to see in the figure presented, as the colour is similar to the background colour
of the TLC plate (Figure 7.5a). The component that fluoresced blue at UV-365 nm
(Rfx100 = 25) was the only spot to quench fluorescence at UV-254 nm (Figure 7.5b)
and exhibit a zone of inhibition (Figure 7.5c). A slight zone of inhibition, exhibited at
an Rfx100 = 25, was also observed in fraction C4, which suggested that some of this
component was also contained in this fraction.
Fractions that appeared to contain more than one active component were subjected to
different TLC solvent systems in an attempt to separate the active components (results
not shown). This resulted in the active components moving further up the plate yielding
larger Rf values, but the relative distance between the active spots did not change. This
strongly suggested that some of the active components were very similar in structure.
When components are similar in structure they can be very difficult to identify as the
separation systems required become complex (Harbourne, 1973). However, as this
investigation was only interested in the class of compounds present that exhibited
activity rather than absolute identification of the compounds, complete separation of the

Chapter 7 – Preliminary Identification of Bioactive Components
198
active components was not necessary. If complete identification of the active
compounds were to be performed, further separation and purification using HPLC and
other chromatographic techniques would be required. Preliminary identification using
specific and universal detection reagents on TLC plates is discussed in the following
section.
7.3.3 Detection of Classes of Compounds Fractions B2, B3, B4, B5, C2, C3, C4 and C5/6 were selected for the determination of
the classes of compounds of active components. These fractions were chosen as they
covered all components that exhibited antibacterial activity in the final stages of the
fractionation process. Fractions within the B series and C series were subjected to silica
gel TLC using the mobile phase CHCl3:MeOH (95:5) and CHCl3:MeOH (90:10),
respectively, as described in Section 3.12.2. Rfx100 values of the active components
and in turn the corresponding colour reactions were determined and compared. A
number of TLC plates were spotted with the fractions, developed, dried and then
sprayed with different spray reagents to determine the presence of classes of compounds
(Section 3.14). Bioautography was also performed on separate TLC plates as described
in Section 3.13.5 and photos of plates are shown in Figure 7.6. Components that
exhibited bioactivity and their corresponding colour reactions determined using each
spray reagent are presented in Table 7.4.
Since there appear to be few reports on using spray reagents for the preliminary
chemical identification of constituents in basidiomycetous fungi, the spray reagents
chosen were those that have been used in the phytochemical identification of plant
constituents (Ahmad & Beg, 2001; Ebi & Kamalu, 2001; van der Watt & Pretorius,
2001). Preliminary identification of active constituents in plants using TLC spray
reagents has been performed for many years and only recently have the same techniques
been used in the identification of constituents in Ganoderma species (Aryantha et al.,
2002). Spray reagents used have been listed in the Materials and Methods chapter
(Section 3.14.1). In the case where a first spray reagent detected a certain class of
compound, a second spray reagent was then used for confirmation.

Chapter 7 – Preliminary Identification of Bioactive Components
199
Figure 7.6 displays the bioautography results of the B and C series fractions separated
using the mobile phase CHCl3:MeOH (95:5) and CHCl3:MeOH (90:10), respectively.
Three active components were observed in the B series at Rfx100 values of 55, 49 and
32. Another five components that exhibited activity were observed in the C series
fractions at Rfx100 values of 60, 52, 42, 32 and 25. These eight active components
were the focus of class identification using detection reagents. Separation of these
active components was attempted using different solvent systems but did not prove
successful, which suggested that some of the components were similar in structure.
Nevertheless, for the purpose of class identification, this was not necessary as the active
components had different Rfx100 values.
Figure 7.6. Bioautography agar overlay of the B series and C series fractions from the DCM extract. Rfx100 values are shown to the left of active components. (a) B series fractions (B2 to B5) separated by TLC using the mobile phase CHCl3:MeOH (95:5) and (b) C series fractions (C2 to C5) separated using the mobile phase CHCl3:MeOH (90:10); Note that Rfx100 values cannot be compared between plates since they were developed in different solvent systems.
Table 7.4 shows Rfx100 values and the corresponding colour reaction for the eight
components that exhibited antibacterial activity. For ease of discussion, the active
components in the B series that exhibited Rfx100 values of 55, 49 and 32 have been
numbered 1, 2 and 3, respectively, and active components in the C series exhibiting
Rfx100 values of 60, 52, 42, 32 and 25 have been numbered 4, 5, 6, 7 and 8,
respectively. In addition, rather than separately discussing the results of each spray
reagent reaction for the different active components, the different classes of compounds
B2 B3 B5 B4 C2 C3 C5 C4
a. b.
55
32
49 49
32
55 55 49 49
32 32 25
52
32 42
32 25
42
60
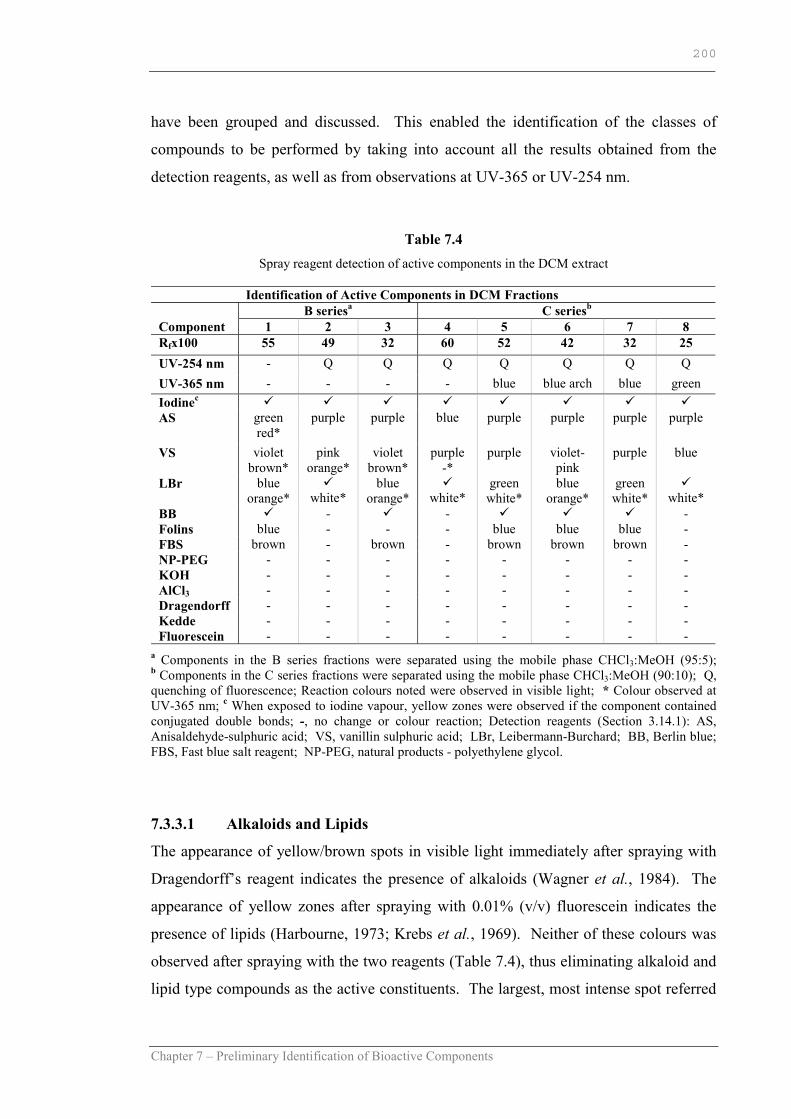
Chapter 7 – Preliminary Identification of Bioactive Components
200
have been grouped and discussed. This enabled the identification of the classes of
compounds to be performed by taking into account all the results obtained from the
detection reagents, as well as from observations at UV-365 or UV-254 nm.
Table 7.4 Spray reagent detection of active components in the DCM extract
Identification of Active Components in DCM Fractions B seriesa C seriesb Component 1 2 3 4 5 6 7 8 Rfx100 55 49 32 60 52 42 32 25 UV-254 nm - Q Q Q Q Q Q Q UV-365 nm - - - - blue blue arch blue green Iodinec AS green
red* purple purple blue purple purple purple purple
VS violet brown*
pink orange*
violet brown*
purple -*
purple violet-pink
purple blue
LBr blue orange*
white*
blue orange*
white*
green white*
blue orange*
green white*
white*
BB - - - Folins blue - - - blue blue blue - FBS brown - brown - brown brown brown - NP-PEG - - - - - - - - KOH - - - - - - - - AlCl3 - - - - - - - - Dragendorff - - - - - - - - Kedde - - - - - - - - Fluorescein - - - - - - - -
a Components in the B series fractions were separated using the mobile phase CHCl3:MeOH (95:5); b Components in the C series fractions were separated using the mobile phase CHCl3:MeOH (90:10); Q, quenching of fluorescence; Reaction colours noted were observed in visible light; * Colour observed at UV-365 nm; c When exposed to iodine vapour, yellow zones were observed if the component contained conjugated double bonds; -, no change or colour reaction; Detection reagents (Section 3.14.1): AS, Anisaldehyde-sulphuric acid; VS, vanillin sulphuric acid; LBr, Leibermann-Burchard; BB, Berlin blue; FBS, Fast blue salt reagent; NP-PEG, natural products - polyethylene glycol.
7.3.3.1 Alkaloids and Lipids
The appearance of yellow/brown spots in visible light immediately after spraying with
Dragendorff’s reagent indicates the presence of alkaloids (Wagner et al., 1984). The
appearance of yellow zones after spraying with 0.01% (v/v) fluorescein indicates the
presence of lipids (Harbourne, 1973; Krebs et al., 1969). Neither of these colours was
observed after spraying with the two reagents (Table 7.4), thus eliminating alkaloid and
lipid type compounds as the active constituents. The largest, most intense spot referred

Chapter 7 – Preliminary Identification of Bioactive Components
201
to earlier on in the fractionation process (Section 7.3.1), however, did not exhibit
antibactierial activity, was determined to be an alkaloid type compound. This spot
appeared yellow/orange in visible light after spraying with Dragendorff’s reagent, as
well as fluoresced bright blue at UV-365 nm (results not shown), which is indicative of
alkaloids (Harbourne, 1973; Wagner et al., 1984).
7.3.3.2 Phenols
A number of detection reagents have been developed that can detect phenolic
compounds. Such detection includes the presence of blue spots in visible light after
spraying with Folins reagent and the appearance of red-brown zones in visible light
after spraying with Fast Blue Salt reagent (FBS) (Wagner et al., 1984), or the
appearance of intense green, purple, blue or black colour in visible light after spraying
with Berlin Blue (BB) reagent (Harbourne, 1973). The majority of the active
constituents in the fractions gave positive colour reactions with these spray reagents,
indicating the presence of phenolics (Table 7.4). However, components no. 2, 4 and 8
(Rfx100 = 49, 60 and 25, respectively) did not react with any of these reagents (Table
7.4), which suggested that these compounds were not phenolic structures or structures
that contained phenolic units.
Phenolic compounds absorb in short UV wavelength, which is observed as dark spots
on the plates (Harbourne, 1973). Although components 2 and 3 (Rfx100 = 49 and 32,
respectively) quenched fluorescence at UV-254 nm, other structures are also known to
cause this effect. Components 4 and 8 also quenched fluorescence at UV-254 nm
(results not shown) and, as previously observed, did not have any positive phenolic
reactions. Components 5, 6 and 7 (Rfx100 = 52, 42, 32, respectively) were observed to
quench fluorescence at UV-254 nm (Table 7.4). They also exhibited positive reactions
with all the phenolic detection reagents, suggesting that they were phenolic structures or
contained phenolic units.
7.3.3.3 Flavonoids and Coumarins
Coumarins and flavonoids are phenolic structures (Cowan, 1999) and have been shown
to exhibit antibacterial activity from plants (Ahmad & Beg, 2001; Nostro et al., 2000).
However, there appear to be no reports of fungal flavonoids or coumarins exhibiting

Chapter 7 – Preliminary Identification of Bioactive Components
202
antibacterial activity. This was also the case in this investigation. The active
components did not react with either KOH or AlCl3, indicating that they were neither
coumarin nor flavonoid type compounds (Table 7.4). This was confirmed using the
spray reagents NP-PEG, which intensifies the fluorescence of native coumarins at UV-
365 nm, and FBS, which reacts with flavonoids to produce blue to blue violet zones in
visible light (Table 7.4) (Krebs et al., 1969; Wagner et al., 1984).
A number of coumarins and flavonoids were observed in earlier fractions of the crude
DCM extract, as indicated by their fluorescence of bright blue, blue, purple and green at
UV-365 nm (Harbourne, 1973). However, none of these compounds exhibited
antibacterial activity in earlier assays and thus were not included at this stage of the
investigation.
7.3.3.4 Anthracene Derivatives
KOH and NP-PEG are also used for the detection of anthracene derivatives. When the
TLC plate is sprayed with KOH, anthraquinones appear red in visible light and exhibit
red fluorescence in UV-365 nm, whilst anthrones and anthronols appear yellow in
visible light and exhibit yellow fluorescence in UV-365 nm (Wagner et al., 1984).
When NP-PEG is used as the detection reagent, anthracene derivatives give intense
yellow fluorescence at UV-365 nm (Wagner et al., 1984). No active components
yielded these colours when these spray reagents were applied, indicating that they were
not derivatives of anthracene (Table7.4). In addition, there was no yellow or red to
brown fluorescence exhibited by the active components at UV-365 nm, which also
indicated they were not anthracene derivatives (Wagner et al., 1984).
7.3.3.5 Terpenoids
Non-specific detection of terpenoids can be performed by spraying the plate with
vanillin-sulphuric acid reagent (VS), anisaldehyde-sulphuric acid reagent (AS) or
Liebermann-Burchard reagent (LB), heating the plate at 100ºC for 5 to 10 minutes and
then observing for colours in visible light (Wagner et al., 1984). All active components
exhibited distinct colours, ranging from violet/purple to blue to green, with these
detection reagents, indicating the presence of terpenoids (Table 7.4). The colour

Chapter 7 – Preliminary Identification of Bioactive Components
203
reactions with these reagents were strong, suggesting that the active components were
terpenoid type.
Natural terpenoids have cyclic structures with one or more functional groups (e.g.
hydroxyl, carbonyl) (Harbourne, 1973). They have conjugated double bond systems
that will appear as yellow zones in visible light when exposed to iodine vapour (Wagner
et al., 1984). All active components displayed this reaction when exposed to the
vapour, confirming that they were compounds that contained conjugated double bonds
(Table 7.4). This confirmed the positive reactions obtained with the terpenoid universal
detection reagents, including VS, As and LBr reagents (Table 7.4). Phenolic units can
also be encountered in terpenoids (as a functional group) (Harbourne, 1973) and may
explain why there were positive reactions with some of the detection reagents that
detect phenolic compounds. In addition, the colour reactions observed for phenolics
were less intense than those for terpenoids, which suggested that they were a substituent
attached to the main terpenoid compound.
Terpenoids encompass a number of compounds including: volatile mono- and
sesquiterpenes (C15) (essential oils) through to the less volatile diterpenes (C20) to the
involatile triterpenoids and sterols (C30) and carotenoid pigments (C40) (Harbourne,
1973). Unfortunately there is no sensitive universal reagent for the detecting classes of
terpenoids (Harbourne, 1973). Thus, differentiation of the different types of terpenoids
is generally impossible by using TLC spray reagents.
Triterpenes have been detected in Ganoderma by spraying with LBr reagent and
observing for fluorescence at UV-365 nm (Aryantha et al., 2002). In this investigation,
all the active components fluoresced white or orange at UV-365 nm after spraying with
this detection reagent, which suggested the active components were triterpenes. In
addition, when sprayed with the same reagent and viewed in visible light, triterpenoids
and sterols appear a blue to green colour (Harbourne, 1973), which was also observed
for components 1, 3, 5, 6 and 7 (Table 7.4). However, further testing would need to be
performed to confirm this, which was beyond the scope of this investigation. An
interesting observation, however, is that most of the pharmacologically active

Chapter 7 – Preliminary Identification of Bioactive Components
204
compounds isolated from Ganoderma species have been triterpenoids (Chairul et al.,
1991; Gao et al., 2002a; Kimura et al., 2002; Wu et al., 2001).
Two types of triterpenes that can be specifically detected are cardiac glycosides and
saponins (Harbourne, 1973; Wagner et al., 1984). Cardiac glycosides are detected by
the appearance of pink zones in visible light after spraying with Kedde reagent
(Harbourne, 1973). When TLC plates containing active fractions were sprayed with this
reagent some of the compounds turned pink (results not shown). However, none of
these pink spots correlated with those of the active components, indicating that the
active components were not cardiac glycosides. There is no specific detection of
saponins using spray reagents, but they have soap like properties and are generally
observed if the solution that contains the extract foams (Harbourne, 1973). Foaming of
the extract did not occur, which eliminated the presence of saponins. However,
component 1 did not fluoresce at UV-365 nm or quench fluorescence at UV-254 nm
(Table 7.4), which are properties associated with saponins (Harbourne, 1973).
7.3.3.6 Preliminary Identification of the Active Components
Overall, the results indicated that the active components were terpenoid type
compounds, some with phenolic groups attached. A summary of the results are
displayed in Table 7.5, which shows that all components were terpenoids type structures
containing conjugated bond systems. Components 1, 3, 5, 6 and 7 also contained
phenolic groups attached to the main terpenoid structure. Compounds that have similar
structures tend to migrate close to each other using TLC, making them difficult to
separate (Harbourne, 1973). Thus, the preliminary identification of all compounds into
the same class of compounds may explain why there was difficulty in separating the
active components in the fractionation processes (Section 7.3.2).
There were other characteristics of the extract and resulting fractions that supported the
classification of the active components into the class of terpenoids. Such factors
include: 1) Terpenoids are lipid soluble and often difficult to characterise on a
microscale level since all (except carotenoids) are colourless (Harbourne, 1973). This
was the case in this investigation, as the fractionation process proceeded the active
fractions became clear and there was no detection in visible or UV light; and, 2)

Chapter 7 – Preliminary Identification of Bioactive Components
205
Terpenoids are generally extracted from plants by light petroleum, ether or chloroform
and can be separated on silica gel chromatography using the same solvents (Cowan,
1999; Harbourne, 1973). The DCM extract in this investigation exhibited the strongest
antibacterial activity and partial separation of components in the extract was performed
on silica gel using similar solvents.
Table 7.5 Summary of the class of compounds for the active components present in the DCM extract
Identification of Active Components in DCM Fractions B seriesa C seriesb Component 1 2 3 4 5 6 7 8 Rfx100 55 49 32 60 52 42 32 25 UV-254 nm - + + + + + + + UV-365 nm - - - - + + + + CONJUGATED DOUBLE BONDS
+ + + + + + + +
ALKALOIDS - - - - - - - - LIPIDS - - - - - - - - TERPENOIDS + + + + + + + + Saponins - - - - - - - - Cardiac glycosides - - - - - - - - PHENOLICS + - + - + + + - Coumarins - - - - - - - - Flavonoids - - - - - - - -
a Components in the B series fractions were separated using the mobile phase CHCl3:MeOH (95:5); b Components in the C series fractions were separated using the mobile phase CHCl3:MeOH (90:10); +, positive detection; -, not detected;
There have been reports of volatile oils and sesquiterpenes from plants that have been
shown to exhibit antibacterial activity (Anke & Sterner, 1991; Dorman & Deans, 2000).
Sesquiterpenes from the mycelial culture of two basidiomycetous fungi, Flammulina
velutipes and Resupinatus leightonii, have also been shown to exhibit antibacterial
activity (Eilbert et al., 2000; Ishikawa et al., 2001). However, the likelihood that the
active components were mono-terpenoids or sesquiterpenoids (essential oils) was very
low, as preliminary analysis of the active fractions by GC-MS showed no volatile
compounds (results not shown). Since, essential oils are highly volatile (Dorman &
Deans, 2000; Harbourne, 1973) they should be relatively easy to detect by GC-MS. In
addition, there have been no reports on the isolation of sesquiterpenes from Ganoderma
species (Mothana et al., 2000).
Chapter 7 – Preliminary Identification of Bioactive Components
206
Diterpenes and triterpenes are found to exist in the resins and barks of trees or the latex
of herbaceous plants (Harbourne, 1973). Ganoderma cupreum is known to be a woody
fungus with a latex context (Smith & Sivasithamparam, 2003) and therefore might
exude these types of terpenoids. They generally have a protective function in nature
(Harbourne, 1973), and studies have shown that various diterpenes and triterpenes
extracted from other sources have exhibited antibacterial activities (Pinducciu et al.,
1995; Savluchinske Feio et al., 1999; Wilkens et al., 2002). In addition, it has been
reported that there is no single TLC system available for their resolution, and they are
not volatile (Harbourne, 1973).
The main constituents isolated from Ganoderma species have been triterpenoids, which
include steroidal compounds (Chen & Chen, 2003; Kleinwachter et al., 2001; Rosecke
& Konig, 2000; Su et al., 2000, 2001). Many of these compounds have been shown to
possess antitumour activity (Gan et al., 1998a; Lin et al., 1991; Wu et al., 2001), as well
as antioxidant properties (Zhu et al., 1999). However, there appear to be only a few
investigations on the antibacterial properties of such compounds (Li et al., 2000b;
Mothana et al., 2000; Smania et al., 1999).
Overall, the active constituents were determined to be in the class of terpenoids, and
most likely to be triterpenes, given the number of triterpenes from Ganoderma species
with reported biological activity (Chairul et al., 1991; El-Mekkawy et al., 1998; Giner-
Larza et al., 2000; Kimura et al., 2002). However, to confirm this, further studies
would need to be performed. To determine the structures, the fractions would need to
be further purified by HPLC and identified using other spectroscopic techniques such as
NMR, GC-MS, UV and IR. This was beyond the scope of this investigation as the
primary purpose of this investigation was only to identify the class of compound.
Therefore, this chapter reported the preliminary identification of some of the major
active components found in the DCM extract from Ganoderma cupreum, and is one of
the first accounts of Ganoderma terpenoid compounds exhibiting antibacterial activity.
7.4 Summary Putative chemical identification (class of compounds) of antibacterial components in the
DCM extract from the mycelium of an Australian Ganoderma isolate was performed.
Chapter 7 – Preliminary Identification of Bioactive Components
207
This was achieved using a bioassay-guided fractionation process, which utilised TLC
and an agar-overlay bioautographic technique. Only the components that exhibited
antibacterial activity were of interest. Detection of the components was based on
fluorescence at UV-365 nm or UV absorption at UV-254 nm, as well as the use of
selective or universal chemical spray reagents.
TLC was chosen as the means for analysis as it is a simple, fast and reproducible means
of detecting constituents in a crude extract (Hostettmann, 1999). Initial analysis by
TLC determined there to be eighteen components present in the crude DCM extract
(Section 7.3.1). Bioautographic analysis of these components indicated that the
antibacterial activity was restricted to the less polar components in the extract (Figure
7.1). The number of biologically active components could not be determined in initial
stages due to the low concentration of the components exhibiting activity. After further
purification, it was observed that there were more than eighteen components present in
the crude DCM extract (Section 7.3.2). As some of the components were present in low
concentrations, they were only detected in the later stages of the fractionation and
purification process. However, since only the biologically active components were of
interest, the absolute number of components in the extract was not considered to be of
high importance.
Partial purification of the extract was performed by silica gel column chromatography
and a stepwise gradient, beginning with CHCl3:MeOH (99:1) and ending with
CHCl3:MeOH (2:8). The first purification yielded thirty fractions and the fractions that
contained like compounds were combined to make seven final separate fractions from
the first purification (A series) (Figure 7.2). Analysis of the fractions for antibacterial
activity demonstrated that four of these, A2, A3, A4 and A6, exhibited activity (results
not shown). Fractions A2, A3 and A4, showed strong activity and were subjected to a
second purification step.
A second purification using the same system was performed on fractions A2, A3 and
A4 (Section 7.3.2.2). This led to eleven further fractions, of which eight fractions, B2
to B5 and C2 to C5, had components that displayed antibacterial activity (Figure 7.4 and
Figure 7.5). The active components within these fractions were then separated and

Chapter 7 – Preliminary Identification of Bioactive Components
208
analysed by TLC using two solvent systems. Fractions B2 to B5 were separated using
CHCl3:MeOH (95:5) and fractions C2 to C4 were separated using CHCl3:MeOH
(90:10). Bioautographic analysis of the eight fractions yielded eight active components
(Figure 7.6).
Finally, a number of TLC spray reagents were used to identify the chemical class of
active compounds (Section 7.3.3). These reagents, combined with the localisation of
the active components in the bioautography assay, determined that the eight active
components were terpenoids. In addition, five of the active components were
determined to be terpenoid type compounds with phenolic groups (Table 7.4 and Table
7.5). This is one of the first accounts of the isolation of antibacterial terpenoid type
compounds from the mycelium of Ganoderma cupreum.

8 Chapter Eight
CCoonncclluussiioonn
Chapter 8 - Conclusion
210
8.1 Identification of Three Australian Ganoderma Isolates Three Australian Ganoderma species, which had been isolated from the Cairns State
Forest by a local mushroom cultivator, were confirmed to be from the Family
Ganodermataceae. Using molecular tools and evolutionary studies, the three species
were identified to be Ganoderma cupreum (H1), Ganoderma weberianum (H2) and
Ganoderma species (H3) (Section 4.3.3.4). The third isolate, Ganoderma H3, could not
be classified to a particular species using molecular methods, as the available sequence
data in the Ganoderma database did not contain sufficiently closely related sequences to
allow identification. However, traditional methods have identified this isolate as an
Australian G. boninense (personal communication, Dr. Brendan J. Smith, CSIRO,
Canberra, ACT, Australia). The speciation of this Ganoderma will require additional
sequence data of Australian G. boninense isolates.
With reports suggesting that many Ganoderma species have been misnamed (Hseu &
Wang, 1991; Ryvarden, 1991), the correct identification of the three Australian
Ganoderma isolates was an important first step in this investigation. The nucleotide
sequence data (entire ITS I to ITS II region) for the three species were given accession
numbers and submitted for future reference into GenBank, a universal sequence data
bank that is accessible worldwide. Accession numbers are: Ganoderma cupreum (H1),
AY569450; Ganoderma weberianum (H2) AY569451, and; Ganoderma species (H3),
AY569452. This is a major contribution to the database on Ganoderma species,
particularly from the Asia-Pacific region, and will ultimately aid in establishing a
universal classification system for Ganoderma. In addition, this will aid in the
clarification of misidentified species and enable correct identification of new species in
the future.
8.2 Storage and Growth of Three Australian Ganoderma Isolates Long term and short term storage conditions of the three Ganoderma isolates were
identified. The importance of suitable long term storage conditions was so the fungi
would remain viable throughout this investigation, as well as for future reference and
use. The most suitable method determined for the long term storage of the isolates was
on balsa wood chips, stored at –80ºC for periods of up to 2 years without subculture
(Section 5.3.1.1). However, long term storage resulted in decreased growth after

Chapter 8 - Conclusion
211
subculture of both Ganoderma H1 and H3. Short-term storage, which was investigated
to allow for rapid subculture throughout this investigation, was determined to be best on
agar slants up to a maximum of eight weeks for the three isolates (Section 5.3.1.2). In
addition, it was important to store Ganoderma species H1 and H3 away from direct
light, as light was observed to have a detrimental effect on the viability of the
mycelium. The viability studies highlighted that closely related species can require
different storage conditions and the importance of determining appropriate conditions
for the survival of each fungus.
The optimal temperature and pH for the mycelial growth of the three isolates were
determined to be 30°C and an initial medium pH of 6 (Section 5.3.2.1). This is similar
to what has been reported for other Ganoderma species (Yang & Liau, 1998) and agrees
with the observation that Ganoderma species are generally isolated from tropical
regions (Moncalvo & Ryvarden, 1998). However, the growth behaviour generally
varied between the three isolates. The temperature range over which the fungi grew
(Section 5.3.2.1) as well as their growth rates (Section 5.3.2.2) were different, again
highlighting that there can be differences between closely related species.
A liquid growth medium, which contained phosphates, organic nitrates and minerals,
was found to support the best mycelial growth of the three Australian isolates (Section
5.3.2.3) and the carbohydrate source within this medium affected mycelial biomass
production (Section 5.3.2.4). It was observed that glucose supported the greatest growth
of both G. cupreum (H1) and G. weberianum (H2), and galactose and fructose
supported the greatest growth of Ganoderma species (H3) (Section 5.3.2.4). These
observations were generally consistent with other reports that have noted that different
species can utilise different nutrient sources (Griffin, 1994; Sone et al., 1985; Tang &
Zhong, 2002).
Some important growth factors, including pH, temperature and carbohydrate source, for
the three isolates were identified. This enabled the rapid production of the mycelial
biomass to produce sufficient quantities for further investigation of the antibacterial
activities of the mycelium. These growth conditions provided evidence that fungi from
different regions around the world may require different growth conditions as well as

Chapter 8 - Conclusion
212
the notion that different species from within the same genus may also require different
growth factors. In addition, these growth conditions have added to the wealth of
information currently available on the growth and cultivation of Ganoderma, but more
importantly contributed to information on the specific species, G. cupreum (H1), G.
weberianum (H2), and possibly G. boninense (H3).
8.3 Antibacterial Properties The antibacterial activity of the mycelium from the three Australian Ganoderma isolates
was investigated. Two extraction processes were employed, a hot water and organic
extraction (Chapter 6). Preliminary results indicated that both the aqueous and organic
extracts from G. cupreum (H1) possessed activity against a greater range of bacteria
than the other Ganoderma isolates, and thus, Ganoderma H1 was used for a more in-
depth investigation. Hot water extracts exhibited activity against some Gram positive
bacteria (Section 6.3.1.2). However, organic solvent extracts exhibited antibacterial
activity against a greater range of Gram positive bacteria (Section 6.3.1.4) of which the
DCM extract appeared to have the strongest antibacterial effect. Other reports have also
shown chlorinated solvent extracts from different Ganoderma species to possess
biological activity towards Gram positive bacteria (Mothana et al., 2003; Smania et al.,
1999). Activity was also observed for the HEX and EtOAc extracts, but this activity
was limited to one or two bacteria for extracts from mycelium cultivated in PDB. No
activity was exhibited against the Gram negative bacteria for any of the extracts.
The medium that supported the greatest mycelial growth of G. cupreum (H1) (Basal-G)
also yielded extracts with the greatest antibacterial activity (Section 6.3.2.2), thus, the
selection of this growth medium for further investigations of G. cupreum (H1). The
HEX, DCM and EtOAc extracts from this fungus exhibited antibacterial activity
towards some Gram positive aerobic/aerotolerant bacteria, B. cereus, B. subtilis, E.
faecalis, S. pyogenes, S. aureus S. epidermidis and L. monocytogenes, as well as some
Clostridium species, C. perfringens, C. sporogenes. In particular, the antibacterial
activity exhibited against a number of clinically important pathogens, Clostridium
difficile, and MRSAs, was of great significance, as these bacteria are among those that
are reported to have resistance to a number of currently available antibiotics (Lipsitch &
Samore, 2002; Swartz, 2000).

Chapter 8 - Conclusion
213
The effective concentrations of the most active organic extracts were investigated by
means of minimum inhibitory concentration (MIC) and minimum bactericidal
concentration (MBC) assays (Section 6.3.2.6). HEX extracts were not investigated
further due to their insolubility in the broth medium cultures. It was observed that a
lower concentration was required to kill the Clostridium isolates than the other bacteria,
indicating that the anaerobic bacteria were more susceptible to the extracts (Section
6.3.2.6). The MIC and MBC values (Table 6.11) along with the concentration dose
graphs (Figure 6.8a-w) indicated that the inhibitory action exhibited by the extract was
concentration dependent and that the concentration would depend on the target bacteria.
Time course growth assays confirmed the bacteriostatic or bactericidal activity of the
extracts against the different test organisms. The DCM and EtOAc extracts were
predominantly bactericidal against the range of bacteria tested (Figure 6.9 and 6.10).
However, this was highly dependent on the concentration of the extract and the target
organism.
This is the first report of antibacterial activity of extracts from the liquid cultivated
mycelium of Ganoderma.
8.4 Identification of Active Components Preliminary identification of the components that exhibited antibacterial activity from
the DCM extract was carried out (Chapter 7). Bioassay guided fractionation partially
purified more than one active compound that was present in the DCM crude extract
(Section 7.3.2). These active compounds were determined to be terpenoid in structure,
some with phenolic groups attached. This preliminary identification is in general
consensus with reports in the literature that triterpenes (a subclass of terpenoids) are a
major group of constituents isolated from Ganoderma that have been shown to
possesses biological activity (Kim & Kim, 1999a; Kimura et al., 2002; Mizuno et al.,
1995c; Wu et al., 2001).
It is most likely that the active compounds isolated from this Australian Ganoderma
species are triterpenoid type compounds. However, until further structure elucidation is
performed, one can only speculate as to the type of terpenoid present. To identify the
exact type of compound, further work is required which would involve complete
Chapter 8 - Conclusion
214
purification of the active compounds and further analysis using chromatographic
techniques. However, this is beyond the scope of this investigation.
This is the first account of the isolation of antibacterial terpenoid type compounds from
the mycelium of Ganoderma cupreum.
8.5 Close This investigation provided an insight to the growth and activity of three Australian
Ganoderma species. It demonstrated the importance of establishing viability and
culture conditions for new isolates. In addition, it demonstrated that liquid cultivated
mycelium is a valuable source of bioactive compounds, and with this comes the
possibilities of culture medium manipulation to increase bioactivity or bioactive
substance production.
Finally, the findings from this investigation are particularly interesting from a
commercial aspect. Potential possibilities exist to establish research and development
of bioactive metabolites from ‘indigenous’ Ganoderma species. Consequently, the need
to comply with Australian Quarantine laws is not warranted, as the Ganoderma species
that could be used in the production of such metabolites could be taken from the those
already found naturally within the Australia environment.

Glossary
215
9 Glossary
All glossary definitions are taken from the Oxford Dictionary of Biochemical and
Molecular Biology (Anonymous, 1997), unless otherwise stated.
Agglutinate to cause the clumping of cells, particles, etc, or to undergo such clumping.
Angiogenesis the formation of blood vessels, whether during embryogenesis, tissue repair, or invasive growth of tumours.
Antibacterial any of numerous substances produced by living microorganisms (and some plants) that are able to selectively and at low concentrations to destroy or inhibit the growth of bacterial organisms.
Antibiotic any of numerous substances produced by living microorganisms (and some plants) that are able to selectively and at low concentrations to destroy or inhibit the growth of other organisms.
Antibody any glycoprotein that is capable of combining noncovalentely, reversibly and in a specific manner with a corresponding antigen.
Anticomplement see adj complement Antifungal any of numerous substances produced by living microorganisms (and some
plants) that are able to selectively and at low concentrations to destroy or inhibit the growth of fungal organisms.
Antiherpetic any agent having the ability to destroy or inhibit the herpes virus. Antigen any agent that stimulates the production of a specific antibody or antibodies
that can combine with the antigen.
Antihistamine any drug or other agent that antagonises an action of histamine on the body. Antihistamines are used in the treatment of immediate type hypersensitivity.
Antiinflammatory any drug or other agent that is able to inhibit the natural defence reaction (inflammation) of vertebrate tissue to infection or to injury.
Antimetatstatic see adj metastasis. Antimicrobial describing a drug, antibiotic agent, physical process, radiation, etc. that
is inimical to microbes. Any substance having antimicrobial properties.
Antinociceptive see adj nociceptive.
Antioxidant any substance (often an organic compound) that opposes oxidation or inhibits reactions brought about by dioxygen or peroxides
Antithrombotic any substance that has the ability to inhibit the process of thrombus Antiviral activity see adj virus.
Glossary
216
Apoptosis cell death that may either occur by accident, cell necrosis, or by an intracellular controlled process characterised by a condensation, and subsequent fragmentation of the nucleus during which the plasma membrane remains intact.
Atheroma a condition or process affecting blood vessels in which plaques form beneath the inner lining
Atherosclerosis a degenerative condition affecting arteries in which there is hyperplasia of the outer coat and fatty degeneration of the middle coat of the arteries due to atheroma.
ATPase abbr. for adenosine triphosphate. A universally important coenzyme an enzyme regulator. Reactions in which is participates are often driven in the direction to hydrolysis of ATP.
Basidiocarp the fruiting body (mushroom cap) of a fungus
Bioinformatics the science concerned with the structure and properties of biological scientific information
Biological activity any activity of a substance that is demonstratable in living organisms.
Biological response modifiers abbr. BRM any substance that has the ability to modulate the host’s biological response by a stimulation of the immune system that may result in various therapeutic effects (Zhou & Gao, 2002).
Cancer any malignant neoplasm.
Carcinogenesis the process(es) involved in the production of cancers, including the action of carcinogens on living cells.
Carcinogen any agent that directly or indirectly induces the transformation of a normal cell into a neoplastic cell.
Cell mediated immunity specific immunity that depends on the presence of T lymphocytes. It is important in the organism’s defence against viral and some bacterial infections.
Clade a monophyletic taxon. A group of organisms or genes that contains that include the most recent common ancestor of all its members (Brinkman & Leipe, 2001).
Cladistics a method of classification that attempts to reconstruct a phylogeny using characters that are unique to each taxonomic group. The term cladistic is currently used to describe an evolutionary or phylogenetic tree based on gene sequence similarities and gene association.
Cloning vector the DNA of any transmissible agent into which a segment of foreign DNA can be spliced in order to introduce the foreign DNA into cells of the agent’s normal host and promote its replication and transcription therein.
Complement a system of plasma proteins, found in the blood of vertebrates that acts as an effector mechanism in immune defence against infection by microorganisms. The activation products of complement components cause lysis of antigenic cells, attract phagocytic cells to the site of activation, and assist the uptake and destruction of antigenic cells by phagocytes.

Glossary
217
Concanavalin A abbr. Con A an agglutinating and mitogenic protein that constitutes the major component of the subsidiary globulin fraction obtained from the ripe seeds of the jack bean.
Cutex the outer, shiniest layer of the fruiting body. Containing an outer layer. Generally referred to as laccate.
Cytokine any of a varied group of proteins that are released by mammalian cells and act on other cells through specific receptors. They elicit from the target cell a variety of responses depending on the cytokine and target cell.
Cytotoxic causing cell death.
Cytotoxicity the attribute of being cytotoxic
Deoxyribonuclease I an enzyme that catalyses the endonucleolytic cleavage of DNA.
DNA polymerase (ββββ and αααα) common name for either two of categories of enzymes that catalyse the synthesis of DNA from deoxyribonuclease triphosphates in the presence of nucleic acid primer.
Endonuclease any enzyme from a large group of phosphoric diester hydrolases, forming sub-classes, that catalyse the hydrolysis of nonterminal diester linkages in polynucleotides to yield oligonucleotides.
Extracellular present outside a cell, expelled from a cell or happening outside a cell.
Fruiting body the fruit of the mushroom, visible to the naked eye. Other names include: conk, mushroom, basidiocarp.
Glycoprotein any protein that contains covalently bound glucose residues other than as a moiety of nucleic acid.
Haemagglutination the agglutination of red blood cells.
Haemophiliac having any of various hereditary disorders in which there is a deficiency or defect in certain of the blood coagulation factors resulting in prolonged bleeding following injury
Haemostasis the stopping of bleeding or the arrest of the circulation to an organ or part
Hepato+ denoting or pertaining to the liver.
Hepatoprotective activity the ability of a substance to have protective abilities toward the liver.
Histamine a compound present in many mammalian tissues. It is a potent vasodilator, increases capillary permeability, causes contraction of smooth muscle, plays a role in the regulation of gastric secretion and acts as a mediator in allergic and anaphylactic conditions.
Hypercholesterolaemia the presence of higher than normal concentrations of cholesterol in the blood.
Hyperplasia the increase in size of a tissue or organ resulting from an increase in the total number of cells present. The part thus affected retains its normal form.
Hypersensitive having an abnormally great sensitivity, especially to an allergen, drug or other antagonist.

Glossary
218
Hypersensitivity the state or condition of being hypersensitive.
Hypertension the state or condition of having a higher than normal arterial blood pressure.
Hypoglycaemea the presence of an abnormally low blood glucose concentration.
Hypoglycaemic having abnormally low blood glucose concentration.
Hypolipidemic activity substances that have the ability to inhibit cholesterol biosynthesis and cholesterol.
Hypotension the state or condition of having a lower than normal arterial blood pressure. Hypotensive adj.
IFN-γγγγ abbr. for interferon. Suffixed Greek letters are added to differentiate the main classes.
Immuno+ indicating immune or immunity. Immunoinitiators see biological response modifier (Zhou & Gao, 2002)
Immunomodulator any agent that alters the extent of the immune response to an antigen, by altering the antigenicity of the antigen or by altering in a nonspecific manner the specific reactivity of the non-specific effector mechanism of the host. Immunomodulatory adj.
Immunostimulant any agent that non-specifically enhances the immunologically specific reactivity of an animal to an antigen and also the animal’s non-specific effector mechanisms. Immunostimulatory adj.
Immunosuppression the suppression of immune responses to antigens.
Immunosuppressive able to cause immunosuppression.
Interferon any member of a group of proteins that form a closely related group to nonviral proteins that are produced and liberated by animal cells following exposure to a variety of inducing agents. They are not normally present in non-induced cells. They exert non-specific antiviral activity through cellular metabolic processes involving the synthesis of both RNA and protein.
Interleukin any member of a heterogeneous group of cytokines that have the ability to act as signalling molecules between different populations of leukocytes. Several classes have been defined, each is designated by a suffixed Arabic numeral, e.g. Interleukin 2
Interleukin 2 produced by T cells in response to antigenic or mitogenic stimulation.
Intracellular within a cell or cells.
Laccate see cutex Leukocytes any white blood cell.
Ling Zhi Chinese name for Ganoderma lucidum.
Lyophilic solvent preferring
Lypholisation the process of rendering lyphile or lyophilic. The term is now specifically applied to freeze drying in which, by use of vacuum, water is removed from ice by sublimation.

Glossary
219
Macrophage any cell of the mononuclear phagocyte system that is characterised by its ability to phagocytose foreign particulate and colloidal material.
Metastasis the transfer of disease, especially tumour cells, from one part of the body or another by way of the natural passages (i.e. blood vessels, lymphatics) or by direct continuity.
Mitogen any substance or agent that induces or stimulates mitosis.
Mitogenic activity having the ability to induce or stimulate mitosis.
Monophyletic derived from the same origin Necrosis the death of a portion of tissue as a result of disease or injury.
Neutriceutical any substance that may be considered a food or part of a food and provides medical or health benefits including the prevention and treatment of disease.
Neoplasm any new and morbid formation of tissue; a tumour.
Nociceptor any receptor that reacts to painful stimulus.
Oligonucleotides any molecule that contains a small number of nucleotide units connected by phosphodiester linkages.
Oncogenic (of an agent) causing the formation of a neoplastic tumour or tumours
Phylogeny the evolutionary history of an organism or group of related organisms
Phylogram (phylogenetic tree) a graphical representation of the putative evolutionary relationships of a group of organisms
Platelets the smallest of the blood cells. The main function are in haemostasis.
Polypore a fungus that is a member of the Polyporaceae Family. Produces spores in pores found on the underside of the mushroom. A typically tough, woody mushroom that is generally found on logs, stumps, or other dead wood (Zjawiony, 2004).
Promyelocytic leukaemia the promotion of neoplastic diseases of the leukocytes within the bone marrow.
Recombinant DNA a fragment of DNA that has been inserted into a cloning vector, thereby leading to its use in the isolation of a clone of cells characterised by the presence of the fragment.
Resistance the ability of a living organism, particularly a bacterium, to resist the effect of a disadvantageous environment or substance, especially an antibiotic.
Restriction enzyme any of a group of enzymes that cleaves molecules of DNA internally at specific base sequences. Alternative name restriction endonuclease.
Reverse transcriptase a DNA polymerase enzyme, found particularly in retroviruses and possibly in normal animal cells that uses either DNA or RNA as a template.
RNA polymerase an enzyme that utilises ATP, GTP, CTP and UTP to synthesise RNA from a DNA or RNA template
Sarcoma a malignant tumour of connective tissue or of its derivatives. Sarcoma 180 is a commonly used tumour for in vitro experimentation.

Glossary
220
Stipe the stem or stalk of the mushroom. Terminal deoxynucleotidyl transferase an enzyme commonly isolated from calf
thymus that catalyses template-independent addition of deoxynucleoside phosphates to the 3’-OH group on a DNA fragment.
Therapeutic effect an agent that has a beneficial effect on a substance.
Thrombus a blood clot forming within a blood vessel.
T lymphocyte any of a calls of lymphocytes that undergo maturation and differentiation in thymus, they are responsible for immune reactions involving cell-cell interaction.
TNF-αααα abbr. (Tumour necrosis factor) either of two structures and functionally related proteins. TNF-α is produced mainly by monocytes and macrophages, and is involved in the activation of a large array of cellular genes and also multiple signal transduction pathways, kinases and transcription factors.
Tumour a mass of proliferating cells lacking to varying degrees, normal growth control.
Virus a noncellular infective agent that is capable of reproducing only in an appropriate host cell.

References
221
References Adrio, J.L. & Demain, A.L. (2003). Fungal biotechnology. Int Microbiol 6, 191-199.
Ahmad, I. & Beg, A.Z. (2001). Antimicrobial and phytochemical studies on 45 Indian medicinal plants against multi-drug resistant human pathogens. J Ethnopharmacol 74, 113-123.
Ahn, Y.J., Park, S.J., Lee, S.G., Shin, S.C. & Choi, D.H. (2000). Cordycepin: Selective growth inhibitor derived from liquid culture of Corpyceps militaris against Clostridium spp. Journal of Agricultural and Food Chemistry 48, 2744-2748.
Alberts, A.W., Chen, J.C., Kuron, G., Hunt, V., Huff, J., Hoffman, C., Rothrock, J., Lopez, M., Joshua, H., Harris, E., Patchett, A., Monaghan, R., Currie, S., Stapley, E., Albers-Schonberg, G., Hensens, O., Hirschfield, J., Hoogsteen, K., Liesch, J. & Springer, J. (1980). Mevinolin: a highly potent competitive inhibitor of hydroxymethylglutyryl-coenzyme A reductase and a cholesterol-lowering agent. Proc Nat Acad Sci 77, 3957-3961.
Alhambra, A., Cuadros, J.A., Cacho, J., Gomez-Garces, J.L. & Alos, J.I. (2004). In vitro susceptibility of recent antibiotic-resistant urinary pathogens to ertapenem and 12 other antibiotics. J Antimicrob Chemother In press.
Al-Hilli, A.L. & Smith, J.E. (1992). Influence of propionic acid on growth and aflatoxin production by Aspergillus flavus in liquid submerged and solid substrate conditions. J Environ Pathol Toxicol Oncol 11, 57-60.
Ando, K. (1997). XII. Preservation of mushroom cultures. Food Rev Int 13, 423-429.
Anke, T., Kupka, J., Schramm, G. & Steglich, W. (1980). Antibiotics from basidiomycetes. X. Scorodonin, a new antibacterial and antifungal metabolite from Marasmius scorodonius (Fr.) Fr. J Antibiot 33, 463-467.
Anke, H. & Sterner, O. (1991). Comparison of the antimicrobial and cytotoxic activities of twenty unsaturated sesquiterpene dialdehydes from plants and mushrooms. Planta Medica 57, 344-346.
Anonymous. (1997). Oxford Dictionary of Biochemistry and Molecular Biology. Oxford University Press Inc., New York.
Anonymous. (1999). pGem® -T and pGem® - T Easy vector systems. In Technical Manual No. 42., 29p, Madison, USA.
Arisawa, M., Fujita, A., Saga, M., Fukumura, H., Hayashi, T., Shimizu, M. & Morita, N. (1986). Three new lanostanoids from Ganoderma lucidum. J Nat Prod 49, 621-625.
Aryantha, N.P., Adinda, A. & Kusmaningati, S. (2002). Occurance of triterpenoids and polysaccharides on Ganoderma tropicum with Ganoderma lucidum as reference. Australian Mycologist 20, 123-129.
Bae, J.T., Sinha, J., Park, J.P., Song, C.H. & Yun, J.W. (2000). Optimization of submerged culture conditions for exo-biopolymer production by Paecilomyces japonica. J Microbiol Biotechnol 10, 482-487.

References
222
Baker, J.T., Borris, R.P., Carte, B., Cardell, G.A., Soejarto, D.D., Gragg, G.M., Gupta, M.P., Iwn, M.M., Madulid, D.R. & Tyler, V.E. (1995). Natural product drug discovery and development: New perspectives on international collaboration. J Nat Prod 58, 1325-1357.
Balassa, L.L. & Prudden, J.F. (1978). Appliations of chitin and chitosan in wound-healing acceleration. In Proc 1st Int Conf Chitin/Chitosan (ed. R. A. A. Muzzarelli and E. R. Pariser), pp. 296-305.
Bao, X.F., Wang, X.S., Dong, Q., Fang, J.N. & Li, X.Y. (2002). Structural features of immunologically active polysaccharides from Ganoderma lucidum. Phytochemistry 59, 175-181.
Baratta, M.T., Dorman, H.J.D., Deans, S.G., Figueiredo, A.C., Barroso, J.G. & Ruberto, G. (1998). Antimicrobial and antioxidant properties of some commercial essential oils. Flav Frag J 13, 235-244.
Barry, A.L. & Thornsberry, C. (1985). Susceptibility Tests: Diffusion Test Procedures. In Manual Clinical Microbiol (ed. E. H. Lennette), pp. 978-990. American Society for Microbiology, Washington, D.C.
Baykam, N., Esener, H., Ergonul, O., Eren, S., Celikbas, A.K. & Dokuzogus, P. (2004). In vitro antimicrobial susceptibility of Brucella species. Int J Antimicrob Agents 23, 405-407.
Beltran-Garcia, M.J., Estarron-Espinosa, M. & Ogura, T. (1997). Volatile compounds secreted by the Oyster mushroom (Pleurotus ostreatus) and their antibacterial activities. J Agric Food Chem 45, 4049-4052.
Berbee, M.L. & Taylor, J.W. (1992). Detecting morphological convergence in true fungi, using 18S rRNA gene sequence data. BioSystems 28, 117-125.
Bergey. (1986). Bergy's Manual of Systematic Bacteria. Vol. 2. (ed. Sneath, P.H.A., Mair, N.S., Sharpe, M.E., Holt, J.G), 1599p. Williams & Wilkins, Baltimore, MD, USA.
Bilay, V.T., Solomko, E.F. & Buchalo, A.S. (2000). Growth of edible and medicinal mushrooms on commercial agar media. In Proc 15th Int Congress Sci Cultivation of Edible Fungi, vol. 1 & 2 (ed. L. J. L. D. Van Griensven), pp. 757-761. A.A. Balkema, Rotterdam, Maastricht.
Binder, M. & Hibbett, D.S. (2001). Higher-level phylogenetic relationships of Homobasidiomycetes (mushroom-forming fungi) inferred from four rDNA regions. 76-90.
Binns, S.E., Purgina, B., Bergeron, C., Smith, M.L., Ball, L., Baum, B.R. & Arnason, J. T. (2000). Light-mediated antifungal activity of Echinacea extracts. Plant Medica 66, 241-244.
Borchers, A.T., Stern, J.S., Hackman, R.M., Keen, C.L. & Gershwin, M.E. (1999). Mushrooms, tumors, and immunity. Proc Soc Exp Biol Med 221, 281-293.
Brancato, F.P. & Golding, N.S. (1953). The diameter of the mold colony as a reliable measure of growth. Mycologia 45, 848-864.
Bremer, K. (1994). Branch support and tree stability. Cladistics 10, 295-304.
Brian, P.W. (1951). Antibiotics produced by mushrooms. Bot Rev 17, 357-430.

References
223
Brinkman, F.S.L. & Leipe, D.D. (2001). Phylogenetic Analysis. In Bioinformatics: A pratical guide to the analysis of genes and proteins (ed. A. D. Baxevanis and B. F. F. Ouellette), pp. 323-358. John Wiley & Sons, Inc.
Bruns, T.D., White, T.J. & Taylor, J.W. (1991). Fungal molecular systematics. Annu Rev Ecol Syst 22, 525-564.
Buchanan, P.K. (2001). A taxonomic overview of the genus Ganoderma with special reference to species of medicinal and neutriceutical importance. Proc Int Symp Ganoderma Sci, 27-29.
Cao, L.Z. & Lin, Z.B. (2003). Regulatory effect fo Ganoderma lucidum polysaccharides on cytotoxic T-lymphocytes induced by dendritic cells in vitro. Acta Pharmacol Sin 24, 312-326.
Cao, R., Hou, G., Jiang, Q. & Wang, D. (1993). [Immune regulation by Ganoderma lucidum polysaccharide (GLP) in mice]. Shandong Yike Daxue Xuebao 31, 287-290].
Carson, C.F., Hammer, K.A. & Riley, T.V. (1995). Broth microdilution method for determining the susceptibility of Escherichia coli and Staphylococcus aureus to the essential oil of Melaleuca alternifolia (tee tree oil). Microbios 82, 181-185.
Chairul, S.M. & Hayashi, Y. (1994). Lanostanoid triterpenes from Ganoderma applanatum. Phytochemistry 35, 1305-1308.
Chairul, T.T., Hayashi, Y., Nishizawa, M., Tokuda, H., Chairul, S.M. & Hayashi, Y. (1991). Applanaoxidic acids A, B, C and D, biologically active tetracyclic triterpenes from Ganoderma applanatum. Phytochemistry 30, 4105-4109.
Chairul, T.T., Nishizawa, M., Shiro, M., Tokuda, H. & Hayashi, Y. (1990). Malonate half-esters of homolanostanoid from an Asian Ganoderma fungus. Phytochemistry 29, 923-928.
Chang, H.M. & But, H.P.P. (1986). Pharmacology and applications of Chinese Materia Medica. 740p. World Scientific, Singapore.
Chang, S.T. (1995). Ganoderma - The leader in production and technology of mushroom nutriceuticals. In Proc 6th Int Symp Recent Adv Ganoderma lucidum Res (ed. B. K. Kim, I. H. Kim and Y. S. Kim), pp. 43-52. The Pharmaceutical Society of Korea, Seoul, Korea.
Chang, S.T. (1999). Global impact of edible and medicinal mushrooms on human welfare in the 21st century: nongreen revolution. Int J Med Mush 1, 1-7.
Chang, S.T. & Buswell, J.A. (1996). Mushroom nutriceuticals. World J Microbiol Biotechnol 12, 473-476.
Chang, S.T. & Buswell, J.A. (1999). Ganoderma lucidum (Curt.:Fr.) P. Karst. (aphyllophoromycetideae) - a mushrooming medicinal mushroom. Int J Med Mush 1, 139-146.
Chang, S.T. & Miles, P.G. (1989a). Cultivation in polypropylene bags ("bag log" cultivation). In Edible Mushrooms and their Cultivation (ed. S.T. Chang and P.G. Miles), pp. 201-223. CRC Press, Inc., Florida, USA.

References
224
Chang, S.T. & Miles, P.G. (1989b). Overview of the Biology of the Fungi. In Edible Mushrooms and their Cultivation (ed. S.-T. Chang and P. G. Miles), pp. 41-79. CRC Press, Inc., Florida, USA.
Chang, S.T. & Miles, P.G. (1992). Mushroom biology - A new discipline. Mycologist 6, 64-65.
Chen, A.W. (1999). Cultivation of the Medicinal Mushroom Ganoderma lucidum (Curt.:Fr.) P. Karst. (Reishi) in North America. Int J Med Mush 1, 263-282.
Chen, C.S. (1993). Methods for inducing various morphological fruiting body of Ganoderma tsugae Murr. Trans Mycol Soc Republ China 8, 9-16.
Chen, D.H. & Chen, W.K.D. (2003). Determination of Ganoderic acids in triterpenoid constituents of Ganoderma tsugae. J Food Drug Analysis 11, 195-201.
Chen, A.W. & Miles, P.G. (1996a). Biomedical research and the application of mushroom nutriceuticals from Ganoderma lucidum. In Proc 2nd Int Conf Mush Biol Mush Prod (ed. D. J. Royse), pp. 161-175. University Park, Pennsylvania.
Chen, A.W. & Miles, P.G. (1996b). Cultivation of Ganoderma bonsai. In Proc 2nd Int Conf Mush Biol Mush Prod (ed. D. J. Royse), University Park, Pennsylvania.
Chen, R.Y. & Yu, D.Q. (1991). Studies on the triterpenoid constituents of the spores from Ganoderma lucidum Karst. Acta Pharmaceut Sin 26, 267-73.
Chen, R.Y. & Yu, D.Q. (1999). Studies on the triterpenoid constituents of the spores of Ganoderma lucidum (Curt.:Fr.) P. Karst. (aphyllophoromycetideae). Int J Med Mush 1, 147-152.
Chen, T.W., Wong, Y.K. & Lee, S.S. (1991). In vitro cytotoxicity of Ganoderma lucidum on oral cancer cells. Zhonghua Yi Xue Za Zhi (Taipei) 48, 54-58.
Chen, D.H., Shiou, W.Y., Wang, K.C., Huang, S.Y., Shie, Y.T., Tsai, C.M., Shie, J.F. & Chen, K.D. (1999). Chemotaxonomy of triterpenoid pattern of HPLC of Ganoderma lucidum and Ganoderma tsugae. J Chin Chem Soc 46, 47-51.
Chen, J.H., Zhang, L.N., Yu, D.S. & Zhu, R.P. (2000). [Chemical components and solution properties of a glycan-protein complex from Ganoderma lucidum mycelium]. Chem J Chin Universities 21, 964-968.
Cheong, J., Jung, W. & Park, W. (1999). Characterization of an alkali-extracted peptidoglycan from Korean Ganoderma lucidum. Arch Pharm Res 22, 515-519.
Clark, A.M. (1996). Natural products as a resource for new drugs. Pharm Res 13, 1131-1141.
Cochrane, V.W. (1958). Physiology of Fungi. 524p. John Wiley, New York.
Coletto, B.M.A. & Mondino, P. (1991). [Antibiotic activity in Basidiomycetes: V. Antibiotic activity of mycelia and cultural filtrates]. Allionia (Turin) 30, 61-64.
Cowan, M.M. (1999). Plant products as antimicrobial agents. Clin Microbiol Rev 12, 564-582.
Cragg, G.M., Boyd, M.R., Cardellina, J.H., Grever, M.R., Schepartz, S.A. & Snader, K.M. (1993). The role of plants in the drug discovery program of the US manipulation. In International Crop Science 1, pp. 178-196. Crop Science Society of America, Madison, USA.

References
225
Cragg, G.M., Newman, D.J. & Snader, K.M. (1997). Natural products in drug discovery and development. J Nat Prod 60, 52-60.
Croan, S.C., Burdsall, H.H.J. & Rentmeester, R.M. (1999). Preservation of tropical wood-inhabiting basidiomycetes. Mycologia 91, 908-916.
Davis, J. (1994). Inactivation of antibiotic and the dissemination of resistance genes. Science 264, 375-382.
Demain, A.L. & Elander, R.P. (1999). The β-lactam antibiotics: past, present, and future. Antonie van Leeuwenhoek 75, 5-19.
Diallo, D., Marston, A., Terreaux, C., Touré, T., Smedstad Paulsen, B. & Hostettmann, K. (2001). Screening of Malian medicinal plants for antifungal, larvicidal, molluscicidal, antioxidant and radical scavenging activities. Phytother Res 15, 401-406.
Diamond, R.D. (1993). The growing problem in patients infected with human immunodificency virus. Rev Infect Dis 13, 480-486.
Donadio, S., Carrano, L., Brandi, L., Serina, S., Soffientini, A., Raimondi, E., Montanini, N., Sosio, M. & Gualerzi, C. O. (2002a). Targets and assays for discovering novel antibacterial agents. J Biotechnol 99, 175-185.
Donadio, S., Monciardini, P., Alduina, R., Mazza, P., Chiocchini, C., Cavaletti, L., Sosio, M. & Puglia, A. M. (2002b). Microbial technologies for the discovery of novel bioactive metabolites. J Biotechnol 99, 187-198.
Donnelly, D.M.X. & Hutchinson, R. M. (1990). Armillane, a saturated sesquiterpene ester from Armillaria mellea. Phytochemistry 29, 179-182.
Donnelly, D.M., Abe, F., Coveney, D., Fukuda, N., O'Reilly, J., Polonsky, J. & Prange, T. (1985). Antibacterial sesquiterpene aryl esters from Armillaria mellea. J Nat Prod 48, 10-16.
Donnelly, D.M.X., Abe, F., Coveney, D., Fukuda, N., O’Reilly, J., Polonsky, J. & Prange, T. (1986). New sesquiterpene aryl esters from Armillaria mellea. J Nat Prod 49, 111-116.
Dorman, H.J.D. & Deans, S.G. (2000). Antimicrobial agents from plants: antibacterial activity of plant volatile oils. J Appl Microbiol 88, 308-316.
Dornberger, K., Ihn, W., Schade, W., Tresselt, D., Zureck, A. & and Radics, L. (1986). Evidence for the occurance of the 4-hydroxybenzenediazonium in the extract of Agaricus xanthodermus. Tetrahedron Lett 27, 559-560.
Ebi, G.C. & Kamalu, T.N. (2001). Phytochemical and antimicrobial properties of constituents of 'Ogwa Odenigbo', a popular Nigerian herbal medicine for Typhoid fever. Phytother Res 15, 73-75.
Edelstein, L. & Segel, L.A. (1983). Growth and metabolism in mycelial fungi. J Theor Biol 104, 187-210.
Eilbert, F., Engler-Lohr, M., Anke, H. & Sterner, O. (2000). Bioactive sesquiterpenes from the basidiomycete Resupinatus leightonii. J Nat Prod 63, 1286-1287.

References
226
El-Mekkawy, S., Meselhy, M.R., Nakamura, N., Tezuka, Y., Hattori, M., Kakiuchi, N., Shimotohno, K., Kawahata, T. & Otake, T. (1998). Anti-HIV-1 and anti-HIV-1-protease substances from Ganoderma lucidum. Phytochemistry 49, 1651-1657.
Elvin-Lewis, M. (2001). Should we be concerned about herbal remedies. J Ethnopharmacol 75, 141-164.
Endo, A., Kuroda, M. & Tanzawa, K. (1976a). FEBS Lett 72, 323-326.
Endo, A., Kuroda, M. & Tsujita, Y. (1976b). ML-236A, ML-236B, and ML-236C, new inhibitors of cholesterogenesis produced by Penicillium citrinum. J Antibiot 29, 1346-1348.
Eo, S.K., Kim, Y.S., Lee, C.K. & Han, S.S. (1999a). Antiherpetic activities of various protein bound polysaccharides isolated from Ganoderma lucidum. J Ethnopharmacol 68, 175-181.
Eo, S.K., Kim, Y.S., Lee, C.K. & Han, S.S. (1999b). Antiviral activities of various water and methanol soluble substances isolated from Ganoderma lucidum. J Ethnopharmacol 68, 129-136.
Eo, S.K., Kim, Y.S., Lee, C.K. & Han, S.S. (2000). Possible mode of antiviral activity of acidic protein bound polysaccharide isolated from Ganoderma lucidum on herpes simplex viruses. J Ethnopharmacol 72, 475-481.
Fakeye, T.O., Itiola, O.A. & Odelola, H.A. (2000). Evaluation of the antimicrobial property of the stem bark of Picralima nitida (Apocynaceae). Phytother Res 14, 368-370.
Fang, Q.H. & Zhong, J.J. (2002a). Two-stage culture process for improved production of ganoderic acid by liquid fermentation of higher fungus Ganoderma lucidum. Biotechnol Prog 18, 51-54.
Fang, Q.H. & Zhong, J.J. (2002b). Effect of initial pH on production of ganoderic acid and polysaccharide by submerged fermentation of Ganoderma lucidum. Process Biochem 37, 769-774.
Fang, Q.H. & Zhong, J.J. (2002c). Submerged fermentation of higher fungus Ganoderma lucidum for production of valuable bioactive metabolites - ganoderic acid and polysaccharide. Biochem Eng 10, 61-65.
Fang, Q.H., Tang, Y.J. & Zhong, J.J. (2002). Significance of inoculation density control in production of polysaccharide and ganoderic acid by submerged culture of Ganoderma lucidum. Process Biochem 37, 1375-1379.
Farnsworth, N.R. (1994). Ethnopharmacology and drug development. In Ethnobotany and the search for new drugs Ciba Foundation Symposium, Vol. 185 (ed. G. T. Prance), pp. 42-59. Wiley, Chischester.
Farris, J.S., Albert, V.A., Kallersjo, M., Lipscomb, D. & Kluge, A.G. (1996). Parsimony jackknifing outperforms neighbor-joining. Cladistics 12, 99-124.
Felsenstein, J. (1985). Confidence limits on phylogenies: an approach using the bootstrap. Evolution 39, 783-791.
Feresin, G.E., Tapia, A., Lopez, S.N. & Zacchino, S.A. (2001). Antimicrobial activity of plants used in traditional medicine of San Juan province, Argentine. J Ethnopharmacol 78, 103-107.

References
227
Fischer, G., Muller, T., Schwalbe, R., Ostrowski, R. & Dott, W. (2000). Species-specific profiles of mycotoxins produced in cultures and associated with conidia of airborne fungi derived from biowaste. Int J Hyg Environ Health 203, 105-116.
Fleming, A. (1929). On the antibacterial action of a Penicillium, with special reference to their use in the isolation of B. influenzae. Brit J Exp Pathol 10, 226-236.
Florey, H.W., Chain, E.B., Heatley, N.G., Jennings, M.A., Sanders, A.G., Abranam, E.P. & Florey, M.E. (1949). Antibiotics, Vol. 2. Oxford University Press, London.
Florianowicz, T. (1998). Penicillium expansum growth and production of patulin in the presence of benzoic acid and its derivatives. Acta Microbiol Pol 47, 45-53.
Gan, K.H., Fann, Y.F., Hsu, S.H., Kuo, K.W. & Lin, C.N. (1998a). Mediation of the cytotoxicity of lanostanoids and steroids of Ganoderma tsugae through apoptosis and cell cycle. J Nat Prod 61, 485-487.
Gan, K.H., Kuo, S.H. & Lin, C.N. (1998b). Steroidal constituents of Ganoderma applanatum and Ganoderma neo-japonicum. J Nat Prod 61, 1421-1422.
Gao, X.X., Fei, X.F., Wang, B.X., Zhang, J., Gong, Y.J., Minami, M., Nagata, T. & Ikejima, T. (2000a). Effects of polysaccharides (FI0-b) from mycelium of Ganoderma tsugae on proinflammatory cytokine production by THP-1 cells and human PBMC (I). Acta Pharmacol Sin 21, 1179-1185.
Gao, X.X., Wang, B.X., Fei, X.F., Zhang, J., Gong, Y.J., Minami, M., Nagata, T. & Ikejima, T. (2000b). Effects of polysaccharides (FI0-c) from mycelium of Ganoderma tsugae on proinflammatory cytokine production by THP-1 cells and human PBMC (II). Acta Pharmacol Sin 21, 1186-1192.
Gao, J.J., Min, B.S., Ahn, E.M., Nakamura, N., Lee, H.K. & Hattori, M. (2002a). New triterpene aldehydes, lucialdehydes A-C, from Ganoderma lucidum and their cytotoxicity against murine and human tumor cells. Chem Pharm Bull (Tokyo) 50, 837-840.
Gao, Y., Zhou, S., Wen, J., Huang, M. & Xu, A. (2002b). Mechanism of the antiulcerogenic effect of Ganoderma lucidum polysaccharides on indomethacin-induced lesions in the rat. Life Sci 72, 731-745.
Gao, Y., Zhou, S., Huang, M. & Xu, A. (2003). Antibacterial and antiviral value of the genus Ganoderma P. Karst. species (Aphyllophoromycetideae): A review. Int J Med Mush 5, 235-246.
Gau, J.P., Lin, C.K., Lee, S.S. & Wang, S.R. (1990). The lack of antiplatelet effect of crude extracts from Ganoderma lucidum on HIV-positive hemophiliacs. Am J Chin Med 18, 175-179.
Giner-Larza, E.M., Manez, S., Giner-Pons, R.M., Carmen Recio, M. & Rios, J.L. (2000). On the anti-inflammatory and anti-phospholipase A(2) activity of extracts from lanostane-rich species. J Ethnopharmacol 73, 61-69.
Goldstein, I.J., Hughes, R.C., Monsigny, M., Osawa, T. & Sharon, N. (1980). Nature 285, 66.
Gonzalez, A.G., Leon, F., Rivera, A., Munoz, C.M. & Bermejo, J. (1999). Lanostanoid triterpenes from Ganoderma lucidum. J Nat Prod 62, 1700-1701.

References
228
Gonzalez, A.G., Leon, F., Rivera, A., Padron, J.I., Gonzalez-Plata, J., Zuluaga, J.C., Quintana, J., Estevez, F. & Bermejo, J. (2002). New lanostanoids from the fungus Ganoderma concinna. J Nat Prod 65, 417-421.
Gottlieb, A.M., Saidman, B.O. & Wright, J.E. (1998). Isoenzymes of Ganoderma species from southern South America. Mycological Res 102, 415-426.
Gottlieb, A.M. & Wright, J.E. (1999a). Taxonomy of Ganoderma from southern South America: subgenus Elfvingia. Mycologica Res 103, 1289-1298.
Gottlieb, A.M. & Wright, J.E. (1999b). Taxonomy of Ganoderma from southern South America: subgenus Ganoderma. Mycological Res 103, 661-673.
Gottlieb, A.M., Ferrer, E. & Wright, J.E. (2000). rDNA analyses as an aid to the taxonomy of species of Ganoderma. Mycological Res 104, 1033-1045.
Graybeal, A. (1998). Is it better to add taxa or characters to a difficult phylogenetic problem? System Biol 47, 9-17.
Griffin, D.H. (1994). Chemical requirements for growth. In Fungal Physiology (ed. D. H. Griffin), pp. 131-157. Wiley-Liss, Inc., New York, USA.
Grigansky, A.P., Solomko, E.F. & Kirchoff, B. (1999). Mycelial growth of medicinal mushroom Hericium erinaceus (Bull.:Fr.) Pers. in pure culture. Int J Med Mush 1, 81-87.
Haak-Frendscho, M., Kino, K., Sone, T. & Jardieu, P. (1993). Ling Zhi-8: a novel T cell mitogen induces cytokine production and upregulation of ICAM-1 expression. Cell Immunol 150, 101-113.
Hamburger, M. & Hostettmann, K. (1991). Bioactivity in plants: The link between phytochemistry and medicine. Phytochemistry 30, 3864-3874.
Hamlyn, P.F. & Schmidt, R.J. (1994). Potential therapeutic application of fungal filaments in wound management. Mycologist 8, 14-19.
Harbourne, J.B. (1973). Methods of Plant analysis. Phytochem Methods, 1-32. Haruyama, H., Kuwano, H., Kinoshita, T., Terahara, A., Nishigaki, T. & Tamura, C.
(1986). Structure elucidation of the bioactive metabolites of ML-236B (mevastatin) isolated from dog urine. Chem Pharm Bull 34, 1459-1467.
Hatvani, N. (2001). Antibacterial effect of the culture fluid of Lentinus edodes mycelium grown in submerged liquid culture. Int J Antimicrob Agents 17, 71-74.
Haufe, D., Luther, T., Kotzsch, M., Knels, L. & Koch, T. (2004). Perfluorocarbon attenuates response of Concanavalin A stimulated mononuclear blood cells without altering ligand-receptor interaction. Am J Physiol Lung Cell Mol Physiol submitted.
Hawksworth, D.L. (1991). The fungal dimension of biodiversity: magnitude, significance, and conservation. Mycological Res 95, 641-655.
Hikino, H., Konno, C., Mirin, Y. & Hayashi, T. (1985). Isolation and hypoglycemic activity of ganoderans A and B, glycans of Ganoderma lucidum fruit bodies. Planta Med, 339-340.
Hikino, H. & Mizuno, T. (1989). Hypoglycemic actions of some heteroglycans of Ganoderma lucidum fruit bodies. Planta Med 55, 385.
References
229
Hikino, H., Ishiyama, M., Suzuki, Y. & Konno, C. (1989). Mechanisms of hypoglycemic activity of ganoderan B: a glycan of Ganoderma lucidum fruit bodies. Planta Med 55, 423-428.
Hillis, D.M. (1996). Inferring complex phylogenies. Nature 383, 130-131.
Hirasawa, M., Shouji, N., Neta, T., Fukushima, K. & Takada, K. (1999). Three kinds of antibacterial substances from Lentinus edodes (Berk.) Sing. (Shiitake, an edible mushroom). Int J Antimicrob Agents 11, 151-157.
Hirotani, M., Asaka, I., Ino, C., Furuya, T. & Shiro, M. (1987). Ganoderic acid derivatives and ergosta-4,7,22-triene-3,6-dione from Ganoderma lucidum. Phytochemistry 26, 2797-2803.
Hirotani, M., Ino, C. & Furuya, T. (1993). Comparitive study on the strain-specific triterpenoid components of Ganoderm lucidum. Phytochemistry 33, 379-382.
Hirotani, M., Ino, C., Furuya, T. & Shiro, M. (1986). Ganoderic acids T, S and R, new triterpenoids from the cultured mycelia of Ganoderma lucidum. Chem Pharm Bull 34, 2282-2285.
Hoffman, W.F., Alberts, A.W., Anderson, P.S., Chen, J.S., Smith, R.L. & Willard, A.K. (1986). 3-Hydroxy-3-methylglutaryl-coenzyme A reductase inhibitors. E. Side chain ester derivatives of mevinolin. J Med Chem 29, 849-852.
Hong, S.G., Jeong, W. & Jung, H.S. (2002). Amplification of mitochondrial small subunit ribosomal DNA of polypores and its potential for phylogenetic analysis. Mycologia 94, 823-833.
Hook III, E.W., Cannon, R.O. & Nahmias, A.J. (1992). Herpes simplex virus infection as a risk factor for human immunodeficiency virus in heterosexuals. J Infect Dis 165, 251-255.
Horvath, G., Kocsis, B., Botz, L., Nemeth, J. & Szabo, L. (2002). Antibacterial activity of Thymus phenols by direct bioautography. Proc 7th Hung Congress Plant Physiol 46, 145-146.
Hostettmann, K. (1999). Strategy for the biological and chemical evaluation of plant extracts. www.iupac.org/symposia/proceedings/phuket97/hostettmann.html, IUPAC electronic source.
Hseu, R.S. & Wang, H.H. (1991). A new system for identifying cultures of Ganoderma species. In Proc 13th Int Congress Sci Cultivation of Edible Fungi, vol. Vol. 1 & 2. (ed. M. J. Maher). A.A. Balkema Publishers, Dublin, Ireland.
Hseu, R.S., Wang, H.H., Wang, H.F. & Moncalvo, J.M. (1996). Differentiation and grouping of isolates of the Ganoderma lucidum complex by random amplified polymorphic DNA-PCR compared with grouping on the basis of internal transcribed spacer sequences. Appl Environ Microbiol 62, 1354-1363.
Hughes, K.W., Toyohara, T.L. & Petersen, R.H. (1998). DNA sequence and RFLP analysis of Pleurotopsis longinqua from three disjunct populations. Mycologia 90, 595-600.
Hung, W.S., Fang, C.L., Su, C.H., Lai, W.F., Chang, Y.C. & Tsai, Y.H. (2001). Cytotoxicity and immunogenicity of SACCHACHITIN and its mechanism of action on skin wound healing. J Biomed Mater Res 56, 93-100.
References
230
Ishikawa, N.K., Fukushi, Y., Yamaji, K., Tahara, S. & Takahashi, K. (2001). Antimicrobial cuparene-type sesquiterpenes, enokipodins C and D, from a mycelial culture of Flammulina velutipes. J Nat Prod 64, 932-934.
Johansen, C.L., Coolen, L. & Hunik, J.H. (1998). Influence of morphology on product formation in Aspergillus awamori during submerged fermentations. Biotechnol Prog 14, 233-240.
Jong, S.C. & Birmingham, J.M. (1992). Medicinal benefits of the mushroom Ganoderma. Adv Appl Microbiol 37, 101-134.
Jong, S.C. & Birmingham, J.M. (1993). Medicinal and therapeutic value of the shiitake mushroom. Adv Appl Microbiol 39, 153-84.
Jong, S.C., Birmingham, J.M. & Pai, S.H. (1991). Immunomodulatory substances of fungal origin. J Immunol Immunopharmacol 11, 115-122.
Kabir, Y., Kimura, S. & Tamura, T. (1988). Dietary effect of Ganoderma lucidum mushroom on blood pressure and lipid levels in spontaneously hypertensive rats (SHR). J Nutr Sci Vitaminol (Tokyo) 34, 433-438.
Karsten, P.A. (1881). Enumeratio boletinearum et polyporearum fennicarum. Systemate novo dispositarum. Rev Mycol 3, 101-134.
Kawagishi, H. (1995). Mushroom lectins. Food Rev Int 11, 63-68.
Kawagishi, H., Fukuhara, F., Sazuka, M., Kawashima, A., Mitsubori, T. & Tomita, T. (1993). 5'-deoxy-5'-methylsulphinyladenosine, a platelet aggregation inhibitor from Ganoderma lucidum. Phytochemistry 32, 239-241.
Kawagishi, H., Mitsunaga, S., Yamawaki, M., Ido, M., Shimada, A., Kinoshita, T., Murata, T., Usui, T., Kimura, A. & Chiba, S. (1997). A lectin from mycelia of the fungus Ganoderma lucidum. Phytochemistry 44, 7-10.
Keller, A.C., Maillard, M. P. & Hostettmann, K. (1996). Antimicrobial steroids from the fungus Fomitopsis pinicola. Phytochemistry 41, 1041-1046.
Kendrick, B. (1985). The Fifth Kingdom. Mycologue Publication, Waterloo.
Kikuchi, T., Kanomi, S., Kadota, S., Murai, Y., Tsubono, K. & Ogita, Z.I. (1986a). Constituents of the fungus Ganoderma lucidum (Fr.) Karst. I. Structures of ganoderic acids C2, E, I, and K, lucidenic acid F and related compounds. Chem Pharm Bull 34, 3695-3712.
Kikuchi, T., Kanomi, S., Murai, Y., Kadota, S., Tsubono, K. & Ogita, Z.I. (1986b). Constituents of the fungus Ganoderma lucidum (Fr.) Karst. II. Structures of ganoderic acids F, G, and H, lucidenic acids D2 and E2, and related compounds. Chem Pharm Bull 34, 4018-4029.
Kikuchi, T., Kanomi, S., Murai, Y., Kadota, S., Tsubono, K. & Ogita, Z.I. (1986c). Constituents of the fungus Ganoderma lucidum (Fr.) Karst. III. Structures of ganolucidic acids A and B, new lanostane-type triterpenoids. Chem Pharm Bull 34, 4030-4036.
Kim, H.W. & Kim, B.K. (1999a). Biomedicinal triterpenoids of Ganoderma lucidum (Curt.:Fr.) P. Karst. (aphyllophoromycetideae). Int J Med Mush 1, 121-138.
References
231
Kim, K.C. & Kim, I.G. (1999b). Ganoderma lucidum extract protects DNA from strand breakage caused by hydroxyl radical and UV irradiation. Int J Mol Med 4, 273-277.
Kim, B.K., Cho, H.Y., Kim, J.S., Kim, H.W. & Choi, E.C. (1993). Studies on constituents of higher fungi of Korea (LXVIII). Antitumor components of the cultured mycelia of Ganoderma lucidum. Korean J Pharmacol 24, 203-212.
Kim, H.W., Shim, M.J., Choi, E.C. & Kim, B.K. (1997). Inhibition of cytopathic effect of human immunodeficiency virus-1 by water-soluble extract of Ganoderma lucidum. Arch Pharm Res 20, 425-431.
Kim, D.H., Shim, S.B., Kim, N.J. & Jang, I.S. (1999). Beta-glucuronidase-inhibitory activity and hepatoprotective effect of Ganoderma lucidum. Biol Pharm Bull 22, 162-164.
Kim, Y.S., Eo, S.K., Oh, K.W., Lee, C. & Han, S.S. (2000). Antiherpetic activities of acidic protein bound polysacchride isolated from Ganoderma lucidum alone and in combinations with interferons. J Ethnopharmacol 72, 451-458.
Kim, S.W., Hwang, H.J., Park, J.P., Cho, Y.J., Song, C.H. & Yun, J.W. (2002a). Mycelial growth and exo-biopolymer production by submerged culture of various edible mushrooms under different media. Lett Appl Microbiol 34, 56-61.
Kim, S.W., Hwang, H.J., Xu, C.P., Na, Y.S., Song, S.K. & Yun, J.W. (2002b). Influence of nutritional conditions on the mycelial growth and exopolysaccharide production in Paecilomyces sinclairii. Lett Appl Microbiol 34, 389-393.
Kim, S.W., Hwang, H.J., Xu, C.P., Sung, J.M., Choi, J.W. & Yun, J.W. (2003). Optimization of submerged culture process for the production of mycelial biomass and exo-polysaccharides by Cordyceps militaris C738. J Appl Microbiol 94, 120-126.
Kimura, Y., Taniguchi, M. & Baba, K. (2002). Antitumor and antimetastatic effects on liver of triterpenoid fractions of Ganoderma lucidum: mechanism of action and isolation of an active substance. Anticancer Res 22, 3309-3318.
King, A. & Brown, D.F.J. (2001). Qualtiy assurance of antimicrobial susceptibility testing by disc diffusion. J Antimicrob Chemother 48, Suppl. S1., 71-76.
Kino, K., Yamashita, A., Yamaoka, K., Watanabe, J., Tanaka, S., Ko, K., Shimizu, K. & Tsunoo, H. (1989). Isolation and characterization of a new immunomodulatory protein, ling zhi-8 (LZ-8), from Ganoderma lucidum. J Biol Chem 264, 472-478.
Kino, K., Mizumoto, K., Sone, T., Yamaji, T., Watanabe, J., Yamashita, A., Yamaoka, K., Shimizu, K., Ko, K. & Tsunoo, H. (1990). An immunomodulating protein, Ling Zhi-8 (LZ-8) prevents insulitis in non-obese diabetic mice. Diabetologia 33, 713-718.
Kino, K., Sone, T., Watanabe, J., Yamashita, A., Tsuboi, H., Miyajima, H. & Tsunoo, H. (1991). Immunomodulator, LZ-8, prevents antibody production in mice. Int J Immunopharmacol 13, 1109-1115.
Kleinwachter, P., Anh, N., Kiet, T.T., Schlegel, B., Dahse, H.M., Hartl, A. & Grafe, U. (2001). Colossolactones, new triterpenoid metabolites from a Vietnamese mushroom Ganoderma colossum. J Nat Prod 64, 236-239.

References
232
Knudsen, G.R. & Stack, J.P. (1991). Modeling growth and dispersal of fungi in natural environments. In Handbook of Applied Mycology, vol. 1 (ed. D.K. Arora, B. Rai, K.G. Mukerji and G.R. Knudsen), pp. 625-645. Marcel Dekker, New York.
Komatsu, N., Nagumo, N., Okubo, S., Koike, K. (1973). Protective effect of mushroom polysaccharide Schizophyllan against experimental bacterial infections. Jpn J Antibiot 26, 277-283.
Komoda, Y., Shimizu, M., Sonoda, Y. & Sato, Y. (1989). Ganoderic acid and its derivatives as cholesterol synthesis inhibitors. Chem Pharm Bull (Tokyo) 37, 531-533.
Koyama, K., Imaizumi, T., Akiba, M., Kinoshita, K., Takahashi, K., Suzuki, A., Yano, S., Horie, S., Watanabe, K. & Naoi, Y. (1997). Antinociceptive components of Ganoderma lucidum. Planta Med 63, 224-227.
Krebs, K.G., Heusser, D. & Wimmer, H. (1969). Z. Spray reagents. In Thin-Layer Chromatography (ed. E. Stahl), pp. 854-880. Springer-Verlag, Berlin.
Kubota, T., Asaka, Y., Miura, I. & Mori, H. (1982). Structures of Ganoderic acid A and B, two new lanostane type bitter triterpenes from Ganoderma lucidum (Fr.) Karst. Helv Chim Acta 65, 611-619.
Kumar, S., Tamura, K., Jakobsen, I.B. & Nei, M. (2001). MEGA2: Molecular Evolutionary Genetics software. Arizona State University, Tempe, Arizona, USA.
Lakshmi, B., Ajith, T.A., Sheena, N., Gunapalan, N. & Janardhanan, K.K. (2003). Antiperoxidative, anti-inflammatory, and antimutagenic activities of ethanol extract of the mycelium of Ganoderma lucidum occurring in South India. Teratogenesis, Carcinogenesis, and Mutagenesis Supplement 1 S1, 85-97.
Larena, I.I. & Melgarejo, P. (1996). Biological Control of Monilinia laxa and Fusarium oxysporum f. sp. lycopersici by a Lytic Enzyme-Producing Penicillium purpurogenum. Biol Control 6, 361-367.
Lee, K.S., Lee, M.W. & Lee, J.Y. (1982). Studies on the antimicrobial activity of Poria cocos. Korean J Mycol 10, 27-31.
Lee, S., Park, S., Oh, J.W. & Yang, C. (1998). Natural inhibitors for protein prenyltransferase. Planta Med 64, 303-308.
Lee, K.M., Lee, S.Y. & Lee, H.Y. (1999). Effect of ammonium phosphate on mycelial growth and exopolysaccharides production of Ganoderma lucidum in an air-lift fermenter. J Microbiol Biotechnol 9, 726-731.
Lee, J.M., Kwon, H., Jeong, H., Lee, J.W., Lee, S.Y., Baek, S.J. & Surh, Y.J. (2001). Inhibition of lipid peroxidation and oxidative DNA damage by Ganoderma lucidum. Phytother Res 15, 245-249.
Lei, L.S. & Lin, Z.B. (1992). Effect of Ganoderma polysaccharides on T cell subpopulations and production of interleukin 2 in mixed lymphocyte response. Acta Pharmaceut Sin 27, 331-335.
Lei, L.S. & Lin, Z.B. (1993). Effects of Ganoderma polysaccharides on the activity of DNA polymerase alpha of splenocytes and immune function in aged mice. Acta Pharmaceut Sin 28, 577-582.

References
233
Li, P. & Zhang, K. (2000). [Isolation, purification and bioactivities of exopoly saccharides from fermented broth of Ganoderma lucidum]. Wei Sheng Wu Xue Bao 40, 217-220.
Li, M.C., Liang, D.S., Xu, Z.M., Lei, L.S. & Yang, S.Q. (2000a). [Effect of Ganoderma polysaccharides on cAMP in murine peritoneal macrophages]. Zhongguo Zhong Yao Za Zhi 25, 41-43.
Li, P., Xu, R., Xia, J. & Zhang, K. (2000b). Production of tetracyclic triterpenoids by submerged fermentation of G. lucidum. Gongye Weishengwu 30, 15-17.
Lieu, C.W., Lee, S.S. & Wang, S.Y. (1992). The effect of Ganoderma lucidum on induction of differentiation in leukemic U937 cells. Anticancer Res 12, 1211-1215.
Lin, L.J. & Shiao, M.S. (1987). Separation of oxygenated triterpenoids from Ganoderma lucidum by high-performance liquid chromatography. J Chromatogr 410, 195-200.
Lin, L.J., Shiao, M.S. (1988). Seven new triterpenes from Ganoderma lucidum. J Nat Prod 51, 918-924.
Lin, C.P., Sun, A.T. & Liu, Y.A. (1973). Studies on the submerged cultivation of Ganoderma sp. Acta Microbiol Sin 13, 145-151.
Lin, C.N., Tome, W.P. & Won, S.J. (1991). Novel cytotoxic principles of Formosan Ganoderma lucidum. J Nat Prod 54, 998-1002.
Lin, J.M., Lin, C.C., Chen, M.F., Ujiie, T. & Takada, A. (1995). Radical scavenger and antihepatotoxic activity of Ganoderma formosanum, Ganoderma lucidum and Ganoderma neo-japonicum. J Ethnopharmacol 47, 33-41.
Lin, S.B., Li, C.H., Lee, S.S. & Kan, L.S. (2003). Triterpene-enriched extracts from Ganoderma lucidum inhibit growth of hepatoma cells via suppressing protein kinase C, activating mitogen-activated protein kinases and G2-phase cell cycle arrest. Life Sci 72, 2381-2390.
Lindequist, U. (1995). Structure and biological activity of triterpenes, polysaccharides and other constituents of Ganoderma lucidum. In Proc 6th Int Symp Recent Adv Ganoderma lucidum Res (ed. B. K. Kim, I. H. Kim and Y. S. Kim), pp. 61-91. The Pharmaceutical Society of Korea, Seoul, Korea.
Lipsitch, M. & Samore, M.H. (2002). Antimicrobial use and antimicrobial resistance: A population perspective. Emerg Infect Dis 8, 347-354.
Liu, F., Ooi, V.E.C. & Chang, S.T. (1997). Free radical scavenging activities of mushroom polysaccharide extracts. Life Sci 60, 763-771.
Lonergan, G., Jones, C. & Mainwaring, D. (1993). The effect of pH and temperature on radial growth rate and biomass production for selected Australian white-rot fungi in comparison with two strains of Phanerochaete chrysosporium. Materials and Organisms 28, 309-317.
Lorenzen, K. & Anke, T. (1998). Basidiomycetes as a source for new bioactive natural products. Curr Org Chem 2, 329-364.
Luo, J. & Lin, Z.B. (2001). A new triterpene from the fruiting bodies of Ganoderma lucidum. Acta Pharmaceut Sin 36, 595-598.
References
234
Luo, J., Zhao, Y.Y. & Li, Z.B. (2002). A new lanostane-type triterpene from the fruiting bodies of Ganoderma lucidum. J Asian Nat Prod Res 4, 129-134.
Ma, J., Ye, Q., Hua, Y., Zhang, D., Cooper, R., Chang, M.N., Chang, J.Y. & Sun, H.H. (2002). New lanostanoids from the mushroom Ganoderma lucidum. J Nat Prod 65, 72-75.
Magee, B.B., D'Souza, T.M. & Magee, P.T. (1987). Strain and species identification by restriction fragment length polymorphisms in the ribosomal DNA repeat of Candida species. J Bacteriol 169, 1639-1643.
Mahato, S.B., Nandy, A.K. & Roy, G. (1992). Triterpenoids. Phytochemistry 31, 2199-2249.
Mann, C.M. & Markham, J.L. (1998). A new method for determining the minimum inhibitory concentration of essential oils. J Appl Microbiol 84, 538-544.
Martinez-Cruz, R., Cordoba, F., Mireles-Lopez, J.C., Zenteno, E., Perez-Ortega, E., Martinez, M. & Campos, E.P. (1999). Effects of concanvalin A on protein-C activity. Life Sci 64, 879-885.
Matsuyama, H., Mangindaan, R.E.P. & Yano, T. (1992). Protective effect of shizophyllan and scleroglucan against Streptococcus sp. infection in yellowtail (Seriola quinqueradiata). Aquaculture 101, 197-203.
Mau, J.L., Lin, H.C. & Chen, C.C. (2002). Antioxidant properties of several medicinal mushrooms. J Agric Food Chem 50, 6072-6077.
Mayordomo, I., Randez-Gil, F. & Prieto, J.A. (2000). Isolation, purification, and characterization of a cold-active lipase from Aspergillus nidulans. J Agric Food Chem 48, 105-109.
Mayzumi, F., Okamoto, H. & Mizuno, T. (1997). Cultivation of Reishi (Ganoderma lucidum). Food Rev Int 13, 365-382.
McAfee, B.J. & Taylor, A. (1999). A review of the volatile metabolites of fungi found on wood substrates. Natural Toxins 7, 283-303.
McGowan, J.E.J. (2001). Economic impact of antimicrobial resistance. Emerg Infect Dis 7, 286-292.
Miles, P.G. & Chang, S.T. (1997). Mushroom Biology: Concise basics and current developments. World Scientific, Singapore.
Miller, R.N.G., Holderness, M., Bridge, P.D., Chung, G.F. & Zakaria, M.H. (1999). Genetic diversity of Ganoderma in oil palm plantings. Plant Pathology 48, 595-603.
Min, B.S., Nakamura, N., Miyashiro, H., Bae, K.W. & Hattori, M. (1998). Triterpenes from the spores of Ganoderma lucidum and their inhibitory activity against HIV-1 protease. Chem Pharm Bull (Tokyo) 46, 1607-1612.
Min, B.S., Gao, J.J., Nakamura, N. & Hattori, M. (2000). Triterpenes from the spores of Ganoderma lucidum and their cytotoxicity against meth-A and LLC tumor cells. Chem Pharm Bull (Tokyo) 48, 1026-1033.

References
235
Min, B.S., Gao, J.J., Hattori, M., Lee, H.K. & Kim, Y.H. (2001). Anticomplement activity of terpenoids from the spores of Ganoderma lucidum. Planta Med 67, 811-814.
Miyasaka, N., Inoue, H., Totsuka, T., Koike, R., Kino, K. & Tsunoo, H. (1992). An immunomodulatory protein, Ling Zhi-8, facilitates cellular interaction through modulation of adhesion molecules. Biochem Biophys Res Commun 186, 385-390.
Miyazaki, T. & Nishijima, M. (1982). Structural examination of an alkali-extracted, water-soluble heteroglycan of the fungus Ganoderma lucidum. Carbohydr Res 109, 290-294.
Mizuno, T. (1991). Antitumour polysaccharides of polyporaceae fungi, Ganoderma applanatum and Fomitopsis pinicola. In 3rd Symp Ganoderma lucidum, pp. 25-31, Seoul, Korea.
Mizuno, T. (1993). Food function and medicinal effect of mushroom fungi. Foods Food Ingred J, 55-70.
Mizuno, T. (1995). Bioactive biomolecules of mushrooms: food function and medicinal effect of mushroom fungi. Food Rev Int 11, 7-21.
Mizuno, T. (1996). A development of antitumor polysaccharides from mushroom fungi. Foods Food Ingred J, 69-85.
Mizuno, T. (1997). Studies on bioactive substances and medicinal effect of Reishi, Ganoderma lucidum in Japan. In Proc 1st Int Symp Ganoderma lucidum in Japan (ed. A. committee), pp. 121-127. Toyo-Igaku-sha Co., Ltd., Tokyo, Japan.
Mizuno, T. (1999). The extraction and development of antitumor-active polysaccharides from medicinal mushrooms in Japan (Review). Int J Med Mush 1, 9-29.
Mizuno, T., Sakai, T. & Chihara, G. (1995a). Health foods and medicinal usages of mushrooms. Food Rev Int 11, 69-81.
Mizuno, T., Wang, G., Zhang, J., Kawagishi, H., Nishitoba, T. & Li, J. (1995b). Reishi, Ganoderma lucidum and Ganoderma tsugae: bioactive substances and medicinal effects. Food Rev Int 11, 151-166.
Mizuno, T.S., Hazime, S., Nishitoba, T. & Kawagishi, H. (1995c). Antitumor-active substances from mushrooms. Food Rev Int 11, 23-61.
Mizushina, Y., Hanashima, L., Yamaguchi, T., Takemura, M., Sugawara, F., Saneyoshi, M., Matsukage, A., Yoshida, S. & Sakaguchi, K. (1998a). A mushroom fruiting body-inducing substance inhibits activities of replicative DNA polymerases. Biochem Biophys Res Commun 249, 17-22.
Mizushina, Y., Watanabe, I., Togashi, H., Hanashima, L., Takemura, M., Ohta, K., Sugawara, F., Koshino, H., Esumi, Y., Uzawa, J., Matsukage, A., Yoshida, S. & Sakaguchi, K. (1998b). An ergosterol peroxide, a natural product that selectively enhances the inhibitory effect of linoleic acid on DNA polymerase beta. Biol Pharm Bull 21, 444-448.
Mizushina, Y., Takahashi, N., Hanashima, L., Koshino, H., Esumi, Y., Uzawa, J., Sugawara, F. & Sakaguchi, K. (1999). Lucidenic acid O and lactone, new terpene inhibitors of eukaryotic DNA polymerases from a basidiomycete, Ganoderma lucidum. Bioorg Med Chem 7, 2047-2052.

References
236
Moncalvo, J.M. (2000). Systematics of Ganoderma. In Ganoderma Diseases of Perennial Crops (ed. J. Flood, P. D. Bridge and M. Holderness), pp. 23-45. CABI Bioscience, Egham, UK.
Moncalvo, J.F. & Ryvarden, F. (1998). Nomenclature of Ganodermataceae. In Synopsis Fungorum 11, pp. 1-109.
Moncalvo, J.M., Wang, H.F., Wang, H.H. & Hseu, R.S. (1994). Molecular studies in the Ganoderma lucidum complex. In 94' Int Symp Ganoderma Res (ed. Z. B. Lin), pp. 12-13. Beijing Medical University Press, Beijing, China.
Moncalvo, J.M., Wang, H.F. & Hseu, R.S. (1995a). Gene phylogeny of the Ganoderma lucidum complex based on ribosomal DNA sequences. Comparison with traditional taxonomic characters. Mycological Res 99, 1489-1499.
Moncalvo, J.M., Wang, H.F., Wang, H.H. & Hseu, R.S. (1995b). The use of ribosomal DNA sequence data for species identification and phylogeny in the Ganodermataceae. In Ganoderma: Systematics, Phytopathology and Pharmacology. Proceedings of Contributed Symposium 59AB. 5th International Mycological Conference (ed. P. K. Buchanan, R. S. Hseu and J. M. Monacalvo), pp. 31-44. National Taiwan University, Taipei, Vancouver.
Moncalvo, J.M., Wang, H.H. & Hseu, R.S. (1995c). Phylogenetic relationships in Ganoderma inferred from the internal transcribed spacers and 25S ribosomal DNA sequences. Mycologia 87, 223-238.
Moncalvo, J.M., Lutzoni, F.M., Rehner, S.A., Johnson, J. & Vilgalys, R. (2000). Phylogenetic relationships of agaric fungi based on nuclear large subunit ribosomal DNA sequences. System Biol 49, 278-305.
Monroe, S. & Polk, R. (2000). Antimicrobial use and bacterial resistance. Curr Microbiol 3, 496-501.
Morigiwa, A., Kitabatake, K., Fujimoto, Y. & Ikekawa, N. (1986). Angiotensin converting enzyme-inhibitory triterpenes from Ganoderma lucidum. Chem Pharm Bull (Tokyo) 34, 3025-3028.
Moss, G.P. (2004). Revised Section F. Natural products and related compounds, vol. 2004. International Union of Pure and Applied Chemists.
Mothana, R.A., Jansen, R., Julich, W.D. & Lindequist, U. (2000). Ganomycins A and B, new antimicrobial farnesyl hydroquinones from the basidiomycete Ganoderma pfeifferi. J Nat Prod 63, 416-418.
Mothana, R.A.A., Awadh Ali, N.A., Jansen, R., Wegner, U., Mentel, R. & Lindequist, U. (2003). Antiviral lanostanoid triterpenes from the fungus Ganoderma pfeifferi. Fitoterapia 74, 177-180.
Mulligen, M.E., Murry-Leisure, K.A., Ribner, B.S., Standiford, H.C., John, J.F., Karvick, J.A., Kauffman, C.A. & Yu, V.L. (1993). Methicillin resistant Staphylococcus aureus. Am J Med 94, 313-328.
Nakashima, S., Umeda, Y. & Kanada, T. (1979). Effect of polysaccharides from Ganoderma applanatum on immune responses. I. Enhancing effect on the induction of delayed hypersensitivity in mice. Microbiol Immunol 23, 501-513.

References
237
Naoi, Y. (1997). Artificial cultivation of "Reishi": To harvest the highest-quality Ganoderma lucidum. In Proc 1st Int Symp Ganoderma lucidum in Japan (ed. A. committee), pp. 160-162. Toyo-Igaku-sha Co., Ltd., Tokyo, Japan.
Nei, M. (1996). Phylogenetic analysis in molecular evolutionary genetics. Annual Review in Genetics 30, 371-403.
Ngai, P.H.K. & Ng, T.B. (2004). A mushroom (Ganoderma capense) lectin with spectacular thermostability, potent mitogenic activity on splenocytes, and antiproliferative activity toward tumor cells. Biochem Biophys Res Commun 314, 988-993.
Nigg, H.N. & Seigler, D. (1992). Phytochemical resources for Medicine and Agriculture, pp. 76-363. Plenum Press, New York.
Nishitoba, T., Sato, H., Shirasu, S. & Sakamura, S. (1986). Evidence on the strain-specific terpenoid pattern of Ganoderma lucidum. Agric Biol Chem 50, 2151-2154.
Nishitoba, T., Sato, H. & Sakamura, S. (1988). Bitterness and structure relationship of the triterpenoids from Ganoderma lucidum (Reishi). Agric Biol Chem 52, 1791-1795.
Nostro, A., Germanò, M.P., D'Angelo, V., Marino, A. & Cannatelli, M.A. (2000). Extraction methods and bioautography for evaluation of medicinal plant antimicrobial activity. Lett Appl Microbiol 30, 379-384.
Obuchi, T., Kondoh, H., Watanabe, N., Tamai, M., Omura, S., Yang, J.S., Liang, X.T. (1990). Armillaric acid, a new antibiotic produced by Armillaria mellea. Planta Medica 56, 198-201.
Oei, P. (1996). Conservation of strains and culture collections. In Mush Cultivation. Backhuys.
Oh, K.W., Lee, C.K., Kim, Y.S., Eo, S.K. & Han, S.S. (2000). Antiherpetic activities of acidic protein bound polysacchride isolated from Ganoderma lucidum alone and in combinations with acyclovir and vidarabine. J Ethnopharmacol 72, 221-227.
Olsen, R., Schwartzmiller, D., Weppner, W. & Winandy, R. (1989). Biomedical applications of chitin and its derivatives. In Proc 4th Int Conf Chitin Chitosan (ed. G. Skjak-Braek, T. Anthonsen and P. Sandford), pp. 813-828. Elsevier Science Publishers Ltd.
Onions, A.H.S. (1971). Preservation of fungi. In Methods Microbiol, vol. 4 (ed. C. Booth), pp. 113-151. Academic Press Inc. (London) Ltd., London.
Onions, A.H.S. (1983). Preservation of fungi. In The Filamentous Fungi 4: Fungal Technology (ed. T), pp. 375-390. Edward Arnold Publishing, London.
Ooi, L.S.M., Ooi, V.E.C. & Fung, M.C. (2002). Induction of gene expression of immunomodulatory cytokines in the mouse by a polysaccharide from Ganoderma lucidum (Curt.: Fr.) P. Karst. (Aphyllophoromycetideae). Int J Med Mush 4, 27-35.
Ooi, V.E.C. (2000). Medicinally important fungi. In Proc 15th Int Congress Sci Cultivation of Edible Fungi, vol. 1 & 2 (ed. L. J. L. D. Van Griensven), pp. 41-51. A.A. Balkema, Rotterdam, Maastricht.
References
238
Ooi, V.E.C. & Liu, F. (1999). A review of pharmacological activities of mushroom polysaccharides. Int J Med Mush 1, 195-206.
Pace, G.W. (1980). Rheology of mycelial fermentation broth. In Fungal Biotech (ed. J. E. Smith, D. R. Berry and B. Kristiansen), pp. 95-110. Academic Press, London, U.K.
Palombo, E.A. & Sempe, S.J. (2001). Antibacterial activity of traditional Australian medicinal plants. J Ethnopharmacol 77, 151-157.
Palombo, E.A. & Semple, S.J. (2002). Antibacterial activity of Australian plant extracts against methicillin-resistant Staphylococcus aureus (MRSA) and vancomycin-resistant enterococci (VRE). J Basic Microbiol 42, 446-450.
Park, K.S., Park, S., Jung, I.C., Ha, H.C., Kim, S.H., Lee, J.S. (1994). Production of protein-bound polysaccharides by solid state fermentation of Coriolus versicolor. Korean J Mycol 22, 184-189.
Park, D.S., Ryu, Y.J., Seok, S.J., Kim, Y.S., Yoo, Y.B., Cha, D.Y. & Sung, J.M. (1996). Rapid PCR-RFLP. The genetic relationship analysis of Ganoderma spp. using the PCR-RFLP and RAPD. J Agric Sci 38, 251-260.
Park, E.J., Ko, G., Kim, J. & Sohn, D.H. (1997). Antifibrotic effects of a polysaccharide extracted from Ganoderma lucidum, glycyrrhizin, and pentoxifylline in rats with cirrhosis induced by biliary obstruction. Biol Pharm Bull 20, 417-20.
Perlin, D.S. & Park, S. (2001). Rapid identification of fungal pathogens: molecular approaches for the new millennium. Rev Med Microbiol 12(suppl 1), S13-S20.
Pinducciu, G., Serra, C., Cagetti, M.G., Cotti, M., Deidda, D., Pinza, M. & Pompei, R. (1995). Selective antibacterial activity of triterpene derivatives. Med Microbiol Lett 4, 83-90.
Poe, S. (1998). The effect of taxonomic sampling on acuracy of phylogeny estimation: test case of a known phylogeny. Mol Biol Evol 15, 1086-1090.
Pointing, S.B. & Hyde, K.D. (2001). Bio-exploitation of filamentous fungi, First edition. 219p, Fungal Diversity Press, Hong Kong, China.
Protiva, J., Skorkovská, H., Urban, J. & Vystrcil, A. (1979). Triterpenes and steroids from Ganoderma applanatum. Collection Czechoslov Chem Commun 45, 2710-2713.
Quimio, T.H. (1986). Culturing Ganoderma the "Pleurotus-way". Mush Newslett Tropics 6, 12-13.
Quinn, R.J. (1999). High-throughput screening in natural product drug discovery in Australia utilising Australia's biodiversity. Drug Develop Res 46, 250-254.
Robbins, W.J., Kavanagh, F. & Hervey, A. (1947). Antibiotic substances from basidiomycetes 1. Pleurotus. Proc Nat Acad Sci 33, 171-176.
Rodrigues, K.F., Hesse, M. & Werner, C. (2000). Antimicrobial activities of secondary metabolites produced by endophytic fungi from Spondias mombin. J Basic Microbiol 40, 261-267.
Rosecke, J. & Konig, W.A. (2000). Constituents of various wood-rotting basidiomycetes. Phytochemistry 54, 603-610.

References
239
Ryvarden, L. (1991). Genera of polypores. Nomenclature and taxonomy. In Synopsis Fungorum 5. Fungiflora, pp. 363, Oslo, Norway.
Ryvarden, L. (1994). Can we trust morphology in Ganoderma? In Systematics, Phytopathology and Pharmacology, 5th Int Mycol Congress (ed. P. K. Buchanan, R. S. Hseu and J. M. Moncalvo), pp. 19-24. Dept. Agric. Chem., National Taiwan University, Taipei, China.
Ryvarden, L. (2000). Studies in neotropical polypores 2: a preliminary key to neotropical species of Ganoderma with a laccate pileus. Mycologia 92, 180-191.
Saitou, N. (1996). Reconstruction of gene trees from sequence data. Methods Enzymol 266, 427-449.
Sakagami, H., Aoki, T., Simpson, A. & Tanuma, S.I. (1991). Induction of immunopotentiating activity by protein-bound polysaccharide, PSK (Review). Anticancer Res 11, 993-1000.
Sambrook, J. & Russell, D.W. (2001). Molecular Cloning. A laboratory manual, 3rd edition. CSHL press, NY, USA.
Sanderson, M.J. & Donoghue, M.J. (1989). Patterns of variation in levels of homoplasy. Evolution 43, 1781-1795.
Sasaki, T., Arai, Y., Ikekawa, T., Chihara, G. & Fukuoka, F. (1971). Antitumor polysaccharides from some polyporaceae, Ganoderma applanatum (Pers.) Pat and Phellinus linteus (Berk. et Curt) Aoshima. Chem Pharm Bull (Tokyo) 19, 821-826.
Savluchinske Feio, S., Gigante, B., Carlos Roseiro, J. & Marcelo-Curto, M. J. (1999). Antimicrobial activity of diterpene resin acid derivatives. J Microbiol Methods 35, 201-206.
Schisler, L.C. & Volkoff, O. (1977). The effect of safflower oil on mycelial growth of Boletaceae in submerged liquid cultures. Mycologia 69, 118-125.
Schoenknecht, F.D., Sabath, L.D. & Thornsberry, C. (1985). Susceptibility Tests: Special Tests. In Manual Clinical Microbiol (ed. E.H. Lennette), pp. 1000-1008. American Society for Microbiology, Washington, D.C.
Seltrennikoff, C. (1995). Antifungal drugs: (1,3) b-glucan-synthase inhibitors. pp.6-8. Springer-Verlag, Heidelberg.
Sherma, J. (2002). Planar chromatography. Anal Chem 74, 2653-2662.
Shiao, M.S. (1992). Triterpenoid natural products in the fungus Ganoderma lucidum. J Chin Chem Soc 39, 669-674.
Shiao, M.S., Lin, L.J., Yeh, S.F. & Chou, C.S. (1987). Two new triterpenes of the fungus Ganoderma lucidum. J Nat Prod 50, 886-890.
Shiao, M.S., Lin, L.J. & Yeh, S.F. (1988a). Triterpenes from Ganoderma lucidum. Phytochemistry 27, 2911-2914.
Shiao, M.S., Lin, L.J. & Yeh, S.F. (1988b). Triterpenes in Ganoderma lucidum. Phytochemistry 27, 873-875.
Shieh, Y.H., Liu, C.F., Huang, Y.K., Yang, J.Y., Wu, I.L., Lin, C.H. & Li, S.C. (2001). Evaluation of the hepatic and renal-protective effects of Ganoderma lucidum in mice. Am J Chin Med 29, 501-507.
References
240
Shimizu, A., Yano, T., Saito, Y. & Inada, Y. (1985). Isolation of an inhibitor of platelet aggregation from a fungus, Ganoderma lucidum. Chem Pharm Bull (Tokyo) 33, 3012-3015.
Shu, Y.Z. (1998). Recent natural products based drug development: A pharmaceutical industry perspective. J Nat Prod 61, 1053-1071.
Smania, A.J., Delle Monache, F., Smania, E.F.A. & Cuneo, R.S. (1999). Antibacterial activity of steroidal compounds isolated from Ganoderma applanatum (Pers.) Pat. (aphyllophoromycetideae) fruit body. Int J Med Mush 1, 325-330.
Smania, E.F.A., Della Monache, F., Smania, A.J., Yunes, R.A. & Cuneo, R.S. (2003). Antifungal activity of sterols and triterpenes isolated from Ganoderma annulare. Fitoterapia 74, 375-377.
Smith, D. (1993). Tolerance to freezing and thawing. In Stress Tolerance of Fungi (ed. D. H. Jennings), pp. 145-171. Marcel Dekker Inc., 270 Madison Avenue, N.Y., N.Y., 1016.
Smith, B.J. & Sivasithamparam, K. (2000a). Internal transcribed spacer ribosomal DNA sequence of five species of Ganoderma from Australia. Mycological Res 104, 943-951.
Smith, B.J. & Sivasithamparam, K. (2000b). Isozymes of Ganoderma species in Australia. Mycological Res 104, 952-961.
Smith, B.J. & Sivasithamparam, K. (2003). Morphological studies of Ganoderma (Ganodermmataceae) from the Australasian Pacific regions. Australian Systematic Botany 16, 487-503.
Sone, Y., Okuda, R., Wada, N., Kishida, E. & Misaki, A. (1985). Structures and antitumor activities of the polysaccharides isolated from fruiting body and the growing culture of mycelium of Ganoderma lucidum. Agric Biol Chem 49, 2641-2653.
Song, C.H. & Cho, K.Y. (1987). A synthetic medium for the production of submerged cultures of Lentinus edodes. Mycologia 79, 866-876.
Song, C.H., Yang, B.K., Ra, K.S., Shon, D.H., Park, E.J., Go, G.I. & Kim, Y.H. (1998). Hepatoprotective effect of extracellular polymer produced by submerged culture of Ganoderma lucidum WK-003. J Microbiol Biotechnol 8, 277-279.
Stamets, P. (1993). Ganoderma lucidum (Wm, Curtis: Fries) Karsten. In Growing Gourmet and Medicinal Mushrooms (ed. P. Stamets), pp. 355-369. Ten Speed Press, Berkeley, CA.
Steyaert, R.L. (1972). Species of Ganoderma and related genera mainly of the Bogor and Leiden herbaria. Persoonia 7, 55-118.
Steyaert, R.L. (1975). The concept and circumscription of Ganoderma tornatum. Trans Brit Mycol Soc 65, 451-467.
Strigina, L.I., Elkin, Y.N. & Elyakov, G.B. (1971). Steroid metabolites of Ganoderma applanatum basidiomycete. Phytochemistry 10, 2361-2365.
Su, C.H. (1991). Taxonomy and physiology active compounds of Ganoderma - a review. J Taipei Medical College 20, 1-16.
References
241
Su, C.H. & Hsu, Y.H. (1995). A novel biomaterial containing chitin/1-3-b-glucan from cell wall fungal genus Ganoderma for wound healing enhancer. In 2nd Biomedical Material Technol Symp, pp. 16. R. O. C, Taipei.
Su, C.H., Juan, S.W., Sun, C.S. & Tung, I.C. (1996). Application of extracted waste from basidiomes of Ganoderma for healing enhancement of skin wounds. In Proc 2nd Int Conf Mush Biol Mush Prod (ed. D. J. Royse), University Park, Pennslyvania.
Su, C.H., Sun, C.S., Juan, S.W., Hu, C.H., Ke, W.T. & Sheu, M.T. (1997). Fungal mycelia as the source of chitin and polysaccharides and their applications as skin substitutes. Biomaterials 18, 1169-1174.
Su, C.H., Sun, C.S., Juan, S.W., Ho, H.O., Hu, C.H. & Sheu, M.T. (1999). Development of fungal mycelia as skin substitutes: effects on wound healing and fibroblast. Biomaterials 20, 61-68.
Su, H. J., Fann, Y. F., Chung, M. I., Won, S. J. & Lin, C. N. (2000). New lanostanoids of Ganoderma tsugae. J Nat Prod 63, 514-516.
Su, C.H., Yang, Y.Z., Ho, H.O., Hu, C.H. & Sheu, M.T. (2001). High-performance liquid chromatographic analysis for the characterization of triterpenoids from Ganoderma. J Chromatogr Sci 39, 93-100.
Subramaniam, S. (1999). Biology WorkBench. San Diego Super Computing Centre (SDSC), University of Calafornia, San Diego. Accessed via the WWW.
Sudirman, L.I. & Mujiyati, S. (1997). Preliminary detection of antimicrobial activity of fruiting bodies' extracts of tropical Ganoderma sp. In Proc 1st Int Symp Ganoderma lucidum in Japan (ed. A. Committee), pp. 154-159. Toyo-Igaku-sha Co., Ltd., Tokyo, Japan.
Swafford, D.L., Olsen, G.J., Waddell, P.J. & Hillis, D.M. (1996). Phylogentic inference. In Mol Systematics (ed. D. M. Hillis, C. Moritz and B. K. Mable), pp. 407-514. Sinauer Associates, Sunderland, MA.
Swann, E.C. & Taylor, J.W. (1993). Higher taxa of basidiomycetes: an 18S rRNA gene perspective. Mycologia 85, 923-936.
Swann, E.C. & Taylor, J.W. (1995). Phylogenetic perspectives on basidiomycete systematics: evidence form the 18S rRNA gene. Can J Bot 73 (Suppl. 1.), S862-S868.
Swartz, M.N. (2000). Impact of antimicrobial agents and chemotherapy. Antimicrob Agents Chemother 44, 2009-2016.
Takamatsu, S. (1998). PCR applications in fungal phylogeny. In Applications of PCR in Mycology (ed. P. Bridge, D. Arora, C. Reddy and R. Elander), pp. 125-152. CAB International.
Takazawa, H., Tajima, F. & Miyashita, C. (1982). [An antifungal compound from 'Shiitake' (Lentinus edodes)]. Yakugaku Zasshi 102, 489-491.
Takeuchi, T. (1969). Coriolin, a new Basidiomycetes antibiotic. J Antibiot 22, 215-217.
Tanaka, S., Ko, K., Kino, K., Tsuchiya, K., Yamashita, A., Murasugi, A., Sakuma, S. & Tsunoo, H. (1989). Complete amino acid sequence of an immunomodulatory protein, ling zhi-8 (LZ-8). An immunomodulator from a fungus, Ganoderma

References
242
lucidium, having similarity to immunoglobulin variable regions. J Biol Chem 264, 16372-16377.
Tang, Y.J. & Zhong, J.J. (2002). Fed-batch fermentation of Ganoderma lucidum for the hyperproduction of polysaccharide and ganoderic acid. Enzyme Microb Technol 31, 20-28.
Tao, J. & Feng, K.Y. (1990). Experimental and clinical studies on inhibitory effect of Ganoderma lucidum on platelet aggregation. J Tongji Med Univ 10, 240-243.
Tasaka, K., Akagi, M., Miyoshi, K., Mio, M. & Makino, T. (1988a). Anti-allergic constituents in the culture medium of Ganoderma lucidum. (I). Inhibitory effect of oleic acid on histamine release. Agents Actions 23, 153-156.
Tasaka, K., Mio, M., Izushi, K., Akagi, M. & Makino, T. (1988b). Anti-allergic constituents in the culture medium of Ganoderma lucidum. (II). The inhibitory effect of cyclooctasulfur on histamine release. Agents Actions 23, 157-160.
Tomoda, M., Gonda, R., Kasahara, Y. & Hikino, H. (1986). Glycan structures of ganoderans B and C, hypoglycemic glycans of Ganoderma lucidum fruit bodies. Phytochemistry 25, 2817-2820.
Tong, C.C. & Chen, Z.C. (1990). Cultivation of Ganoderma luciderm (sic) in Malaysia. Mush J Tropics 10, 27-30.
Tortora, G.J., Funke, B.R. & Case, C.L. (2001). Microbiology: An Introduction. p.88. Benjamin Cummings, San Fransisco.
Trinci, A.P.J. (1971). Influence of the width of the peripheral growth zone on the radial growth rate of fungal colonies on solid media. J Gen Microbiol 67, 325-344.
Triratana, S., Thaithatgoon, S. & Gawgla, M. (1991). Cultivation of Ganoderma lucidum in sawdust bags. In Proc 13th Int Congress Sci Cultivation of Edible Fungi, vol. 1 & 2 (ed. M. J. Maher). A.A. Balkema Publishers, Dublin, Ireland.
Tseng, T.C., Shiao, M.S., Sheih, Y.S. & Hao, Y.Y. (1984). Studies on Ganoderma lucidum 1. Liquid culture and chemical composition of mycelium. Bot Bull Academia Sin 25, 149-157.
Tsukagoshi, S., Hashimoto, Y., Fujii, G., Kobayashi, H., Nomoto, K. & Orita, K. (1984). Krestin (PSK). Cancer Treat Rev 11, 131-155.
Ukai, S., Kiho, T., Hara, C., Kuruma, I. & Tanaka, Y. (1983). Polysaccharides in fungi. XIV. Anti-inflammatory effect of the polysaccharides from the fruit bodies of several fungi. J Pharmacobiodyn 6, 983-990.
Usui, T., Iwasaki, Y. & Mizuno, T. (1981). Isolation and characterization of two kinds of hetero-galactan from the fruit bodies of Ganoderma applanatum by employing a column of concanavalin A-sepharose 4B. Carbohydr Res 92, 103-114.
Usui, T., Iwasaki, Y., Mizuno, T., Tanaka, M., Shinkai, K. & Arakawa, M. (1983). Isolation and characterization of antitumor active β−D-glucans from the fruit bodies of Ganoderma applanatum. Carbohydr Res 115, 273-280.
van der Hem, L.G., van der Vliet, J.A., Bocken, C.F., Kino, K., Hoitsma, A.J. & Tax, W.J. (1995). Ling Zhi-8: studies of a new immunomodulating agent. Transplantation 60, 438-443.

References
243
van der Waaij, D. & Nord, C.E. (2000). Development and persistence of multi-resistance to antibiotics in bacteria; an analysis and a new approach to this urgent problem. Int J Antimicrob Agents 16, 191-197.
van der Watt, E. & Pretorius, J.C. (2001). Purification and identification of active antibacterial components in Carpobrotus edulis L. J Ethnopharmacol 76, 87-91.
Vidal, C., Fargues, J. & Lacey, L.A. (1997). Intraspecific variability of Paecilomyces fumosoroseus: Effect of temperature and vegetative growth. J Invertebr Pathol 70, 18-26.
Vilgalys, R., Hopple, J.J.S. & Hibbett, D.S. (1994). Phylogenetic implications of generic concepts in fungal taxonomy: The impact of molecular systematic studies. Mycologica Helv 6, 73-91
Villee, C.A., Solomon, E.P., Martin, C.E., Martin, D.W., Berg, L.R. & Davis, P.W. (1989). Biology, Second edition. Harcourt Brace Jovanovich, Inc., Orlando, Florida.
Vlietinck, A.J., Van Hoof, L., Totté, J., Lasure, A., Vanden Berghe, D., Rwangabo, P.C. & Mvukiyumwami, J. (1995). Screening of hundred (sic) Rwandese medicinal plants for antimicrobial and antiviral activity. J Ethnopharmacol 46, 31-47.
Vogel, A.I. (1948). A textbook of practical organic chemistry. 1012p. Longmans, Green and co., London.
Wagner, H., Bladt, S. & Zgainski, E.M. (1984). Plant drug analysis. A thin Layer Chromatography atlas. 351p. Springer-Verlag, Germany.
Wang, Y.C. & McNeil, B. (1995). pH effects on exopolysaccharide and oxalic acid production in cultures of Sclerotium glucanicum. Enzyme Microb Technol 17, 124-130.
Wang, C.N., Chen, J.C., Shiao, M.S. & Wang, C.T. (1991). The inhibition of human platelet function by ganodermic acids. Biochem J 277, 189-197.
Wang, G., Zhang, J., Mizuno, T., Zhuang, C., Ito, H., Mayuzumi, H., Okamoto, H. & Li, J. (1993). Antitumor active polysaccharides from the Chinese mushroom Songshan lingzhi, the fruiting body of Ganoderma tsugae. Biosci Biotechnol Biochem 57, 894-900.
Wang, C.H., Wang, C.H., Shen, M.H. & Yan, X.Y. (1996). Isolation and characterization of polysaccharides from Ganoderma lucidum. In Proc 2nd IntConf Mush Biol Mush Prod (ed. D. J. Royse), pp.205-214. University Park, Pennslyvania.
Wang, H.Q., Zhong, J.J. & Yu, J.T. (1997a). Enhanced production of taxol in suspension cultures of Taxus chinensis by controlling inoculum size. Biotech Lett 19, 353-355.
Wang, S.Y., Hsu, M.L., Hsu, H.C., Tzeng, C.H., Lee, S.S., Shiao, M.S. & Ho, C.K. (1997b). The anti-tumor effect of Ganoderma lucidum is mediated by cytokines released from activated macrophages and T lymphocytes. Int J Cancer 70, 699-705.
Wang, H., Ng, T.B. & Ooi, V.E.C. (1998). Lectins from mushrooms. Mycological Res 102, 897-906.

References
244
Wasser, S.P. (2002). Medicinal mushrooms as a source of antitumor and immunomodulating polysaccharides. Appl Microbiol Biotechnol 60, 258-274.
Wasser, S.P. & Weis, A.L. (1999a). General description of the most important medicinal higher basidiomycetes mushrooms. 1. Int J Med Mush 1, 351-370.
Wasser, S. P. & Weis, A.L. (1999b). Medicinal properties of substances occurring in higher basidiomycetes mushrooms: current perspectives (Review). Int J Med Mush 1, 31-62.
Wasser, S.P. & Weis, A.L. (1999c). Therapeutic effects of substances occurring in higher Basidiomycetes mushrooms: a modern perspective. Crit Rev Immunol 19, 65-96.
Wasson, R.G. (1968). Soma-Divine Mushroom of Immortality. 381p. Harcourt, Brace & World, Inc., New York.
Wen, Z., Li, J., He, S., Xiong, S. & He, X. (1997). [Effect of Ganoderma japonicum (Fr.) Lloyd mixture on experimental thrombosis]. Hunan Yi Ke Da Xue Xue Bao 22, 15-18.
Whittaker, R.H. (1969). New concepts of kingdoms or organisms. Evolutionary relations are better represented by new classifications than by the traditional two kingdoms. Science 163, 150-160.
Wilkens, M., Alarcón, C., Urzúa, A. & Mendoza, L. (2002). Characterization of the bactericidal activity of natural diterpene Kaurenoic Acid. Plata Medica 68, 452-454.
Willard, T. (1990). Reishi Mushroom. Herb of spiritual potency and medical wonder. 167p, Sylvan Press, Seattle, WA.
Worley, C.L. (1939). Interpretation of comparative growths of fungal colonies on different solid substrates. Plant Physiology 14, 589-593.
Wu, T.S., Shi, L.S. & Kuo, S.C. (2001). Cytotoxicity of Ganoderma lucidum triterpenes. J Nat Prod 64, 1121-1122.
Yang, F.C. & Liau, C.B. (1998). Effects of cultivating conditions on the mycelial growth of Ganoderma lucidum in submerged flask cultures. Bioprocess Eng 19, 233-236.
Yang, F., Ke, Y. & Kuo, S. (2000). Effect of fatty acids on the mycelial growth and polysaccharide formation by Ganoderma lucidum in shake flask cultures. Enzyme Microb Technol 27, 295-301.
Yen, G.C. & Wu, J.Y. (1999). Antioxidant and radical scavenging properties of extracts from Ganoderma tsugae. Food Chem 65, 375-379.
Yokokawa, H. & Mitsuhashi, T. (1981). The sterol composition of mushrooms. Phytochemistry 20, 1349-1351.
Yoon, S.Y., Eo, S.K., Kim, Y.S., Lee, C.K. & Han, S.S. (1994). Antimicrobial activity of Ganoderma lucidum extract alone and in combination with some antibiotics. Arch Pharm Res 17, 438-442.

References
245
You, Y.H. & Lin, Z.B. (2002). Protective effects of Ganoderma lucidum polysaccharides peptide on injury of macrophages induced by reactive oxygen species. Acta Pharmacol Sin 23, 787-791.
Zhang, Q. & Lin, Z. (1999a). [Study on antitumor activity and mechanism of Ganoderma polysaccharides B]. Zhongguo Zhong Xi Yi Jie He Za Zhi 19, 544-547.
Zhang, Q. & Lin, Z. (1999b). The antitumor activity of Ganoderma lucidum (Curt.:Fr.)P. Karst. (Ling Zhi) (aphyllophoromycetideae) polysaccharides is related to tumor necrosis factor-α and interferon-γ. Int J Med Mush 1, 207-215.
Zhang, H.N. & Lin, Z.B. (2004). Hypoglycemic effect of Ganoderma lucidum polysaccharides. Acta Pharmacol Sin 25, 191-195.
Zhang, J., Wang, G., Li, H., Zhuang, C., Mizuno, T., Ito, H., Mayuzumi, H., Okamoto, H. & Li, J. (1994). Antitumor active protein-containing glycans from the Chinese mushroom songshan lingzhi, Ganoderma tsugae mycelium. Biosci Biotechnol Biochem 58, 1202-1205.
Zhang, G.L., Wang, Y.H., Ni, W., Teng, H.L. & Lin, Z.B. (2002a). Hepatoprotective role of Ganoderma lucidum polysaccharide against BCG-induced immune liver injury in mice. World J Gastroenterol 8, 728-733.
Zhang, J., Tang, Q., Zimmerman-Kordmann, M., Reutter, W. & Fan, H. (2002b). Activation of B lymphocytes by GLIS, a bioactive proteoglycan from Ganoderma lucidum. Life Sci 71, 623-638.
Zhao, C. & He, Y. (2002). [Isolation, purification and structural characterization of active polysaccharides from the mycelium of Ganoderma lucidum]. Zhong Yao Cai 25, 252-254.
Zhong, J.J., Fang, Q.H. & Tang, Y.J. (2002). Enhanced production of valuable metabolites in submerged cultures of medicinal mushroom Ganoderma lucidum by manipulation of oxygen supply. J Plant Biotechnol 4, 109-115.
Zhou, S. & Gao, Y. (2002). The immunomodulating effects of Ganoderma lucidum (Curt.:Fr.) P. Karst. (Ling Zhi, Reishi mushroom) (Aphyllophoromycetideae). Int J Med Mush 4, 1-11.
Zhu, M., Chang, Q., Wong, L.K., Chong, F.S. & Li, R.C. (1999). Triterpene antioxidants from Ganoderma lucidum. Phytother Res 13, 529-531.
Zhu, H.S., Yang, X.L., Wang, L.B., Zhao, D.X. & Chen, L. (2000). Effects of extracts from sporoderm-broken spores of Ganoderma lucidum on HeLa cells. Cell Biol Toxicol 16, 201-6.
Zjawiony, J.K. (2004). Biologically active compounds from Aphyllophorales (Polypore) fungi. J Nat Prod 67, 300-310.

Appendix 1
246
Appendix 1
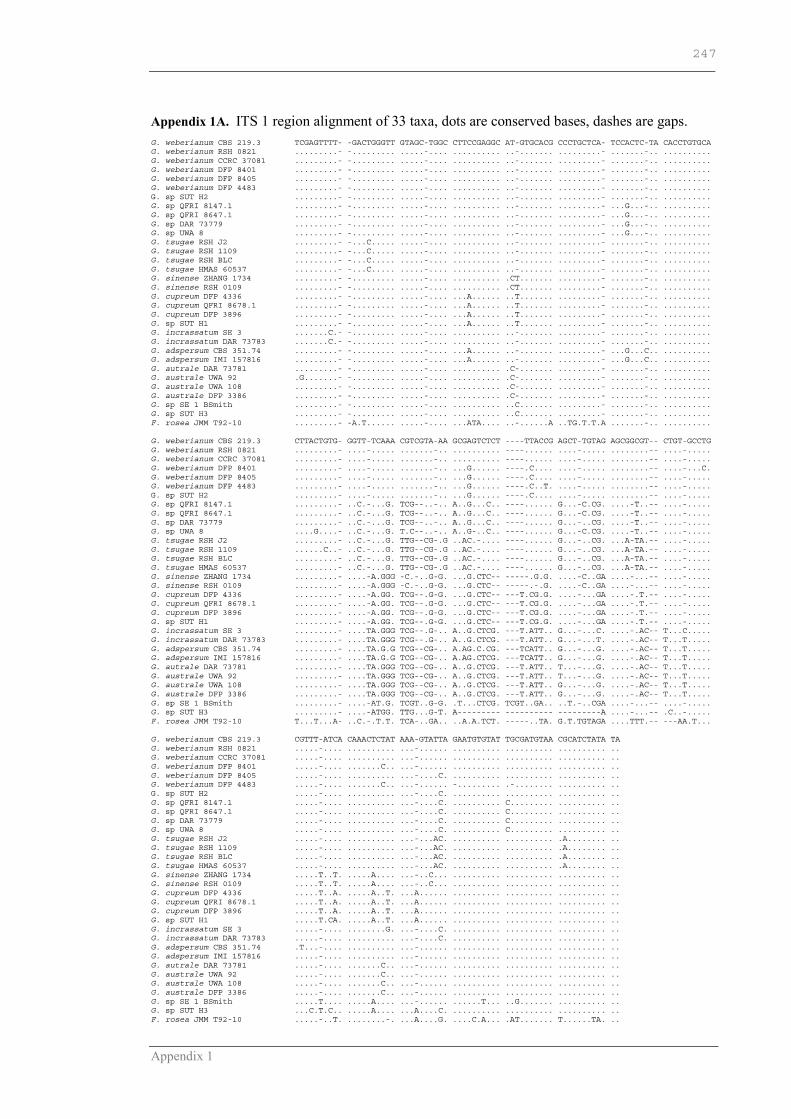
Appendix 1
247
Appendix 1A. ITS 1 region alignment of 33 taxa, dots are conserved bases, dashes are gaps. G. weberianum CBS 219.3 TCGAGTTTT- -GACTGGGTT GTAGC-TGGC CTTCCGAGGC AT-GTGCACG CCCTGCTCA- TCCACTC-TA CACCTGTGCA G. weberianum RSH 0821 .........- -......... .....-.... .......... ..-....... .........- .......-.. .......... G. weberianum CCRC 37081 .........- -......... .....-.... .......... ..-....... .........- .......-.. .......... G. weberianum DFP 8401 .........- -......... .....-.... .......... ..-....... .........- .......-.. .......... G. weberianum DFP 8405 .........- -......... .....-.... .......... ..-....... .........- .......-.. .......... G. weberianum DFP 4483 .........- -......... .....-.... .......... ..-....... .........- .......-.. .......... G. sp SUT H2 .........- -......... .....-.... .......... ..-....... .........- .......-.. .......... G. sp QFRI 8147.1 .........- -......... .....-.... .......... ..-....... .........- ...G...-.. .......... G. sp QFRI 8647.1 .........- -......... .....-.... .......... ..-....... .........- ...G...-.. .......... G. sp DAR 73779 .........- -......... .....-.... .......... ..-....... .........- ...G...-.. .......... G. sp UWA 8 .........- -......... .....-.... .......... ..-....... .........- ...G...-.. .......... G. tsugae RSH J2 .........- -...C..... .....-.... .......... ..-....... .........- .......-.. .......... G. tsugae RSH 1109 .........- -...C..... .....-.... .......... ..-....... .........- .......-.. .......... G. tsugae RSH BLC .........- -...C..... .....-.... .......... ..-....... .........- .......-.. .......... G. tsugae HMAS 60537 .........- -...C..... .....-.... .......... ..-....... .........- .......-.. .......... G. sinense ZHANG 1734 .........- -......... .....-.... .......... .CT....... .........- .......-.. .......... G. sinense RSH 0109 .........- -......... .....-.... .......... .CT....... .........- .......-.. .......... G. cupreum DFP 4336 .........- -......... .....-.... ...A...... ..T....... .........- .......-.. .......... G. cupreum QFRI 8678.1 .........- -......... .....-.... ...A...... ..T....... .........- .......-.. .......... G. cupreum DFP 3896 .........- -......... .....-.... ...A...... ..T....... .........- .......-.. .......... G. sp SUT H1 .........- -......... .....-.... ...A...... ..T....... .........- .......-.. .......... G. incrassatum SE 3 .......C.- -......... .....-.... .......... ..-....... .........- .......-.. .......... G. incrassatum DAR 73783 .......C.- -......... .....-.... .......... ..-....... .........- .......-.. .......... G. adspersum CBS 351.74 .........- -......... .....-.... ...A...... ..-....... .........- ...G...C.. .......... G. adspersum IMI 157816 .........- -......... .....-.... ...A...... ..-....... .........- ...G...C.. .......... G. autrale DAR 73781 .........- -......... .....-.... .......... .C-....... .........- .......-.. .......... G. australe UWA 92 .G.......- -......... .....-.... .......... .C-....... .........- .......-.. .......... G. australe UWA 108 .........- -......... .....-.... .......... .C-....... .........- .......-.. .......... G. australe DFP 3386 .........- -......... .....-.... .......... .C-....... .........- .......-.. .......... G. sp SE 1 BSmith .........- -......... .....-.... .......... ..C....... .........- .......-.. .......... G. sp SUT H3 .........- -......... .....-.... .......... ..C....... .........- .......-.. .......... F. rosea JMM T92-10 .........- -A.T...... .....-.... ...ATA.... ..-......A ..TG.T.T.A .......-.. .......... G. weberianum CBS 219.3 CTTACTGTG- GGTT-TCAAA CGTCGTA-AA GCGAGTCTCT ----TTACCG AGCT-TGTAG AGCGGCGT-- CTGT-GCCTG G. weberianum RSH 0821 .........- ....-..... .......-.. .......... ----...... ....-..... ........-- ....-..... G. weberianum CCRC 37081 .........- ....-..... .......-.. .......... ----...... ....-..... ........-- ....-..... G. weberianum DFP 8401 .........- ....-..... .......-.. ...G...... ----.C.... ....-..... ........-- ....-...C. G. weberianum DFP 8405 .........- ....-..... .......-.. ...G...... ----.C.... ....-..... ........-- ....-..... G. weberianum DFP 4483 .........- ....-..... .......-.. ...G...... ----.C..T. ....-..... ........-- ....-..... G. sp SUT H2 .........- ....-..... .......-.. ...G...... ----.C.... ....-..... ........-- ....-..... G. sp QFRI 8147.1 .........- ..C.-...G. TCG--..-.. A..G...C.. ----...... G...-C.CG. ....-T..-- ....-..... G. sp QFRI 8647.1 .........- ..C.-...G. TCG--..-.. A..G...C.. ----...... G...-C.CG. ....-T..-- ....-..... G. sp DAR 73779 .........- ..C.-...G. TCG--..-.. A..G...C.. ----...... G...-..CG. ....-T..-- ....-..... G. sp UWA 8 ....G....- ..C.-...G. T.C--..-.. A..G-..C.. ----...... G...-C.CG. ....-T..-- ....-..... G. tsugae RSH J2 .........- ..C.-...G. TTG--CG-.G ..AC.-.... ----...... G...-..CG. ...A-TA.-- ....-..... G. tsugae RSH 1109 ......C..- ..C.-...G. TTG--CG-.G ..AC.-.... ----...... G...-..CG. ...A-TA.-- ....-..... G. tsugae RSH BLC .........- ..C.-...G. TTG--CG-.G ..AC.-.... ----...... G...-..CG. ...A-TA.-- ....-..... G. tsugae HMAS 60537 .........- ..C.-...G. TTG--CG-.G ..AC.-.... ----...... G...-..CG. ...A-TA.-- ....-..... G. sinense ZHANG 1734 .........- ....-A.GGG -C.-..G-G. ...G.CTC-- -----.G.G. ....-C..GA ....-...-- ....-..... G. sinense RSH 0109 .........- ....-A.GGG -C.-..G-G. ...G.CTC-- -----.-.G. ....-C..GA ....-...-- ....-..... G. cupreum DFP 4336 .........- ....-A.GG. TCG--.G-G. ...G.CTC-- ---T.CG.G. ....-...GA ....-.T.-- ....-..... G. cupreum QFRI 8678.1 .........- ....-A.GG. TCG--.G-G. ...G.CTC-- ---T.CG.G. ....-...GA ....-.T.-- ....-..... G. cupreum DFP 3896 .........- ....-A.GG. TCG--.G-G. ...G.CTC-- ---T.CG.G. ....-...GA ....-.T.-- ....-..... G. sp SUT H1 .........- ....-A.GG. TCG--.G-G. ...G.CTC-- ---T.CG.G. ....-...GA ....-.T.-- ....-..... G. incrassatum SE 3 .........- ....TA.GGG TCG--.G-.. A..G.CTCG. ---T.ATT.. G...-...C. ....-.AC-- T...C..... G. incrassatum DAR 73783 .........- ....TA.GGG TCG--.G-.. A..G.CTCG. ---T.ATT.. G...-...T. ....-.AC-- T...T..... G. adspersum CBS 351.74 .........- ....TA.G.G TCG--CG-.. A.AG.C.CG. ---TCATT.. G...-...G. ....-.AC-- T...T..... G. adspersum IMI 157816 .........- ....TA.G.G TCG--CG-.. A.AG.CTCG. ---TCATT.. G...-...G. ....-.AC-- T...T..... G. autrale DAR 73781 .........- ....TA.GGG TCG--CG-.. A..G.CTCG. ---T.ATT.. T...-...G. ....-.AC-- T...T..... G. australe UWA 92 .........- ....TA.GGG TCG--CG-.. A..G.CTCG. ---T.ATT.. T...-...G. ....-.AC-- T...T..... G. australe UWA 108 .........- ....TA.GGG TCG--CG-.. A..G.CTCG. ---T.ATT.. G...-...G. ....-.AC-- T...T..... G. australe DFP 3386 .........- ....TA.GGG TCG--CG-.. A..G.CTCG. ---T.ATT.. G...-...G. ....-.AC-- T...T..... G. sp SE 1 BSmith .........- ....-AT.G. TCGT..G-G. .T...CTCG. TCGT..GA.. ..T.-..CGA ....-...-- ....-..... G. sp SUT H3 .........- ....-ATGG. TTG...G-T. A--------- ---------- ---------A ....-...-- .C..-..... F. rosea JMM T92-10 T...T...A- ..C.-.T.T. TCA-..GA.. ..A.A.TCT. -----..TA. G.T.TGTAGA ....TTT.-- ---AA.T... G. weberianum CBS 219.3 CGTTT-ATCA CAAACTCTAT AAA-GTATTA GAATGTGTAT TGCGATGTAA CGCATCTATA TA G. weberianum RSH 0821 .....-.... .......... ...-...... .......... .......... .......... .. G. weberianum CCRC 37081 .....-.... .......... ...-...... .......... .......... .......... .. G. weberianum DFP 8401 .....-.... .......C.. ...-...... .......... .......... .......... .. G. weberianum DFP 8405 .....-.... .......... ...-....C. .......... .......... .......... .. G. weberianum DFP 4483 .....-.... .......C.. ...-...... -......... .-........ .......... .. G. sp SUT H2 .....-.... .......... ...-....C. .......... .......... .......... .. G. sp QFRI 8147.1 .....-.... .......... ...-....C. .......... C......... .......... .. G. sp QFRI 8647.1 .....-.... .......... ...-....C. .......... C......... .......... .. G. sp DAR 73779 .....-.... .......... ...-....C. .......... C......... .......... .. G. sp UWA 8 .....-.... .......... ...-....C. .......... C......... .......... .. G. tsugae RSH J2 .....-.... .......... ...-...AC. .......... .......... .A........ .. G. tsugae RSH 1109 .....-.... .......... ...-...AC. .......... .......... .A........ .. G. tsugae RSH BLC .....-.... .......... ...-...AC. .......... .......... .A........ .. G. tsugae HMAS 60537 .....-.... .......... ...-...AC. .......... .......... .A........ .. G. sinense ZHANG 1734 .....T..T. .....A.... ...-..C... .......... .......... .......... .. G. sinense RSH 0109 .....T..T. .....A.... ...-..C... .......... .......... .......... .. G. cupreum DFP 4336 .....T..A. .....A..T. ...A...... .......... .......... .......... .. G. cupreum QFRI 8678.1 .....T..A. .....A..T. ...A...... .......... .......... .......... .. G. cupreum DFP 3896 .....T..A. .....A..T. ...A...... .......... .......... .......... .. G. sp SUT H1 .....T.CA. .....A..T. ...A...... .......... .......... .......... .. G. incrassatum SE 3 .....-.... ........G. ...-....C. .......... .......... .......... .. G. incrassatum DAR 73783 .....-.... .......... ...-....C. .......... .......... .......... .. G. adspersum CBS 351.74 .T...-.... .......... ...-...... .......... .......... .......... .. G. adspersum IMI 157816 .....-.... .......... ...-...... .......... .......... .......... .. G. autrale DAR 73781 .....-.... .......C.. ...-...... .......... .......... .......... .. G. australe UWA 92 .....-.... .......C.. ...-...... .......... .......... .......... .. G. australe UWA 108 .....-.... .......C.. ...-...... .......... .......... .......... .. G. australe DFP 3386 .....-.... .......C.. ...-...... .......... .......... .......... .. G. sp SE 1 BSmith .....T.... .....A.... ...-...... ......T... ..G....... .......... .. G. sp SUT H3 ...C.T.C.. .....A.... ...A....C. .......... .......... .......... .. F. rosea JMM T92-10 .....-..T. ........-. ...A....G. ....C.A... .AT....... T......TA. ..

Appendix 1
248
Appendix 1B. ITS 2 alignment of 33 taxa, 224 taxa, dots are conserved bases, dashes are gaps. G. weberianum CCRC 37081 AATCTTCAAC TT-ACGGACC TTTGC----G GGTTTT-GTA -GGCTTGGAC TT-GGAGGCT T--GTCGGTC GTGTTTC--- G. weberianum CBS 219.3 .......... ..-....... .....----. ......-... -......... ..-N...... .--.....N. .......--- G. weberianum RSH 0821 .......... ..-....... .....----. ......-... -......... ..-....... .--.....N. .......--- G. weberianum DFP 8401 .......... ..-..A.... .....----. C.....-... -......... ..-....... .T-.....C. .......--- G. weberianum DFP 4483 .......... ..-..A.... .....----. C.....-... -......... ..-....... .TT.....C. .......--- G. weberianum DFP 8405 .......... ..-..A.... .....----. C.....-... -......... ..-....... .--.....C. .......--- G. sp SUT H2 .......... ..-..A.... .....----. ..N...T... -......... ..-....... .--.....C. .......--- G. sp UWA 8 .......... C.-..AAG.T ...-----GT C..-C.-... -......... ..-....... .T-.....C. .CTC..G--- G. sp DAR 73779 .......... C.-..AAG.T ...-----GT C..-..-... -......... ..-....... .T-.....C. .CTC..G--- G. sp QFRI 8147.1 .......... C.-..AAG.T ...-----GT C..-..-... -......... ..-....... .T-.....C. .CTC..G--- G. sp QFRI 8647.1 .......... C.-..AAG.T ...-----GT C..-..-... -......... ..-....... .--.....C. ..TC..G--- G. tsugae RSH J2 ....N..... C.-..AAG.T ...------. TNG-..T... -......... ..-....... .--.....C. ..T-A..--- G. tsugae RSH BLC ....N..... C.-..AAG.T ...------. T.G-..T... -......... ..-....... .--.....C. ..T-A..--- G. tsugae HMAS 60537 ....N.N..N C.-..AAG.T ...------. T.G-..T... -......... ..-....... .--.....C. ..T-A..--- G. tsugae RSH 1109 .......... C.-..AAG.T ...------. T.G-..T... -......... ..-....... .--.....C. ..T-A..--- G. sinense RSH 0109 .......... C.-..AAGGT C..TG--TAA A.GC..TTN. -......... ..-....... .--......- -CT..AT--A G. sinense ZHANG 1734 .......... C.-..AAGGT C..TG--TAA A.GC..TT.. -......... ..-....... .--......- -CT..AT--A G. cupreum QFRI 8678.1 .......... C.-..AAG.T ...T----AA T.CG..T... -......... ..-....... .--......- -CT.GAT--T G. cupreum DFP 3896 .......... C.-..AAG.T ...T----AA T.CG..T... -......... ..-....... .--.....-- -CT.GAT--T G. cupreum DFP 4336 .......... C.-..AAG.T ...T----AA T.CG..T... -......... ..-....... .--......- -CT..AT--T G. sp SUT H1 .......... C.-..AAG.N ...TT---AA T.GG..T... -......... ..-....... .--......- -CT.GAT--T G. incrassatum SE 3 .........T C.-..AA..T .C.TA--TG. C.--C.T... -......... ..-....... .--....... CCT..A.A-A G. incrassatum DAR 73783 .........T C.-..AA..T .C.TA--TG. C.--C.T... -......... ..-....... .--....... CCT..A.A-A G. adspersum CBS 351.74 .......... ..-...AG.T .C.TG--CGA ..--..T... -..G...... ..-....... .--......- -CT..AA--A G. adspersum IMI 157816 .......... ..-...AG.T .C.TG--CGA ..--..T... -..G...... ..-....... .--......- -CT..AA--A G. autrale DAR 73781 .......... ..-..AAG.T C..TG--CG. C.--..T... -......... ..-....... .--.....C- -CT..AA--C G. australe UWA 92 .......... ..-..AAG.T C..TG--CG. C.--..T... -......... ..-....... .--.....C- -CT..AA--C G. australe DFP 3386 .......... ..-..AAG.T C..TG--CG. C.--..T... -......... ..-....... .--.....C- -CT..AA--C G. australe UWA 108 .......... ..-..AAG.T C..TG--CG. C.--..T... -......... ..-....... .--.....C- -CT..AAA-T G. sp SE 1 BSmith .......... C.-..AAT.T C..----TGC ......T... -......... ..-....... .--....... -.T..ATT-- G. sp SUT H3 .......... C.-..AAG.T ....AAATAA T.GC..GT.. -......... ..-....... .--.....C. -.T.-ATC-- F. rosea JMM T92-10 ...TA..... ..-.TAAG.. ...------. TTAG..TA.. A......... ..-.....GA .TT..T..-- -CC.AAT--- G. weberianum CCRC 37081 GGT--CGGCT CCTCTTAAAT GCA-TTAGCT TGATT-CCTT GCGGATCGG- CTCTCGGTGT GATAAT-GTC TACGACGCGA G. weberianum CBS 219.3 ...--..... .......... ...-...... .....-.... .........- .......... ......-... .......... G. weberianum RSH 0821 ...--..... .......... ...-...... .....-.... .........- .......... ......-... ....N..... G. weberianum DFP 8401 ...--..... .......... ...-...... .....-.... .........- .......... ......-... ....C..... G. weberianum DFP 4483 ...--..... .......... ...-...... .....-.... .........- .......... ......-... ....C...N. G. weberianum DFP 8405 ...--..... .......... ...-...... .....-.... .........- .......... ......-... ....C..... G. sp SUT H2 ...--..... .......... ...-...... .....-.... .........- .......... ......-... ....C..... G. sp UWA 8 -.C--..... .......... ...-...T.. ..G..-.... .........- .......... ......-A.. ..T.C..... G. sp DAR 73779 -.C--..... .......... ...-...... ..G..-.... .........- .......... ......-A.. ..T.C..... G. sp QFRI 8147.1 -.C--..... .......... ...-...... ..G..-.... .T.......- .......... ......-A.. ..T.C..... G. sp QFRI 8647.1 -.C--..... .......... ...-...... ..G..-.... .........- .......... ......-A.. ..T.C..... G. tsugae RSH J2 ...--..... .......... ...-...... ..G..-.... .........- .......... ......-... ....CGCT.. G. tsugae RSH BLC ...--..... .......... ...-...... ..G..-.... .........- .......... ......-... ....C..T.. G. tsugae HMAS 60537 ...--..... .......... ...-...... ..G..-.... .........- .......... ......-... ....C..... G. tsugae RSH 1109 ...--..... .......... ...-...... ..G..-.... .N.......- .......... ......-... ....N..... G. sinense RSH 0109 ...--..... .........C ...-...... .....-.... .........T T.G....... .....C-... .......... G. sinense ZHANG 1734 ...--..... .........C ...-...... .....-.... .........T T.G....... ......-... .......... G. cupreum QFRI 8678.1 ...--..... .....C.... ...-...... ..G..-.... .........C T.G....... ......-... ....C..... G. cupreum DFP 3896 ...--..... .....C.... A..-...... ..G..-.... .........C T.G....... ......-... ....C..... G. cupreum DFP 4336 ...--..... .....C.... ...-...T.. ..G..-.... .........C T.G....... ......-... ....C..... G. sp SUT H1 ...--..... .....C.... ...-...... ..G..-.... .........C T.G....... ......-... ....C..... G. incrassatum SE 3 ...--..... .......... ...-...... ..G..-.... .........C T.G....... ......-... ....C..... G. incrassatum DAR 73783 ...--..... .......... ...-...... ..G..-.... .........C T.G....... ......-... ....C..... G. adspersum CBS 351.74 ...--..... .......... ...-...... ..G..-.... .........G T.G....... ......-... ....C-.... G. adspersum IMI 157816 ...--..... .......... ...A...... ..G..-.... .........G T.G....... ......-... ....C..... G. autrale DAR 73781 ...--..... .......... ...-...... .....T.... .........- ..G....... ......-... ...TC..... G. australe UWA 92 ...--..... .......... ...-...... .....T.... .........- ..G....... ......-... ...TC..... G. australe DFP 3386 ...--..... .......... ...-...... .....T.... .........- ..G....... ......-... ...TC..... G. australe UWA 108 ...--..... .......... ...-...... .....T.... .........- ..G....... ......-... ...TC..... G. sp SE 1 BSmith .A.--..... .....C.... ...-...... ..G..C.T.. ...A.....C T-G....... ......-... ....C..... G. sp SUT H3 ...--..... .....C...C ...-...... ..G..C.T.. .........C T.G....... ......-... ....C..... F. rosea JMM T92-10 ..C--.A... .......... ...-...... ...AC-.T.. AT.......- .......... ......NA.T ...CC.AT.G G. weberianum CCRC 37081 CC-NTGAAGC GTTTT----G G---CGAGCT TCTAACC-GT CCTTG-TTTG GACA---AAT TTA- G. weberianum CBS 219.3 ..-G...... .....----. .---...... .......-.. .....-.... ....---... ...- G. weberianum RSH 0821 ..-G...... .....----. .---...... .......-.. GA.A.-.... -...---... ...- G. weberianum DFP 8401 ..-G...... .....----. .---...... .......-.. .....-.C.. --G.---.C. ...- G. weberianum DFP 4483 ..-GN..... .....T---. .---...... .......-.. .....-.C.. --G.---.C. ...- G. weberianum DFP 8405 ..-G...... .....----. .---...... .......-.. .....-.C.. --G.---.C. ...- G. sp SUT H2 ..-G...... .....----. .---...... .......-.. .....-.... ....---... ...- G. sp UWA 8 ..-G...... ....-----. .---...... .......-.. .TCA.--... ..G.---.C. ...- G. sp DAR 73779 ..-G...... ....-----. .---...... .......-.. .TCA.--... ..G.---.C. ...- G. sp QFRI 8147.1 ..-G...... ....-----. .---...... .......-.. .TCA.--... ..G.---.C. ...- G. sp QFRI 8647.1 ..-G...... ....-----. .---...... .......-.. .TCA.--... ..G.---.C. ...- G. tsugae RSH J2 ..-G...... ....-----. .---...... .......-.. .T.AT----- A-G.C-AGC. ...T G. tsugae RSH BLC ..-G...... ....-----. .---...... .......-.. .T.AT----- A.G.C-AGC. ...T G. tsugae HMAS 60537 ..-G...... ....-----. .---...... ......Y-.. .T.AT----- A.G.C-AGC. ...T G. tsugae RSH 1109 ..-G...... ....-----. .---...... .......-.. .T.AT----- A.G.C-AGC. ...T G. sinense RSH 0109 ..-G...... .....----. .---.A.... ......G-.. .TC..-.A.. ..G.CAA.GC ...- G. sinense ZHANG 1734 ..-G...... .....----. .---.A.... ......N-.. .TC..-.A.. ..G.CAA.GC ...- G. cupreum QFRI 8678.1 ..-GA..... .....T--G. .---...... ....GT.-.. .TC..-.A.A ..G.---.TC ...- G. cupreum DFP 3896 ..-GA..... .....T--G. .---...... ....GT.-.. .TC..-.A.A ..G.---.TC ...- G. cupreum DFP 4336 ..-GA..... .....T--G. .---...... ....GT.-.. .TC..-.A.A ..G.---.TC ...- G. sp SUT H1 ..-GA..... .....T--G. .---...... ....GT.-.. .TC..-.A.A ..G.CA-.TC ...- G. incrassatum SE 3 ..-G...... ..G..T--G. .---...... .....T.-.. .TCGT-.ACA ..G.--ACC. ...- G. incrassatum DAR 73783 ..-G...... ..G..T--G. .---...... .....T.C.. .TCGT-.ACA ..G.--ACC. ...- G. adspersum CBS 351.74 ..-G.-.... ....-----. .---.A.... .......-.. .TCG.-.A.A ..G.CAAGT. .AT- G. adspersum IMI 157816 ..-G...... ....-----. .---.A.... .......-.. .TCG.-.A.A ..G.CAAGT. ...- G. autrale DAR 73781 ..-G...... ....-----. .---.A.... .......-.. ..CGT-.ACA ..G.---GC. ...- G. australe UWA 92 ..-G...... ....-----. .---.A.... .......-.. ..CGT-.ACA ..G.---GC. ...- G. australe DFP 3386 ..-G...... ....-----. .---.A...C .......-.. .TCGT-.ACA ..G.---GC. ...- G. australe UWA 108 ..-G...... ....-----. .---.A.... .......-.. .TCGT-.ACA ..G.---GC. ...- G. sp SE 1 BSmith ..-G...C.. ..---T--T. .---...... .....-.C.. .-CC.T.A.T .GG.CAACGC ...- G. sp SUT H3 ..-G...C.. ..---T--T. .---...... .....-TC.. .TCC.C...T .GG.CAACT. ...- F. rosea JMM T92-10 .T-G....AT ....----T. .---.A.... ..C..TT-.. .T..TTCAA. ...G--AT.. ...T

Appendix 2
249
Appendix 2

Appendix 2
Temperature and pH growth profiles of Basidiomycetous fungi.
Average Mycelial Growth at Different pH and Temperaturesa 10°C 15°C 20°C 25°C 30°C 37°C 45°C pH Average STD Average STD Average STD Average STD Average STD Average STD Average STD
Ganoderma H1 3 0.00 0.00 1.75 0.00 3.50 0.00 11.33 2.08 20.67 2.08 6.67 0.58 0.00 0.00 4 0.00 0.00 1.92 0.14 3.67 0.29 19.67 2.08 29.67 1.53 10.50 0.50 0.00 0.00 5 0.00 0.00 2.50 0.00 3.58 0.52 20.67 1.15 29.33 3.06 11.33 0.58 0.00 0.00 6 0.00 0.00 1.83 0.14 4.08 0.52 18.33 1.53 33.33 2.08 11.67 0.58 0.00 0.00 7 0.00 0.00 2.08 0.14 4.00 0.00 19.33 1.53 31.33 2.31 12.08 0.14 0.00 0.00 8 0.00 0.00 2.42 0.38 3.92 0.14 22.00 3.46 33.17 0.76 12.67 0.58 0.00 0.00 9 0.00 0.00 1.67 0.58 4.17 0.29 25.67 1.53 25.17 1.89 9.83 0.76 0.00 0.00 Ganoderma H2 3 0.00 0.00 2.67 0.58 7.50 0.00 26.83 0.76 32.17 0.76 8.83 0.76 0.00 0.00 4 0.00 0.00 3.50 0.50 10.00 0.00 31.00 0.87 39.17 0.76 14.17 1.44 0.00 0.00 5 0.00 0.00 4.33 0.58 13.67 0.58 38.00 1.00 40.00 0.00 14.33 0.58 0.00 0.00 6 0.00 0.00 4.67 0.58 13.33 0.58 37.67 1.53 43.33 2.89 12.00 1.00 0.00 0.00 7 0.00 0.00 4.00 0.00 12.00 0.00 36.33 2.08 40.00 0.00 13.17 0.29 0.00 0.00 8 0.00 0.00 3.50 0.00 11.67 0.58 36.83 1.26 40.00 0.00 11.67 1.53 0.00 0.00 9 0.00 0.00 2.50 0.50 7.50 0.50 25.17 2.75 34.67 0.58 11.00 1.00 0.00 0.00 Ganoderma H3 3 2.67 0.58 7.33 0.58 25.17 0.76 28.33 2.89 1.00 0.00 0.00 0.00 0.00 0.00 4 3.00 0.00 9.00 0.00 28.33 0.58 34.67 0.58 0.67 0.29 0.00 0.00 0.00 0.00 5 4.67 0.58 12.33 0.58 29.00 3.61 35.33 1.44 1.00 0.00 0.00 0.00 0.00 0.00 6 5.33 0.58 14.00 0.00 32.00 1.00 36.00 1.00 0.75 0.25 0.00 0.00 0.00 0.00 7 4.67 0.58 12.50 0.50 30.50 0.87 35.67 0.58 1.17 0.29 0.00 0.00 0.00 0.00 8 2.67 0.58 8.67 0.58 37.67 1.15 29.00 2.65 0.92 0.14 0.00 0.00 0.00 0.00 9 2.50 0.50 8.00 0.00 19.00 3.61 22.50 2.18 0.17 0.29 0.00 0.00 0.00 0.00 a Mycelial growth was performed on PDA plates.; Mycelial measurements were recorded on the fifth day of growth.; Average, mycelial radial growth (mm) was an average of triplicate growth plates, and were measured on the fifth day of growth; STD, standard deviation of mycelial growth.

Appendix 2… continued
Temperature and pH growth profiles of Basidiomycetous fungi.
Average Mycelial Growth at Different pH and Temperaturesa 10°C 15°C 20°C 25°C 30°C 37°C 45°C pH Average STD Average STD Average STD Average STD Average STD Average STD Average STD
3 0.50 0.50 3.17 0.58 7.33 1.44 12.17 1.44 4.50 0.50 0.00 0.00 0.00 0.00 Ganoderma lucidum 4 0.33 0.58 3.00 1.73 10.83 1.76 15.67 1.53 5.17 0.29 0.00 0.00 0.00 0.00 5 0.33 0.29 6.00 0.00 9.67 2.89 12.67 1.53 3.67 0.58 0.00 0.00 0.00 0.00 6 0.17 0.29 4.50 0.71 9.67 0.29 12.67 2.31 4.00 0.87 0.00 0.00 0.00 0.00 7 0.17 0.29 3.75 0.25 6.67 2.08 13.00 0.00 3.25 0.35 0.00 0.00 0.00 0.00 8 0.00 0.00 1.50 0.00 7.67 1.15 11.00 2.65 3.50 0.50 0.00 0.00 0.00 0.00 9 0.00 0.00 1.00 0.00 2.67 2.08 3.83 2.47 2.00 0.00 0.00 0.00 0.00 0.00
3 0.00 0.00 3.67 0.58 10.00 0.00 14.67 0.58 23.00 0.00 27.67 0.58 18.33 2.08 Ganoderma applanatum 4 0.00 0.00 6.67 0.58 15.00 0.00 29.67 1.53 35.67 6.66 40.00 0.00 32.67 0.58 5 0.50 0.00 6.33 0.58 15.50 0.50 29.67 0.58 39.67 0.58 40.00 0.00 31.33 3.06 6 0.33 0.29 6.33 0.29 13.67 1.15 29.00 1.00 40.00 0.00 40.00 0.00 31.00 2.18 7 0.17 0.29 5.67 0.29 14.33 1.15 27.33 0.58 39.33 0.58 40.00 0.00 33.33 0.58 8 0.00 0.00 5.67 1.15 12.33 0.58 27.00 0.00 36.33 0.58 40.00 0.00 25.67 2.08 9 0.00 0.00 1.17 0.29 7.67 0.58 15.00 0.50 20.00 0.00 24.33 1.15 12.50 3.54
3 0.50 0.71 2.67 0.58 8.33 0.58 15.33 0.58 20.33 1.53 22.33 2.08 20.33 0.58 Pycnoporus cinnabarinus 4 0.17 0.29 4.00 0.00 13.00 2.00 25.67 1.53 34.00 2.00 39.67 0.58 34.67 0.58 5 0.67 0.29 3.33 0.58 12.33 0.29 25.00 1.73 36.00 1.00 39.33 0.58 33.00 1.00 6 1.00 0.00 4.00 1.00 12.00 0.00 25.67 1.15 34.33 1.15 37.67 0.58 31.33 3.21 7 0.50 0.00 6.00 0.00 13.67 0.58 23.00 1.00 22.67 16.20 34.67 0.58 29.00 1.73 8 0.00 0.00 4.67 0.58 11.00 1.73 21.67 1.53 30.00 1.00 33.33 0.58 29.00 1.32 9 0.00 0.00 0.50 0.00 4.33 0.58 10.67 0.58 15.00 0.00 14.33 1.53 15.00 1.00 a Mycelial growth was performed on PDA plates.; Mycelial measurements were recorded on the fifth day of growth.; Average, mycelial radial growth (mm) was an average of triplicate growth plates, and were measured on the fifth day of growth; STD, standard deviation of mycelial growth.
Appendix 3
Appendix 3
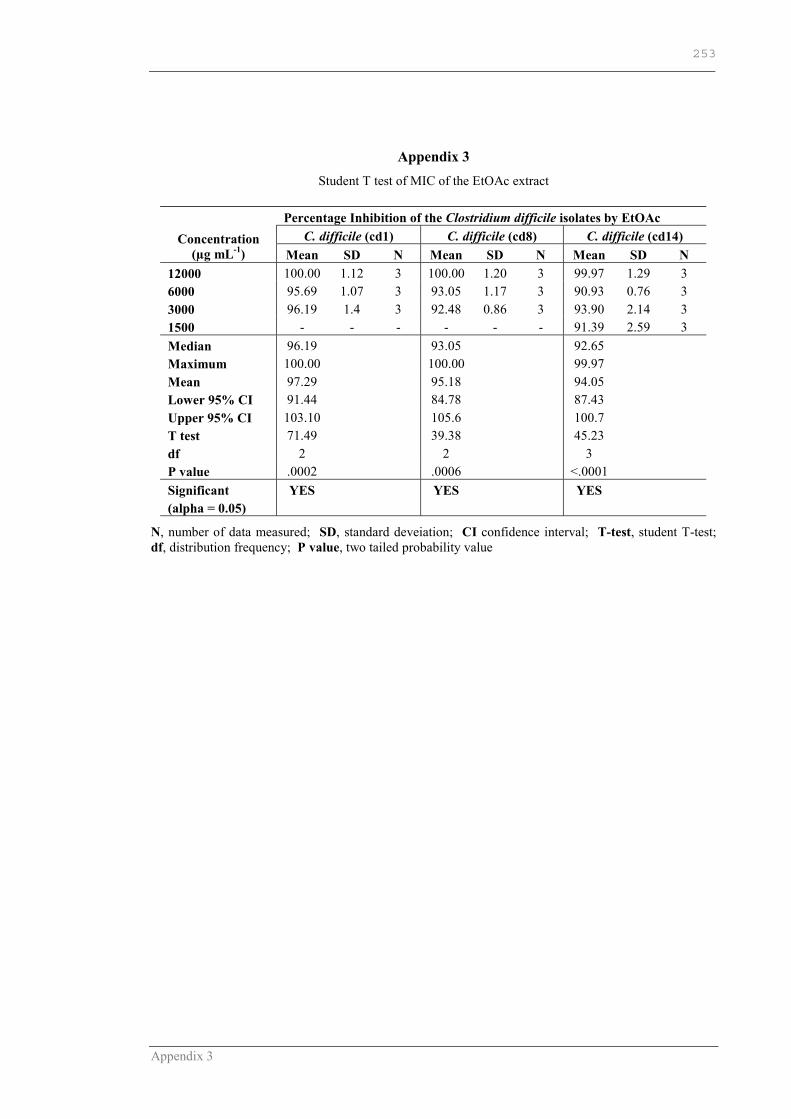
Appendix 3
253
Appendix 3 Student T test of MIC of the EtOAc extract
Percentage Inhibition of the Clostridium difficile isolates by EtOAc
C. difficile (cd1) C. difficile (cd8) C. difficile (cd14) Concentration (µg mL-1) Mean SD N Mean SD N Mean SD N
12000 100.00 1.12 3 100.00 1.20 3 99.97 1.29 3 6000 95.69 1.07 3 93.05 1.17 3 90.93 0.76 3 3000 96.19 1.4 3 92.48 0.86 3 93.90 2.14 3 1500 - - - - - - 91.39 2.59 3 Median 96.19 93.05 92.65 Maximum 100.00 100.00 99.97 Mean 97.29 95.18 94.05 Lower 95% CI 91.44 84.78 87.43 Upper 95% CI 103.10 105.6 100.7 T test 71.49 39.38 45.23 df 2 2 3 P value .0002 .0006 <.0001 Significant (alpha = 0.05)
YES YES YES
N, number of data measured; SD, standard deveiation; CI confidence interval; T-test, student T-test; df, distribution frequency; P value, two tailed probability value